West Point, CA Map & Demographics
West Point Map
West Point Overview
$21,112
PER CAPITA INCOME
$46,514
AVG FAMILY INCOME
$65,139
AVG HOUSEHOLD INCOME
0.36
INEQUALITY / GINI INDEX
777
TOTAL POPULATION
459
MALE POPULATION
318
FEMALE POPULATION
144.34
MALES / 100 FEMALES
69.28
FEMALES / 100 MALES
62.1
MEDIAN AGE
2.7
AVG FAMILY SIZE
2.4
AVG HOUSEHOLD SIZE
285
LABOR FORCE [ PEOPLE ]
46.0%
PERCENT IN LABOR FORCE
West Point Zip Codes
West Point Area Codes
Income in West Point
Income Overview in West Point
Per Capita Income in West Point is $21,112, while median incomes of families and households are $46,514 and $65,139 respectively.
| Characteristic | Number | Measure |
| Per Capita Income | 777 | $21,112 |
| Median Family Income | 171 | $46,514 |
| Mean Family Income | 171 | $61,182 |
| Median Household Income | 322 | $65,139 |
| Mean Household Income | 322 | $54,433 |
| Income Deficit | 171 | $0 |
| Wage / Income Gap (%) | 777 | 0.00% |
| Wage / Income Gap ($) | 777 | 100.00¢ per $1 |
| Gini / Inequality Index | 777 | 0.36 |
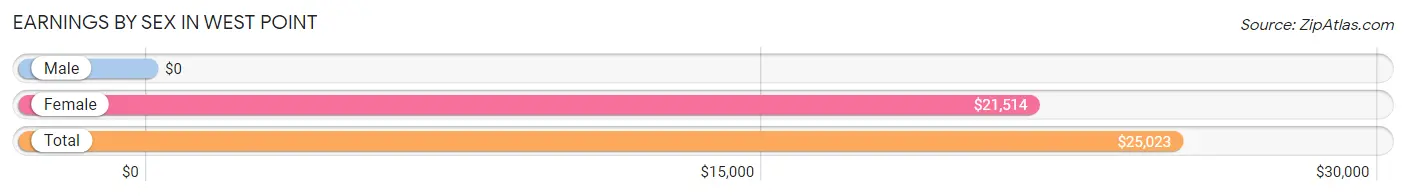
Earnings by Sex in West Point
| Sex | Number | Average Earnings |
| Male | 138 (45.9%) | $0 |
| Female | 163 (54.1%) | $21,514 |
| Total | 301 (100.0%) | $25,023 |
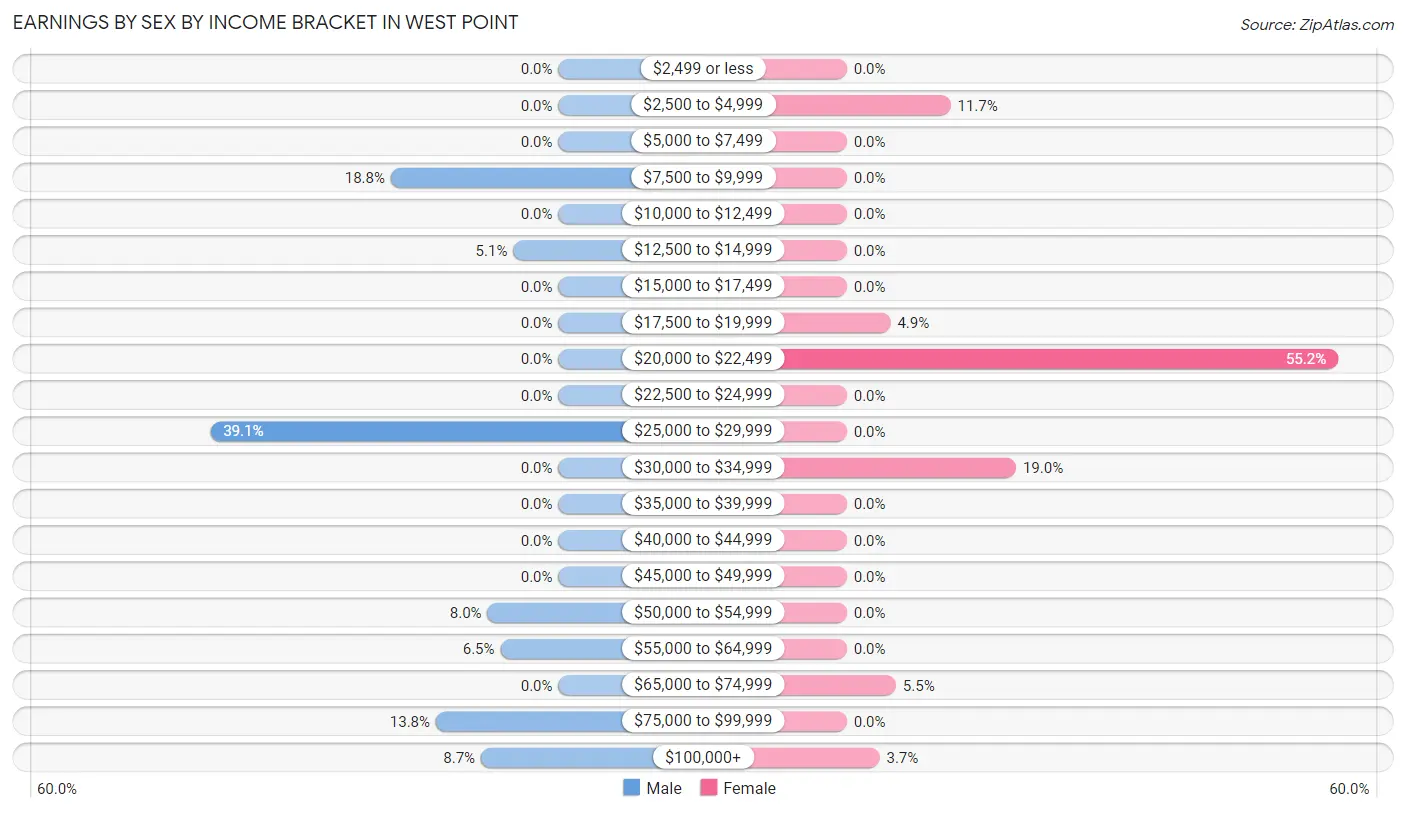
Earnings by Sex by Income Bracket in West Point
The most common earnings brackets in West Point are $25,000 to $29,999 for men (54 | 39.1%) and $20,000 to $22,499 for women (90 | 55.2%).
| Income | Male | Female |
| $2,499 or less | 0 (0.0%) | 0 (0.0%) |
| $2,500 to $4,999 | 0 (0.0%) | 19 (11.7%) |
| $5,000 to $7,499 | 0 (0.0%) | 0 (0.0%) |
| $7,500 to $9,999 | 26 (18.8%) | 0 (0.0%) |
| $10,000 to $12,499 | 0 (0.0%) | 0 (0.0%) |
| $12,500 to $14,999 | 7 (5.1%) | 0 (0.0%) |
| $15,000 to $17,499 | 0 (0.0%) | 0 (0.0%) |
| $17,500 to $19,999 | 0 (0.0%) | 8 (4.9%) |
| $20,000 to $22,499 | 0 (0.0%) | 90 (55.2%) |
| $22,500 to $24,999 | 0 (0.0%) | 0 (0.0%) |
| $25,000 to $29,999 | 54 (39.1%) | 0 (0.0%) |
| $30,000 to $34,999 | 0 (0.0%) | 31 (19.0%) |
| $35,000 to $39,999 | 0 (0.0%) | 0 (0.0%) |
| $40,000 to $44,999 | 0 (0.0%) | 0 (0.0%) |
| $45,000 to $49,999 | 0 (0.0%) | 0 (0.0%) |
| $50,000 to $54,999 | 11 (8.0%) | 0 (0.0%) |
| $55,000 to $64,999 | 9 (6.5%) | 0 (0.0%) |
| $65,000 to $74,999 | 0 (0.0%) | 9 (5.5%) |
| $75,000 to $99,999 | 19 (13.8%) | 0 (0.0%) |
| $100,000+ | 12 (8.7%) | 6 (3.7%) |
| Total | 138 (100.0%) | 163 (100.0%) |
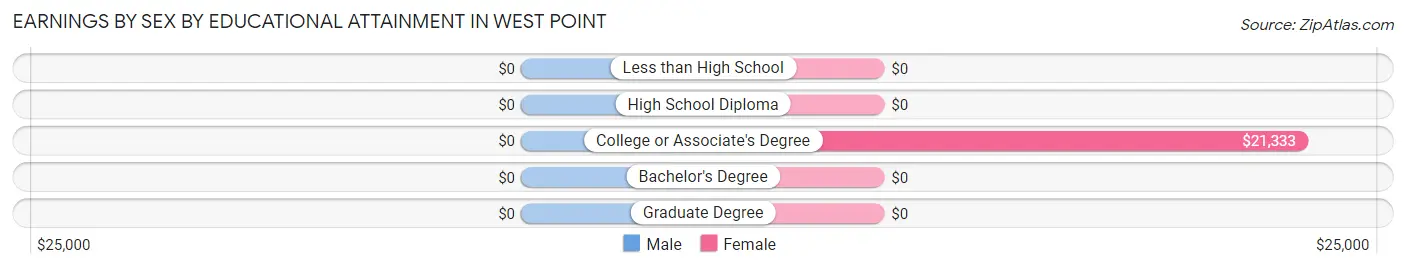
Earnings by Sex by Educational Attainment in West Point
| Educational Attainment | Male Income | Female Income |
| Less than High School | - | - |
| High School Diploma | - | - |
| College or Associate's Degree | - | - |
| Bachelor's Degree | - | - |
| Graduate Degree | - | - |
| Total | - | - |
Family Income in West Point
Family Income Brackets in West Point
According to the West Point family income data, there are 90 families falling into the $35,000 to $49,999 income range, which is the most common income bracket and makes up 52.6% of all families.
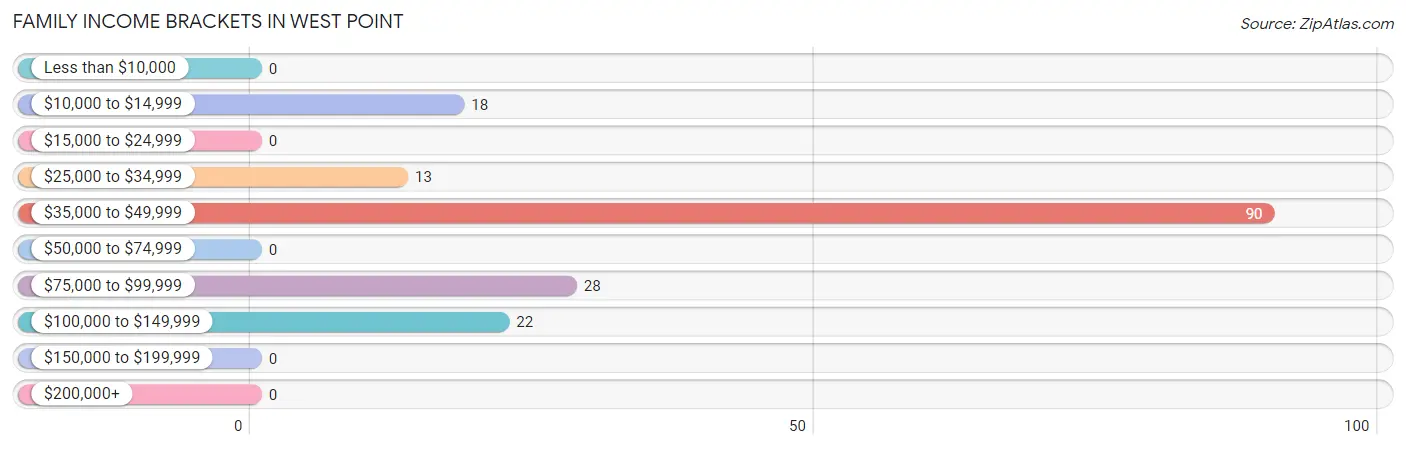
| Income Bracket | # Families | % Families |
| Less than $10,000 | 0 | 0.0% |
| $10,000 to $14,999 | 18 | 10.5% |
| $15,000 to $24,999 | 0 | 0.0% |
| $25,000 to $34,999 | 13 | 7.6% |
| $35,000 to $49,999 | 90 | 52.6% |
| $50,000 to $74,999 | 0 | 0.0% |
| $75,000 to $99,999 | 28 | 16.4% |
| $100,000 to $149,999 | 22 | 12.9% |
| $150,000 to $199,999 | 0 | 0.0% |
| $200,000+ | 0 | 0.0% |
Family Income by Famaliy Size in West Point
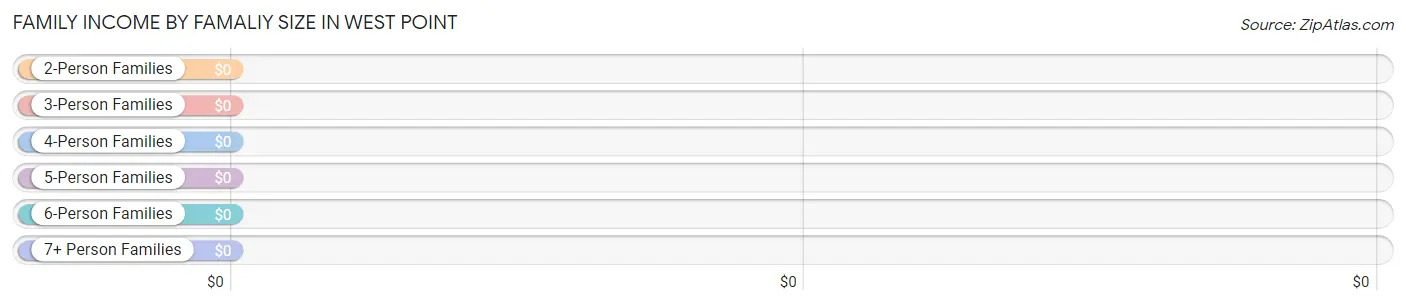
| Income Bracket | # Families | Median Income |
| 2-Person Families | 96 (56.1%) | $0 |
| 3-Person Families | 7 (4.1%) | $0 |
| 4-Person Families | 28 (16.4%) | $0 |
| 5-Person Families | 40 (23.4%) | $0 |
| 6-Person Families | 0 (0.0%) | $0 |
| 7+ Person Families | 0 (0.0%) | $0 |
| Total | 171 (100.0%) | $46,514 |
Family Income by Number of Earners in West Point
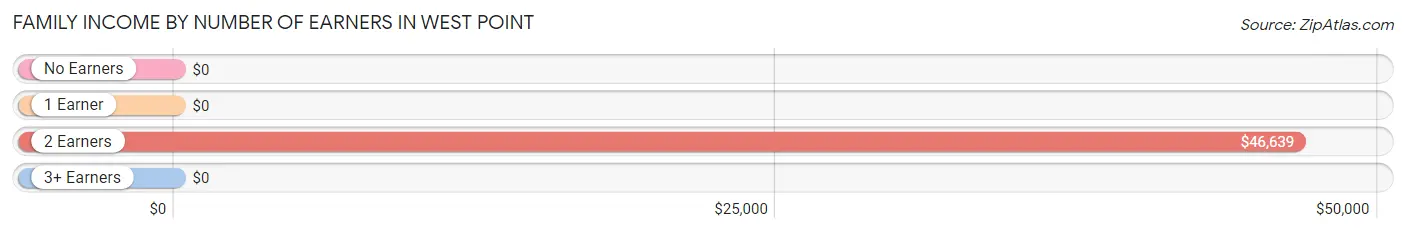
| Number of Earners | # Families | Median Income |
| No Earners | 6 (3.5%) | $0 |
| 1 Earner | 47 (27.5%) | $0 |
| 2 Earners | 118 (69.0%) | $46,639 |
| 3+ Earners | 0 (0.0%) | $0 |
| Total | 171 (100.0%) | $46,514 |
Household Income in West Point
Household Income Brackets in West Point
With 90 households falling in the category, the $50,000 to $74,999 income range is the most frequent in West Point, accounting for 28.0% of all households.
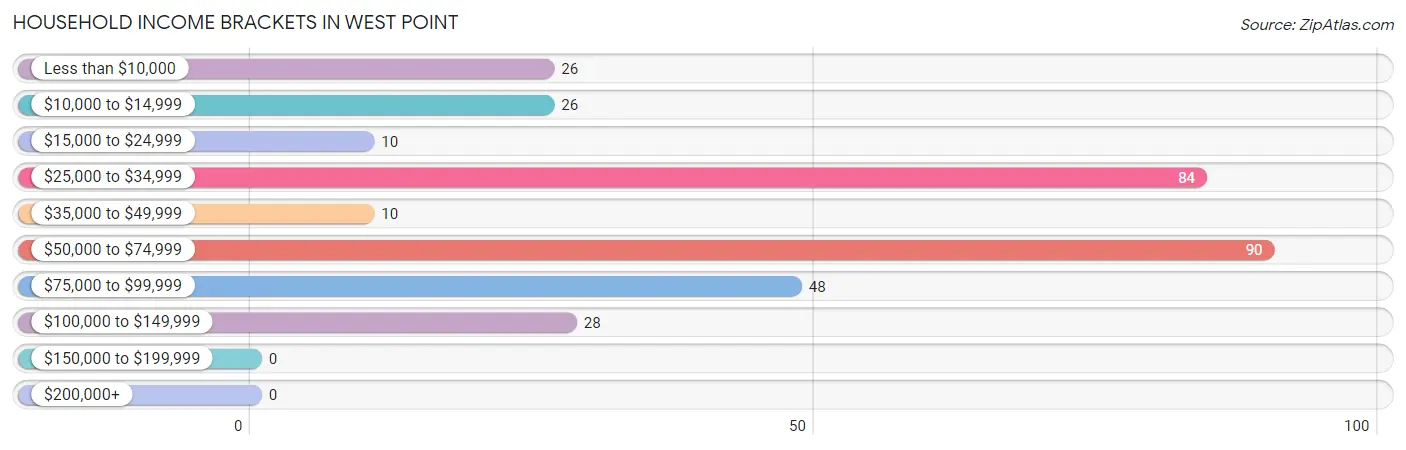
| Income Bracket | # Households | % Households |
| Less than $10,000 | 26 | 8.1% |
| $10,000 to $14,999 | 26 | 8.1% |
| $15,000 to $24,999 | 10 | 3.1% |
| $25,000 to $34,999 | 84 | 26.1% |
| $35,000 to $49,999 | 10 | 3.1% |
| $50,000 to $74,999 | 90 | 28.0% |
| $75,000 to $99,999 | 48 | 14.9% |
| $100,000 to $149,999 | 28 | 8.7% |
| $150,000 to $199,999 | 0 | 0.0% |
| $200,000+ | 0 | 0.0% |
Household Income by Householder Age in West Point
The median household income in West Point is $65,139, with the highest median household income of $66,361 found in the 45 to 64 years age bracket for the primary householder. A total of 118 households (36.6%) fall into this category.
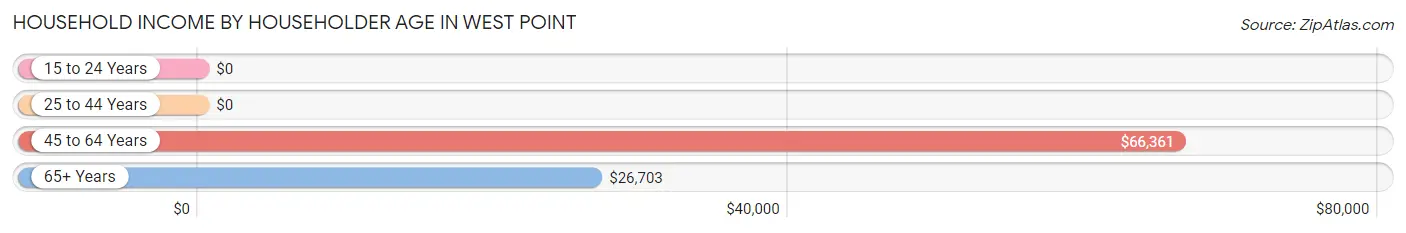
| Income Bracket | # Households | Median Income |
| 15 to 24 Years | 0 (0.0%) | $0 |
| 25 to 44 Years | 94 (29.2%) | $0 |
| 45 to 64 Years | 118 (36.6%) | $66,361 |
| 65+ Years | 110 (34.2%) | $26,703 |
| Total | 322 (100.0%) | $65,139 |
Poverty in West Point
Income Below Poverty by Sex and Age in West Point
With 18.1% poverty level for males and 15.4% for females among the residents of West Point, under 5 year old males and 25 to 34 year old females are the most vulnerable to poverty, with 26 males (100.0%) and 18 females (45.0%) in their respective age groups living below the poverty level.
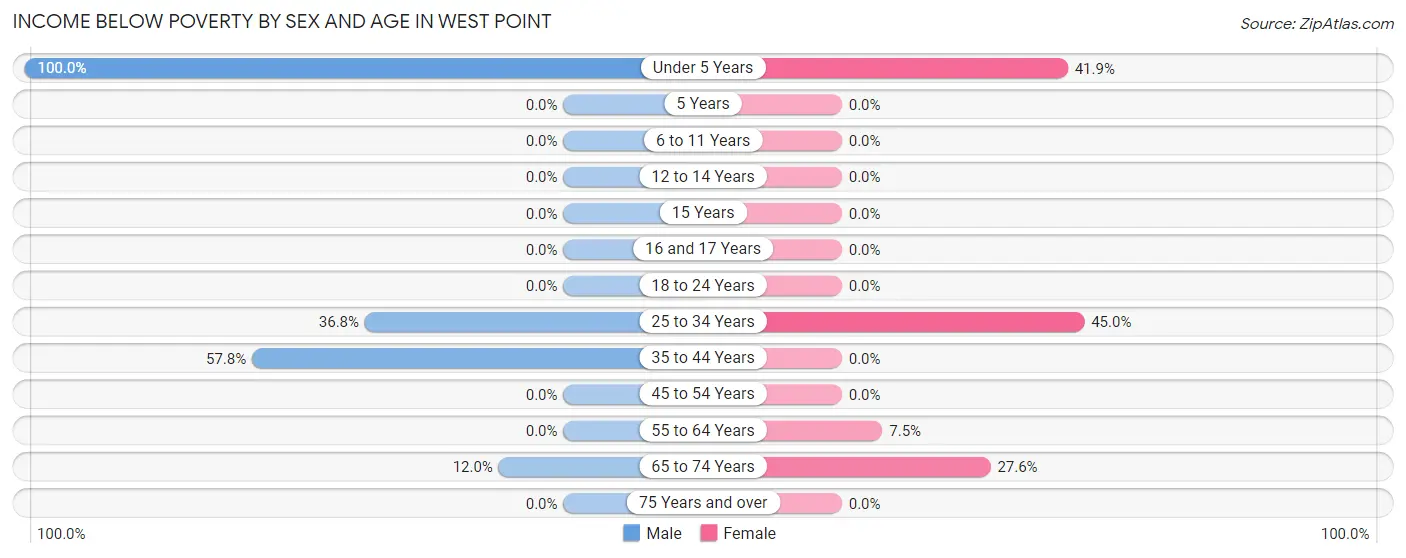
| Age Bracket | Male | Female |
| Under 5 Years | 26 (100.0%) | 13 (41.9%) |
| 5 Years | 0 (0.0%) | 0 (0.0%) |
| 6 to 11 Years | 0 (0.0%) | 0 (0.0%) |
| 12 to 14 Years | 0 (0.0%) | 0 (0.0%) |
| 15 Years | 0 (0.0%) | 0 (0.0%) |
| 16 and 17 Years | 0 (0.0%) | 0 (0.0%) |
| 18 to 24 Years | 0 (0.0%) | 0 (0.0%) |
| 25 to 34 Years | 7 (36.8%) | 18 (45.0%) |
| 35 to 44 Years | 26 (57.8%) | 0 (0.0%) |
| 45 to 54 Years | 0 (0.0%) | 0 (0.0%) |
| 55 to 64 Years | 0 (0.0%) | 10 (7.5%) |
| 65 to 74 Years | 24 (12.0%) | 8 (27.6%) |
| 75 Years and over | 0 (0.0%) | 0 (0.0%) |
| Total | 83 (18.1%) | 49 (15.4%) |
Income Above Poverty by Sex and Age in West Point
According to the poverty statistics in West Point, males aged 5 years and females aged 6 to 11 years are the age groups that are most secure financially, with 100.0% of males and 100.0% of females in these age groups living above the poverty line.
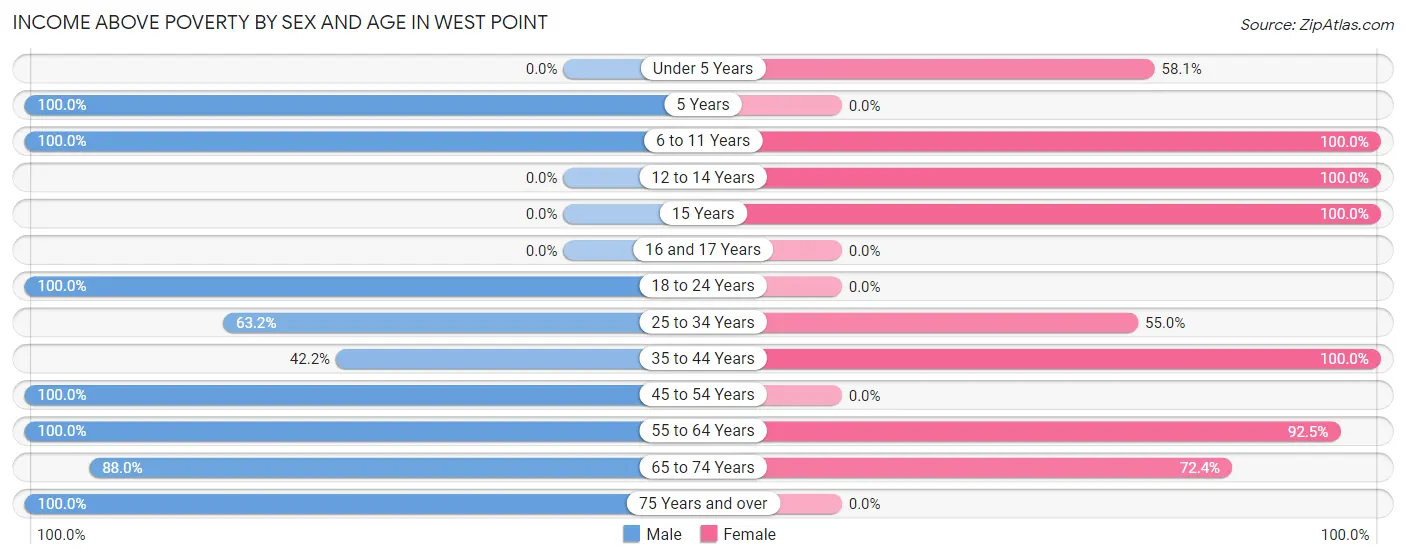
| Age Bracket | Male | Female |
| Under 5 Years | 0 (0.0%) | 18 (58.1%) |
| 5 Years | 21 (100.0%) | 0 (0.0%) |
| 6 to 11 Years | 38 (100.0%) | 12 (100.0%) |
| 12 to 14 Years | 0 (0.0%) | 19 (100.0%) |
| 15 Years | 0 (0.0%) | 10 (100.0%) |
| 16 and 17 Years | 0 (0.0%) | 0 (0.0%) |
| 18 to 24 Years | 54 (100.0%) | 0 (0.0%) |
| 25 to 34 Years | 12 (63.2%) | 22 (55.0%) |
| 35 to 44 Years | 19 (42.2%) | 44 (100.0%) |
| 45 to 54 Years | 15 (100.0%) | 0 (0.0%) |
| 55 to 64 Years | 9 (100.0%) | 123 (92.5%) |
| 65 to 74 Years | 176 (88.0%) | 21 (72.4%) |
| 75 Years and over | 32 (100.0%) | 0 (0.0%) |
| Total | 376 (81.9%) | 269 (84.6%) |
Income Below Poverty Among Married-Couple Families in West Point
The poverty statistics for married-couple families in West Point show that 27.3% or 18 of the total 66 families live below the poverty line. Families with 3 or 4 children have the highest poverty rate of 45.0%, comprising of 18 families. On the other hand, families with no children have the lowest poverty rate of 0.0%, which includes 0 families.
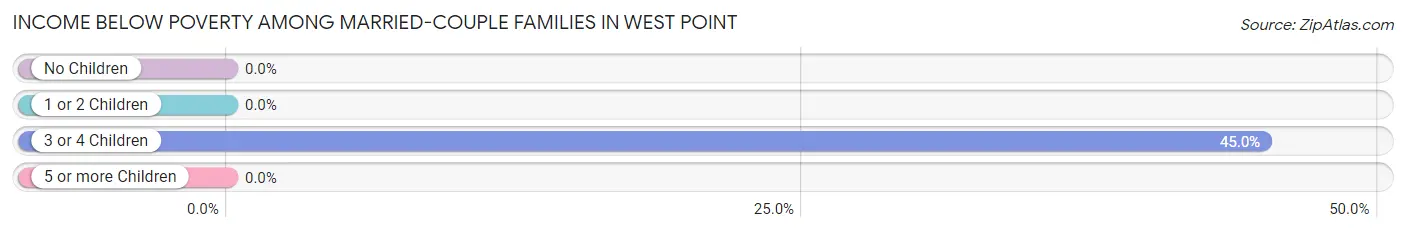
| Children | Above Poverty | Below Poverty |
| No Children | 7 (100.0%) | 0 (0.0%) |
| 1 or 2 Children | 19 (100.0%) | 0 (0.0%) |
| 3 or 4 Children | 22 (55.0%) | 18 (45.0%) |
| 5 or more Children | 0 (0.0%) | 0 (0.0%) |
| Total | 48 (72.7%) | 18 (27.3%) |
Income Below Poverty Among Single-Parent Households in West Point
| Children | Single Father | Single Mother |
| No Children | 0 (0.0%) | 0 (0.0%) |
| 1 or 2 Children | 0 (0.0%) | 0 (0.0%) |
| 3 or 4 Children | 0 (0.0%) | 0 (0.0%) |
| 5 or more Children | 0 (0.0%) | 0 (0.0%) |
| Total | 0 (0.0%) | 0 (0.0%) |
Income Below Poverty Among Married-Couple vs Single-Parent Households in West Point
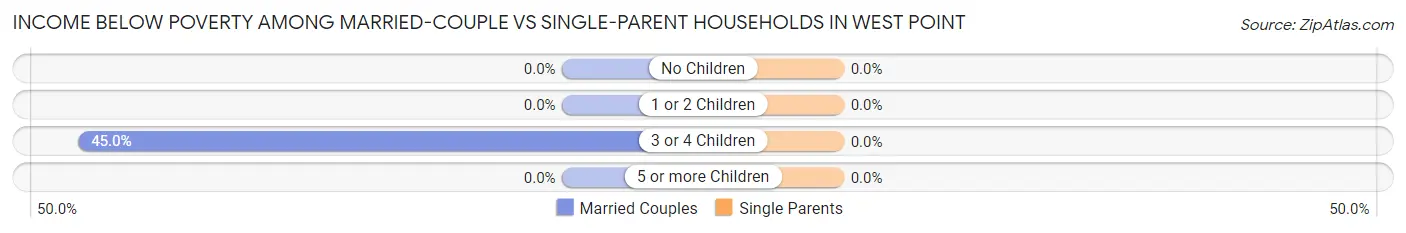
| Children | Married-Couple Families | Single-Parent Households |
| No Children | 0 (0.0%) | 0 (0.0%) |
| 1 or 2 Children | 0 (0.0%) | 0 (0.0%) |
| 3 or 4 Children | 18 (45.0%) | 0 (0.0%) |
| 5 or more Children | 0 (0.0%) | 0 (0.0%) |
| Total | 18 (27.3%) | 0 (0.0%) |
Race in West Point
The most populous races in West Point are White / Caucasian (417 | 53.7%), Hispanic or Latino (280 | 36.0%), and Two or more Races (270 | 34.7%).
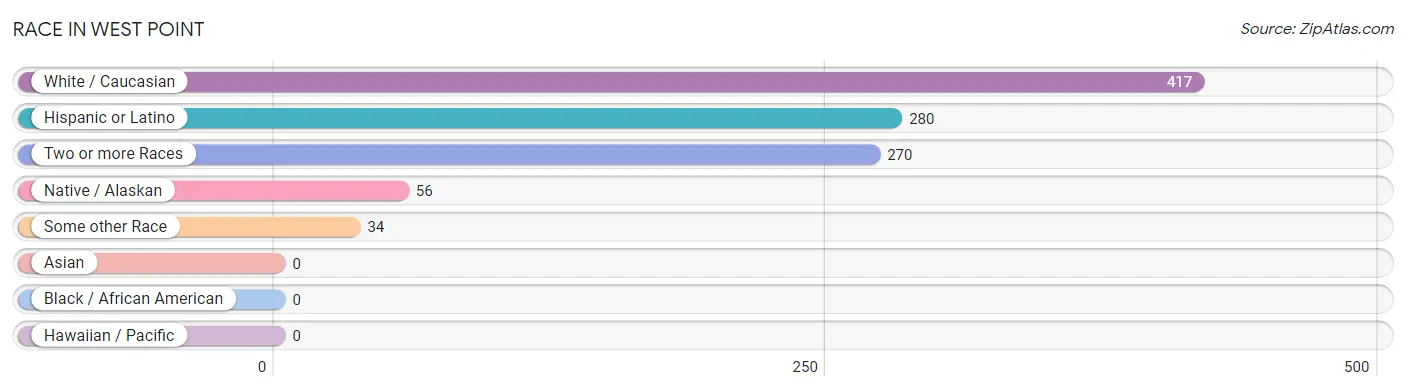
| Race | # Population | % Population |
| Asian | 0 | 0.0% |
| Black / African American | 0 | 0.0% |
| Hawaiian / Pacific | 0 | 0.0% |
| Hispanic or Latino | 280 | 36.0% |
| Native / Alaskan | 56 | 7.2% |
| White / Caucasian | 417 | 53.7% |
| Two or more Races | 270 | 34.7% |
| Some other Race | 34 | 4.4% |
| Total | 777 | 100.0% |
Ancestry in West Point
The most populous ancestries reported in West Point are German (196 | 25.2%), English (195 | 25.1%), Spanish (144 | 18.5%), Irish (114 | 14.7%), and Scotch-Irish (40 | 5.1%), together accounting for 88.7% of all West Point residents.
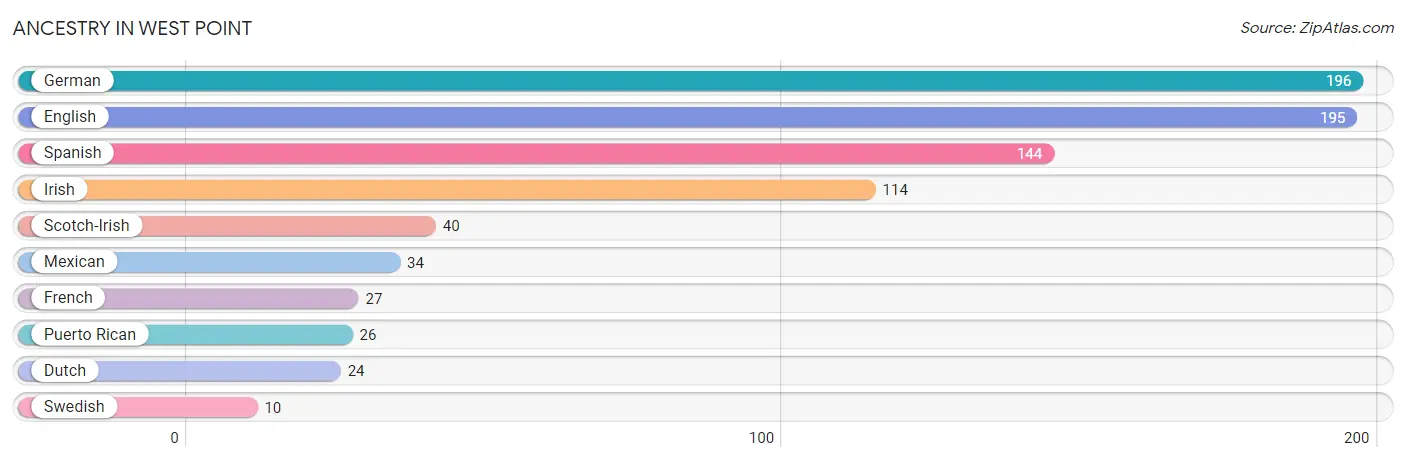
| Ancestry | # Population | % Population |
| Dutch | 24 | 3.1% |
| English | 195 | 25.1% |
| French | 27 | 3.5% |
| German | 196 | 25.2% |
| Irish | 114 | 14.7% |
| Mexican | 34 | 4.4% |
| Puerto Rican | 26 | 3.4% |
| Scotch-Irish | 40 | 5.1% |
| Spanish | 144 | 18.5% |
| Swedish | 10 | 1.3% | View All 10 Rows |
Immigrants in West Point

| Immigration Origin | # Population | % Population | View All 0 Rows |
Sex and Age in West Point
Sex and Age in West Point
The most populous age groups in West Point are 70 to 74 Years (190 | 41.4%) for men and 60 to 64 Years (133 | 41.8%) for women.
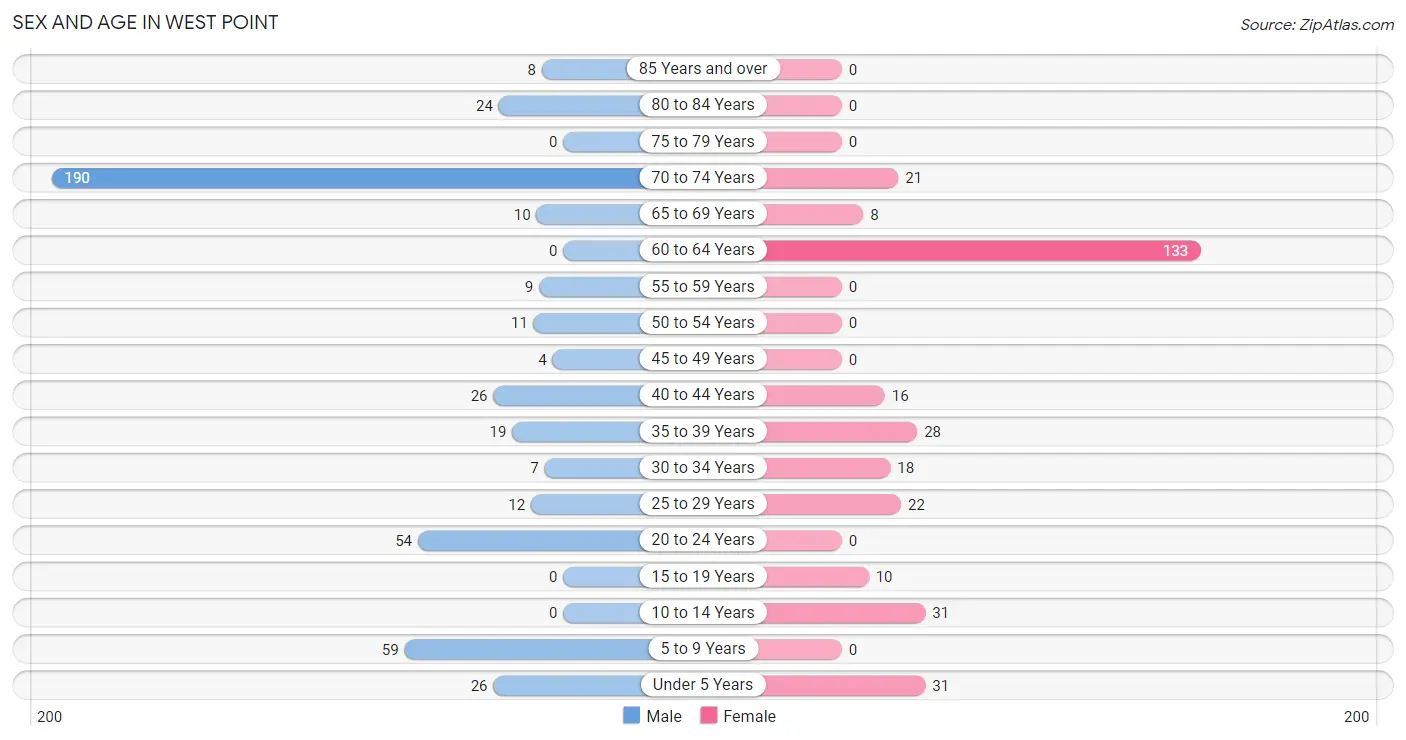
| Age Bracket | Male | Female |
| Under 5 Years | 26 (5.7%) | 31 (9.8%) |
| 5 to 9 Years | 59 (12.9%) | 0 (0.0%) |
| 10 to 14 Years | 0 (0.0%) | 31 (9.8%) |
| 15 to 19 Years | 0 (0.0%) | 10 (3.1%) |
| 20 to 24 Years | 54 (11.8%) | 0 (0.0%) |
| 25 to 29 Years | 12 (2.6%) | 22 (6.9%) |
| 30 to 34 Years | 7 (1.5%) | 18 (5.7%) |
| 35 to 39 Years | 19 (4.1%) | 28 (8.8%) |
| 40 to 44 Years | 26 (5.7%) | 16 (5.0%) |
| 45 to 49 Years | 4 (0.9%) | 0 (0.0%) |
| 50 to 54 Years | 11 (2.4%) | 0 (0.0%) |
| 55 to 59 Years | 9 (2.0%) | 0 (0.0%) |
| 60 to 64 Years | 0 (0.0%) | 133 (41.8%) |
| 65 to 69 Years | 10 (2.2%) | 8 (2.5%) |
| 70 to 74 Years | 190 (41.4%) | 21 (6.6%) |
| 75 to 79 Years | 0 (0.0%) | 0 (0.0%) |
| 80 to 84 Years | 24 (5.2%) | 0 (0.0%) |
| 85 Years and over | 8 (1.7%) | 0 (0.0%) |
| Total | 459 (100.0%) | 318 (100.0%) |
Families and Households in West Point
Median Family Size in West Point
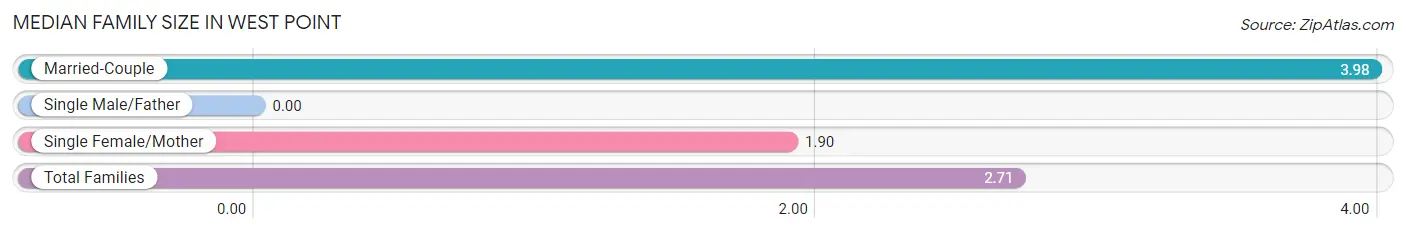
| Family Type | # Families | Family Size |
| Married-Couple | 66 (38.6%) | 3.98 |
| Single Male/Father | 0 (0.0%) | - |
| Single Female/Mother | 105 (61.4%) | 1.90 |
| Total Families | 171 (100.0%) | 2.71 |
Median Household Size in West Point
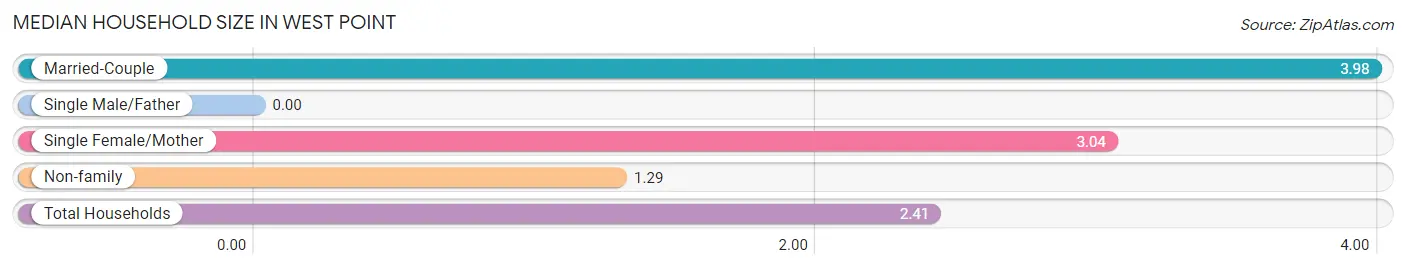
| Household Type | # Households | Household Size |
| Married-Couple | 66 (20.5%) | 3.98 |
| Single Male/Father | 0 (0.0%) | - |
| Single Female/Mother | 105 (32.6%) | 3.04 |
| Non-family | 151 (46.9%) | 1.29 |
| Total Households | 322 (100.0%) | 2.41 |
Household Size by Marriage Status in West Point
Out of a total of 322 households in West Point, 171 (53.1%) are family households, while 151 (46.9%) are nonfamily households. The most numerous type of family households are 3-person households, comprising 97, and the most common type of nonfamily households are 1-person households, comprising 121.
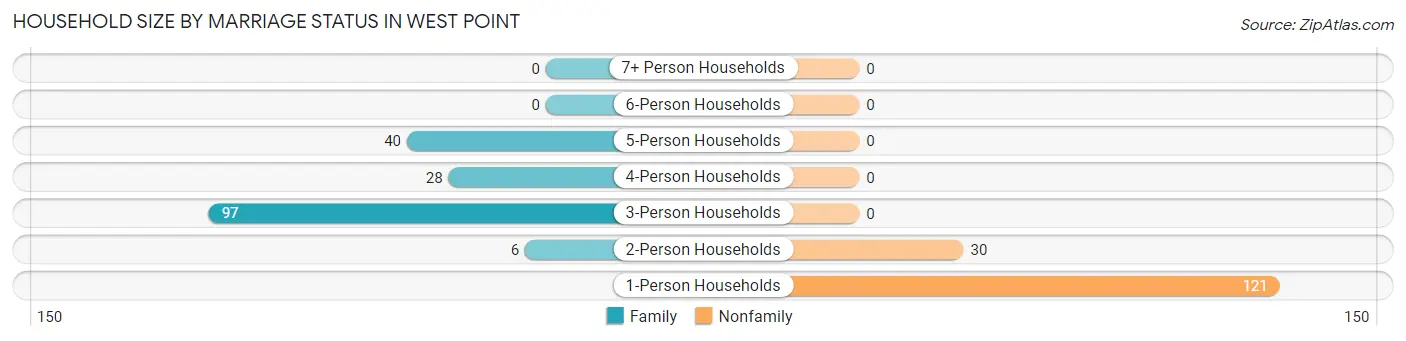
| Household Size | Family Households | Nonfamily Households |
| 1-Person Households | - | 121 (37.6%) |
| 2-Person Households | 6 (1.9%) | 30 (9.3%) |
| 3-Person Households | 97 (30.1%) | 0 (0.0%) |
| 4-Person Households | 28 (8.7%) | 0 (0.0%) |
| 5-Person Households | 40 (12.4%) | 0 (0.0%) |
| 6-Person Households | 0 (0.0%) | 0 (0.0%) |
| 7+ Person Households | 0 (0.0%) | 0 (0.0%) |
| Total | 171 (53.1%) | 151 (46.9%) |
Female Fertility in West Point
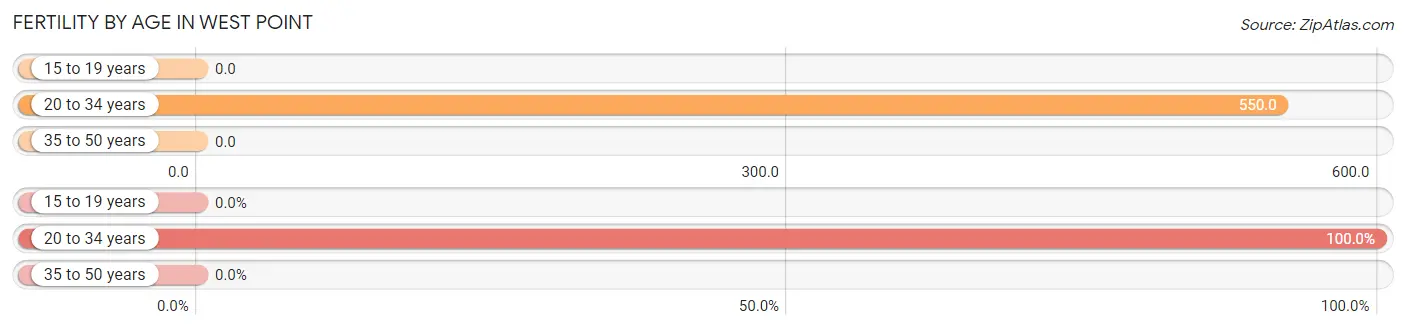
Fertility by Age in West Point
Average fertility rate in West Point is 234.0 births per 1,000 women. Women in the age bracket of 20 to 34 years have the highest fertility rate with 550.0 births per 1,000 women. Women in the age bracket of 20 to 34 years acount for 100.0% of all women with births.
| Age Bracket | Women with Births | Births / 1,000 Women |
| 15 to 19 years | 0 (0.0%) | 0.0 |
| 20 to 34 years | 22 (100.0%) | 550.0 |
| 35 to 50 years | 0 (0.0%) | 0.0 |
| Total | 22 (100.0%) | 234.0 |
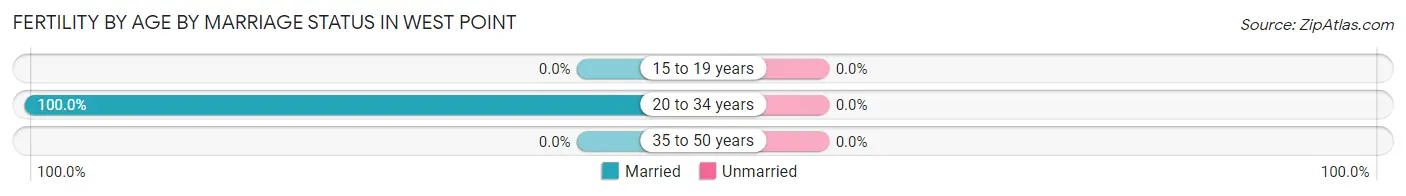
Fertility by Age by Marriage Status in West Point
| Age Bracket | Married | Unmarried |
| 15 to 19 years | 0 (0.0%) | 0 (0.0%) |
| 20 to 34 years | 22 (100.0%) | 0 (0.0%) |
| 35 to 50 years | 0 (0.0%) | 0 (0.0%) |
| Total | 22 (100.0%) | 0 (0.0%) |
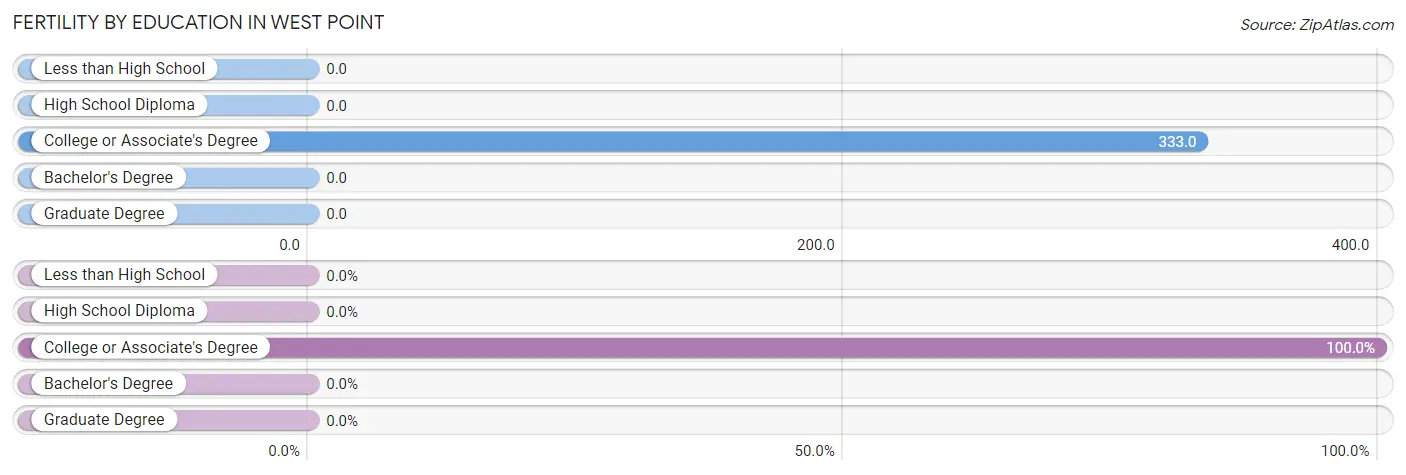
Fertility by Education in West Point
| Educational Attainment | Women with Births | Births / 1,000 Women |
| Less than High School | 0 (0.0%) | 0.0 |
| High School Diploma | 0 (0.0%) | 0.0 |
| College or Associate's Degree | 22 (100.0%) | 333.0 |
| Bachelor's Degree | 0 (0.0%) | 0.0 |
| Graduate Degree | 0 (0.0%) | 0.0 |
| Total | 22 (100.0%) | 234.0 |
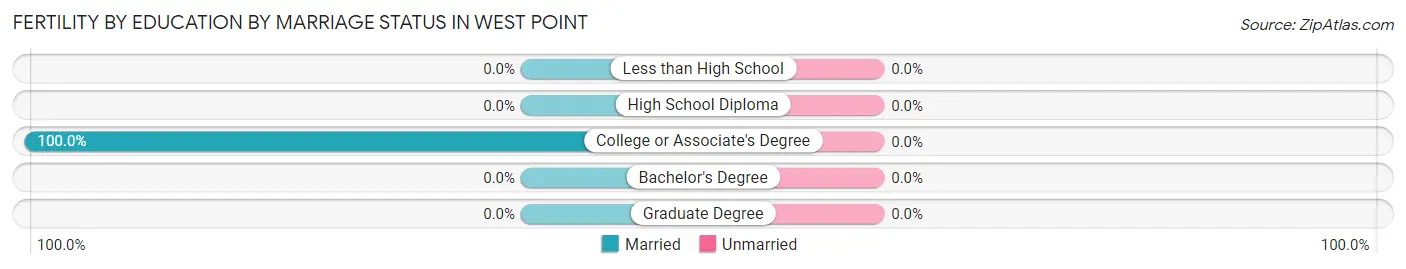
Fertility by Education by Marriage Status in West Point
| Educational Attainment | Married | Unmarried |
| Less than High School | 0 (0.0%) | 0 (0.0%) |
| High School Diploma | 0 (0.0%) | 0 (0.0%) |
| College or Associate's Degree | 22 (100.0%) | 0 (0.0%) |
| Bachelor's Degree | 0 (0.0%) | 0 (0.0%) |
| Graduate Degree | 0 (0.0%) | 0 (0.0%) |
| Total | 22 (100.0%) | 0 (0.0%) |
Employment Characteristics in West Point
Employment by Class of Employer in West Point
Among the 285 employed individuals in West Point, private company employees (183 | 64.2%), self-employed (not incorporated) (42 | 14.7%), and local government employees (27 | 9.5%) make up the most common classes of employment.
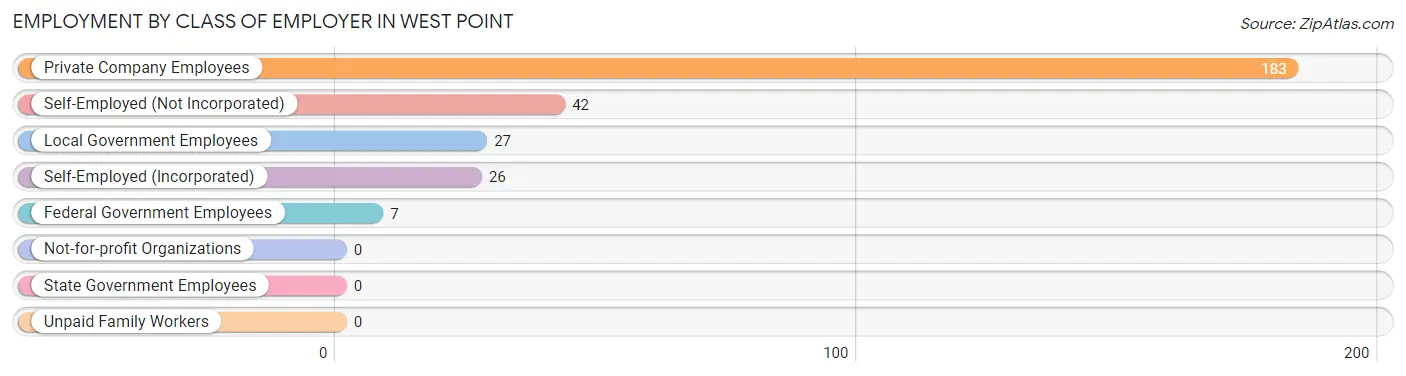
| Employer Class | # Employees | % Employees |
| Private Company Employees | 183 | 64.2% |
| Self-Employed (Incorporated) | 26 | 9.1% |
| Self-Employed (Not Incorporated) | 42 | 14.7% |
| Not-for-profit Organizations | 0 | 0.0% |
| Local Government Employees | 27 | 9.5% |
| State Government Employees | 0 | 0.0% |
| Federal Government Employees | 7 | 2.5% |
| Unpaid Family Workers | 0 | 0.0% |
| Total | 285 | 100.0% |
Employment Status by Age in West Point
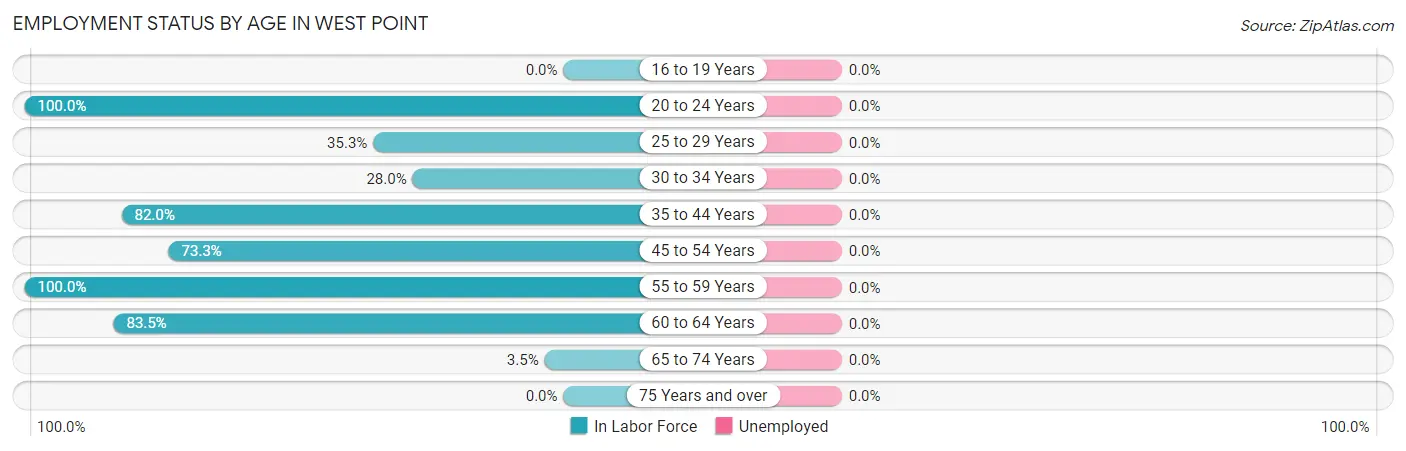
| Age Bracket | In Labor Force | Unemployed |
| 16 to 19 Years | 0 (0.0%) | 0 (0.0%) |
| 20 to 24 Years | 54 (100.0%) | 0 (0.0%) |
| 25 to 29 Years | 12 (35.3%) | 0 (0.0%) |
| 30 to 34 Years | 7 (28.0%) | 0 (0.0%) |
| 35 to 44 Years | 73 (82.0%) | 0 (0.0%) |
| 45 to 54 Years | 11 (73.3%) | 0 (0.0%) |
| 55 to 59 Years | 9 (100.0%) | 0 (0.0%) |
| 60 to 64 Years | 111 (83.5%) | 0 (0.0%) |
| 65 to 74 Years | 8 (3.5%) | 0 (0.0%) |
| 75 Years and over | 0 (0.0%) | 0 (0.0%) |
| Total | 285 (46.0%) | 0 (0.0%) |
Employment Status by Educational Attainment in West Point
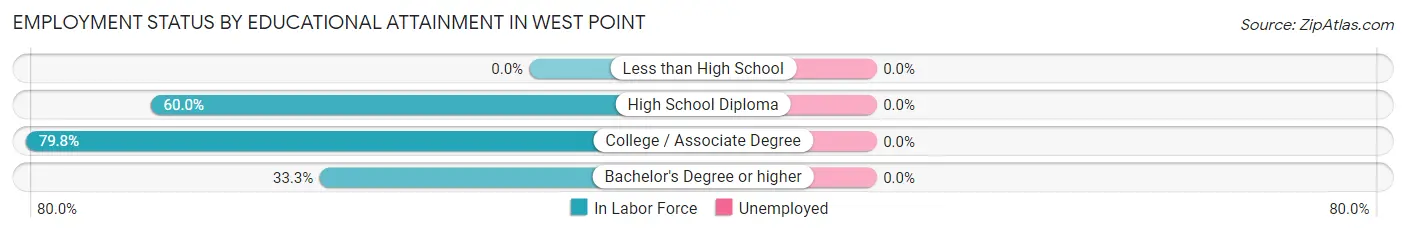
| Educational Attainment | In Labor Force | Unemployed |
| Less than High School | 0 (0.0%) | 0 (0.0%) |
| High School Diploma | 27 (60.0%) | 0 (0.0%) |
| College / Associate Degree | 190 (79.8%) | 0 (0.0%) |
| Bachelor's Degree or higher | 6 (33.3%) | 0 (0.0%) |
| Total | 223 (73.1%) | 0 (0.0%) |
Employment Occupations by Sex in West Point
Management, Business, Science and Arts Occupations
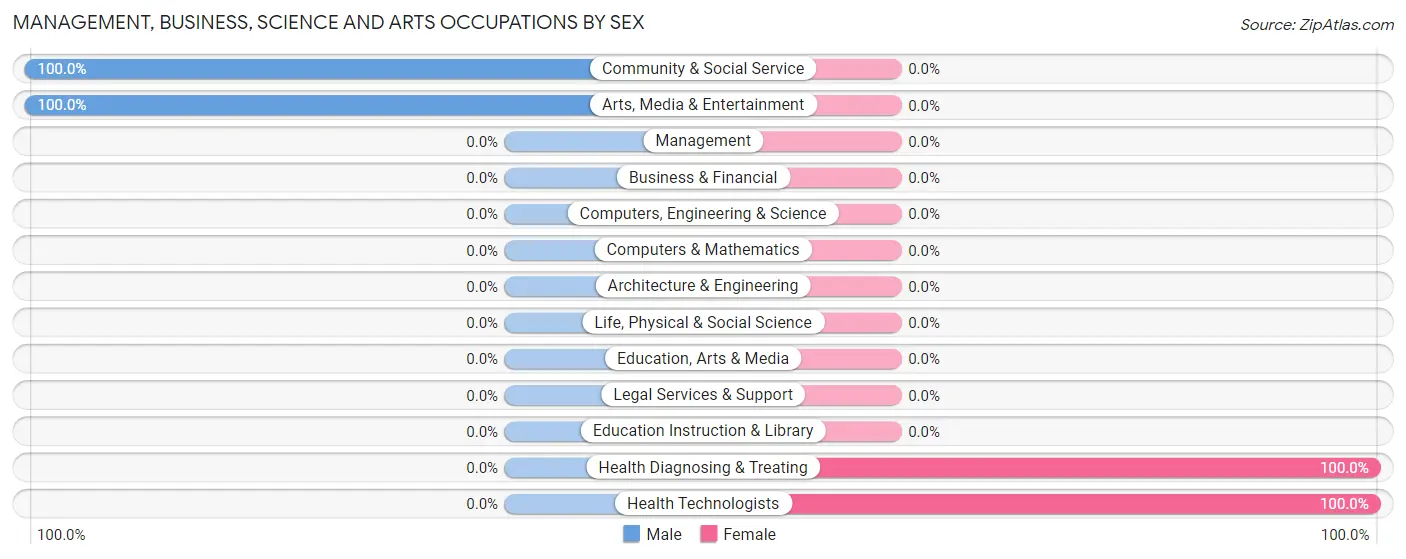
The most common Management, Business, Science and Arts occupations in West Point are Community & Social Service (11 | 3.9%), Arts, Media & Entertainment (11 | 3.9%), Health Diagnosing & Treating (6 | 2.1%), and Health Technologists (6 | 2.1%).
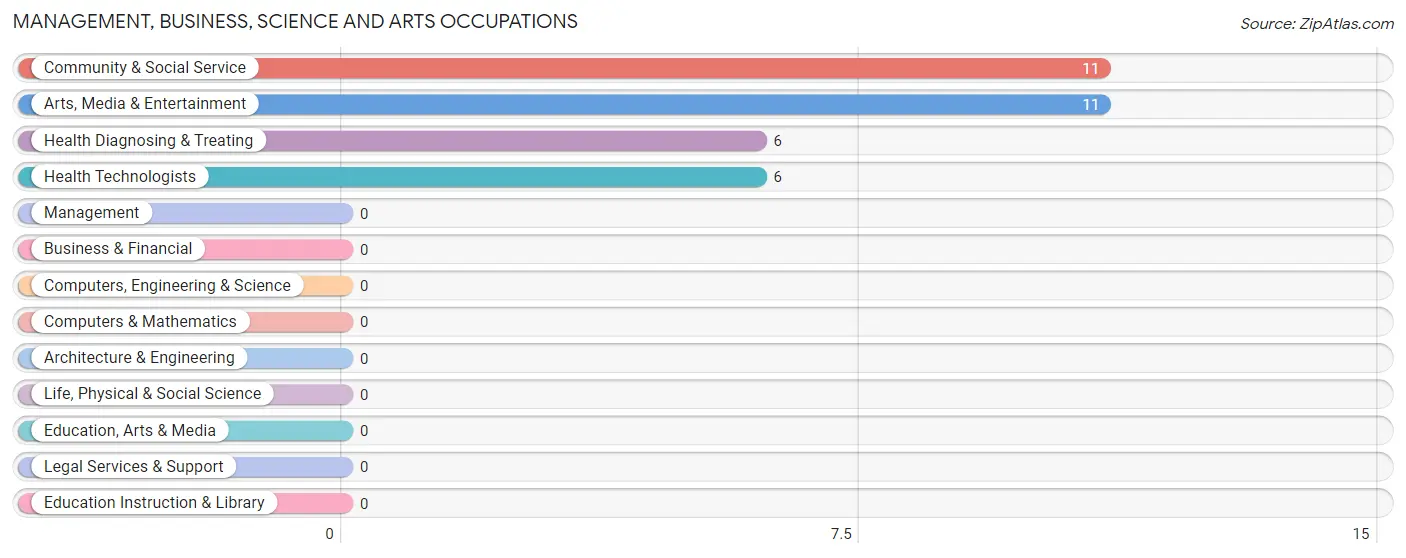
Management, Business, Science and Arts Occupations by Sex
Within the Management, Business, Science and Arts occupations in West Point, the most male-oriented occupations are Community & Social Service (100.0%), and Arts, Media & Entertainment (100.0%), while the most female-oriented occupations are Health Diagnosing & Treating (100.0%), and Health Technologists (100.0%).
| Occupation | Male | Female |
| Management | 0 (0.0%) | 0 (0.0%) |
| Business & Financial | 0 (0.0%) | 0 (0.0%) |
| Computers, Engineering & Science | 0 (0.0%) | 0 (0.0%) |
| Computers & Mathematics | 0 (0.0%) | 0 (0.0%) |
| Architecture & Engineering | 0 (0.0%) | 0 (0.0%) |
| Life, Physical & Social Science | 0 (0.0%) | 0 (0.0%) |
| Community & Social Service | 11 (100.0%) | 0 (0.0%) |
| Education, Arts & Media | 0 (0.0%) | 0 (0.0%) |
| Legal Services & Support | 0 (0.0%) | 0 (0.0%) |
| Education Instruction & Library | 0 (0.0%) | 0 (0.0%) |
| Arts, Media & Entertainment | 11 (100.0%) | 0 (0.0%) |
| Health Diagnosing & Treating | 0 (0.0%) | 6 (100.0%) |
| Health Technologists | 0 (0.0%) | 6 (100.0%) |
| Total (Category) | 11 (64.7%) | 6 (35.3%) |
| Total (Overall) | 138 (48.4%) | 147 (51.6%) |
Services Occupations
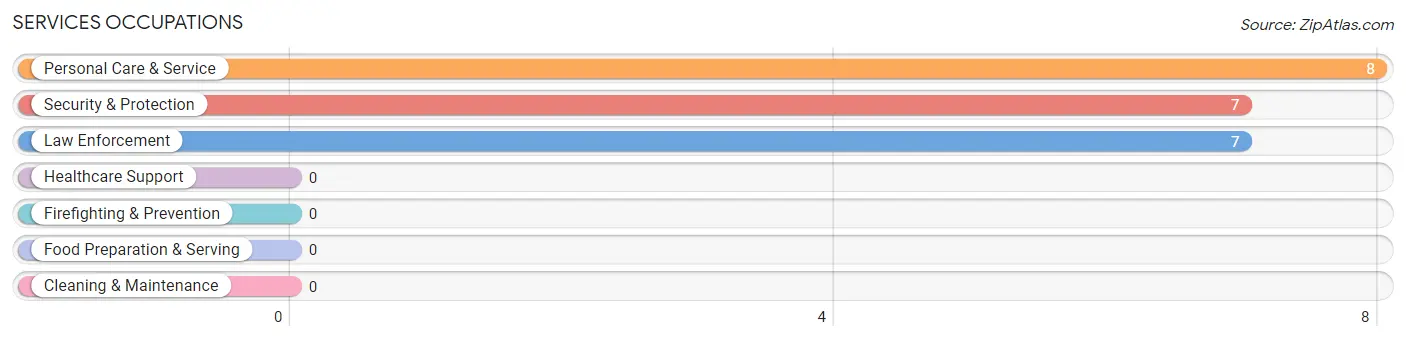
The most common Services occupations in West Point are Personal Care & Service (8 | 2.8%), Security & Protection (7 | 2.5%), and Law Enforcement (7 | 2.5%).
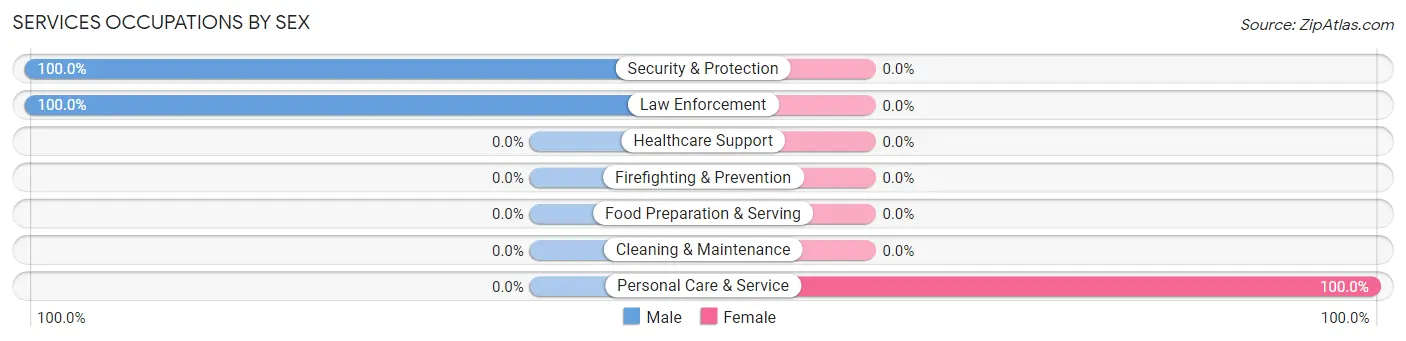
Services Occupations by Sex
| Occupation | Male | Female |
| Healthcare Support | 0 (0.0%) | 0 (0.0%) |
| Security & Protection | 7 (100.0%) | 0 (0.0%) |
| Firefighting & Prevention | 0 (0.0%) | 0 (0.0%) |
| Law Enforcement | 7 (100.0%) | 0 (0.0%) |
| Food Preparation & Serving | 0 (0.0%) | 0 (0.0%) |
| Cleaning & Maintenance | 0 (0.0%) | 0 (0.0%) |
| Personal Care & Service | 0 (0.0%) | 8 (100.0%) |
| Total (Category) | 7 (46.7%) | 8 (53.3%) |
| Total (Overall) | 138 (48.4%) | 147 (51.6%) |
Sales and Office Occupations
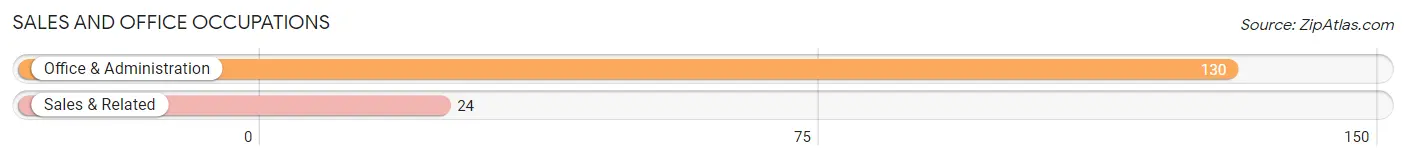
The most common Sales and Office occupations in West Point are Office & Administration (130 | 45.6%), and Sales & Related (24 | 8.4%).
Sales and Office Occupations by Sex
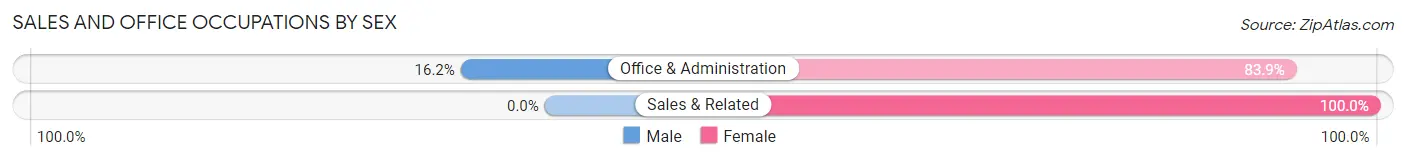
| Occupation | Male | Female |
| Sales & Related | 0 (0.0%) | 24 (100.0%) |
| Office & Administration | 21 (16.2%) | 109 (83.9%) |
| Total (Category) | 21 (13.6%) | 133 (86.4%) |
| Total (Overall) | 138 (48.4%) | 147 (51.6%) |
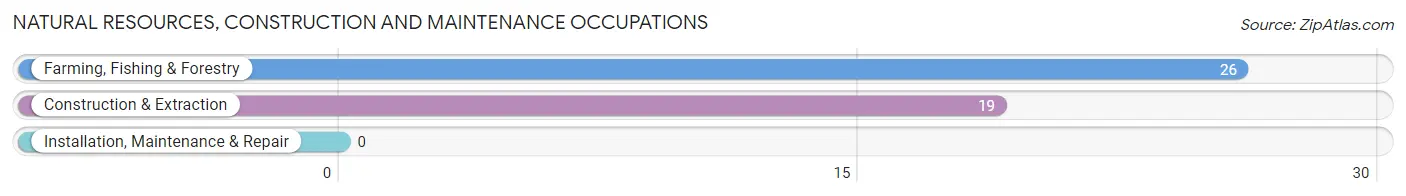
Natural Resources, Construction and Maintenance Occupations
The most common Natural Resources, Construction and Maintenance occupations in West Point are Farming, Fishing & Forestry (26 | 9.1%), and Construction & Extraction (19 | 6.7%).
Natural Resources, Construction and Maintenance Occupations by Sex
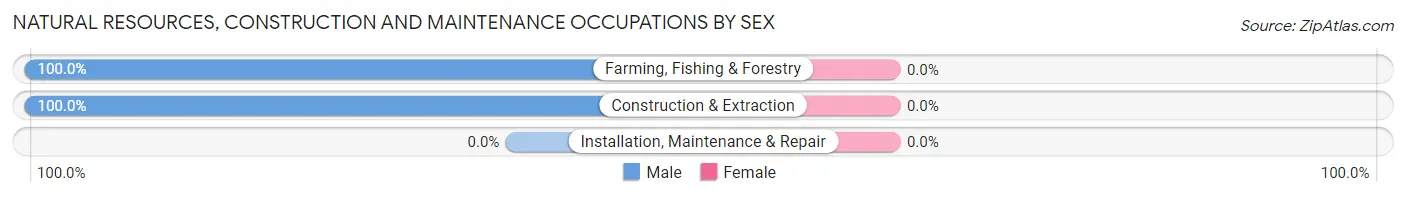
| Occupation | Male | Female |
| Farming, Fishing & Forestry | 26 (100.0%) | 0 (0.0%) |
| Construction & Extraction | 19 (100.0%) | 0 (0.0%) |
| Installation, Maintenance & Repair | 0 (0.0%) | 0 (0.0%) |
| Total (Category) | 45 (100.0%) | 0 (0.0%) |
| Total (Overall) | 138 (48.4%) | 147 (51.6%) |
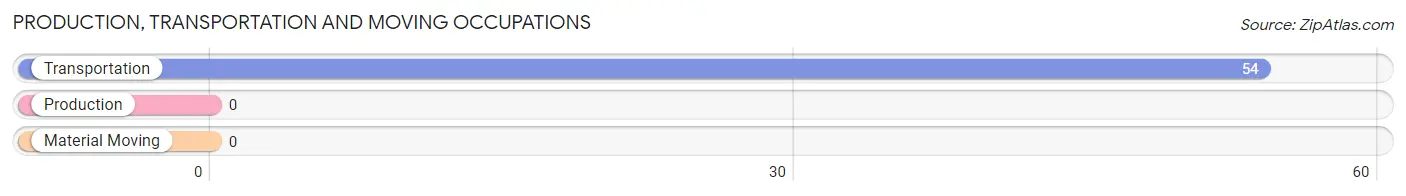
Production, Transportation and Moving Occupations
The most common Production, Transportation and Moving occupations in West Point are , and Transportation (54 | 19.0%).
Production, Transportation and Moving Occupations by Sex
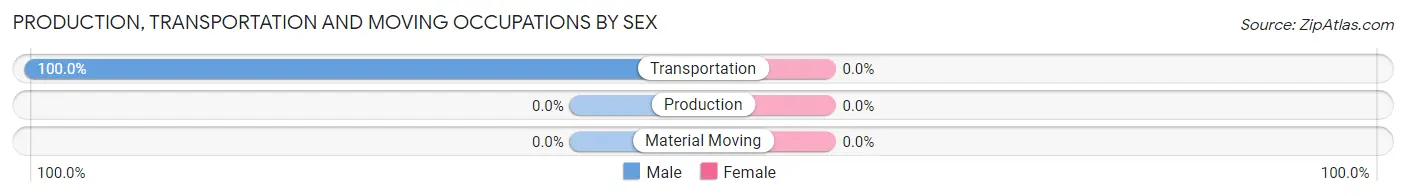
| Occupation | Male | Female |
| Production | 0 (0.0%) | 0 (0.0%) |
| Transportation | 54 (100.0%) | 0 (0.0%) |
| Material Moving | 0 (0.0%) | 0 (0.0%) |
| Total (Category) | 54 (100.0%) | 0 (0.0%) |
| Total (Overall) | 138 (48.4%) | 147 (51.6%) |
Employment Industries by Sex in West Point
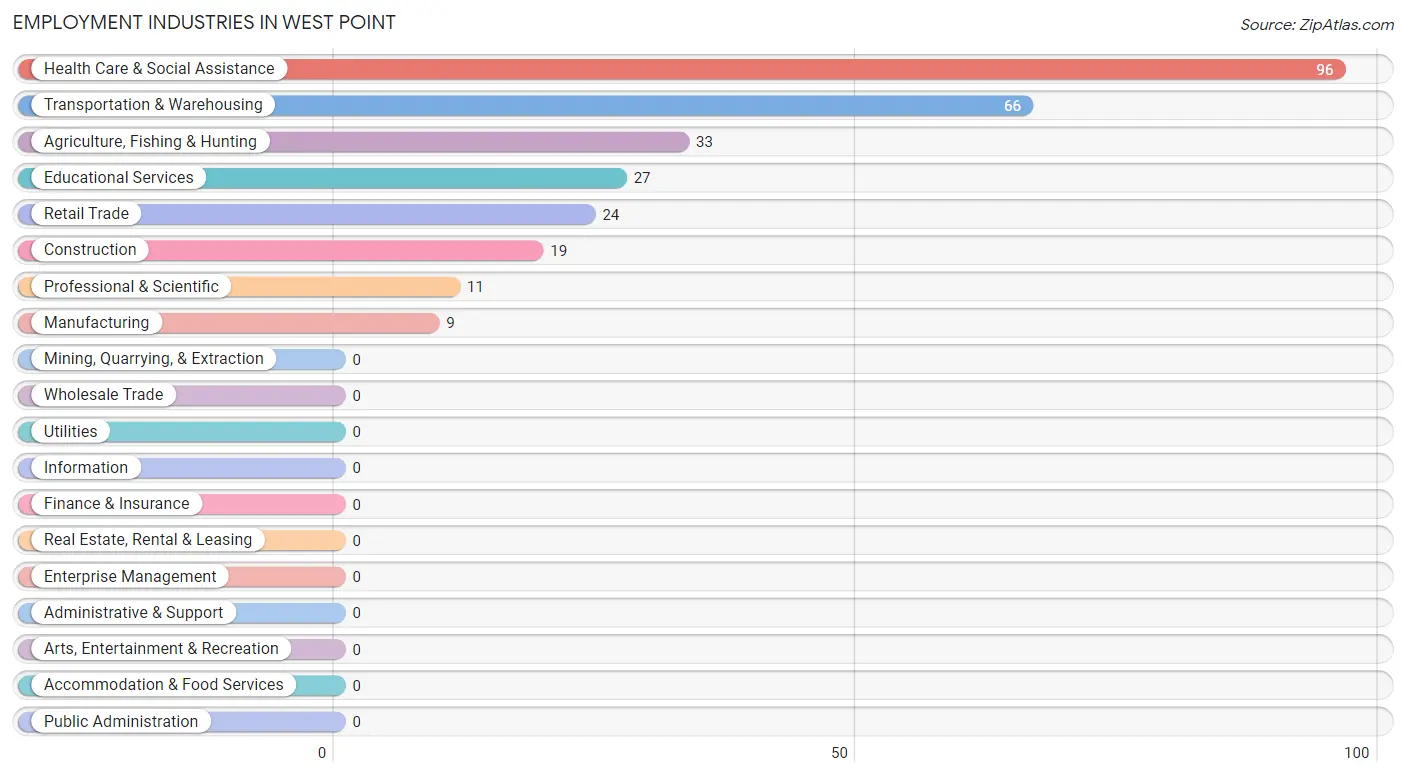
Employment Industries in West Point
The major employment industries in West Point include Health Care & Social Assistance (96 | 33.7%), Transportation & Warehousing (66 | 23.2%), Agriculture, Fishing & Hunting (33 | 11.6%), Educational Services (27 | 9.5%), and Retail Trade (24 | 8.4%).
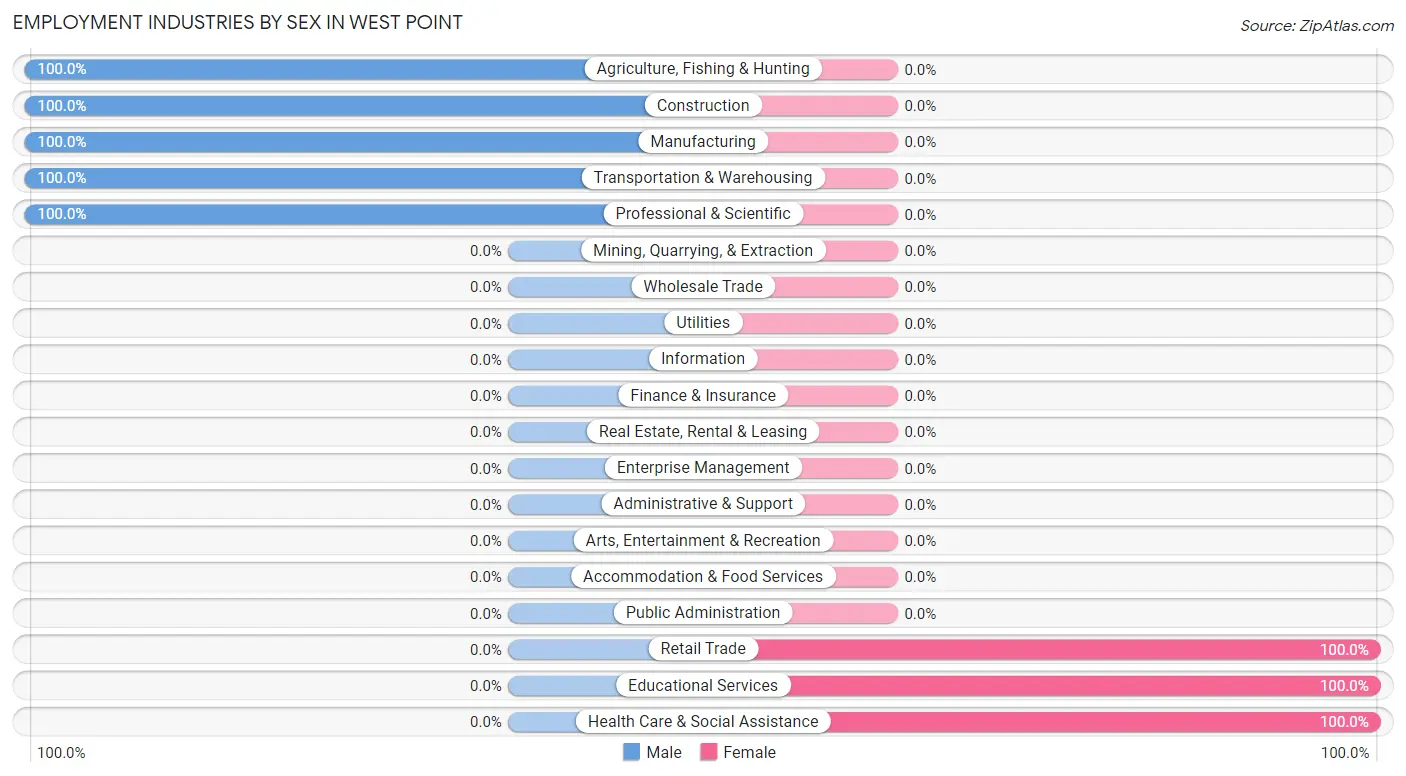
Employment Industries by Sex in West Point
The West Point industries that see more men than women are Agriculture, Fishing & Hunting (100.0%), Construction (100.0%), and Manufacturing (100.0%), whereas the industries that tend to have a higher number of women are Retail Trade (100.0%), Educational Services (100.0%), and Health Care & Social Assistance (100.0%).
| Industry | Male | Female |
| Agriculture, Fishing & Hunting | 33 (100.0%) | 0 (0.0%) |
| Mining, Quarrying, & Extraction | 0 (0.0%) | 0 (0.0%) |
| Construction | 19 (100.0%) | 0 (0.0%) |
| Manufacturing | 9 (100.0%) | 0 (0.0%) |
| Wholesale Trade | 0 (0.0%) | 0 (0.0%) |
| Retail Trade | 0 (0.0%) | 24 (100.0%) |
| Transportation & Warehousing | 66 (100.0%) | 0 (0.0%) |
| Utilities | 0 (0.0%) | 0 (0.0%) |
| Information | 0 (0.0%) | 0 (0.0%) |
| Finance & Insurance | 0 (0.0%) | 0 (0.0%) |
| Real Estate, Rental & Leasing | 0 (0.0%) | 0 (0.0%) |
| Professional & Scientific | 11 (100.0%) | 0 (0.0%) |
| Enterprise Management | 0 (0.0%) | 0 (0.0%) |
| Administrative & Support | 0 (0.0%) | 0 (0.0%) |
| Educational Services | 0 (0.0%) | 27 (100.0%) |
| Health Care & Social Assistance | 0 (0.0%) | 96 (100.0%) |
| Arts, Entertainment & Recreation | 0 (0.0%) | 0 (0.0%) |
| Accommodation & Food Services | 0 (0.0%) | 0 (0.0%) |
| Public Administration | 0 (0.0%) | 0 (0.0%) |
| Total | 138 (48.4%) | 147 (51.6%) |
Education in West Point
School Enrollment in West Point
The most common levels of schooling among the 139 students in West Point are elementary school (38 | 27.3%), middle school (31 | 22.3%), and college / undergraduate (26 | 18.7%).
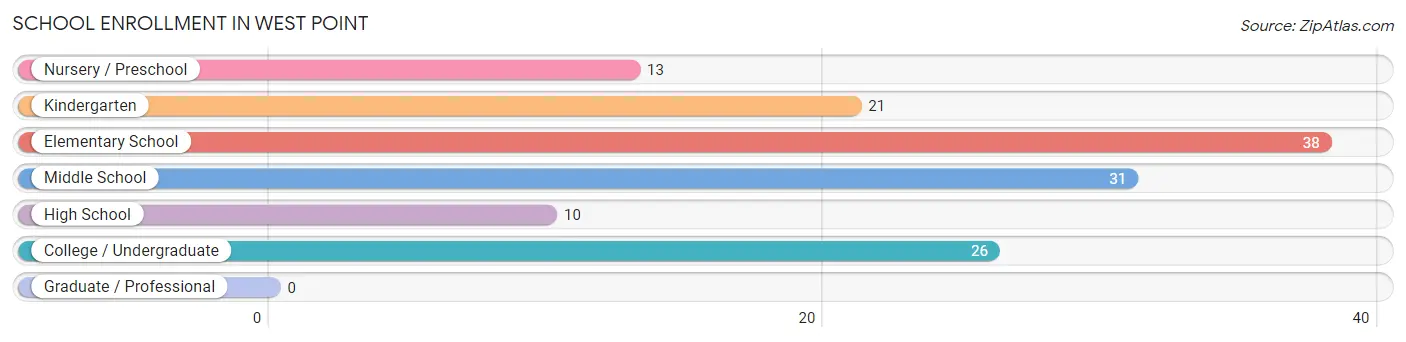
| School Level | # Students | % Students |
| Nursery / Preschool | 13 | 9.3% |
| Kindergarten | 21 | 15.1% |
| Elementary School | 38 | 27.3% |
| Middle School | 31 | 22.3% |
| High School | 10 | 7.2% |
| College / Undergraduate | 26 | 18.7% |
| Graduate / Professional | 0 | 0.0% |
| Total | 139 | 100.0% |
School Enrollment by Age by Funding Source in West Point
Out of a total of 139 students who are enrolled in schools in West Point, 13 (9.4%) attend a private institution, while the remaining 126 (90.6%) are enrolled in public schools. The age group of 3 to 4 year olds has the highest likelihood of being enrolled in private schools, with 13 (100.0% in the age bracket) enrolled. Conversely, the age group of 5 to 9 year old has the lowest likelihood of being enrolled in a private school, with 59 (100.0% in the age bracket) attending a public institution.
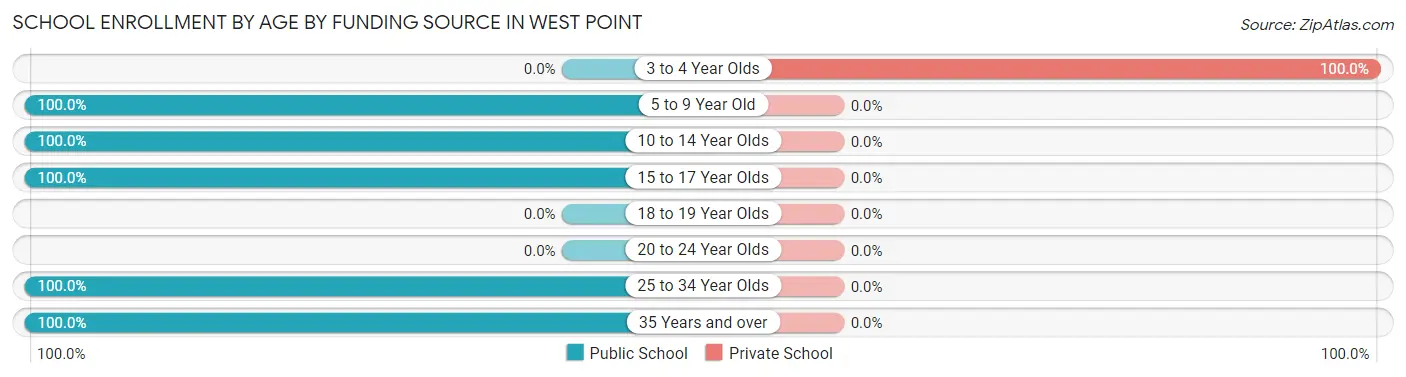
| Age Bracket | Public School | Private School |
| 3 to 4 Year Olds | 0 (0.0%) | 13 (100.0%) |
| 5 to 9 Year Old | 59 (100.0%) | 0 (0.0%) |
| 10 to 14 Year Olds | 31 (100.0%) | 0 (0.0%) |
| 15 to 17 Year Olds | 10 (100.0%) | 0 (0.0%) |
| 18 to 19 Year Olds | 0 (0.0%) | 0 (0.0%) |
| 20 to 24 Year Olds | 0 (0.0%) | 0 (0.0%) |
| 25 to 34 Year Olds | 7 (100.0%) | 0 (0.0%) |
| 35 Years and over | 19 (100.0%) | 0 (0.0%) |
| Total | 126 (90.6%) | 13 (9.4%) |
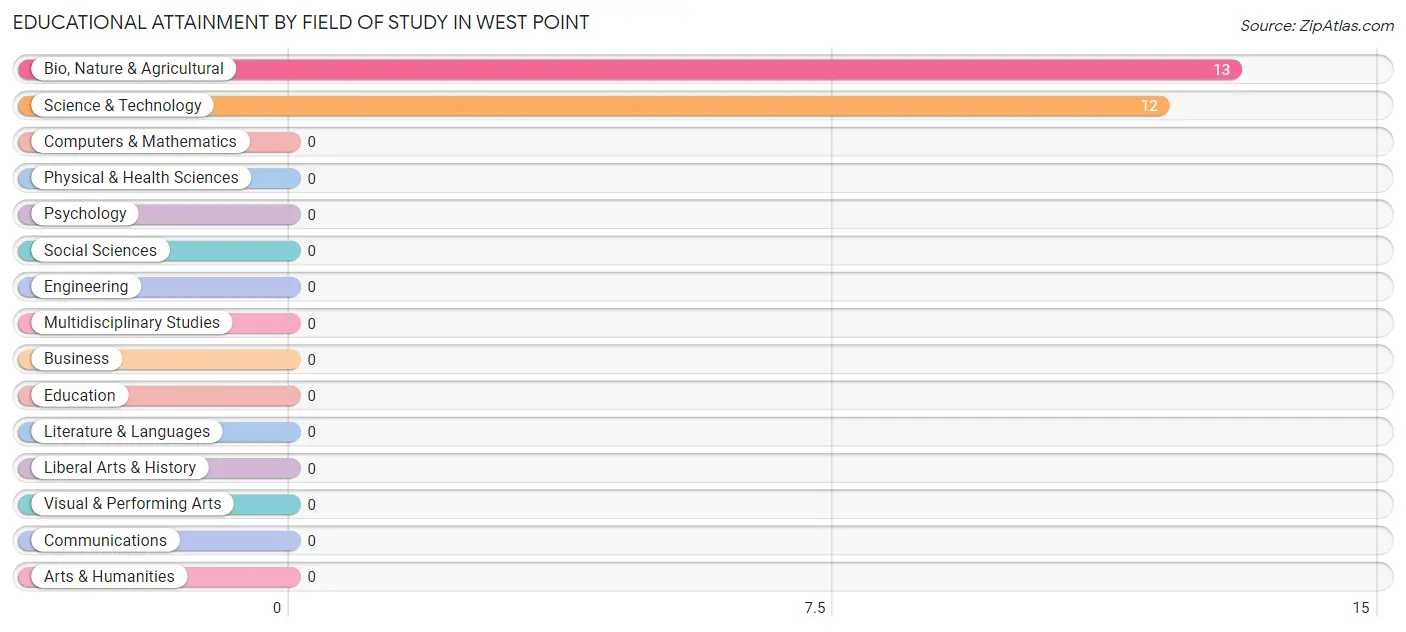
Educational Attainment by Field of Study in West Point
Bio, nature & agricultural (13 | 52.0%), and science & technology (12 | 48.0%) are the most common fields of study among 25 individuals in West Point who have obtained a bachelor's degree or higher.
| Field of Study | # Graduates | % Graduates |
| Computers & Mathematics | 0 | 0.0% |
| Bio, Nature & Agricultural | 13 | 52.0% |
| Physical & Health Sciences | 0 | 0.0% |
| Psychology | 0 | 0.0% |
| Social Sciences | 0 | 0.0% |
| Engineering | 0 | 0.0% |
| Multidisciplinary Studies | 0 | 0.0% |
| Science & Technology | 12 | 48.0% |
| Business | 0 | 0.0% |
| Education | 0 | 0.0% |
| Literature & Languages | 0 | 0.0% |
| Liberal Arts & History | 0 | 0.0% |
| Visual & Performing Arts | 0 | 0.0% |
| Communications | 0 | 0.0% |
| Arts & Humanities | 0 | 0.0% |
| Total | 25 | 100.0% |
Transportation & Commute in West Point
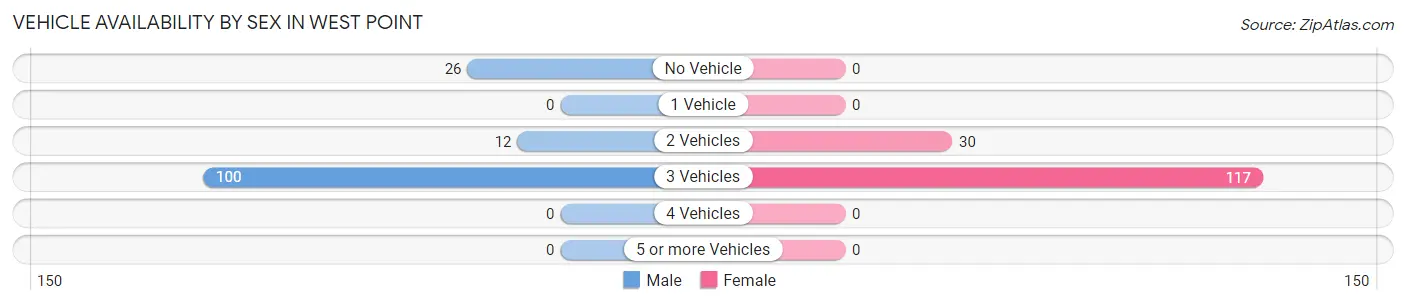
Vehicle Availability by Sex in West Point
The most prevalent vehicle ownership categories in West Point are males with 3 vehicles (100, accounting for 72.5%) and females with 3 vehicles (117, making up 68.0%).
| Vehicles Available | Male | Female |
| No Vehicle | 26 (18.8%) | 0 (0.0%) |
| 1 Vehicle | 0 (0.0%) | 0 (0.0%) |
| 2 Vehicles | 12 (8.7%) | 30 (20.4%) |
| 3 Vehicles | 100 (72.5%) | 117 (79.6%) |
| 4 Vehicles | 0 (0.0%) | 0 (0.0%) |
| 5 or more Vehicles | 0 (0.0%) | 0 (0.0%) |
| Total | 138 (100.0%) | 147 (100.0%) |
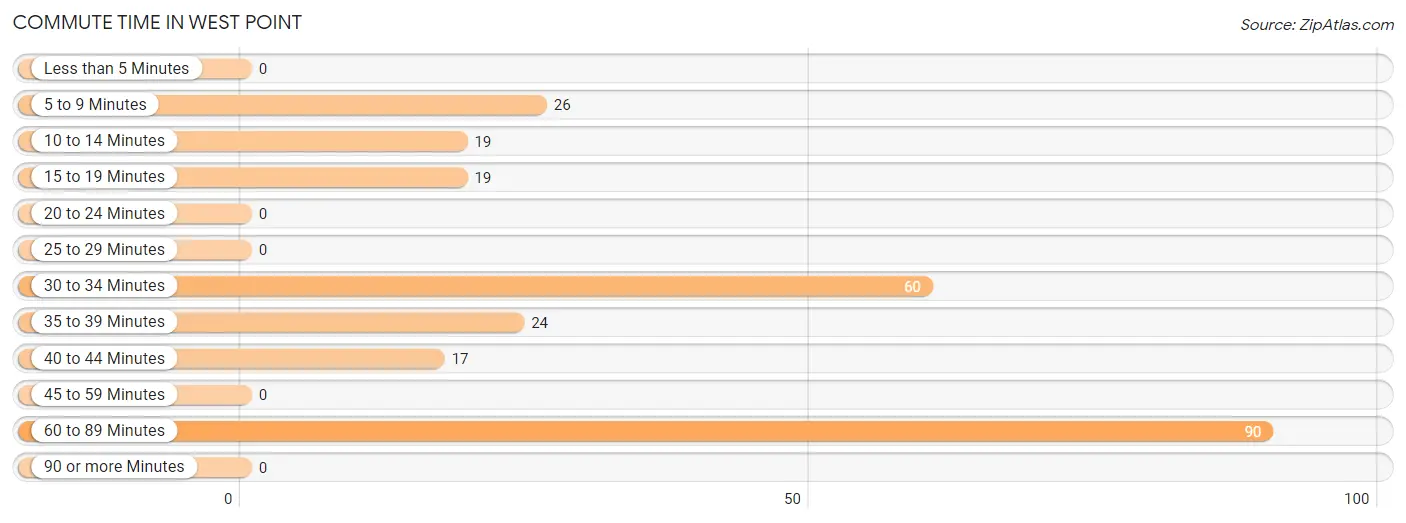
Commute Time in West Point
The most frequently occuring commute durations in West Point are 60 to 89 minutes (90 commuters, 35.3%), 30 to 34 minutes (60 commuters, 23.5%), and 5 to 9 minutes (26 commuters, 10.2%).
| Commute Time | # Commuters | % Commuters |
| Less than 5 Minutes | 0 | 0.0% |
| 5 to 9 Minutes | 26 | 10.2% |
| 10 to 14 Minutes | 19 | 7.4% |
| 15 to 19 Minutes | 19 | 7.4% |
| 20 to 24 Minutes | 0 | 0.0% |
| 25 to 29 Minutes | 0 | 0.0% |
| 30 to 34 Minutes | 60 | 23.5% |
| 35 to 39 Minutes | 24 | 9.4% |
| 40 to 44 Minutes | 17 | 6.7% |
| 45 to 59 Minutes | 0 | 0.0% |
| 60 to 89 Minutes | 90 | 35.3% |
| 90 or more Minutes | 0 | 0.0% |
Commute Time by Sex in West Point
The most common commute times in West Point are 30 to 34 minutes (54 commuters, 50.0%) for males and 60 to 89 minutes (90 commuters, 61.2%) for females.
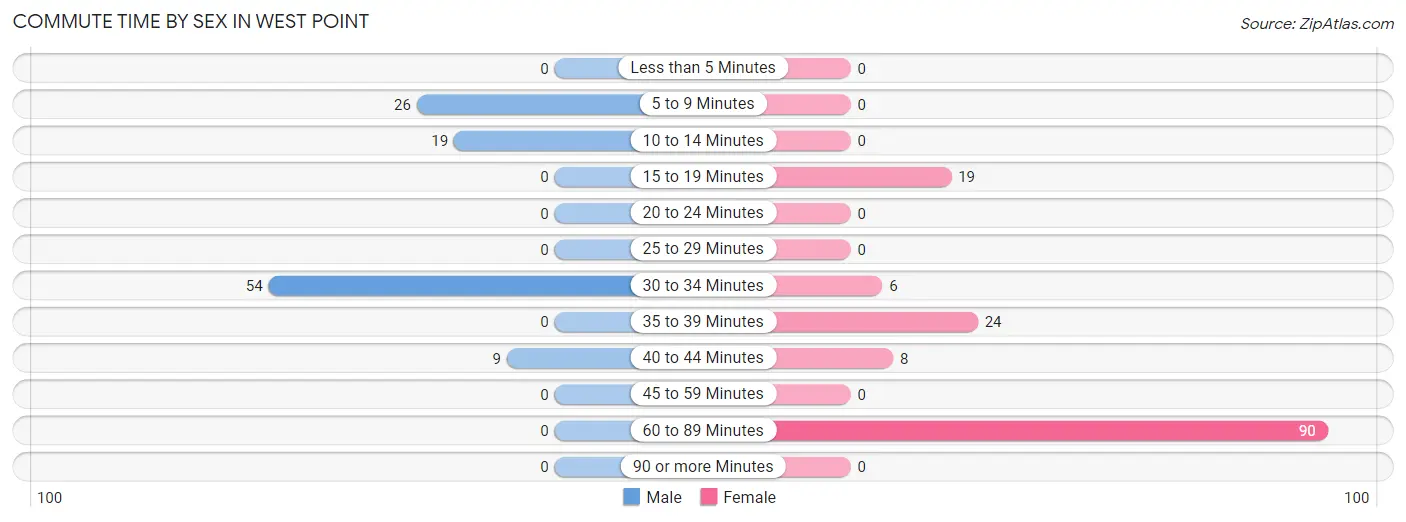
| Commute Time | Male | Female |
| Less than 5 Minutes | 0 (0.0%) | 0 (0.0%) |
| 5 to 9 Minutes | 26 (24.1%) | 0 (0.0%) |
| 10 to 14 Minutes | 19 (17.6%) | 0 (0.0%) |
| 15 to 19 Minutes | 0 (0.0%) | 19 (12.9%) |
| 20 to 24 Minutes | 0 (0.0%) | 0 (0.0%) |
| 25 to 29 Minutes | 0 (0.0%) | 0 (0.0%) |
| 30 to 34 Minutes | 54 (50.0%) | 6 (4.1%) |
| 35 to 39 Minutes | 0 (0.0%) | 24 (16.3%) |
| 40 to 44 Minutes | 9 (8.3%) | 8 (5.4%) |
| 45 to 59 Minutes | 0 (0.0%) | 0 (0.0%) |
| 60 to 89 Minutes | 0 (0.0%) | 90 (61.2%) |
| 90 or more Minutes | 0 (0.0%) | 0 (0.0%) |
Time of Departure to Work by Sex in West Point
The most frequent times of departure to work in West Point are 7:00 AM to 7:29 AM (54, 50.0%) for males and 6:00 AM to 6:29 AM (90, 61.2%) for females.
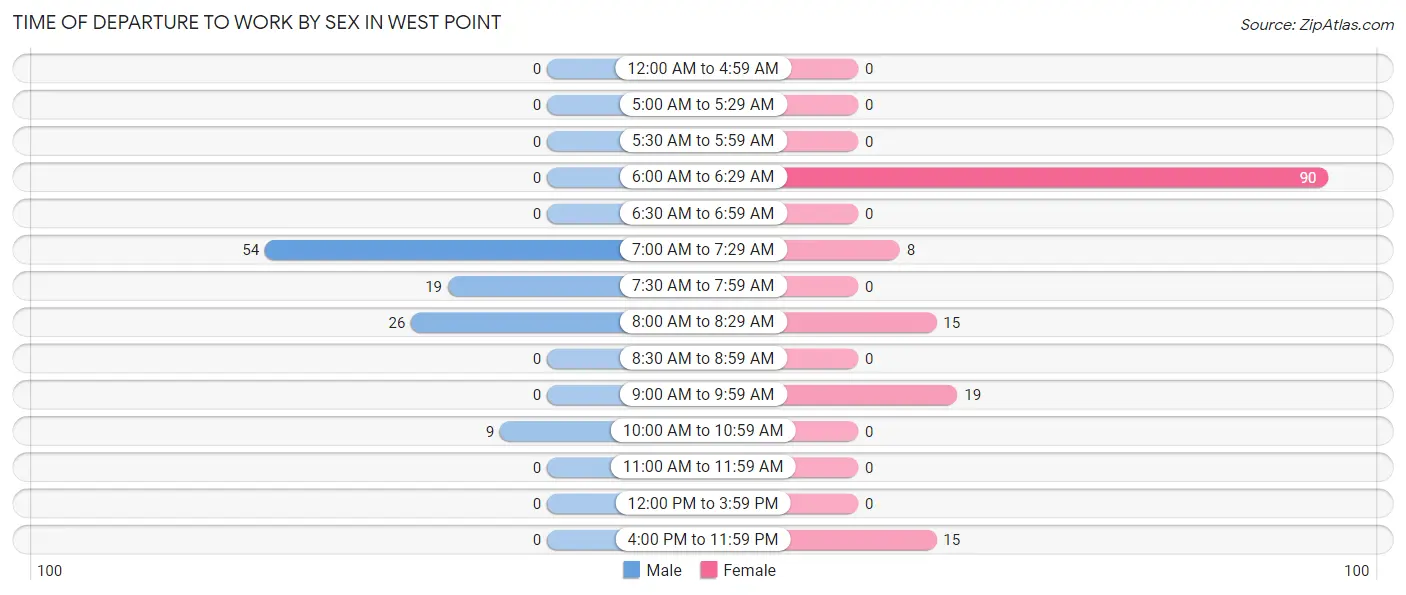
| Time of Departure | Male | Female |
| 12:00 AM to 4:59 AM | 0 (0.0%) | 0 (0.0%) |
| 5:00 AM to 5:29 AM | 0 (0.0%) | 0 (0.0%) |
| 5:30 AM to 5:59 AM | 0 (0.0%) | 0 (0.0%) |
| 6:00 AM to 6:29 AM | 0 (0.0%) | 90 (61.2%) |
| 6:30 AM to 6:59 AM | 0 (0.0%) | 0 (0.0%) |
| 7:00 AM to 7:29 AM | 54 (50.0%) | 8 (5.4%) |
| 7:30 AM to 7:59 AM | 19 (17.6%) | 0 (0.0%) |
| 8:00 AM to 8:29 AM | 26 (24.1%) | 15 (10.2%) |
| 8:30 AM to 8:59 AM | 0 (0.0%) | 0 (0.0%) |
| 9:00 AM to 9:59 AM | 0 (0.0%) | 19 (12.9%) |
| 10:00 AM to 10:59 AM | 9 (8.3%) | 0 (0.0%) |
| 11:00 AM to 11:59 AM | 0 (0.0%) | 0 (0.0%) |
| 12:00 PM to 3:59 PM | 0 (0.0%) | 0 (0.0%) |
| 4:00 PM to 11:59 PM | 0 (0.0%) | 15 (10.2%) |
| Total | 108 (100.0%) | 147 (100.0%) |
Housing Occupancy in West Point
Occupancy by Ownership in West Point
Of the total 322 dwellings in West Point, owner-occupied units account for 262 (81.4%), while renter-occupied units make up 60 (18.6%).
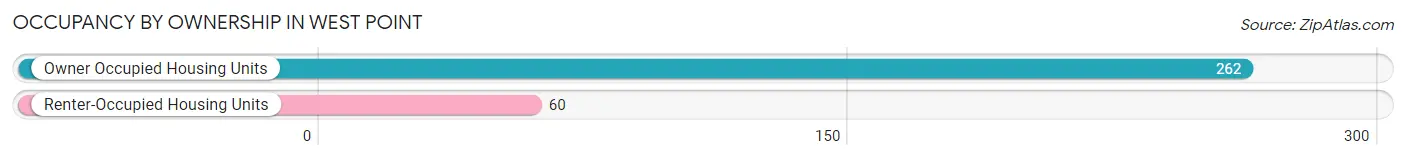
| Occupancy | # Housing Units | % Housing Units |
| Owner Occupied Housing Units | 262 | 81.4% |
| Renter-Occupied Housing Units | 60 | 18.6% |
| Total Occupied Housing Units | 322 | 100.0% |
Occupancy by Household Size in West Point
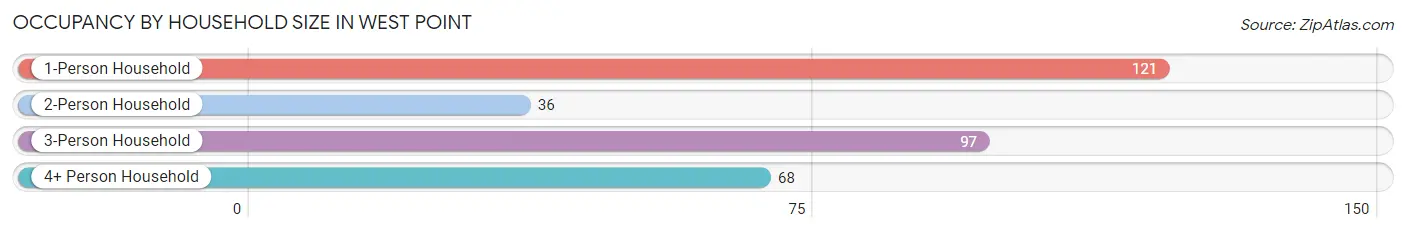
| Household Size | # Housing Units | % Housing Units |
| 1-Person Household | 121 | 37.6% |
| 2-Person Household | 36 | 11.2% |
| 3-Person Household | 97 | 30.1% |
| 4+ Person Household | 68 | 21.1% |
| Total Housing Units | 322 | 100.0% |
Occupancy by Ownership by Household Size in West Point
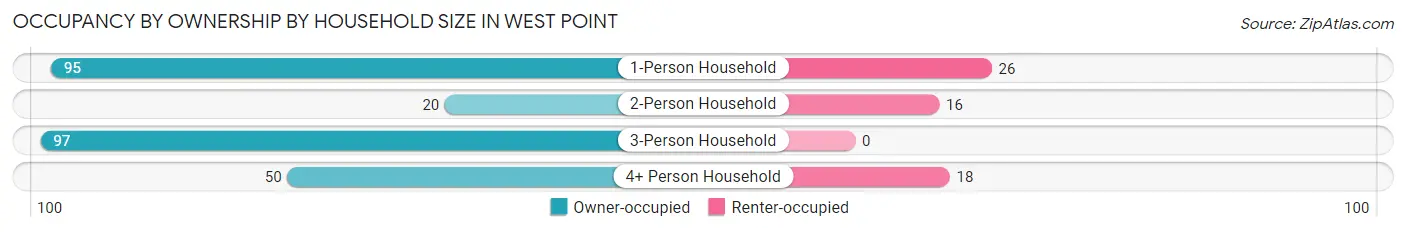
| Household Size | Owner-occupied | Renter-occupied |
| 1-Person Household | 95 (78.5%) | 26 (21.5%) |
| 2-Person Household | 20 (55.6%) | 16 (44.4%) |
| 3-Person Household | 97 (100.0%) | 0 (0.0%) |
| 4+ Person Household | 50 (73.5%) | 18 (26.5%) |
| Total Housing Units | 262 (81.4%) | 60 (18.6%) |
Occupancy by Educational Attainment in West Point
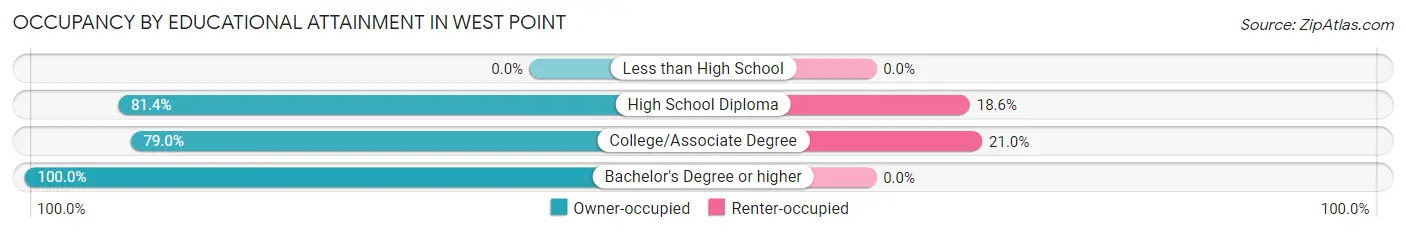
| Household Size | Owner-occupied | Renter-occupied |
| Less than High School | 0 (0.0%) | 0 (0.0%) |
| High School Diploma | 79 (81.4%) | 18 (18.6%) |
| College/Associate Degree | 158 (79.0%) | 42 (21.0%) |
| Bachelor's Degree or higher | 25 (100.0%) | 0 (0.0%) |
Occupancy by Age of Householder in West Point
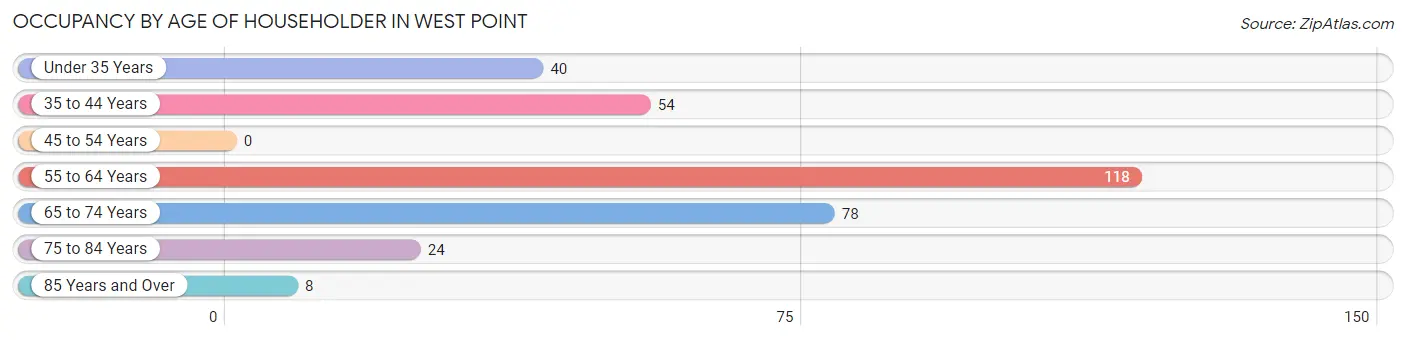
| Age Bracket | # Households | % Households |
| Under 35 Years | 40 | 12.4% |
| 35 to 44 Years | 54 | 16.8% |
| 45 to 54 Years | 0 | 0.0% |
| 55 to 64 Years | 118 | 36.6% |
| 65 to 74 Years | 78 | 24.2% |
| 75 to 84 Years | 24 | 7.4% |
| 85 Years and Over | 8 | 2.5% |
| Total | 322 | 100.0% |
Housing Finances in West Point
Median Income by Occupancy in West Point
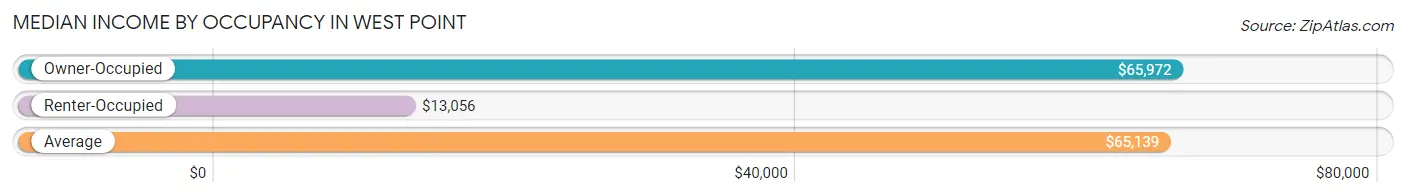
| Occupancy Type | # Households | Median Income |
| Owner-Occupied | 262 (81.4%) | $65,972 |
| Renter-Occupied | 60 (18.6%) | $13,056 |
| Average | 322 (100.0%) | $65,139 |
Occupancy by Householder Income Bracket in West Point
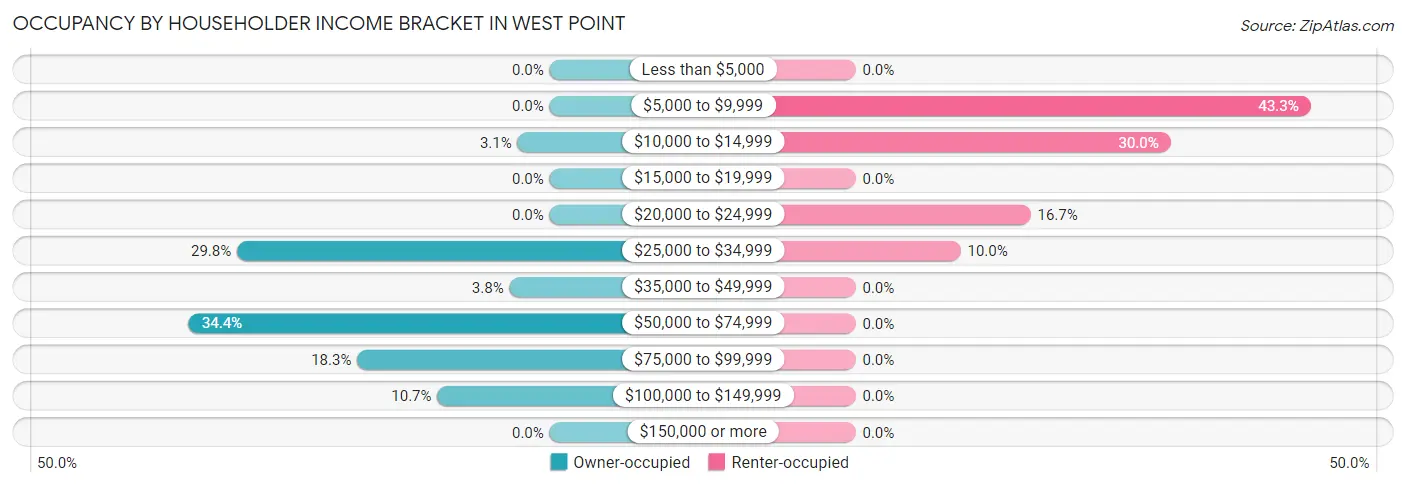
| Income Bracket | Owner-occupied | Renter-occupied |
| Less than $5,000 | 0 (0.0%) | 0 (0.0%) |
| $5,000 to $9,999 | 0 (0.0%) | 26 (43.3%) |
| $10,000 to $14,999 | 8 (3.0%) | 18 (30.0%) |
| $15,000 to $19,999 | 0 (0.0%) | 0 (0.0%) |
| $20,000 to $24,999 | 0 (0.0%) | 10 (16.7%) |
| $25,000 to $34,999 | 78 (29.8%) | 6 (10.0%) |
| $35,000 to $49,999 | 10 (3.8%) | 0 (0.0%) |
| $50,000 to $74,999 | 90 (34.4%) | 0 (0.0%) |
| $75,000 to $99,999 | 48 (18.3%) | 0 (0.0%) |
| $100,000 to $149,999 | 28 (10.7%) | 0 (0.0%) |
| $150,000 or more | 0 (0.0%) | 0 (0.0%) |
| Total | 262 (100.0%) | 60 (100.0%) |
Monthly Housing Cost Tiers in West Point
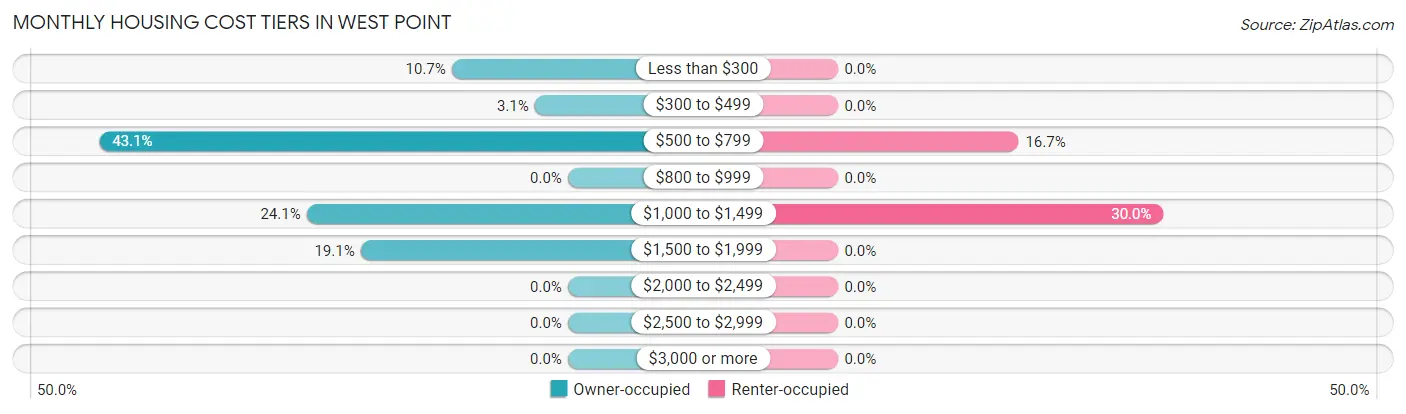
| Monthly Cost | Owner-occupied | Renter-occupied |
| Less than $300 | 28 (10.7%) | 0 (0.0%) |
| $300 to $499 | 8 (3.0%) | 0 (0.0%) |
| $500 to $799 | 113 (43.1%) | 10 (16.7%) |
| $800 to $999 | 0 (0.0%) | 0 (0.0%) |
| $1,000 to $1,499 | 63 (24.0%) | 18 (30.0%) |
| $1,500 to $1,999 | 50 (19.1%) | 0 (0.0%) |
| $2,000 to $2,499 | 0 (0.0%) | 0 (0.0%) |
| $2,500 to $2,999 | 0 (0.0%) | 0 (0.0%) |
| $3,000 or more | 0 (0.0%) | 0 (0.0%) |
| Total | 262 (100.0%) | 60 (100.0%) |
Physical Housing Characteristics in West Point
Housing Structures in West Point
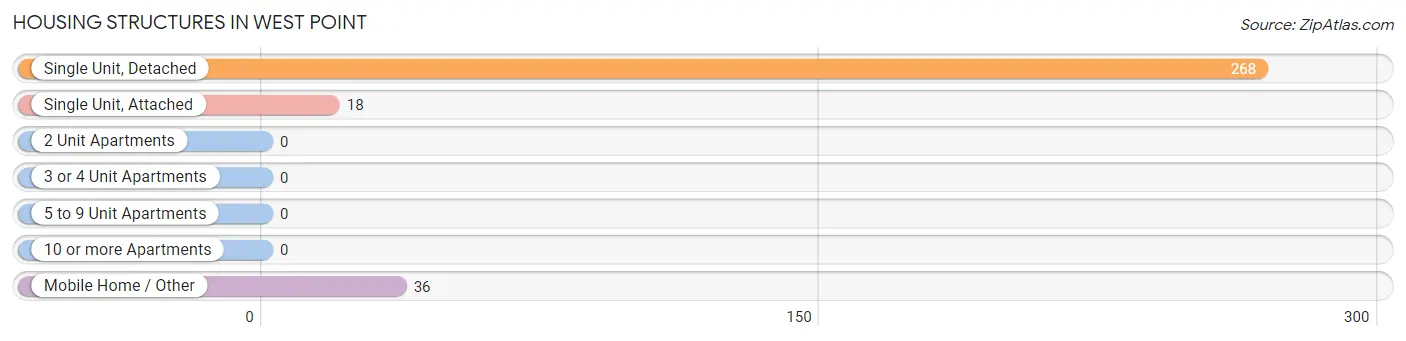
| Structure Type | # Housing Units | % Housing Units |
| Single Unit, Detached | 268 | 83.2% |
| Single Unit, Attached | 18 | 5.6% |
| 2 Unit Apartments | 0 | 0.0% |
| 3 or 4 Unit Apartments | 0 | 0.0% |
| 5 to 9 Unit Apartments | 0 | 0.0% |
| 10 or more Apartments | 0 | 0.0% |
| Mobile Home / Other | 36 | 11.2% |
| Total | 322 | 100.0% |
Housing Structures by Occupancy in West Point
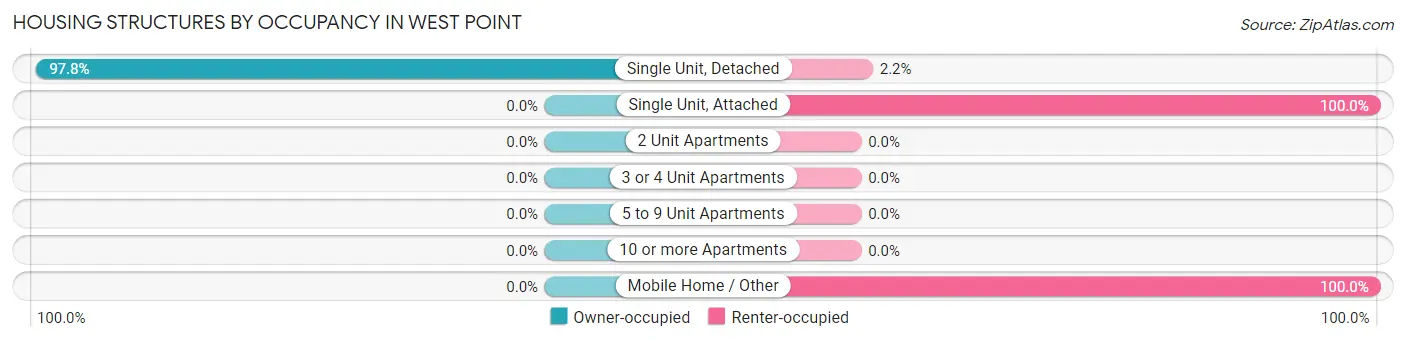
| Structure Type | Owner-occupied | Renter-occupied |
| Single Unit, Detached | 262 (97.8%) | 6 (2.2%) |
| Single Unit, Attached | 0 (0.0%) | 18 (100.0%) |
| 2 Unit Apartments | 0 (0.0%) | 0 (0.0%) |
| 3 or 4 Unit Apartments | 0 (0.0%) | 0 (0.0%) |
| 5 to 9 Unit Apartments | 0 (0.0%) | 0 (0.0%) |
| 10 or more Apartments | 0 (0.0%) | 0 (0.0%) |
| Mobile Home / Other | 0 (0.0%) | 36 (100.0%) |
| Total | 262 (81.4%) | 60 (18.6%) |
Housing Structures by Number of Rooms in West Point
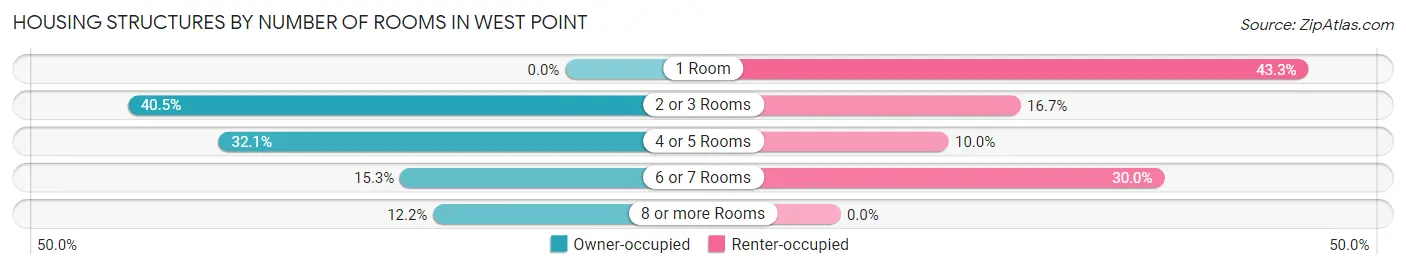
| Number of Rooms | Owner-occupied | Renter-occupied |
| 1 Room | 0 (0.0%) | 26 (43.3%) |
| 2 or 3 Rooms | 106 (40.5%) | 10 (16.7%) |
| 4 or 5 Rooms | 84 (32.1%) | 6 (10.0%) |
| 6 or 7 Rooms | 40 (15.3%) | 18 (30.0%) |
| 8 or more Rooms | 32 (12.2%) | 0 (0.0%) |
| Total | 262 (100.0%) | 60 (100.0%) |
Housing Structure by Heating Type in West Point
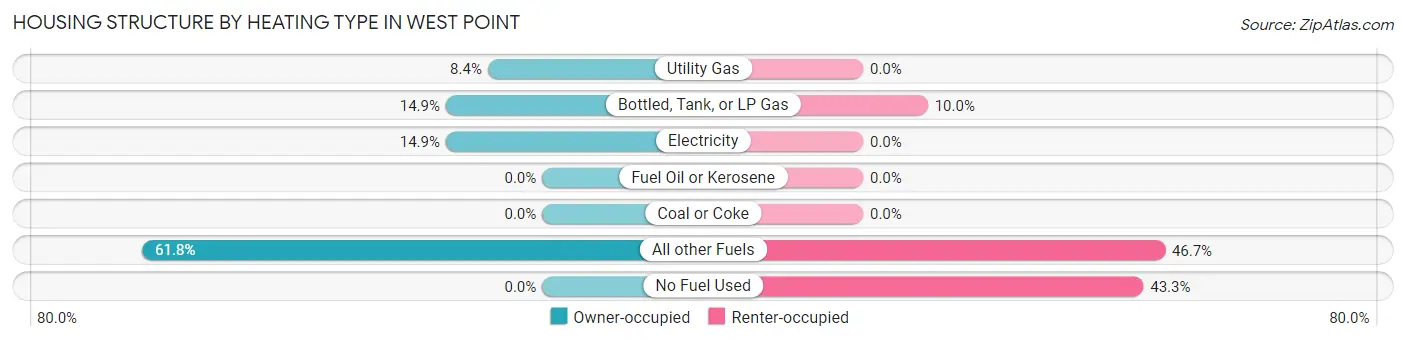
| Heating Type | Owner-occupied | Renter-occupied |
| Utility Gas | 22 (8.4%) | 0 (0.0%) |
| Bottled, Tank, or LP Gas | 39 (14.9%) | 6 (10.0%) |
| Electricity | 39 (14.9%) | 0 (0.0%) |
| Fuel Oil or Kerosene | 0 (0.0%) | 0 (0.0%) |
| Coal or Coke | 0 (0.0%) | 0 (0.0%) |
| All other Fuels | 162 (61.8%) | 28 (46.7%) |
| No Fuel Used | 0 (0.0%) | 26 (43.3%) |
| Total | 262 (100.0%) | 60 (100.0%) |
Household Vehicle Usage in West Point
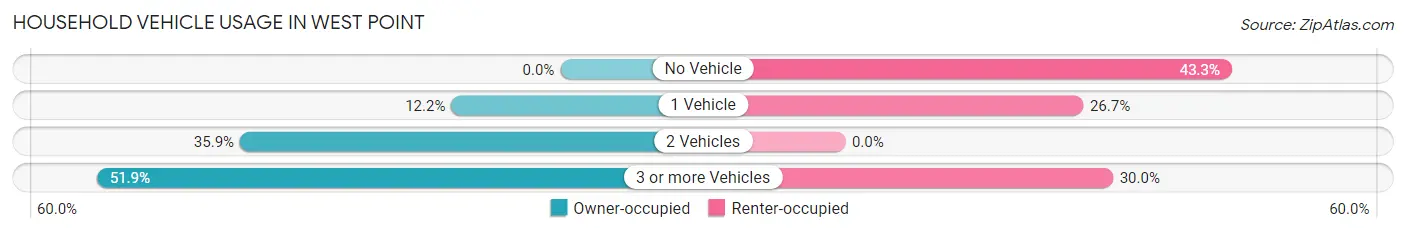
| Vehicles per Household | Owner-occupied | Renter-occupied |
| No Vehicle | 0 (0.0%) | 26 (43.3%) |
| 1 Vehicle | 32 (12.2%) | 16 (26.7%) |
| 2 Vehicles | 94 (35.9%) | 0 (0.0%) |
| 3 or more Vehicles | 136 (51.9%) | 18 (30.0%) |
| Total | 262 (100.0%) | 60 (100.0%) |
Real Estate & Mortgages in West Point
Real Estate and Mortgage Overview in West Point
| Characteristic | Without Mortgage | With Mortgage |
| Housing Units | 188 | 74 |
| Median Property Value | $89,600 | $273,200 |
| Median Household Income | $65,611 | $0 |
| Monthly Housing Costs | $558 | $0 |
| Real Estate Taxes | - | - |
Property Value by Mortgage Status in West Point
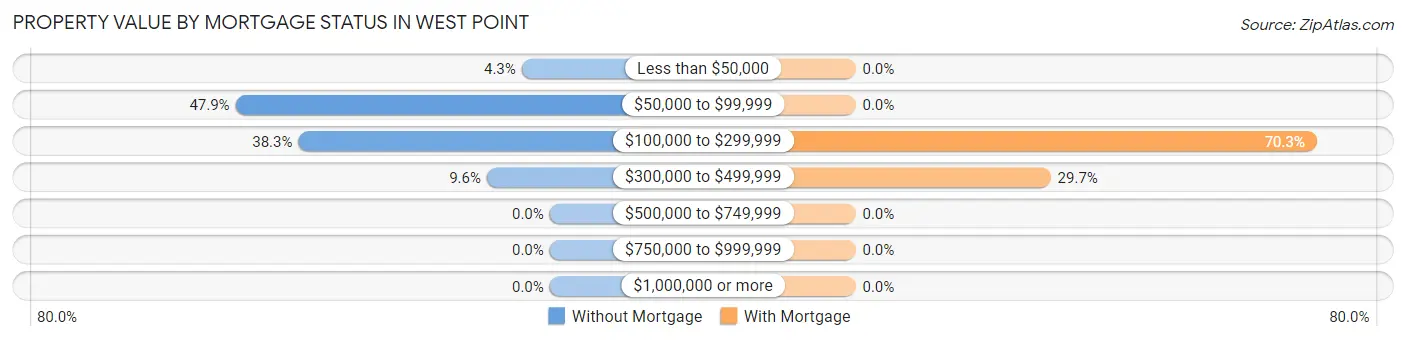
| Property Value | Without Mortgage | With Mortgage |
| Less than $50,000 | 8 (4.3%) | 0 (0.0%) |
| $50,000 to $99,999 | 90 (47.9%) | 0 (0.0%) |
| $100,000 to $299,999 | 72 (38.3%) | 52 (70.3%) |
| $300,000 to $499,999 | 18 (9.6%) | 22 (29.7%) |
| $500,000 to $749,999 | 0 (0.0%) | 0 (0.0%) |
| $750,000 to $999,999 | 0 (0.0%) | 0 (0.0%) |
| $1,000,000 or more | 0 (0.0%) | 0 (0.0%) |
| Total | 188 (100.0%) | 74 (100.0%) |
Household Income by Mortgage Status in West Point
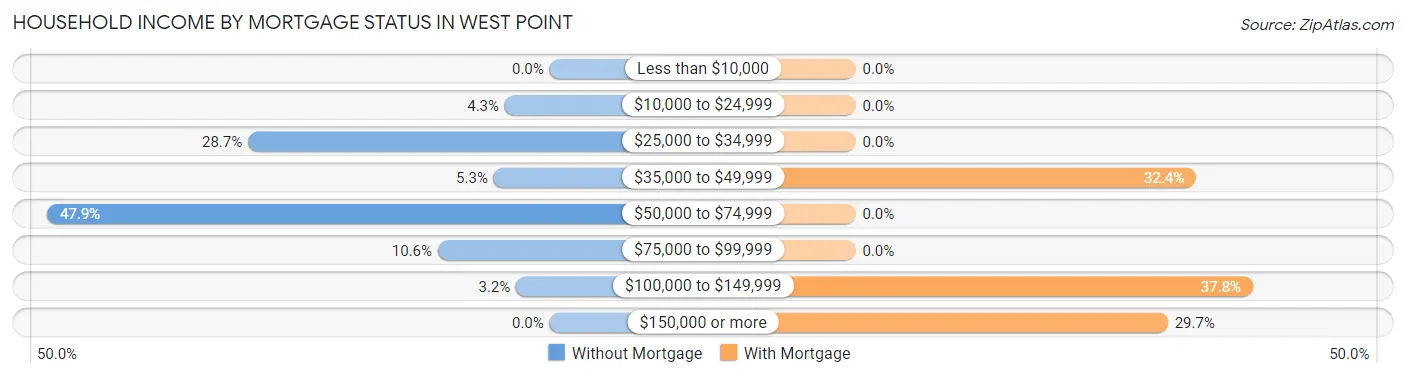
| Household Income | Without Mortgage | With Mortgage |
| Less than $10,000 | 0 (0.0%) | 0 (0.0%) |
| $10,000 to $24,999 | 8 (4.3%) | 0 (0.0%) |
| $25,000 to $34,999 | 54 (28.7%) | 0 (0.0%) |
| $35,000 to $49,999 | 10 (5.3%) | 24 (32.4%) |
| $50,000 to $74,999 | 90 (47.9%) | 0 (0.0%) |
| $75,000 to $99,999 | 20 (10.6%) | 0 (0.0%) |
| $100,000 to $149,999 | 6 (3.2%) | 28 (37.8%) |
| $150,000 or more | 0 (0.0%) | 22 (29.7%) |
| Total | 188 (100.0%) | 74 (100.0%) |
Property Value to Household Income Ratio in West Point
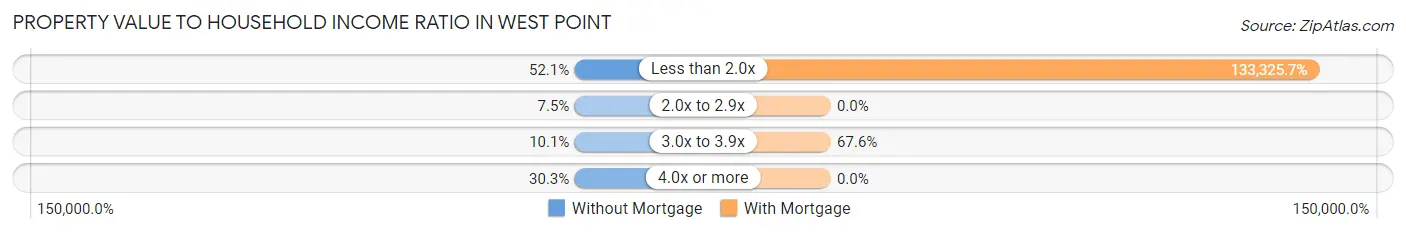
| Value-to-Income Ratio | Without Mortgage | With Mortgage |
| Less than 2.0x | 98 (52.1%) | 98,661 (133,325.7%) |
| 2.0x to 2.9x | 14 (7.4%) | 0 (0.0%) |
| 3.0x to 3.9x | 19 (10.1%) | 50 (67.6%) |
| 4.0x or more | 57 (30.3%) | 0 (0.0%) |
| Total | 188 (100.0%) | 74 (100.0%) |
Real Estate Taxes by Mortgage Status in West Point
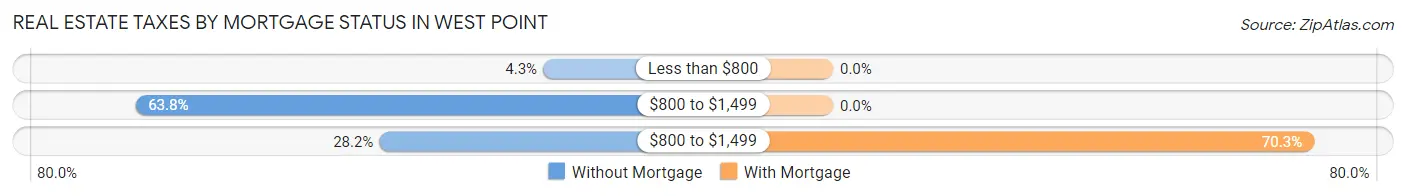
| Property Taxes | Without Mortgage | With Mortgage |
| Less than $800 | 8 (4.3%) | 0 (0.0%) |
| $800 to $1,499 | 120 (63.8%) | 0 (0.0%) |
| $800 to $1,499 | 53 (28.2%) | 52 (70.3%) |
| Total | 188 (100.0%) | 74 (100.0%) |
Health & Disability in West Point
Health Insurance Coverage by Age in West Point
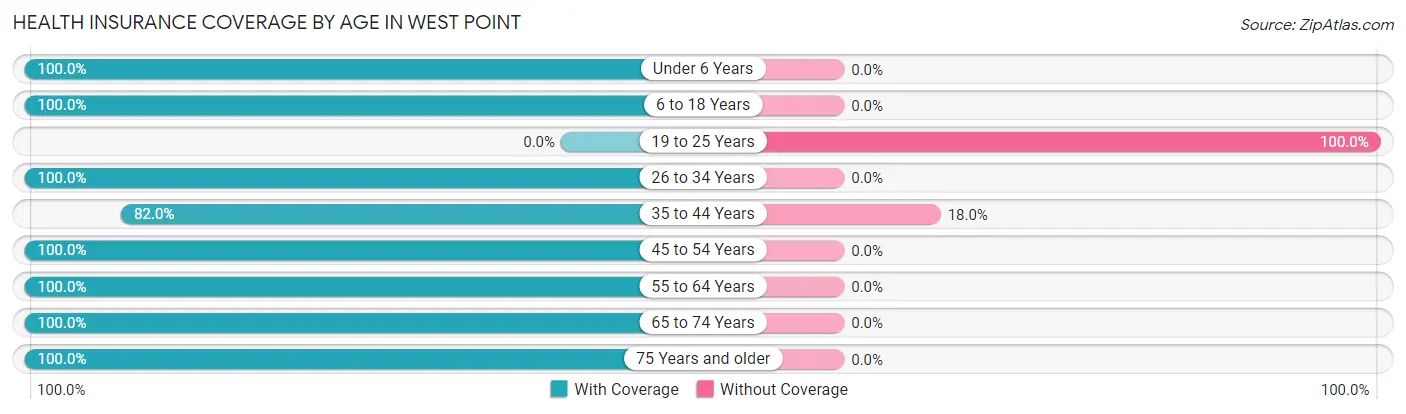
| Age Bracket | With Coverage | Without Coverage |
| Under 6 Years | 78 (100.0%) | 0 (0.0%) |
| 6 to 18 Years | 79 (100.0%) | 0 (0.0%) |
| 19 to 25 Years | 0 (0.0%) | 54 (100.0%) |
| 26 to 34 Years | 59 (100.0%) | 0 (0.0%) |
| 35 to 44 Years | 73 (82.0%) | 16 (18.0%) |
| 45 to 54 Years | 15 (100.0%) | 0 (0.0%) |
| 55 to 64 Years | 142 (100.0%) | 0 (0.0%) |
| 65 to 74 Years | 229 (100.0%) | 0 (0.0%) |
| 75 Years and older | 32 (100.0%) | 0 (0.0%) |
| Total | 707 (91.0%) | 70 (9.0%) |
Health Insurance Coverage by Citizenship Status in West Point
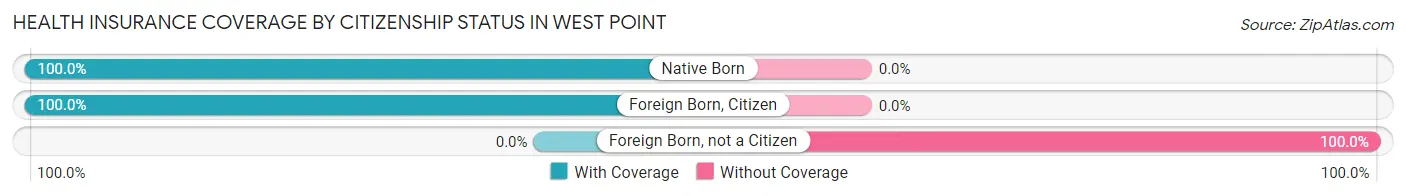
| Citizenship Status | With Coverage | Without Coverage |
| Native Born | 78 (100.0%) | 0 (0.0%) |
| Foreign Born, Citizen | 79 (100.0%) | 0 (0.0%) |
| Foreign Born, not a Citizen | 0 (0.0%) | 54 (100.0%) |
Health Insurance Coverage by Household Income in West Point
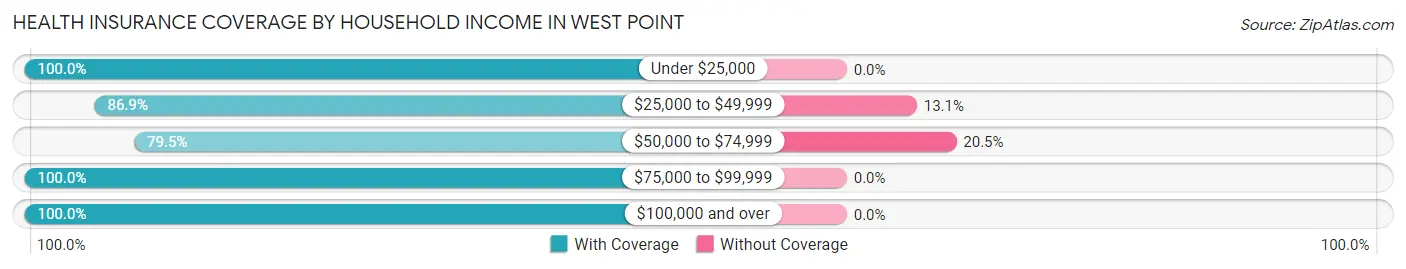
| Household Income | With Coverage | Without Coverage |
| Under $25,000 | 132 (100.0%) | 0 (0.0%) |
| $25,000 to $49,999 | 106 (86.9%) | 16 (13.1%) |
| $50,000 to $74,999 | 209 (79.5%) | 54 (20.5%) |
| $75,000 to $99,999 | 166 (100.0%) | 0 (0.0%) |
| $100,000 and over | 94 (100.0%) | 0 (0.0%) |
Public vs Private Health Insurance Coverage by Age in West Point
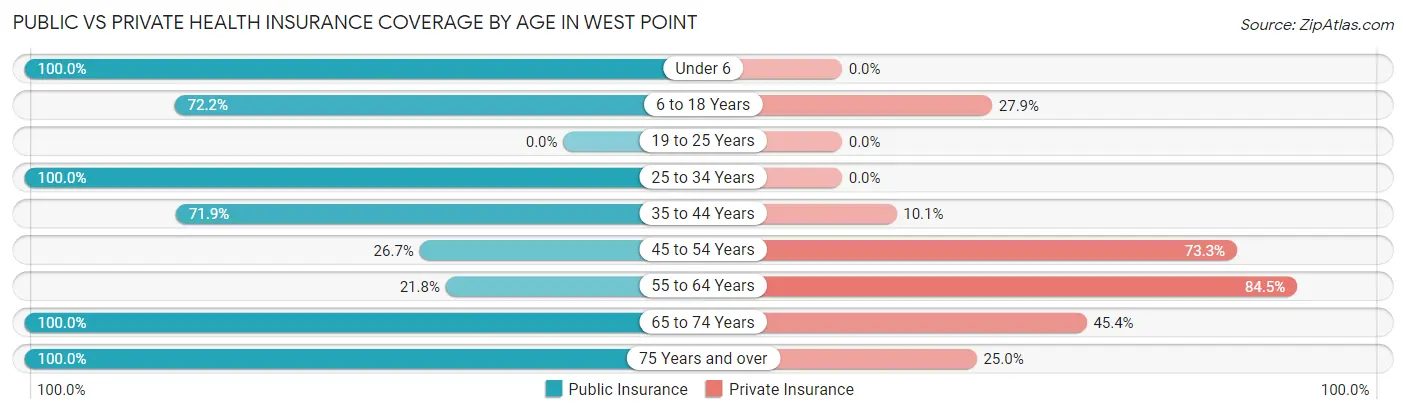
| Age Bracket | Public Insurance | Private Insurance |
| Under 6 | 78 (100.0%) | 0 (0.0%) |
| 6 to 18 Years | 57 (72.2%) | 22 (27.9%) |
| 19 to 25 Years | 0 (0.0%) | 0 (0.0%) |
| 25 to 34 Years | 59 (100.0%) | 0 (0.0%) |
| 35 to 44 Years | 64 (71.9%) | 9 (10.1%) |
| 45 to 54 Years | 4 (26.7%) | 11 (73.3%) |
| 55 to 64 Years | 31 (21.8%) | 120 (84.5%) |
| 65 to 74 Years | 229 (100.0%) | 104 (45.4%) |
| 75 Years and over | 32 (100.0%) | 8 (25.0%) |
| Total | 554 (71.3%) | 274 (35.3%) |
Disability Status by Sex by Age in West Point
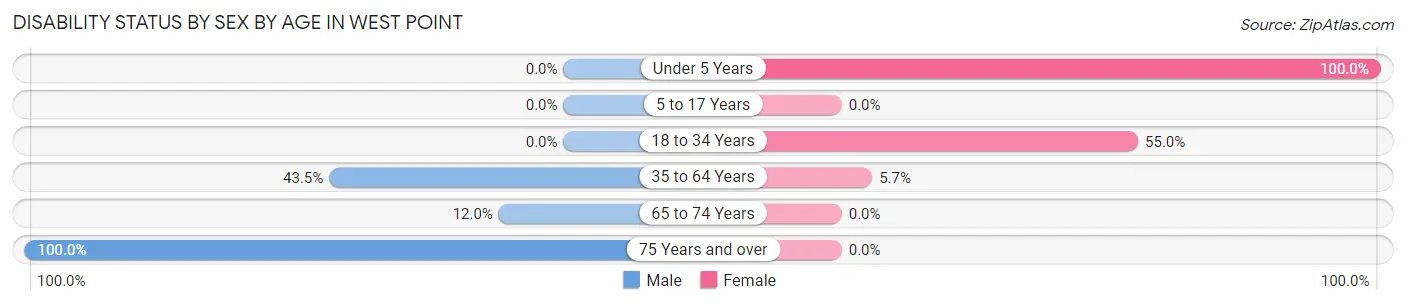
| Age Bracket | Male | Female |
| Under 5 Years | 0 (0.0%) | 31 (100.0%) |
| 5 to 17 Years | 0 (0.0%) | 0 (0.0%) |
| 18 to 34 Years | 0 (0.0%) | 22 (55.0%) |
| 35 to 64 Years | 30 (43.5%) | 10 (5.7%) |
| 65 to 74 Years | 24 (12.0%) | 0 (0.0%) |
| 75 Years and over | 32 (100.0%) | 0 (0.0%) |
Disability Class by Sex by Age in West Point
Disability Class: Hearing Difficulty
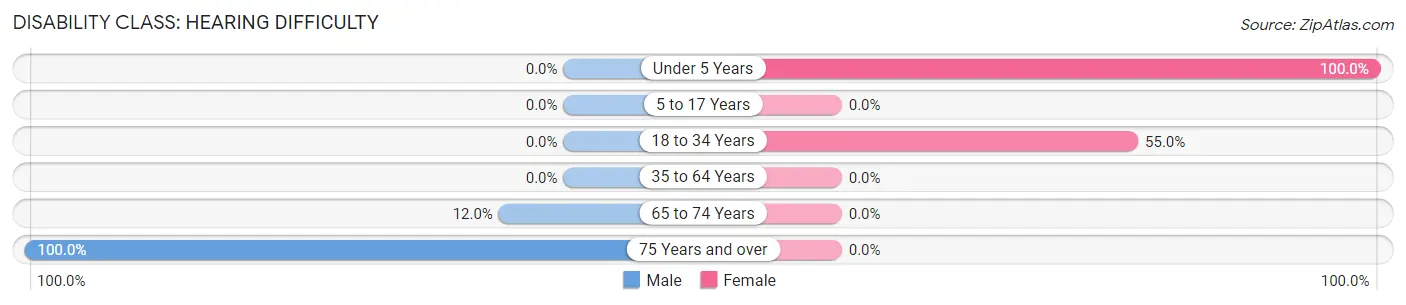
| Age Bracket | Male | Female |
| Under 5 Years | 0 (0.0%) | 31 (100.0%) |
| 5 to 17 Years | 0 (0.0%) | 0 (0.0%) |
| 18 to 34 Years | 0 (0.0%) | 22 (55.0%) |
| 35 to 64 Years | 0 (0.0%) | 0 (0.0%) |
| 65 to 74 Years | 24 (12.0%) | 0 (0.0%) |
| 75 Years and over | 32 (100.0%) | 0 (0.0%) |
Disability Class: Vision Difficulty
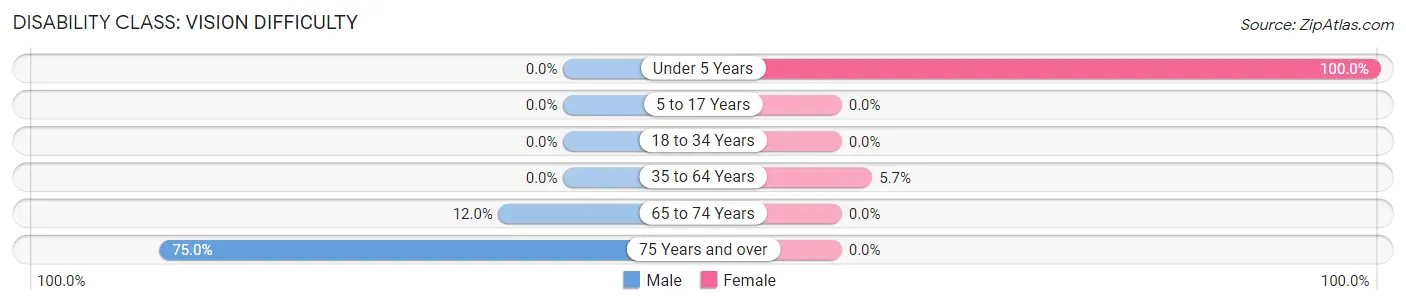
| Age Bracket | Male | Female |
| Under 5 Years | 0 (0.0%) | 31 (100.0%) |
| 5 to 17 Years | 0 (0.0%) | 0 (0.0%) |
| 18 to 34 Years | 0 (0.0%) | 0 (0.0%) |
| 35 to 64 Years | 0 (0.0%) | 10 (5.7%) |
| 65 to 74 Years | 24 (12.0%) | 0 (0.0%) |
| 75 Years and over | 24 (75.0%) | 0 (0.0%) |
Disability Class: Cognitive Difficulty
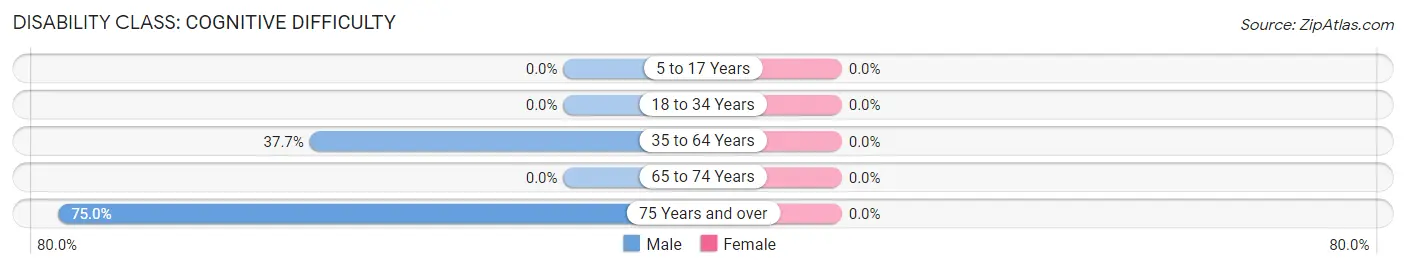
| Age Bracket | Male | Female |
| 5 to 17 Years | 0 (0.0%) | 0 (0.0%) |
| 18 to 34 Years | 0 (0.0%) | 0 (0.0%) |
| 35 to 64 Years | 26 (37.7%) | 0 (0.0%) |
| 65 to 74 Years | 0 (0.0%) | 0 (0.0%) |
| 75 Years and over | 24 (75.0%) | 0 (0.0%) |
Disability Class: Ambulatory Difficulty
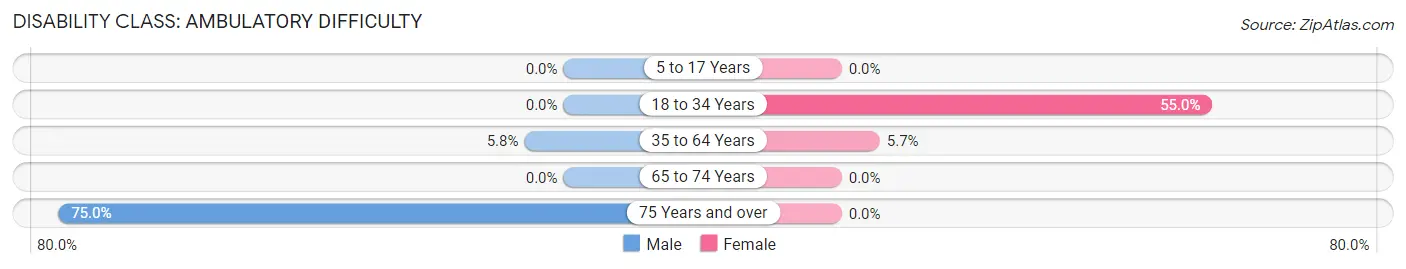
| Age Bracket | Male | Female |
| 5 to 17 Years | 0 (0.0%) | 0 (0.0%) |
| 18 to 34 Years | 0 (0.0%) | 22 (55.0%) |
| 35 to 64 Years | 4 (5.8%) | 10 (5.7%) |
| 65 to 74 Years | 0 (0.0%) | 0 (0.0%) |
| 75 Years and over | 24 (75.0%) | 0 (0.0%) |
Disability Class: Self-Care Difficulty
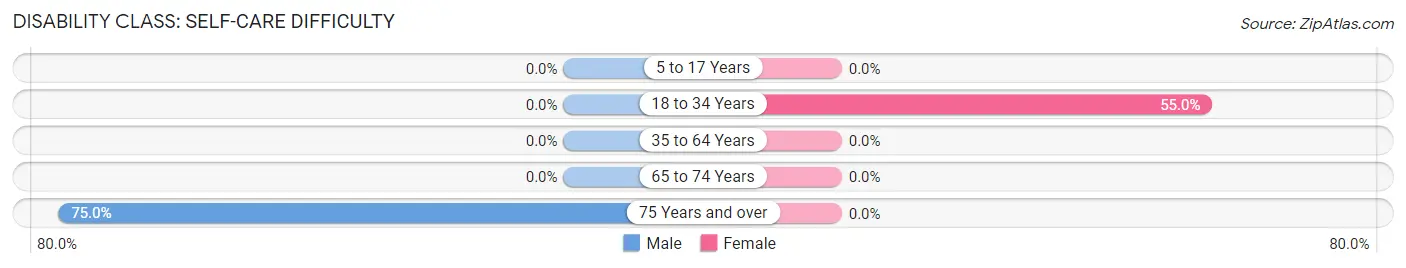
| Age Bracket | Male | Female |
| 5 to 17 Years | 0 (0.0%) | 0 (0.0%) |
| 18 to 34 Years | 0 (0.0%) | 22 (55.0%) |
| 35 to 64 Years | 0 (0.0%) | 0 (0.0%) |
| 65 to 74 Years | 0 (0.0%) | 0 (0.0%) |
| 75 Years and over | 24 (75.0%) | 0 (0.0%) |
Technology Access in West Point
Computing Device Access in West Point
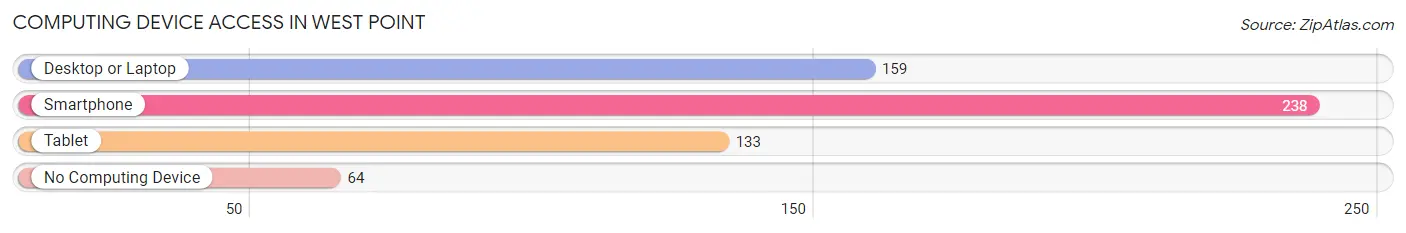
| Device Type | # Households | % Households |
| Desktop or Laptop | 159 | 49.4% |
| Smartphone | 238 | 73.9% |
| Tablet | 133 | 41.3% |
| No Computing Device | 64 | 19.9% |
| Total | 322 | 100.0% |
Internet Access in West Point
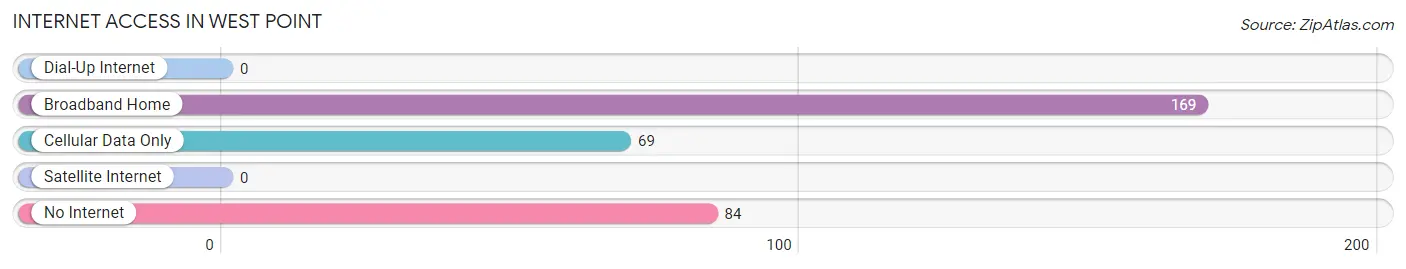
| Internet Type | # Households | % Households |
| Dial-Up Internet | 0 | 0.0% |
| Broadband Home | 169 | 52.5% |
| Cellular Data Only | 69 | 21.4% |
| Satellite Internet | 0 | 0.0% |
| No Internet | 84 | 26.1% |
| Total | 322 | 100.0% |
West Point Summary
West Point is a small unincorporated community located in Calaveras County, California. It is situated in the Sierra Nevada foothills, approximately two miles east of the town of San Andreas. The population of West Point was 1,122 at the 2010 census.
History
West Point was founded in 1848 by a group of miners who were searching for gold in the area. The town was named after the nearby West Point Mine, which was discovered in 1849. The mine was one of the most productive in the area, producing over $2 million in gold during its lifetime.
The town of West Point was officially incorporated in 1854. During the late 19th century, the town was a popular destination for tourists, who came to enjoy the scenery and the nearby hot springs.
In the early 20th century, West Point was a popular destination for hunters and fishermen. The town was also home to a number of resorts, including the West Point Hotel, which was built in 1910.
Geography
West Point is located in the Sierra Nevada foothills, approximately two miles east of the town of San Andreas. The town is situated at an elevation of 1,845 feet above sea level.
The climate in West Point is mild and temperate. The average high temperature in the summer is 85°F, and the average low temperature in the winter is 33°F.
Economy
The economy of West Point is largely based on tourism and agriculture. The town is home to a number of resorts, including the West Point Hotel, which offers a variety of amenities, including a spa, a golf course, and a restaurant.
The town is also home to a number of wineries, including the West Point Winery, which produces a variety of wines, including Cabernet Sauvignon, Chardonnay, and Zinfandel.
The town is also home to a number of farms, which produce a variety of fruits and vegetables, including apples, peaches, and tomatoes.
Demographics
As of the 2010 census, the population of West Point was 1,122. The racial makeup of the town was 94.3% White, 0.7% African American, 0.7% Native American, 0.7% Asian, 0.2% Pacific Islander, 1.2% from other races, and 2.1% from two or more races.
The median household income in West Point was $45,000, and the median family income was $50,000. The per capita income in West Point was $20,000.
Conclusion
West Point is a small unincorporated community located in Calaveras County, California. It is situated in the Sierra Nevada foothills, approximately two miles east of the town of San Andreas. The population of West Point was 1,122 at the 2010 census. The economy of West Point is largely based on tourism and agriculture, and the town is home to a number of resorts, wineries, and farms. The racial makeup of the town was 94.3% White, 0.7% African American, 0.7% Native American, 0.7% Asian, 0.2% Pacific Islander, 1.2% from other races, and 2.1% from two or more races. The median household income in West Point was $45,000, and the median family income was $50,000.
Common Questions
What is Per Capita Income in West Point?
Per Capita income in West Point is $21,112.
What is the Median Family Income in West Point?
Median Family Income in West Point is $46,514.
What is the Median Household income in West Point?
Median Household Income in West Point is $65,139.
What is Inequality or Gini Index in West Point?
Inequality or Gini Index in West Point is 0.36.
What is the Total Population of West Point?
Total Population of West Point is 777.
What is the Total Male Population of West Point?
Total Male Population of West Point is 459.
What is the Total Female Population of West Point?
Total Female Population of West Point is 318.
What is the Ratio of Males per 100 Females in West Point?
There are 144.34 Males per 100 Females in West Point.
What is the Ratio of Females per 100 Males in West Point?
There are 69.28 Females per 100 Males in West Point.
What is the Median Population Age in West Point?
Median Population Age in West Point is 62.1 Years.
What is the Average Family Size in West Point
Average Family Size in West Point is 2.7 People.
What is the Average Household Size in West Point
Average Household Size in West Point is 2.4 People.
How Large is the Labor Force in West Point?
There are 285 People in the Labor Forcein in West Point.
What is the Percentage of People in the Labor Force in West Point?
46.0% of People are in the Labor Force in West Point.