Wasco, CA Map & Demographics
Wasco Map
Wasco Overview
$16,256
PER CAPITA INCOME
$49,675
AVG FAMILY INCOME
$48,109
AVG HOUSEHOLD INCOME
24.8%
WAGE / INCOME GAP [ % ]
75.2¢/ $1
WAGE / INCOME GAP [ $ ]
$7,365
FAMILY INCOME DEFICIT
0.44
INEQUALITY / GINI INDEX
26,317
TOTAL POPULATION
15,615
MALE POPULATION
10,702
FEMALE POPULATION
145.91
MALES / 100 FEMALES
68.54
FEMALES / 100 MALES
30.2
MEDIAN AGE
4.0
AVG FAMILY SIZE
3.6
AVG HOUSEHOLD SIZE
9,515
LABOR FORCE [ PEOPLE ]
48.3%
PERCENT IN LABOR FORCE
8.6%
UNEMPLOYMENT RATE
Wasco Zip Codes
Wasco Area Codes
Income in Wasco
Income Overview in Wasco
Per Capita Income in Wasco is $16,256, while median incomes of families and households are $49,675 and $48,109 respectively.
| Characteristic | Number | Measure |
| Per Capita Income | 26,317 | $16,256 |
| Median Family Income | 5,029 | $49,675 |
| Mean Family Income | 5,029 | $66,409 |
| Median Household Income | 6,080 | $48,109 |
| Mean Household Income | 6,080 | $62,990 |
| Income Deficit | 5,029 | $7,365 |
| Wage / Income Gap (%) | 26,317 | 24.78% |
| Wage / Income Gap ($) | 26,317 | 75.22¢ per $1 |
| Gini / Inequality Index | 26,317 | 0.44 |
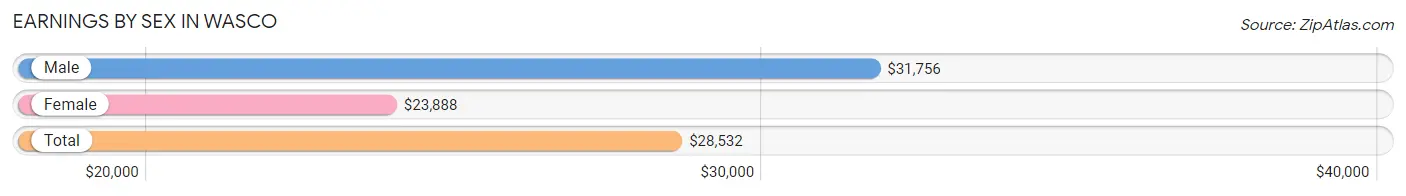
Earnings by Sex in Wasco
Average Earnings in Wasco are $28,532, $31,756 for men and $23,888 for women, a difference of 24.8%.
| Sex | Number | Average Earnings |
| Male | 6,272 (61.1%) | $31,756 |
| Female | 3,997 (38.9%) | $23,888 |
| Total | 10,269 (100.0%) | $28,532 |
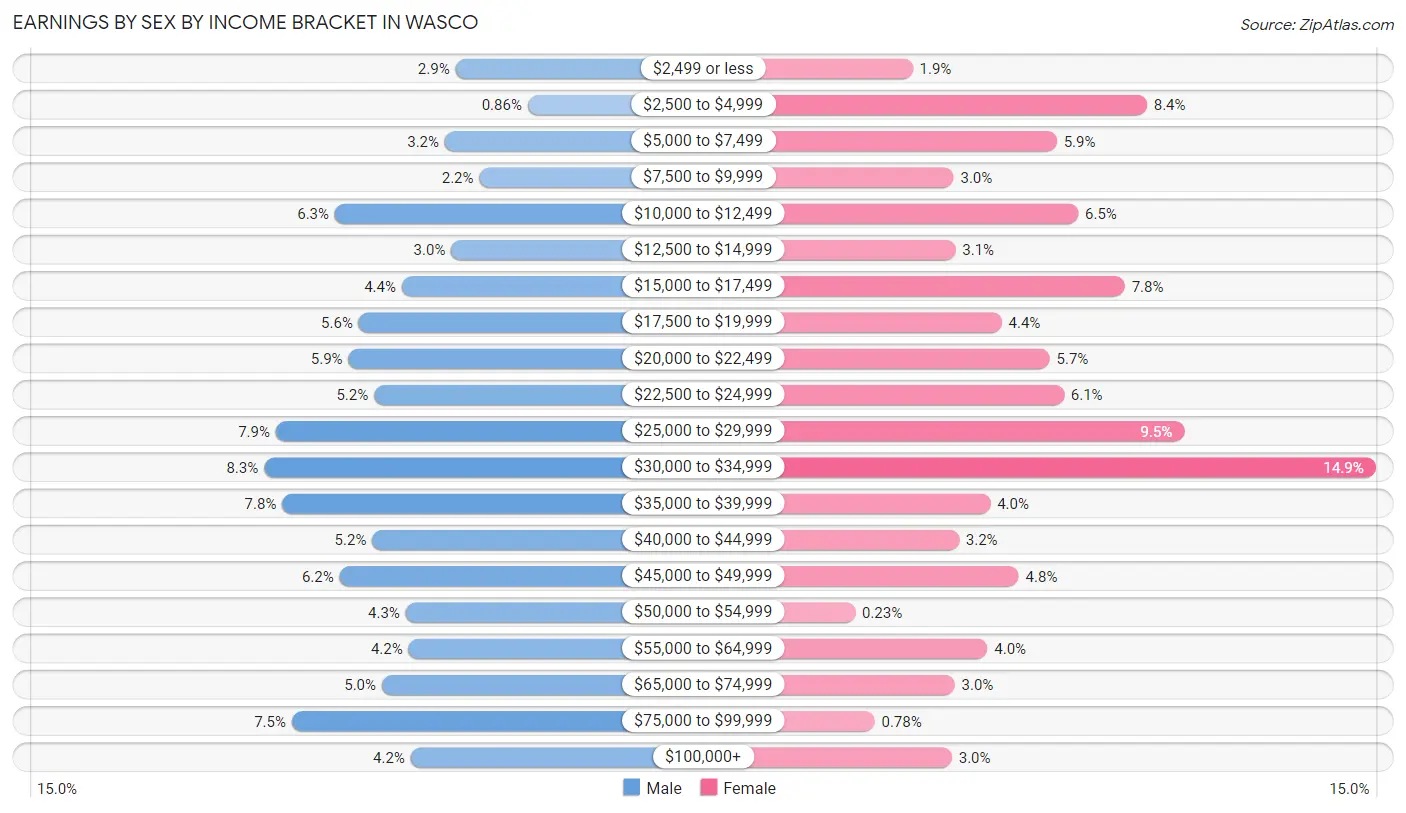
Earnings by Sex by Income Bracket in Wasco
The most common earnings brackets in Wasco are $30,000 to $34,999 for men (519 | 8.3%) and $30,000 to $34,999 for women (594 | 14.9%).
| Income | Male | Female |
| $2,499 or less | 181 (2.9%) | 74 (1.8%) |
| $2,500 to $4,999 | 54 (0.9%) | 337 (8.4%) |
| $5,000 to $7,499 | 200 (3.2%) | 236 (5.9%) |
| $7,500 to $9,999 | 139 (2.2%) | 120 (3.0%) |
| $10,000 to $12,499 | 394 (6.3%) | 260 (6.5%) |
| $12,500 to $14,999 | 189 (3.0%) | 122 (3.0%) |
| $15,000 to $17,499 | 276 (4.4%) | 312 (7.8%) |
| $17,500 to $19,999 | 352 (5.6%) | 174 (4.3%) |
| $20,000 to $22,499 | 370 (5.9%) | 228 (5.7%) |
| $22,500 to $24,999 | 325 (5.2%) | 244 (6.1%) |
| $25,000 to $29,999 | 498 (7.9%) | 379 (9.5%) |
| $30,000 to $34,999 | 519 (8.3%) | 594 (14.9%) |
| $35,000 to $39,999 | 487 (7.8%) | 161 (4.0%) |
| $40,000 to $44,999 | 328 (5.2%) | 126 (3.2%) |
| $45,000 to $49,999 | 386 (6.1%) | 193 (4.8%) |
| $50,000 to $54,999 | 269 (4.3%) | 9 (0.2%) |
| $55,000 to $64,999 | 264 (4.2%) | 158 (4.0%) |
| $65,000 to $74,999 | 311 (5.0%) | 121 (3.0%) |
| $75,000 to $99,999 | 470 (7.5%) | 31 (0.8%) |
| $100,000+ | 260 (4.2%) | 118 (2.9%) |
| Total | 6,272 (100.0%) | 3,997 (100.0%) |
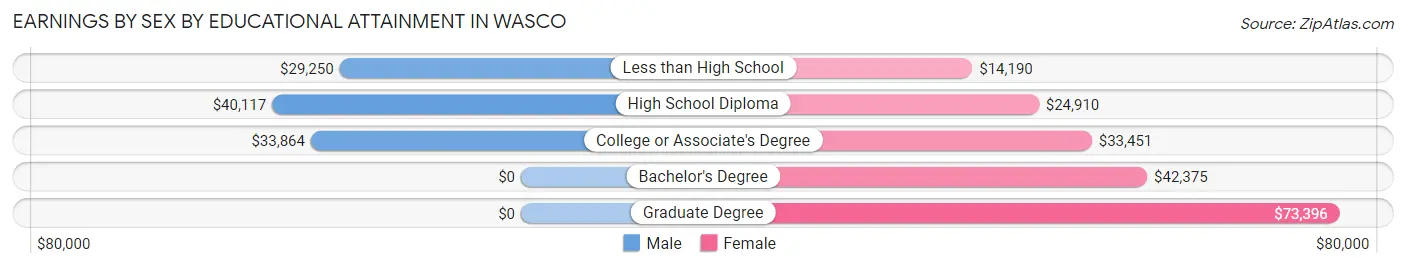
Earnings by Sex by Educational Attainment in Wasco
Average earnings in Wasco are $34,184 for men and $24,587 for women, a difference of 28.1%. Men with an educational attainment of high school diploma enjoy the highest average annual earnings of $40,117, while those with less than high school education earn the least with $29,250. Women with an educational attainment of graduate degree earn the most with the average annual earnings of $73,396, while those with less than high school education have the smallest earnings of $14,190.
| Educational Attainment | Male Income | Female Income |
| Less than High School | $29,250 | $14,190 |
| High School Diploma | $40,117 | $24,910 |
| College or Associate's Degree | $33,864 | $33,451 |
| Bachelor's Degree | - | - |
| Graduate Degree | - | - |
| Total | $34,184 | $24,587 |
Family Income in Wasco
Family Income Brackets in Wasco
According to the Wasco family income data, there are 1,172 families falling into the $35,000 to $49,999 income range, which is the most common income bracket and makes up 23.3% of all families. Conversely, the $150,000 to $199,999 income bracket is the least frequent group with only 146 families (2.9%) belonging to this category.
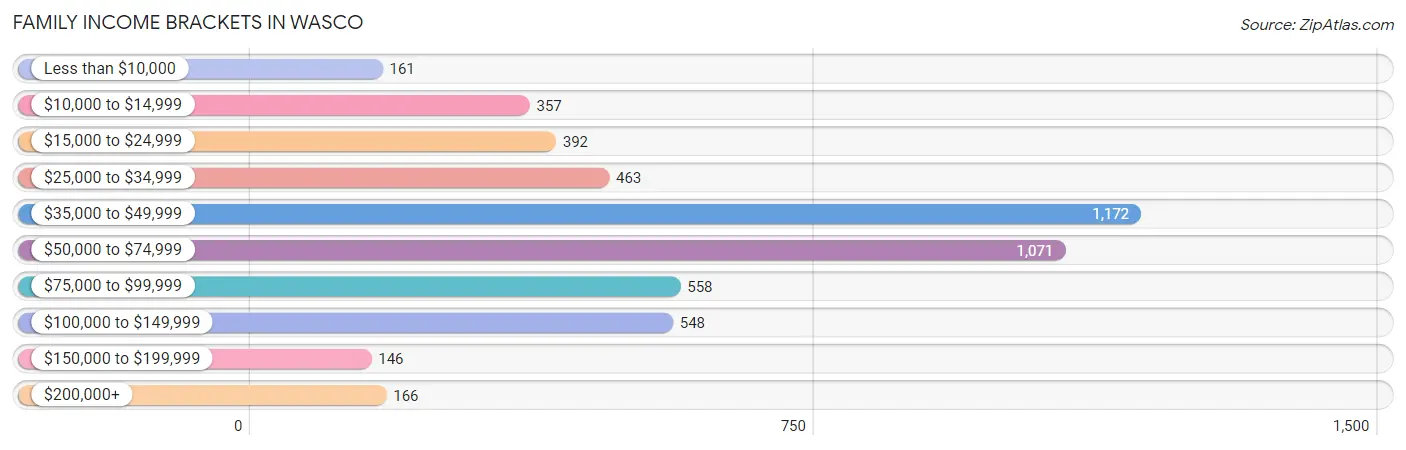
| Income Bracket | # Families | % Families |
| Less than $10,000 | 161 | 3.2% |
| $10,000 to $14,999 | 357 | 7.1% |
| $15,000 to $24,999 | 392 | 7.8% |
| $25,000 to $34,999 | 463 | 9.2% |
| $35,000 to $49,999 | 1,172 | 23.3% |
| $50,000 to $74,999 | 1,071 | 21.3% |
| $75,000 to $99,999 | 558 | 11.1% |
| $100,000 to $149,999 | 548 | 10.9% |
| $150,000 to $199,999 | 146 | 2.9% |
| $200,000+ | 166 | 3.3% |
Family Income by Famaliy Size in Wasco
7+ person families (387 | 7.7%) account for the highest median family income in Wasco with $97,934 per family, while 2-person families (1,534 | 30.5%) have the highest median income of $19,205 per family member.
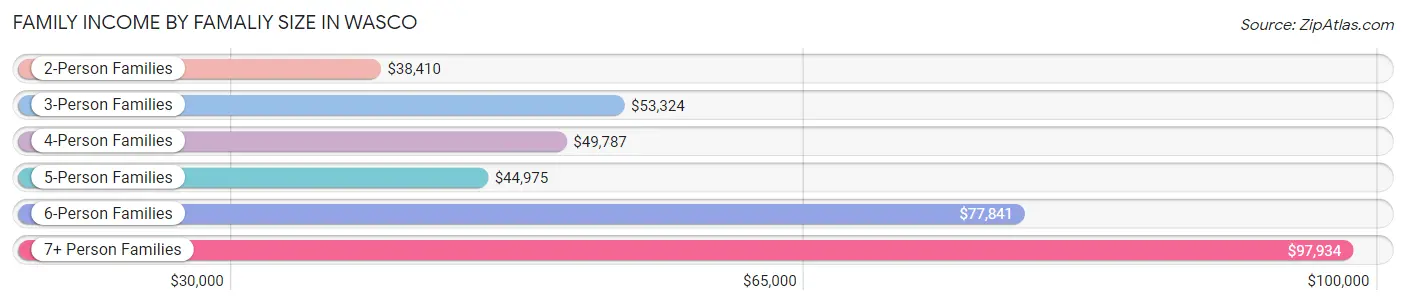
| Income Bracket | # Families | Median Income |
| 2-Person Families | 1,534 (30.5%) | $38,410 |
| 3-Person Families | 1,169 (23.3%) | $53,324 |
| 4-Person Families | 1,065 (21.2%) | $49,787 |
| 5-Person Families | 517 (10.3%) | $44,975 |
| 6-Person Families | 357 (7.1%) | $77,841 |
| 7+ Person Families | 387 (7.7%) | $97,934 |
| Total | 5,029 (100.0%) | $49,675 |
Family Income by Number of Earners in Wasco
The median family income in Wasco is $49,675, with families comprising 3+ earners (907) having the highest median family income of $122,399, while families with no earners (741) have the lowest median family income of $20,089, accounting for 18.0% and 14.7% of families, respectively.
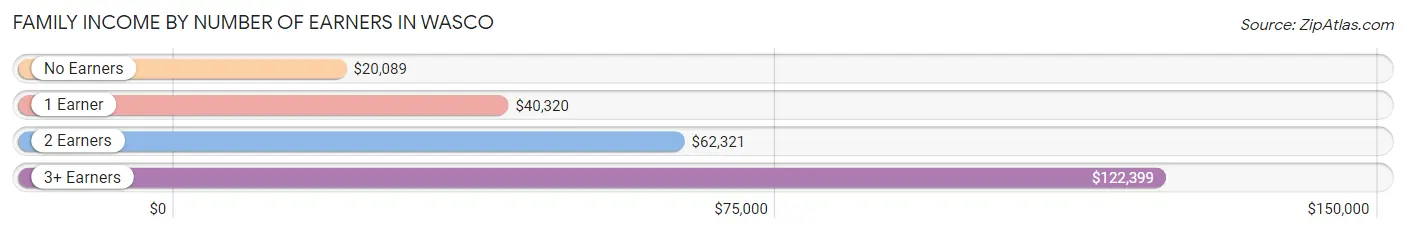
| Number of Earners | # Families | Median Income |
| No Earners | 741 (14.7%) | $20,089 |
| 1 Earner | 2,045 (40.7%) | $40,320 |
| 2 Earners | 1,336 (26.6%) | $62,321 |
| 3+ Earners | 907 (18.0%) | $122,399 |
| Total | 5,029 (100.0%) | $49,675 |
Household Income in Wasco
Household Income Brackets in Wasco
With 1,113 households falling in the category, the $35,000 to $49,999 income range is the most frequent in Wasco, accounting for 18.3% of all households. In contrast, only 176 households (2.9%) fall into the $200,000+ income bracket, making it the least populous group.
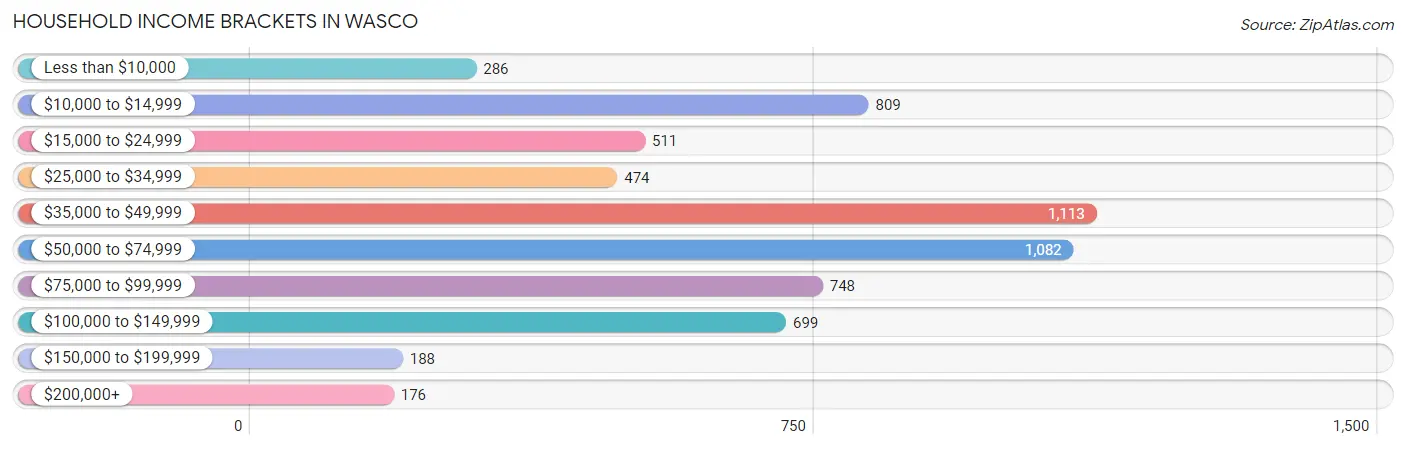
| Income Bracket | # Households | % Households |
| Less than $10,000 | 286 | 4.7% |
| $10,000 to $14,999 | 809 | 13.3% |
| $15,000 to $24,999 | 511 | 8.4% |
| $25,000 to $34,999 | 474 | 7.8% |
| $35,000 to $49,999 | 1,113 | 18.3% |
| $50,000 to $74,999 | 1,082 | 17.8% |
| $75,000 to $99,999 | 748 | 12.3% |
| $100,000 to $149,999 | 699 | 11.5% |
| $150,000 to $199,999 | 188 | 3.1% |
| $200,000+ | 176 | 2.9% |
Household Income by Householder Age in Wasco
The median household income in Wasco is $48,109, with the highest median household income of $63,037 found in the 45 to 64 years age bracket for the primary householder. A total of 2,096 households (34.5%) fall into this category. Meanwhile, the 65+ years age bracket for the primary householder has the lowest median household income of $20,482, with 1,067 households (17.5%) in this group.
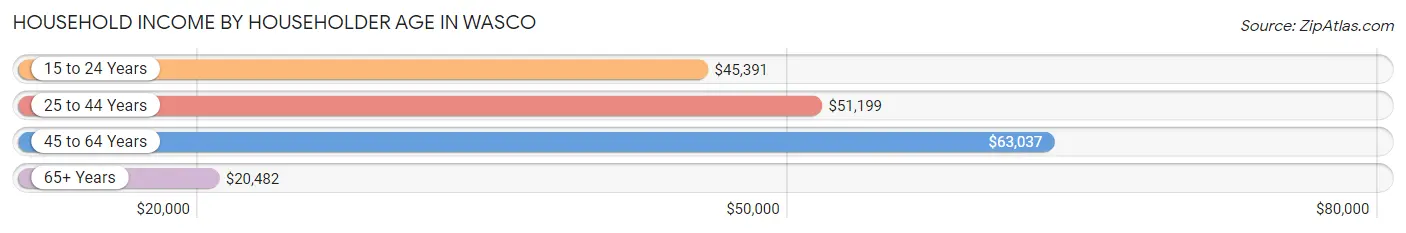
| Income Bracket | # Households | Median Income |
| 15 to 24 Years | 211 (3.5%) | $45,391 |
| 25 to 44 Years | 2,706 (44.5%) | $51,199 |
| 45 to 64 Years | 2,096 (34.5%) | $63,037 |
| 65+ Years | 1,067 (17.5%) | $20,482 |
| Total | 6,080 (100.0%) | $48,109 |
Poverty in Wasco
Income Below Poverty by Sex and Age in Wasco
With 18.7% poverty level for males and 22.5% for females among the residents of Wasco, 5 year old males and 16 and 17 year old females are the most vulnerable to poverty, with 54 males (73.0%) and 102 females (40.5%) in their respective age groups living below the poverty level.

| Age Bracket | Male | Female |
| Under 5 Years | 238 (30.8%) | 140 (12.2%) |
| 5 Years | 54 (73.0%) | 88 (26.8%) |
| 6 to 11 Years | 390 (27.6%) | 338 (26.8%) |
| 12 to 14 Years | 220 (27.9%) | 183 (38.4%) |
| 15 Years | 0 (0.0%) | 24 (32.0%) |
| 16 and 17 Years | 26 (11.9%) | 102 (40.5%) |
| 18 to 24 Years | 106 (10.9%) | 162 (13.2%) |
| 25 to 34 Years | 402 (16.1%) | 548 (28.4%) |
| 35 to 44 Years | 143 (10.2%) | 293 (22.9%) |
| 45 to 54 Years | 103 (10.0%) | 49 (5.0%) |
| 55 to 64 Years | 299 (29.2%) | 256 (28.7%) |
| 65 to 74 Years | 111 (20.7%) | 148 (22.7%) |
| 75 Years and over | 19 (6.0%) | 65 (39.9%) |
| Total | 2,111 (18.7%) | 2,396 (22.5%) |
Income Above Poverty by Sex and Age in Wasco
According to the poverty statistics in Wasco, males aged 15 years and females aged 45 to 54 years are the age groups that are most secure financially, with 100.0% of males and 95.0% of females in these age groups living above the poverty line.
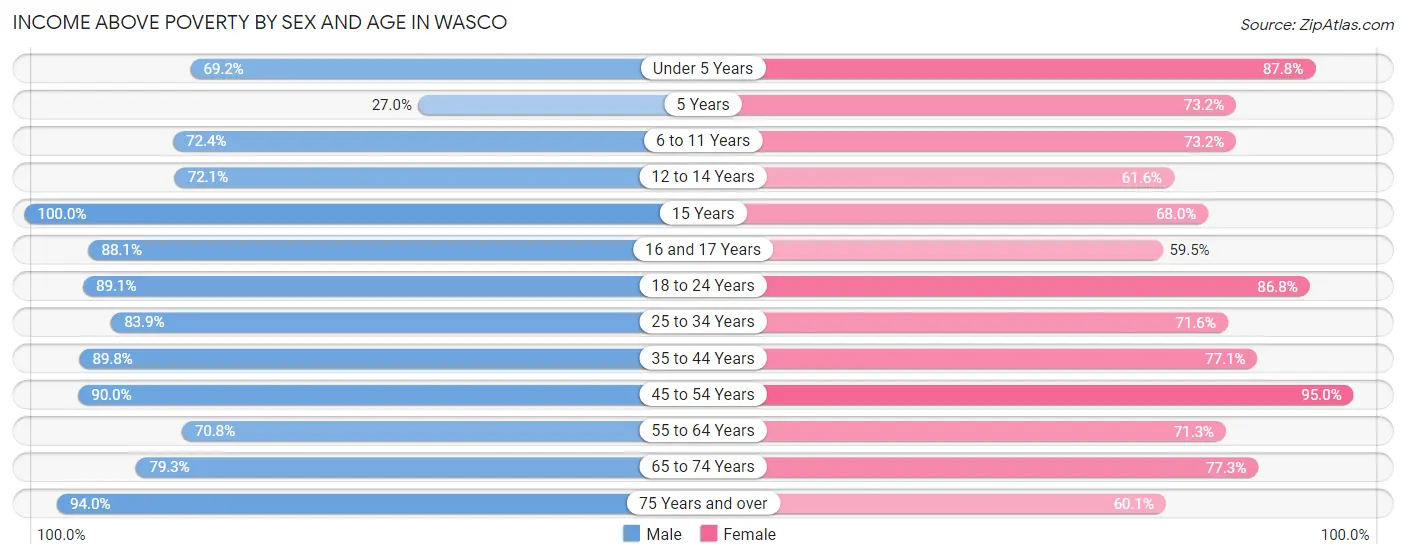
| Age Bracket | Male | Female |
| Under 5 Years | 535 (69.2%) | 1,009 (87.8%) |
| 5 Years | 20 (27.0%) | 240 (73.2%) |
| 6 to 11 Years | 1,024 (72.4%) | 923 (73.2%) |
| 12 to 14 Years | 569 (72.1%) | 294 (61.6%) |
| 15 Years | 244 (100.0%) | 51 (68.0%) |
| 16 and 17 Years | 193 (88.1%) | 150 (59.5%) |
| 18 to 24 Years | 869 (89.1%) | 1,066 (86.8%) |
| 25 to 34 Years | 2,096 (83.9%) | 1,382 (71.6%) |
| 35 to 44 Years | 1,260 (89.8%) | 988 (77.1%) |
| 45 to 54 Years | 929 (90.0%) | 928 (95.0%) |
| 55 to 64 Years | 725 (70.8%) | 636 (71.3%) |
| 65 to 74 Years | 424 (79.2%) | 503 (77.3%) |
| 75 Years and over | 295 (94.0%) | 98 (60.1%) |
| Total | 9,183 (81.3%) | 8,268 (77.5%) |
Income Below Poverty Among Married-Couple Families in Wasco
The poverty statistics for married-couple families in Wasco show that 17.3% or 564 of the total 3,264 families live below the poverty line. Families with no children have the highest poverty rate of 25.0%, comprising of 353 families. On the other hand, families with 1 or 2 children have the lowest poverty rate of 9.1%, which includes 118 families.
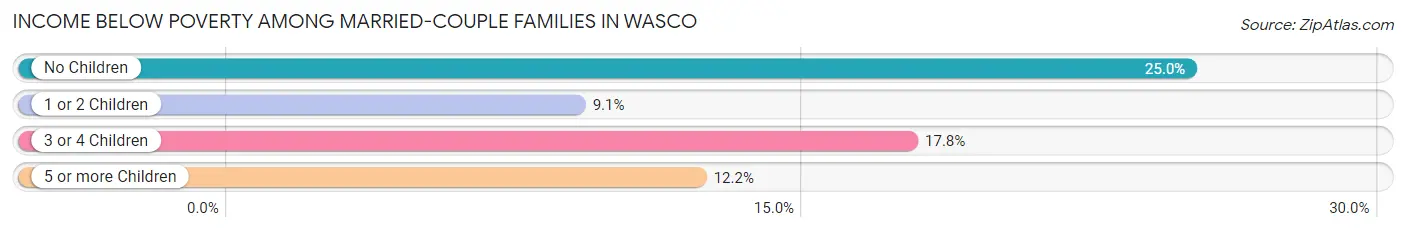
| Children | Above Poverty | Below Poverty |
| No Children | 1,057 (75.0%) | 353 (25.0%) |
| 1 or 2 Children | 1,182 (90.9%) | 118 (9.1%) |
| 3 or 4 Children | 375 (82.2%) | 81 (17.8%) |
| 5 or more Children | 86 (87.8%) | 12 (12.2%) |
| Total | 2,700 (82.7%) | 564 (17.3%) |
Income Below Poverty Among Single-Parent Households in Wasco
According to the poverty data in Wasco, 20.4% or 151 single-father households and 32.7% or 335 single-mother households are living below the poverty line. Among single-father households, those with 5 or more children have the highest poverty rate, with 104 households (100.0%) experiencing poverty. Likewise, among single-mother households, those with 3 or 4 children have the highest poverty rate, with 90 households (49.7%) falling below the poverty line.
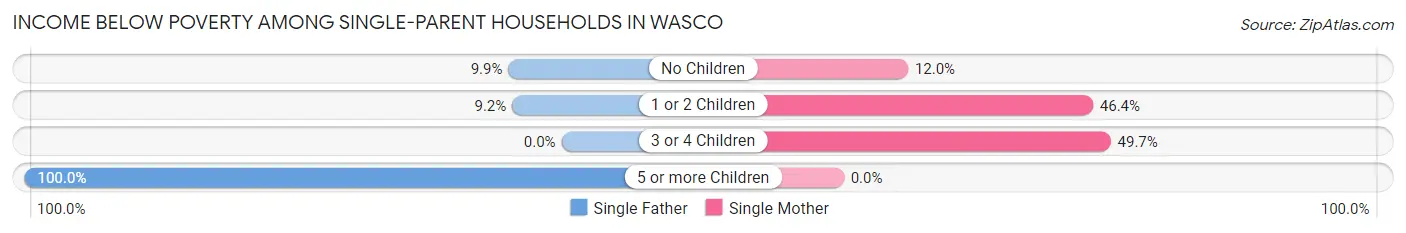
| Children | Single Father | Single Mother |
| No Children | 22 (9.9%) | 51 (12.0%) |
| 1 or 2 Children | 25 (9.2%) | 194 (46.4%) |
| 3 or 4 Children | 0 (0.0%) | 90 (49.7%) |
| 5 or more Children | 104 (100.0%) | 0 (0.0%) |
| Total | 151 (20.4%) | 335 (32.7%) |
Income Below Poverty Among Married-Couple vs Single-Parent Households in Wasco
The poverty data for Wasco shows that 564 of the married-couple family households (17.3%) and 486 of the single-parent households (27.5%) are living below the poverty level. Within the married-couple family households, those with no children have the highest poverty rate, with 353 households (25.0%) falling below the poverty line. Among the single-parent households, those with 5 or more children have the highest poverty rate, with 104 household (100.0%) living below poverty.
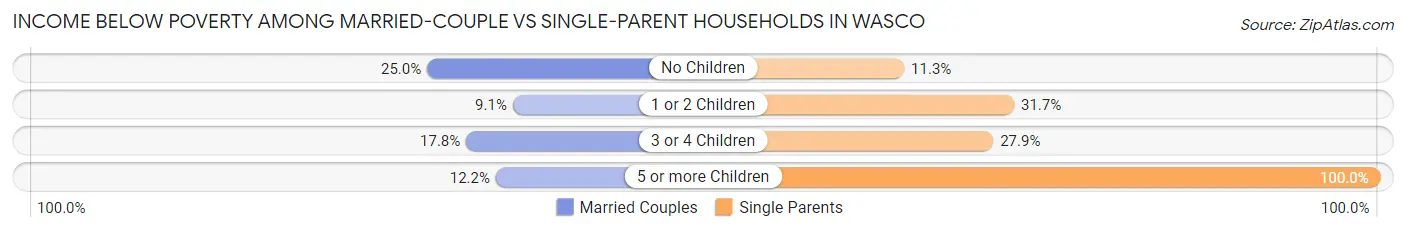
| Children | Married-Couple Families | Single-Parent Households |
| No Children | 353 (25.0%) | 73 (11.3%) |
| 1 or 2 Children | 118 (9.1%) | 219 (31.7%) |
| 3 or 4 Children | 81 (17.8%) | 90 (27.9%) |
| 5 or more Children | 12 (12.2%) | 104 (100.0%) |
| Total | 564 (17.3%) | 486 (27.5%) |
Race in Wasco
The most populous races in Wasco are Hispanic or Latino (22,839 | 86.8%), White / Caucasian (10,549 | 40.1%), and Two or more Races (9,496 | 36.1%).
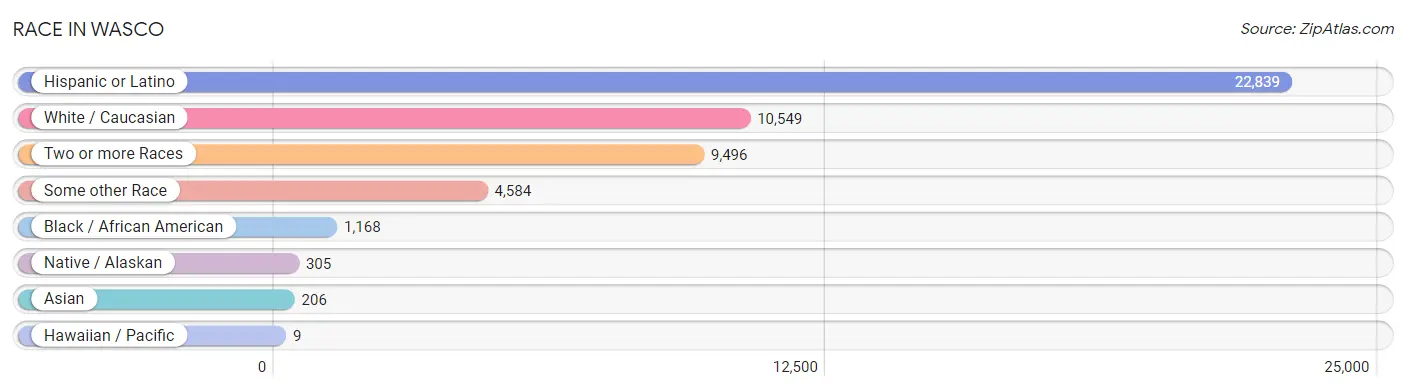
| Race | # Population | % Population |
| Asian | 206 | 0.8% |
| Black / African American | 1,168 | 4.4% |
| Hawaiian / Pacific | 9 | 0.0% |
| Hispanic or Latino | 22,839 | 86.8% |
| Native / Alaskan | 305 | 1.2% |
| White / Caucasian | 10,549 | 40.1% |
| Two or more Races | 9,496 | 36.1% |
| Some other Race | 4,584 | 17.4% |
| Total | 26,317 | 100.0% |
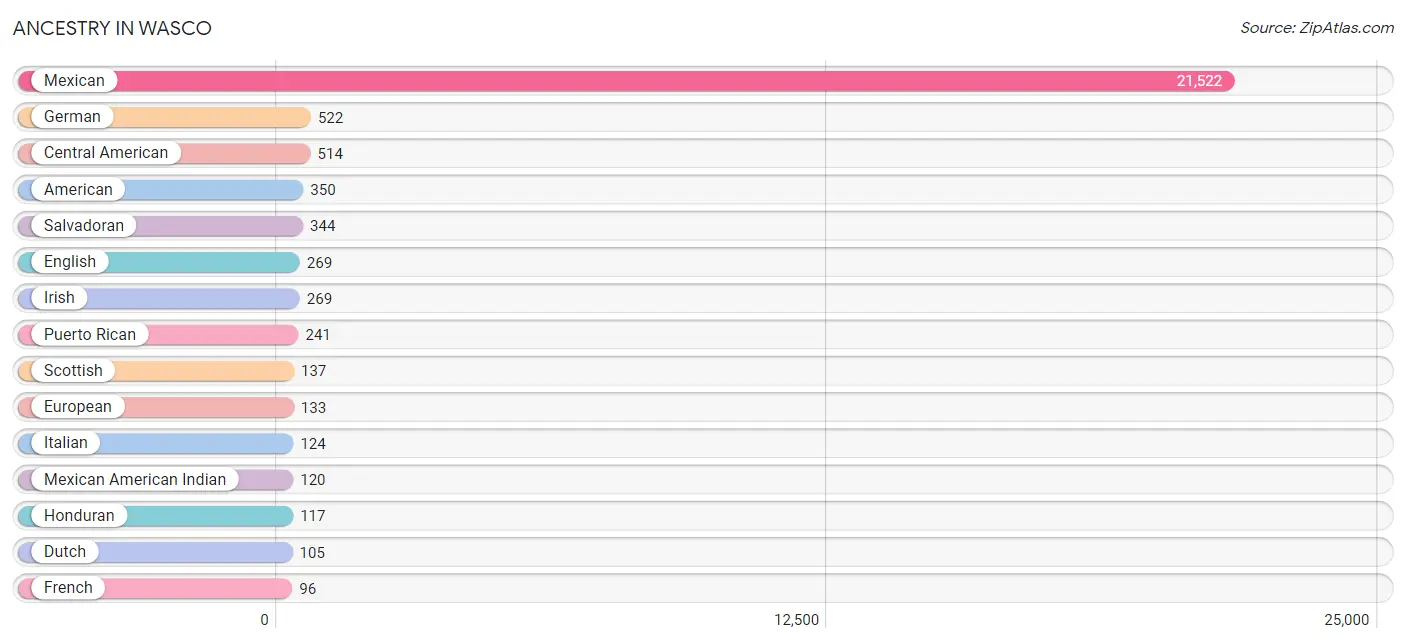
Ancestry in Wasco
The most populous ancestries reported in Wasco are Mexican (21,522 | 81.8%), German (522 | 2.0%), Central American (514 | 1.9%), American (350 | 1.3%), and Salvadoran (344 | 1.3%), together accounting for 88.3% of all Wasco residents.
| Ancestry | # Population | % Population |
| African | 25 | 0.1% |
| American | 350 | 1.3% |
| Apache | 5 | 0.0% |
| Arab | 66 | 0.3% |
| Armenian | 11 | 0.0% |
| Austrian | 6 | 0.0% |
| Belizean | 9 | 0.0% |
| Bhutanese | 14 | 0.1% |
| Blackfeet | 10 | 0.0% |
| Bolivian | 1 | 0.0% |
| British | 1 | 0.0% |
| Burmese | 29 | 0.1% |
| Canadian | 15 | 0.1% |
| Central American | 514 | 1.9% |
| Central American Indian | 86 | 0.3% |
| Cherokee | 82 | 0.3% |
| Cheyenne | 20 | 0.1% |
| Chilean | 5 | 0.0% |
| Chippewa | 3 | 0.0% |
| Choctaw | 5 | 0.0% |
| Comanche | 6 | 0.0% |
| Crow | 7 | 0.0% |
| Cuban | 13 | 0.1% |
| Czechoslovakian | 5 | 0.0% |
| Danish | 7 | 0.0% |
| Dominican | 6 | 0.0% |
| Dutch | 105 | 0.4% |
| Dutch West Indian | 14 | 0.1% |
| Egyptian | 5 | 0.0% |
| English | 269 | 1.0% |
| Ethiopian | 6 | 0.0% |
| European | 133 | 0.5% |
| Filipino | 20 | 0.1% |
| Finnish | 8 | 0.0% |
| French | 96 | 0.4% |
| German | 522 | 2.0% |
| Guatemalan | 49 | 0.2% |
| Haitian | 23 | 0.1% |
| Honduran | 117 | 0.4% |
| Hungarian | 6 | 0.0% |
| Indian (Asian) | 57 | 0.2% |
| Irish | 269 | 1.0% |
| Italian | 124 | 0.5% |
| Jamaican | 6 | 0.0% |
| Japanese | 3 | 0.0% |
| Korean | 76 | 0.3% |
| Latvian | 9 | 0.0% |
| Malaysian | 6 | 0.0% |
| Mexican | 21,522 | 81.8% |
| Mexican American Indian | 120 | 0.5% |
| Native Hawaiian | 17 | 0.1% |
| Navajo | 6 | 0.0% |
| Norwegian | 29 | 0.1% |
| Paiute | 3 | 0.0% |
| Paraguayan | 17 | 0.1% |
| Peruvian | 25 | 0.1% |
| Polish | 38 | 0.1% |
| Portuguese | 10 | 0.0% |
| Puerto Rican | 241 | 0.9% |
| Puget Sound Salish | 8 | 0.0% |
| Romanian | 7 | 0.0% |
| Russian | 23 | 0.1% |
| Salvadoran | 344 | 1.3% |
| Samoan | 3 | 0.0% |
| Scandinavian | 13 | 0.1% |
| Scotch-Irish | 70 | 0.3% |
| Scottish | 137 | 0.5% |
| Shoshone | 5 | 0.0% |
| South American | 48 | 0.2% |
| Spaniard | 43 | 0.2% |
| Spanish | 4 | 0.0% |
| Sri Lankan | 57 | 0.2% |
| Subsaharan African | 31 | 0.1% |
| Swedish | 36 | 0.1% |
| Swiss | 4 | 0.0% |
| Welsh | 10 | 0.0% |
| Yaqui | 10 | 0.0% | View All 77 Rows |
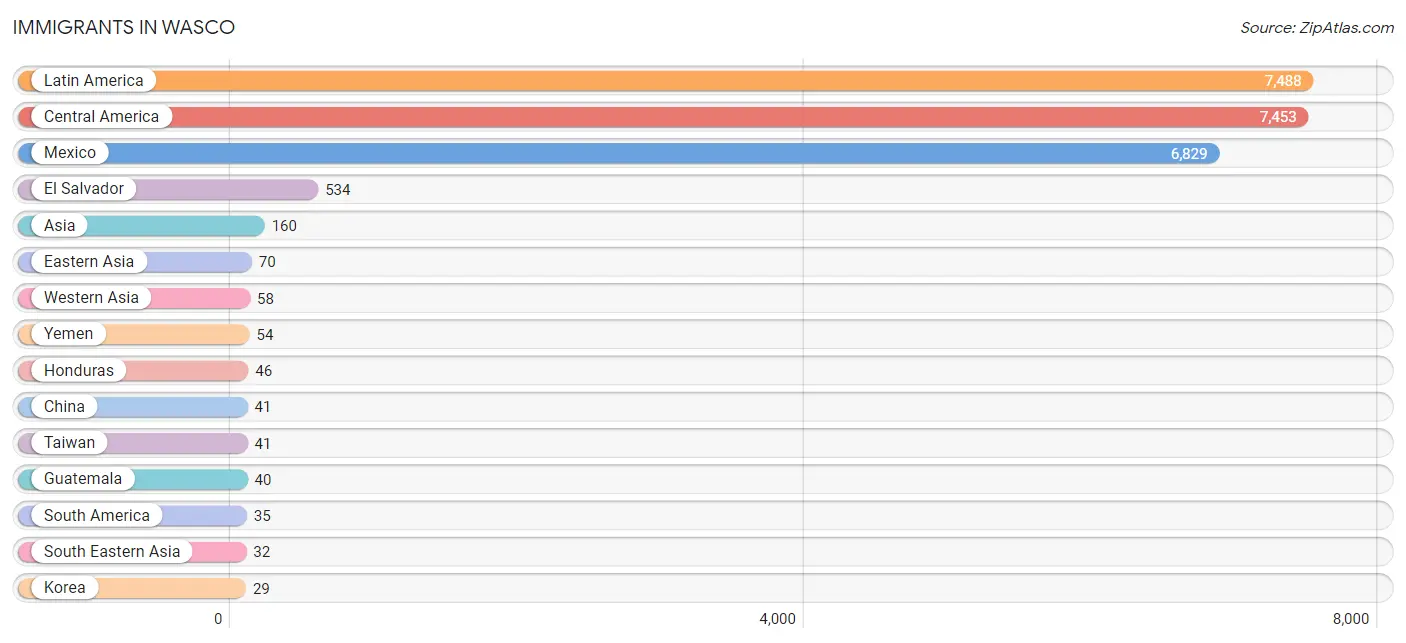
Immigrants in Wasco
The most numerous immigrant groups reported in Wasco came from Latin America (7,488 | 28.4%), Central America (7,453 | 28.3%), Mexico (6,829 | 26.0%), El Salvador (534 | 2.0%), and Asia (160 | 0.6%), together accounting for 85.4% of all Wasco residents.
| Immigration Origin | # Population | % Population |
| Africa | 4 | 0.0% |
| Armenia | 4 | 0.0% |
| Asia | 160 | 0.6% |
| Cambodia | 3 | 0.0% |
| Central America | 7,453 | 28.3% |
| China | 41 | 0.2% |
| Eastern Africa | 4 | 0.0% |
| Eastern Asia | 70 | 0.3% |
| Eastern Europe | 4 | 0.0% |
| El Salvador | 534 | 2.0% |
| Europe | 6 | 0.0% |
| Guatemala | 40 | 0.2% |
| Honduras | 46 | 0.2% |
| Korea | 29 | 0.1% |
| Latin America | 7,488 | 28.4% |
| Mexico | 6,829 | 26.0% |
| Oceania | 1 | 0.0% |
| Peru | 18 | 0.1% |
| Portugal | 2 | 0.0% |
| Russia | 4 | 0.0% |
| South America | 35 | 0.1% |
| South Eastern Asia | 32 | 0.1% |
| Southern Europe | 2 | 0.0% |
| Taiwan | 41 | 0.2% |
| Thailand | 6 | 0.0% |
| Vietnam | 23 | 0.1% |
| Western Asia | 58 | 0.2% |
| Yemen | 54 | 0.2% |
| Zimbabwe | 4 | 0.0% | View All 29 Rows |
Sex and Age in Wasco
Sex and Age in Wasco
The most populous age groups in Wasco are 30 to 34 Years (2,130 | 13.6%) for men and 5 to 9 Years (1,234 | 11.5%) for women.
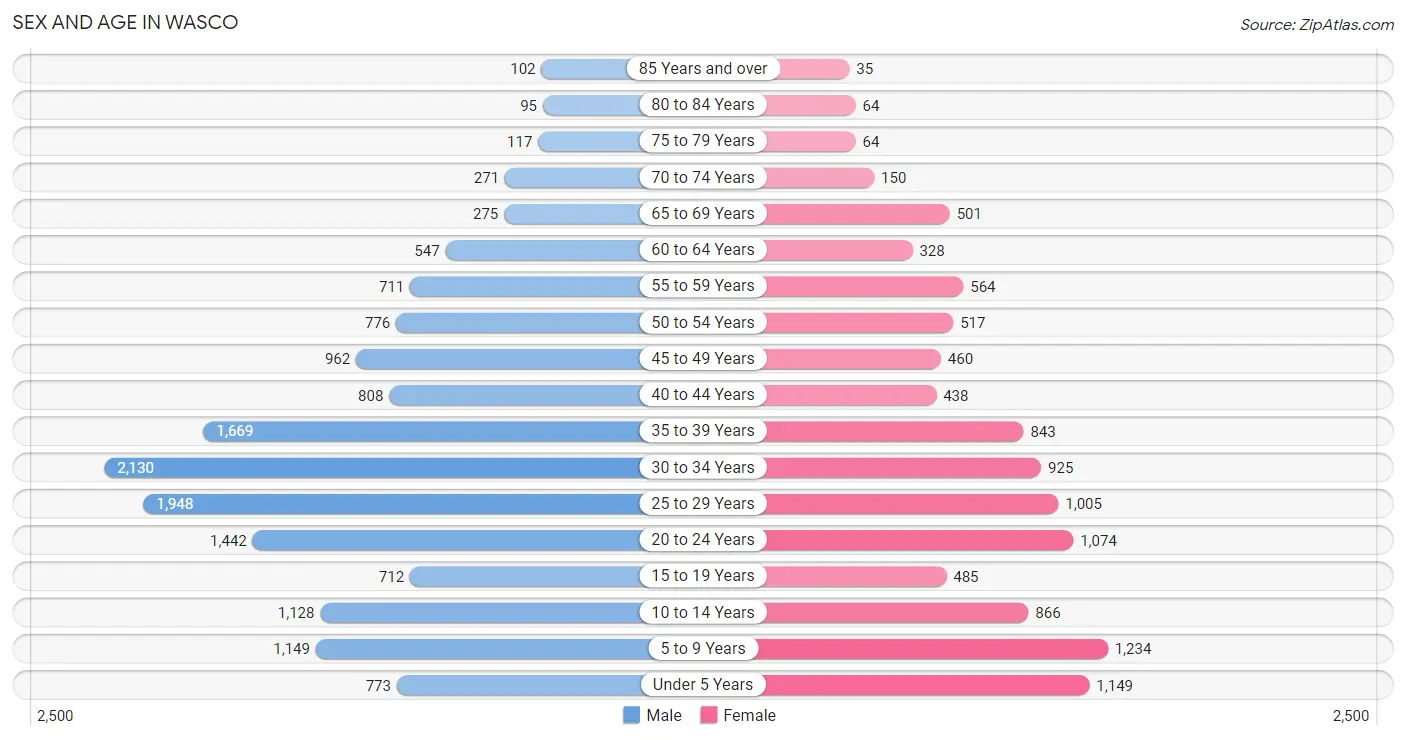
| Age Bracket | Male | Female |
| Under 5 Years | 773 (5.0%) | 1,149 (10.7%) |
| 5 to 9 Years | 1,149 (7.4%) | 1,234 (11.5%) |
| 10 to 14 Years | 1,128 (7.2%) | 866 (8.1%) |
| 15 to 19 Years | 712 (4.6%) | 485 (4.5%) |
| 20 to 24 Years | 1,442 (9.2%) | 1,074 (10.0%) |
| 25 to 29 Years | 1,948 (12.5%) | 1,005 (9.4%) |
| 30 to 34 Years | 2,130 (13.6%) | 925 (8.6%) |
| 35 to 39 Years | 1,669 (10.7%) | 843 (7.9%) |
| 40 to 44 Years | 808 (5.2%) | 438 (4.1%) |
| 45 to 49 Years | 962 (6.2%) | 460 (4.3%) |
| 50 to 54 Years | 776 (5.0%) | 517 (4.8%) |
| 55 to 59 Years | 711 (4.5%) | 564 (5.3%) |
| 60 to 64 Years | 547 (3.5%) | 328 (3.1%) |
| 65 to 69 Years | 275 (1.8%) | 501 (4.7%) |
| 70 to 74 Years | 271 (1.7%) | 150 (1.4%) |
| 75 to 79 Years | 117 (0.7%) | 64 (0.6%) |
| 80 to 84 Years | 95 (0.6%) | 64 (0.6%) |
| 85 Years and over | 102 (0.6%) | 35 (0.3%) |
| Total | 15,615 (100.0%) | 10,702 (100.0%) |
Families and Households in Wasco
Median Family Size in Wasco
The median family size in Wasco is 4.00 persons per family, with married-couple families (3,264 | 64.9%) accounting for the largest median family size of 4.08 persons per family. On the other hand, single male/father families (740 | 14.7%) represent the smallest median family size with 3.64 persons per family.
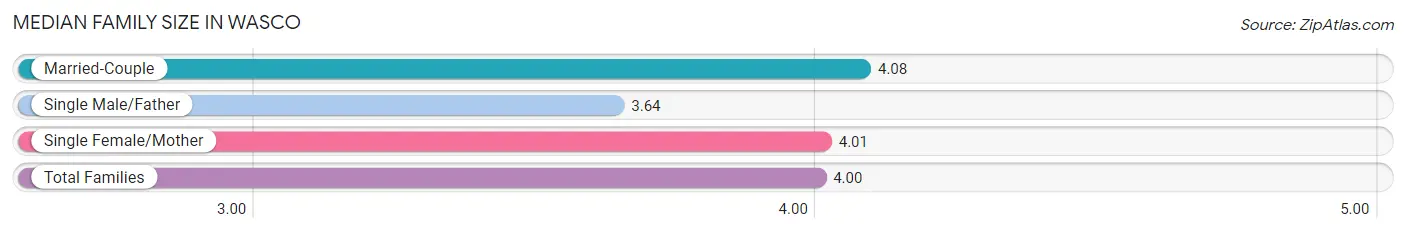
| Family Type | # Families | Family Size |
| Married-Couple | 3,264 (64.9%) | 4.08 |
| Single Male/Father | 740 (14.7%) | 3.64 |
| Single Female/Mother | 1,025 (20.4%) | 4.01 |
| Total Families | 5,029 (100.0%) | 4.00 |
Median Household Size in Wasco
The median household size in Wasco is 3.61 persons per household, with single female/mother households (1,025 | 16.9%) accounting for the largest median household size of 4.26 persons per household. non-family households (1,051 | 17.3%) represent the smallest median household size with 1.04 persons per household.
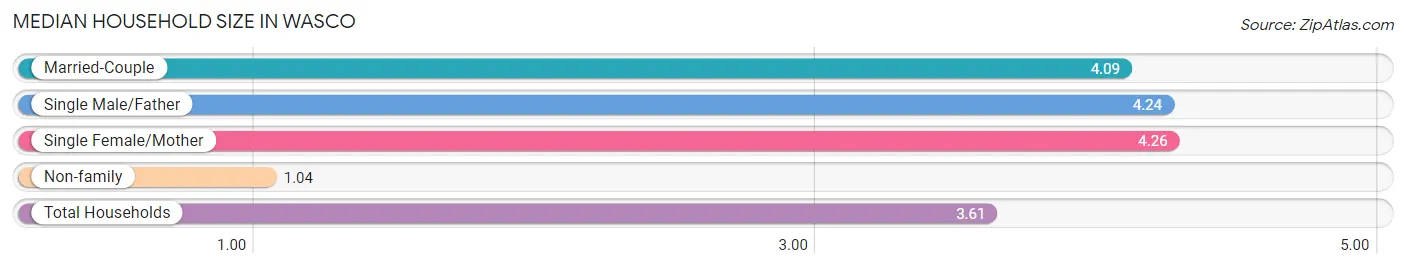
| Household Type | # Households | Household Size |
| Married-Couple | 3,264 (53.7%) | 4.09 |
| Single Male/Father | 740 (12.2%) | 4.24 |
| Single Female/Mother | 1,025 (16.9%) | 4.26 |
| Non-family | 1,051 (17.3%) | 1.04 |
| Total Households | 6,080 (100.0%) | 3.61 |
Household Size by Marriage Status in Wasco
Out of a total of 6,080 households in Wasco, 5,029 (82.7%) are family households, while 1,051 (17.3%) are nonfamily households. The most numerous type of family households are 2-person households, comprising 1,310, and the most common type of nonfamily households are 1-person households, comprising 1,011.
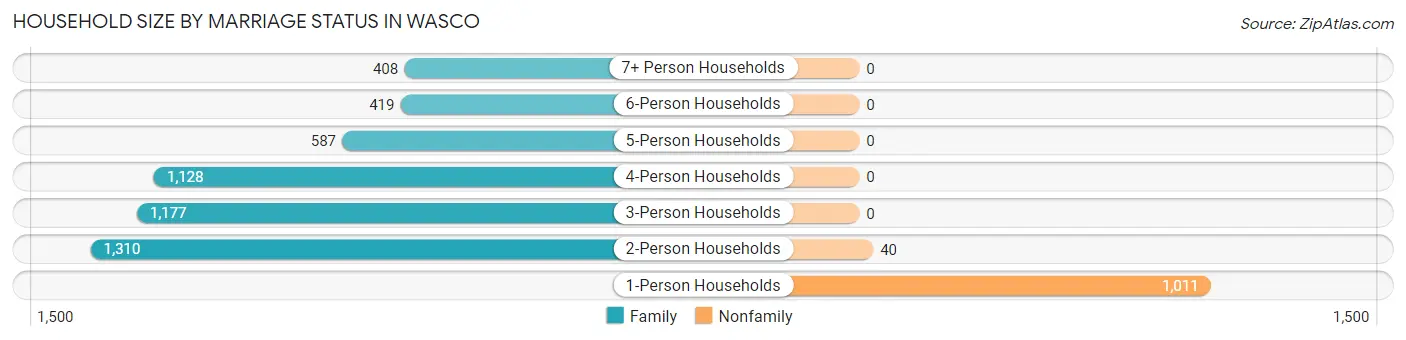
| Household Size | Family Households | Nonfamily Households |
| 1-Person Households | - | 1,011 (16.6%) |
| 2-Person Households | 1,310 (21.5%) | 40 (0.7%) |
| 3-Person Households | 1,177 (19.4%) | 0 (0.0%) |
| 4-Person Households | 1,128 (18.5%) | 0 (0.0%) |
| 5-Person Households | 587 (9.7%) | 0 (0.0%) |
| 6-Person Households | 419 (6.9%) | 0 (0.0%) |
| 7+ Person Households | 408 (6.7%) | 0 (0.0%) |
| Total | 5,029 (82.7%) | 1,051 (17.3%) |
Female Fertility in Wasco
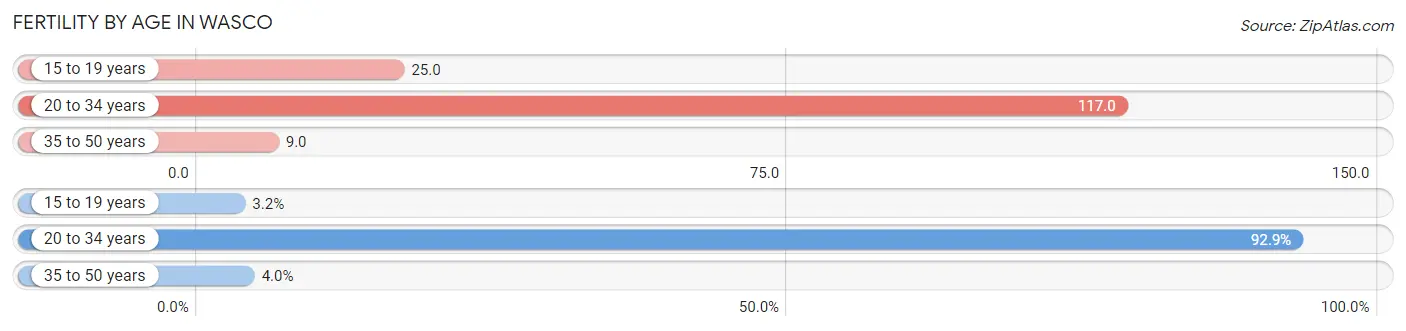
Fertility by Age in Wasco
Average fertility rate in Wasco is 72.0 births per 1,000 women. Women in the age bracket of 20 to 34 years have the highest fertility rate with 117.0 births per 1,000 women. Women in the age bracket of 20 to 34 years acount for 92.9% of all women with births.
| Age Bracket | Women with Births | Births / 1,000 Women |
| 15 to 19 years | 12 (3.2%) | 25.0 |
| 20 to 34 years | 352 (92.9%) | 117.0 |
| 35 to 50 years | 15 (4.0%) | 9.0 |
| Total | 379 (100.0%) | 72.0 |
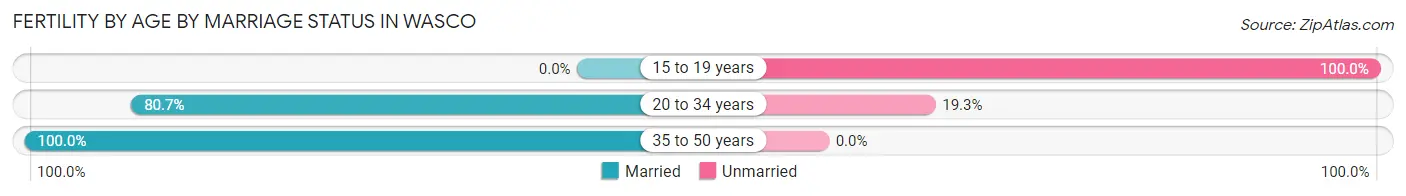
Fertility by Age by Marriage Status in Wasco
78.9% of women with births (379) in Wasco are married. The highest percentage of unmarried women with births falls into 15 to 19 years age bracket with 100.0% of them unmarried at the time of birth, while the lowest percentage of unmarried women with births belong to 35 to 50 years age bracket with 0.0% of them unmarried.
| Age Bracket | Married | Unmarried |
| 15 to 19 years | 0 (0.0%) | 12 (100.0%) |
| 20 to 34 years | 284 (80.7%) | 68 (19.3%) |
| 35 to 50 years | 15 (100.0%) | 0 (0.0%) |
| Total | 299 (78.9%) | 80 (21.1%) |
Fertility by Education in Wasco
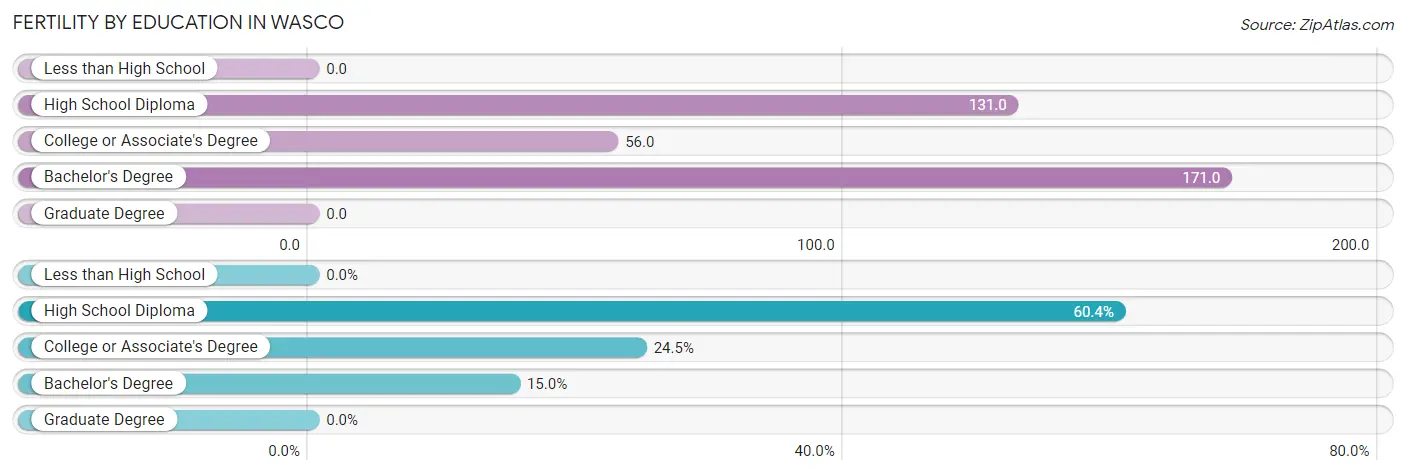
| Educational Attainment | Women with Births | Births / 1,000 Women |
| Less than High School | 0 (0.0%) | 0.0 |
| High School Diploma | 229 (60.4%) | 131.0 |
| College or Associate's Degree | 93 (24.5%) | 56.0 |
| Bachelor's Degree | 57 (15.0%) | 171.0 |
| Graduate Degree | 0 (0.0%) | 0.0 |
| Total | 379 (100.0%) | 72.0 |
Fertility by Education by Marriage Status in Wasco
21.1% of women with births in Wasco are unmarried. Women with the educational attainment of bachelor's degree are most likely to be married with 100.0% of them married at childbirth, while women with the educational attainment of high school diploma are least likely to be married with 31.9% of them unmarried at childbirth.
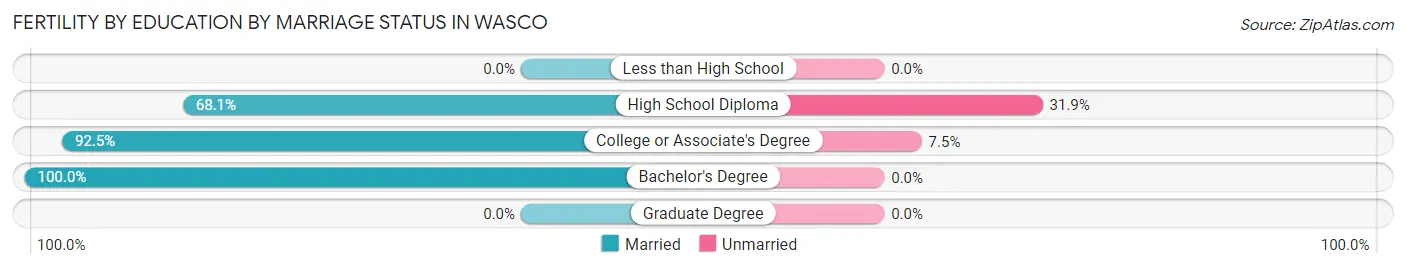
| Educational Attainment | Married | Unmarried |
| Less than High School | 0 (0.0%) | 0 (0.0%) |
| High School Diploma | 156 (68.1%) | 73 (31.9%) |
| College or Associate's Degree | 86 (92.5%) | 7 (7.5%) |
| Bachelor's Degree | 57 (100.0%) | 0 (0.0%) |
| Graduate Degree | 0 (0.0%) | 0 (0.0%) |
| Total | 299 (78.9%) | 80 (21.1%) |
Employment Characteristics in Wasco
Employment by Class of Employer in Wasco
Among the 8,534 employed individuals in Wasco, private company employees (7,068 | 82.8%), local government employees (429 | 5.0%), and not-for-profit organizations (423 | 5.0%) make up the most common classes of employment.
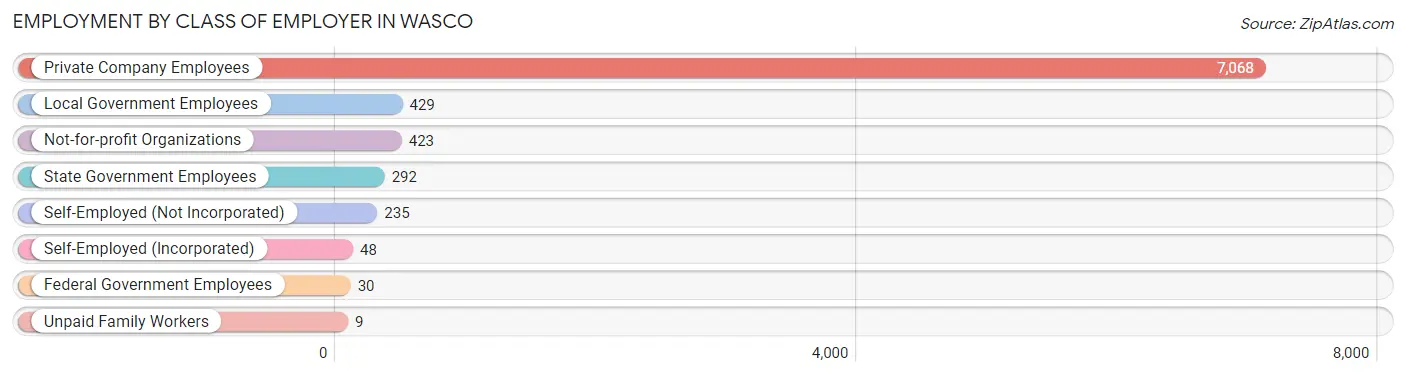
| Employer Class | # Employees | % Employees |
| Private Company Employees | 7,068 | 82.8% |
| Self-Employed (Incorporated) | 48 | 0.6% |
| Self-Employed (Not Incorporated) | 235 | 2.8% |
| Not-for-profit Organizations | 423 | 5.0% |
| Local Government Employees | 429 | 5.0% |
| State Government Employees | 292 | 3.4% |
| Federal Government Employees | 30 | 0.4% |
| Unpaid Family Workers | 9 | 0.1% |
| Total | 8,534 | 100.0% |
Employment Status by Age in Wasco
According to the labor force statistics for Wasco, out of the total population over 16 years of age (19,699), 48.3% or 9,515 individuals are in the labor force, with 8.6% or 818 of them unemployed. The age group with the highest labor force participation rate is 35 to 44 years, with 58.5% or 2,198 individuals in the labor force. Within the labor force, the 60 to 64 years age range has the highest percentage of unemployed individuals, with 20.3% or 79 of them being unemployed.
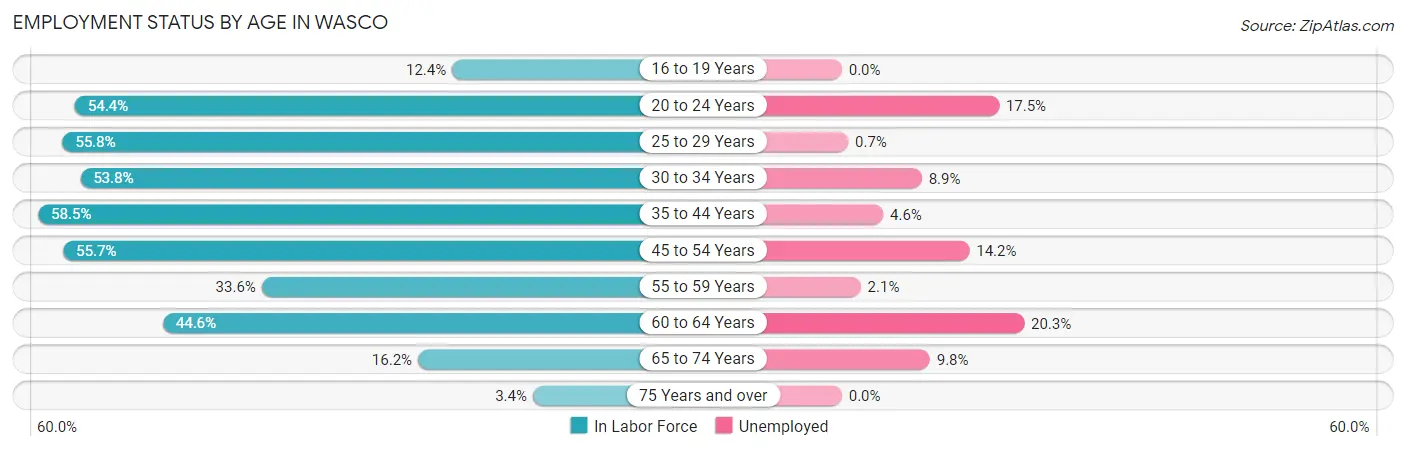
| Age Bracket | In Labor Force | Unemployed |
| 16 to 19 Years | 109 (12.4%) | 0 (0.0%) |
| 20 to 24 Years | 1,369 (54.4%) | 240 (17.5%) |
| 25 to 29 Years | 1,648 (55.8%) | 12 (0.7%) |
| 30 to 34 Years | 1,644 (53.8%) | 146 (8.9%) |
| 35 to 44 Years | 2,198 (58.5%) | 101 (4.6%) |
| 45 to 54 Years | 1,512 (55.7%) | 215 (14.2%) |
| 55 to 59 Years | 428 (33.6%) | 9 (2.1%) |
| 60 to 64 Years | 390 (44.6%) | 79 (20.3%) |
| 65 to 74 Years | 194 (16.2%) | 19 (9.8%) |
| 75 Years and over | 16 (3.4%) | 0 (0.0%) |
| Total | 9,515 (48.3%) | 818 (8.6%) |
Employment Status by Educational Attainment in Wasco
According to labor force statistics for Wasco, 53.5% of individuals (7,828) out of the total population between 25 and 64 years of age (14,631) are in the labor force, with 7.2% or 564 of them being unemployed. The group with the highest labor force participation rate are those with the educational attainment of bachelor's degree or higher, with 73.0% or 575 individuals in the labor force. Within the labor force, individuals with college / associate degree education have the highest percentage of unemployment, with 9.3% or 176 of them being unemployed.
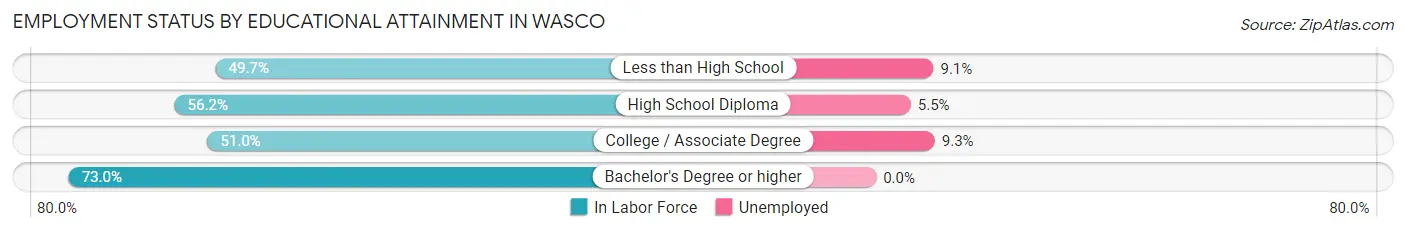
| Educational Attainment | In Labor Force | Unemployed |
| Less than High School | 2,575 (49.7%) | 472 (9.1%) |
| High School Diploma | 2,778 (56.2%) | 272 (5.5%) |
| College / Associate Degree | 1,896 (51.0%) | 346 (9.3%) |
| Bachelor's Degree or higher | 575 (73.0%) | 0 (0.0%) |
| Total | 7,828 (53.5%) | 1,053 (7.2%) |
Employment Occupations by Sex in Wasco
Management, Business, Science and Arts Occupations
The most common Management, Business, Science and Arts occupations in Wasco are Community & Social Service (547 | 6.3%), Education Instruction & Library (399 | 4.6%), Management (247 | 2.8%), Business & Financial (164 | 1.9%), and Health Diagnosing & Treating (143 | 1.7%).
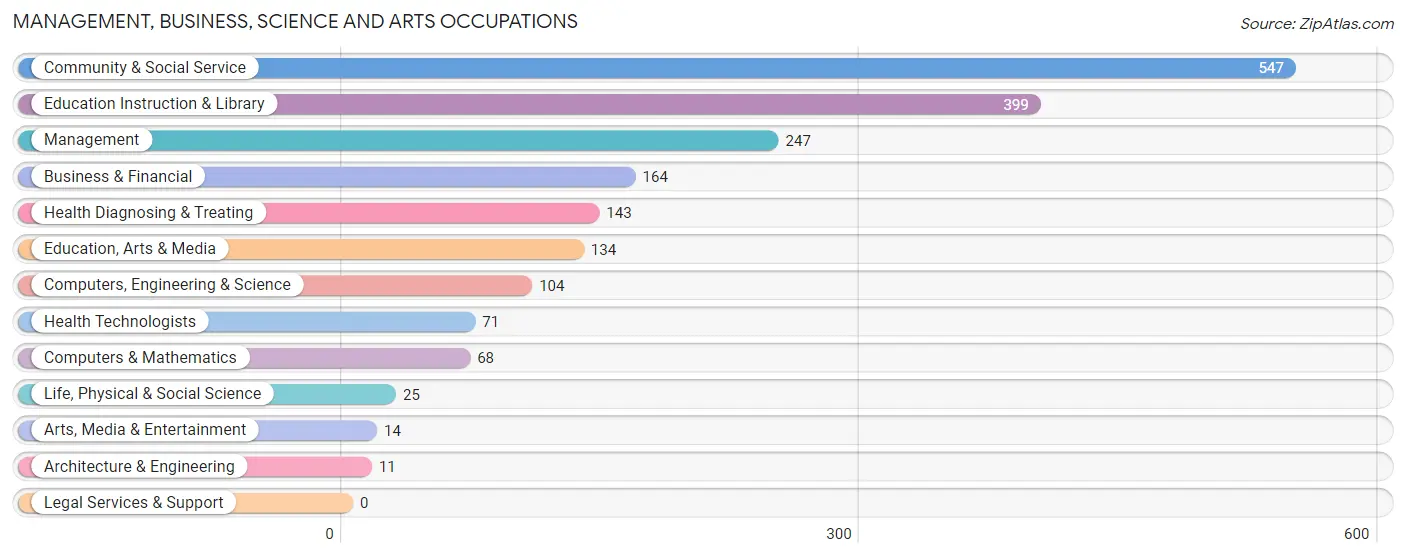
Management, Business, Science and Arts Occupations by Sex
Within the Management, Business, Science and Arts occupations in Wasco, the most male-oriented occupations are Arts, Media & Entertainment (100.0%), Computers & Mathematics (89.7%), and Management (73.7%), while the most female-oriented occupations are Architecture & Engineering (100.0%), Life, Physical & Social Science (100.0%), and Health Diagnosing & Treating (92.3%).
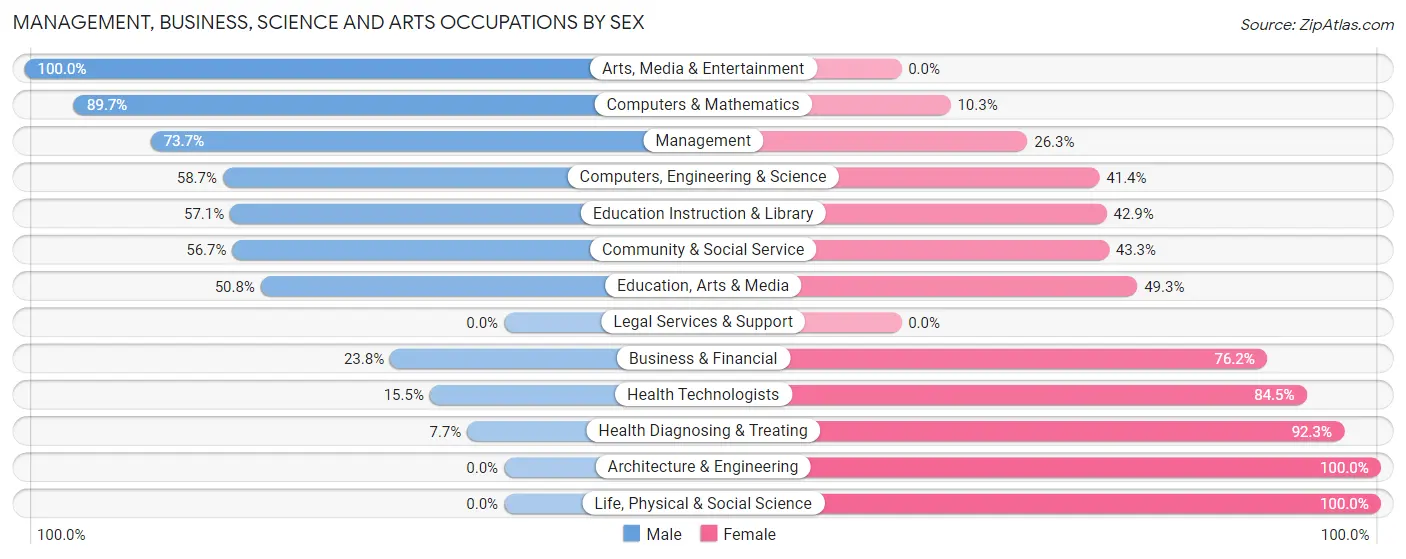
| Occupation | Male | Female |
| Management | 182 (73.7%) | 65 (26.3%) |
| Business & Financial | 39 (23.8%) | 125 (76.2%) |
| Computers, Engineering & Science | 61 (58.7%) | 43 (41.3%) |
| Computers & Mathematics | 61 (89.7%) | 7 (10.3%) |
| Architecture & Engineering | 0 (0.0%) | 11 (100.0%) |
| Life, Physical & Social Science | 0 (0.0%) | 25 (100.0%) |
| Community & Social Service | 310 (56.7%) | 237 (43.3%) |
| Education, Arts & Media | 68 (50.7%) | 66 (49.2%) |
| Legal Services & Support | 0 (0.0%) | 0 (0.0%) |
| Education Instruction & Library | 228 (57.1%) | 171 (42.9%) |
| Arts, Media & Entertainment | 14 (100.0%) | 0 (0.0%) |
| Health Diagnosing & Treating | 11 (7.7%) | 132 (92.3%) |
| Health Technologists | 11 (15.5%) | 60 (84.5%) |
| Total (Category) | 603 (50.0%) | 602 (50.0%) |
| Total (Overall) | 5,111 (58.8%) | 3,580 (41.2%) |
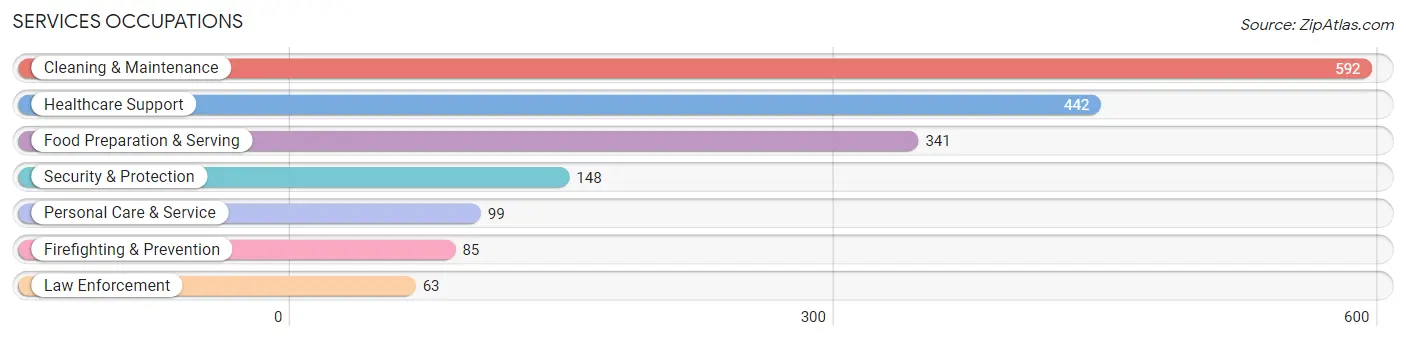
Services Occupations
The most common Services occupations in Wasco are Cleaning & Maintenance (592 | 6.8%), Healthcare Support (442 | 5.1%), Food Preparation & Serving (341 | 3.9%), Security & Protection (148 | 1.7%), and Personal Care & Service (99 | 1.1%).
Services Occupations by Sex
Within the Services occupations in Wasco, the most male-oriented occupations are Personal Care & Service (93.9%), Cleaning & Maintenance (90.4%), and Law Enforcement (60.3%), while the most female-oriented occupations are Healthcare Support (92.8%), Food Preparation & Serving (73.9%), and Firefighting & Prevention (51.8%).
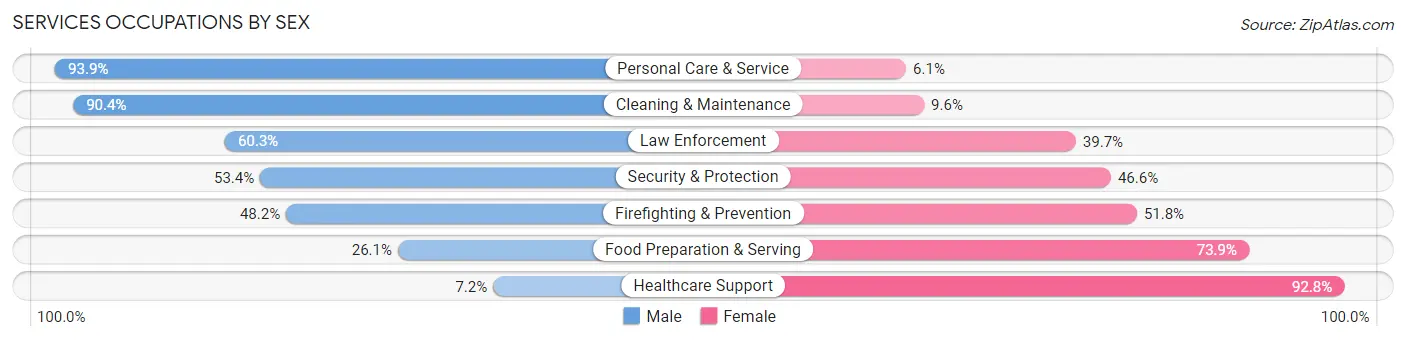
| Occupation | Male | Female |
| Healthcare Support | 32 (7.2%) | 410 (92.8%) |
| Security & Protection | 79 (53.4%) | 69 (46.6%) |
| Firefighting & Prevention | 41 (48.2%) | 44 (51.8%) |
| Law Enforcement | 38 (60.3%) | 25 (39.7%) |
| Food Preparation & Serving | 89 (26.1%) | 252 (73.9%) |
| Cleaning & Maintenance | 535 (90.4%) | 57 (9.6%) |
| Personal Care & Service | 93 (93.9%) | 6 (6.1%) |
| Total (Category) | 828 (51.0%) | 794 (48.9%) |
| Total (Overall) | 5,111 (58.8%) | 3,580 (41.2%) |
Sales and Office Occupations
The most common Sales and Office occupations in Wasco are Office & Administration (723 | 8.3%), and Sales & Related (505 | 5.8%).

Sales and Office Occupations by Sex

| Occupation | Male | Female |
| Sales & Related | 207 (41.0%) | 298 (59.0%) |
| Office & Administration | 107 (14.8%) | 616 (85.2%) |
| Total (Category) | 314 (25.6%) | 914 (74.4%) |
| Total (Overall) | 5,111 (58.8%) | 3,580 (41.2%) |
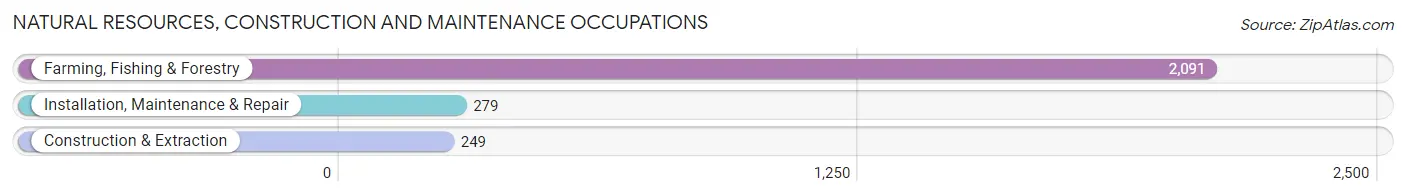
Natural Resources, Construction and Maintenance Occupations
The most common Natural Resources, Construction and Maintenance occupations in Wasco are Farming, Fishing & Forestry (2,091 | 24.1%), Installation, Maintenance & Repair (279 | 3.2%), and Construction & Extraction (249 | 2.9%).
Natural Resources, Construction and Maintenance Occupations by Sex
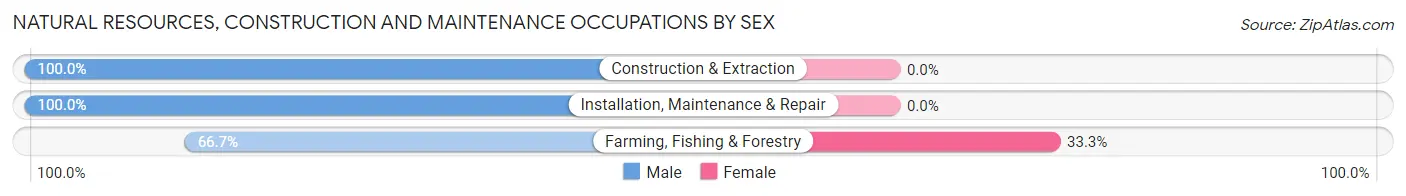
| Occupation | Male | Female |
| Farming, Fishing & Forestry | 1,394 (66.7%) | 697 (33.3%) |
| Construction & Extraction | 249 (100.0%) | 0 (0.0%) |
| Installation, Maintenance & Repair | 279 (100.0%) | 0 (0.0%) |
| Total (Category) | 1,922 (73.4%) | 697 (26.6%) |
| Total (Overall) | 5,111 (58.8%) | 3,580 (41.2%) |
Production, Transportation and Moving Occupations
The most common Production, Transportation and Moving occupations in Wasco are Material Moving (1,051 | 12.1%), Transportation (506 | 5.8%), and Production (460 | 5.3%).
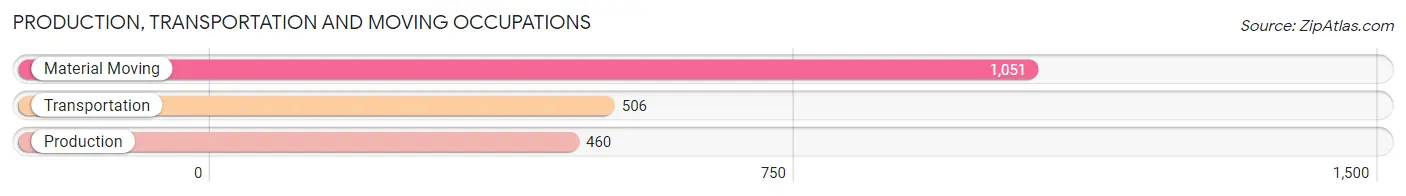
Production, Transportation and Moving Occupations by Sex
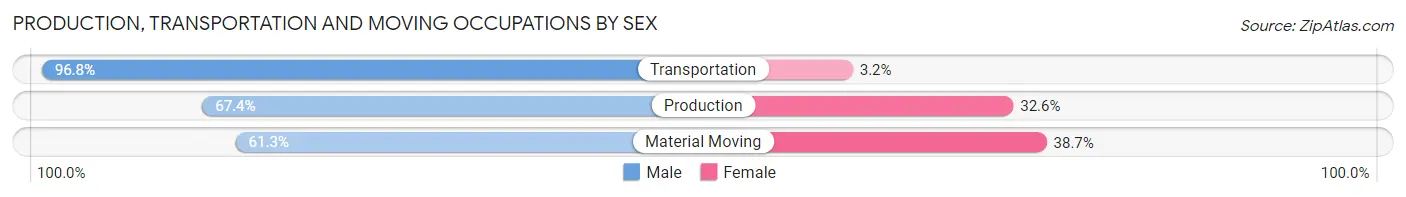
| Occupation | Male | Female |
| Production | 310 (67.4%) | 150 (32.6%) |
| Transportation | 490 (96.8%) | 16 (3.2%) |
| Material Moving | 644 (61.3%) | 407 (38.7%) |
| Total (Category) | 1,444 (71.6%) | 573 (28.4%) |
| Total (Overall) | 5,111 (58.8%) | 3,580 (41.2%) |
Employment Industries by Sex in Wasco
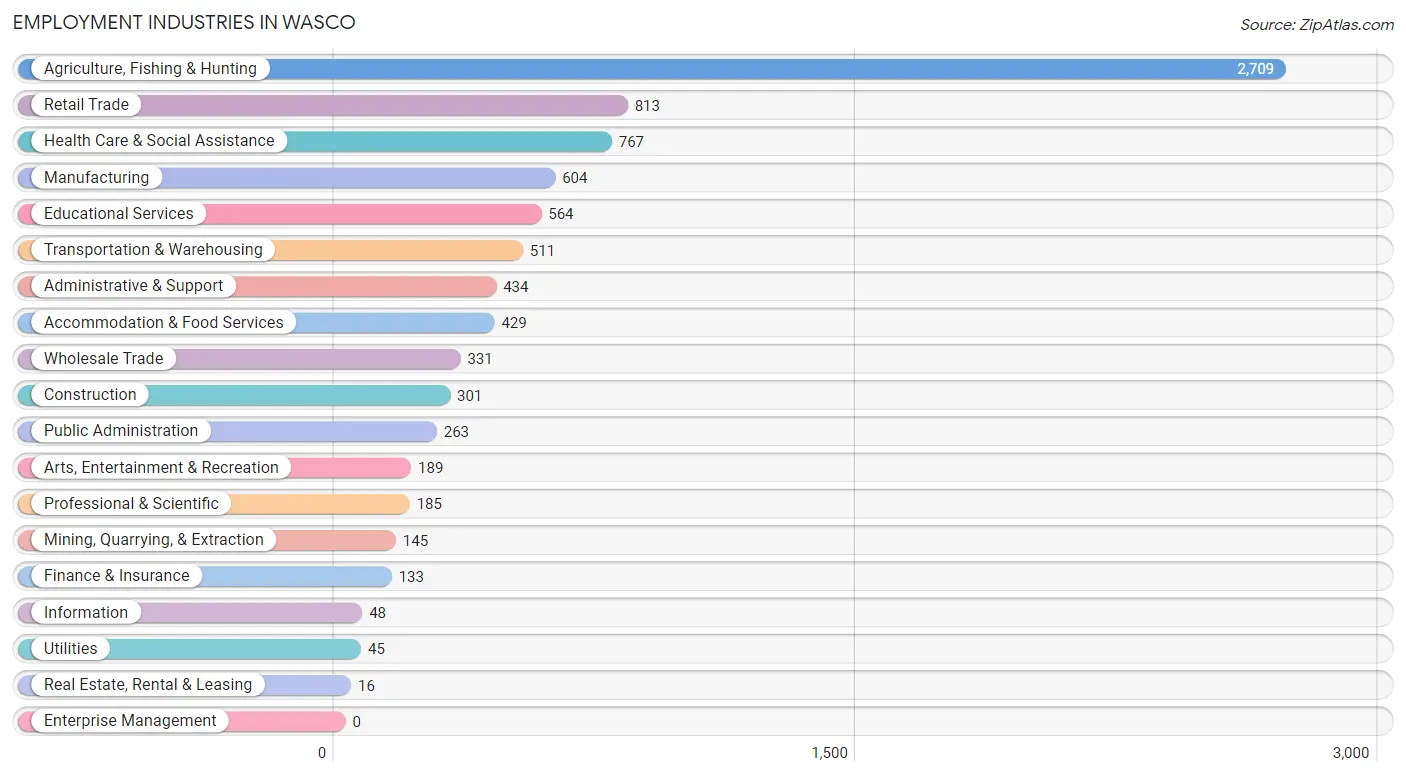
Employment Industries in Wasco
The major employment industries in Wasco include Agriculture, Fishing & Hunting (2,709 | 31.2%), Retail Trade (813 | 9.3%), Health Care & Social Assistance (767 | 8.8%), Manufacturing (604 | 7.0%), and Educational Services (564 | 6.5%).
Employment Industries by Sex in Wasco
The Wasco industries that see more men than women are Mining, Quarrying, & Extraction (100.0%), Utilities (100.0%), and Arts, Entertainment & Recreation (100.0%), whereas the industries that tend to have a higher number of women are Finance & Insurance (100.0%), Real Estate, Rental & Leasing (100.0%), and Professional & Scientific (91.9%).
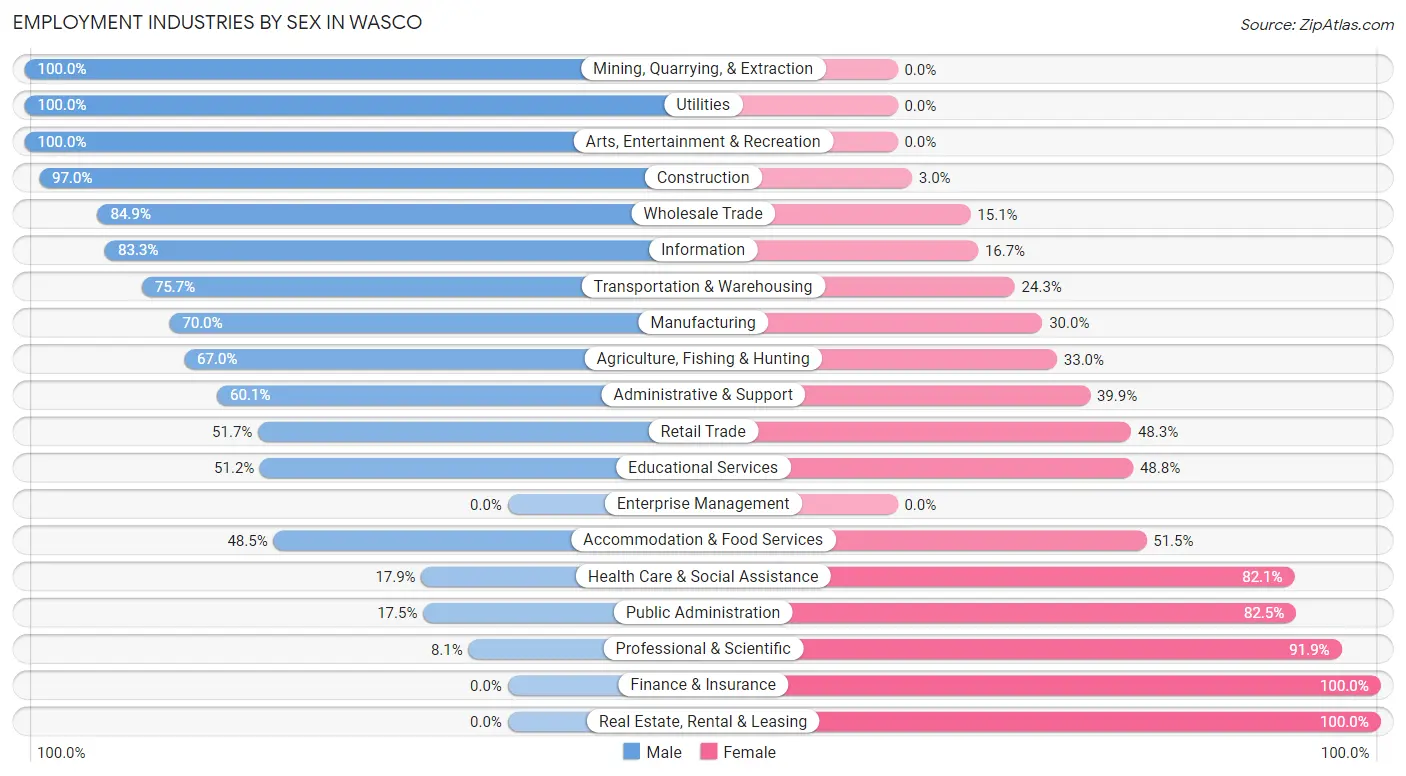
| Industry | Male | Female |
| Agriculture, Fishing & Hunting | 1,815 (67.0%) | 894 (33.0%) |
| Mining, Quarrying, & Extraction | 145 (100.0%) | 0 (0.0%) |
| Construction | 292 (97.0%) | 9 (3.0%) |
| Manufacturing | 423 (70.0%) | 181 (30.0%) |
| Wholesale Trade | 281 (84.9%) | 50 (15.1%) |
| Retail Trade | 420 (51.7%) | 393 (48.3%) |
| Transportation & Warehousing | 387 (75.7%) | 124 (24.3%) |
| Utilities | 45 (100.0%) | 0 (0.0%) |
| Information | 40 (83.3%) | 8 (16.7%) |
| Finance & Insurance | 0 (0.0%) | 133 (100.0%) |
| Real Estate, Rental & Leasing | 0 (0.0%) | 16 (100.0%) |
| Professional & Scientific | 15 (8.1%) | 170 (91.9%) |
| Enterprise Management | 0 (0.0%) | 0 (0.0%) |
| Administrative & Support | 261 (60.1%) | 173 (39.9%) |
| Educational Services | 289 (51.2%) | 275 (48.8%) |
| Health Care & Social Assistance | 137 (17.9%) | 630 (82.1%) |
| Arts, Entertainment & Recreation | 189 (100.0%) | 0 (0.0%) |
| Accommodation & Food Services | 208 (48.5%) | 221 (51.5%) |
| Public Administration | 46 (17.5%) | 217 (82.5%) |
| Total | 5,111 (58.8%) | 3,580 (41.2%) |
Education in Wasco
School Enrollment in Wasco
The most common levels of schooling among the 7,210 students in Wasco are elementary school (1,758 | 24.4%), high school (1,565 | 21.7%), and middle school (1,456 | 20.2%).
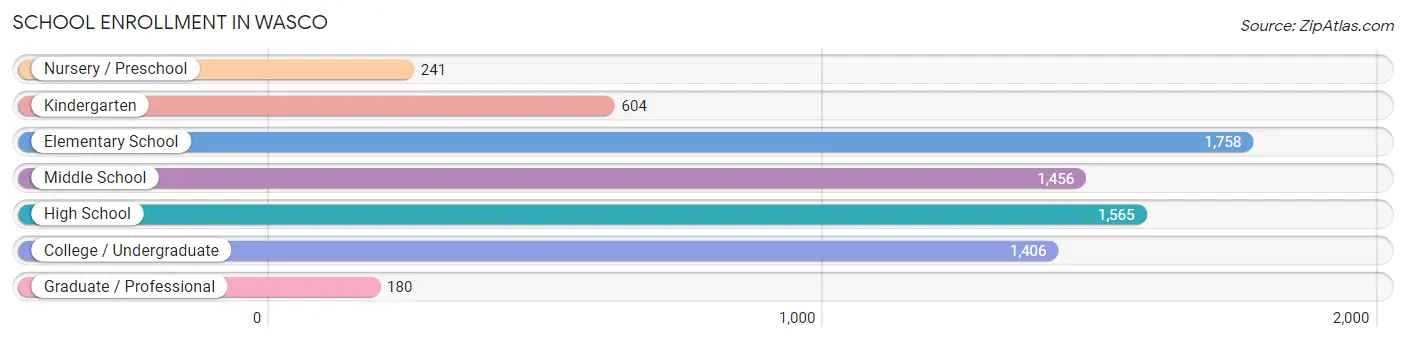
| School Level | # Students | % Students |
| Nursery / Preschool | 241 | 3.3% |
| Kindergarten | 604 | 8.4% |
| Elementary School | 1,758 | 24.4% |
| Middle School | 1,456 | 20.2% |
| High School | 1,565 | 21.7% |
| College / Undergraduate | 1,406 | 19.5% |
| Graduate / Professional | 180 | 2.5% |
| Total | 7,210 | 100.0% |
School Enrollment by Age by Funding Source in Wasco
Out of a total of 7,210 students who are enrolled in schools in Wasco, 570 (7.9%) attend a private institution, while the remaining 6,640 (92.1%) are enrolled in public schools. The age group of 25 to 34 year olds has the highest likelihood of being enrolled in private schools, with 212 (34.4% in the age bracket) enrolled. Conversely, the age group of 3 to 4 year olds has the lowest likelihood of being enrolled in a private school, with 239 (100.0% in the age bracket) attending a public institution.
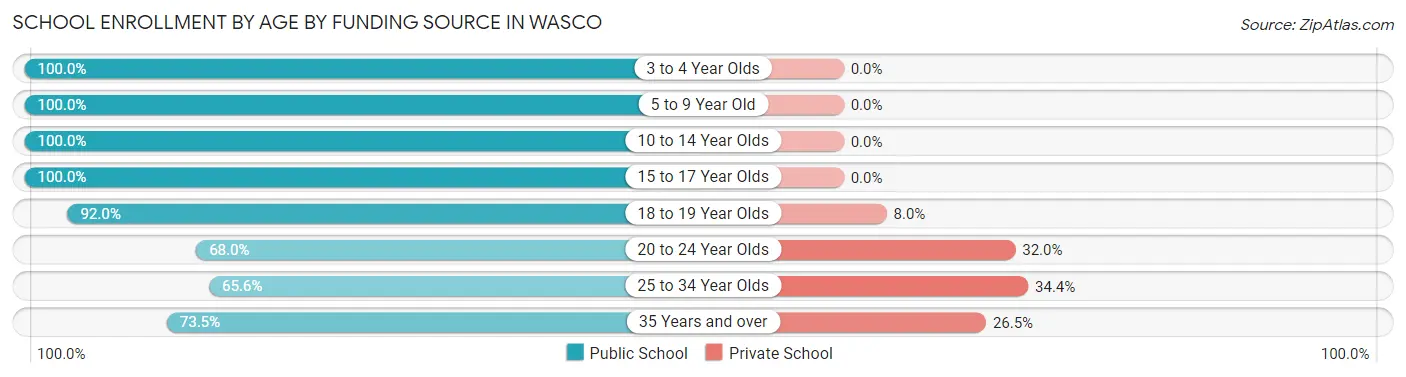
| Age Bracket | Public School | Private School |
| 3 to 4 Year Olds | 239 (100.0%) | 0 (0.0%) |
| 5 to 9 Year Old | 2,288 (100.0%) | 0 (0.0%) |
| 10 to 14 Year Olds | 1,915 (100.0%) | 0 (0.0%) |
| 15 to 17 Year Olds | 756 (100.0%) | 0 (0.0%) |
| 18 to 19 Year Olds | 265 (92.0%) | 23 (8.0%) |
| 20 to 24 Year Olds | 481 (68.0%) | 226 (32.0%) |
| 25 to 34 Year Olds | 405 (65.6%) | 212 (34.4%) |
| 35 Years and over | 294 (73.5%) | 106 (26.5%) |
| Total | 6,640 (92.1%) | 570 (7.9%) |
Educational Attainment by Field of Study in Wasco
Business (182 | 19.9%), science & technology (127 | 13.9%), bio, nature & agricultural (91 | 10.0%), education (88 | 9.6%), and liberal arts & history (85 | 9.3%) are the most common fields of study among 913 individuals in Wasco who have obtained a bachelor's degree or higher.
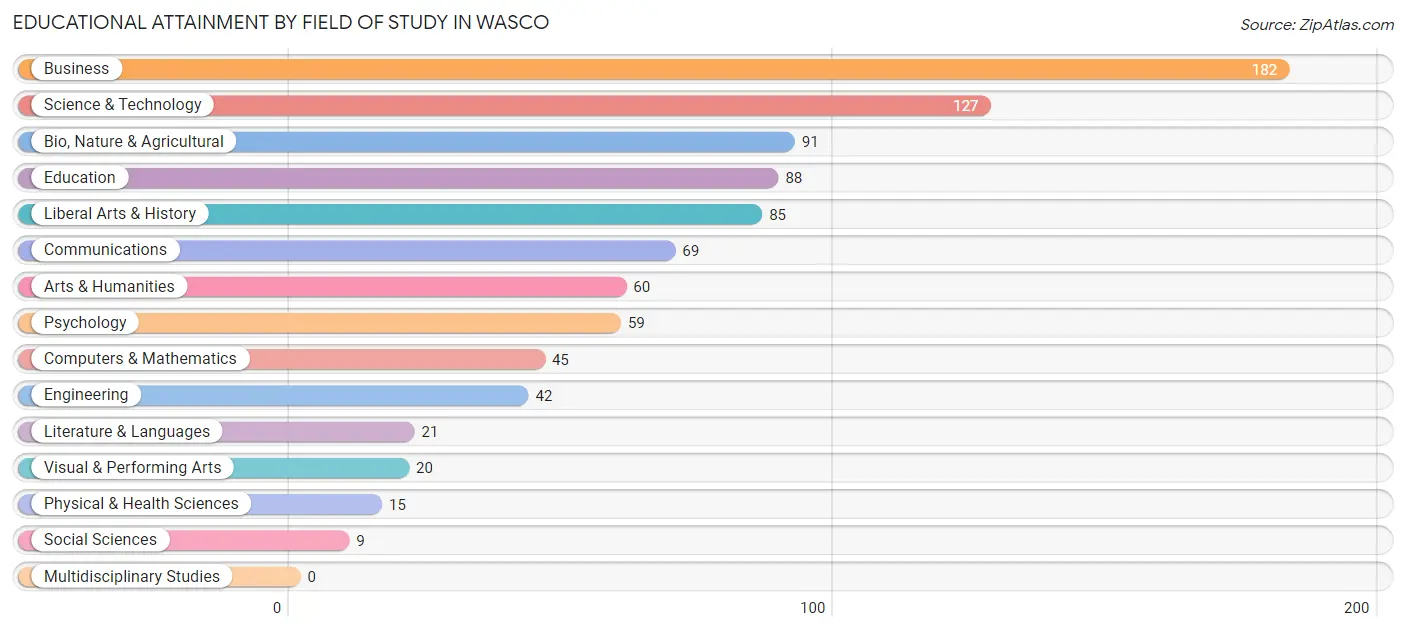
| Field of Study | # Graduates | % Graduates |
| Computers & Mathematics | 45 | 4.9% |
| Bio, Nature & Agricultural | 91 | 10.0% |
| Physical & Health Sciences | 15 | 1.6% |
| Psychology | 59 | 6.5% |
| Social Sciences | 9 | 1.0% |
| Engineering | 42 | 4.6% |
| Multidisciplinary Studies | 0 | 0.0% |
| Science & Technology | 127 | 13.9% |
| Business | 182 | 19.9% |
| Education | 88 | 9.6% |
| Literature & Languages | 21 | 2.3% |
| Liberal Arts & History | 85 | 9.3% |
| Visual & Performing Arts | 20 | 2.2% |
| Communications | 69 | 7.6% |
| Arts & Humanities | 60 | 6.6% |
| Total | 913 | 100.0% |
Transportation & Commute in Wasco
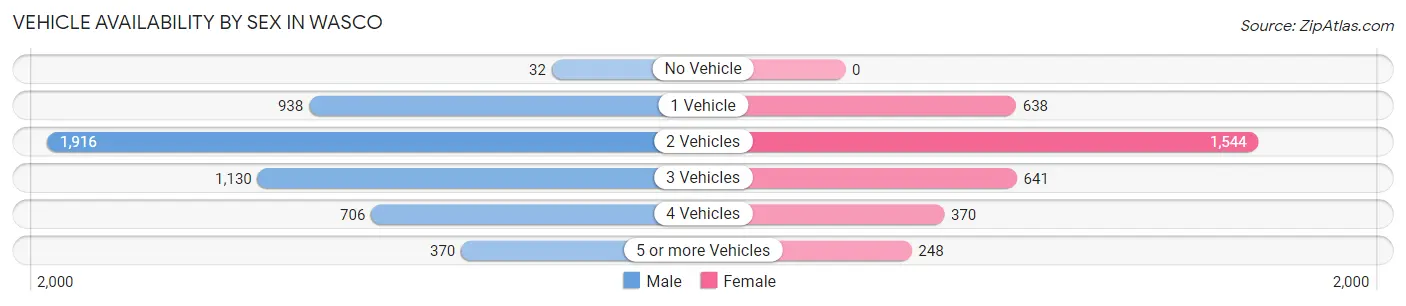
Vehicle Availability by Sex in Wasco
The most prevalent vehicle ownership categories in Wasco are males with 2 vehicles (1,916, accounting for 37.6%) and females with 2 vehicles (1,544, making up 55.7%).
| Vehicles Available | Male | Female |
| No Vehicle | 32 (0.6%) | 0 (0.0%) |
| 1 Vehicle | 938 (18.4%) | 638 (18.5%) |
| 2 Vehicles | 1,916 (37.6%) | 1,544 (44.9%) |
| 3 Vehicles | 1,130 (22.2%) | 641 (18.6%) |
| 4 Vehicles | 706 (13.9%) | 370 (10.7%) |
| 5 or more Vehicles | 370 (7.3%) | 248 (7.2%) |
| Total | 5,092 (100.0%) | 3,441 (100.0%) |
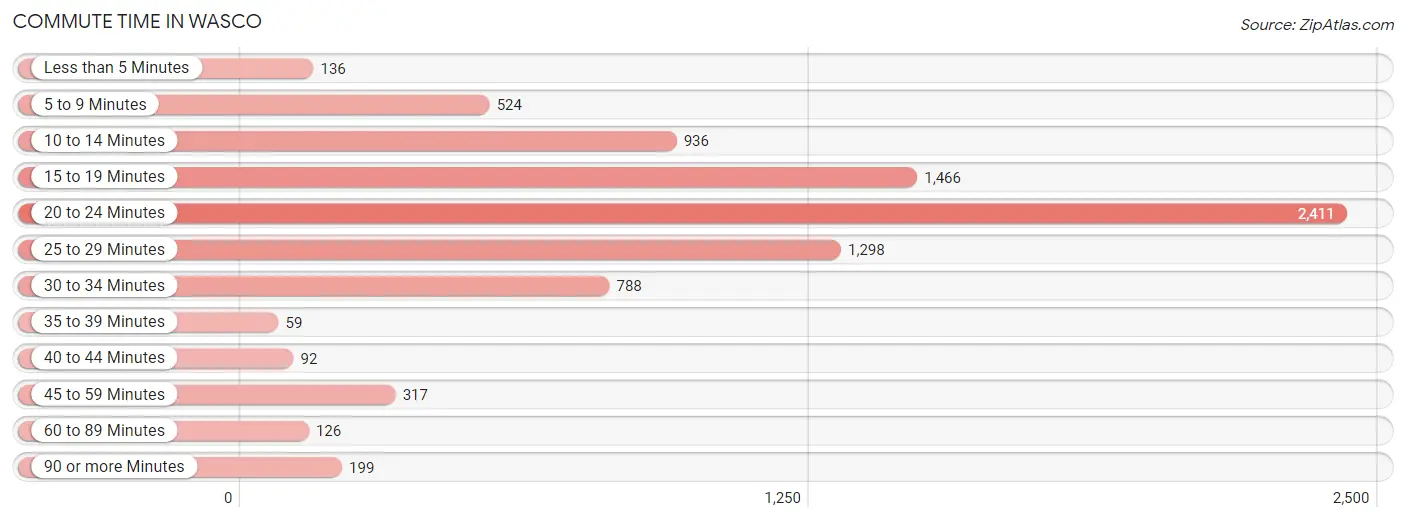
Commute Time in Wasco
The most frequently occuring commute durations in Wasco are 20 to 24 minutes (2,411 commuters, 28.9%), 15 to 19 minutes (1,466 commuters, 17.5%), and 25 to 29 minutes (1,298 commuters, 15.5%).
| Commute Time | # Commuters | % Commuters |
| Less than 5 Minutes | 136 | 1.6% |
| 5 to 9 Minutes | 524 | 6.3% |
| 10 to 14 Minutes | 936 | 11.2% |
| 15 to 19 Minutes | 1,466 | 17.5% |
| 20 to 24 Minutes | 2,411 | 28.9% |
| 25 to 29 Minutes | 1,298 | 15.5% |
| 30 to 34 Minutes | 788 | 9.4% |
| 35 to 39 Minutes | 59 | 0.7% |
| 40 to 44 Minutes | 92 | 1.1% |
| 45 to 59 Minutes | 317 | 3.8% |
| 60 to 89 Minutes | 126 | 1.5% |
| 90 or more Minutes | 199 | 2.4% |
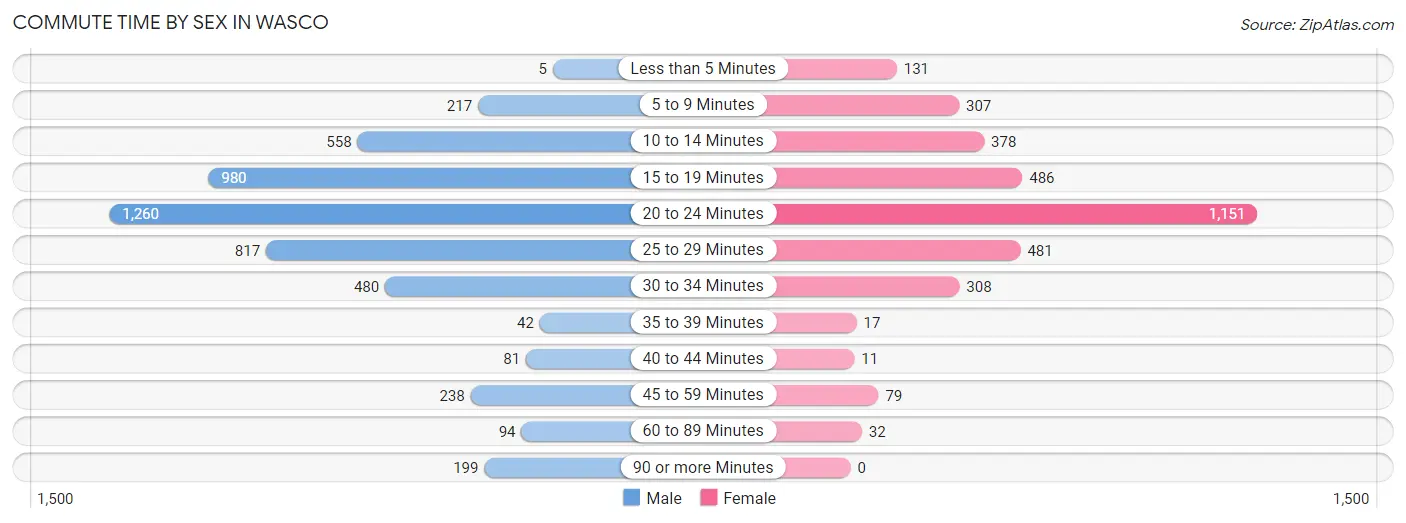
Commute Time by Sex in Wasco
The most common commute times in Wasco are 20 to 24 minutes (1,260 commuters, 25.4%) for males and 20 to 24 minutes (1,151 commuters, 34.0%) for females.
| Commute Time | Male | Female |
| Less than 5 Minutes | 5 (0.1%) | 131 (3.9%) |
| 5 to 9 Minutes | 217 (4.4%) | 307 (9.1%) |
| 10 to 14 Minutes | 558 (11.2%) | 378 (11.2%) |
| 15 to 19 Minutes | 980 (19.7%) | 486 (14.4%) |
| 20 to 24 Minutes | 1,260 (25.4%) | 1,151 (34.0%) |
| 25 to 29 Minutes | 817 (16.4%) | 481 (14.2%) |
| 30 to 34 Minutes | 480 (9.7%) | 308 (9.1%) |
| 35 to 39 Minutes | 42 (0.8%) | 17 (0.5%) |
| 40 to 44 Minutes | 81 (1.6%) | 11 (0.3%) |
| 45 to 59 Minutes | 238 (4.8%) | 79 (2.3%) |
| 60 to 89 Minutes | 94 (1.9%) | 32 (0.9%) |
| 90 or more Minutes | 199 (4.0%) | 0 (0.0%) |
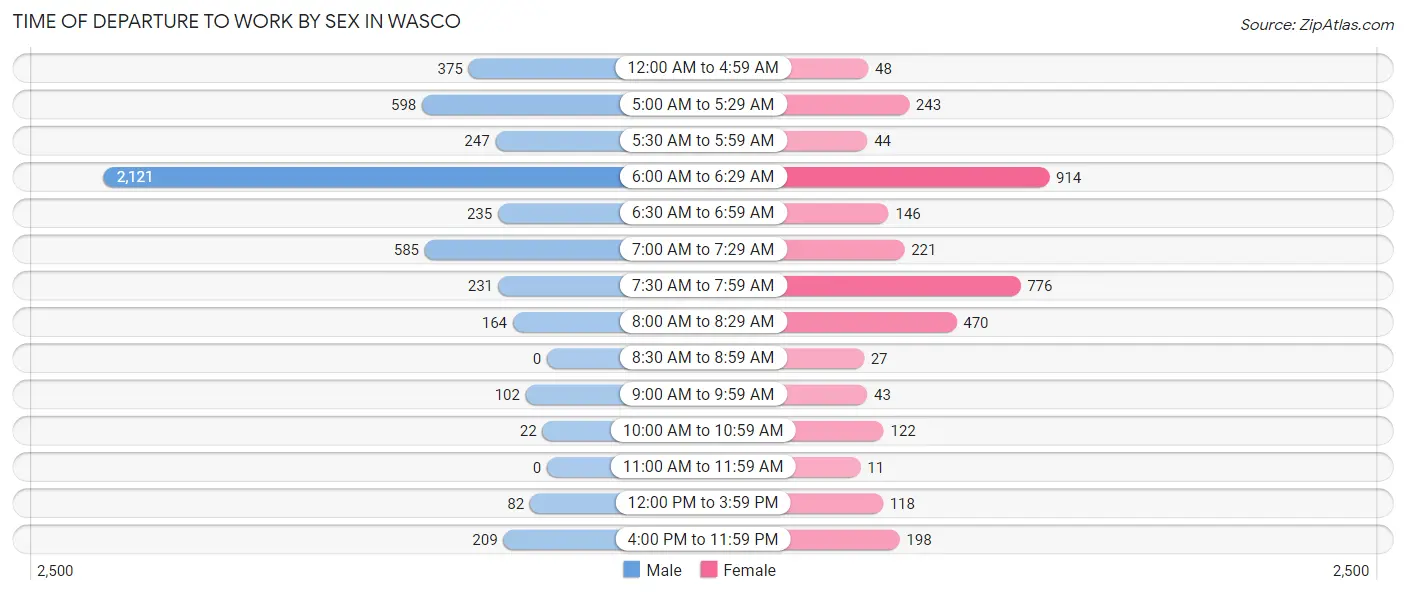
Time of Departure to Work by Sex in Wasco
The most frequent times of departure to work in Wasco are 6:00 AM to 6:29 AM (2,121, 42.7%) for males and 6:00 AM to 6:29 AM (914, 27.0%) for females.
| Time of Departure | Male | Female |
| 12:00 AM to 4:59 AM | 375 (7.5%) | 48 (1.4%) |
| 5:00 AM to 5:29 AM | 598 (12.0%) | 243 (7.2%) |
| 5:30 AM to 5:59 AM | 247 (5.0%) | 44 (1.3%) |
| 6:00 AM to 6:29 AM | 2,121 (42.7%) | 914 (27.0%) |
| 6:30 AM to 6:59 AM | 235 (4.7%) | 146 (4.3%) |
| 7:00 AM to 7:29 AM | 585 (11.8%) | 221 (6.5%) |
| 7:30 AM to 7:59 AM | 231 (4.6%) | 776 (23.0%) |
| 8:00 AM to 8:29 AM | 164 (3.3%) | 470 (13.9%) |
| 8:30 AM to 8:59 AM | 0 (0.0%) | 27 (0.8%) |
| 9:00 AM to 9:59 AM | 102 (2.1%) | 43 (1.3%) |
| 10:00 AM to 10:59 AM | 22 (0.4%) | 122 (3.6%) |
| 11:00 AM to 11:59 AM | 0 (0.0%) | 11 (0.3%) |
| 12:00 PM to 3:59 PM | 82 (1.7%) | 118 (3.5%) |
| 4:00 PM to 11:59 PM | 209 (4.2%) | 198 (5.9%) |
| Total | 4,971 (100.0%) | 3,381 (100.0%) |
Housing Occupancy in Wasco
Occupancy by Ownership in Wasco
Of the total 6,080 dwellings in Wasco, owner-occupied units account for 3,629 (59.7%), while renter-occupied units make up 2,451 (40.3%).
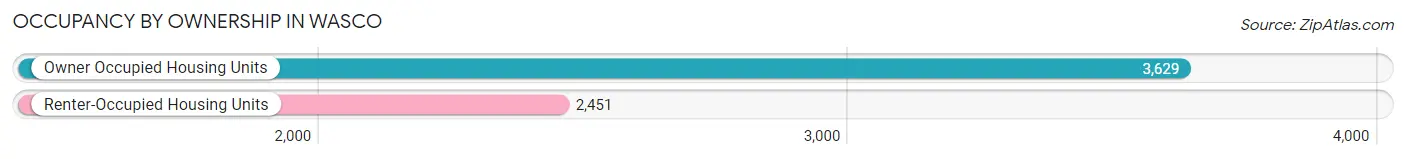
| Occupancy | # Housing Units | % Housing Units |
| Owner Occupied Housing Units | 3,629 | 59.7% |
| Renter-Occupied Housing Units | 2,451 | 40.3% |
| Total Occupied Housing Units | 6,080 | 100.0% |
Occupancy by Household Size in Wasco
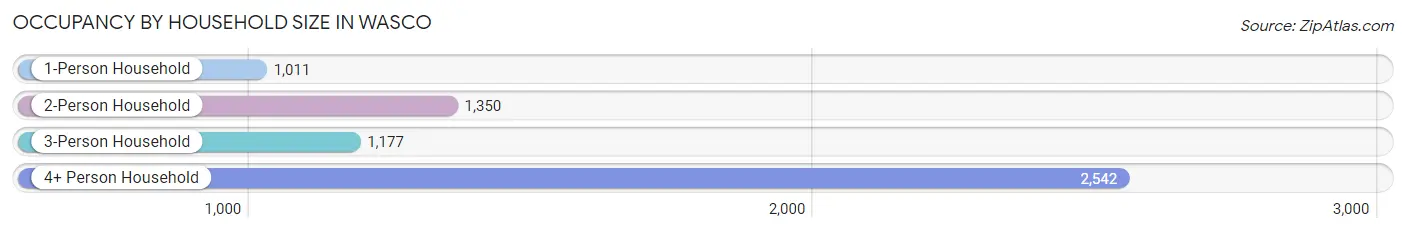
| Household Size | # Housing Units | % Housing Units |
| 1-Person Household | 1,011 | 16.6% |
| 2-Person Household | 1,350 | 22.2% |
| 3-Person Household | 1,177 | 19.4% |
| 4+ Person Household | 2,542 | 41.8% |
| Total Housing Units | 6,080 | 100.0% |
Occupancy by Ownership by Household Size in Wasco
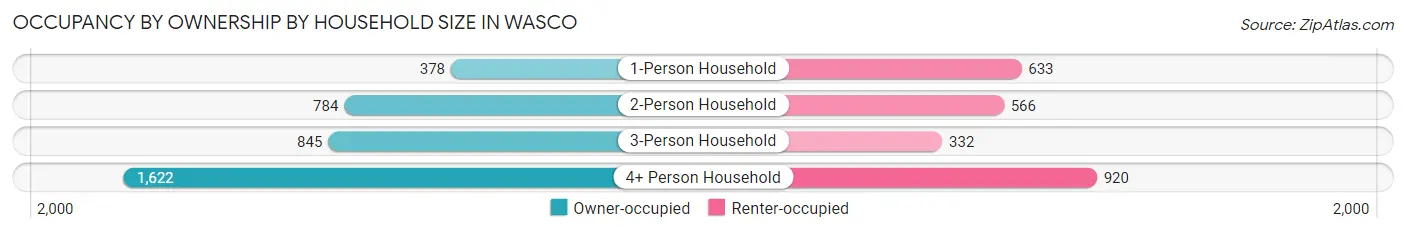
| Household Size | Owner-occupied | Renter-occupied |
| 1-Person Household | 378 (37.4%) | 633 (62.6%) |
| 2-Person Household | 784 (58.1%) | 566 (41.9%) |
| 3-Person Household | 845 (71.8%) | 332 (28.2%) |
| 4+ Person Household | 1,622 (63.8%) | 920 (36.2%) |
| Total Housing Units | 3,629 (59.7%) | 2,451 (40.3%) |
Occupancy by Educational Attainment in Wasco
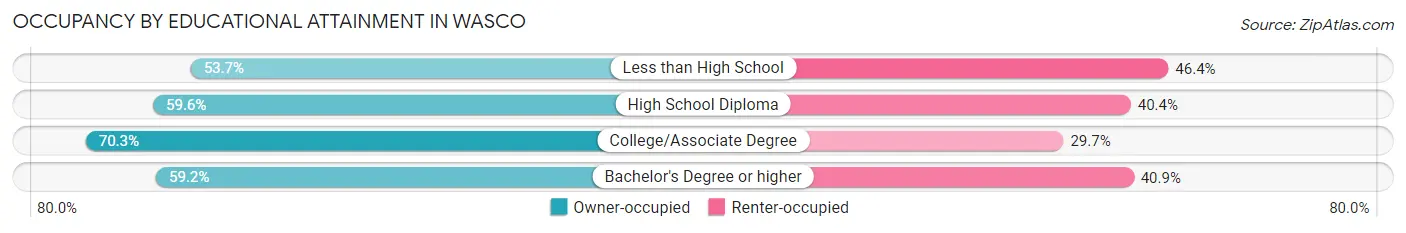
| Household Size | Owner-occupied | Renter-occupied |
| Less than High School | 1,258 (53.6%) | 1,087 (46.4%) |
| High School Diploma | 1,172 (59.6%) | 794 (40.4%) |
| College/Associate Degree | 963 (70.3%) | 407 (29.7%) |
| Bachelor's Degree or higher | 236 (59.2%) | 163 (40.8%) |
Occupancy by Age of Householder in Wasco
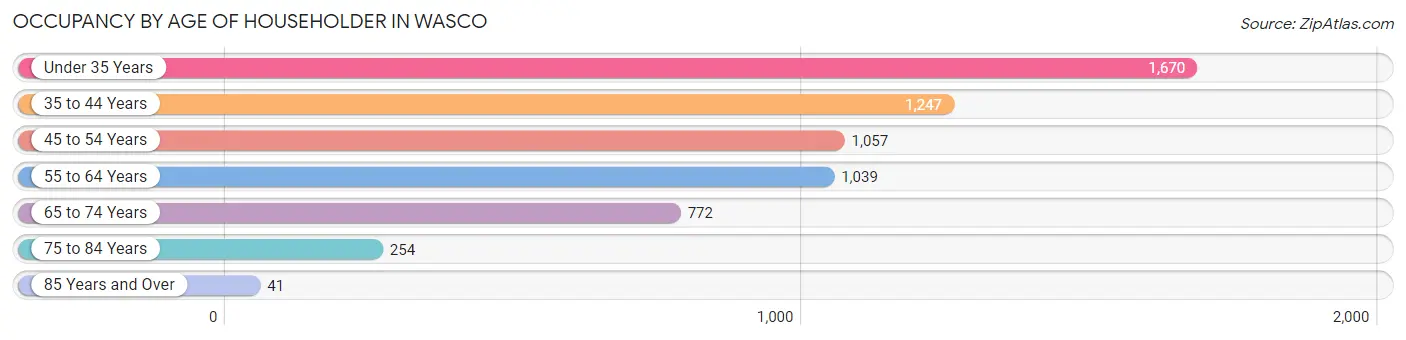
| Age Bracket | # Households | % Households |
| Under 35 Years | 1,670 | 27.5% |
| 35 to 44 Years | 1,247 | 20.5% |
| 45 to 54 Years | 1,057 | 17.4% |
| 55 to 64 Years | 1,039 | 17.1% |
| 65 to 74 Years | 772 | 12.7% |
| 75 to 84 Years | 254 | 4.2% |
| 85 Years and Over | 41 | 0.7% |
| Total | 6,080 | 100.0% |
Housing Finances in Wasco
Median Income by Occupancy in Wasco
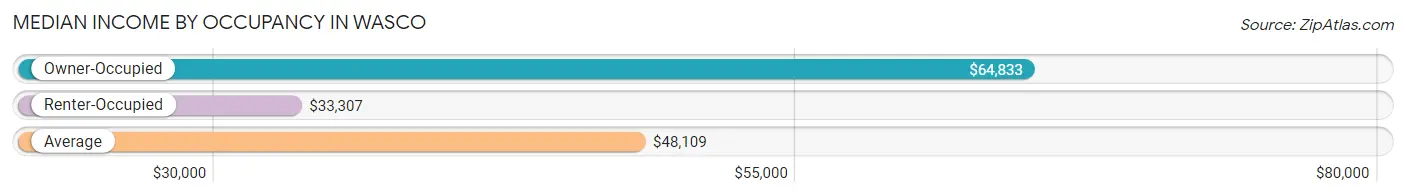
| Occupancy Type | # Households | Median Income |
| Owner-Occupied | 3,629 (59.7%) | $64,833 |
| Renter-Occupied | 2,451 (40.3%) | $33,307 |
| Average | 6,080 (100.0%) | $48,109 |
Occupancy by Householder Income Bracket in Wasco
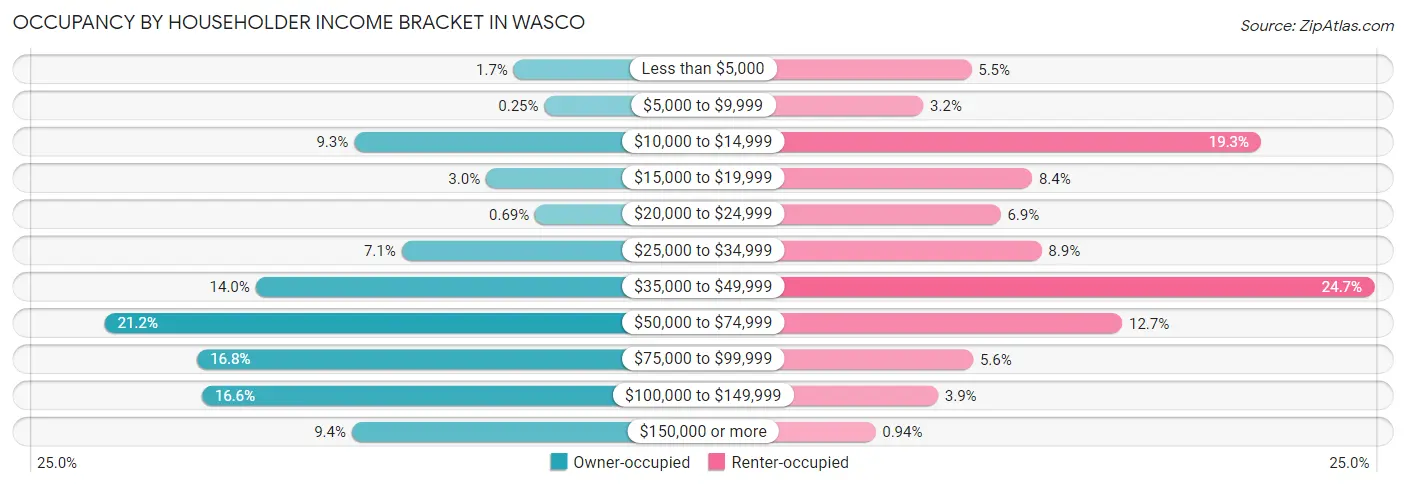
| Income Bracket | Owner-occupied | Renter-occupied |
| Less than $5,000 | 62 (1.7%) | 135 (5.5%) |
| $5,000 to $9,999 | 9 (0.3%) | 79 (3.2%) |
| $10,000 to $14,999 | 338 (9.3%) | 473 (19.3%) |
| $15,000 to $19,999 | 110 (3.0%) | 206 (8.4%) |
| $20,000 to $24,999 | 25 (0.7%) | 169 (6.9%) |
| $25,000 to $34,999 | 256 (7.0%) | 217 (8.8%) |
| $35,000 to $49,999 | 508 (14.0%) | 605 (24.7%) |
| $50,000 to $74,999 | 769 (21.2%) | 311 (12.7%) |
| $75,000 to $99,999 | 609 (16.8%) | 137 (5.6%) |
| $100,000 to $149,999 | 601 (16.6%) | 96 (3.9%) |
| $150,000 or more | 342 (9.4%) | 23 (0.9%) |
| Total | 3,629 (100.0%) | 2,451 (100.0%) |
Monthly Housing Cost Tiers in Wasco
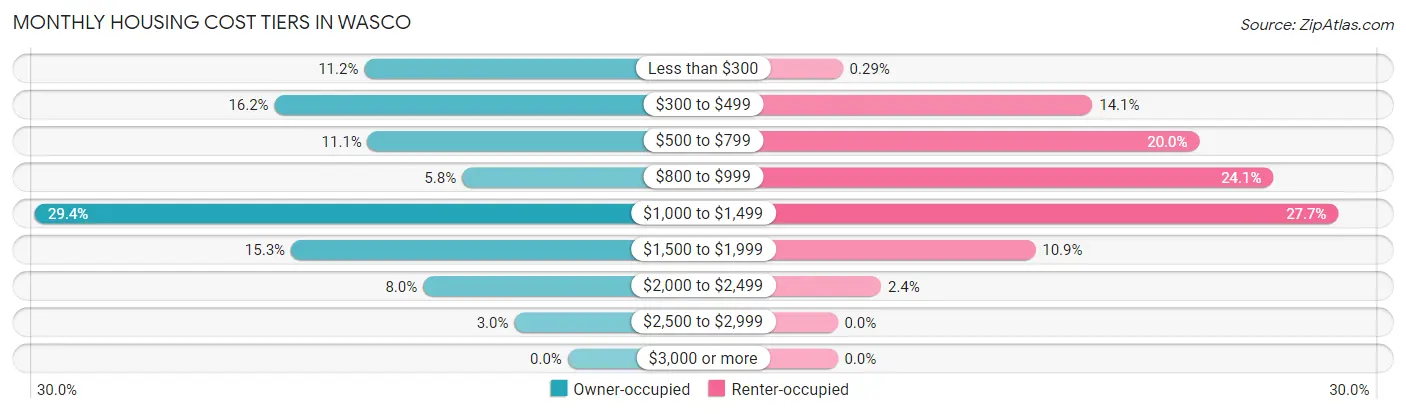
| Monthly Cost | Owner-occupied | Renter-occupied |
| Less than $300 | 408 (11.2%) | 7 (0.3%) |
| $300 to $499 | 588 (16.2%) | 345 (14.1%) |
| $500 to $799 | 401 (11.1%) | 490 (20.0%) |
| $800 to $999 | 212 (5.8%) | 590 (24.1%) |
| $1,000 to $1,499 | 1,068 (29.4%) | 678 (27.7%) |
| $1,500 to $1,999 | 555 (15.3%) | 268 (10.9%) |
| $2,000 to $2,499 | 290 (8.0%) | 59 (2.4%) |
| $2,500 to $2,999 | 107 (2.9%) | 0 (0.0%) |
| $3,000 or more | 0 (0.0%) | 0 (0.0%) |
| Total | 3,629 (100.0%) | 2,451 (100.0%) |
Physical Housing Characteristics in Wasco
Housing Structures in Wasco
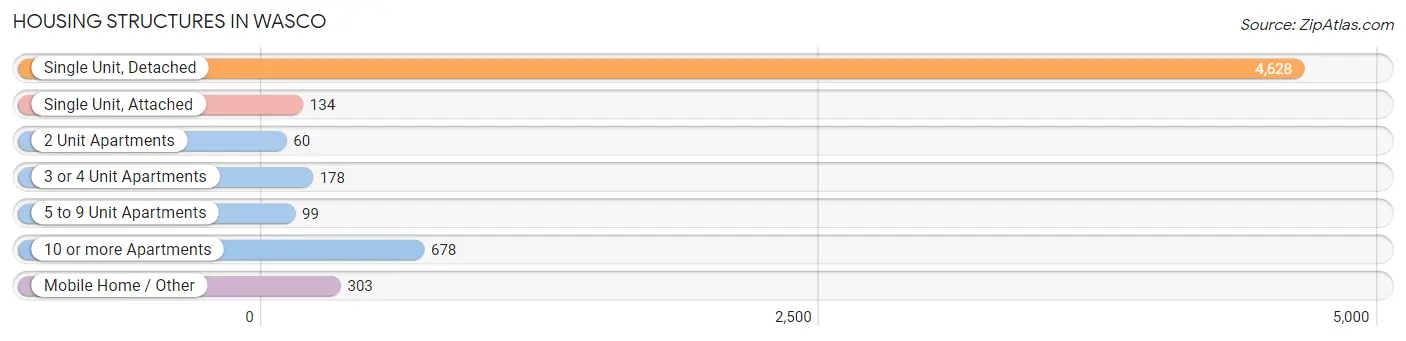
| Structure Type | # Housing Units | % Housing Units |
| Single Unit, Detached | 4,628 | 76.1% |
| Single Unit, Attached | 134 | 2.2% |
| 2 Unit Apartments | 60 | 1.0% |
| 3 or 4 Unit Apartments | 178 | 2.9% |
| 5 to 9 Unit Apartments | 99 | 1.6% |
| 10 or more Apartments | 678 | 11.2% |
| Mobile Home / Other | 303 | 5.0% |
| Total | 6,080 | 100.0% |
Housing Structures by Occupancy in Wasco
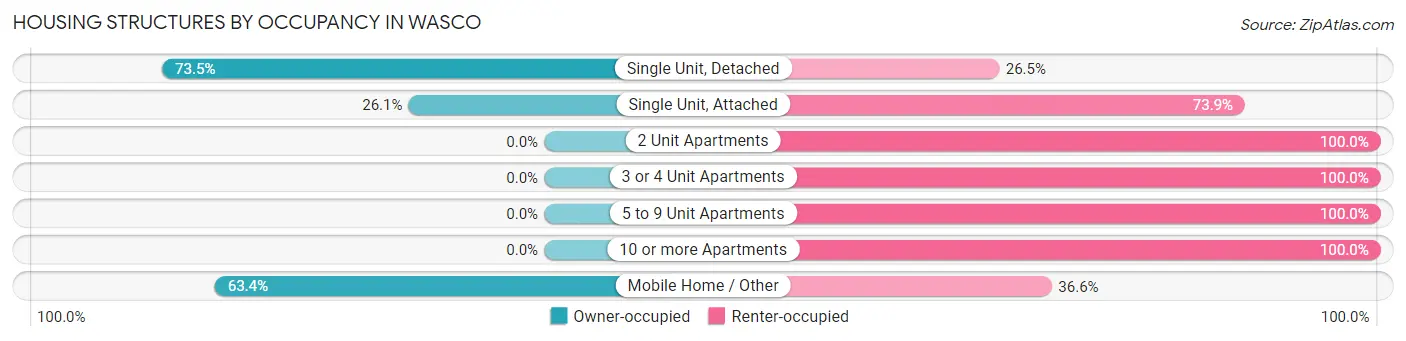
| Structure Type | Owner-occupied | Renter-occupied |
| Single Unit, Detached | 3,402 (73.5%) | 1,226 (26.5%) |
| Single Unit, Attached | 35 (26.1%) | 99 (73.9%) |
| 2 Unit Apartments | 0 (0.0%) | 60 (100.0%) |
| 3 or 4 Unit Apartments | 0 (0.0%) | 178 (100.0%) |
| 5 to 9 Unit Apartments | 0 (0.0%) | 99 (100.0%) |
| 10 or more Apartments | 0 (0.0%) | 678 (100.0%) |
| Mobile Home / Other | 192 (63.4%) | 111 (36.6%) |
| Total | 3,629 (59.7%) | 2,451 (40.3%) |
Housing Structures by Number of Rooms in Wasco
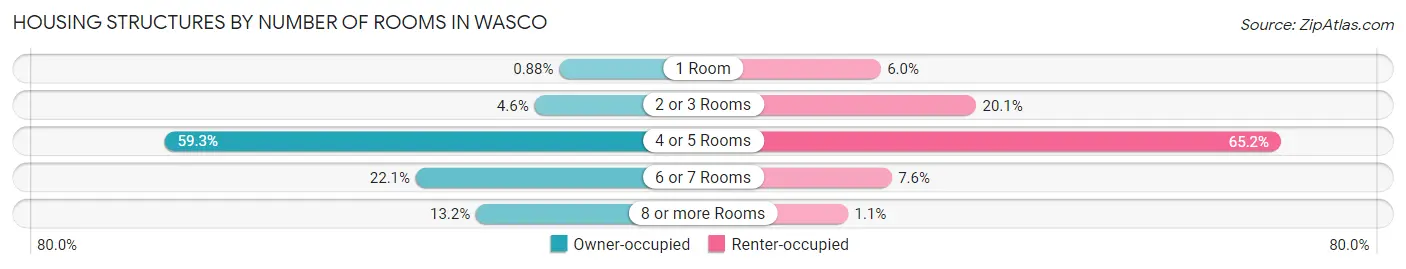
| Number of Rooms | Owner-occupied | Renter-occupied |
| 1 Room | 32 (0.9%) | 146 (6.0%) |
| 2 or 3 Rooms | 165 (4.5%) | 492 (20.1%) |
| 4 or 5 Rooms | 2,151 (59.3%) | 1,599 (65.2%) |
| 6 or 7 Rooms | 802 (22.1%) | 186 (7.6%) |
| 8 or more Rooms | 479 (13.2%) | 28 (1.1%) |
| Total | 3,629 (100.0%) | 2,451 (100.0%) |
Housing Structure by Heating Type in Wasco
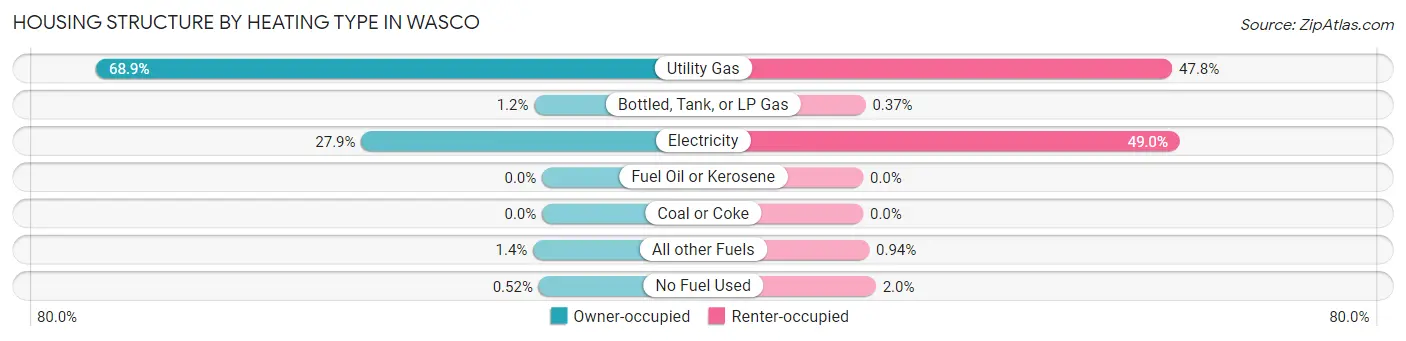
| Heating Type | Owner-occupied | Renter-occupied |
| Utility Gas | 2,502 (68.9%) | 1,171 (47.8%) |
| Bottled, Tank, or LP Gas | 44 (1.2%) | 9 (0.4%) |
| Electricity | 1,014 (27.9%) | 1,200 (49.0%) |
| Fuel Oil or Kerosene | 0 (0.0%) | 0 (0.0%) |
| Coal or Coke | 0 (0.0%) | 0 (0.0%) |
| All other Fuels | 50 (1.4%) | 23 (0.9%) |
| No Fuel Used | 19 (0.5%) | 48 (2.0%) |
| Total | 3,629 (100.0%) | 2,451 (100.0%) |
Household Vehicle Usage in Wasco
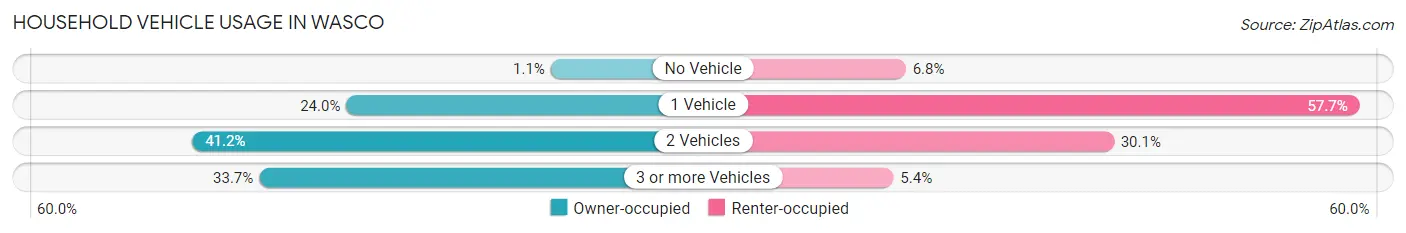
| Vehicles per Household | Owner-occupied | Renter-occupied |
| No Vehicle | 39 (1.1%) | 167 (6.8%) |
| 1 Vehicle | 870 (24.0%) | 1,413 (57.7%) |
| 2 Vehicles | 1,496 (41.2%) | 738 (30.1%) |
| 3 or more Vehicles | 1,224 (33.7%) | 133 (5.4%) |
| Total | 3,629 (100.0%) | 2,451 (100.0%) |
Real Estate & Mortgages in Wasco
Real Estate and Mortgage Overview in Wasco
| Characteristic | Without Mortgage | With Mortgage |
| Housing Units | 1,353 | 2,276 |
| Median Property Value | $210,500 | $230,200 |
| Median Household Income | $43,482 | $231 |
| Monthly Housing Costs | $344 | $0 |
| Real Estate Taxes | $1,338 | $14 |
Property Value by Mortgage Status in Wasco
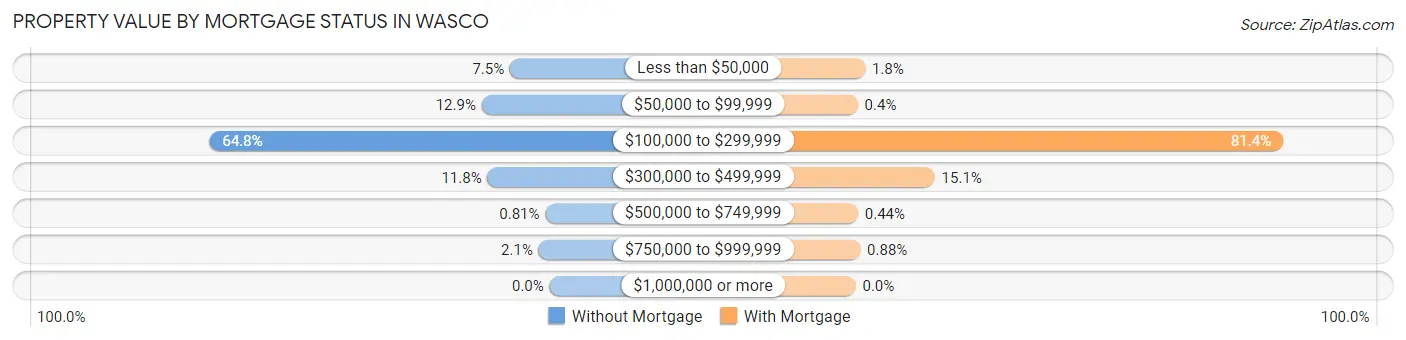
| Property Value | Without Mortgage | With Mortgage |
| Less than $50,000 | 102 (7.5%) | 41 (1.8%) |
| $50,000 to $99,999 | 175 (12.9%) | 9 (0.4%) |
| $100,000 to $299,999 | 877 (64.8%) | 1,853 (81.4%) |
| $300,000 to $499,999 | 160 (11.8%) | 343 (15.1%) |
| $500,000 to $749,999 | 11 (0.8%) | 10 (0.4%) |
| $750,000 to $999,999 | 28 (2.1%) | 20 (0.9%) |
| $1,000,000 or more | 0 (0.0%) | 0 (0.0%) |
| Total | 1,353 (100.0%) | 2,276 (100.0%) |
Household Income by Mortgage Status in Wasco
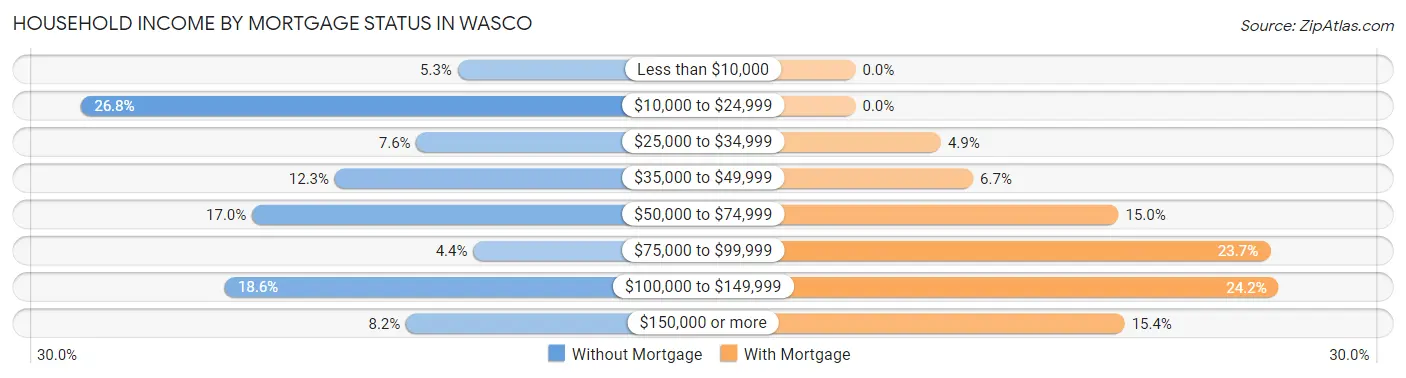
| Household Income | Without Mortgage | With Mortgage |
| Less than $10,000 | 71 (5.2%) | 0 (0.0%) |
| $10,000 to $24,999 | 362 (26.8%) | 0 (0.0%) |
| $25,000 to $34,999 | 103 (7.6%) | 111 (4.9%) |
| $35,000 to $49,999 | 166 (12.3%) | 153 (6.7%) |
| $50,000 to $74,999 | 230 (17.0%) | 342 (15.0%) |
| $75,000 to $99,999 | 59 (4.4%) | 539 (23.7%) |
| $100,000 to $149,999 | 251 (18.5%) | 550 (24.2%) |
| $150,000 or more | 111 (8.2%) | 350 (15.4%) |
| Total | 1,353 (100.0%) | 2,276 (100.0%) |
Property Value to Household Income Ratio in Wasco
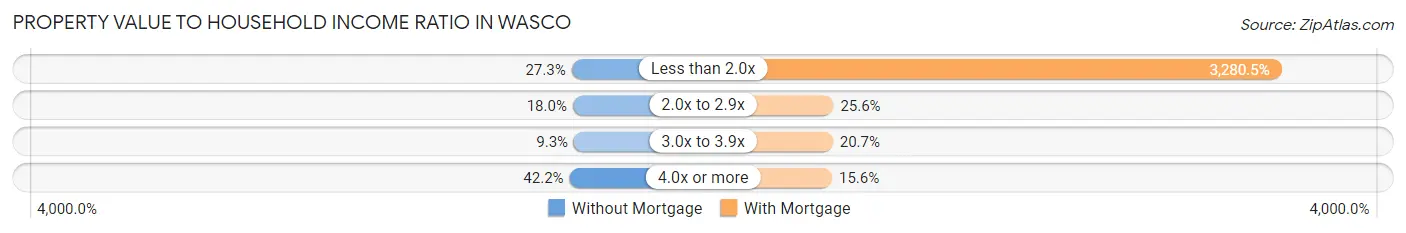
| Value-to-Income Ratio | Without Mortgage | With Mortgage |
| Less than 2.0x | 369 (27.3%) | 74,663 (3,280.4%) |
| 2.0x to 2.9x | 243 (18.0%) | 583 (25.6%) |
| 3.0x to 3.9x | 126 (9.3%) | 471 (20.7%) |
| 4.0x or more | 571 (42.2%) | 356 (15.6%) |
| Total | 1,353 (100.0%) | 2,276 (100.0%) |
Real Estate Taxes by Mortgage Status in Wasco
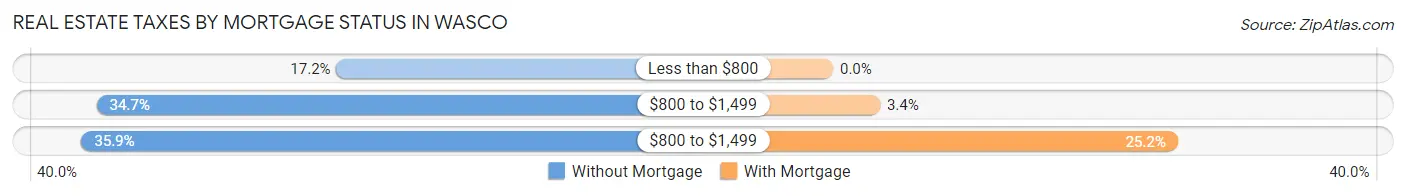
| Property Taxes | Without Mortgage | With Mortgage |
| Less than $800 | 233 (17.2%) | 0 (0.0%) |
| $800 to $1,499 | 470 (34.7%) | 78 (3.4%) |
| $800 to $1,499 | 485 (35.8%) | 573 (25.2%) |
| Total | 1,353 (100.0%) | 2,276 (100.0%) |
Health & Disability in Wasco
Health Insurance Coverage by Age in Wasco
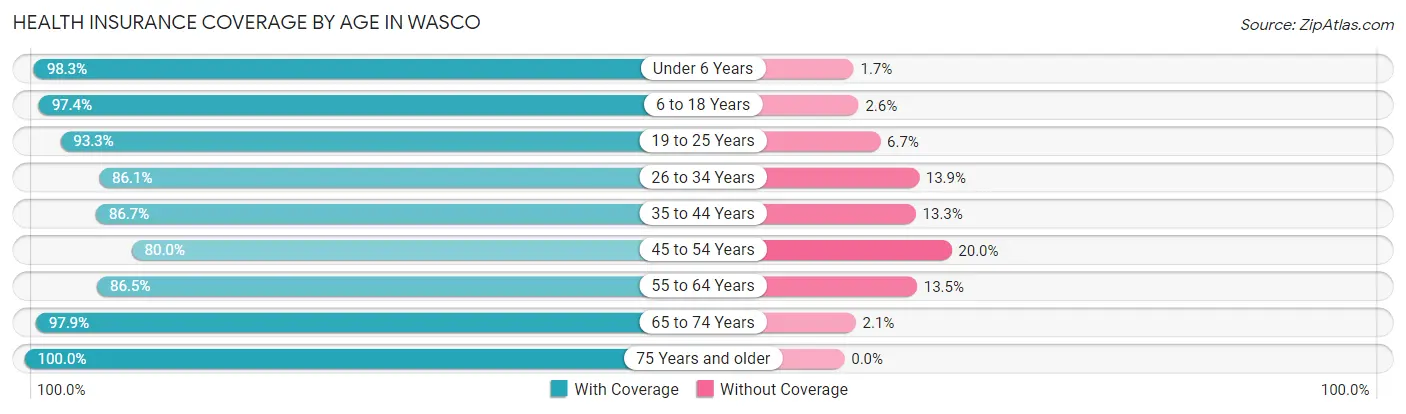
| Age Bracket | With Coverage | Without Coverage |
| Under 6 Years | 2,284 (98.3%) | 40 (1.7%) |
| 6 to 18 Years | 4,900 (97.4%) | 133 (2.6%) |
| 19 to 25 Years | 2,196 (93.3%) | 157 (6.7%) |
| 26 to 34 Years | 3,453 (86.1%) | 557 (13.9%) |
| 35 to 44 Years | 2,327 (86.7%) | 357 (13.3%) |
| 45 to 54 Years | 1,608 (80.0%) | 401 (20.0%) |
| 55 to 64 Years | 1,657 (86.5%) | 259 (13.5%) |
| 65 to 74 Years | 1,161 (97.9%) | 25 (2.1%) |
| 75 Years and older | 477 (100.0%) | 0 (0.0%) |
| Total | 20,063 (91.2%) | 1,929 (8.8%) |
Health Insurance Coverage by Citizenship Status in Wasco
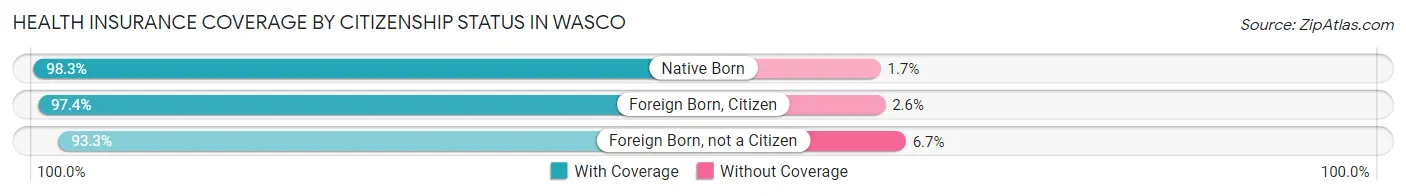
| Citizenship Status | With Coverage | Without Coverage |
| Native Born | 2,284 (98.3%) | 40 (1.7%) |
| Foreign Born, Citizen | 4,900 (97.4%) | 133 (2.6%) |
| Foreign Born, not a Citizen | 2,196 (93.3%) | 157 (6.7%) |
Health Insurance Coverage by Household Income in Wasco
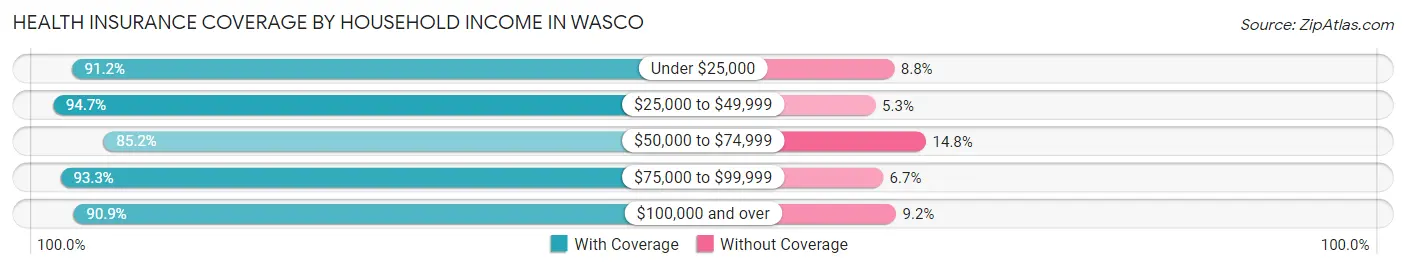
| Household Income | With Coverage | Without Coverage |
| Under $25,000 | 2,759 (91.2%) | 267 (8.8%) |
| $25,000 to $49,999 | 5,229 (94.7%) | 293 (5.3%) |
| $50,000 to $74,999 | 3,677 (85.2%) | 637 (14.8%) |
| $75,000 to $99,999 | 3,873 (93.3%) | 279 (6.7%) |
| $100,000 and over | 4,499 (90.8%) | 453 (9.1%) |
Public vs Private Health Insurance Coverage by Age in Wasco
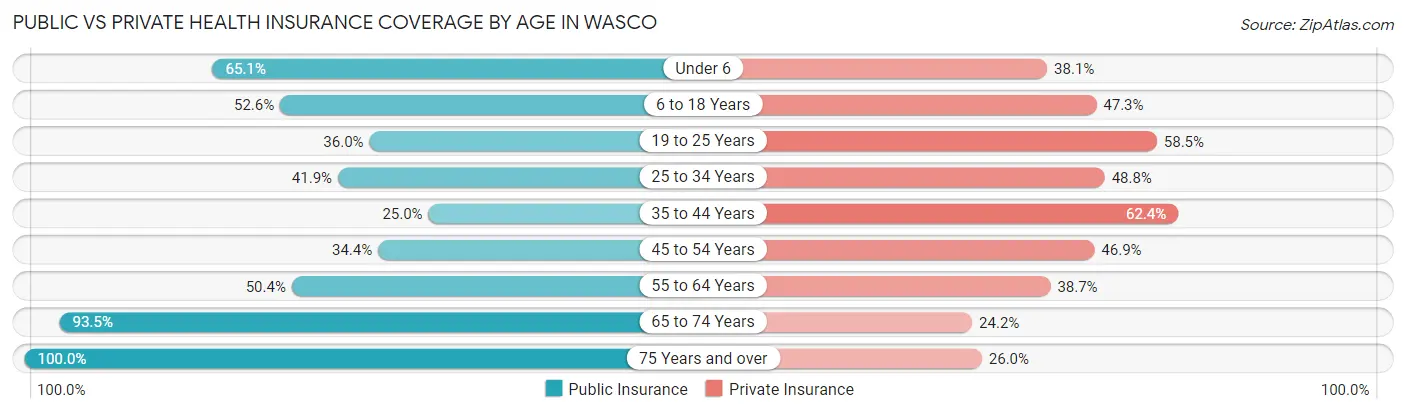
| Age Bracket | Public Insurance | Private Insurance |
| Under 6 | 1,513 (65.1%) | 886 (38.1%) |
| 6 to 18 Years | 2,647 (52.6%) | 2,378 (47.2%) |
| 19 to 25 Years | 847 (36.0%) | 1,376 (58.5%) |
| 25 to 34 Years | 1,678 (41.8%) | 1,957 (48.8%) |
| 35 to 44 Years | 672 (25.0%) | 1,675 (62.4%) |
| 45 to 54 Years | 691 (34.4%) | 942 (46.9%) |
| 55 to 64 Years | 966 (50.4%) | 742 (38.7%) |
| 65 to 74 Years | 1,109 (93.5%) | 287 (24.2%) |
| 75 Years and over | 477 (100.0%) | 124 (26.0%) |
| Total | 10,600 (48.2%) | 10,367 (47.1%) |
Disability Status by Sex by Age in Wasco
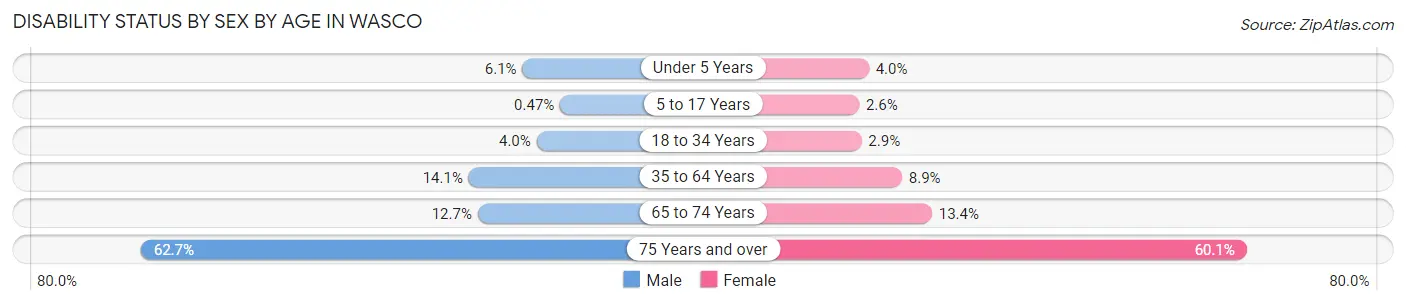
| Age Bracket | Male | Female |
| Under 5 Years | 47 (6.1%) | 46 (4.0%) |
| 5 to 17 Years | 13 (0.5%) | 62 (2.5%) |
| 18 to 34 Years | 138 (4.0%) | 92 (2.9%) |
| 35 to 64 Years | 486 (14.1%) | 281 (8.9%) |
| 65 to 74 Years | 68 (12.7%) | 87 (13.4%) |
| 75 Years and over | 197 (62.7%) | 98 (60.1%) |
Disability Class by Sex by Age in Wasco
Disability Class: Hearing Difficulty
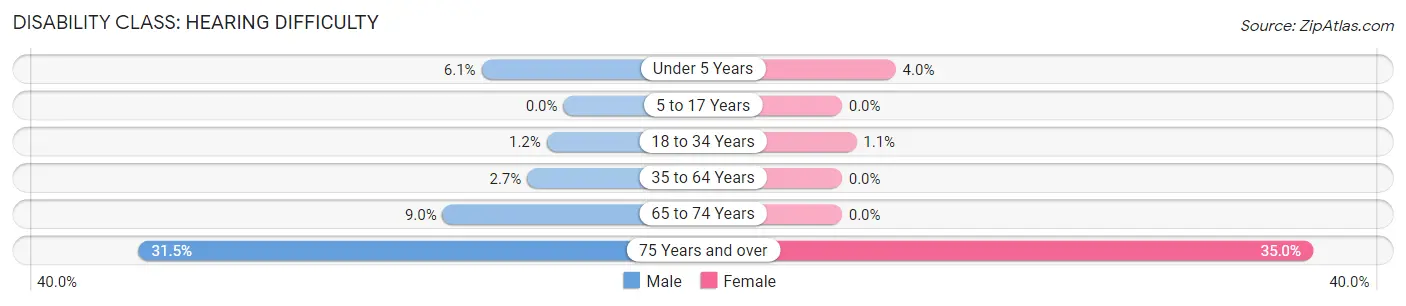
| Age Bracket | Male | Female |
| Under 5 Years | 47 (6.1%) | 46 (4.0%) |
| 5 to 17 Years | 0 (0.0%) | 0 (0.0%) |
| 18 to 34 Years | 43 (1.2%) | 34 (1.1%) |
| 35 to 64 Years | 93 (2.7%) | 0 (0.0%) |
| 65 to 74 Years | 48 (9.0%) | 0 (0.0%) |
| 75 Years and over | 99 (31.5%) | 57 (35.0%) |
Disability Class: Vision Difficulty
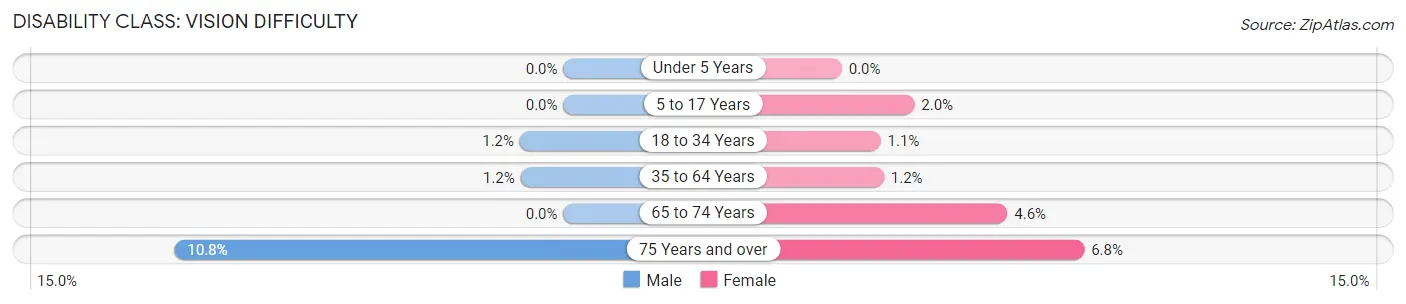
| Age Bracket | Male | Female |
| Under 5 Years | 0 (0.0%) | 0 (0.0%) |
| 5 to 17 Years | 0 (0.0%) | 49 (2.0%) |
| 18 to 34 Years | 42 (1.2%) | 34 (1.1%) |
| 35 to 64 Years | 41 (1.2%) | 37 (1.2%) |
| 65 to 74 Years | 0 (0.0%) | 30 (4.6%) |
| 75 Years and over | 34 (10.8%) | 11 (6.8%) |
Disability Class: Cognitive Difficulty
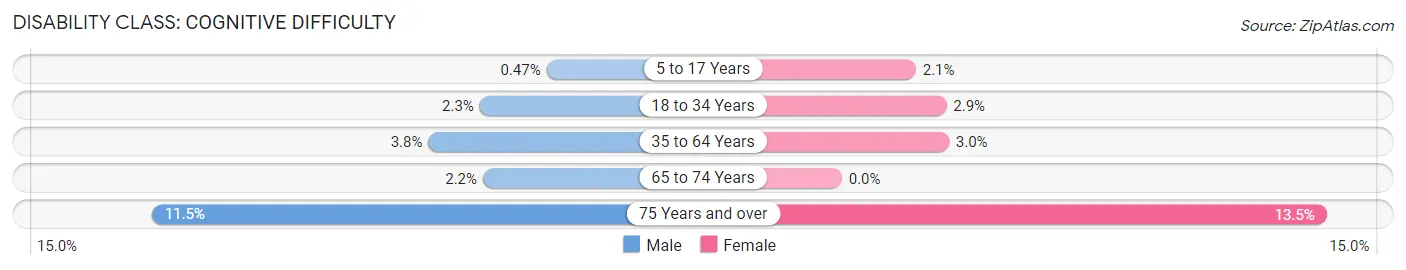
| Age Bracket | Male | Female |
| 5 to 17 Years | 13 (0.5%) | 50 (2.1%) |
| 18 to 34 Years | 81 (2.3%) | 92 (2.9%) |
| 35 to 64 Years | 130 (3.8%) | 94 (3.0%) |
| 65 to 74 Years | 12 (2.2%) | 0 (0.0%) |
| 75 Years and over | 36 (11.5%) | 22 (13.5%) |
Disability Class: Ambulatory Difficulty
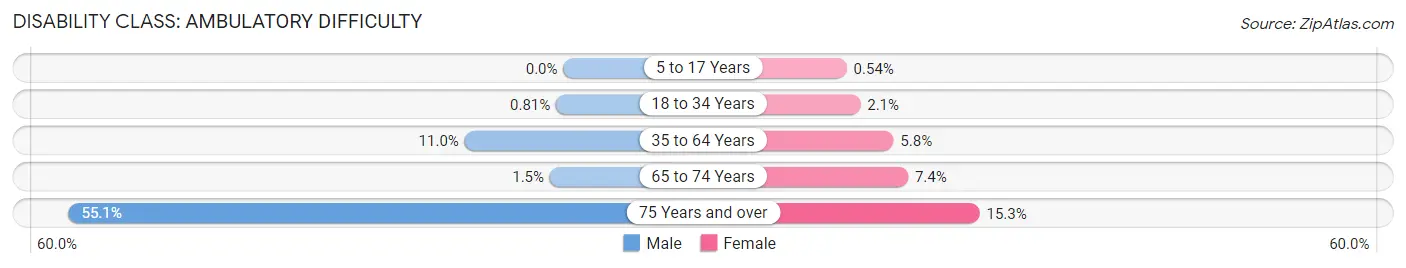
| Age Bracket | Male | Female |
| 5 to 17 Years | 0 (0.0%) | 13 (0.5%) |
| 18 to 34 Years | 28 (0.8%) | 65 (2.1%) |
| 35 to 64 Years | 380 (11.0%) | 181 (5.8%) |
| 65 to 74 Years | 8 (1.5%) | 48 (7.4%) |
| 75 Years and over | 173 (55.1%) | 25 (15.3%) |
Disability Class: Self-Care Difficulty
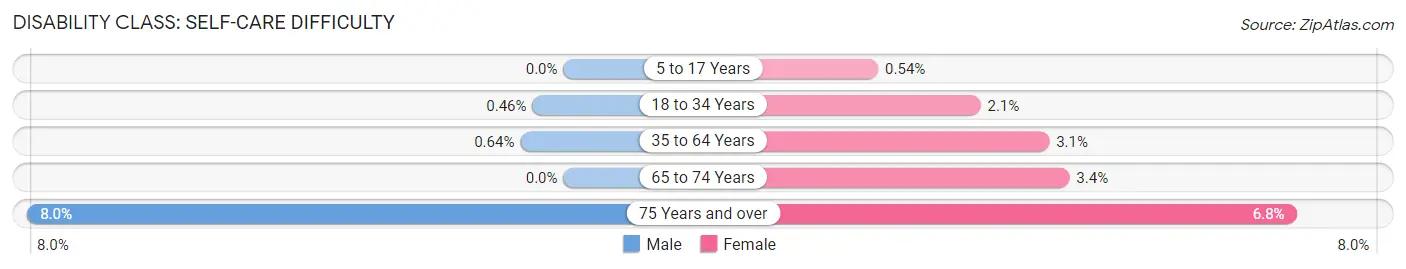
| Age Bracket | Male | Female |
| 5 to 17 Years | 0 (0.0%) | 13 (0.5%) |
| 18 to 34 Years | 16 (0.5%) | 65 (2.1%) |
| 35 to 64 Years | 22 (0.6%) | 97 (3.1%) |
| 65 to 74 Years | 0 (0.0%) | 22 (3.4%) |
| 75 Years and over | 25 (8.0%) | 11 (6.8%) |
Technology Access in Wasco
Computing Device Access in Wasco
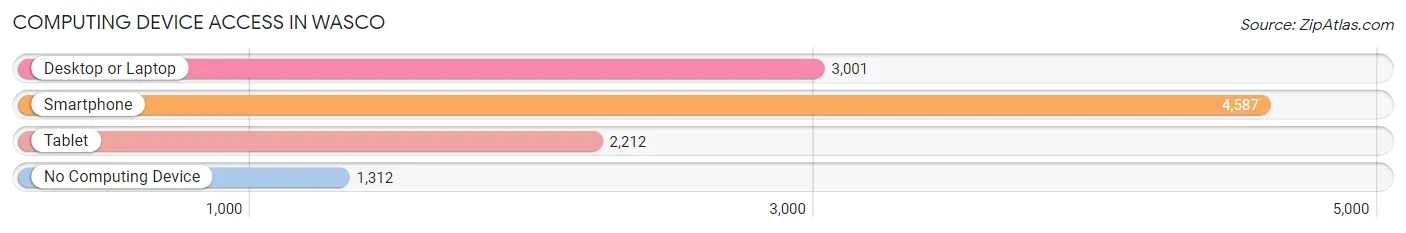
| Device Type | # Households | % Households |
| Desktop or Laptop | 3,001 | 49.4% |
| Smartphone | 4,587 | 75.4% |
| Tablet | 2,212 | 36.4% |
| No Computing Device | 1,312 | 21.6% |
| Total | 6,080 | 100.0% |
Internet Access in Wasco
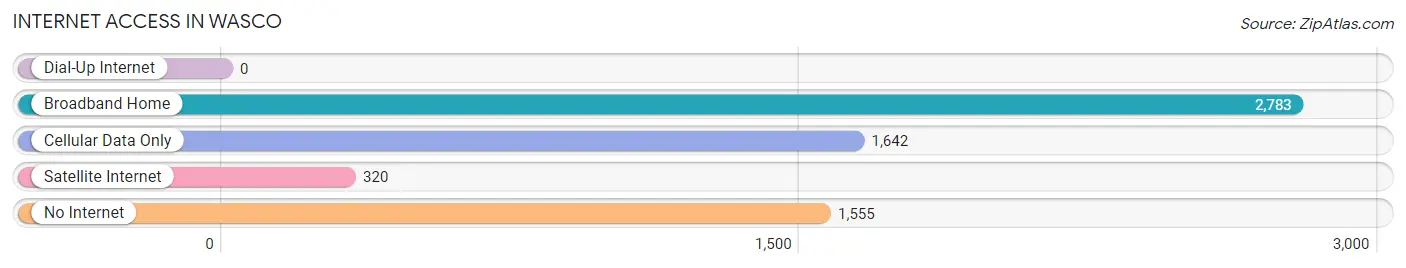
| Internet Type | # Households | % Households |
| Dial-Up Internet | 0 | 0.0% |
| Broadband Home | 2,783 | 45.8% |
| Cellular Data Only | 1,642 | 27.0% |
| Satellite Internet | 320 | 5.3% |
| No Internet | 1,555 | 25.6% |
| Total | 6,080 | 100.0% |
Wasco Summary
Wasco is a city located in Kern County, California, United States. It is situated in the San Joaquin Valley, approximately 8 miles (13 km) northwest of Bakersfield. The population was 25,545 at the 2010 census, up from 21,263 at the 2000 census.
History
The area that is now Wasco was originally inhabited by the Yokuts people. The first European to explore the area was Spanish explorer Pedro Fages in 1772. The area was later settled by ranchers in the late 19th century. The town of Wasco was founded in 1876 by the Southern Pacific Railroad. The name of the town was derived from the Spanish word for “water”, as the town was located near a natural spring.
In the early 20th century, Wasco was a major center for agriculture, with cotton, alfalfa, and citrus being the main crops. The town was also home to a large number of oil wells. In the 1950s, the town began to experience a population boom as people moved to the area from other parts of California.
Geography
Wasco is located at 35°59′N 119°30′W (35.983, -119.500). According to the United States Census Bureau, the city has a total area of 5.3 square miles (13.7 km2), all of it land.
The city is located in the San Joaquin Valley, approximately 8 miles (13 km) northwest of Bakersfield. It is bordered by the cities of Shafter to the north, McFarland to the east, and Delano to the south.
Economy
Wasco’s economy is largely based on agriculture. The city is home to a number of large farms and ranches, and is a major producer of cotton, alfalfa, and citrus. The city is also home to a number of oil wells, and is a major producer of oil and natural gas.
In addition to agriculture, Wasco is home to a number of businesses, including a number of restaurants, retail stores, and service providers. The city is also home to a number of manufacturing companies, including a number of food processing plants.
Demographics
As of the 2010 census, Wasco had a population of 25,545. The racial makeup of the city was 57.2% White, 1.3% African American, 1.2% Native American, 0.7% Asian, 0.1% Pacific Islander, 36.3% from other races, and 3.3% from two or more races. Hispanic or Latino of any race were 63.2% of the population.
The median income for a household in the city was $35,945, and the median income for a family was $41,945. The per capita income for the city was $15,945. About 22.2% of families and 26.3% of the population were below the poverty line, including 36.3% of those under age 18 and 11.3% of those age 65 or over.
Common Questions
What is Per Capita Income in Wasco?
Per Capita income in Wasco is $16,256.
What is the Median Family Income in Wasco?
Median Family Income in Wasco is $49,675.
What is the Median Household income in Wasco?
Median Household Income in Wasco is $48,109.
What is Income or Wage Gap in Wasco?
Income or Wage Gap in Wasco is 24.8%.
Women in Wasco earn 75.2 cents for every dollar earned by a man.
What is Family Income Deficit in Wasco?
Family Income Deficit in Wasco is $7,365.
Families that are below poverty line in Wasco earn $7,365 less on average than the poverty threshold level.
What is Inequality or Gini Index in Wasco?
Inequality or Gini Index in Wasco is 0.44.
What is the Total Population of Wasco?
Total Population of Wasco is 26,317.
What is the Total Male Population of Wasco?
Total Male Population of Wasco is 15,615.
What is the Total Female Population of Wasco?
Total Female Population of Wasco is 10,702.
What is the Ratio of Males per 100 Females in Wasco?
There are 145.91 Males per 100 Females in Wasco.
What is the Ratio of Females per 100 Males in Wasco?
There are 68.54 Females per 100 Males in Wasco.
What is the Median Population Age in Wasco?
Median Population Age in Wasco is 30.2 Years.
What is the Average Family Size in Wasco
Average Family Size in Wasco is 4.0 People.
What is the Average Household Size in Wasco
Average Household Size in Wasco is 3.6 People.
How Large is the Labor Force in Wasco?
There are 9,515 People in the Labor Forcein in Wasco.
What is the Percentage of People in the Labor Force in Wasco?
48.3% of People are in the Labor Force in Wasco.
What is the Unemployment Rate in Wasco?
Unemployment Rate in Wasco is 8.6%.