Wallace, CA Map & Demographics
Wallace Map
Wallace Overview
$43,670
PER CAPITA INCOME
$108,142
AVG FAMILY INCOME
$67,614
AVG HOUSEHOLD INCOME
0.32
INEQUALITY / GINI INDEX
350
TOTAL POPULATION
123
MALE POPULATION
227
FEMALE POPULATION
54.19
MALES / 100 FEMALES
184.55
FEMALES / 100 MALES
65.7
MEDIAN AGE
2.7
AVG FAMILY SIZE
1.9
AVG HOUSEHOLD SIZE
217
LABOR FORCE [ PEOPLE ]
62.0%
PERCENT IN LABOR FORCE
12.9%
UNEMPLOYMENT RATE
Wallace Zip Codes
Wallace Area Codes
Income in Wallace
Income Overview in Wallace
Per Capita Income in Wallace is $43,670, while median incomes of families and households are $108,142 and $67,614 respectively.
| Characteristic | Number | Measure |
| Per Capita Income | 350 | $43,670 |
| Median Family Income | 93 | $108,142 |
| Mean Family Income | 93 | $115,601 |
| Median Household Income | 189 | $67,614 |
| Mean Household Income | 189 | $79,786 |
| Income Deficit | 93 | $0 |
| Wage / Income Gap (%) | 350 | 0.00% |
| Wage / Income Gap ($) | 350 | 100.00¢ per $1 |
| Gini / Inequality Index | 350 | 0.32 |
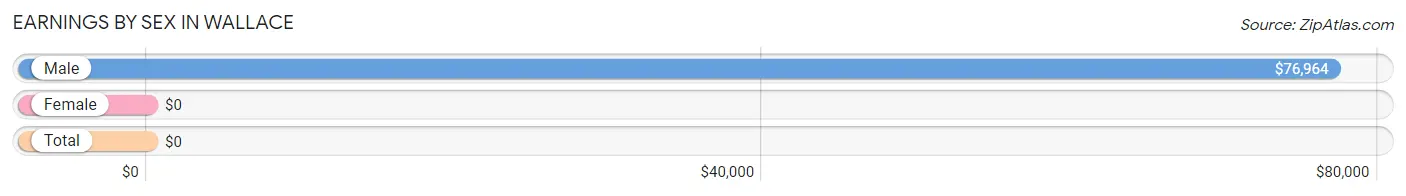
Earnings by Sex in Wallace
| Sex | Number | Average Earnings |
| Male | 48 (25.4%) | $76,964 |
| Female | 141 (74.6%) | $0 |
| Total | 189 (100.0%) | $0 |
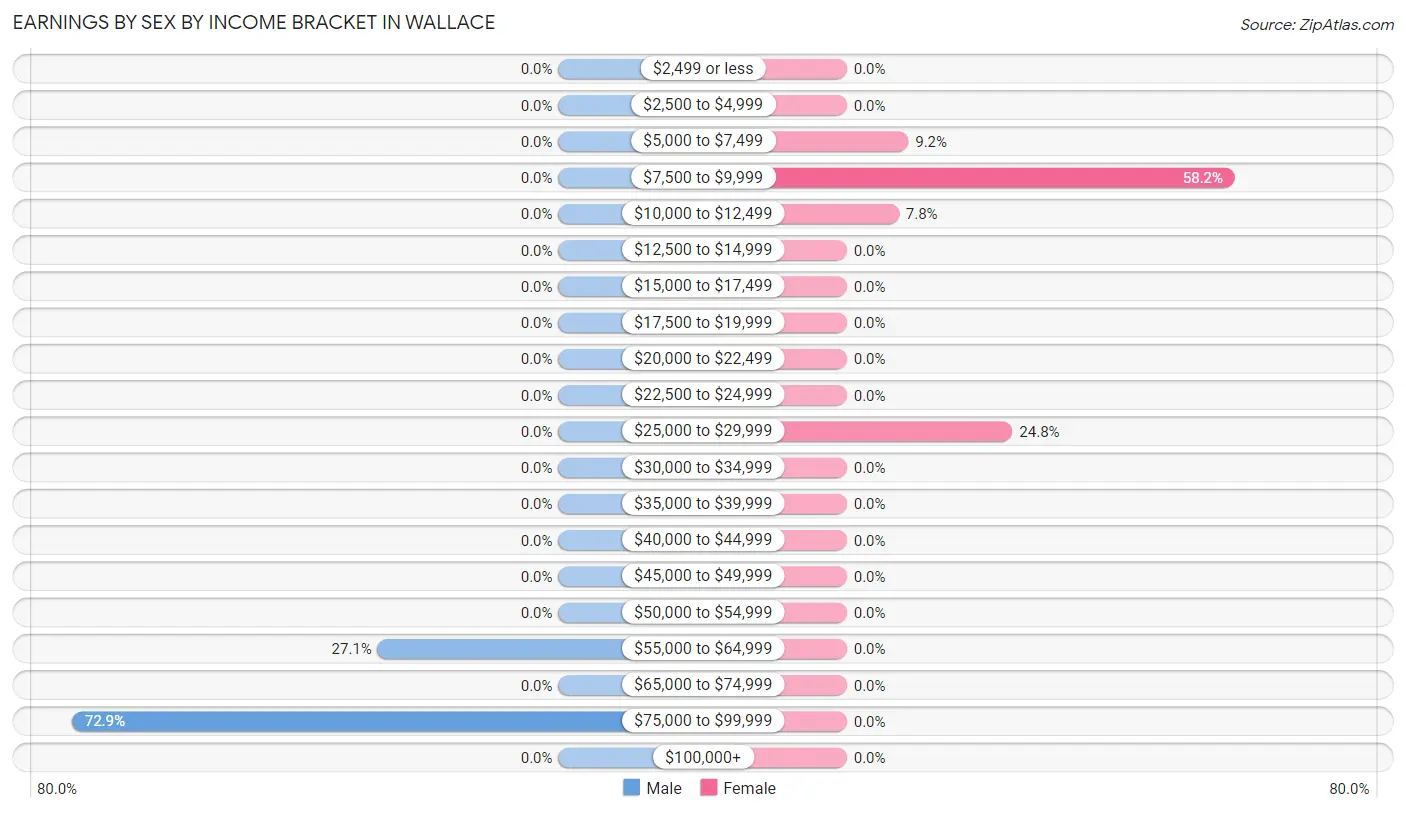
Earnings by Sex by Income Bracket in Wallace
The most common earnings brackets in Wallace are $75,000 to $99,999 for men (35 | 72.9%) and $7,500 to $9,999 for women (82 | 58.2%).
| Income | Male | Female |
| $2,499 or less | 0 (0.0%) | 0 (0.0%) |
| $2,500 to $4,999 | 0 (0.0%) | 0 (0.0%) |
| $5,000 to $7,499 | 0 (0.0%) | 13 (9.2%) |
| $7,500 to $9,999 | 0 (0.0%) | 82 (58.2%) |
| $10,000 to $12,499 | 0 (0.0%) | 11 (7.8%) |
| $12,500 to $14,999 | 0 (0.0%) | 0 (0.0%) |
| $15,000 to $17,499 | 0 (0.0%) | 0 (0.0%) |
| $17,500 to $19,999 | 0 (0.0%) | 0 (0.0%) |
| $20,000 to $22,499 | 0 (0.0%) | 0 (0.0%) |
| $22,500 to $24,999 | 0 (0.0%) | 0 (0.0%) |
| $25,000 to $29,999 | 0 (0.0%) | 35 (24.8%) |
| $30,000 to $34,999 | 0 (0.0%) | 0 (0.0%) |
| $35,000 to $39,999 | 0 (0.0%) | 0 (0.0%) |
| $40,000 to $44,999 | 0 (0.0%) | 0 (0.0%) |
| $45,000 to $49,999 | 0 (0.0%) | 0 (0.0%) |
| $50,000 to $54,999 | 0 (0.0%) | 0 (0.0%) |
| $55,000 to $64,999 | 13 (27.1%) | 0 (0.0%) |
| $65,000 to $74,999 | 0 (0.0%) | 0 (0.0%) |
| $75,000 to $99,999 | 35 (72.9%) | 0 (0.0%) |
| $100,000+ | 0 (0.0%) | 0 (0.0%) |
| Total | 48 (100.0%) | 141 (100.0%) |
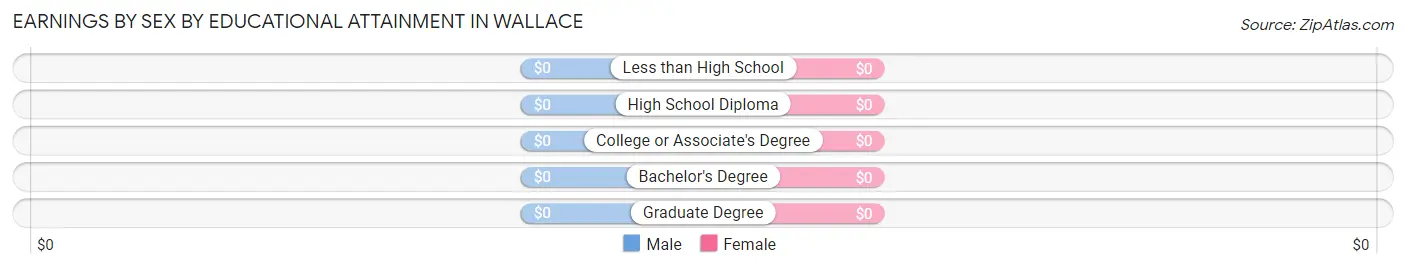
Earnings by Sex by Educational Attainment in Wallace
| Educational Attainment | Male Income | Female Income |
| Less than High School | - | - |
| High School Diploma | - | - |
| College or Associate's Degree | - | - |
| Bachelor's Degree | - | - |
| Graduate Degree | - | - |
| Total | $76,964 | $0 |
Family Income in Wallace
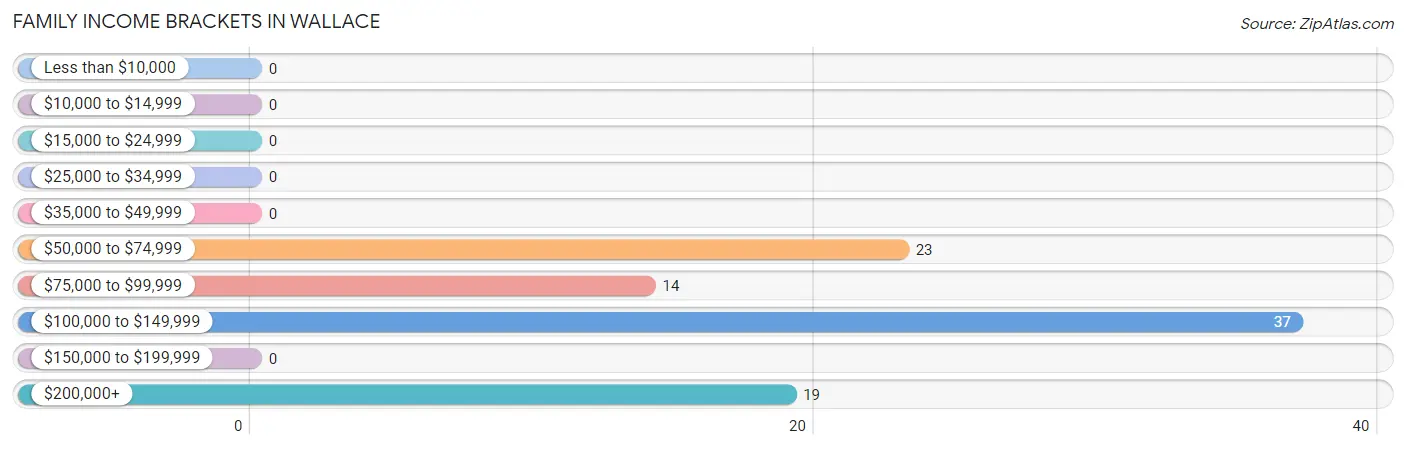
Family Income Brackets in Wallace
According to the Wallace family income data, there are 37 families falling into the $100,000 to $149,999 income range, which is the most common income bracket and makes up 39.8% of all families.
| Income Bracket | # Families | % Families |
| Less than $10,000 | 0 | 0.0% |
| $10,000 to $14,999 | 0 | 0.0% |
| $15,000 to $24,999 | 0 | 0.0% |
| $25,000 to $34,999 | 0 | 0.0% |
| $35,000 to $49,999 | 0 | 0.0% |
| $50,000 to $74,999 | 23 | 24.7% |
| $75,000 to $99,999 | 14 | 15.1% |
| $100,000 to $149,999 | 37 | 39.8% |
| $150,000 to $199,999 | 0 | 0.0% |
| $200,000+ | 19 | 20.4% |
Family Income by Famaliy Size in Wallace
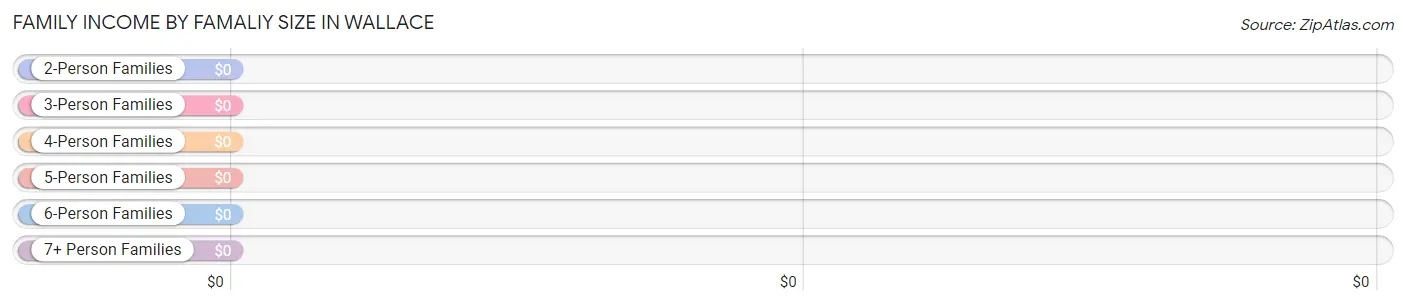
| Income Bracket | # Families | Median Income |
| 2-Person Families | 56 (60.2%) | $0 |
| 3-Person Families | 37 (39.8%) | $0 |
| 4-Person Families | 0 (0.0%) | $0 |
| 5-Person Families | 0 (0.0%) | $0 |
| 6-Person Families | 0 (0.0%) | $0 |
| 7+ Person Families | 0 (0.0%) | $0 |
| Total | 93 (100.0%) | $108,142 |
Family Income by Number of Earners in Wallace
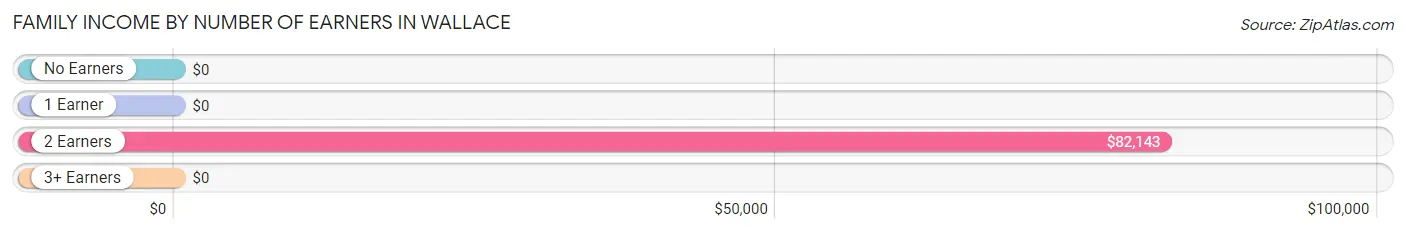
| Number of Earners | # Families | Median Income |
| No Earners | 47 (50.5%) | $0 |
| 1 Earner | 0 (0.0%) | $0 |
| 2 Earners | 46 (49.5%) | $82,143 |
| 3+ Earners | 0 (0.0%) | $0 |
| Total | 93 (100.0%) | $108,142 |
Household Income in Wallace
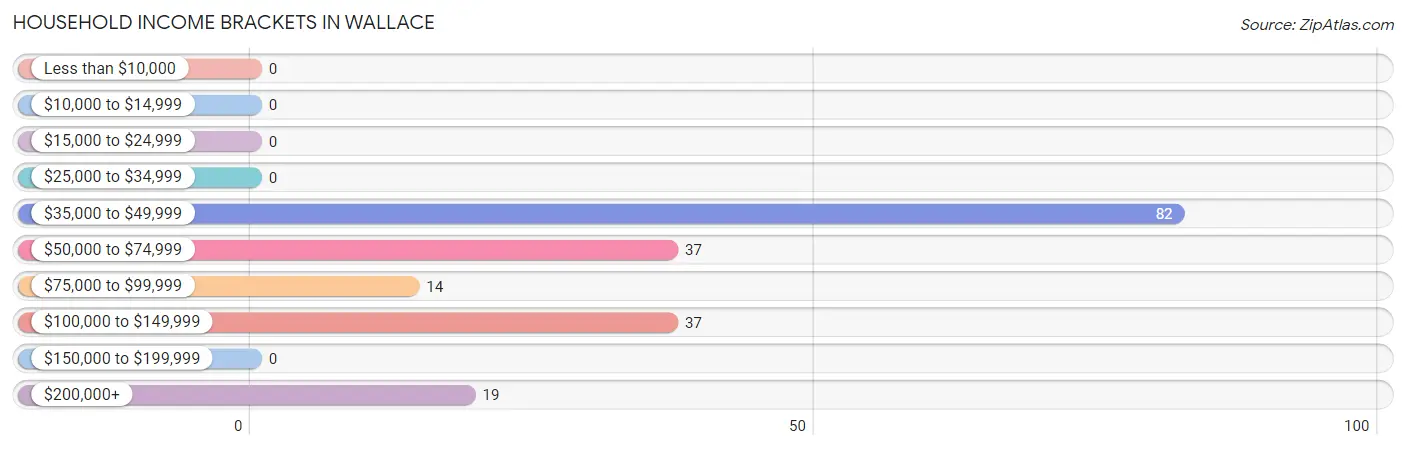
Household Income Brackets in Wallace
With 82 households falling in the category, the $35,000 to $49,999 income range is the most frequent in Wallace, accounting for 43.4% of all households.
| Income Bracket | # Households | % Households |
| Less than $10,000 | 0 | 0.0% |
| $10,000 to $14,999 | 0 | 0.0% |
| $15,000 to $24,999 | 0 | 0.0% |
| $25,000 to $34,999 | 0 | 0.0% |
| $35,000 to $49,999 | 82 | 43.4% |
| $50,000 to $74,999 | 37 | 19.6% |
| $75,000 to $99,999 | 14 | 7.4% |
| $100,000 to $149,999 | 37 | 19.6% |
| $150,000 to $199,999 | 0 | 0.0% |
| $200,000+ | 19 | 10.1% |
Household Income by Householder Age in Wallace
| Income Bracket | # Households | Median Income |
| 15 to 24 Years | 0 (0.0%) | $0 |
| 25 to 44 Years | 0 (0.0%) | $0 |
| 45 to 64 Years | 32 (16.9%) | $0 |
| 65+ Years | 157 (83.1%) | $0 |
| Total | 189 (100.0%) | $67,614 |
Poverty in Wallace
Income Below Poverty by Sex and Age in Wallace
| Age Bracket | Male | Female |
| Under 5 Years | 0 (0.0%) | 0 (0.0%) |
| 5 Years | 0 (0.0%) | 0 (0.0%) |
| 6 to 11 Years | 0 (0.0%) | 0 (0.0%) |
| 12 to 14 Years | 0 (0.0%) | 0 (0.0%) |
| 15 Years | 0 (0.0%) | 0 (0.0%) |
| 16 and 17 Years | 0 (0.0%) | 0 (0.0%) |
| 18 to 24 Years | 0 (0.0%) | 0 (0.0%) |
| 25 to 34 Years | 0 (0.0%) | 0 (0.0%) |
| 35 to 44 Years | 0 (0.0%) | 0 (0.0%) |
| 45 to 54 Years | 0 (0.0%) | 0 (0.0%) |
| 55 to 64 Years | 0 (0.0%) | 0 (0.0%) |
| 65 to 74 Years | 0 (0.0%) | 0 (0.0%) |
| 75 Years and over | 0 (0.0%) | 0 (0.0%) |
| Total | 0 (0.0%) | 0 (0.0%) |
Income Above Poverty by Sex and Age in Wallace
According to the poverty statistics in Wallace, males aged 35 to 44 years and females aged 18 to 24 years are the age groups that are most secure financially, with 100.0% of males and 100.0% of females in these age groups living above the poverty line.
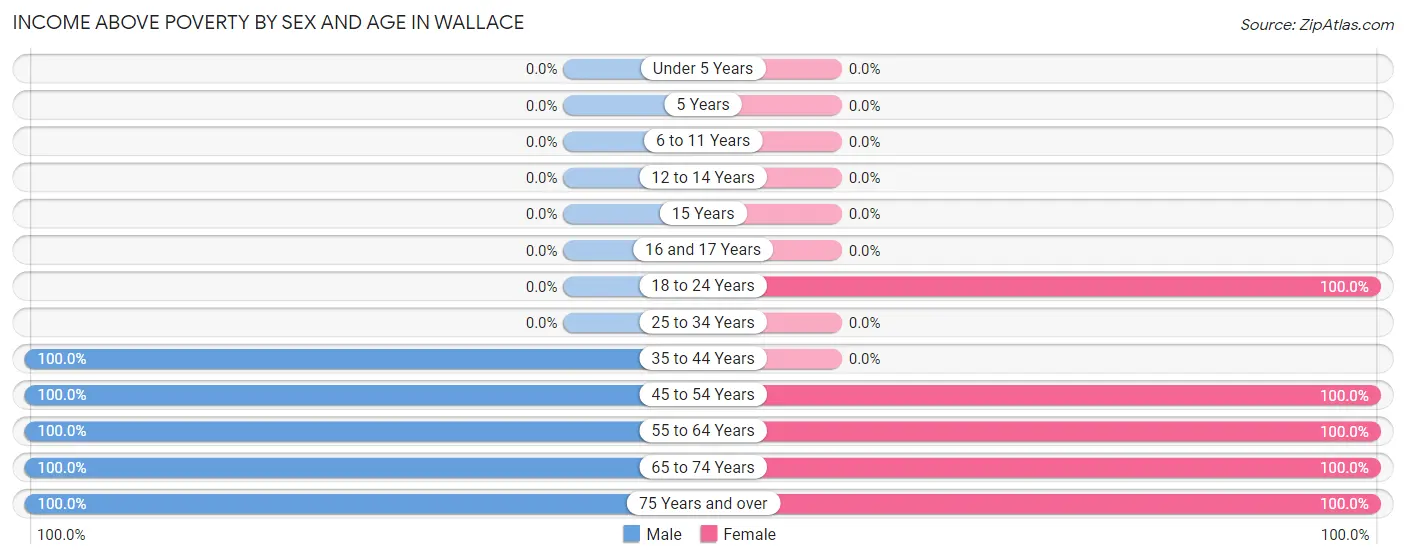
| Age Bracket | Male | Female |
| Under 5 Years | 0 (0.0%) | 0 (0.0%) |
| 5 Years | 0 (0.0%) | 0 (0.0%) |
| 6 to 11 Years | 0 (0.0%) | 0 (0.0%) |
| 12 to 14 Years | 0 (0.0%) | 0 (0.0%) |
| 15 Years | 0 (0.0%) | 0 (0.0%) |
| 16 and 17 Years | 0 (0.0%) | 0 (0.0%) |
| 18 to 24 Years | 0 (0.0%) | 28 (100.0%) |
| 25 to 34 Years | 0 (0.0%) | 0 (0.0%) |
| 35 to 44 Years | 28 (100.0%) | 0 (0.0%) |
| 45 to 54 Years | 21 (100.0%) | 35 (100.0%) |
| 55 to 64 Years | 13 (100.0%) | 40 (100.0%) |
| 65 to 74 Years | 49 (100.0%) | 110 (100.0%) |
| 75 Years and over | 12 (100.0%) | 14 (100.0%) |
| Total | 123 (100.0%) | 227 (100.0%) |
Income Below Poverty Among Married-Couple Families in Wallace
| Children | Above Poverty | Below Poverty |
| No Children | 93 (100.0%) | 0 (0.0%) |
| 1 or 2 Children | 0 (0.0%) | 0 (0.0%) |
| 3 or 4 Children | 0 (0.0%) | 0 (0.0%) |
| 5 or more Children | 0 (0.0%) | 0 (0.0%) |
| Total | 93 (100.0%) | 0 (0.0%) |
Income Below Poverty Among Single-Parent Households in Wallace
| Children | Single Father | Single Mother |
| No Children | 0 (0.0%) | 0 (0.0%) |
| 1 or 2 Children | 0 (0.0%) | 0 (0.0%) |
| 3 or 4 Children | 0 (0.0%) | 0 (0.0%) |
| 5 or more Children | 0 (0.0%) | 0 (0.0%) |
| Total | 0 (0.0%) | 0 (0.0%) |
Income Below Poverty Among Married-Couple vs Single-Parent Households in Wallace
| Children | Married-Couple Families | Single-Parent Households |
| No Children | 0 (0.0%) | 0 (0.0%) |
| 1 or 2 Children | 0 (0.0%) | 0 (0.0%) |
| 3 or 4 Children | 0 (0.0%) | 0 (0.0%) |
| 5 or more Children | 0 (0.0%) | 0 (0.0%) |
| Total | 0 (0.0%) | 0 (0.0%) |
Race in Wallace
The most populous races in Wallace are White / Caucasian (318 | 90.9%), Hispanic or Latino (32 | 9.1%), and Native / Alaskan (19 | 5.4%).
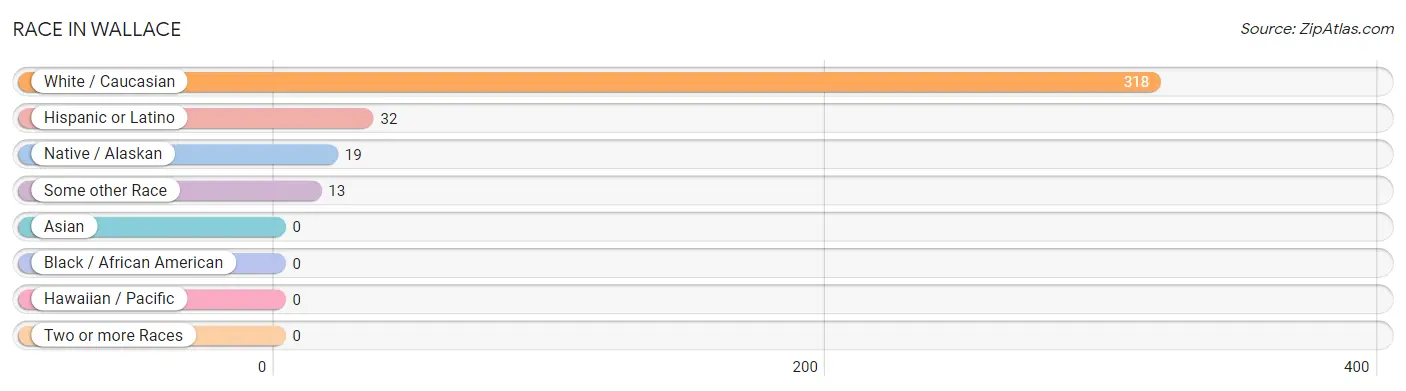
| Race | # Population | % Population |
| Asian | 0 | 0.0% |
| Black / African American | 0 | 0.0% |
| Hawaiian / Pacific | 0 | 0.0% |
| Hispanic or Latino | 32 | 9.1% |
| Native / Alaskan | 19 | 5.4% |
| White / Caucasian | 318 | 90.9% |
| Two or more Races | 0 | 0.0% |
| Some other Race | 13 | 3.7% |
| Total | 350 | 100.0% |
Ancestry in Wallace
The most populous ancestries reported in Wallace are Greek (82 | 23.4%), German (64 | 18.3%), Italian (44 | 12.6%), Spanish American Indian (19 | 5.4%), and Irish (16 | 4.6%), together accounting for 64.3% of all Wallace residents.
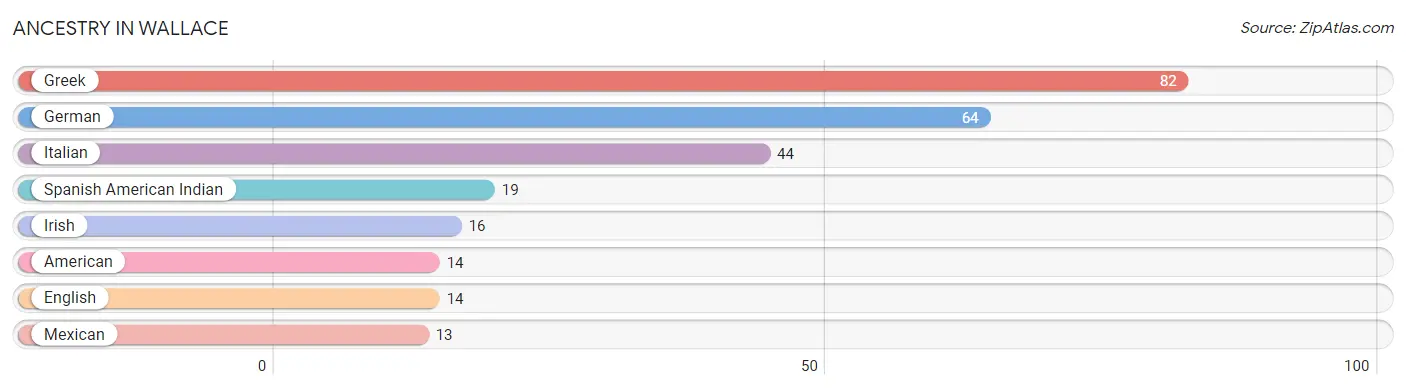
| Ancestry | # Population | % Population |
| American | 14 | 4.0% |
| English | 14 | 4.0% |
| German | 64 | 18.3% |
| Greek | 82 | 23.4% |
| Irish | 16 | 4.6% |
| Italian | 44 | 12.6% |
| Mexican | 13 | 3.7% |
| Spanish American Indian | 19 | 5.4% | View All 8 Rows |
Immigrants in Wallace
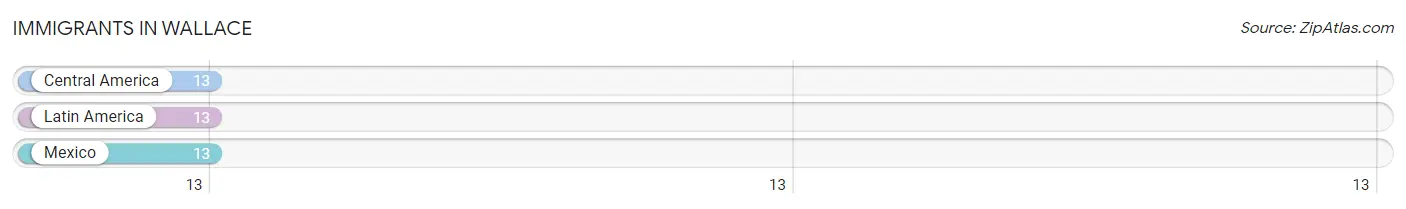
The most numerous immigrant groups reported in Wallace came from Central America (13 | 3.7%), Latin America (13 | 3.7%), and Mexico (13 | 3.7%), together accounting for 11.1% of all Wallace residents.
| Immigration Origin | # Population | % Population |
| Central America | 13 | 3.7% |
| Latin America | 13 | 3.7% |
| Mexico | 13 | 3.7% | View All 3 Rows |
Sex and Age in Wallace
Sex and Age in Wallace
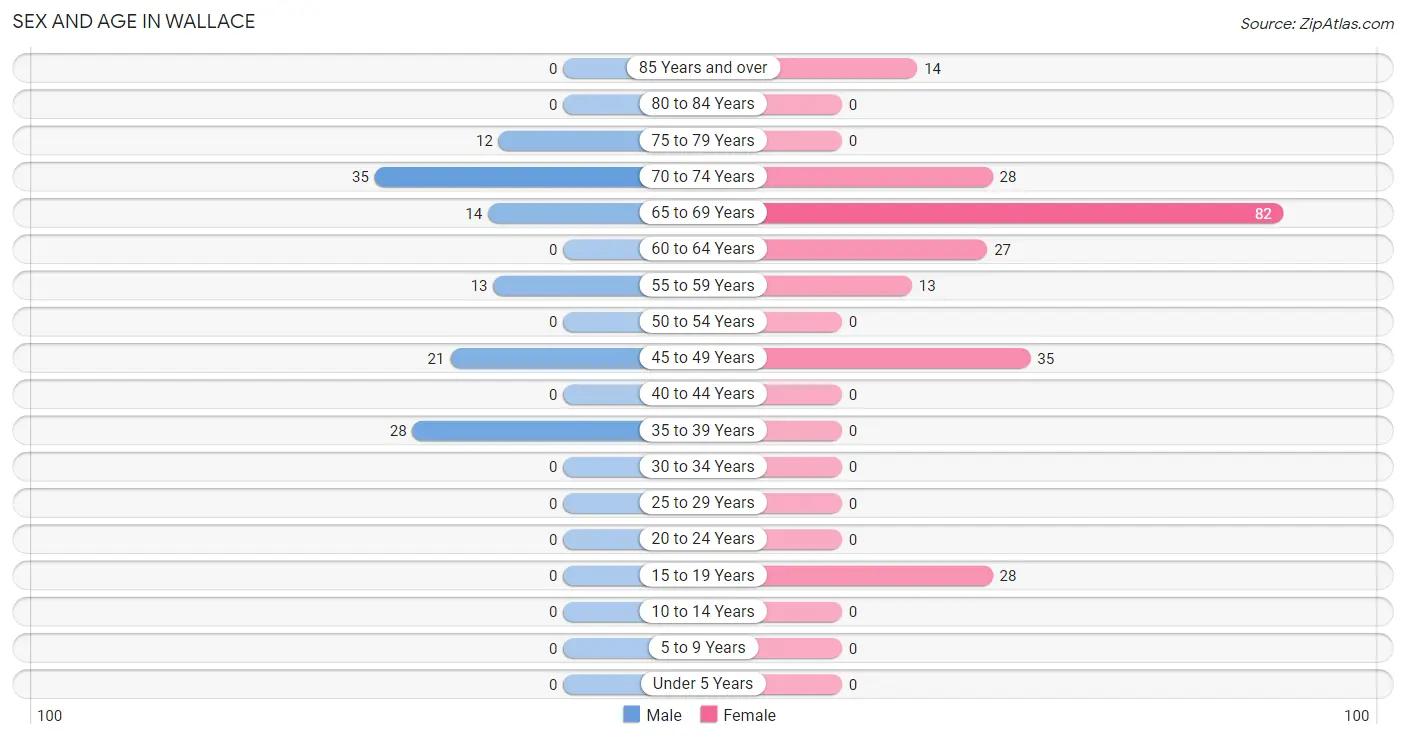
The most populous age groups in Wallace are 70 to 74 Years (35 | 28.5%) for men and 65 to 69 Years (82 | 36.1%) for women.
| Age Bracket | Male | Female |
| Under 5 Years | 0 (0.0%) | 0 (0.0%) |
| 5 to 9 Years | 0 (0.0%) | 0 (0.0%) |
| 10 to 14 Years | 0 (0.0%) | 0 (0.0%) |
| 15 to 19 Years | 0 (0.0%) | 28 (12.3%) |
| 20 to 24 Years | 0 (0.0%) | 0 (0.0%) |
| 25 to 29 Years | 0 (0.0%) | 0 (0.0%) |
| 30 to 34 Years | 0 (0.0%) | 0 (0.0%) |
| 35 to 39 Years | 28 (22.8%) | 0 (0.0%) |
| 40 to 44 Years | 0 (0.0%) | 0 (0.0%) |
| 45 to 49 Years | 21 (17.1%) | 35 (15.4%) |
| 50 to 54 Years | 0 (0.0%) | 0 (0.0%) |
| 55 to 59 Years | 13 (10.6%) | 13 (5.7%) |
| 60 to 64 Years | 0 (0.0%) | 27 (11.9%) |
| 65 to 69 Years | 14 (11.4%) | 82 (36.1%) |
| 70 to 74 Years | 35 (28.5%) | 28 (12.3%) |
| 75 to 79 Years | 12 (9.8%) | 0 (0.0%) |
| 80 to 84 Years | 0 (0.0%) | 0 (0.0%) |
| 85 Years and over | 0 (0.0%) | 14 (6.2%) |
| Total | 123 (100.0%) | 227 (100.0%) |
Families and Households in Wallace
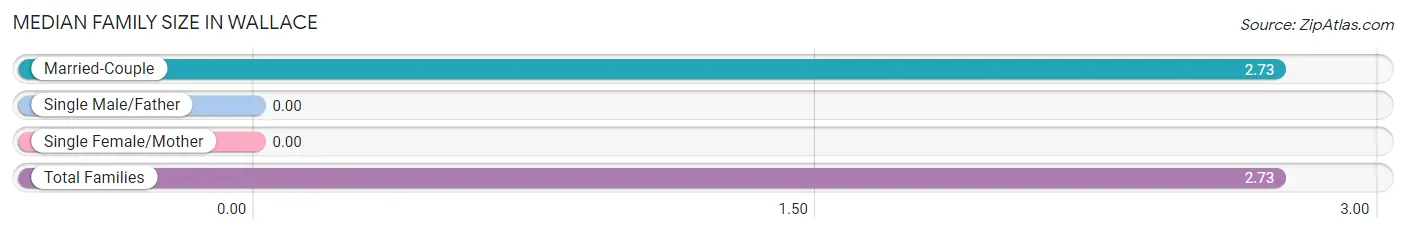
Median Family Size in Wallace
| Family Type | # Families | Family Size |
| Married-Couple | 93 (100.0%) | 2.73 |
| Single Male/Father | 0 (0.0%) | - |
| Single Female/Mother | 0 (0.0%) | - |
| Total Families | 93 (100.0%) | 2.73 |
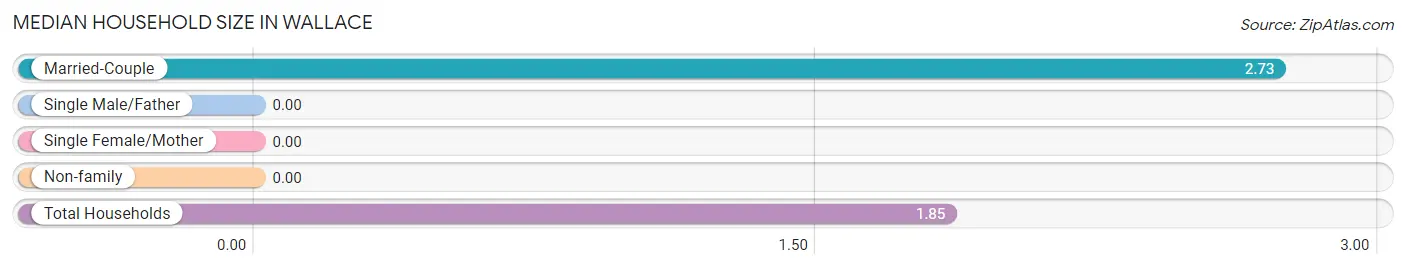
Median Household Size in Wallace
| Household Type | # Households | Household Size |
| Married-Couple | 93 (49.2%) | 2.73 |
| Single Male/Father | 0 (0.0%) | - |
| Single Female/Mother | 0 (0.0%) | - |
| Non-family | 96 (50.8%) | - |
| Total Households | 189 (100.0%) | 1.85 |
Household Size by Marriage Status in Wallace
Out of a total of 189 households in Wallace, 93 (49.2%) are family households, while 96 (50.8%) are nonfamily households. The most numerous type of family households are 2-person households, comprising 56, and the most common type of nonfamily households are 1-person households, comprising 96.
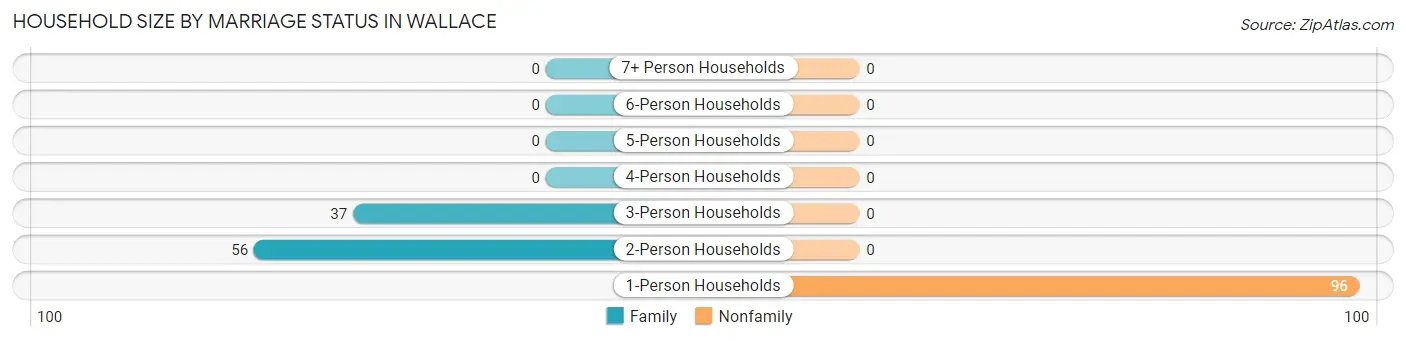
| Household Size | Family Households | Nonfamily Households |
| 1-Person Households | - | 96 (50.8%) |
| 2-Person Households | 56 (29.6%) | 0 (0.0%) |
| 3-Person Households | 37 (19.6%) | 0 (0.0%) |
| 4-Person Households | 0 (0.0%) | 0 (0.0%) |
| 5-Person Households | 0 (0.0%) | 0 (0.0%) |
| 6-Person Households | 0 (0.0%) | 0 (0.0%) |
| 7+ Person Households | 0 (0.0%) | 0 (0.0%) |
| Total | 93 (49.2%) | 96 (50.8%) |
Female Fertility in Wallace
Fertility by Age in Wallace
| Age Bracket | Women with Births | Births / 1,000 Women |
| 15 to 19 years | 0 (0.0%) | 0.0 |
| 20 to 34 years | 0 (0.0%) | 0.0 |
| 35 to 50 years | 0 (0.0%) | 0.0 |
| Total | 0 (0.0%) | 0.0 |
Fertility by Age by Marriage Status in Wallace
| Age Bracket | Married | Unmarried |
| 15 to 19 years | 0 (0.0%) | 0 (0.0%) |
| 20 to 34 years | 0 (0.0%) | 0 (0.0%) |
| 35 to 50 years | 0 (0.0%) | 0 (0.0%) |
| Total | 0 (0.0%) | 0 (0.0%) |
Fertility by Education in Wallace
| Educational Attainment | Women with Births | Births / 1,000 Women |
| Less than High School | 0 (0.0%) | 0.0 |
| High School Diploma | 0 (0.0%) | 0.0 |
| College or Associate's Degree | 0 (0.0%) | 0.0 |
| Bachelor's Degree | 0 (0.0%) | 0.0 |
| Graduate Degree | 0 (0.0%) | 0.0 |
| Total | 0 (0.0%) | 0.0 |
Fertility by Education by Marriage Status in Wallace
| Educational Attainment | Married | Unmarried |
| Less than High School | 0 (0.0%) | 0 (0.0%) |
| High School Diploma | 0 (0.0%) | 0 (0.0%) |
| College or Associate's Degree | 0 (0.0%) | 0 (0.0%) |
| Bachelor's Degree | 0 (0.0%) | 0 (0.0%) |
| Graduate Degree | 0 (0.0%) | 0 (0.0%) |
| Total | 0 (0.0%) | 0 (0.0%) |
Employment Characteristics in Wallace
Employment by Class of Employer in Wallace
Among the 189 employed individuals in Wallace, private company employees (107 | 56.6%), and self-employed (not incorporated) (82 | 43.4%) make up the most common classes of employment.
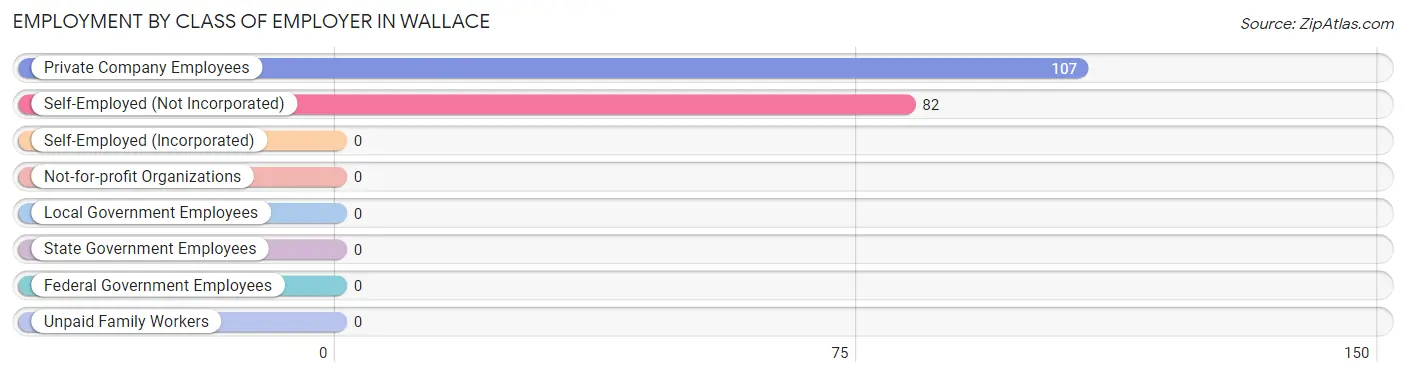
| Employer Class | # Employees | % Employees |
| Private Company Employees | 107 | 56.6% |
| Self-Employed (Incorporated) | 0 | 0.0% |
| Self-Employed (Not Incorporated) | 82 | 43.4% |
| Not-for-profit Organizations | 0 | 0.0% |
| Local Government Employees | 0 | 0.0% |
| State Government Employees | 0 | 0.0% |
| Federal Government Employees | 0 | 0.0% |
| Unpaid Family Workers | 0 | 0.0% |
| Total | 189 | 100.0% |
Employment Status by Age in Wallace
According to the labor force statistics for Wallace, out of the total population over 16 years of age (350), 62.0% or 217 individuals are in the labor force, with 12.9% or 28 of them unemployed. The age group with the highest labor force participation rate is 35 to 44 years, with 100.0% or 28 individuals in the labor force. Within the labor force, the 35 to 44 years age range has the highest percentage of unemployed individuals, with 100.0% or 28 of them being unemployed.
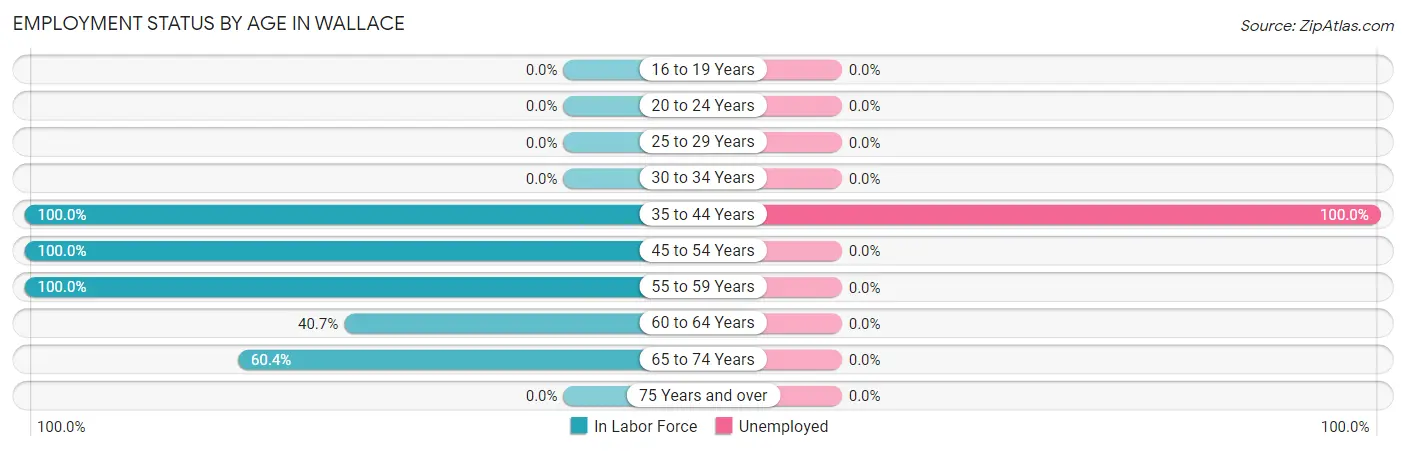
| Age Bracket | In Labor Force | Unemployed |
| 16 to 19 Years | 0 (0.0%) | 0 (0.0%) |
| 20 to 24 Years | 0 (0.0%) | 0 (0.0%) |
| 25 to 29 Years | 0 (0.0%) | 0 (0.0%) |
| 30 to 34 Years | 0 (0.0%) | 0 (0.0%) |
| 35 to 44 Years | 28 (100.0%) | 28 (100.0%) |
| 45 to 54 Years | 56 (100.0%) | 0 (0.0%) |
| 55 to 59 Years | 26 (100.0%) | 0 (0.0%) |
| 60 to 64 Years | 11 (40.7%) | 0 (0.0%) |
| 65 to 74 Years | 96 (60.4%) | 0 (0.0%) |
| 75 Years and over | 0 (0.0%) | 0 (0.0%) |
| Total | 217 (62.0%) | 28 (12.9%) |
Employment Status by Educational Attainment in Wallace
According to labor force statistics for Wallace, 88.3% of individuals (121) out of the total population between 25 and 64 years of age (137) are in the labor force, with 23.1% or 28 of them being unemployed. The group with the highest labor force participation rate are those with the educational attainment of less than high school, with 100.0% or 13 individuals in the labor force. Within the labor force, individuals with bachelor's degree or higher education have the highest percentage of unemployment, with 71.8% or 28 of them being unemployed.
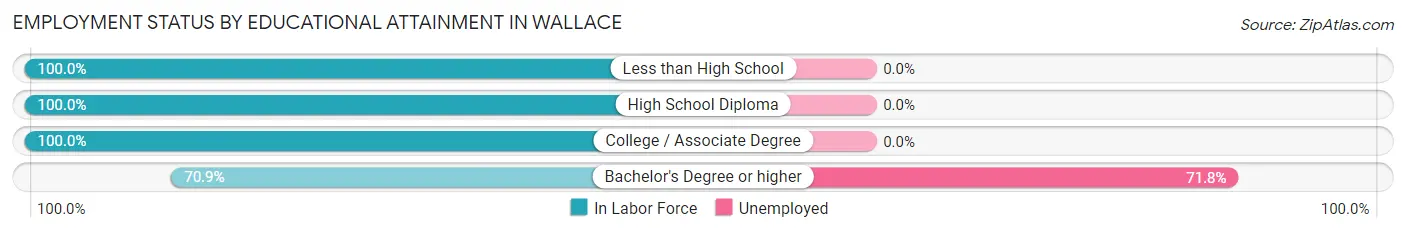
| Educational Attainment | In Labor Force | Unemployed |
| Less than High School | 13 (100.0%) | 0 (0.0%) |
| High School Diploma | 21 (100.0%) | 0 (0.0%) |
| College / Associate Degree | 48 (100.0%) | 0 (0.0%) |
| Bachelor's Degree or higher | 39 (70.9%) | 39 (71.8%) |
| Total | 121 (88.3%) | 32 (23.1%) |
Employment Occupations by Sex in Wallace
Management, Business, Science and Arts Occupations
The most common Management, Business, Science and Arts occupations in Wallace are , and Management (96 | 50.8%).
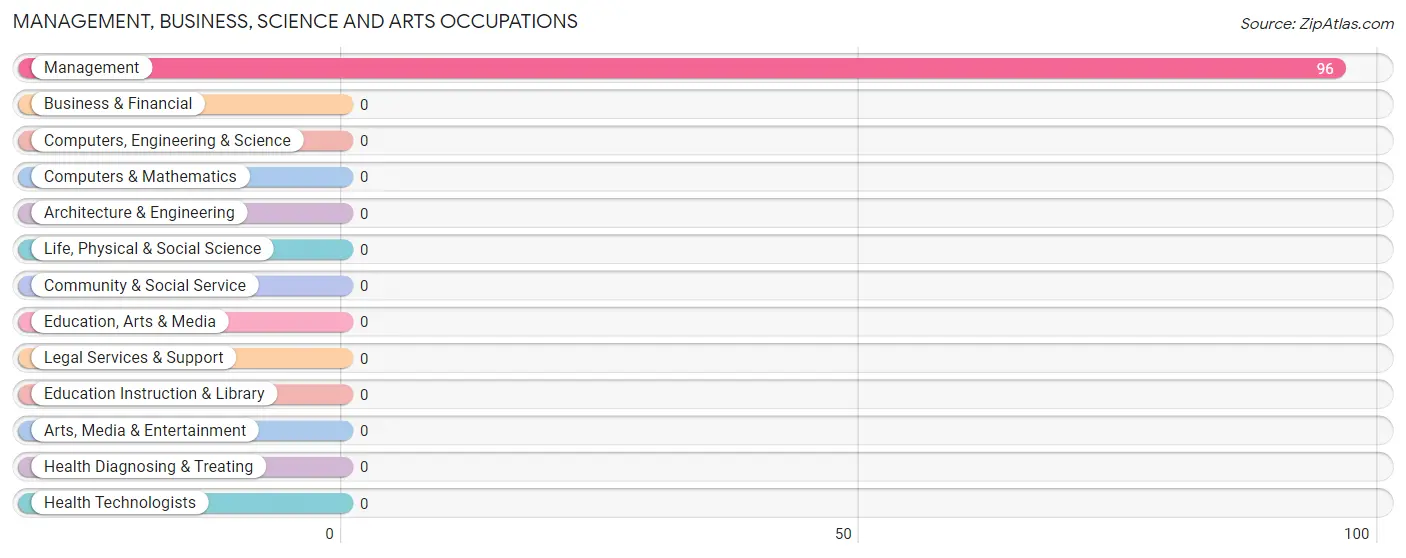
Management, Business, Science and Arts Occupations by Sex
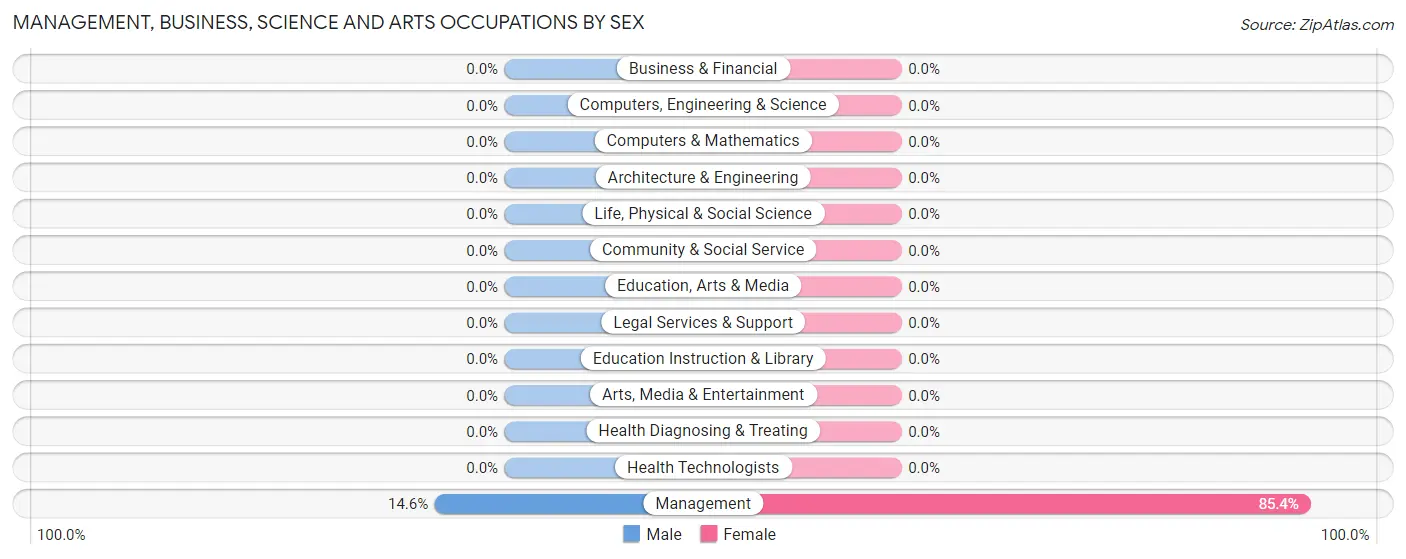
| Occupation | Male | Female |
| Management | 14 (14.6%) | 82 (85.4%) |
| Business & Financial | 0 (0.0%) | 0 (0.0%) |
| Computers, Engineering & Science | 0 (0.0%) | 0 (0.0%) |
| Computers & Mathematics | 0 (0.0%) | 0 (0.0%) |
| Architecture & Engineering | 0 (0.0%) | 0 (0.0%) |
| Life, Physical & Social Science | 0 (0.0%) | 0 (0.0%) |
| Community & Social Service | 0 (0.0%) | 0 (0.0%) |
| Education, Arts & Media | 0 (0.0%) | 0 (0.0%) |
| Legal Services & Support | 0 (0.0%) | 0 (0.0%) |
| Education Instruction & Library | 0 (0.0%) | 0 (0.0%) |
| Arts, Media & Entertainment | 0 (0.0%) | 0 (0.0%) |
| Health Diagnosing & Treating | 0 (0.0%) | 0 (0.0%) |
| Health Technologists | 0 (0.0%) | 0 (0.0%) |
| Total (Category) | 14 (14.6%) | 82 (85.4%) |
| Total (Overall) | 48 (25.4%) | 141 (74.6%) |
Services Occupations
The most common Services occupations in Wallace are , and Cleaning & Maintenance (13 | 6.9%).
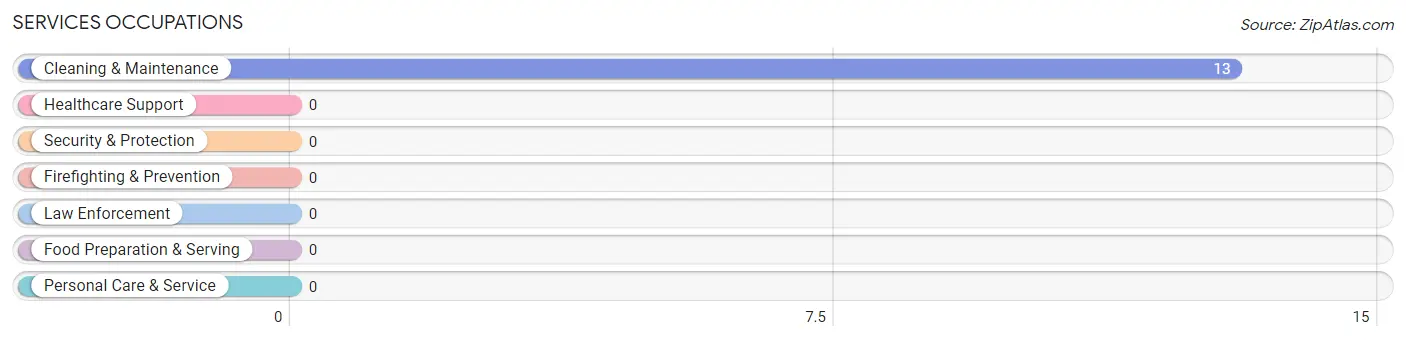
Services Occupations by Sex
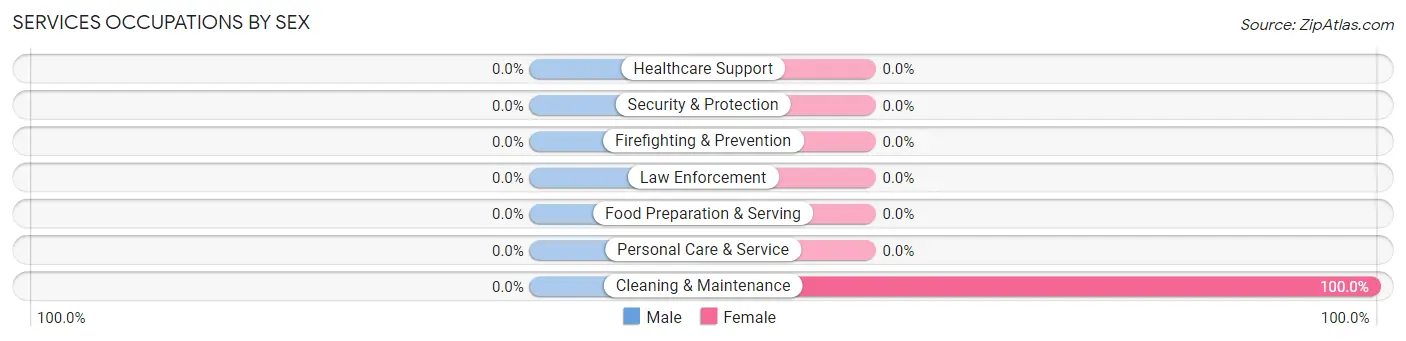
| Occupation | Male | Female |
| Healthcare Support | 0 (0.0%) | 0 (0.0%) |
| Security & Protection | 0 (0.0%) | 0 (0.0%) |
| Firefighting & Prevention | 0 (0.0%) | 0 (0.0%) |
| Law Enforcement | 0 (0.0%) | 0 (0.0%) |
| Food Preparation & Serving | 0 (0.0%) | 0 (0.0%) |
| Cleaning & Maintenance | 0 (0.0%) | 13 (100.0%) |
| Personal Care & Service | 0 (0.0%) | 0 (0.0%) |
| Total (Category) | 0 (0.0%) | 13 (100.0%) |
| Total (Overall) | 48 (25.4%) | 141 (74.6%) |
Sales and Office Occupations
The most common Sales and Office occupations in Wallace are , and Sales & Related (80 | 42.3%).
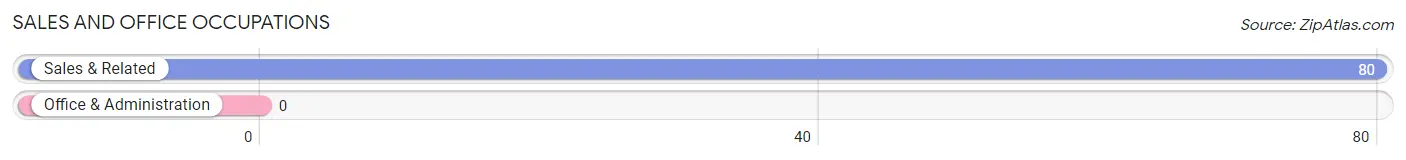
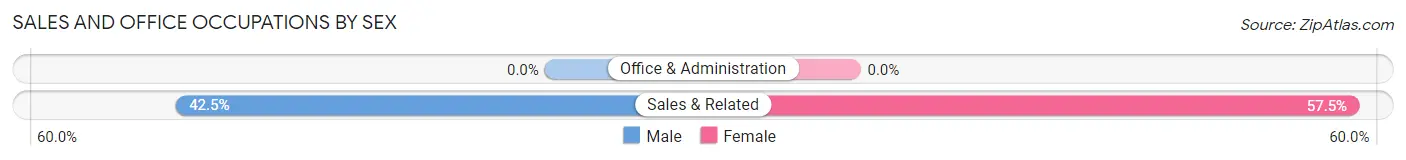
Sales and Office Occupations by Sex
| Occupation | Male | Female |
| Sales & Related | 34 (42.5%) | 46 (57.5%) |
| Office & Administration | 0 (0.0%) | 0 (0.0%) |
| Total (Category) | 34 (42.5%) | 46 (57.5%) |
| Total (Overall) | 48 (25.4%) | 141 (74.6%) |
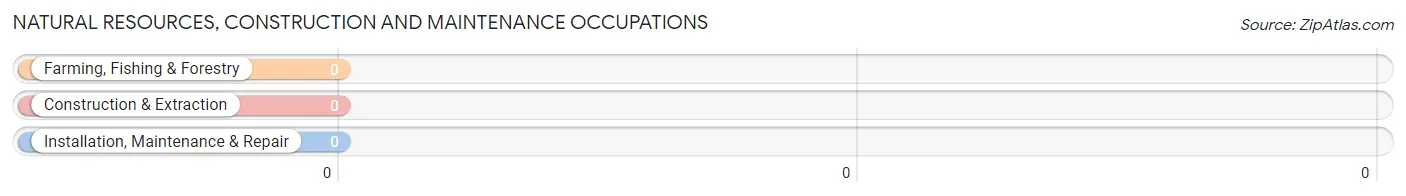
Natural Resources, Construction and Maintenance Occupations
Natural Resources, Construction and Maintenance Occupations by Sex
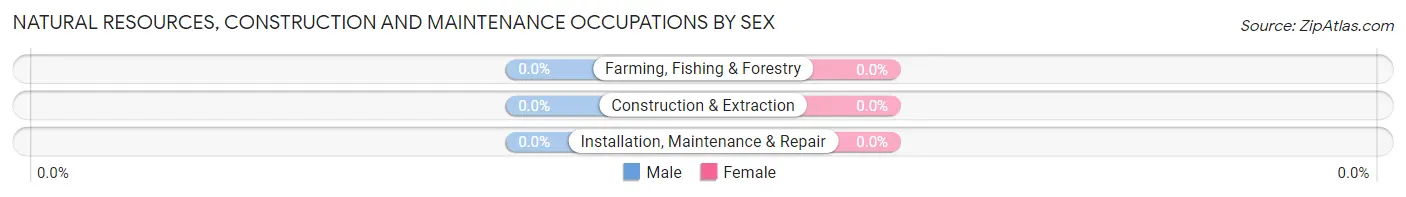
| Occupation | Male | Female |
| Farming, Fishing & Forestry | 0 (0.0%) | 0 (0.0%) |
| Construction & Extraction | 0 (0.0%) | 0 (0.0%) |
| Installation, Maintenance & Repair | 0 (0.0%) | 0 (0.0%) |
| Total (Category) | 0 (0.0%) | 0 (0.0%) |
| Total (Overall) | 48 (25.4%) | 141 (74.6%) |
Production, Transportation and Moving Occupations
Production, Transportation and Moving Occupations by Sex
| Occupation | Male | Female |
| Production | 0 (0.0%) | 0 (0.0%) |
| Transportation | 0 (0.0%) | 0 (0.0%) |
| Material Moving | 0 (0.0%) | 0 (0.0%) |
| Total (Category) | 0 (0.0%) | 0 (0.0%) |
| Total (Overall) | 48 (25.4%) | 141 (74.6%) |
Employment Industries by Sex in Wallace
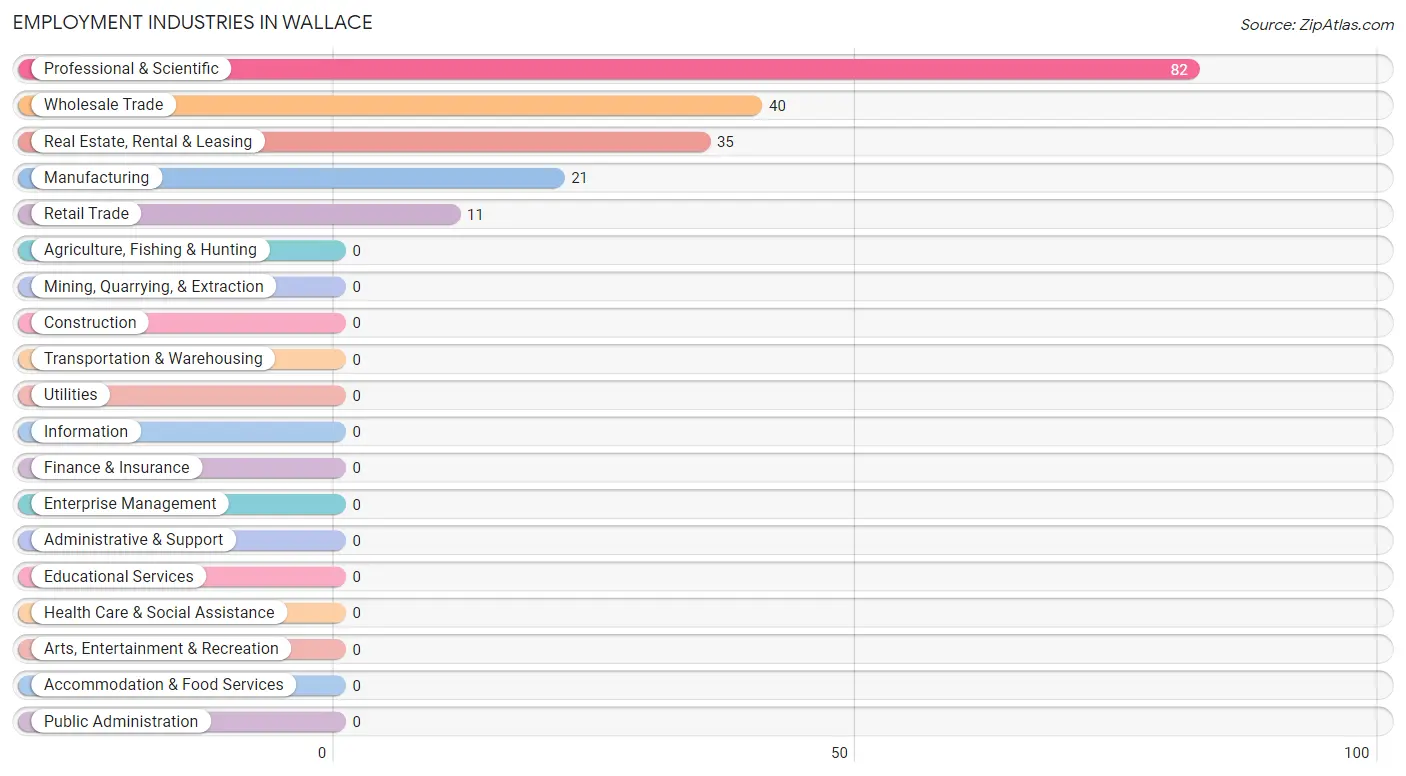
Employment Industries in Wallace
The major employment industries in Wallace include Professional & Scientific (82 | 43.4%), Wholesale Trade (40 | 21.2%), Real Estate, Rental & Leasing (35 | 18.5%), Manufacturing (21 | 11.1%), and Retail Trade (11 | 5.8%).
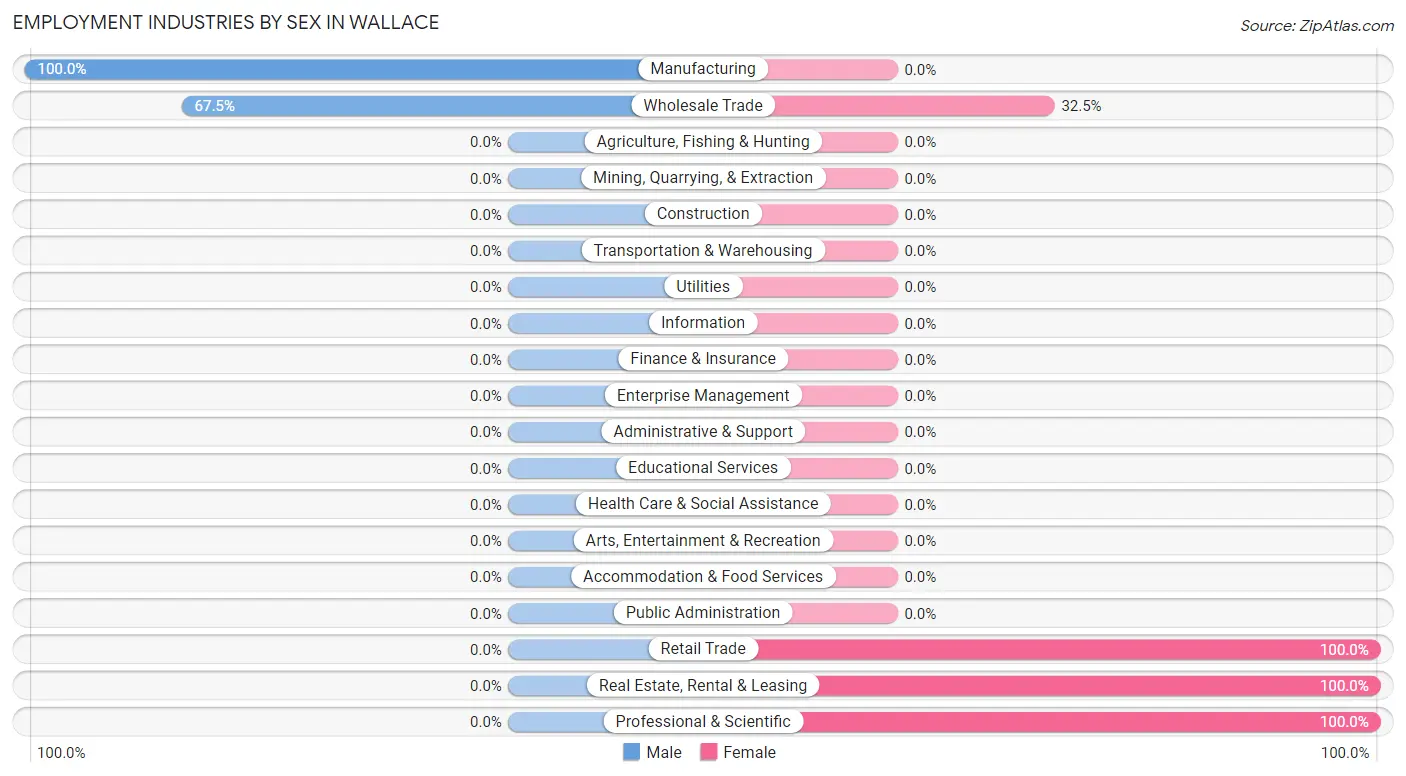
Employment Industries by Sex in Wallace
The Wallace industries that see more men than women are Manufacturing (100.0%), and Wholesale Trade (67.5%), whereas the industries that tend to have a higher number of women are Retail Trade (100.0%), Real Estate, Rental & Leasing (100.0%), and Professional & Scientific (100.0%).
| Industry | Male | Female |
| Agriculture, Fishing & Hunting | 0 (0.0%) | 0 (0.0%) |
| Mining, Quarrying, & Extraction | 0 (0.0%) | 0 (0.0%) |
| Construction | 0 (0.0%) | 0 (0.0%) |
| Manufacturing | 21 (100.0%) | 0 (0.0%) |
| Wholesale Trade | 27 (67.5%) | 13 (32.5%) |
| Retail Trade | 0 (0.0%) | 11 (100.0%) |
| Transportation & Warehousing | 0 (0.0%) | 0 (0.0%) |
| Utilities | 0 (0.0%) | 0 (0.0%) |
| Information | 0 (0.0%) | 0 (0.0%) |
| Finance & Insurance | 0 (0.0%) | 0 (0.0%) |
| Real Estate, Rental & Leasing | 0 (0.0%) | 35 (100.0%) |
| Professional & Scientific | 0 (0.0%) | 82 (100.0%) |
| Enterprise Management | 0 (0.0%) | 0 (0.0%) |
| Administrative & Support | 0 (0.0%) | 0 (0.0%) |
| Educational Services | 0 (0.0%) | 0 (0.0%) |
| Health Care & Social Assistance | 0 (0.0%) | 0 (0.0%) |
| Arts, Entertainment & Recreation | 0 (0.0%) | 0 (0.0%) |
| Accommodation & Food Services | 0 (0.0%) | 0 (0.0%) |
| Public Administration | 0 (0.0%) | 0 (0.0%) |
| Total | 48 (25.4%) | 141 (74.6%) |
Education in Wallace
School Enrollment in Wallace
| School Level | # Students | % Students |
| Nursery / Preschool | 0 | 0.0% |
| Kindergarten | 0 | 0.0% |
| Elementary School | 0 | 0.0% |
| Middle School | 0 | 0.0% |
| High School | 0 | 0.0% |
| College / Undergraduate | 0 | 0.0% |
| Graduate / Professional | 0 | 0.0% |
| Total | 0 | 0.0% |
School Enrollment by Age by Funding Source in Wallace
| Age Bracket | Public School | Private School |
| 3 to 4 Year Olds | 0 (0.0%) | 0 (0.0%) |
| 5 to 9 Year Old | 0 (0.0%) | 0 (0.0%) |
| 10 to 14 Year Olds | 0 (0.0%) | 0 (0.0%) |
| 15 to 17 Year Olds | 0 (0.0%) | 0 (0.0%) |
| 18 to 19 Year Olds | 0 (0.0%) | 0 (0.0%) |
| 20 to 24 Year Olds | 0 (0.0%) | 0 (0.0%) |
| 25 to 34 Year Olds | 0 (0.0%) | 0 (0.0%) |
| 35 Years and over | 0 (0.0%) | 0 (0.0%) |
| Total | 0 (0.0%) | 0 (0.0%) |
Educational Attainment by Field of Study in Wallace
Business (60 | 84.5%), and bio, nature & agricultural (11 | 15.5%) are the most common fields of study among 71 individuals in Wallace who have obtained a bachelor's degree or higher.
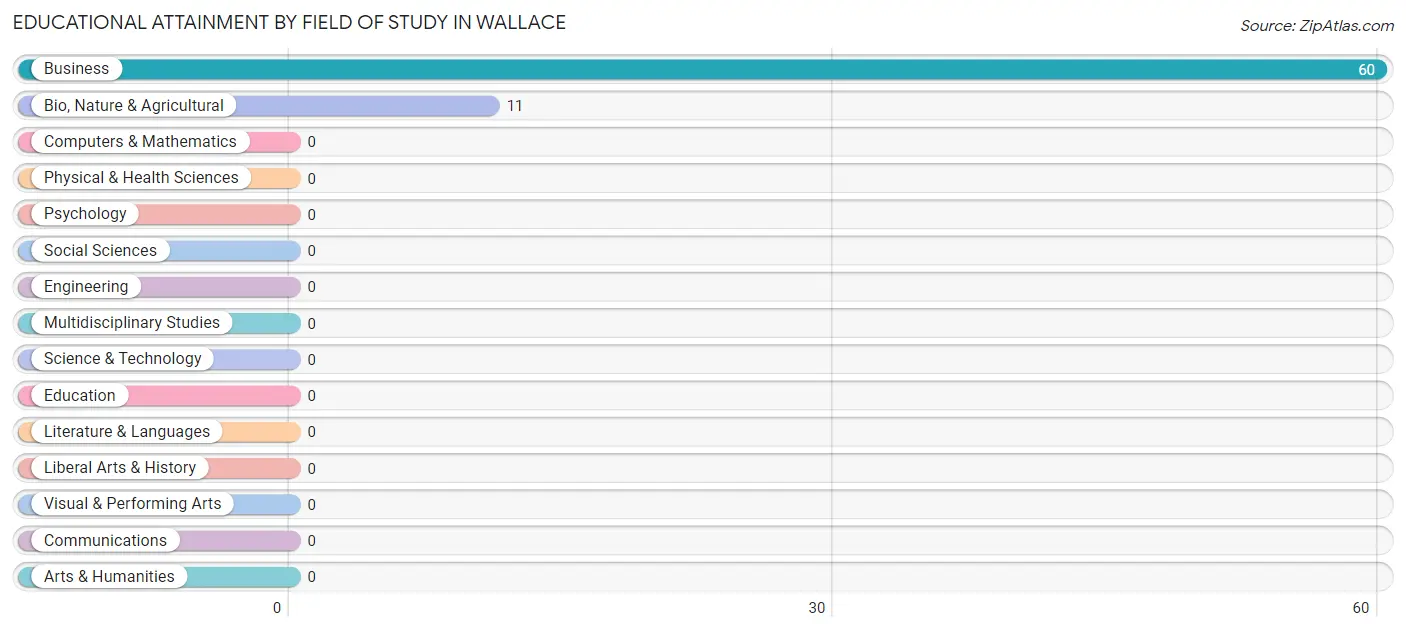
| Field of Study | # Graduates | % Graduates |
| Computers & Mathematics | 0 | 0.0% |
| Bio, Nature & Agricultural | 11 | 15.5% |
| Physical & Health Sciences | 0 | 0.0% |
| Psychology | 0 | 0.0% |
| Social Sciences | 0 | 0.0% |
| Engineering | 0 | 0.0% |
| Multidisciplinary Studies | 0 | 0.0% |
| Science & Technology | 0 | 0.0% |
| Business | 60 | 84.5% |
| Education | 0 | 0.0% |
| Literature & Languages | 0 | 0.0% |
| Liberal Arts & History | 0 | 0.0% |
| Visual & Performing Arts | 0 | 0.0% |
| Communications | 0 | 0.0% |
| Arts & Humanities | 0 | 0.0% |
| Total | 71 | 100.0% |
Transportation & Commute in Wallace
Vehicle Availability by Sex in Wallace
The most prevalent vehicle ownership categories in Wallace are males with 3 vehicles (48, accounting for 100.0%) and females with 3 vehicles (59, making up 34.0%).
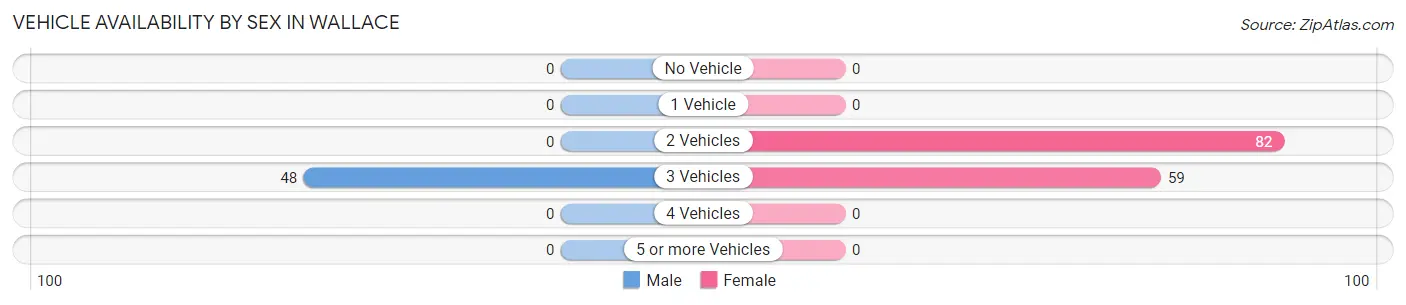
| Vehicles Available | Male | Female |
| No Vehicle | 0 (0.0%) | 0 (0.0%) |
| 1 Vehicle | 0 (0.0%) | 0 (0.0%) |
| 2 Vehicles | 0 (0.0%) | 82 (58.2%) |
| 3 Vehicles | 48 (100.0%) | 59 (41.8%) |
| 4 Vehicles | 0 (0.0%) | 0 (0.0%) |
| 5 or more Vehicles | 0 (0.0%) | 0 (0.0%) |
| Total | 48 (100.0%) | 141 (100.0%) |
Commute Time in Wallace
The most frequently occuring commute durations in Wallace are 45 to 59 minutes (34 commuters, 55.7%), 60 to 89 minutes (27 commuters, 44.3%), and less than 5 minutes (0 commuters, 0.0%).
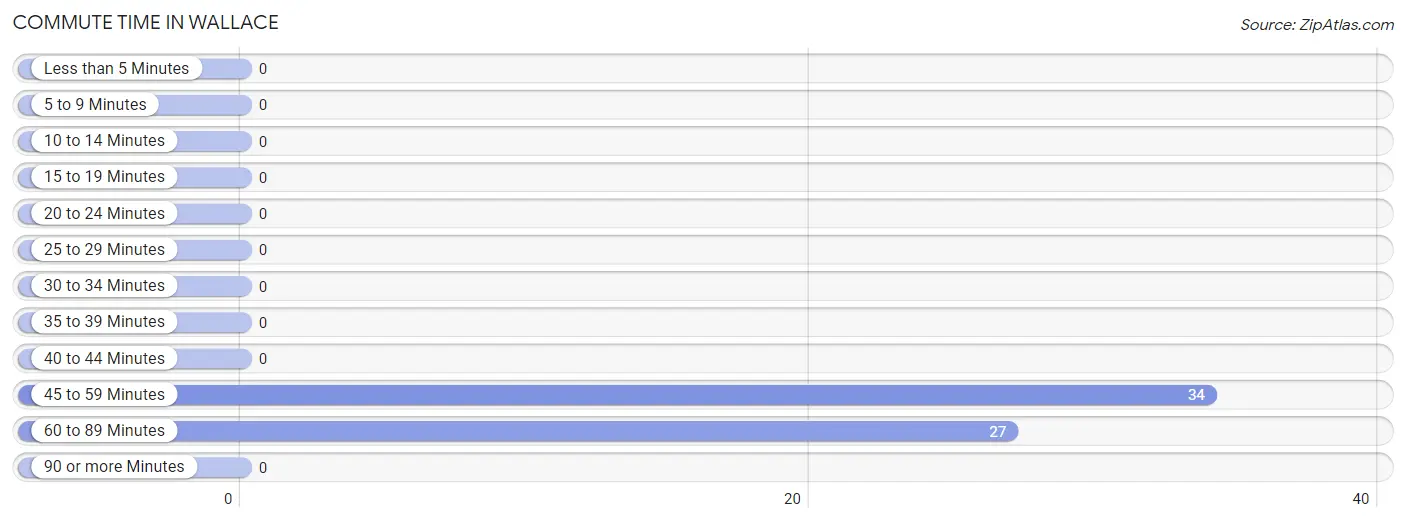
| Commute Time | # Commuters | % Commuters |
| Less than 5 Minutes | 0 | 0.0% |
| 5 to 9 Minutes | 0 | 0.0% |
| 10 to 14 Minutes | 0 | 0.0% |
| 15 to 19 Minutes | 0 | 0.0% |
| 20 to 24 Minutes | 0 | 0.0% |
| 25 to 29 Minutes | 0 | 0.0% |
| 30 to 34 Minutes | 0 | 0.0% |
| 35 to 39 Minutes | 0 | 0.0% |
| 40 to 44 Minutes | 0 | 0.0% |
| 45 to 59 Minutes | 34 | 55.7% |
| 60 to 89 Minutes | 27 | 44.3% |
| 90 or more Minutes | 0 | 0.0% |
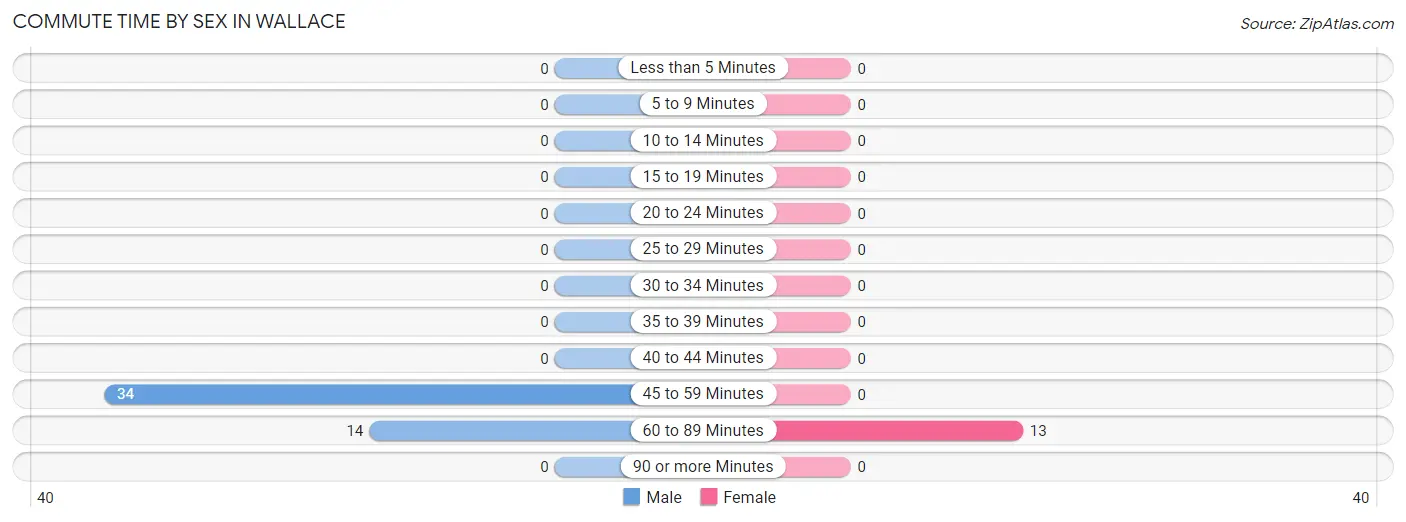
Commute Time by Sex in Wallace
The most common commute times in Wallace are 45 to 59 minutes (34 commuters, 70.8%) for males and 60 to 89 minutes (13 commuters, 100.0%) for females.
| Commute Time | Male | Female |
| Less than 5 Minutes | 0 (0.0%) | 0 (0.0%) |
| 5 to 9 Minutes | 0 (0.0%) | 0 (0.0%) |
| 10 to 14 Minutes | 0 (0.0%) | 0 (0.0%) |
| 15 to 19 Minutes | 0 (0.0%) | 0 (0.0%) |
| 20 to 24 Minutes | 0 (0.0%) | 0 (0.0%) |
| 25 to 29 Minutes | 0 (0.0%) | 0 (0.0%) |
| 30 to 34 Minutes | 0 (0.0%) | 0 (0.0%) |
| 35 to 39 Minutes | 0 (0.0%) | 0 (0.0%) |
| 40 to 44 Minutes | 0 (0.0%) | 0 (0.0%) |
| 45 to 59 Minutes | 34 (70.8%) | 0 (0.0%) |
| 60 to 89 Minutes | 14 (29.2%) | 13 (100.0%) |
| 90 or more Minutes | 0 (0.0%) | 0 (0.0%) |
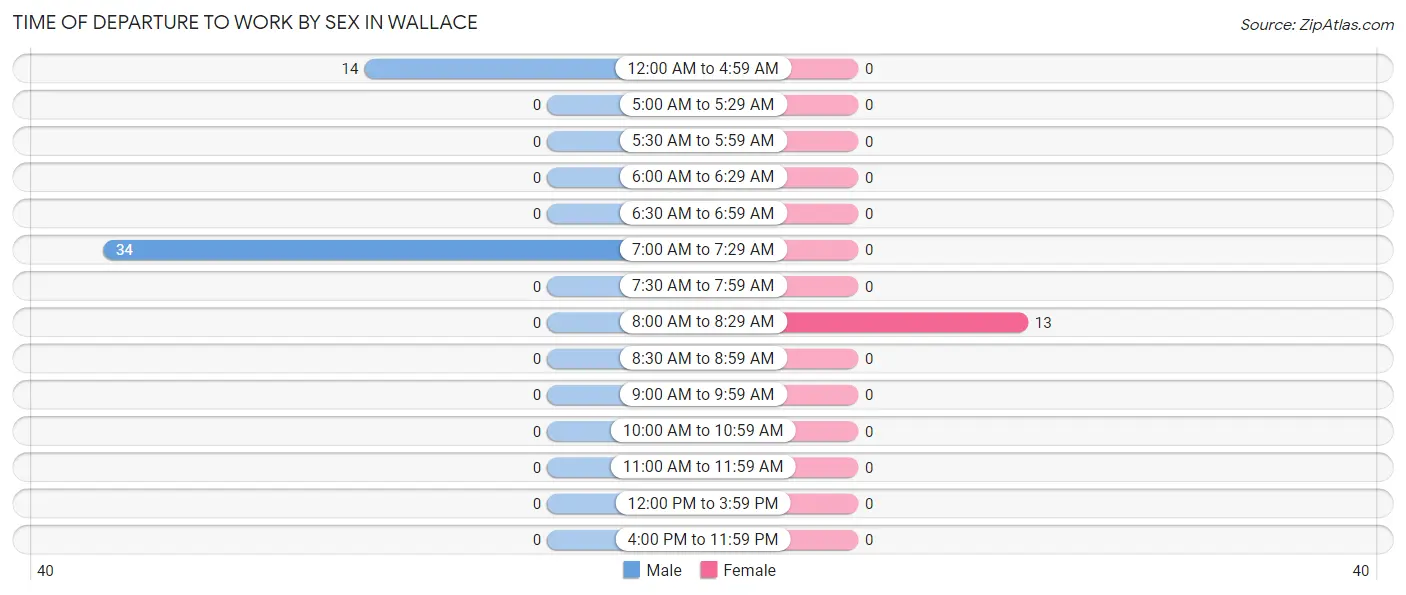
Time of Departure to Work by Sex in Wallace
The most frequent times of departure to work in Wallace are 7:00 AM to 7:29 AM (34, 70.8%) for males and 8:00 AM to 8:29 AM (13, 100.0%) for females.
| Time of Departure | Male | Female |
| 12:00 AM to 4:59 AM | 14 (29.2%) | 0 (0.0%) |
| 5:00 AM to 5:29 AM | 0 (0.0%) | 0 (0.0%) |
| 5:30 AM to 5:59 AM | 0 (0.0%) | 0 (0.0%) |
| 6:00 AM to 6:29 AM | 0 (0.0%) | 0 (0.0%) |
| 6:30 AM to 6:59 AM | 0 (0.0%) | 0 (0.0%) |
| 7:00 AM to 7:29 AM | 34 (70.8%) | 0 (0.0%) |
| 7:30 AM to 7:59 AM | 0 (0.0%) | 0 (0.0%) |
| 8:00 AM to 8:29 AM | 0 (0.0%) | 13 (100.0%) |
| 8:30 AM to 8:59 AM | 0 (0.0%) | 0 (0.0%) |
| 9:00 AM to 9:59 AM | 0 (0.0%) | 0 (0.0%) |
| 10:00 AM to 10:59 AM | 0 (0.0%) | 0 (0.0%) |
| 11:00 AM to 11:59 AM | 0 (0.0%) | 0 (0.0%) |
| 12:00 PM to 3:59 PM | 0 (0.0%) | 0 (0.0%) |
| 4:00 PM to 11:59 PM | 0 (0.0%) | 0 (0.0%) |
| Total | 48 (100.0%) | 13 (100.0%) |
Housing Occupancy in Wallace
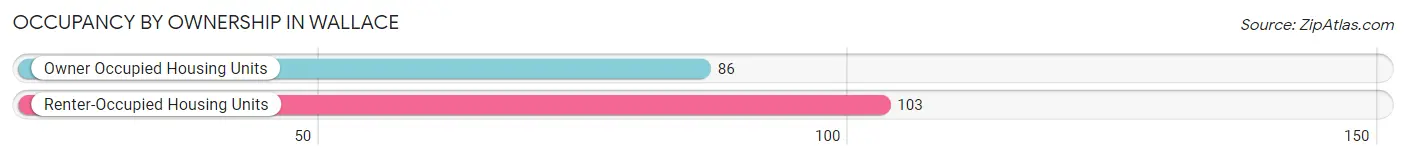
Occupancy by Ownership in Wallace
Of the total 189 dwellings in Wallace, owner-occupied units account for 86 (45.5%), while renter-occupied units make up 103 (54.5%).
| Occupancy | # Housing Units | % Housing Units |
| Owner Occupied Housing Units | 86 | 45.5% |
| Renter-Occupied Housing Units | 103 | 54.5% |
| Total Occupied Housing Units | 189 | 100.0% |
Occupancy by Household Size in Wallace
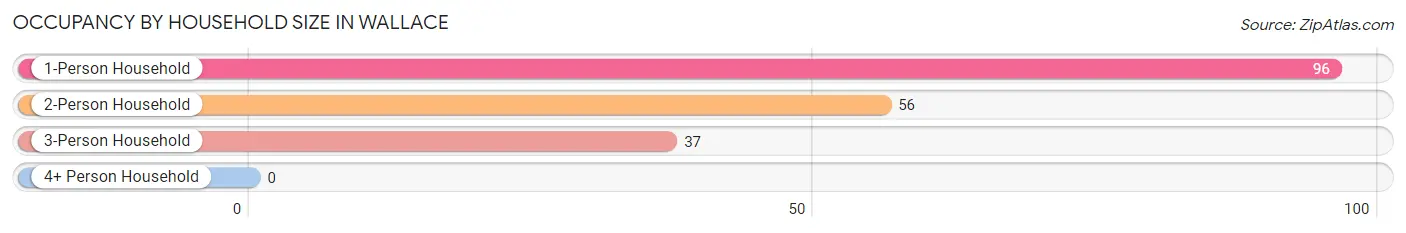
| Household Size | # Housing Units | % Housing Units |
| 1-Person Household | 96 | 50.8% |
| 2-Person Household | 56 | 29.6% |
| 3-Person Household | 37 | 19.6% |
| 4+ Person Household | 0 | 0.0% |
| Total Housing Units | 189 | 100.0% |
Occupancy by Ownership by Household Size in Wallace
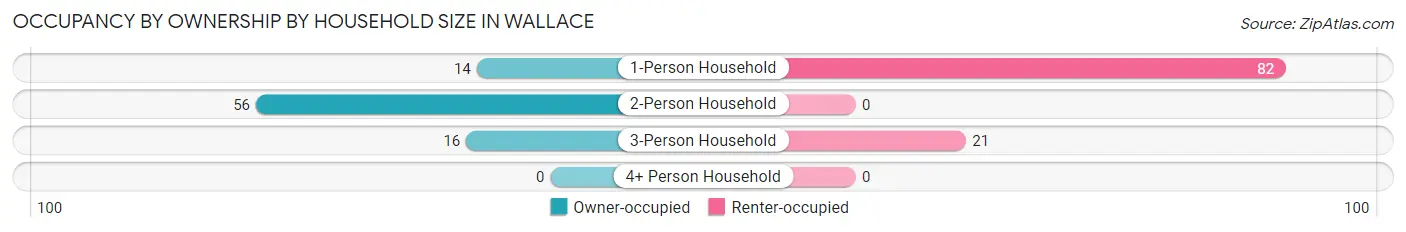
| Household Size | Owner-occupied | Renter-occupied |
| 1-Person Household | 14 (14.6%) | 82 (85.4%) |
| 2-Person Household | 56 (100.0%) | 0 (0.0%) |
| 3-Person Household | 16 (43.2%) | 21 (56.8%) |
| 4+ Person Household | 0 (0.0%) | 0 (0.0%) |
| Total Housing Units | 86 (45.5%) | 103 (54.5%) |
Occupancy by Educational Attainment in Wallace
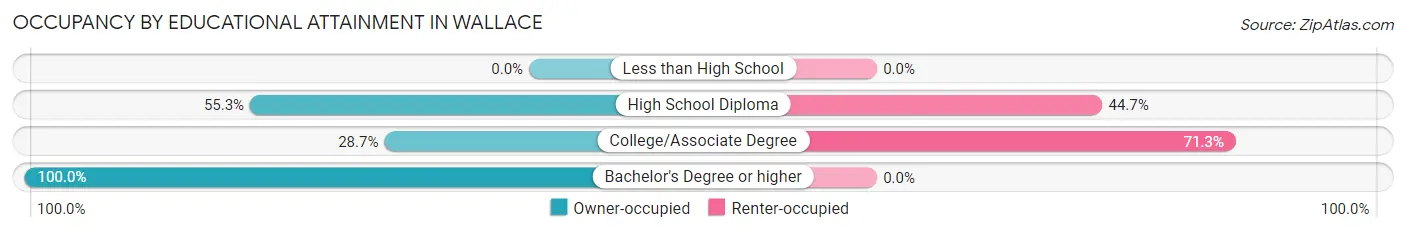
| Household Size | Owner-occupied | Renter-occupied |
| Less than High School | 0 (0.0%) | 0 (0.0%) |
| High School Diploma | 26 (55.3%) | 21 (44.7%) |
| College/Associate Degree | 33 (28.7%) | 82 (71.3%) |
| Bachelor's Degree or higher | 27 (100.0%) | 0 (0.0%) |
Occupancy by Age of Householder in Wallace
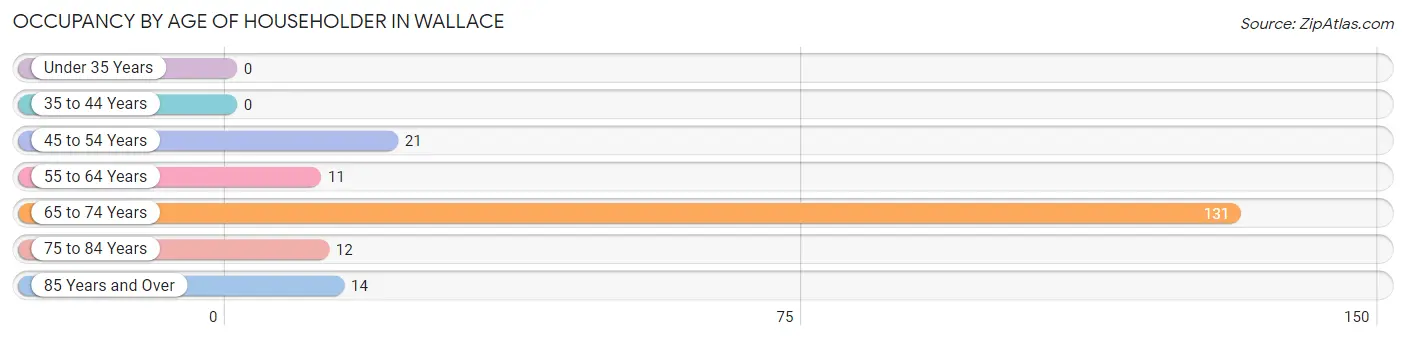
| Age Bracket | # Households | % Households |
| Under 35 Years | 0 | 0.0% |
| 35 to 44 Years | 0 | 0.0% |
| 45 to 54 Years | 21 | 11.1% |
| 55 to 64 Years | 11 | 5.8% |
| 65 to 74 Years | 131 | 69.3% |
| 75 to 84 Years | 12 | 6.4% |
| 85 Years and Over | 14 | 7.4% |
| Total | 189 | 100.0% |
Housing Finances in Wallace
Median Income by Occupancy in Wallace
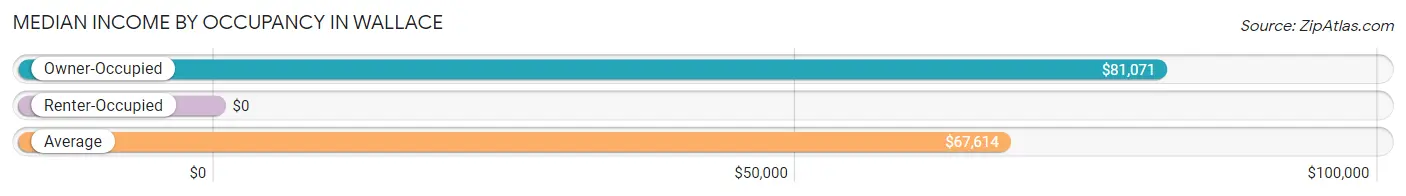
| Occupancy Type | # Households | Median Income |
| Owner-Occupied | 86 (45.5%) | $81,071 |
| Renter-Occupied | 103 (54.5%) | $0 |
| Average | 189 (100.0%) | $67,614 |
Occupancy by Householder Income Bracket in Wallace
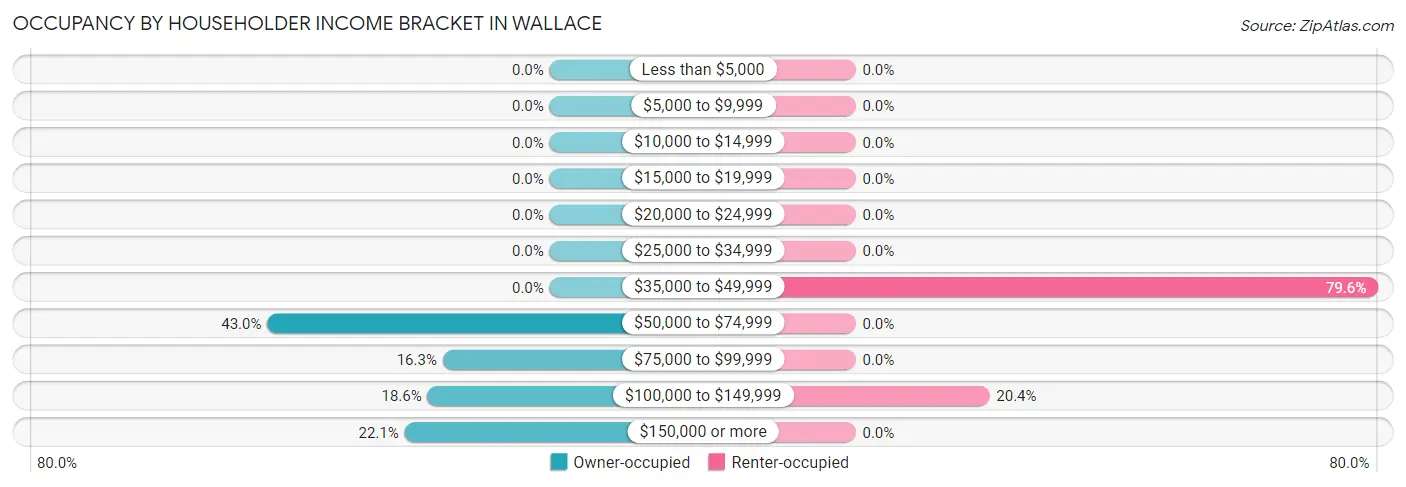
| Income Bracket | Owner-occupied | Renter-occupied |
| Less than $5,000 | 0 (0.0%) | 0 (0.0%) |
| $5,000 to $9,999 | 0 (0.0%) | 0 (0.0%) |
| $10,000 to $14,999 | 0 (0.0%) | 0 (0.0%) |
| $15,000 to $19,999 | 0 (0.0%) | 0 (0.0%) |
| $20,000 to $24,999 | 0 (0.0%) | 0 (0.0%) |
| $25,000 to $34,999 | 0 (0.0%) | 0 (0.0%) |
| $35,000 to $49,999 | 0 (0.0%) | 82 (79.6%) |
| $50,000 to $74,999 | 37 (43.0%) | 0 (0.0%) |
| $75,000 to $99,999 | 14 (16.3%) | 0 (0.0%) |
| $100,000 to $149,999 | 16 (18.6%) | 21 (20.4%) |
| $150,000 or more | 19 (22.1%) | 0 (0.0%) |
| Total | 86 (100.0%) | 103 (100.0%) |
Monthly Housing Cost Tiers in Wallace
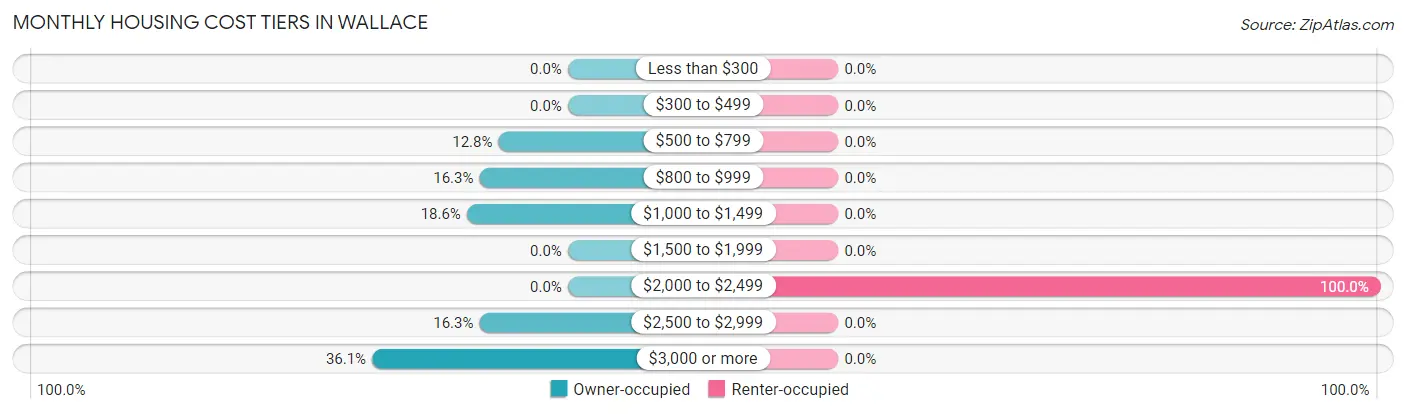
| Monthly Cost | Owner-occupied | Renter-occupied |
| Less than $300 | 0 (0.0%) | 0 (0.0%) |
| $300 to $499 | 0 (0.0%) | 0 (0.0%) |
| $500 to $799 | 11 (12.8%) | 0 (0.0%) |
| $800 to $999 | 14 (16.3%) | 0 (0.0%) |
| $1,000 to $1,499 | 16 (18.6%) | 0 (0.0%) |
| $1,500 to $1,999 | 0 (0.0%) | 0 (0.0%) |
| $2,000 to $2,499 | 0 (0.0%) | 103 (100.0%) |
| $2,500 to $2,999 | 14 (16.3%) | 0 (0.0%) |
| $3,000 or more | 31 (36.0%) | 0 (0.0%) |
| Total | 86 (100.0%) | 103 (100.0%) |
Physical Housing Characteristics in Wallace
Housing Structures in Wallace
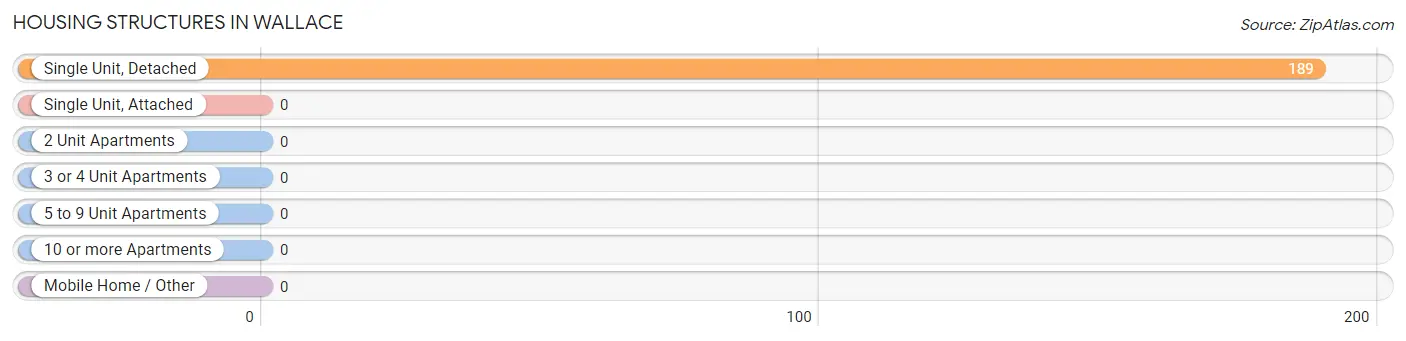
| Structure Type | # Housing Units | % Housing Units |
| Single Unit, Detached | 189 | 100.0% |
| Single Unit, Attached | 0 | 0.0% |
| 2 Unit Apartments | 0 | 0.0% |
| 3 or 4 Unit Apartments | 0 | 0.0% |
| 5 to 9 Unit Apartments | 0 | 0.0% |
| 10 or more Apartments | 0 | 0.0% |
| Mobile Home / Other | 0 | 0.0% |
| Total | 189 | 100.0% |
Housing Structures by Occupancy in Wallace
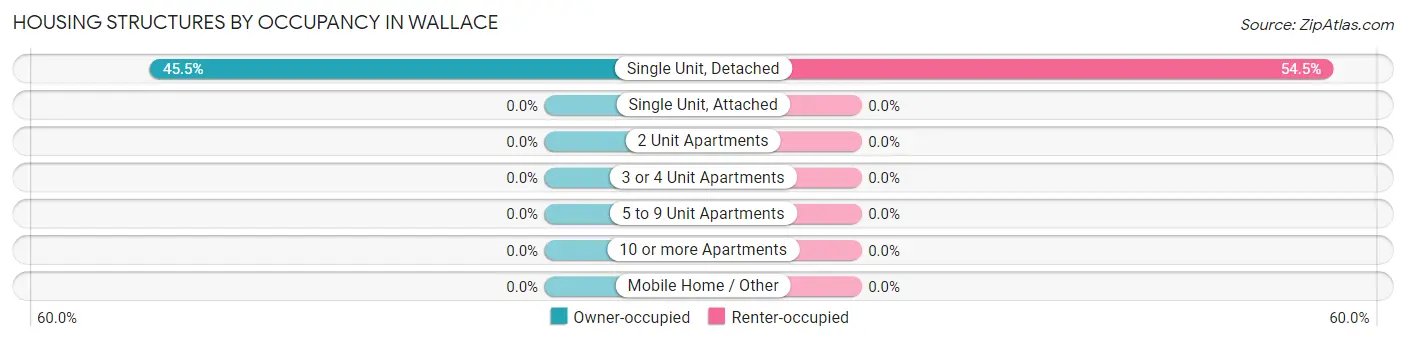
| Structure Type | Owner-occupied | Renter-occupied |
| Single Unit, Detached | 86 (45.5%) | 103 (54.5%) |
| Single Unit, Attached | 0 (0.0%) | 0 (0.0%) |
| 2 Unit Apartments | 0 (0.0%) | 0 (0.0%) |
| 3 or 4 Unit Apartments | 0 (0.0%) | 0 (0.0%) |
| 5 to 9 Unit Apartments | 0 (0.0%) | 0 (0.0%) |
| 10 or more Apartments | 0 (0.0%) | 0 (0.0%) |
| Mobile Home / Other | 0 (0.0%) | 0 (0.0%) |
| Total | 86 (45.5%) | 103 (54.5%) |
Housing Structures by Number of Rooms in Wallace
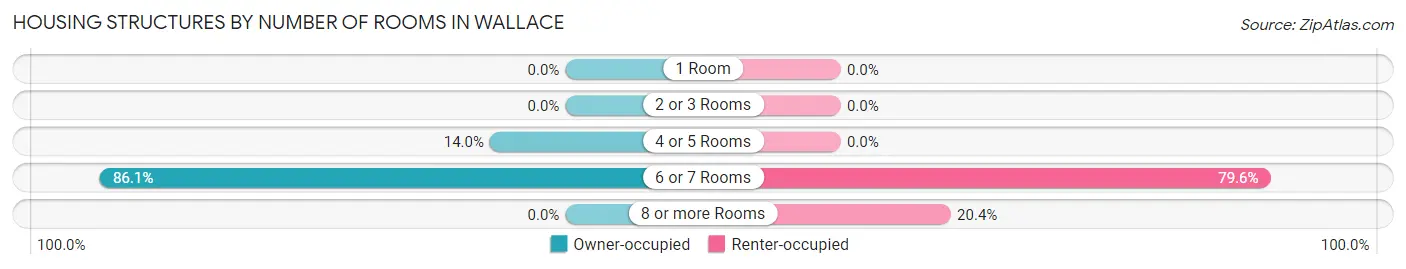
| Number of Rooms | Owner-occupied | Renter-occupied |
| 1 Room | 0 (0.0%) | 0 (0.0%) |
| 2 or 3 Rooms | 0 (0.0%) | 0 (0.0%) |
| 4 or 5 Rooms | 12 (14.0%) | 0 (0.0%) |
| 6 or 7 Rooms | 74 (86.1%) | 82 (79.6%) |
| 8 or more Rooms | 0 (0.0%) | 21 (20.4%) |
| Total | 86 (100.0%) | 103 (100.0%) |
Housing Structure by Heating Type in Wallace
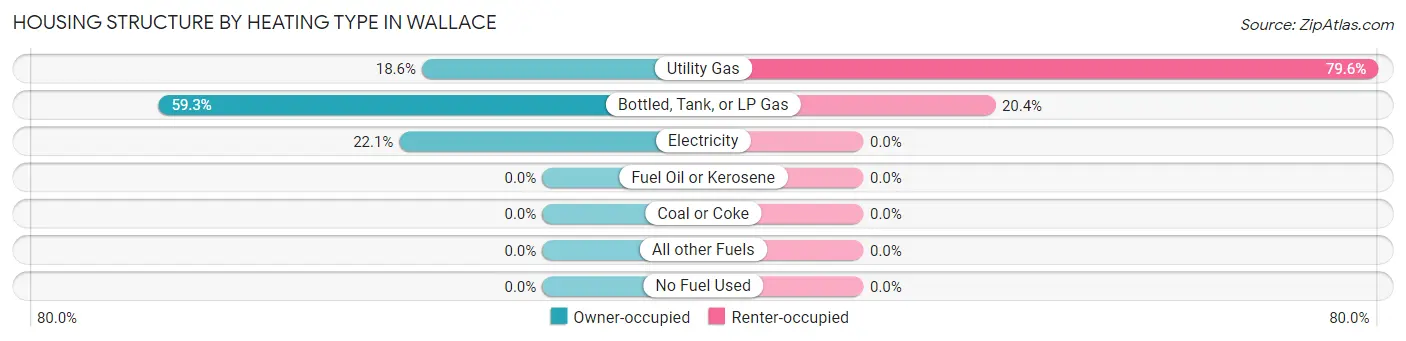
| Heating Type | Owner-occupied | Renter-occupied |
| Utility Gas | 16 (18.6%) | 82 (79.6%) |
| Bottled, Tank, or LP Gas | 51 (59.3%) | 21 (20.4%) |
| Electricity | 19 (22.1%) | 0 (0.0%) |
| Fuel Oil or Kerosene | 0 (0.0%) | 0 (0.0%) |
| Coal or Coke | 0 (0.0%) | 0 (0.0%) |
| All other Fuels | 0 (0.0%) | 0 (0.0%) |
| No Fuel Used | 0 (0.0%) | 0 (0.0%) |
| Total | 86 (100.0%) | 103 (100.0%) |
Household Vehicle Usage in Wallace
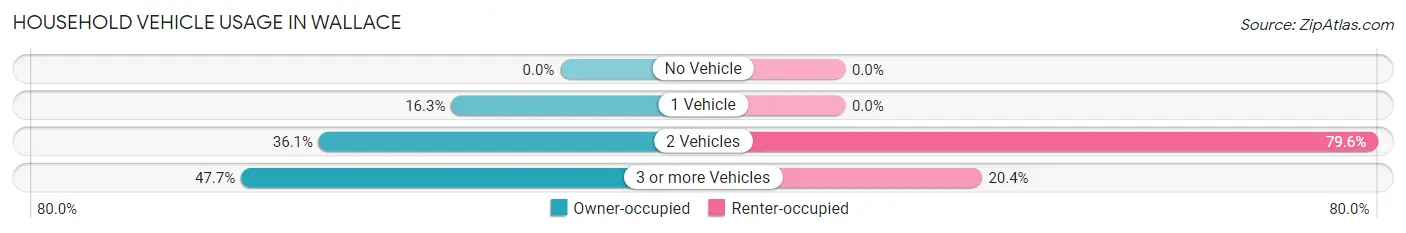
| Vehicles per Household | Owner-occupied | Renter-occupied |
| No Vehicle | 0 (0.0%) | 0 (0.0%) |
| 1 Vehicle | 14 (16.3%) | 0 (0.0%) |
| 2 Vehicles | 31 (36.0%) | 82 (79.6%) |
| 3 or more Vehicles | 41 (47.7%) | 21 (20.4%) |
| Total | 86 (100.0%) | 103 (100.0%) |
Real Estate & Mortgages in Wallace
Real Estate and Mortgage Overview in Wallace
| Characteristic | Without Mortgage | With Mortgage |
| Housing Units | 30 | 56 |
| Median Property Value | - | - |
| Median Household Income | - | - |
| Monthly Housing Costs | - | - |
| Real Estate Taxes | - | - |
Property Value by Mortgage Status in Wallace
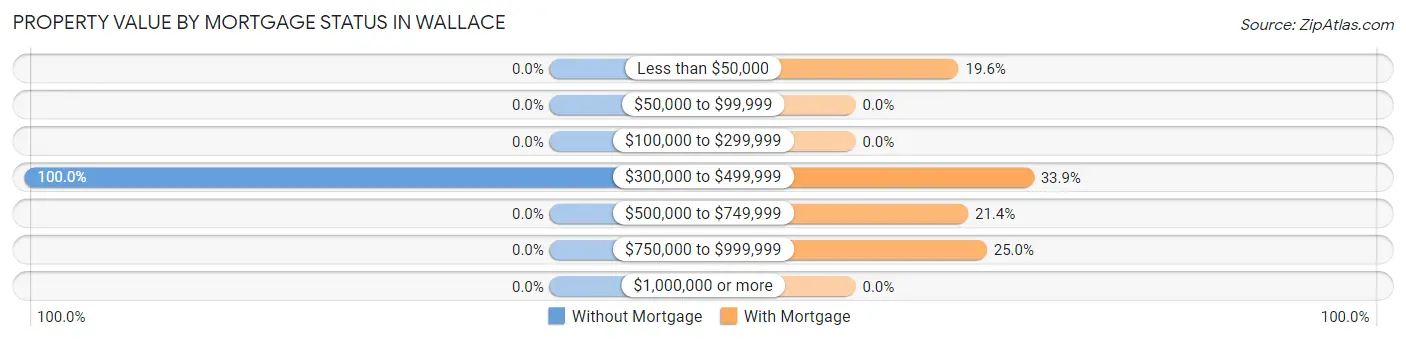
| Property Value | Without Mortgage | With Mortgage |
| Less than $50,000 | 0 (0.0%) | 11 (19.6%) |
| $50,000 to $99,999 | 0 (0.0%) | 0 (0.0%) |
| $100,000 to $299,999 | 0 (0.0%) | 0 (0.0%) |
| $300,000 to $499,999 | 30 (100.0%) | 19 (33.9%) |
| $500,000 to $749,999 | 0 (0.0%) | 12 (21.4%) |
| $750,000 to $999,999 | 0 (0.0%) | 14 (25.0%) |
| $1,000,000 or more | 0 (0.0%) | 0 (0.0%) |
| Total | 30 (100.0%) | 56 (100.0%) |
Household Income by Mortgage Status in Wallace
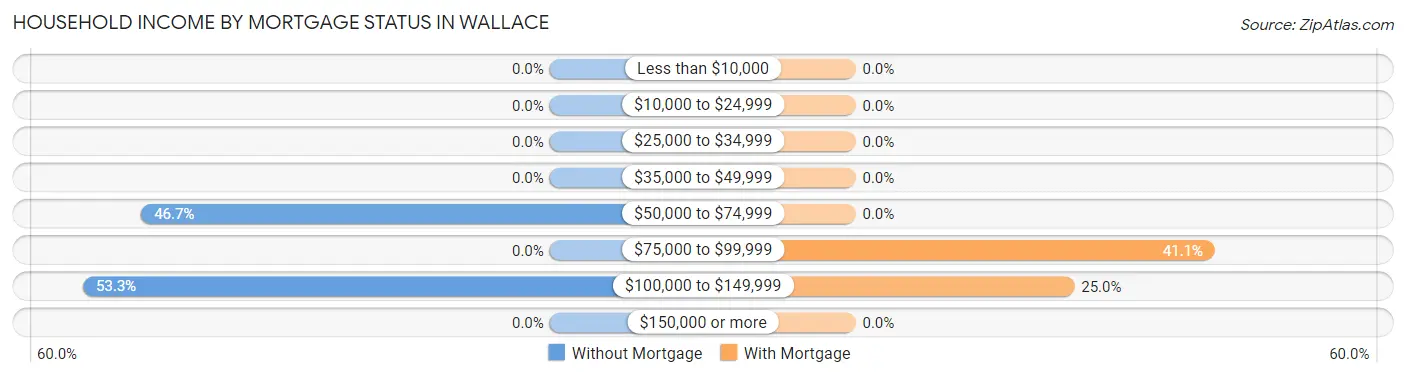
| Household Income | Without Mortgage | With Mortgage |
| Less than $10,000 | 0 (0.0%) | 0 (0.0%) |
| $10,000 to $24,999 | 0 (0.0%) | 0 (0.0%) |
| $25,000 to $34,999 | 0 (0.0%) | 0 (0.0%) |
| $35,000 to $49,999 | 0 (0.0%) | 0 (0.0%) |
| $50,000 to $74,999 | 14 (46.7%) | 0 (0.0%) |
| $75,000 to $99,999 | 0 (0.0%) | 23 (41.1%) |
| $100,000 to $149,999 | 16 (53.3%) | 14 (25.0%) |
| $150,000 or more | 0 (0.0%) | 0 (0.0%) |
| Total | 30 (100.0%) | 56 (100.0%) |
Property Value to Household Income Ratio in Wallace
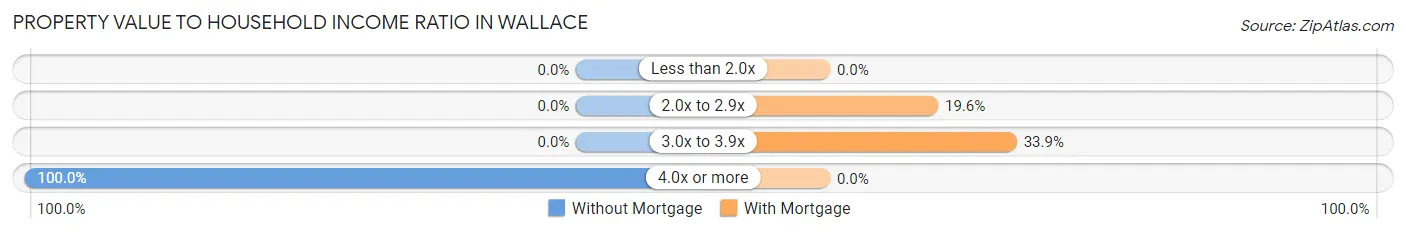
| Value-to-Income Ratio | Without Mortgage | With Mortgage |
| Less than 2.0x | 0 (0.0%) | 0 (0.0%) |
| 2.0x to 2.9x | 0 (0.0%) | 11 (19.6%) |
| 3.0x to 3.9x | 0 (0.0%) | 19 (33.9%) |
| 4.0x or more | 30 (100.0%) | 0 (0.0%) |
| Total | 30 (100.0%) | 56 (100.0%) |
Real Estate Taxes by Mortgage Status in Wallace
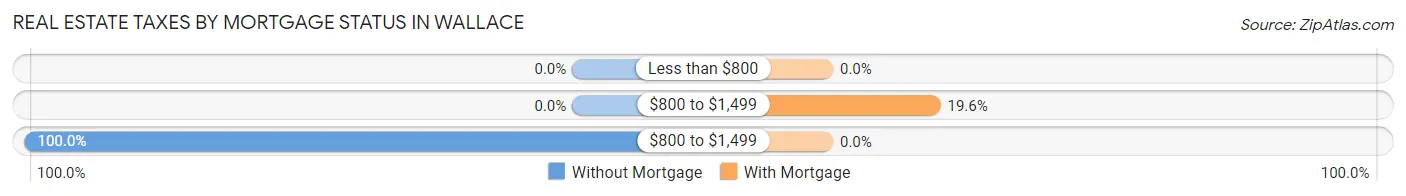
| Property Taxes | Without Mortgage | With Mortgage |
| Less than $800 | 0 (0.0%) | 0 (0.0%) |
| $800 to $1,499 | 0 (0.0%) | 11 (19.6%) |
| $800 to $1,499 | 30 (100.0%) | 0 (0.0%) |
| Total | 30 (100.0%) | 56 (100.0%) |
Health & Disability in Wallace
Health Insurance Coverage by Age in Wallace
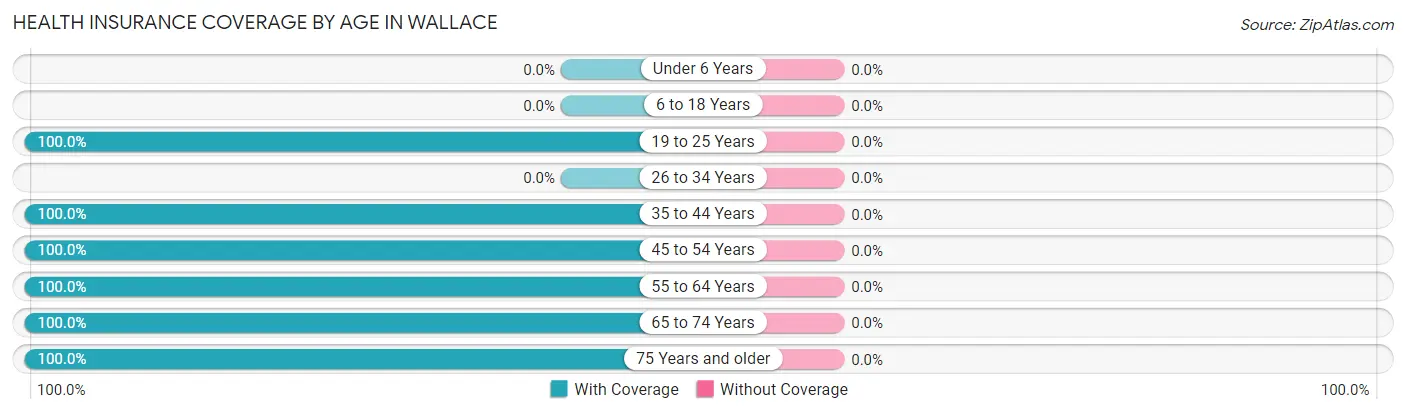
| Age Bracket | With Coverage | Without Coverage |
| Under 6 Years | 0 (0.0%) | 0 (0.0%) |
| 6 to 18 Years | 0 (0.0%) | 0 (0.0%) |
| 19 to 25 Years | 28 (100.0%) | 0 (0.0%) |
| 26 to 34 Years | 0 (0.0%) | 0 (0.0%) |
| 35 to 44 Years | 28 (100.0%) | 0 (0.0%) |
| 45 to 54 Years | 56 (100.0%) | 0 (0.0%) |
| 55 to 64 Years | 53 (100.0%) | 0 (0.0%) |
| 65 to 74 Years | 159 (100.0%) | 0 (0.0%) |
| 75 Years and older | 26 (100.0%) | 0 (0.0%) |
| Total | 350 (100.0%) | 0 (0.0%) |
Health Insurance Coverage by Citizenship Status in Wallace
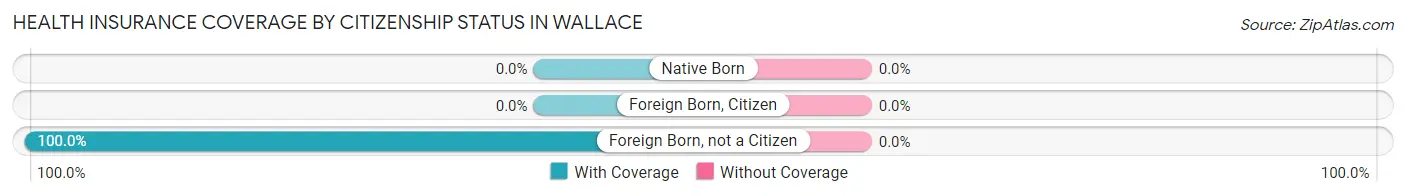
| Citizenship Status | With Coverage | Without Coverage |
| Native Born | 0 (0.0%) | 0 (0.0%) |
| Foreign Born, Citizen | 0 (0.0%) | 0 (0.0%) |
| Foreign Born, not a Citizen | 28 (100.0%) | 0 (0.0%) |
Health Insurance Coverage by Household Income in Wallace
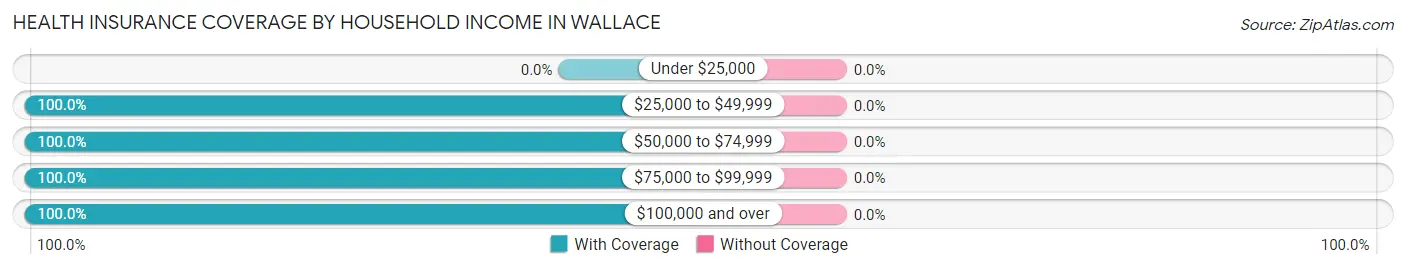
| Household Income | With Coverage | Without Coverage |
| Under $25,000 | 0 (0.0%) | 0 (0.0%) |
| $25,000 to $49,999 | 82 (100.0%) | 0 (0.0%) |
| $50,000 to $74,999 | 64 (100.0%) | 0 (0.0%) |
| $75,000 to $99,999 | 27 (100.0%) | 0 (0.0%) |
| $100,000 and over | 177 (100.0%) | 0 (0.0%) |
Public vs Private Health Insurance Coverage by Age in Wallace
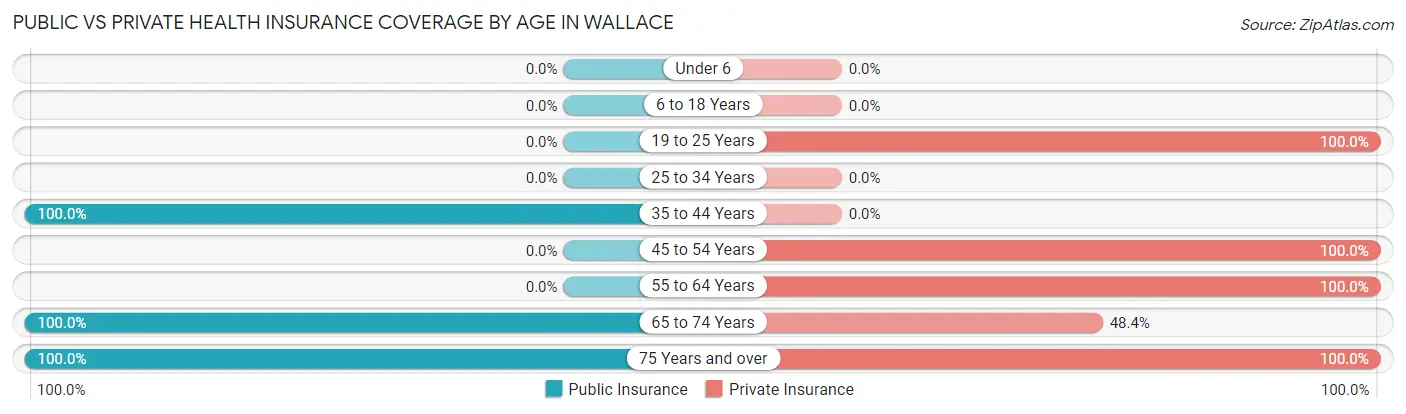
| Age Bracket | Public Insurance | Private Insurance |
| Under 6 | 0 (0.0%) | 0 (0.0%) |
| 6 to 18 Years | 0 (0.0%) | 0 (0.0%) |
| 19 to 25 Years | 0 (0.0%) | 28 (100.0%) |
| 25 to 34 Years | 0 (0.0%) | 0 (0.0%) |
| 35 to 44 Years | 28 (100.0%) | 0 (0.0%) |
| 45 to 54 Years | 0 (0.0%) | 56 (100.0%) |
| 55 to 64 Years | 0 (0.0%) | 53 (100.0%) |
| 65 to 74 Years | 159 (100.0%) | 77 (48.4%) |
| 75 Years and over | 26 (100.0%) | 26 (100.0%) |
| Total | 213 (60.9%) | 240 (68.6%) |
Disability Status by Sex by Age in Wallace
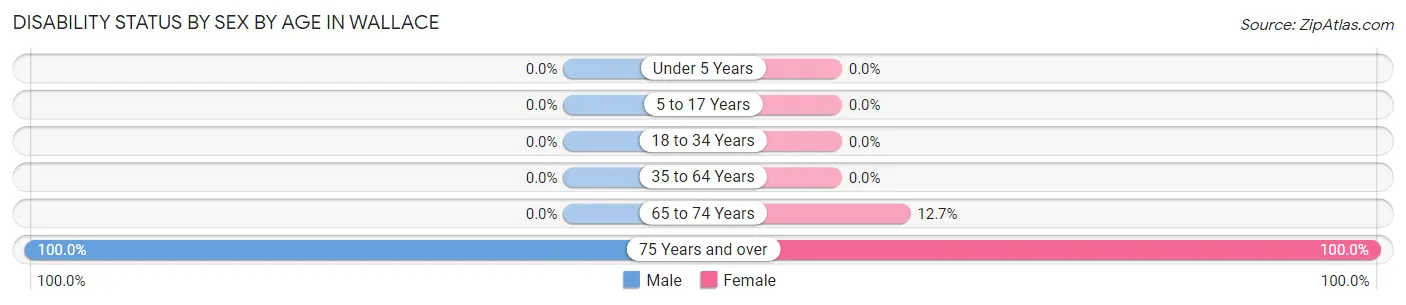
| Age Bracket | Male | Female |
| Under 5 Years | 0 (0.0%) | 0 (0.0%) |
| 5 to 17 Years | 0 (0.0%) | 0 (0.0%) |
| 18 to 34 Years | 0 (0.0%) | 0 (0.0%) |
| 35 to 64 Years | 0 (0.0%) | 0 (0.0%) |
| 65 to 74 Years | 0 (0.0%) | 14 (12.7%) |
| 75 Years and over | 12 (100.0%) | 14 (100.0%) |
Disability Class by Sex by Age in Wallace
Disability Class: Hearing Difficulty
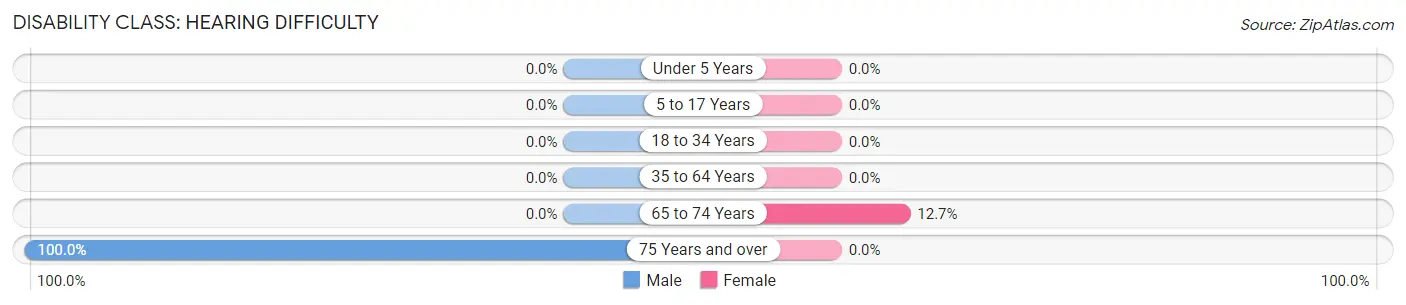
| Age Bracket | Male | Female |
| Under 5 Years | 0 (0.0%) | 0 (0.0%) |
| 5 to 17 Years | 0 (0.0%) | 0 (0.0%) |
| 18 to 34 Years | 0 (0.0%) | 0 (0.0%) |
| 35 to 64 Years | 0 (0.0%) | 0 (0.0%) |
| 65 to 74 Years | 0 (0.0%) | 14 (12.7%) |
| 75 Years and over | 12 (100.0%) | 0 (0.0%) |
Disability Class: Vision Difficulty
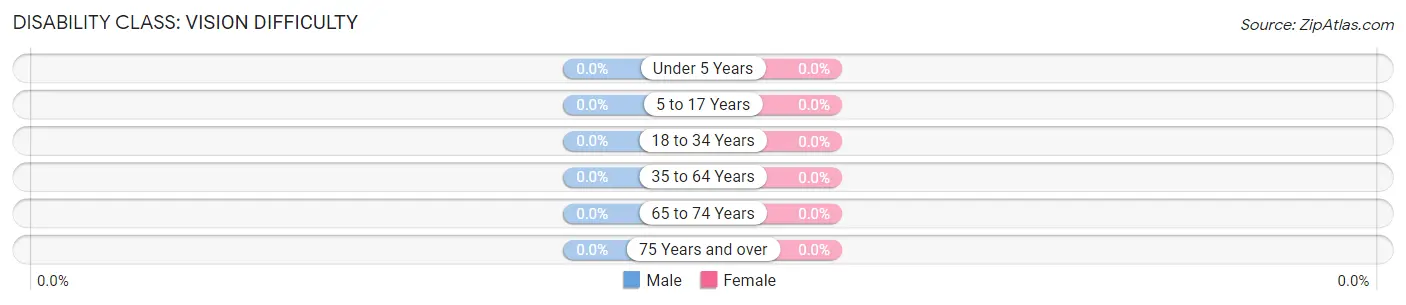
| Age Bracket | Male | Female |
| Under 5 Years | 0 (0.0%) | 0 (0.0%) |
| 5 to 17 Years | 0 (0.0%) | 0 (0.0%) |
| 18 to 34 Years | 0 (0.0%) | 0 (0.0%) |
| 35 to 64 Years | 0 (0.0%) | 0 (0.0%) |
| 65 to 74 Years | 0 (0.0%) | 0 (0.0%) |
| 75 Years and over | 0 (0.0%) | 0 (0.0%) |
Disability Class: Cognitive Difficulty

| Age Bracket | Male | Female |
| 5 to 17 Years | 0 (0.0%) | 0 (0.0%) |
| 18 to 34 Years | 0 (0.0%) | 0 (0.0%) |
| 35 to 64 Years | 0 (0.0%) | 0 (0.0%) |
| 65 to 74 Years | 0 (0.0%) | 14 (12.7%) |
| 75 Years and over | 0 (0.0%) | 0 (0.0%) |
Disability Class: Ambulatory Difficulty
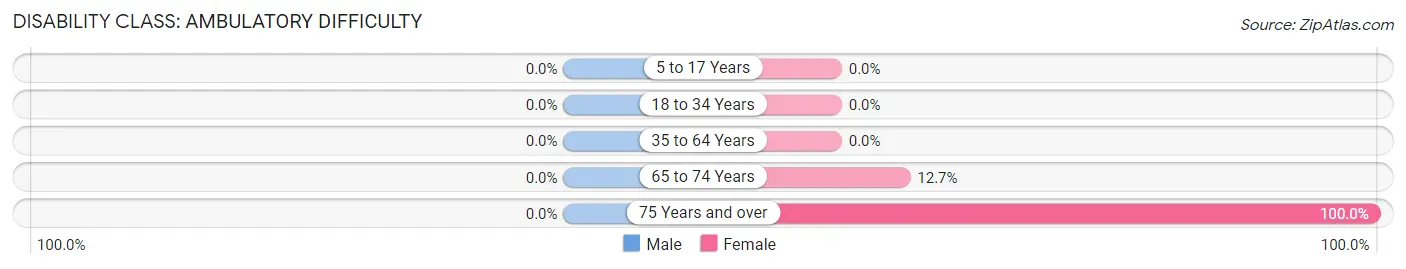
| Age Bracket | Male | Female |
| 5 to 17 Years | 0 (0.0%) | 0 (0.0%) |
| 18 to 34 Years | 0 (0.0%) | 0 (0.0%) |
| 35 to 64 Years | 0 (0.0%) | 0 (0.0%) |
| 65 to 74 Years | 0 (0.0%) | 14 (12.7%) |
| 75 Years and over | 0 (0.0%) | 14 (100.0%) |
Disability Class: Self-Care Difficulty
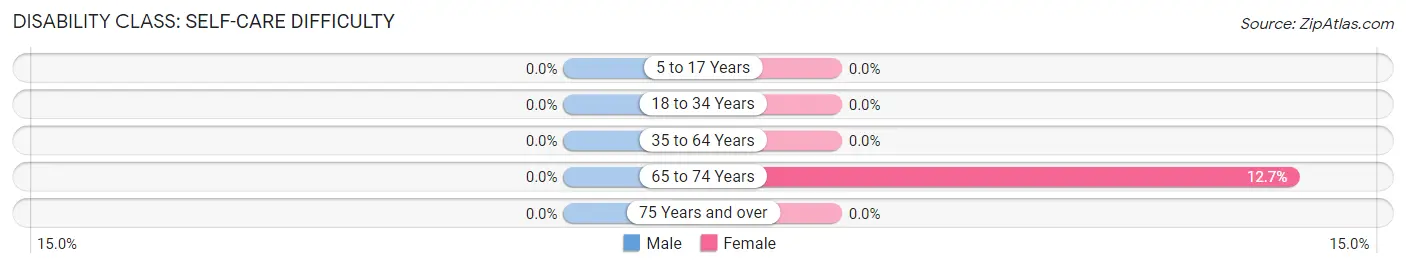
| Age Bracket | Male | Female |
| 5 to 17 Years | 0 (0.0%) | 0 (0.0%) |
| 18 to 34 Years | 0 (0.0%) | 0 (0.0%) |
| 35 to 64 Years | 0 (0.0%) | 0 (0.0%) |
| 65 to 74 Years | 0 (0.0%) | 14 (12.7%) |
| 75 Years and over | 0 (0.0%) | 0 (0.0%) |
Technology Access in Wallace
Computing Device Access in Wallace
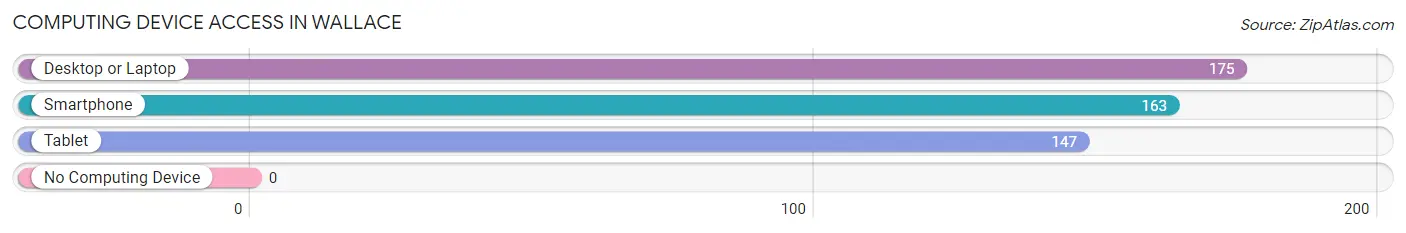
| Device Type | # Households | % Households |
| Desktop or Laptop | 175 | 92.6% |
| Smartphone | 163 | 86.2% |
| Tablet | 147 | 77.8% |
| No Computing Device | 0 | 0.0% |
| Total | 189 | 100.0% |
Internet Access in Wallace
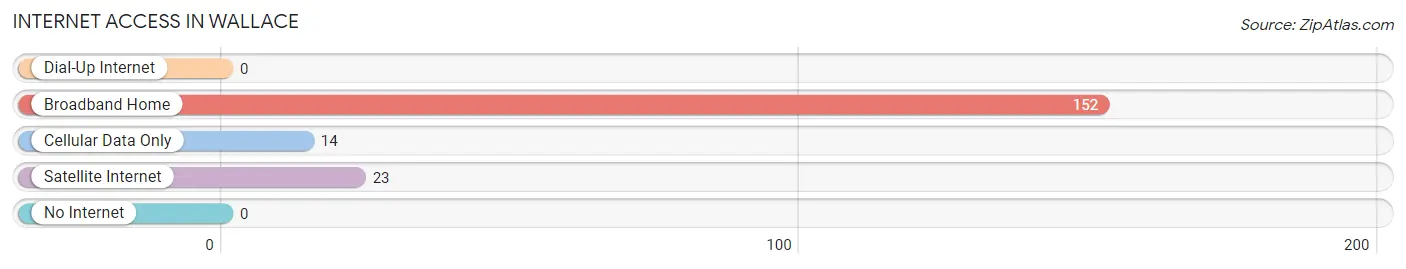
| Internet Type | # Households | % Households |
| Dial-Up Internet | 0 | 0.0% |
| Broadband Home | 152 | 80.4% |
| Cellular Data Only | 14 | 7.4% |
| Satellite Internet | 23 | 12.2% |
| No Internet | 0 | 0.0% |
| Total | 189 | 100.0% |
Wallace Summary
Wallace, California is a small unincorporated community located in the Sierra Nevada foothills of El Dorado County. It is situated in the western part of the county, approximately 25 miles east of Placerville and 40 miles west of South Lake Tahoe. The population of Wallace was estimated to be around 200 people in 2020.
History
The area that is now Wallace was originally inhabited by the Miwok and Maidu Native American tribes. The first European settlers arrived in the area in the mid-1800s, and the town of Wallace was established in 1854. The town was named after a local rancher, William Wallace.
In the late 1800s, Wallace was a bustling mining town, with gold, silver, and copper being mined in the area. The town also had a number of saloons, hotels, and stores. The town's population peaked in the early 1900s, with over 1,000 people living in the area.
In the early 1900s, the mining industry began to decline, and the population of Wallace began to decrease. By the 1950s, the population had dropped to around 200 people.
Geography
Wallace is located in the Sierra Nevada foothills of El Dorado County. It is situated in the western part of the county, approximately 25 miles east of Placerville and 40 miles west of South Lake Tahoe.
The town is surrounded by the Eldorado National Forest, which provides a variety of outdoor recreational activities, including hiking, camping, fishing, and hunting. The area is also home to a number of lakes, including Union Valley Reservoir, Jenkinson Lake, and Silver Lake.
Economy
The economy of Wallace is largely based on tourism and recreation. The town is a popular destination for outdoor enthusiasts, and there are a number of campgrounds, RV parks, and resorts in the area.
The town is also home to a number of small businesses, including restaurants, cafes, and stores. The town also has a post office, a library, and a fire station.
Demographics
The population of Wallace was estimated to be around 200 people in 2020. The town is predominantly white, with around 95% of the population being white. The median household income in Wallace is around $50,000, and the median home value is around $250,000.
Conclusion
Wallace, California is a small unincorporated community located in the Sierra Nevada foothills of El Dorado County. It is a popular destination for outdoor enthusiasts, and the economy of the town is largely based on tourism and recreation. The population of Wallace was estimated to be around 200 people in 2020, and the town is predominantly white.
Common Questions
What is Per Capita Income in Wallace?
Per Capita income in Wallace is $43,670.
What is the Median Family Income in Wallace?
Median Family Income in Wallace is $108,142.
What is the Median Household income in Wallace?
Median Household Income in Wallace is $67,614.
What is Inequality or Gini Index in Wallace?
Inequality or Gini Index in Wallace is 0.32.
What is the Total Population of Wallace?
Total Population of Wallace is 350.
What is the Total Male Population of Wallace?
Total Male Population of Wallace is 123.
What is the Total Female Population of Wallace?
Total Female Population of Wallace is 227.
What is the Ratio of Males per 100 Females in Wallace?
There are 54.19 Males per 100 Females in Wallace.
What is the Ratio of Females per 100 Males in Wallace?
There are 184.55 Females per 100 Males in Wallace.
What is the Median Population Age in Wallace?
Median Population Age in Wallace is 65.7 Years.
What is the Average Family Size in Wallace
Average Family Size in Wallace is 2.7 People.
What is the Average Household Size in Wallace
Average Household Size in Wallace is 1.9 People.
How Large is the Labor Force in Wallace?
There are 217 People in the Labor Forcein in Wallace.
What is the Percentage of People in the Labor Force in Wallace?
62.0% of People are in the Labor Force in Wallace.
What is the Unemployment Rate in Wallace?
Unemployment Rate in Wallace is 12.9%.