Zip Codes with the Highest Percentage of Population Employed in Arts, Entertainment & Recreation in Victorville, CA
RELATED REPORTS & OPTIONS
Arts, Entertainment & Recreation
Victorville
Compare Zip Codes
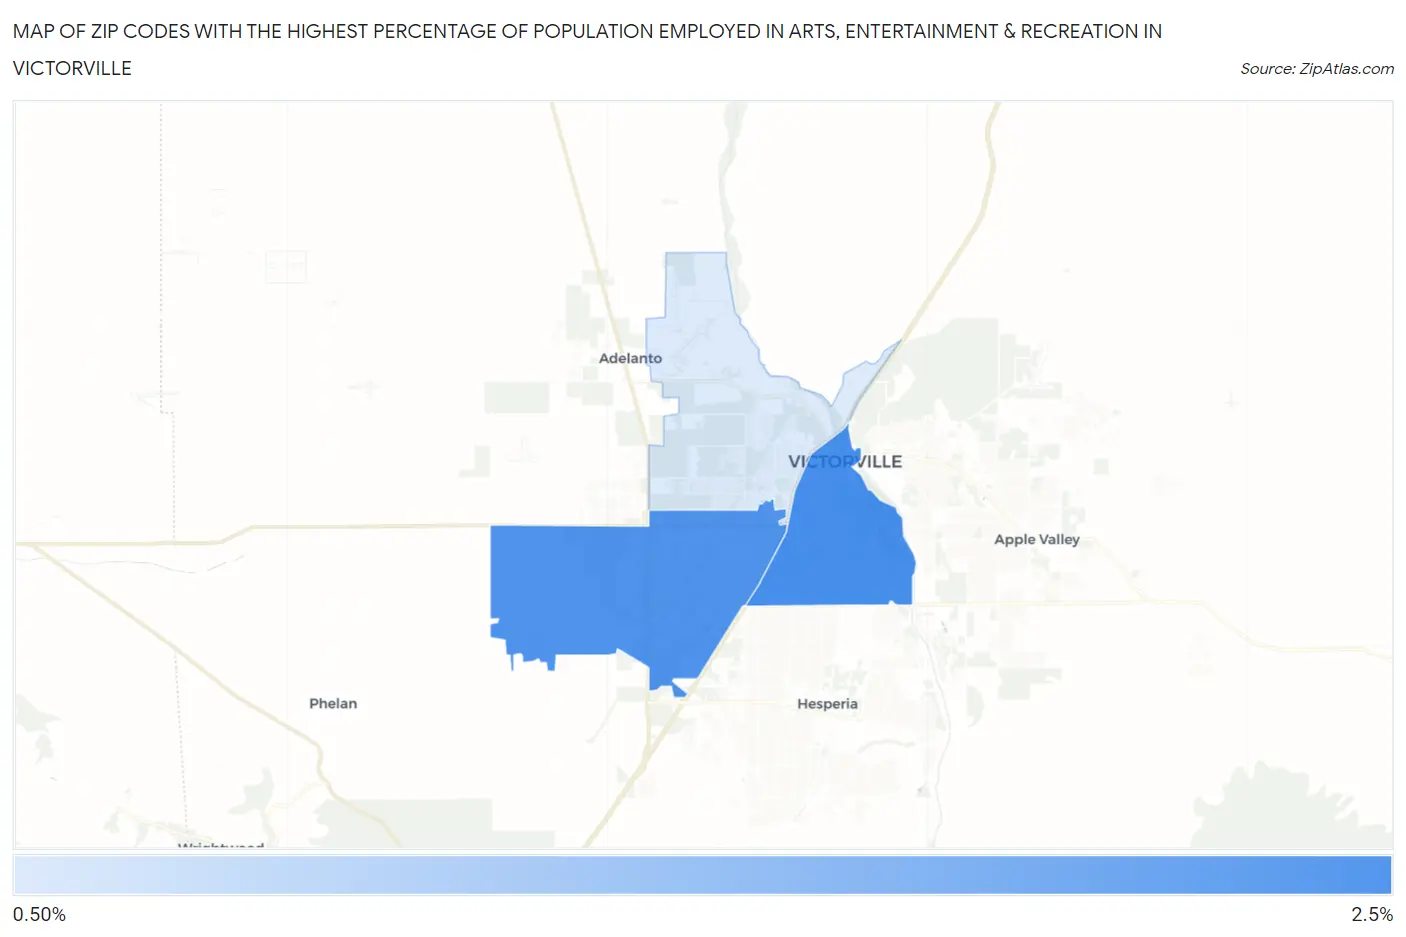
Map of Zip Codes with the Highest Percentage of Population Employed in Arts, Entertainment & Recreation in Victorville
0.0%
2.5%
Zip Codes with the Highest Percentage of Population Employed in Arts, Entertainment & Recreation in Victorville, CA
| Zip Code | % Employed | vs State | vs National | |
| 1. | 92395 | 2.1% | 2.6%(-0.444)#873 | 2.1%(+0.028)#9,157 |
| 2. | 92392 | 2.1% | 2.6%(-0.478)#887 | 2.1%(-0.007)#9,343 |
| 3. | 92394 | 1.3% | 2.6%(-1.21)#1,181 | 2.1%(-0.735)#14,386 |
1
Common Questions
What are the Top Zip Codes with the Highest Percentage of Population Employed in Arts, Entertainment & Recreation in Victorville, CA?
Top Zip Codes with the Highest Percentage of Population Employed in Arts, Entertainment & Recreation in Victorville, CA are:
What zip code has the Highest Percentage of Population Employed in Arts, Entertainment & Recreation in Victorville, CA?
92395 has the Highest Percentage of Population Employed in Arts, Entertainment & Recreation in Victorville, CA with 2.1%.
What is the Percentage of Population Employed in Arts, Entertainment & Recreation in Victorville, CA?
Percentage of Population Employed in Arts, Entertainment & Recreation in Victorville is 1.8%.
What is the Percentage of Population Employed in Arts, Entertainment & Recreation in California?
Percentage of Population Employed in Arts, Entertainment & Recreation in California is 2.6%.
What is the Percentage of Population Employed in Arts, Entertainment & Recreation in the United States?
Percentage of Population Employed in Arts, Entertainment & Recreation in the United States is 2.1%.