Valley Springs, CA Map & Demographics
Valley Springs Map
Valley Springs Overview
$35,697
PER CAPITA INCOME
$79,643
AVG FAMILY INCOME
$90,408
AVG HOUSEHOLD INCOME
54.5%
WAGE / INCOME GAP [ % ]
45.5¢/ $1
WAGE / INCOME GAP [ $ ]
0.31
INEQUALITY / GINI INDEX
3,630
TOTAL POPULATION
1,997
MALE POPULATION
1,633
FEMALE POPULATION
122.29
MALES / 100 FEMALES
81.77
FEMALES / 100 MALES
37.5
MEDIAN AGE
3.3
AVG FAMILY SIZE
3.0
AVG HOUSEHOLD SIZE
1,798
LABOR FORCE [ PEOPLE ]
56.2%
PERCENT IN LABOR FORCE
7.5%
UNEMPLOYMENT RATE
Valley Springs Zip Codes
Valley Springs Area Codes
Income in Valley Springs
Income Overview in Valley Springs
Per Capita Income in Valley Springs is $35,697, while median incomes of families and households are $79,643 and $90,408 respectively.
| Characteristic | Number | Measure |
| Per Capita Income | 3,630 | $35,697 |
| Median Family Income | 882 | $79,643 |
| Mean Family Income | 882 | $103,263 |
| Median Household Income | 1,209 | $90,408 |
| Mean Household Income | 1,209 | $99,364 |
| Income Deficit | 882 | $0 |
| Wage / Income Gap (%) | 3,630 | 54.55% |
| Wage / Income Gap ($) | 3,630 | 45.45¢ per $1 |
| Gini / Inequality Index | 3,630 | 0.31 |
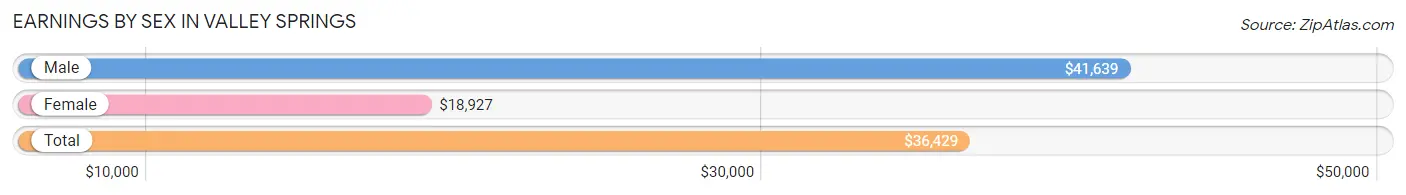
Earnings by Sex in Valley Springs
Average Earnings in Valley Springs are $36,429, $41,639 for men and $18,927 for women, a difference of 54.5%.
| Sex | Number | Average Earnings |
| Male | 1,073 (58.3%) | $41,639 |
| Female | 769 (41.7%) | $18,927 |
| Total | 1,842 (100.0%) | $36,429 |
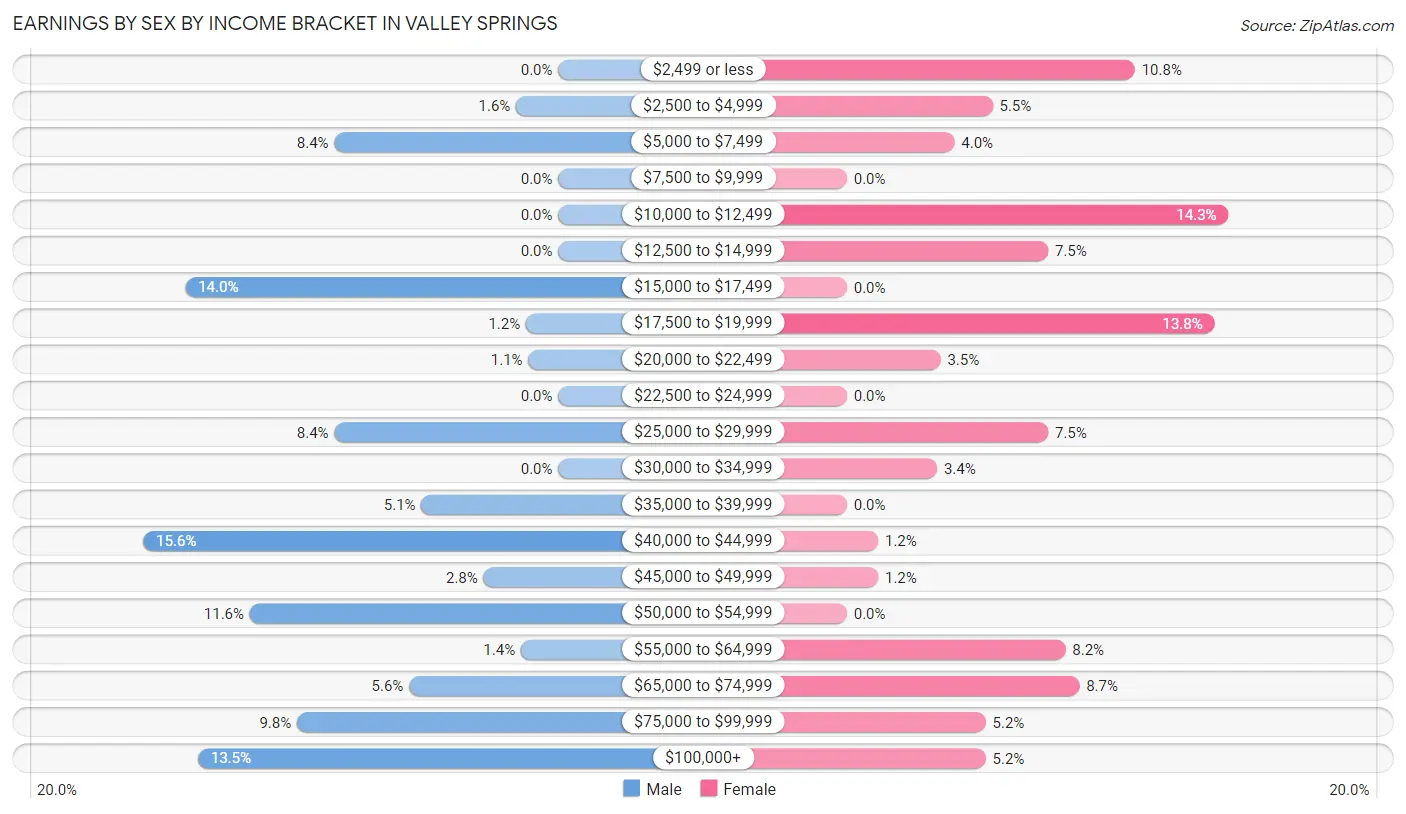
Earnings by Sex by Income Bracket in Valley Springs
The most common earnings brackets in Valley Springs are $40,000 to $44,999 for men (167 | 15.6%) and $10,000 to $12,499 for women (110 | 14.3%).
| Income | Male | Female |
| $2,499 or less | 0 (0.0%) | 83 (10.8%) |
| $2,500 to $4,999 | 17 (1.6%) | 42 (5.5%) |
| $5,000 to $7,499 | 90 (8.4%) | 31 (4.0%) |
| $7,500 to $9,999 | 0 (0.0%) | 0 (0.0%) |
| $10,000 to $12,499 | 0 (0.0%) | 110 (14.3%) |
| $12,500 to $14,999 | 0 (0.0%) | 58 (7.5%) |
| $15,000 to $17,499 | 150 (14.0%) | 0 (0.0%) |
| $17,500 to $19,999 | 13 (1.2%) | 106 (13.8%) |
| $20,000 to $22,499 | 12 (1.1%) | 27 (3.5%) |
| $22,500 to $24,999 | 0 (0.0%) | 0 (0.0%) |
| $25,000 to $29,999 | 90 (8.4%) | 58 (7.5%) |
| $30,000 to $34,999 | 0 (0.0%) | 26 (3.4%) |
| $35,000 to $39,999 | 55 (5.1%) | 0 (0.0%) |
| $40,000 to $44,999 | 167 (15.6%) | 9 (1.2%) |
| $45,000 to $49,999 | 30 (2.8%) | 9 (1.2%) |
| $50,000 to $54,999 | 124 (11.6%) | 0 (0.0%) |
| $55,000 to $64,999 | 15 (1.4%) | 63 (8.2%) |
| $65,000 to $74,999 | 60 (5.6%) | 67 (8.7%) |
| $75,000 to $99,999 | 105 (9.8%) | 40 (5.2%) |
| $100,000+ | 145 (13.5%) | 40 (5.2%) |
| Total | 1,073 (100.0%) | 769 (100.0%) |
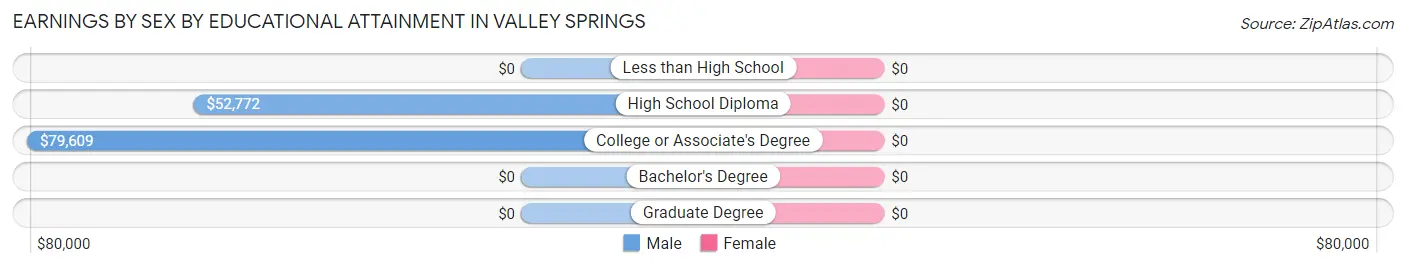
Earnings by Sex by Educational Attainment in Valley Springs
| Educational Attainment | Male Income | Female Income |
| Less than High School | - | - |
| High School Diploma | $52,772 | $0 |
| College or Associate's Degree | $79,609 | $0 |
| Bachelor's Degree | - | - |
| Graduate Degree | - | - |
| Total | $54,977 | $29,394 |
Family Income in Valley Springs
Family Income Brackets in Valley Springs
According to the Valley Springs family income data, there are 194 families falling into the $100,000 to $149,999 income range, which is the most common income bracket and makes up 22.0% of all families.
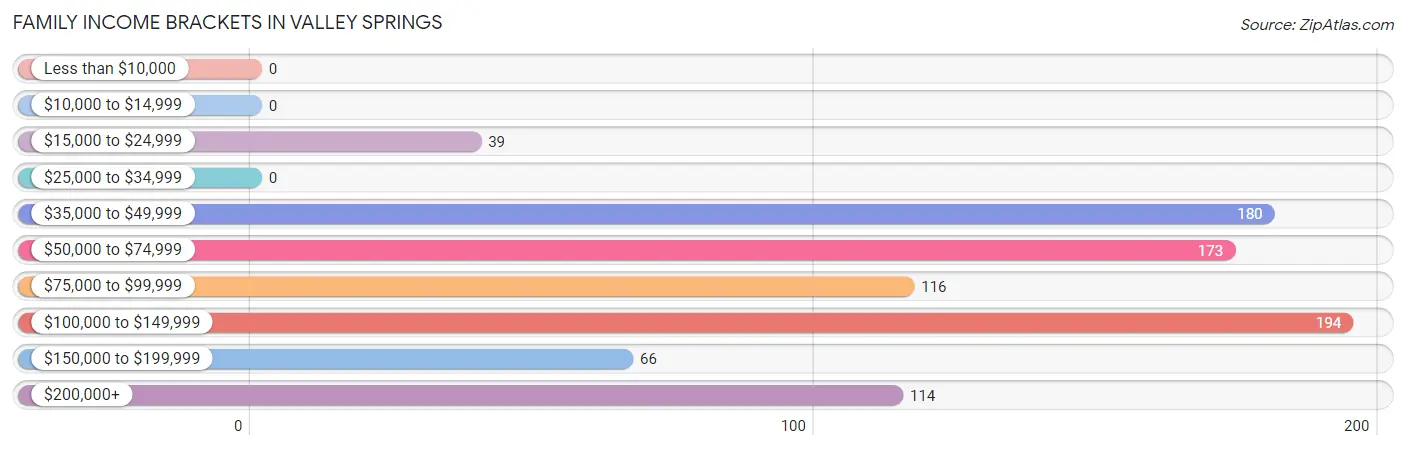
| Income Bracket | # Families | % Families |
| Less than $10,000 | 0 | 0.0% |
| $10,000 to $14,999 | 0 | 0.0% |
| $15,000 to $24,999 | 39 | 4.4% |
| $25,000 to $34,999 | 0 | 0.0% |
| $35,000 to $49,999 | 180 | 20.4% |
| $50,000 to $74,999 | 173 | 19.6% |
| $75,000 to $99,999 | 116 | 13.2% |
| $100,000 to $149,999 | 194 | 22.0% |
| $150,000 to $199,999 | 66 | 7.5% |
| $200,000+ | 114 | 12.9% |
Family Income by Famaliy Size in Valley Springs
3-person families (245 | 27.8%) account for the highest median family income in Valley Springs with $80,607 per family, while 2-person families (438 | 49.7%) have the highest median income of $38,077 per family member.
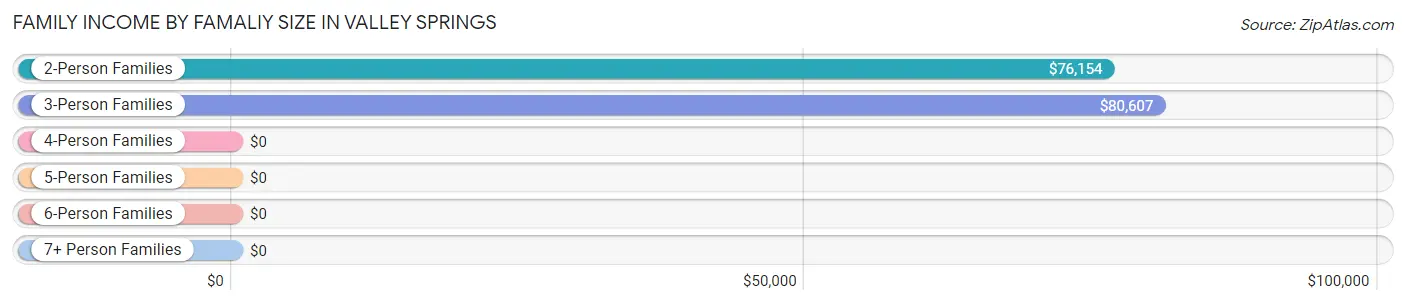
| Income Bracket | # Families | Median Income |
| 2-Person Families | 438 (49.7%) | $76,154 |
| 3-Person Families | 245 (27.8%) | $80,607 |
| 4-Person Families | 168 (19.1%) | $0 |
| 5-Person Families | 17 (1.9%) | $0 |
| 6-Person Families | 14 (1.6%) | $0 |
| 7+ Person Families | 0 (0.0%) | $0 |
| Total | 882 (100.0%) | $79,643 |
Family Income by Number of Earners in Valley Springs
The median family income in Valley Springs is $79,643, with families comprising 1 earner (203) having the highest median family income of $128,661, while families with no earners (216) have the lowest median family income of $45,667, accounting for 23.0% and 24.5% of families, respectively.
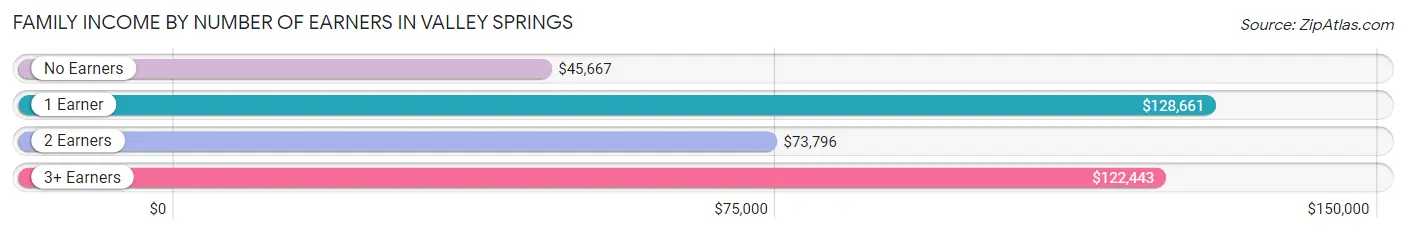
| Number of Earners | # Families | Median Income |
| No Earners | 216 (24.5%) | $45,667 |
| 1 Earner | 203 (23.0%) | $128,661 |
| 2 Earners | 386 (43.8%) | $73,796 |
| 3+ Earners | 77 (8.7%) | $122,443 |
| Total | 882 (100.0%) | $79,643 |
Household Income in Valley Springs
Household Income Brackets in Valley Springs
With 331 households falling in the category, the $100,000 to $149,999 income range is the most frequent in Valley Springs, accounting for 27.4% of all households.
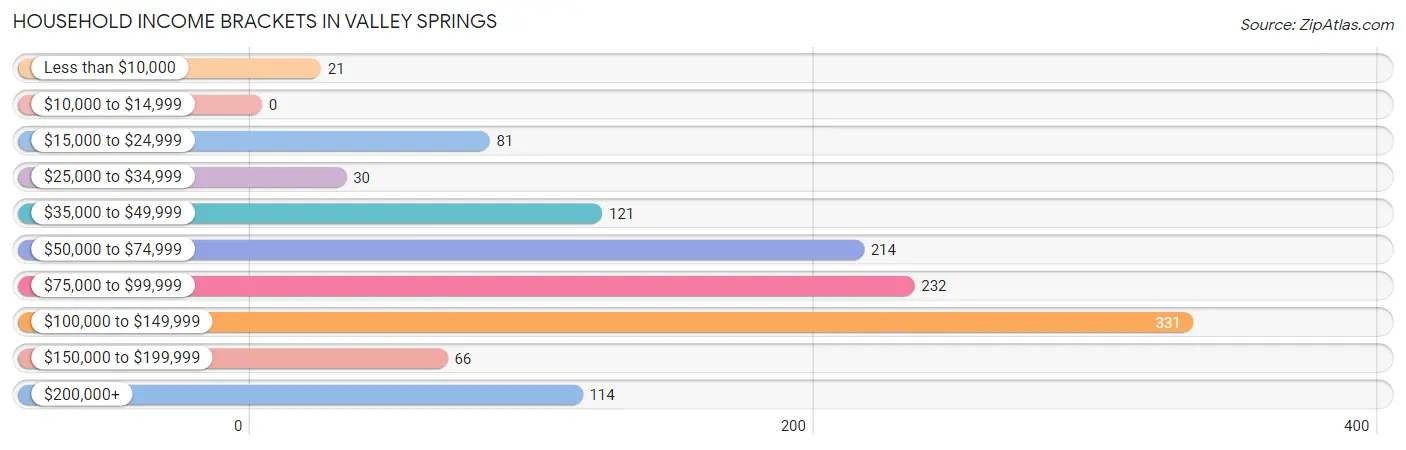
| Income Bracket | # Households | % Households |
| Less than $10,000 | 21 | 1.7% |
| $10,000 to $14,999 | 0 | 0.0% |
| $15,000 to $24,999 | 81 | 6.7% |
| $25,000 to $34,999 | 30 | 2.5% |
| $35,000 to $49,999 | 121 | 10.0% |
| $50,000 to $74,999 | 214 | 17.7% |
| $75,000 to $99,999 | 232 | 19.2% |
| $100,000 to $149,999 | 331 | 27.4% |
| $150,000 to $199,999 | 66 | 5.5% |
| $200,000+ | 114 | 9.4% |
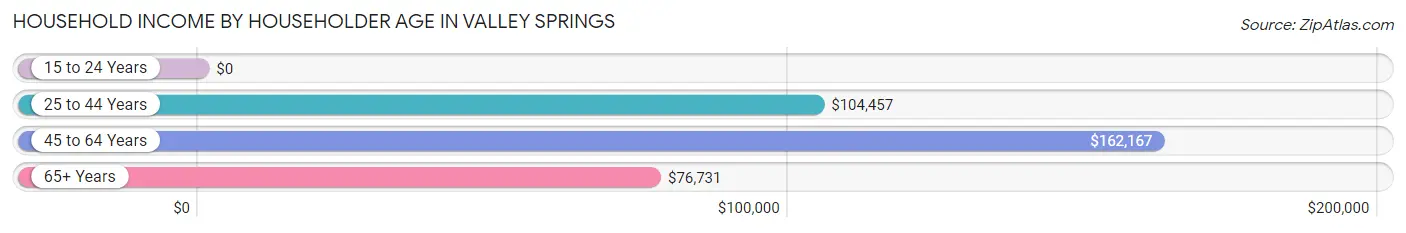
Household Income by Householder Age in Valley Springs
The median household income in Valley Springs is $90,408, with the highest median household income of $162,167 found in the 45 to 64 years age bracket for the primary householder. A total of 280 households (23.2%) fall into this category. Meanwhile, the 15 to 24 years age bracket for the primary householder has the lowest median household income of $0, with 71 households (5.9%) in this group.
| Income Bracket | # Households | Median Income |
| 15 to 24 Years | 71 (5.9%) | $0 |
| 25 to 44 Years | 322 (26.6%) | $104,457 |
| 45 to 64 Years | 280 (23.2%) | $162,167 |
| 65+ Years | 536 (44.3%) | $76,731 |
| Total | 1,209 (100.0%) | $90,408 |
Poverty in Valley Springs
Income Below Poverty by Sex and Age in Valley Springs
With 15.8% poverty level for males and 5.3% for females among the residents of Valley Springs, 6 to 11 year old males and 18 to 24 year old females are the most vulnerable to poverty, with 14 males (100.0%) and 58 females (22.6%) in their respective age groups living below the poverty level.
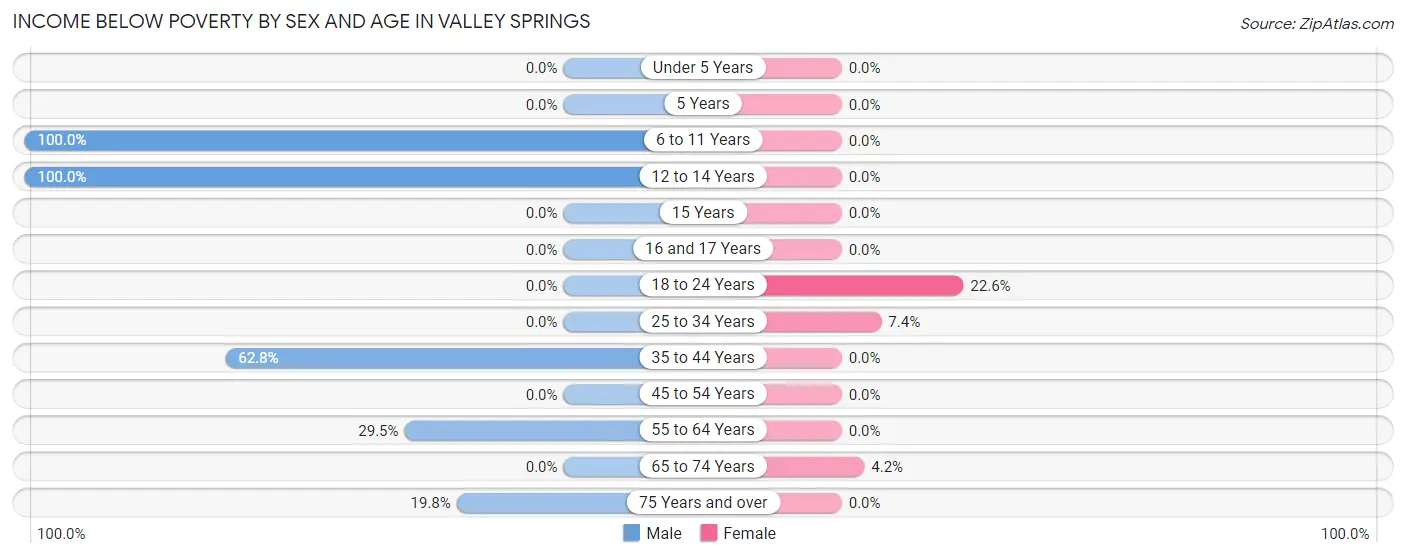
| Age Bracket | Male | Female |
| Under 5 Years | 0 (0.0%) | 0 (0.0%) |
| 5 Years | 0 (0.0%) | 0 (0.0%) |
| 6 to 11 Years | 14 (100.0%) | 0 (0.0%) |
| 12 to 14 Years | 14 (100.0%) | 0 (0.0%) |
| 15 Years | 0 (0.0%) | 0 (0.0%) |
| 16 and 17 Years | 0 (0.0%) | 0 (0.0%) |
| 18 to 24 Years | 0 (0.0%) | 58 (22.6%) |
| 25 to 34 Years | 0 (0.0%) | 15 (7.3%) |
| 35 to 44 Years | 192 (62.7%) | 0 (0.0%) |
| 45 to 54 Years | 0 (0.0%) | 0 (0.0%) |
| 55 to 64 Years | 54 (29.5%) | 0 (0.0%) |
| 65 to 74 Years | 0 (0.0%) | 14 (4.2%) |
| 75 Years and over | 41 (19.8%) | 0 (0.0%) |
| Total | 315 (15.8%) | 87 (5.3%) |
Income Above Poverty by Sex and Age in Valley Springs
According to the poverty statistics in Valley Springs, males aged under 5 years and females aged under 5 years are the age groups that are most secure financially, with 100.0% of males and 100.0% of females in these age groups living above the poverty line.
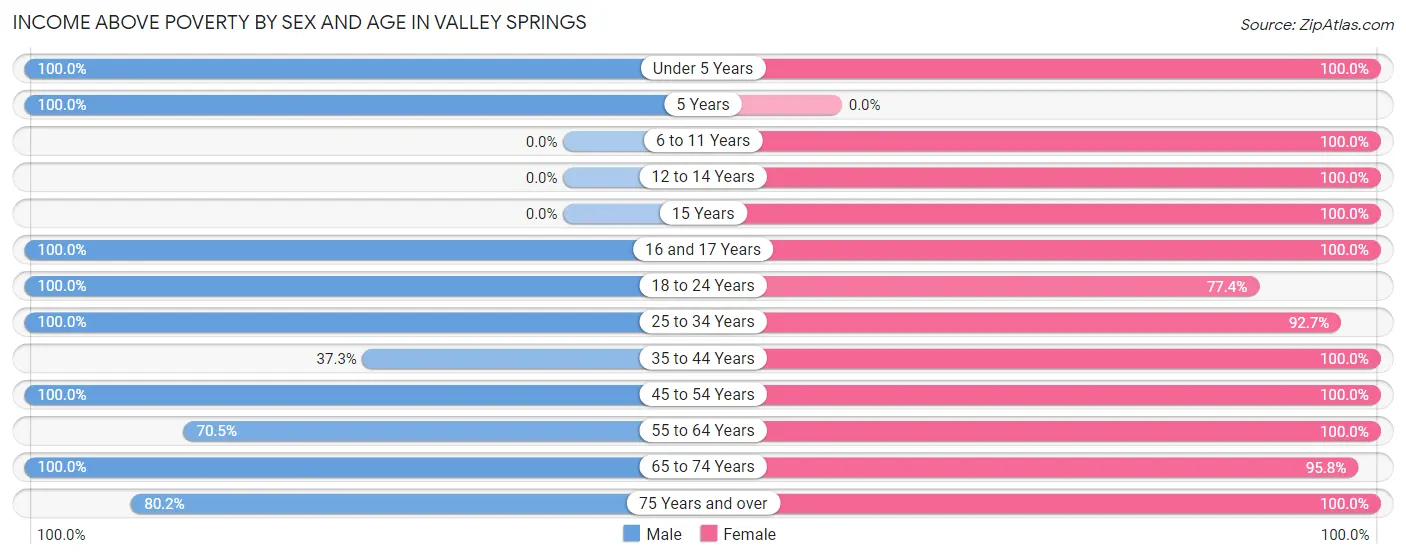
| Age Bracket | Male | Female |
| Under 5 Years | 103 (100.0%) | 40 (100.0%) |
| 5 Years | 41 (100.0%) | 0 (0.0%) |
| 6 to 11 Years | 0 (0.0%) | 108 (100.0%) |
| 12 to 14 Years | 0 (0.0%) | 95 (100.0%) |
| 15 Years | 0 (0.0%) | 15 (100.0%) |
| 16 and 17 Years | 146 (100.0%) | 27 (100.0%) |
| 18 to 24 Years | 291 (100.0%) | 199 (77.4%) |
| 25 to 34 Years | 380 (100.0%) | 189 (92.6%) |
| 35 to 44 Years | 114 (37.2%) | 125 (100.0%) |
| 45 to 54 Years | 126 (100.0%) | 174 (100.0%) |
| 55 to 64 Years | 129 (70.5%) | 105 (100.0%) |
| 65 to 74 Years | 186 (100.0%) | 320 (95.8%) |
| 75 Years and over | 166 (80.2%) | 149 (100.0%) |
| Total | 1,682 (84.2%) | 1,546 (94.7%) |
Income Below Poverty Among Married-Couple Families in Valley Springs
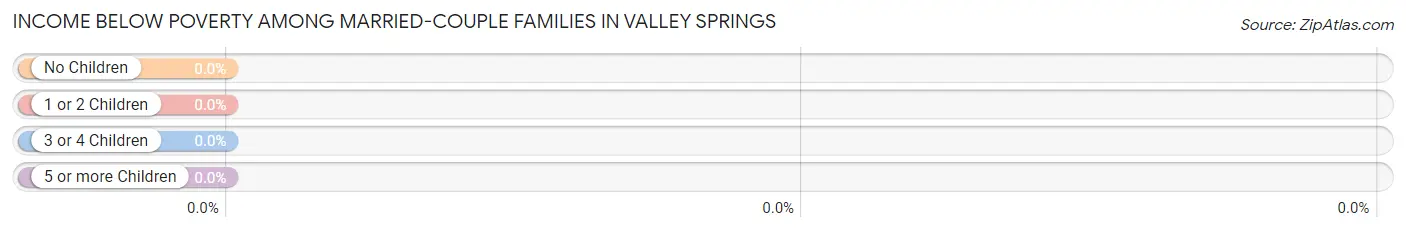
| Children | Above Poverty | Below Poverty |
| No Children | 460 (100.0%) | 0 (0.0%) |
| 1 or 2 Children | 242 (100.0%) | 0 (0.0%) |
| 3 or 4 Children | 14 (100.0%) | 0 (0.0%) |
| 5 or more Children | 0 (0.0%) | 0 (0.0%) |
| Total | 716 (100.0%) | 0 (0.0%) |
Income Below Poverty Among Single-Parent Households in Valley Springs
According to the poverty data in Valley Springs, 18.8% or 12 single-father households and 13.7% or 14 single-mother households are living below the poverty line. Among single-father households, those with 1 or 2 children have the highest poverty rate, with 12 households (18.8%) experiencing poverty. Likewise, among single-mother households, those with no children have the highest poverty rate, with 14 households (13.7%) falling below the poverty line.
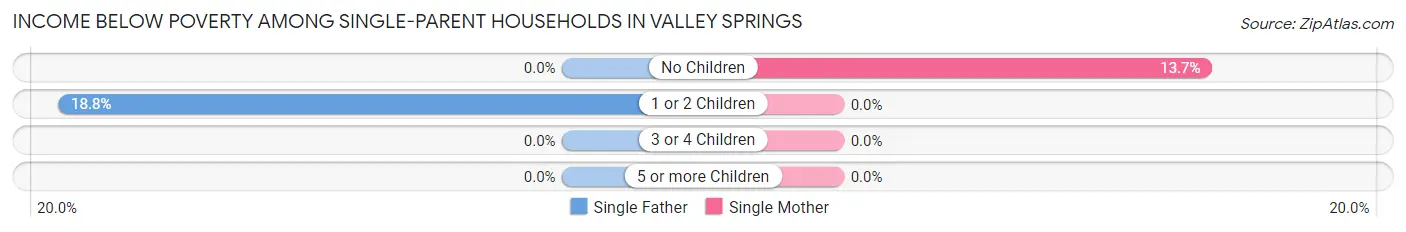
| Children | Single Father | Single Mother |
| No Children | 0 (0.0%) | 14 (13.7%) |
| 1 or 2 Children | 12 (18.8%) | 0 (0.0%) |
| 3 or 4 Children | 0 (0.0%) | 0 (0.0%) |
| 5 or more Children | 0 (0.0%) | 0 (0.0%) |
| Total | 12 (18.8%) | 14 (13.7%) |
Income Below Poverty Among Married-Couple vs Single-Parent Households in Valley Springs
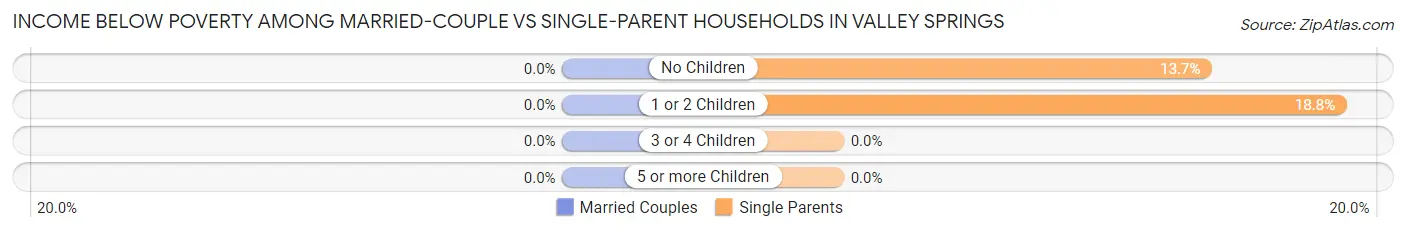
| Children | Married-Couple Families | Single-Parent Households |
| No Children | 0 (0.0%) | 14 (13.7%) |
| 1 or 2 Children | 0 (0.0%) | 12 (18.8%) |
| 3 or 4 Children | 0 (0.0%) | 0 (0.0%) |
| 5 or more Children | 0 (0.0%) | 0 (0.0%) |
| Total | 0 (0.0%) | 26 (15.7%) |
Race in Valley Springs
The most populous races in Valley Springs are White / Caucasian (3,107 | 85.6%), Hispanic or Latino (803 | 22.1%), and Two or more Races (413 | 11.4%).
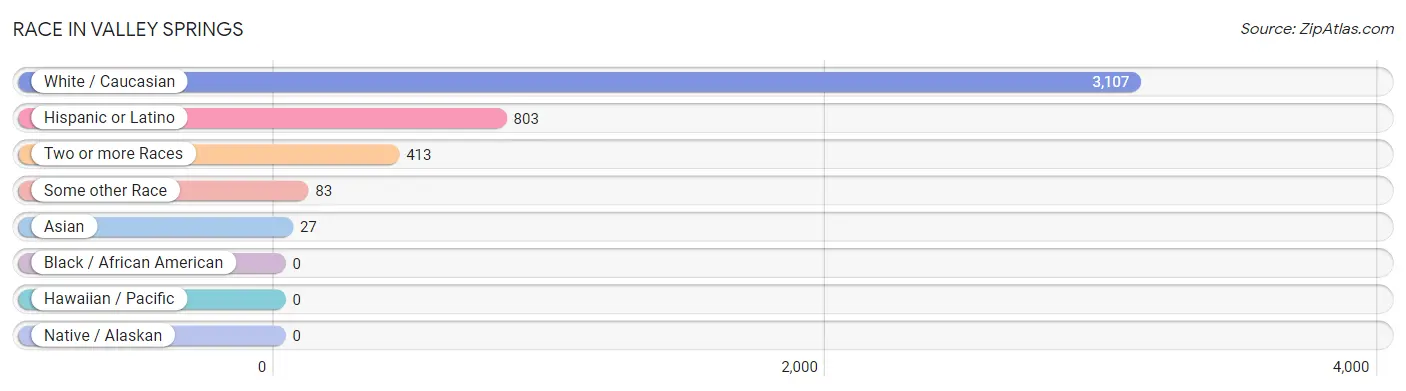
| Race | # Population | % Population |
| Asian | 27 | 0.7% |
| Black / African American | 0 | 0.0% |
| Hawaiian / Pacific | 0 | 0.0% |
| Hispanic or Latino | 803 | 22.1% |
| Native / Alaskan | 0 | 0.0% |
| White / Caucasian | 3,107 | 85.6% |
| Two or more Races | 413 | 11.4% |
| Some other Race | 83 | 2.3% |
| Total | 3,630 | 100.0% |
Ancestry in Valley Springs
The most populous ancestries reported in Valley Springs are English (726 | 20.0%), Mexican (592 | 16.3%), German (369 | 10.2%), European (284 | 7.8%), and Italian (271 | 7.5%), together accounting for 61.8% of all Valley Springs residents.
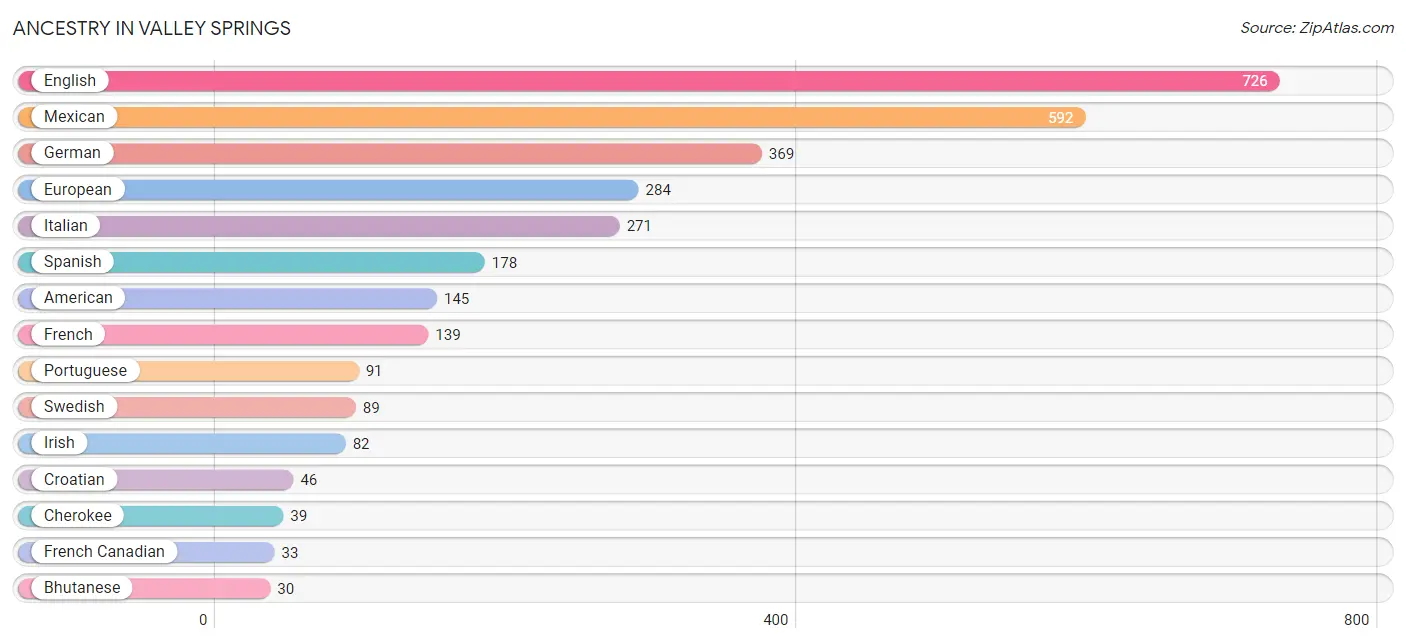
| Ancestry | # Population | % Population |
| American | 145 | 4.0% |
| Bhutanese | 30 | 0.8% |
| Burmese | 18 | 0.5% |
| Cherokee | 39 | 1.1% |
| Croatian | 46 | 1.3% |
| Dutch | 6 | 0.2% |
| English | 726 | 20.0% |
| European | 284 | 7.8% |
| French | 139 | 3.8% |
| French Canadian | 33 | 0.9% |
| German | 369 | 10.2% |
| Greek | 10 | 0.3% |
| Irish | 82 | 2.3% |
| Italian | 271 | 7.5% |
| Korean | 30 | 0.8% |
| Mexican | 592 | 16.3% |
| Norwegian | 7 | 0.2% |
| Portuguese | 91 | 2.5% |
| Scandinavian | 11 | 0.3% |
| Scottish | 26 | 0.7% |
| Spaniard | 13 | 0.4% |
| Spanish | 178 | 4.9% |
| Swedish | 89 | 2.5% |
| Welsh | 30 | 0.8% |
| Yugoslavian | 11 | 0.3% | View All 25 Rows |
Immigrants in Valley Springs
The most numerous immigrant groups reported in Valley Springs came from Central America (55 | 1.5%), Latin America (55 | 1.5%), Mexico (55 | 1.5%), Asia (24 | 0.7%), and Eastern Asia (18 | 0.5%), together accounting for 5.7% of all Valley Springs residents.
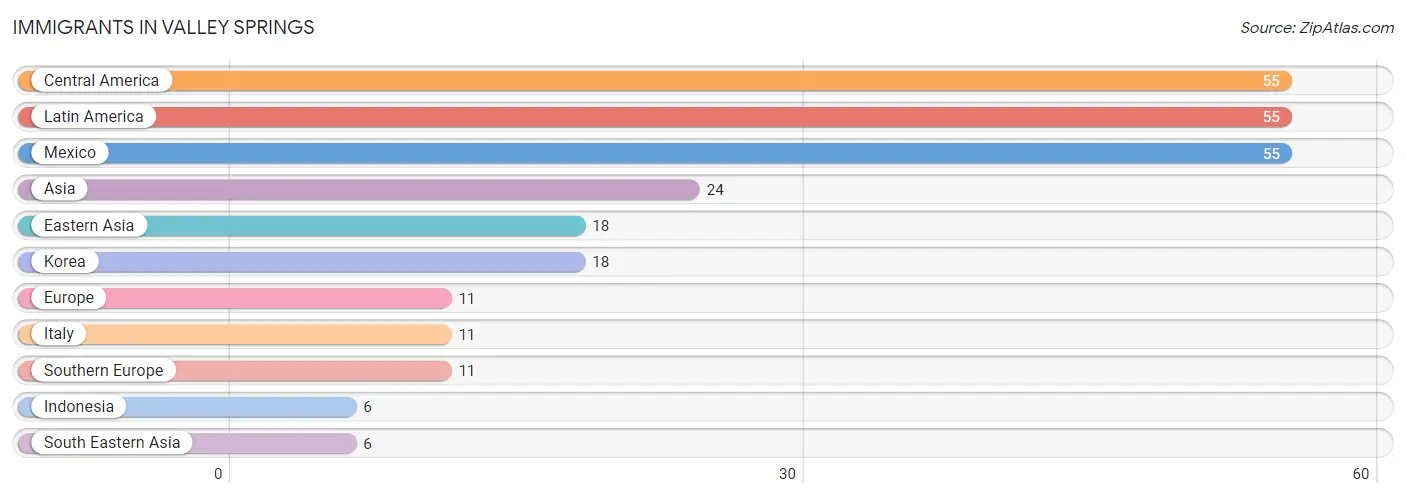
| Immigration Origin | # Population | % Population |
| Asia | 24 | 0.7% |
| Central America | 55 | 1.5% |
| Eastern Asia | 18 | 0.5% |
| Europe | 11 | 0.3% |
| Indonesia | 6 | 0.2% |
| Italy | 11 | 0.3% |
| Korea | 18 | 0.5% |
| Latin America | 55 | 1.5% |
| Mexico | 55 | 1.5% |
| South Eastern Asia | 6 | 0.2% |
| Southern Europe | 11 | 0.3% | View All 11 Rows |
Sex and Age in Valley Springs
Sex and Age in Valley Springs
The most populous age groups in Valley Springs are 40 to 44 Years (257 | 12.9%) for men and 20 to 24 Years (220 | 13.5%) for women.
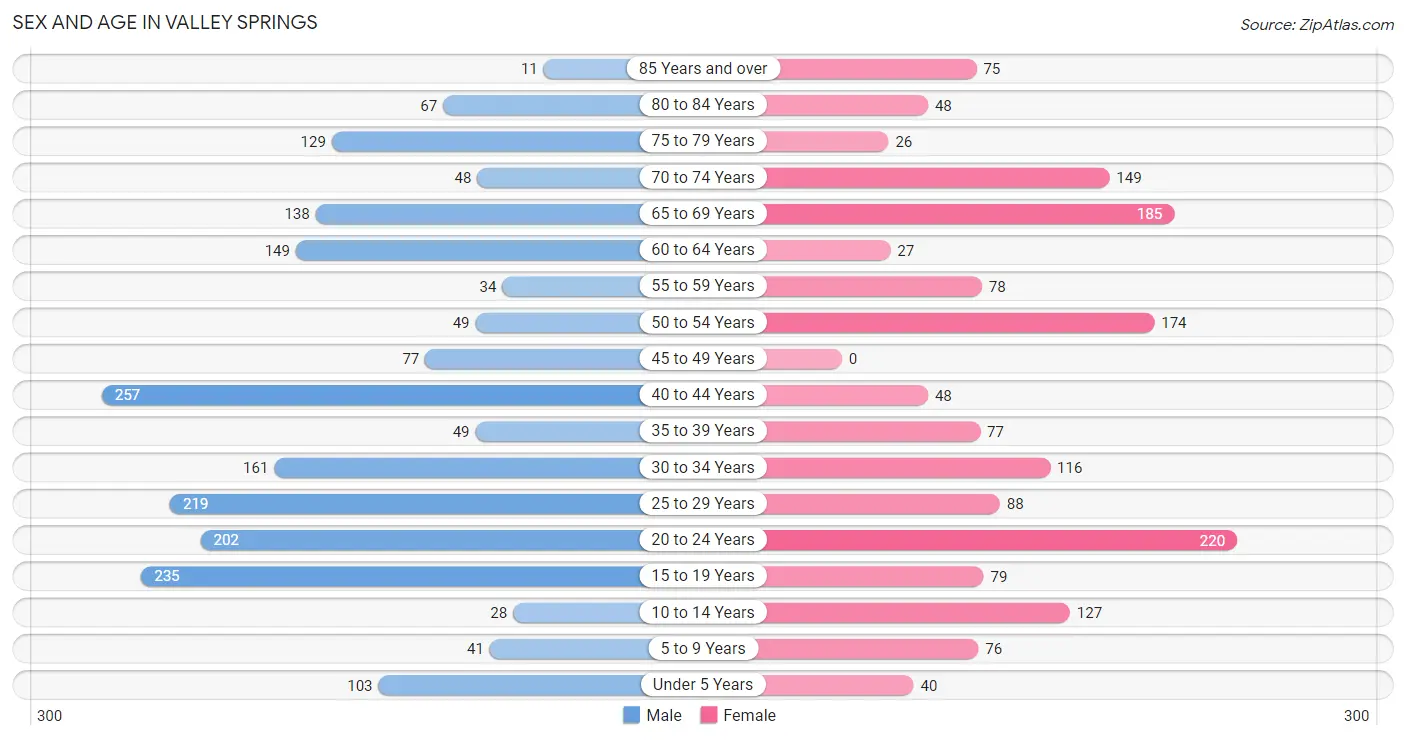
| Age Bracket | Male | Female |
| Under 5 Years | 103 (5.2%) | 40 (2.5%) |
| 5 to 9 Years | 41 (2.1%) | 76 (4.6%) |
| 10 to 14 Years | 28 (1.4%) | 127 (7.8%) |
| 15 to 19 Years | 235 (11.8%) | 79 (4.8%) |
| 20 to 24 Years | 202 (10.1%) | 220 (13.5%) |
| 25 to 29 Years | 219 (11.0%) | 88 (5.4%) |
| 30 to 34 Years | 161 (8.1%) | 116 (7.1%) |
| 35 to 39 Years | 49 (2.5%) | 77 (4.7%) |
| 40 to 44 Years | 257 (12.9%) | 48 (2.9%) |
| 45 to 49 Years | 77 (3.9%) | 0 (0.0%) |
| 50 to 54 Years | 49 (2.5%) | 174 (10.7%) |
| 55 to 59 Years | 34 (1.7%) | 78 (4.8%) |
| 60 to 64 Years | 149 (7.5%) | 27 (1.7%) |
| 65 to 69 Years | 138 (6.9%) | 185 (11.3%) |
| 70 to 74 Years | 48 (2.4%) | 149 (9.1%) |
| 75 to 79 Years | 129 (6.5%) | 26 (1.6%) |
| 80 to 84 Years | 67 (3.4%) | 48 (2.9%) |
| 85 Years and over | 11 (0.5%) | 75 (4.6%) |
| Total | 1,997 (100.0%) | 1,633 (100.0%) |
Families and Households in Valley Springs
Median Family Size in Valley Springs
The median family size in Valley Springs is 3.28 persons per family, with single female/mother families (102 | 11.6%) accounting for the largest median family size of 5.35 persons per family. On the other hand, single male/father families (64 | 7.3%) represent the smallest median family size with 2.59 persons per family.
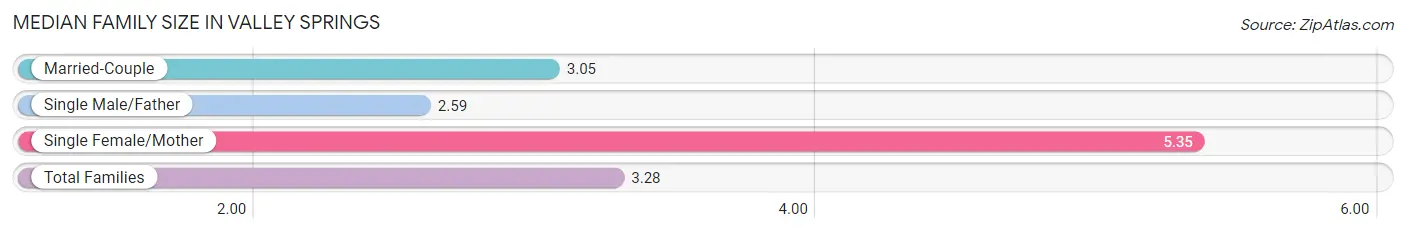
| Family Type | # Families | Family Size |
| Married-Couple | 716 (81.2%) | 3.05 |
| Single Male/Father | 64 (7.3%) | 2.59 |
| Single Female/Mother | 102 (11.6%) | 5.35 |
| Total Families | 882 (100.0%) | 3.28 |
Median Household Size in Valley Springs
The median household size in Valley Springs is 3.00 persons per household, with single female/mother households (102 | 8.4%) accounting for the largest median household size of 6.93 persons per household. non-family households (327 | 27.1%) represent the smallest median household size with 1.31 persons per household.
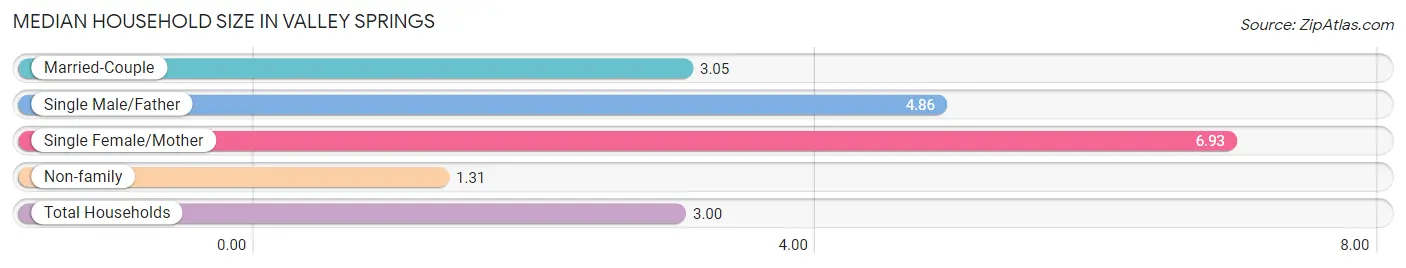
| Household Type | # Households | Household Size |
| Married-Couple | 716 (59.2%) | 3.05 |
| Single Male/Father | 64 (5.3%) | 4.86 |
| Single Female/Mother | 102 (8.4%) | 6.93 |
| Non-family | 327 (27.1%) | 1.31 |
| Total Households | 1,209 (100.0%) | 3.00 |
Household Size by Marriage Status in Valley Springs
Out of a total of 1,209 households in Valley Springs, 882 (73.0%) are family households, while 327 (27.1%) are nonfamily households. The most numerous type of family households are 2-person households, comprising 393, and the most common type of nonfamily households are 1-person households, comprising 273.
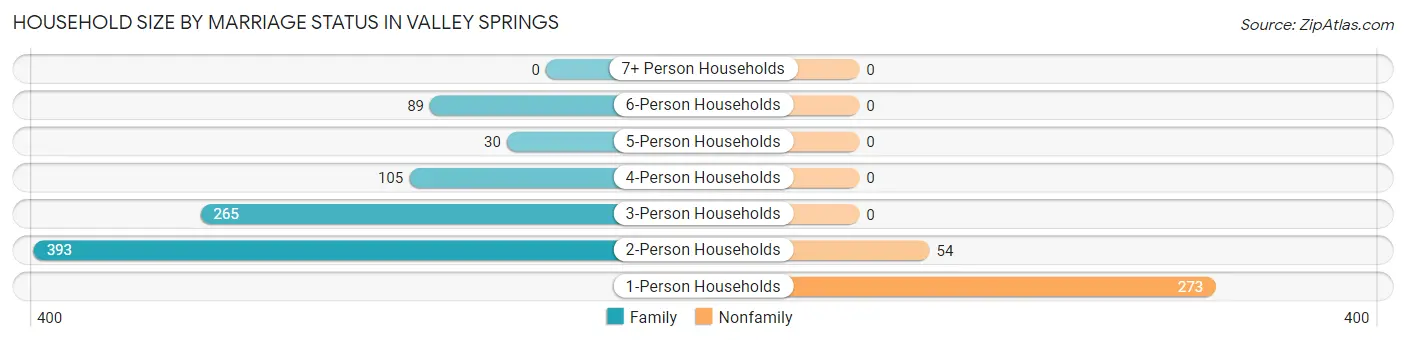
| Household Size | Family Households | Nonfamily Households |
| 1-Person Households | - | 273 (22.6%) |
| 2-Person Households | 393 (32.5%) | 54 (4.5%) |
| 3-Person Households | 265 (21.9%) | 0 (0.0%) |
| 4-Person Households | 105 (8.7%) | 0 (0.0%) |
| 5-Person Households | 30 (2.5%) | 0 (0.0%) |
| 6-Person Households | 89 (7.4%) | 0 (0.0%) |
| 7+ Person Households | 0 (0.0%) | 0 (0.0%) |
| Total | 882 (73.0%) | 327 (27.1%) |
Female Fertility in Valley Springs
Fertility by Age in Valley Springs
Average fertility rate in Valley Springs is 88.0 births per 1,000 women. Women in the age bracket of 20 to 34 years have the highest fertility rate with 106.0 births per 1,000 women. Women in the age bracket of 20 to 34 years acount for 81.8% of all women with births.
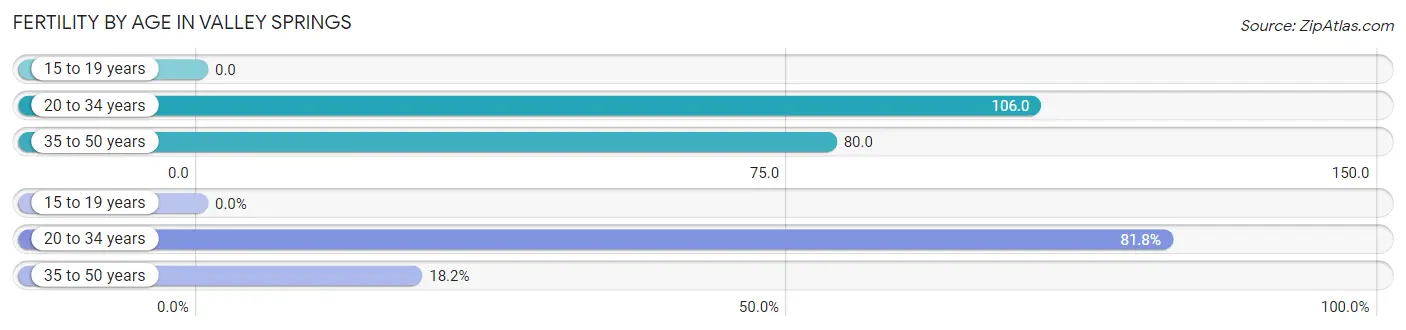
| Age Bracket | Women with Births | Births / 1,000 Women |
| 15 to 19 years | 0 (0.0%) | 0.0 |
| 20 to 34 years | 45 (81.8%) | 106.0 |
| 35 to 50 years | 10 (18.2%) | 80.0 |
| Total | 55 (100.0%) | 88.0 |
Fertility by Age by Marriage Status in Valley Springs
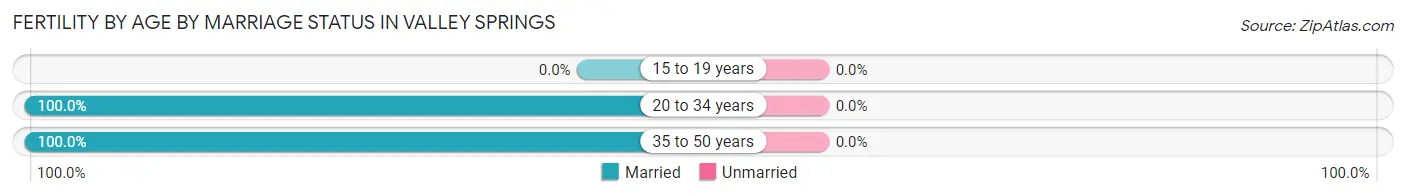
| Age Bracket | Married | Unmarried |
| 15 to 19 years | 0 (0.0%) | 0 (0.0%) |
| 20 to 34 years | 45 (100.0%) | 0 (0.0%) |
| 35 to 50 years | 10 (100.0%) | 0 (0.0%) |
| Total | 55 (100.0%) | 0 (0.0%) |
Fertility by Education in Valley Springs
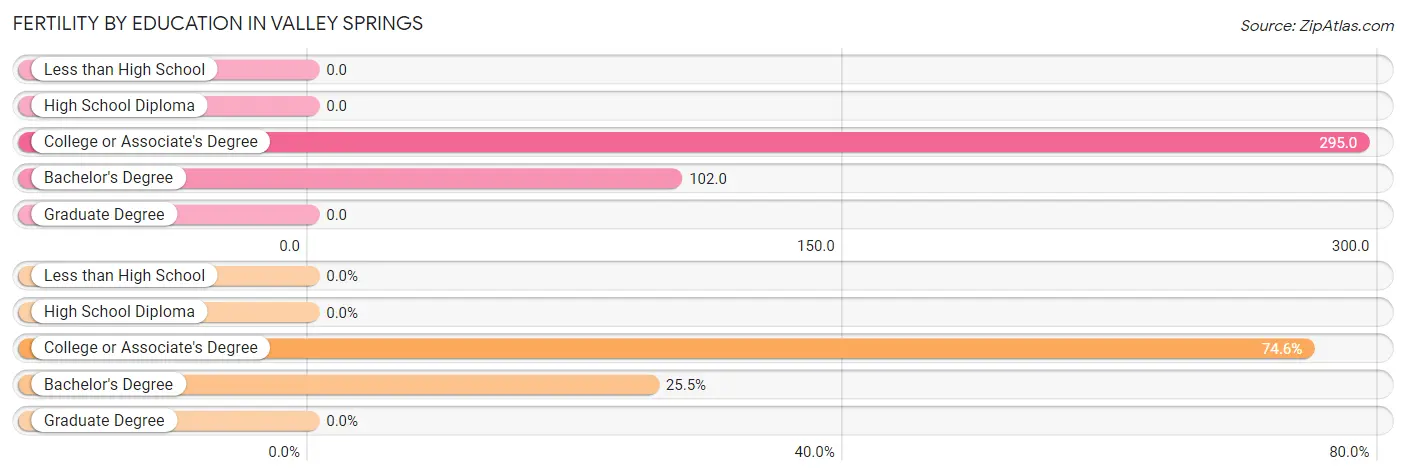
| Educational Attainment | Women with Births | Births / 1,000 Women |
| Less than High School | 0 (0.0%) | 0.0 |
| High School Diploma | 0 (0.0%) | 0.0 |
| College or Associate's Degree | 41 (74.6%) | 295.0 |
| Bachelor's Degree | 14 (25.5%) | 102.0 |
| Graduate Degree | 0 (0.0%) | 0.0 |
| Total | 55 (100.0%) | 88.0 |
Fertility by Education by Marriage Status in Valley Springs
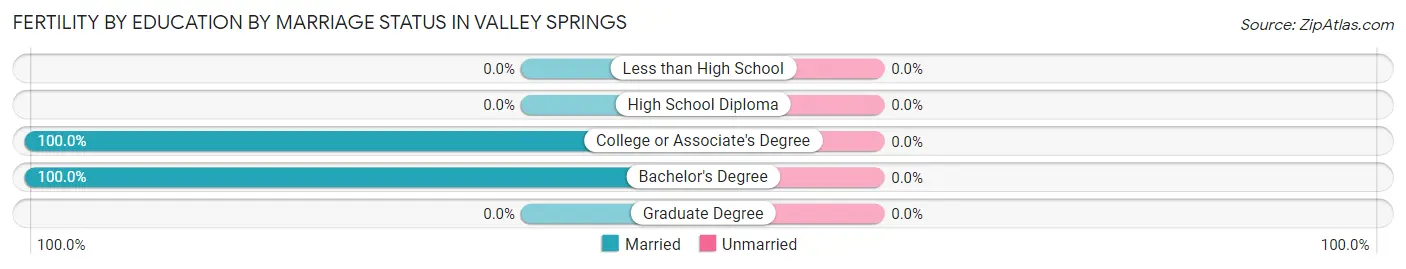
| Educational Attainment | Married | Unmarried |
| Less than High School | 0 (0.0%) | 0 (0.0%) |
| High School Diploma | 0 (0.0%) | 0 (0.0%) |
| College or Associate's Degree | 41 (100.0%) | 0 (0.0%) |
| Bachelor's Degree | 14 (100.0%) | 0 (0.0%) |
| Graduate Degree | 0 (0.0%) | 0 (0.0%) |
| Total | 55 (100.0%) | 0 (0.0%) |
Employment Characteristics in Valley Springs
Employment by Class of Employer in Valley Springs
Among the 1,625 employed individuals in Valley Springs, private company employees (1,211 | 74.5%), local government employees (197 | 12.1%), and self-employed (incorporated) (81 | 5.0%) make up the most common classes of employment.
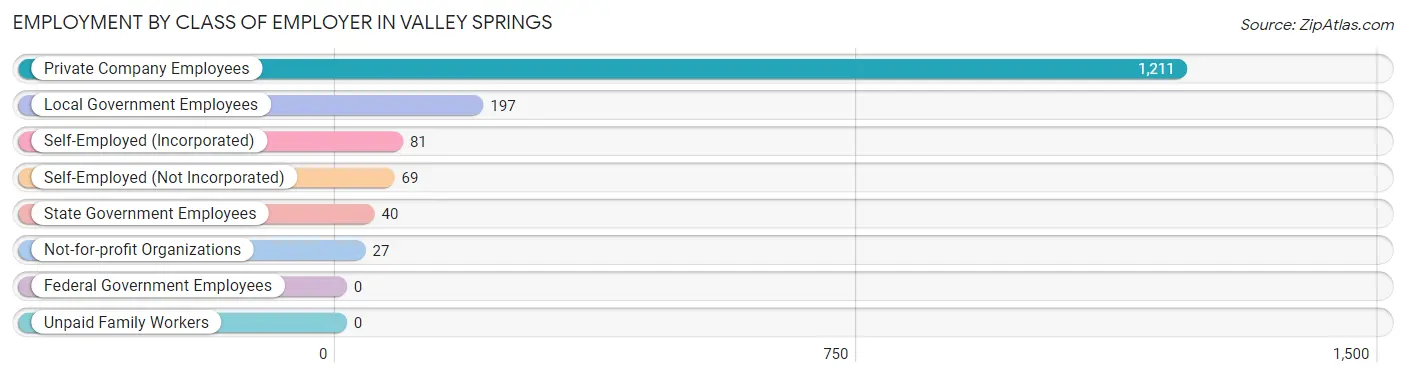
| Employer Class | # Employees | % Employees |
| Private Company Employees | 1,211 | 74.5% |
| Self-Employed (Incorporated) | 81 | 5.0% |
| Self-Employed (Not Incorporated) | 69 | 4.3% |
| Not-for-profit Organizations | 27 | 1.7% |
| Local Government Employees | 197 | 12.1% |
| State Government Employees | 40 | 2.5% |
| Federal Government Employees | 0 | 0.0% |
| Unpaid Family Workers | 0 | 0.0% |
| Total | 1,625 | 100.0% |
Employment Status by Age in Valley Springs
According to the labor force statistics for Valley Springs, out of the total population over 16 years of age (3,200), 56.2% or 1,798 individuals are in the labor force, with 7.5% or 135 of them unemployed. The age group with the highest labor force participation rate is 30 to 34 years, with 100.0% or 277 individuals in the labor force. Within the labor force, the 25 to 29 years age range has the highest percentage of unemployed individuals, with 28.5% or 55 of them being unemployed.
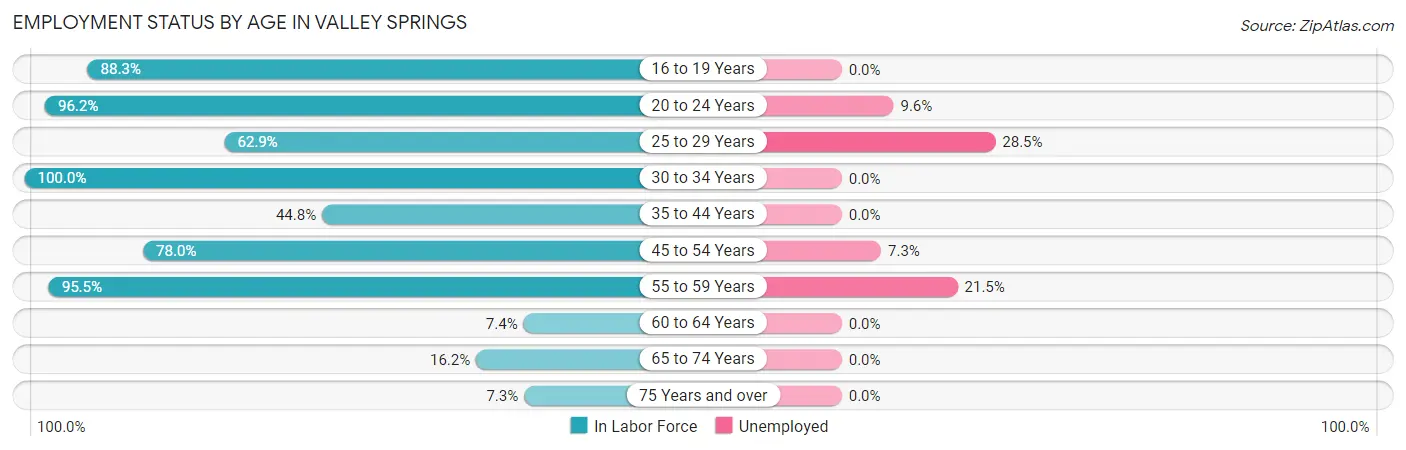
| Age Bracket | In Labor Force | Unemployed |
| 16 to 19 Years | 264 (88.3%) | 0 (0.0%) |
| 20 to 24 Years | 406 (96.2%) | 39 (9.6%) |
| 25 to 29 Years | 193 (62.9%) | 55 (28.5%) |
| 30 to 34 Years | 277 (100.0%) | 0 (0.0%) |
| 35 to 44 Years | 193 (44.8%) | 0 (0.0%) |
| 45 to 54 Years | 234 (78.0%) | 17 (7.3%) |
| 55 to 59 Years | 107 (95.5%) | 23 (21.5%) |
| 60 to 64 Years | 13 (7.4%) | 0 (0.0%) |
| 65 to 74 Years | 84 (16.2%) | 0 (0.0%) |
| 75 Years and over | 26 (7.3%) | 0 (0.0%) |
| Total | 1,798 (56.2%) | 135 (7.5%) |
Employment Status by Educational Attainment in Valley Springs
According to labor force statistics for Valley Springs, 63.4% of individuals (1,016) out of the total population between 25 and 64 years of age (1,603) are in the labor force, with 9.3% or 94 of them being unemployed. The group with the highest labor force participation rate are those with the educational attainment of bachelor's degree or higher, with 91.9% or 228 individuals in the labor force. Within the labor force, individuals with bachelor's degree or higher education have the highest percentage of unemployment, with 18.4% or 42 of them being unemployed.
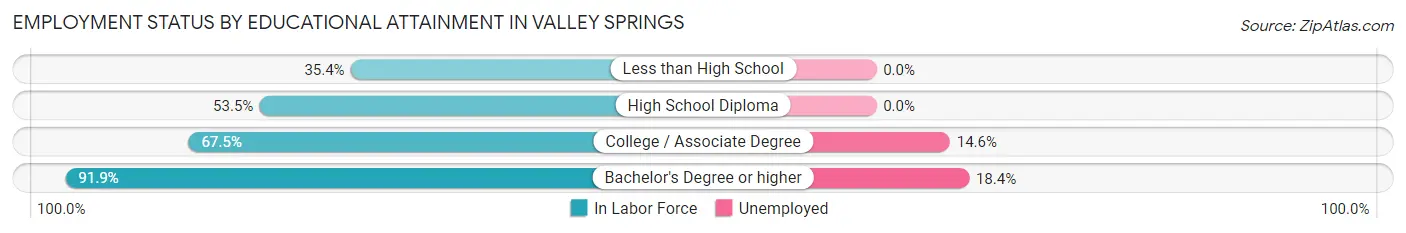
| Educational Attainment | In Labor Force | Unemployed |
| Less than High School | 23 (35.4%) | 0 (0.0%) |
| High School Diploma | 402 (53.5%) | 0 (0.0%) |
| College / Associate Degree | 364 (67.5%) | 79 (14.6%) |
| Bachelor's Degree or higher | 228 (91.9%) | 46 (18.4%) |
| Total | 1,016 (63.4%) | 149 (9.3%) |
Employment Occupations by Sex in Valley Springs
Management, Business, Science and Arts Occupations
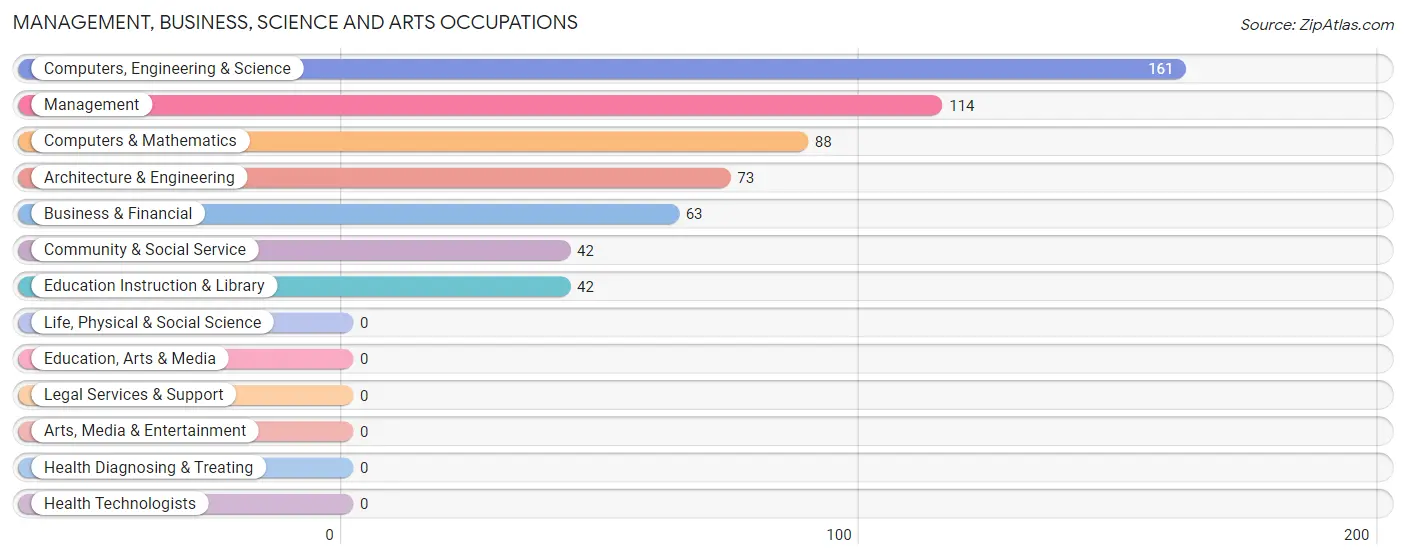
The most common Management, Business, Science and Arts occupations in Valley Springs are Computers, Engineering & Science (161 | 9.7%), Management (114 | 6.9%), Computers & Mathematics (88 | 5.3%), Architecture & Engineering (73 | 4.4%), and Business & Financial (63 | 3.8%).
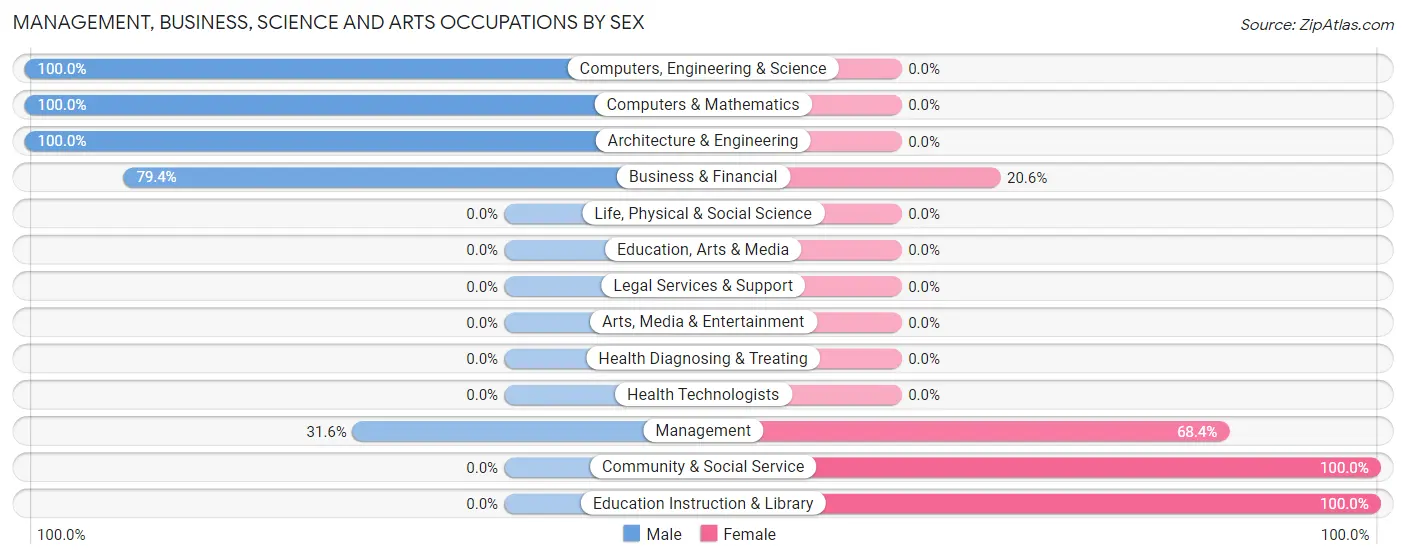
Management, Business, Science and Arts Occupations by Sex
Within the Management, Business, Science and Arts occupations in Valley Springs, the most male-oriented occupations are Computers, Engineering & Science (100.0%), Computers & Mathematics (100.0%), and Architecture & Engineering (100.0%), while the most female-oriented occupations are Community & Social Service (100.0%), Education Instruction & Library (100.0%), and Management (68.4%).
| Occupation | Male | Female |
| Management | 36 (31.6%) | 78 (68.4%) |
| Business & Financial | 50 (79.4%) | 13 (20.6%) |
| Computers, Engineering & Science | 161 (100.0%) | 0 (0.0%) |
| Computers & Mathematics | 88 (100.0%) | 0 (0.0%) |
| Architecture & Engineering | 73 (100.0%) | 0 (0.0%) |
| Life, Physical & Social Science | 0 (0.0%) | 0 (0.0%) |
| Community & Social Service | 0 (0.0%) | 42 (100.0%) |
| Education, Arts & Media | 0 (0.0%) | 0 (0.0%) |
| Legal Services & Support | 0 (0.0%) | 0 (0.0%) |
| Education Instruction & Library | 0 (0.0%) | 42 (100.0%) |
| Arts, Media & Entertainment | 0 (0.0%) | 0 (0.0%) |
| Health Diagnosing & Treating | 0 (0.0%) | 0 (0.0%) |
| Health Technologists | 0 (0.0%) | 0 (0.0%) |
| Total (Category) | 247 (65.0%) | 133 (35.0%) |
| Total (Overall) | 959 (57.7%) | 704 (42.3%) |
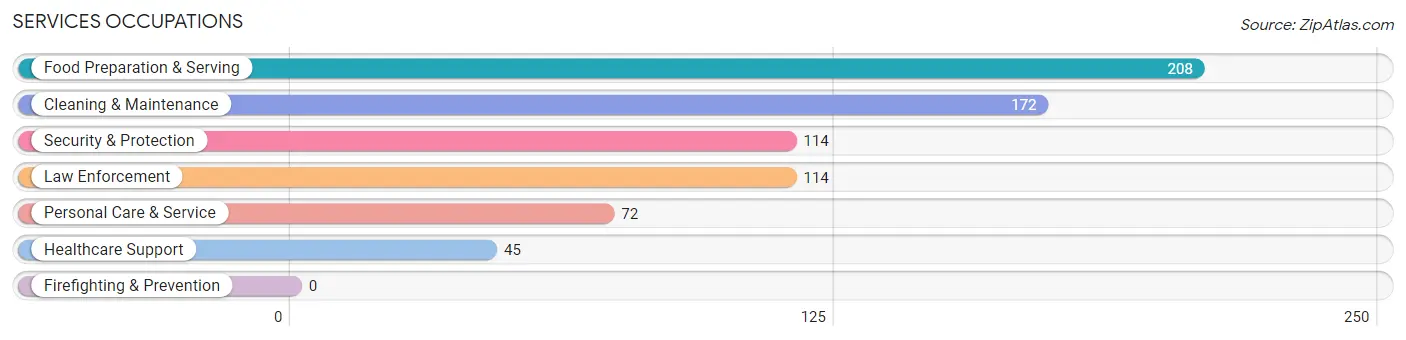
Services Occupations
The most common Services occupations in Valley Springs are Food Preparation & Serving (208 | 12.5%), Cleaning & Maintenance (172 | 10.3%), Security & Protection (114 | 6.9%), Law Enforcement (114 | 6.9%), and Personal Care & Service (72 | 4.3%).
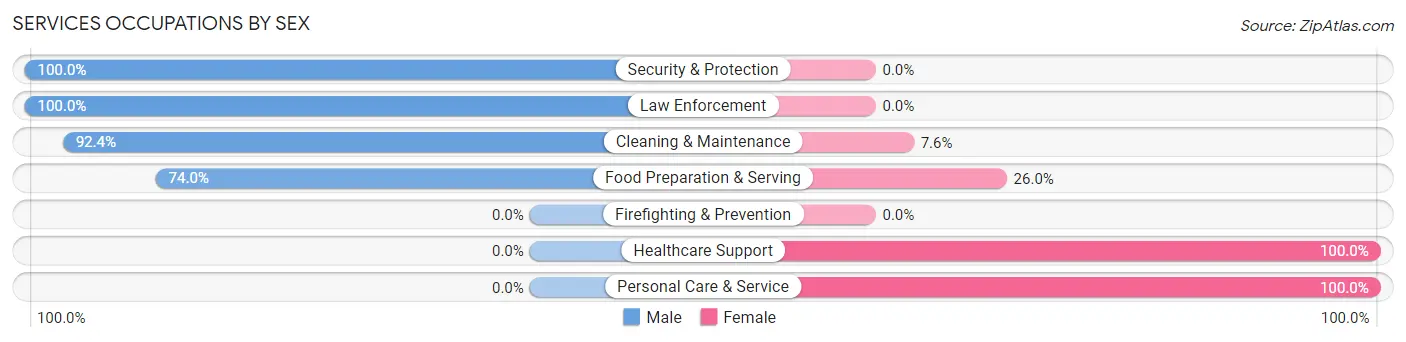
Services Occupations by Sex
Within the Services occupations in Valley Springs, the most male-oriented occupations are Security & Protection (100.0%), Law Enforcement (100.0%), and Cleaning & Maintenance (92.4%), while the most female-oriented occupations are Healthcare Support (100.0%), Personal Care & Service (100.0%), and Food Preparation & Serving (26.0%).
| Occupation | Male | Female |
| Healthcare Support | 0 (0.0%) | 45 (100.0%) |
| Security & Protection | 114 (100.0%) | 0 (0.0%) |
| Firefighting & Prevention | 0 (0.0%) | 0 (0.0%) |
| Law Enforcement | 114 (100.0%) | 0 (0.0%) |
| Food Preparation & Serving | 154 (74.0%) | 54 (26.0%) |
| Cleaning & Maintenance | 159 (92.4%) | 13 (7.6%) |
| Personal Care & Service | 0 (0.0%) | 72 (100.0%) |
| Total (Category) | 427 (69.9%) | 184 (30.1%) |
| Total (Overall) | 959 (57.7%) | 704 (42.3%) |
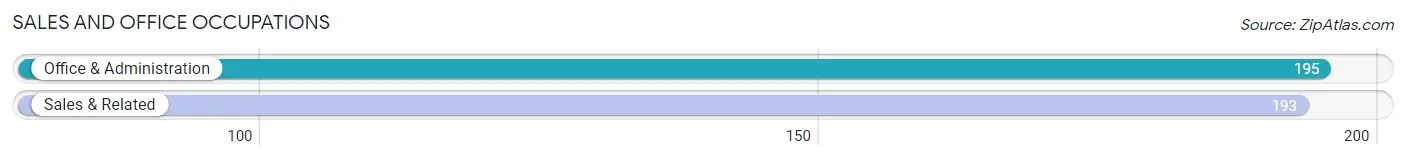
Sales and Office Occupations
The most common Sales and Office occupations in Valley Springs are Office & Administration (195 | 11.7%), and Sales & Related (193 | 11.6%).
Sales and Office Occupations by Sex
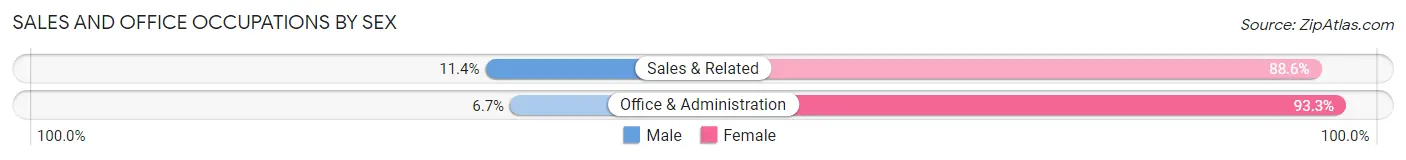
| Occupation | Male | Female |
| Sales & Related | 22 (11.4%) | 171 (88.6%) |
| Office & Administration | 13 (6.7%) | 182 (93.3%) |
| Total (Category) | 35 (9.0%) | 353 (91.0%) |
| Total (Overall) | 959 (57.7%) | 704 (42.3%) |
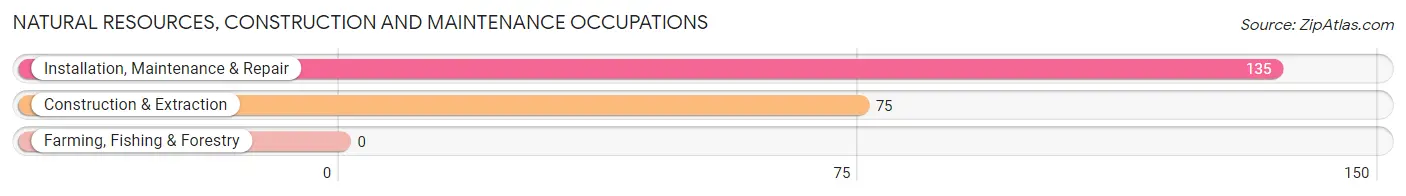
Natural Resources, Construction and Maintenance Occupations
The most common Natural Resources, Construction and Maintenance occupations in Valley Springs are Installation, Maintenance & Repair (135 | 8.1%), and Construction & Extraction (75 | 4.5%).
Natural Resources, Construction and Maintenance Occupations by Sex
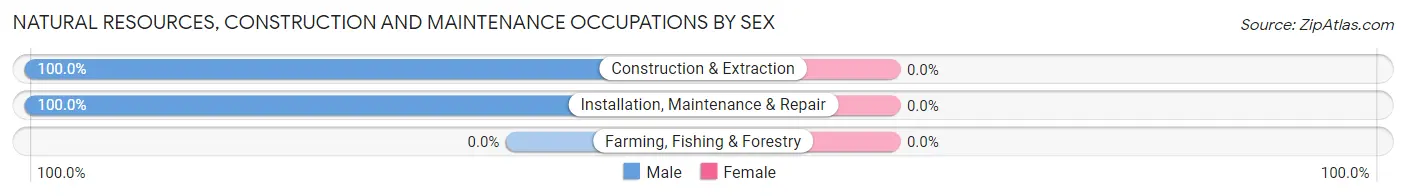
| Occupation | Male | Female |
| Farming, Fishing & Forestry | 0 (0.0%) | 0 (0.0%) |
| Construction & Extraction | 75 (100.0%) | 0 (0.0%) |
| Installation, Maintenance & Repair | 135 (100.0%) | 0 (0.0%) |
| Total (Category) | 210 (100.0%) | 0 (0.0%) |
| Total (Overall) | 959 (57.7%) | 704 (42.3%) |
Production, Transportation and Moving Occupations
The most common Production, Transportation and Moving occupations in Valley Springs are Transportation (34 | 2.0%), Material Moving (25 | 1.5%), and Production (15 | 0.9%).
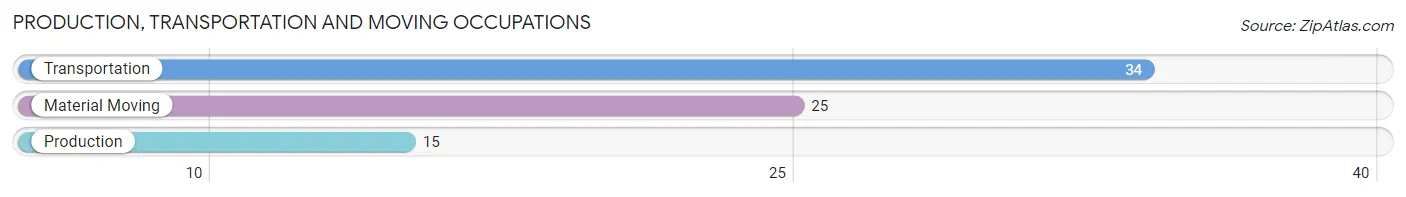
Production, Transportation and Moving Occupations by Sex
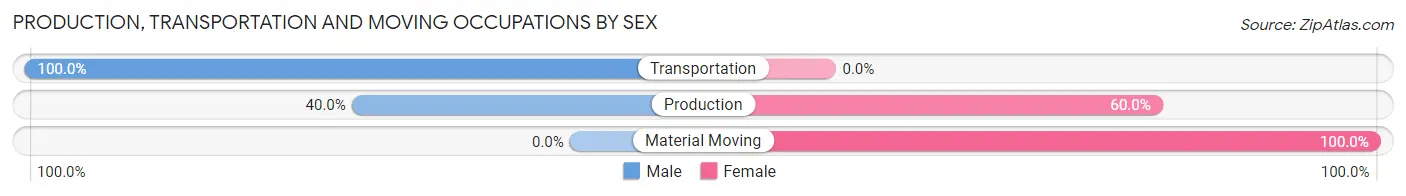
| Occupation | Male | Female |
| Production | 6 (40.0%) | 9 (60.0%) |
| Transportation | 34 (100.0%) | 0 (0.0%) |
| Material Moving | 0 (0.0%) | 25 (100.0%) |
| Total (Category) | 40 (54.0%) | 34 (46.0%) |
| Total (Overall) | 959 (57.7%) | 704 (42.3%) |
Employment Industries by Sex in Valley Springs
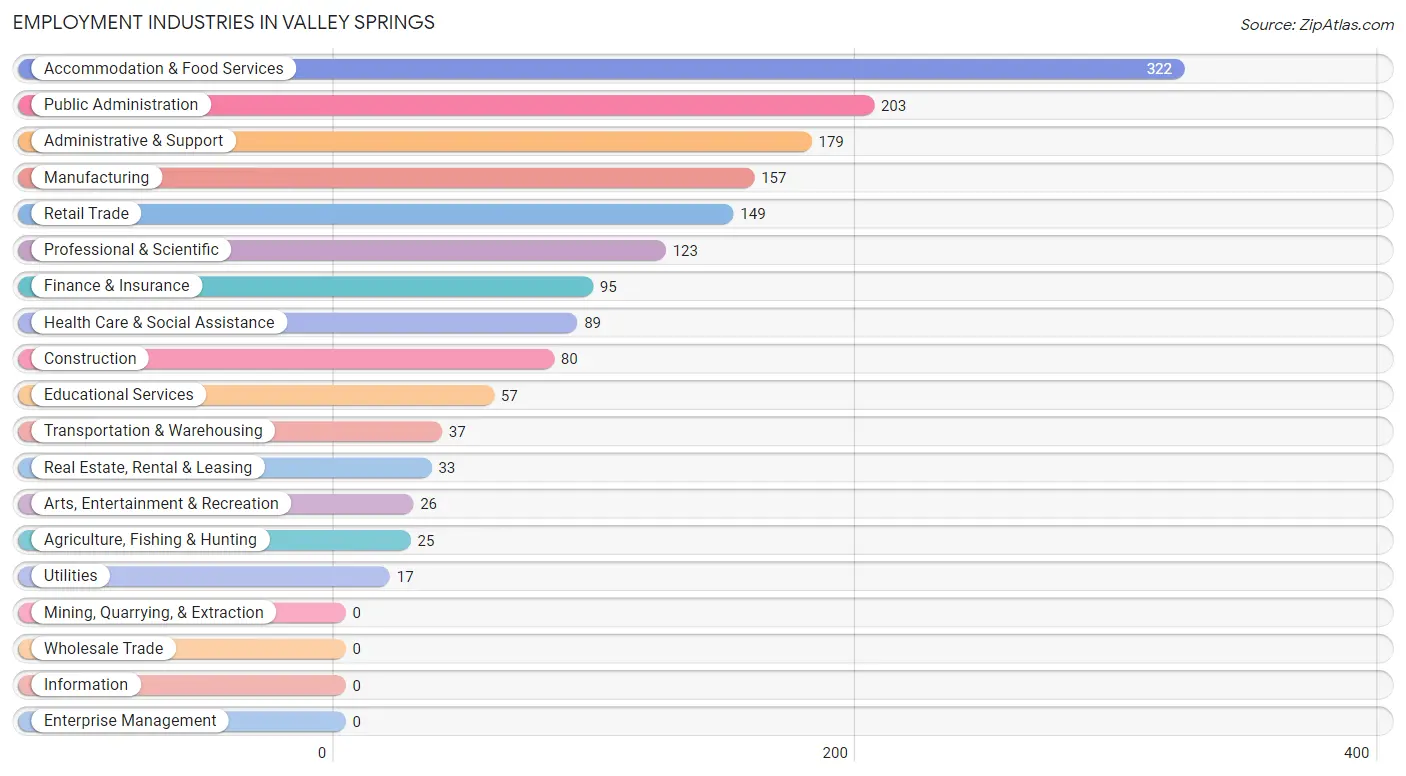
Employment Industries in Valley Springs
The major employment industries in Valley Springs include Accommodation & Food Services (322 | 19.4%), Public Administration (203 | 12.2%), Administrative & Support (179 | 10.8%), Manufacturing (157 | 9.4%), and Retail Trade (149 | 9.0%).
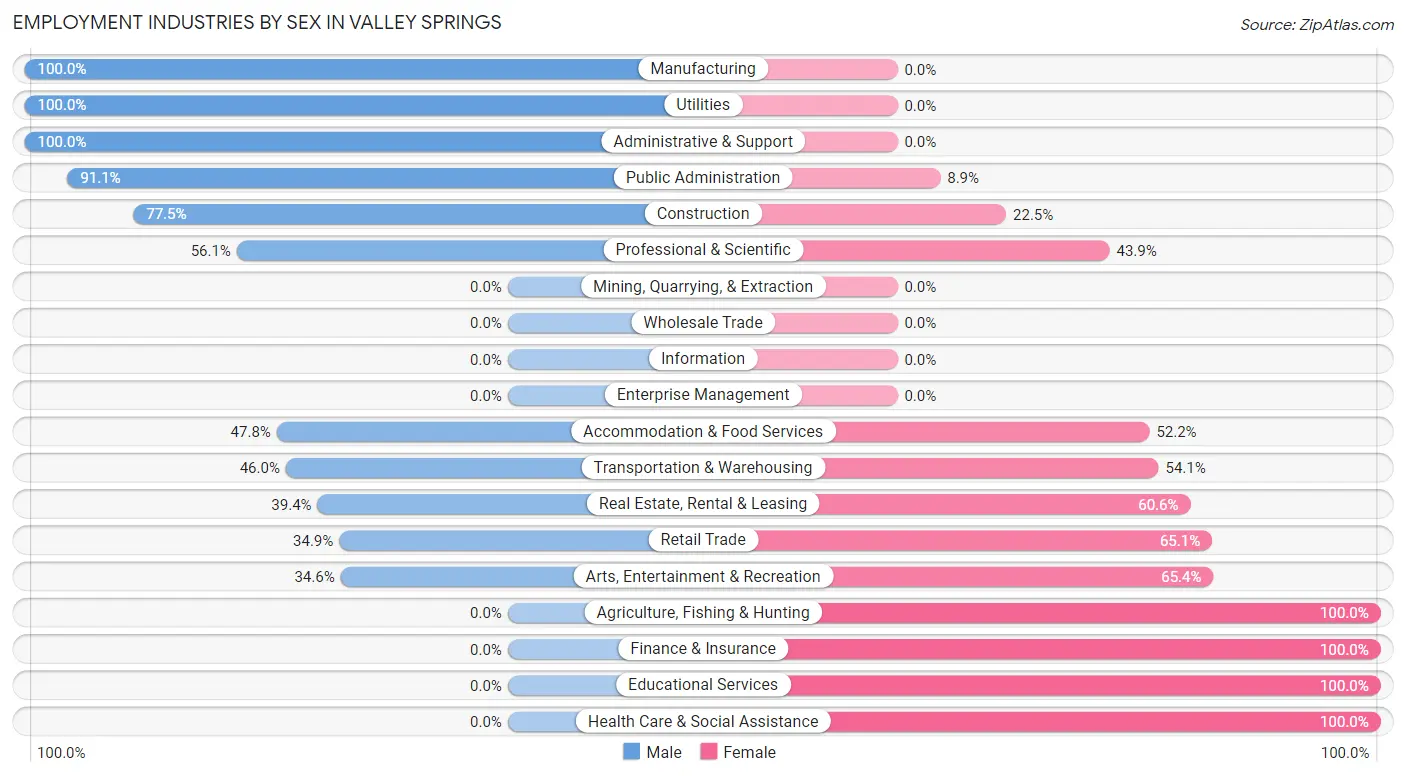
Employment Industries by Sex in Valley Springs
The Valley Springs industries that see more men than women are Manufacturing (100.0%), Utilities (100.0%), and Administrative & Support (100.0%), whereas the industries that tend to have a higher number of women are Agriculture, Fishing & Hunting (100.0%), Finance & Insurance (100.0%), and Educational Services (100.0%).
| Industry | Male | Female |
| Agriculture, Fishing & Hunting | 0 (0.0%) | 25 (100.0%) |
| Mining, Quarrying, & Extraction | 0 (0.0%) | 0 (0.0%) |
| Construction | 62 (77.5%) | 18 (22.5%) |
| Manufacturing | 157 (100.0%) | 0 (0.0%) |
| Wholesale Trade | 0 (0.0%) | 0 (0.0%) |
| Retail Trade | 52 (34.9%) | 97 (65.1%) |
| Transportation & Warehousing | 17 (46.0%) | 20 (54.0%) |
| Utilities | 17 (100.0%) | 0 (0.0%) |
| Information | 0 (0.0%) | 0 (0.0%) |
| Finance & Insurance | 0 (0.0%) | 95 (100.0%) |
| Real Estate, Rental & Leasing | 13 (39.4%) | 20 (60.6%) |
| Professional & Scientific | 69 (56.1%) | 54 (43.9%) |
| Enterprise Management | 0 (0.0%) | 0 (0.0%) |
| Administrative & Support | 179 (100.0%) | 0 (0.0%) |
| Educational Services | 0 (0.0%) | 57 (100.0%) |
| Health Care & Social Assistance | 0 (0.0%) | 89 (100.0%) |
| Arts, Entertainment & Recreation | 9 (34.6%) | 17 (65.4%) |
| Accommodation & Food Services | 154 (47.8%) | 168 (52.2%) |
| Public Administration | 185 (91.1%) | 18 (8.9%) |
| Total | 959 (57.7%) | 704 (42.3%) |
Education in Valley Springs
School Enrollment in Valley Springs
The most common levels of schooling among the 427 students in Valley Springs are middle school (121 | 28.3%), high school (113 | 26.5%), and college / undergraduate (89 | 20.8%).
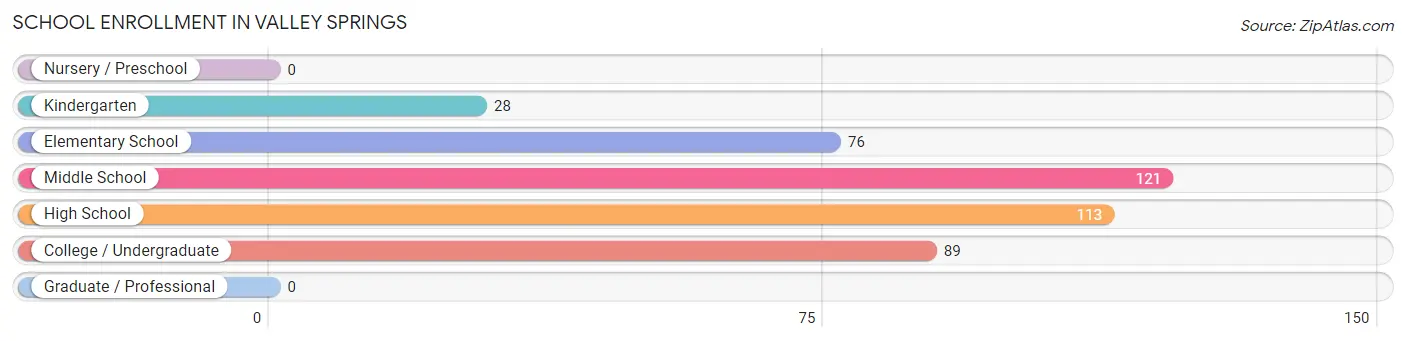
| School Level | # Students | % Students |
| Nursery / Preschool | 0 | 0.0% |
| Kindergarten | 28 | 6.6% |
| Elementary School | 76 | 17.8% |
| Middle School | 121 | 28.3% |
| High School | 113 | 26.5% |
| College / Undergraduate | 89 | 20.8% |
| Graduate / Professional | 0 | 0.0% |
| Total | 427 | 100.0% |
School Enrollment by Age by Funding Source in Valley Springs
Out of a total of 427 students who are enrolled in schools in Valley Springs, 50 (11.7%) attend a private institution, while the remaining 377 (88.3%) are enrolled in public schools. The age group of 35 years and over has the highest likelihood of being enrolled in private schools, with 9 (100.0% in the age bracket) enrolled. Conversely, the age group of 3 to 4 year olds has the lowest likelihood of being enrolled in a private school, with 28 (100.0% in the age bracket) attending a public institution.
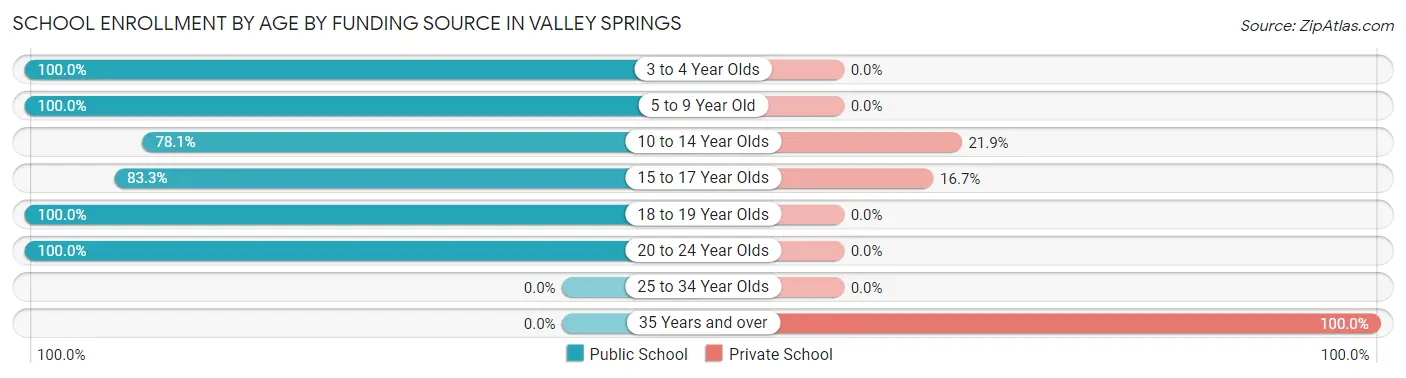
| Age Bracket | Public School | Private School |
| 3 to 4 Year Olds | 28 (100.0%) | 0 (0.0%) |
| 5 to 9 Year Old | 76 (100.0%) | 0 (0.0%) |
| 10 to 14 Year Olds | 121 (78.1%) | 34 (21.9%) |
| 15 to 17 Year Olds | 35 (83.3%) | 7 (16.7%) |
| 18 to 19 Year Olds | 37 (100.0%) | 0 (0.0%) |
| 20 to 24 Year Olds | 80 (100.0%) | 0 (0.0%) |
| 25 to 34 Year Olds | 0 (0.0%) | 0 (0.0%) |
| 35 Years and over | 0 (0.0%) | 9 (100.0%) |
| Total | 377 (88.3%) | 50 (11.7%) |
Educational Attainment by Field of Study in Valley Springs
Communications (82 | 19.4%), science & technology (51 | 12.1%), arts & humanities (49 | 11.6%), education (42 | 9.9%), and literature & languages (41 | 9.7%) are the most common fields of study among 423 individuals in Valley Springs who have obtained a bachelor's degree or higher.
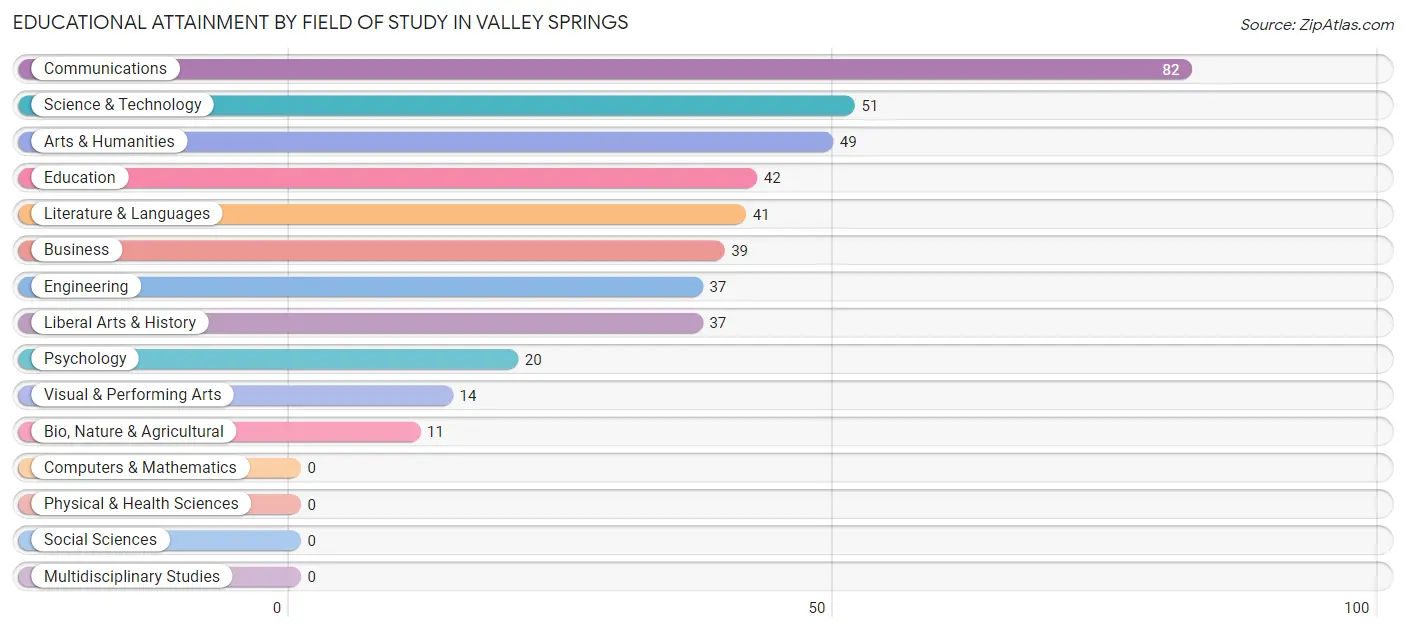
| Field of Study | # Graduates | % Graduates |
| Computers & Mathematics | 0 | 0.0% |
| Bio, Nature & Agricultural | 11 | 2.6% |
| Physical & Health Sciences | 0 | 0.0% |
| Psychology | 20 | 4.7% |
| Social Sciences | 0 | 0.0% |
| Engineering | 37 | 8.7% |
| Multidisciplinary Studies | 0 | 0.0% |
| Science & Technology | 51 | 12.1% |
| Business | 39 | 9.2% |
| Education | 42 | 9.9% |
| Literature & Languages | 41 | 9.7% |
| Liberal Arts & History | 37 | 8.7% |
| Visual & Performing Arts | 14 | 3.3% |
| Communications | 82 | 19.4% |
| Arts & Humanities | 49 | 11.6% |
| Total | 423 | 100.0% |
Transportation & Commute in Valley Springs
Vehicle Availability by Sex in Valley Springs
The most prevalent vehicle ownership categories in Valley Springs are males with 2 vehicles (463, accounting for 50.3%) and females with 2 vehicles (402, making up 65.8%).
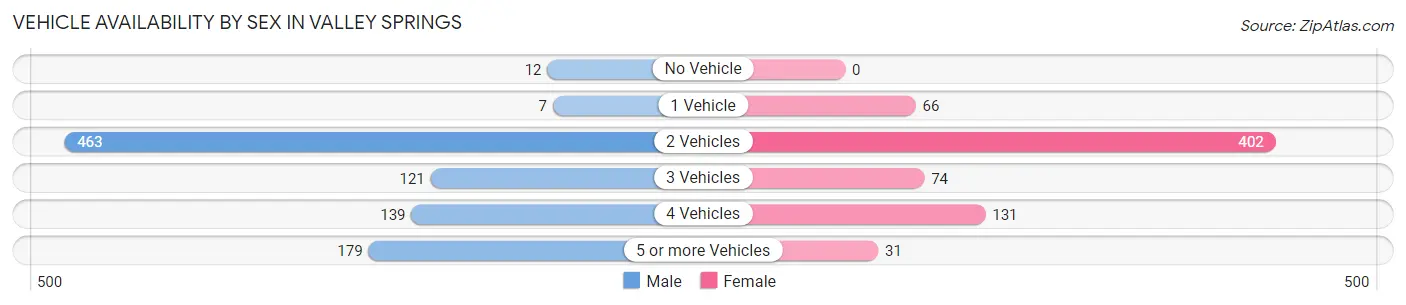
| Vehicles Available | Male | Female |
| No Vehicle | 12 (1.3%) | 0 (0.0%) |
| 1 Vehicle | 7 (0.8%) | 66 (9.4%) |
| 2 Vehicles | 463 (50.3%) | 402 (57.1%) |
| 3 Vehicles | 121 (13.1%) | 74 (10.5%) |
| 4 Vehicles | 139 (15.1%) | 131 (18.6%) |
| 5 or more Vehicles | 179 (19.4%) | 31 (4.4%) |
| Total | 921 (100.0%) | 704 (100.0%) |
Commute Time in Valley Springs
The most frequently occuring commute durations in Valley Springs are 10 to 14 minutes (313 commuters, 21.1%), 5 to 9 minutes (265 commuters, 17.9%), and 45 to 59 minutes (237 commuters, 16.0%).
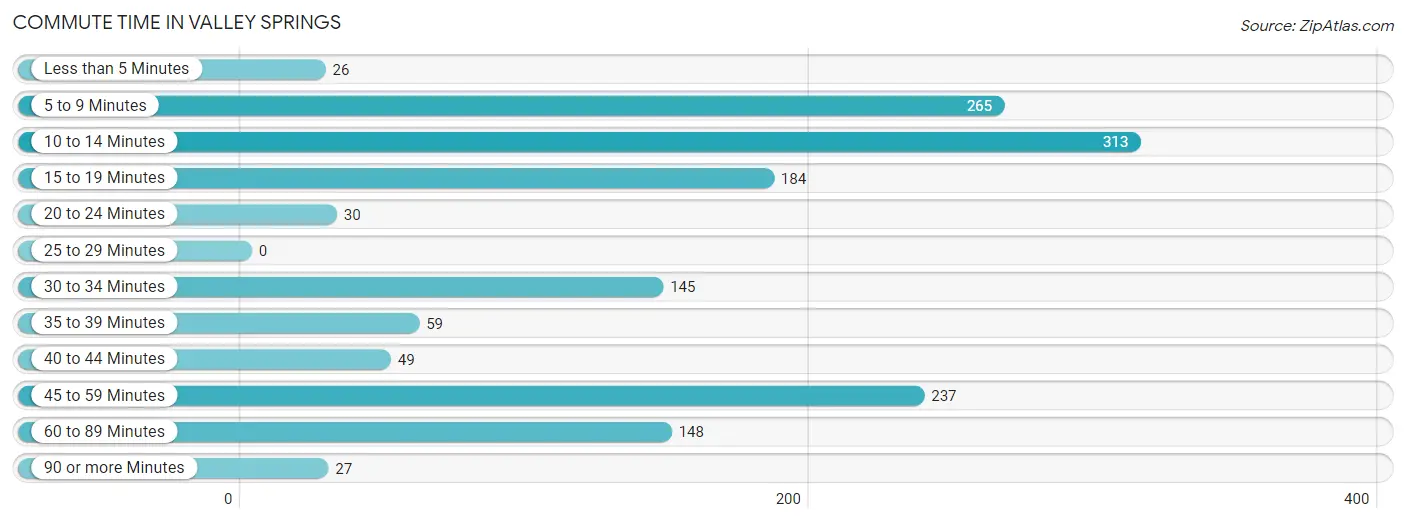
| Commute Time | # Commuters | % Commuters |
| Less than 5 Minutes | 26 | 1.8% |
| 5 to 9 Minutes | 265 | 17.9% |
| 10 to 14 Minutes | 313 | 21.1% |
| 15 to 19 Minutes | 184 | 12.4% |
| 20 to 24 Minutes | 30 | 2.0% |
| 25 to 29 Minutes | 0 | 0.0% |
| 30 to 34 Minutes | 145 | 9.8% |
| 35 to 39 Minutes | 59 | 4.0% |
| 40 to 44 Minutes | 49 | 3.3% |
| 45 to 59 Minutes | 237 | 16.0% |
| 60 to 89 Minutes | 148 | 10.0% |
| 90 or more Minutes | 27 | 1.8% |
Commute Time by Sex in Valley Springs
The most common commute times in Valley Springs are 10 to 14 minutes (171 commuters, 19.9%) for males and 10 to 14 minutes (142 commuters, 22.7%) for females.
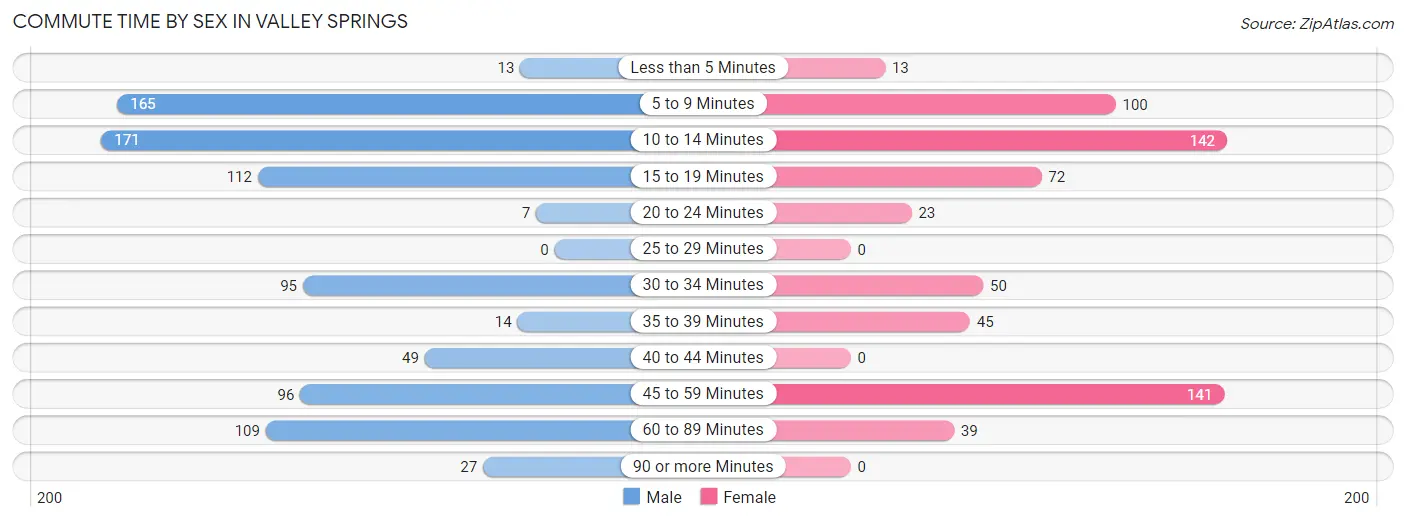
| Commute Time | Male | Female |
| Less than 5 Minutes | 13 (1.5%) | 13 (2.1%) |
| 5 to 9 Minutes | 165 (19.2%) | 100 (16.0%) |
| 10 to 14 Minutes | 171 (19.9%) | 142 (22.7%) |
| 15 to 19 Minutes | 112 (13.1%) | 72 (11.5%) |
| 20 to 24 Minutes | 7 (0.8%) | 23 (3.7%) |
| 25 to 29 Minutes | 0 (0.0%) | 0 (0.0%) |
| 30 to 34 Minutes | 95 (11.1%) | 50 (8.0%) |
| 35 to 39 Minutes | 14 (1.6%) | 45 (7.2%) |
| 40 to 44 Minutes | 49 (5.7%) | 0 (0.0%) |
| 45 to 59 Minutes | 96 (11.2%) | 141 (22.6%) |
| 60 to 89 Minutes | 109 (12.7%) | 39 (6.2%) |
| 90 or more Minutes | 27 (3.2%) | 0 (0.0%) |
Time of Departure to Work by Sex in Valley Springs
The most frequent times of departure to work in Valley Springs are 5:30 AM to 5:59 AM (185, 21.6%) for males and 10:00 AM to 10:59 AM (97, 15.5%) for females.
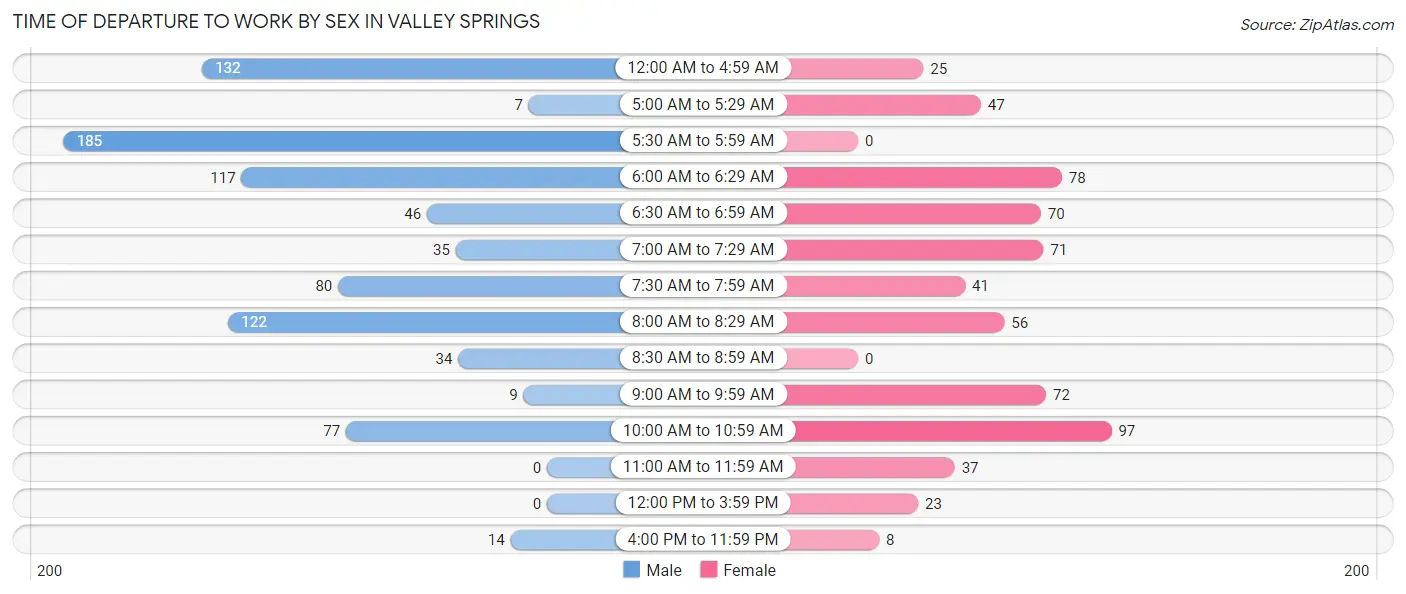
| Time of Departure | Male | Female |
| 12:00 AM to 4:59 AM | 132 (15.4%) | 25 (4.0%) |
| 5:00 AM to 5:29 AM | 7 (0.8%) | 47 (7.5%) |
| 5:30 AM to 5:59 AM | 185 (21.6%) | 0 (0.0%) |
| 6:00 AM to 6:29 AM | 117 (13.6%) | 78 (12.5%) |
| 6:30 AM to 6:59 AM | 46 (5.4%) | 70 (11.2%) |
| 7:00 AM to 7:29 AM | 35 (4.1%) | 71 (11.4%) |
| 7:30 AM to 7:59 AM | 80 (9.3%) | 41 (6.6%) |
| 8:00 AM to 8:29 AM | 122 (14.2%) | 56 (9.0%) |
| 8:30 AM to 8:59 AM | 34 (4.0%) | 0 (0.0%) |
| 9:00 AM to 9:59 AM | 9 (1.1%) | 72 (11.5%) |
| 10:00 AM to 10:59 AM | 77 (9.0%) | 97 (15.5%) |
| 11:00 AM to 11:59 AM | 0 (0.0%) | 37 (5.9%) |
| 12:00 PM to 3:59 PM | 0 (0.0%) | 23 (3.7%) |
| 4:00 PM to 11:59 PM | 14 (1.6%) | 8 (1.3%) |
| Total | 858 (100.0%) | 625 (100.0%) |
Housing Occupancy in Valley Springs
Occupancy by Ownership in Valley Springs
Of the total 1,209 dwellings in Valley Springs, owner-occupied units account for 1,043 (86.3%), while renter-occupied units make up 166 (13.7%).
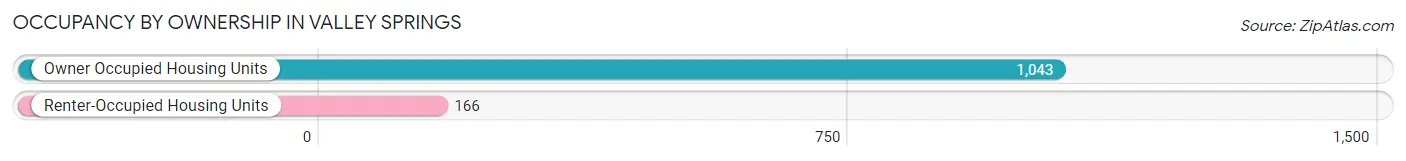
| Occupancy | # Housing Units | % Housing Units |
| Owner Occupied Housing Units | 1,043 | 86.3% |
| Renter-Occupied Housing Units | 166 | 13.7% |
| Total Occupied Housing Units | 1,209 | 100.0% |
Occupancy by Household Size in Valley Springs
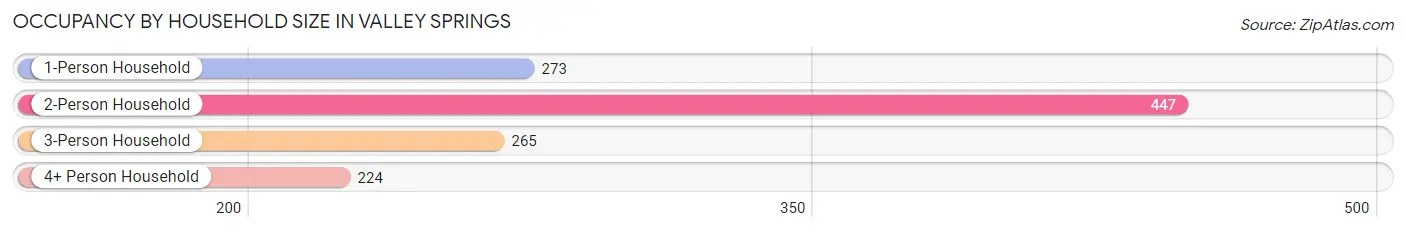
| Household Size | # Housing Units | % Housing Units |
| 1-Person Household | 273 | 22.6% |
| 2-Person Household | 447 | 37.0% |
| 3-Person Household | 265 | 21.9% |
| 4+ Person Household | 224 | 18.5% |
| Total Housing Units | 1,209 | 100.0% |
Occupancy by Ownership by Household Size in Valley Springs
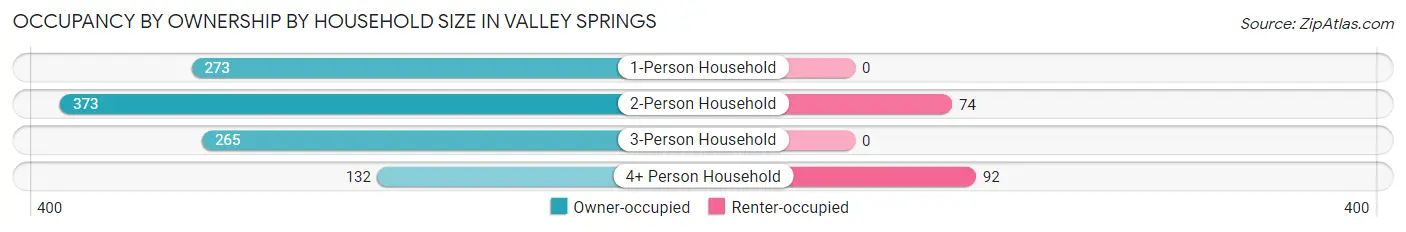
| Household Size | Owner-occupied | Renter-occupied |
| 1-Person Household | 273 (100.0%) | 0 (0.0%) |
| 2-Person Household | 373 (83.5%) | 74 (16.6%) |
| 3-Person Household | 265 (100.0%) | 0 (0.0%) |
| 4+ Person Household | 132 (58.9%) | 92 (41.1%) |
| Total Housing Units | 1,043 (86.3%) | 166 (13.7%) |
Occupancy by Educational Attainment in Valley Springs
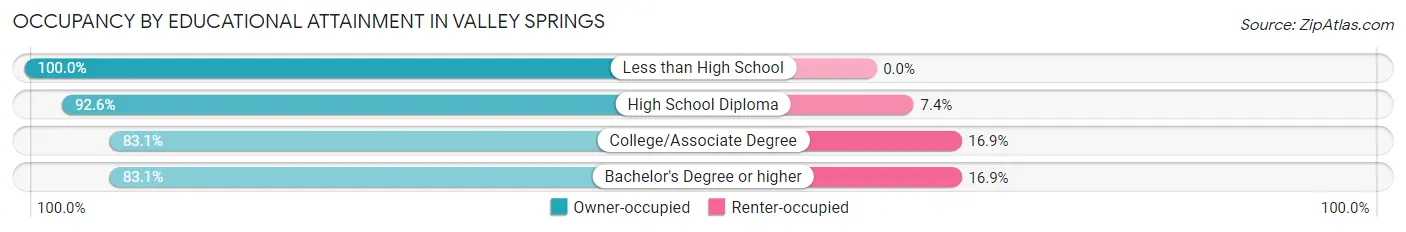
| Household Size | Owner-occupied | Renter-occupied |
| Less than High School | 37 (100.0%) | 0 (0.0%) |
| High School Diploma | 312 (92.6%) | 25 (7.4%) |
| College/Associate Degree | 522 (83.1%) | 106 (16.9%) |
| Bachelor's Degree or higher | 172 (83.1%) | 35 (16.9%) |
Occupancy by Age of Householder in Valley Springs
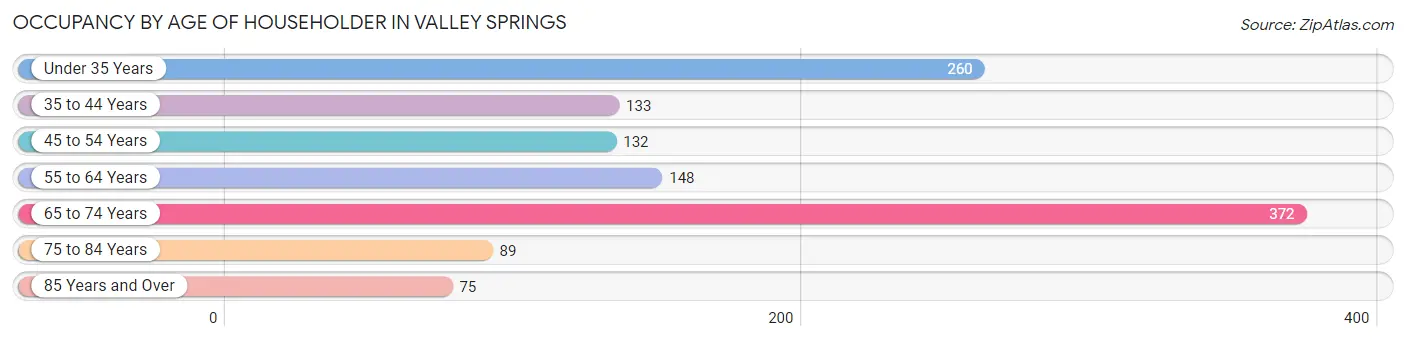
| Age Bracket | # Households | % Households |
| Under 35 Years | 260 | 21.5% |
| 35 to 44 Years | 133 | 11.0% |
| 45 to 54 Years | 132 | 10.9% |
| 55 to 64 Years | 148 | 12.2% |
| 65 to 74 Years | 372 | 30.8% |
| 75 to 84 Years | 89 | 7.4% |
| 85 Years and Over | 75 | 6.2% |
| Total | 1,209 | 100.0% |
Housing Finances in Valley Springs
Median Income by Occupancy in Valley Springs
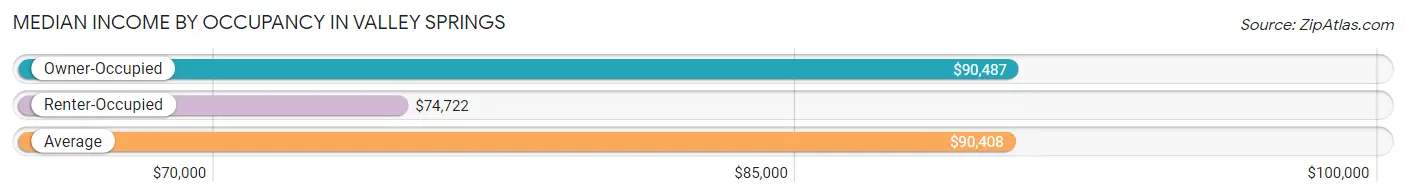
| Occupancy Type | # Households | Median Income |
| Owner-Occupied | 1,043 (86.3%) | $90,487 |
| Renter-Occupied | 166 (13.7%) | $74,722 |
| Average | 1,209 (100.0%) | $90,408 |
Occupancy by Householder Income Bracket in Valley Springs
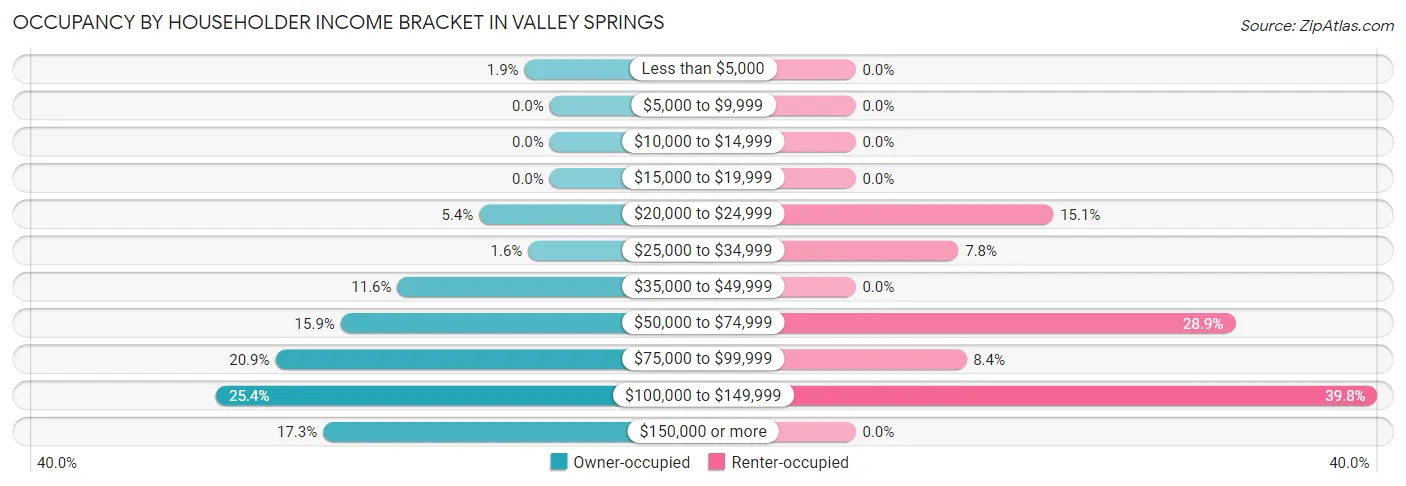
| Income Bracket | Owner-occupied | Renter-occupied |
| Less than $5,000 | 20 (1.9%) | 0 (0.0%) |
| $5,000 to $9,999 | 0 (0.0%) | 0 (0.0%) |
| $10,000 to $14,999 | 0 (0.0%) | 0 (0.0%) |
| $15,000 to $19,999 | 0 (0.0%) | 0 (0.0%) |
| $20,000 to $24,999 | 56 (5.4%) | 25 (15.1%) |
| $25,000 to $34,999 | 17 (1.6%) | 13 (7.8%) |
| $35,000 to $49,999 | 121 (11.6%) | 0 (0.0%) |
| $50,000 to $74,999 | 166 (15.9%) | 48 (28.9%) |
| $75,000 to $99,999 | 218 (20.9%) | 14 (8.4%) |
| $100,000 to $149,999 | 265 (25.4%) | 66 (39.8%) |
| $150,000 or more | 180 (17.3%) | 0 (0.0%) |
| Total | 1,043 (100.0%) | 166 (100.0%) |
Monthly Housing Cost Tiers in Valley Springs
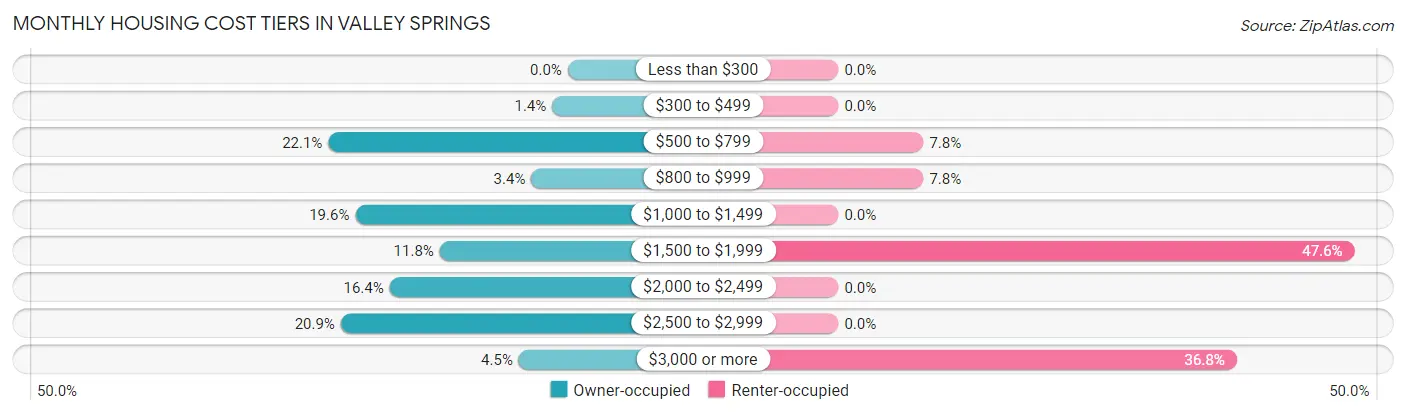
| Monthly Cost | Owner-occupied | Renter-occupied |
| Less than $300 | 0 (0.0%) | 0 (0.0%) |
| $300 to $499 | 15 (1.4%) | 0 (0.0%) |
| $500 to $799 | 230 (22.1%) | 13 (7.8%) |
| $800 to $999 | 35 (3.4%) | 13 (7.8%) |
| $1,000 to $1,499 | 204 (19.6%) | 0 (0.0%) |
| $1,500 to $1,999 | 123 (11.8%) | 79 (47.6%) |
| $2,000 to $2,499 | 171 (16.4%) | 0 (0.0%) |
| $2,500 to $2,999 | 218 (20.9%) | 0 (0.0%) |
| $3,000 or more | 47 (4.5%) | 61 (36.7%) |
| Total | 1,043 (100.0%) | 166 (100.0%) |
Physical Housing Characteristics in Valley Springs
Housing Structures in Valley Springs
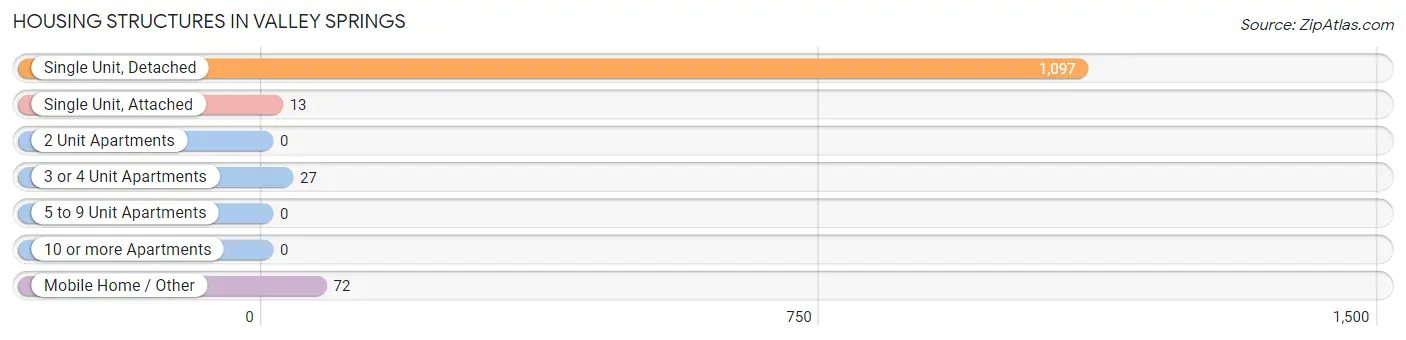
| Structure Type | # Housing Units | % Housing Units |
| Single Unit, Detached | 1,097 | 90.7% |
| Single Unit, Attached | 13 | 1.1% |
| 2 Unit Apartments | 0 | 0.0% |
| 3 or 4 Unit Apartments | 27 | 2.2% |
| 5 to 9 Unit Apartments | 0 | 0.0% |
| 10 or more Apartments | 0 | 0.0% |
| Mobile Home / Other | 72 | 6.0% |
| Total | 1,209 | 100.0% |
Housing Structures by Occupancy in Valley Springs
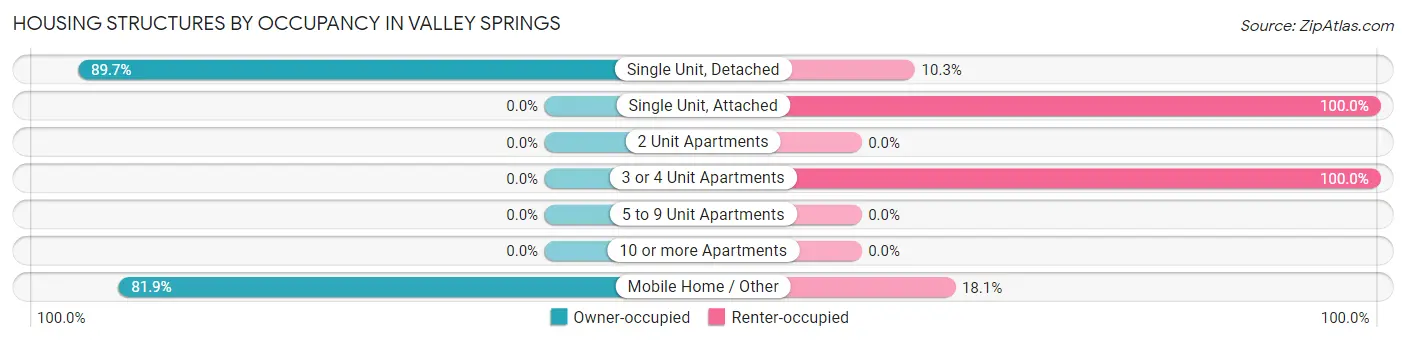
| Structure Type | Owner-occupied | Renter-occupied |
| Single Unit, Detached | 984 (89.7%) | 113 (10.3%) |
| Single Unit, Attached | 0 (0.0%) | 13 (100.0%) |
| 2 Unit Apartments | 0 (0.0%) | 0 (0.0%) |
| 3 or 4 Unit Apartments | 0 (0.0%) | 27 (100.0%) |
| 5 to 9 Unit Apartments | 0 (0.0%) | 0 (0.0%) |
| 10 or more Apartments | 0 (0.0%) | 0 (0.0%) |
| Mobile Home / Other | 59 (81.9%) | 13 (18.1%) |
| Total | 1,043 (86.3%) | 166 (13.7%) |
Housing Structures by Number of Rooms in Valley Springs
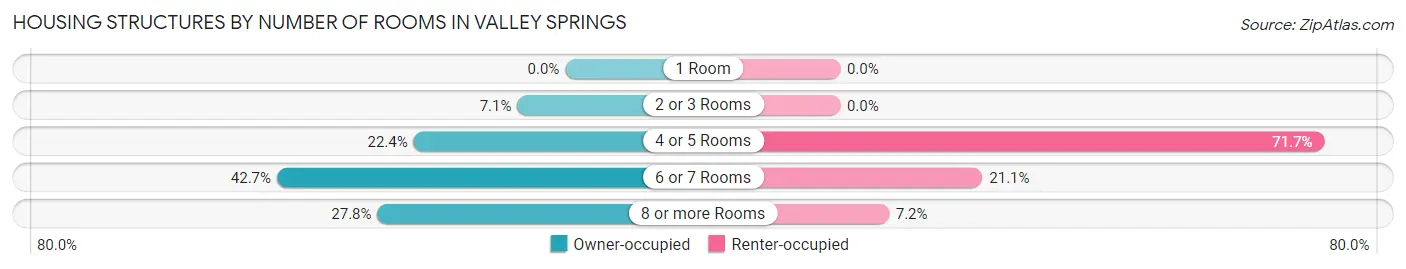
| Number of Rooms | Owner-occupied | Renter-occupied |
| 1 Room | 0 (0.0%) | 0 (0.0%) |
| 2 or 3 Rooms | 74 (7.1%) | 0 (0.0%) |
| 4 or 5 Rooms | 234 (22.4%) | 119 (71.7%) |
| 6 or 7 Rooms | 445 (42.7%) | 35 (21.1%) |
| 8 or more Rooms | 290 (27.8%) | 12 (7.2%) |
| Total | 1,043 (100.0%) | 166 (100.0%) |
Housing Structure by Heating Type in Valley Springs
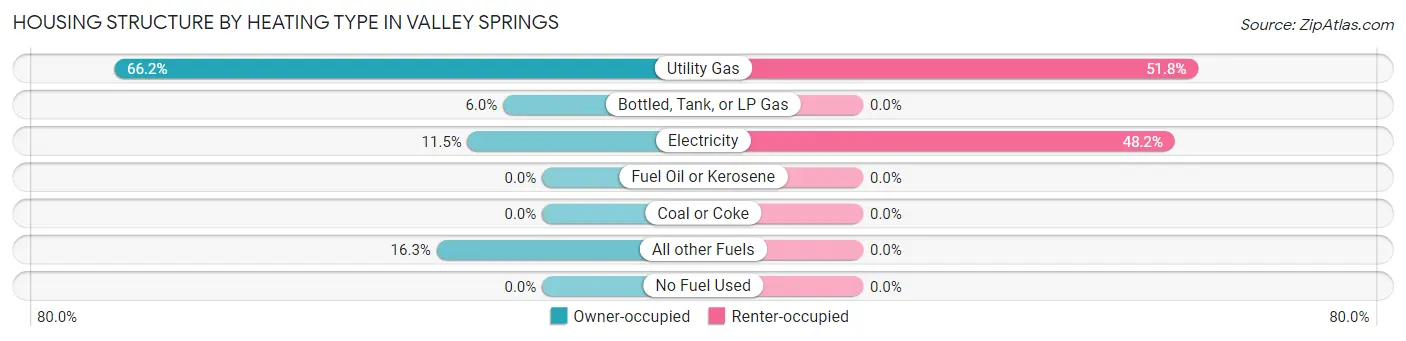
| Heating Type | Owner-occupied | Renter-occupied |
| Utility Gas | 690 (66.2%) | 86 (51.8%) |
| Bottled, Tank, or LP Gas | 63 (6.0%) | 0 (0.0%) |
| Electricity | 120 (11.5%) | 80 (48.2%) |
| Fuel Oil or Kerosene | 0 (0.0%) | 0 (0.0%) |
| Coal or Coke | 0 (0.0%) | 0 (0.0%) |
| All other Fuels | 170 (16.3%) | 0 (0.0%) |
| No Fuel Used | 0 (0.0%) | 0 (0.0%) |
| Total | 1,043 (100.0%) | 166 (100.0%) |
Household Vehicle Usage in Valley Springs
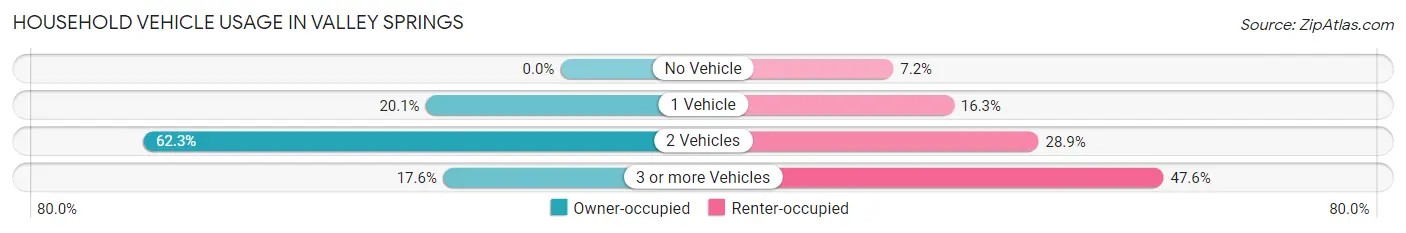
| Vehicles per Household | Owner-occupied | Renter-occupied |
| No Vehicle | 0 (0.0%) | 12 (7.2%) |
| 1 Vehicle | 210 (20.1%) | 27 (16.3%) |
| 2 Vehicles | 650 (62.3%) | 48 (28.9%) |
| 3 or more Vehicles | 183 (17.5%) | 79 (47.6%) |
| Total | 1,043 (100.0%) | 166 (100.0%) |
Real Estate & Mortgages in Valley Springs
Real Estate and Mortgage Overview in Valley Springs
| Characteristic | Without Mortgage | With Mortgage |
| Housing Units | 411 | 632 |
| Median Property Value | $409,700 | $375,700 |
| Median Household Income | $76,635 | $148 |
| Monthly Housing Costs | $763 | $47 |
| Real Estate Taxes | $1,854 | $0 |
Property Value by Mortgage Status in Valley Springs
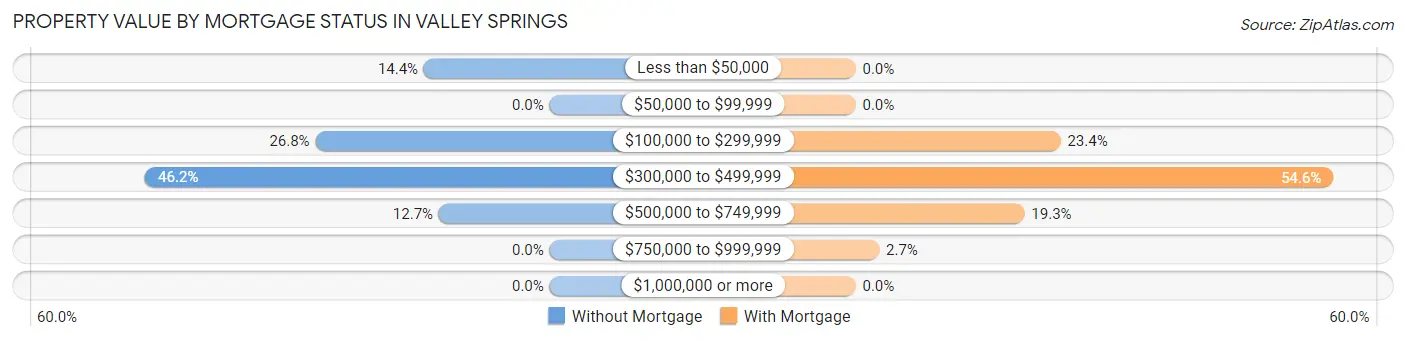
| Property Value | Without Mortgage | With Mortgage |
| Less than $50,000 | 59 (14.4%) | 0 (0.0%) |
| $50,000 to $99,999 | 0 (0.0%) | 0 (0.0%) |
| $100,000 to $299,999 | 110 (26.8%) | 148 (23.4%) |
| $300,000 to $499,999 | 190 (46.2%) | 345 (54.6%) |
| $500,000 to $749,999 | 52 (12.7%) | 122 (19.3%) |
| $750,000 to $999,999 | 0 (0.0%) | 17 (2.7%) |
| $1,000,000 or more | 0 (0.0%) | 0 (0.0%) |
| Total | 411 (100.0%) | 632 (100.0%) |
Household Income by Mortgage Status in Valley Springs
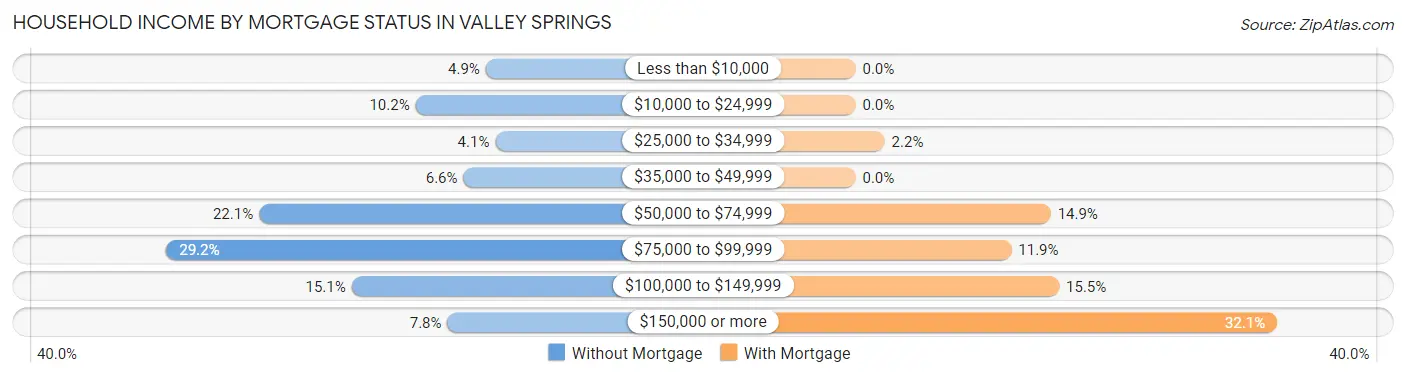
| Household Income | Without Mortgage | With Mortgage |
| Less than $10,000 | 20 (4.9%) | 0 (0.0%) |
| $10,000 to $24,999 | 42 (10.2%) | 0 (0.0%) |
| $25,000 to $34,999 | 17 (4.1%) | 14 (2.2%) |
| $35,000 to $49,999 | 27 (6.6%) | 0 (0.0%) |
| $50,000 to $74,999 | 91 (22.1%) | 94 (14.9%) |
| $75,000 to $99,999 | 120 (29.2%) | 75 (11.9%) |
| $100,000 to $149,999 | 62 (15.1%) | 98 (15.5%) |
| $150,000 or more | 32 (7.8%) | 203 (32.1%) |
| Total | 411 (100.0%) | 632 (100.0%) |
Property Value to Household Income Ratio in Valley Springs
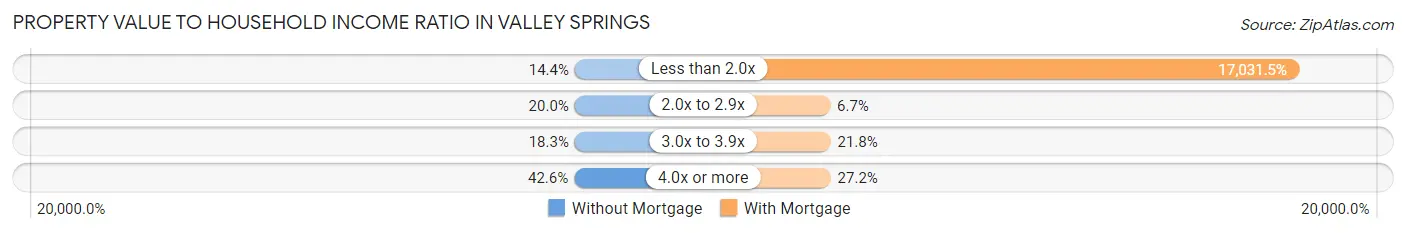
| Value-to-Income Ratio | Without Mortgage | With Mortgage |
| Less than 2.0x | 59 (14.4%) | 107,639 (17,031.5%) |
| 2.0x to 2.9x | 82 (20.0%) | 42 (6.7%) |
| 3.0x to 3.9x | 75 (18.2%) | 138 (21.8%) |
| 4.0x or more | 175 (42.6%) | 172 (27.2%) |
| Total | 411 (100.0%) | 632 (100.0%) |
Real Estate Taxes by Mortgage Status in Valley Springs
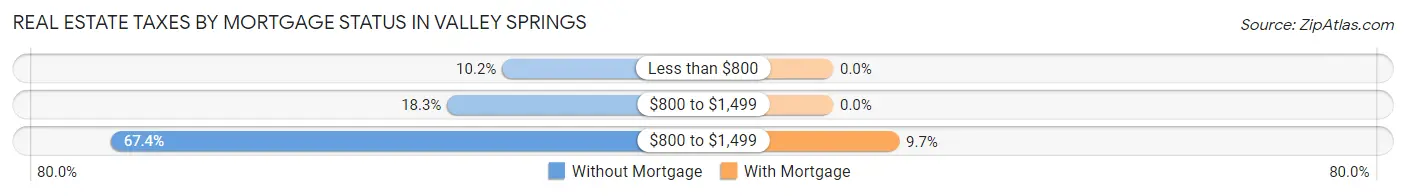
| Property Taxes | Without Mortgage | With Mortgage |
| Less than $800 | 42 (10.2%) | 0 (0.0%) |
| $800 to $1,499 | 75 (18.2%) | 0 (0.0%) |
| $800 to $1,499 | 277 (67.4%) | 61 (9.7%) |
| Total | 411 (100.0%) | 632 (100.0%) |
Health & Disability in Valley Springs
Health Insurance Coverage by Age in Valley Springs
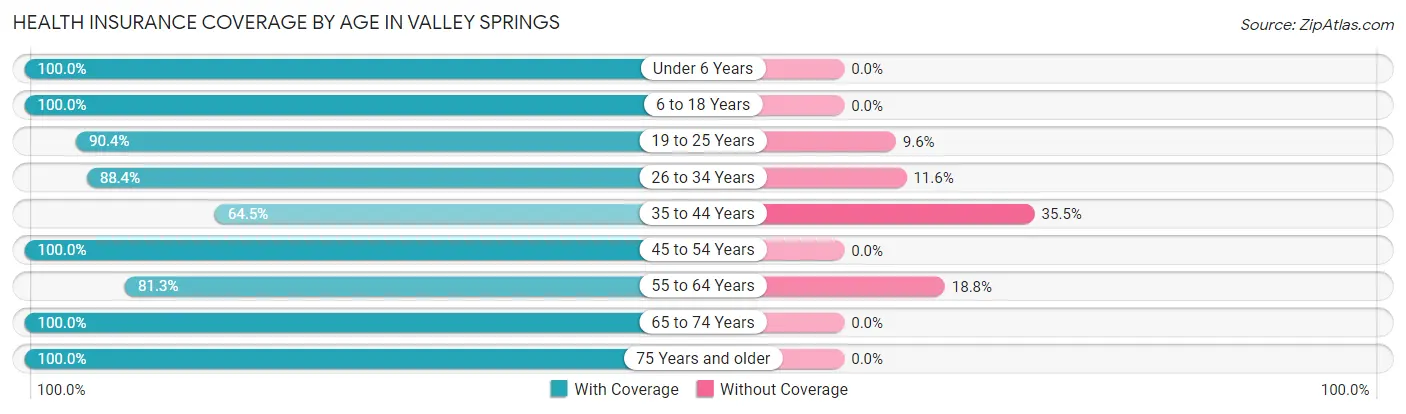
| Age Bracket | With Coverage | Without Coverage |
| Under 6 Years | 184 (100.0%) | 0 (0.0%) |
| 6 to 18 Years | 545 (100.0%) | 0 (0.0%) |
| 19 to 25 Years | 395 (90.4%) | 42 (9.6%) |
| 26 to 34 Years | 503 (88.4%) | 66 (11.6%) |
| 35 to 44 Years | 278 (64.5%) | 153 (35.5%) |
| 45 to 54 Years | 300 (100.0%) | 0 (0.0%) |
| 55 to 64 Years | 234 (81.2%) | 54 (18.8%) |
| 65 to 74 Years | 520 (100.0%) | 0 (0.0%) |
| 75 Years and older | 356 (100.0%) | 0 (0.0%) |
| Total | 3,315 (91.3%) | 315 (8.7%) |
Health Insurance Coverage by Citizenship Status in Valley Springs
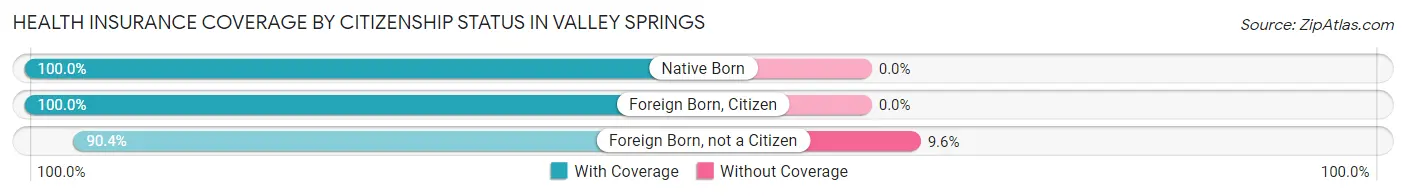
| Citizenship Status | With Coverage | Without Coverage |
| Native Born | 184 (100.0%) | 0 (0.0%) |
| Foreign Born, Citizen | 545 (100.0%) | 0 (0.0%) |
| Foreign Born, not a Citizen | 395 (90.4%) | 42 (9.6%) |
Health Insurance Coverage by Household Income in Valley Springs
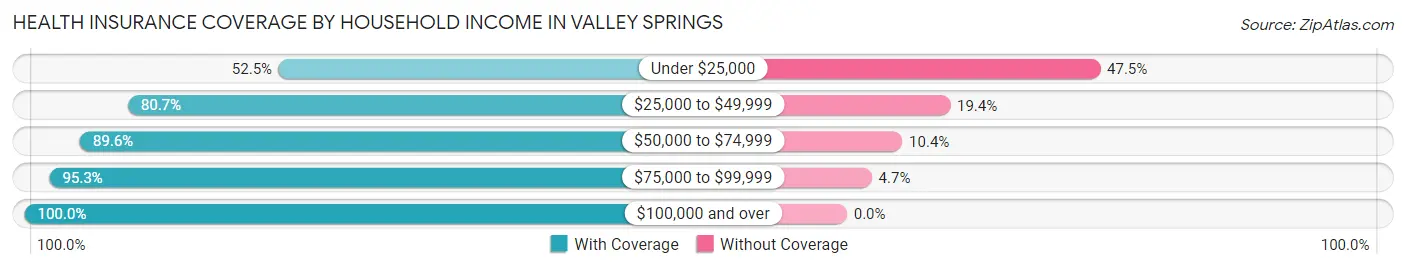
| Household Income | With Coverage | Without Coverage |
| Under $25,000 | 186 (52.5%) | 168 (47.5%) |
| $25,000 to $49,999 | 225 (80.6%) | 54 (19.4%) |
| $50,000 to $74,999 | 441 (89.6%) | 51 (10.4%) |
| $75,000 to $99,999 | 860 (95.3%) | 42 (4.7%) |
| $100,000 and over | 1,603 (100.0%) | 0 (0.0%) |
Public vs Private Health Insurance Coverage by Age in Valley Springs
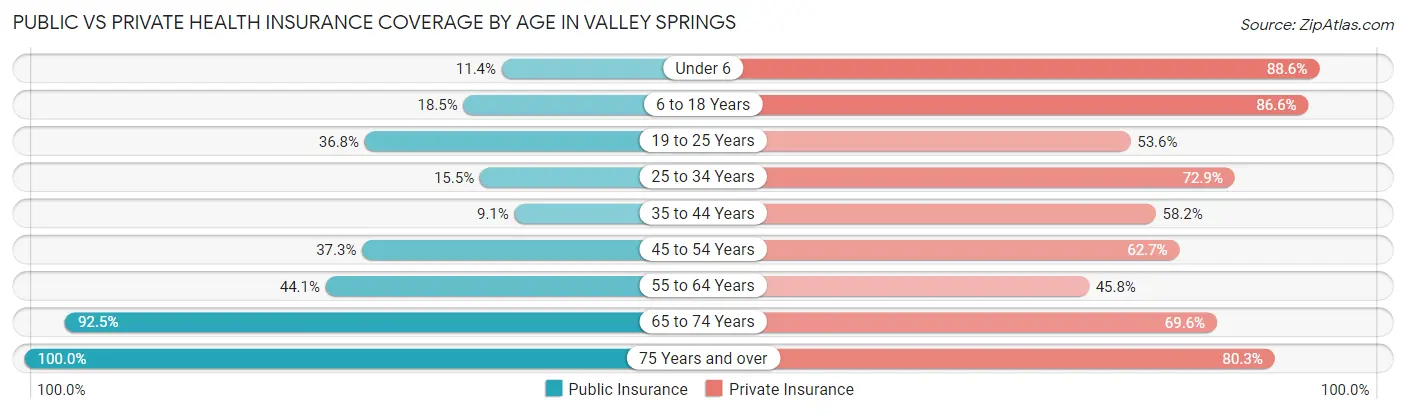
| Age Bracket | Public Insurance | Private Insurance |
| Under 6 | 21 (11.4%) | 163 (88.6%) |
| 6 to 18 Years | 101 (18.5%) | 472 (86.6%) |
| 19 to 25 Years | 161 (36.8%) | 234 (53.5%) |
| 25 to 34 Years | 88 (15.5%) | 415 (72.9%) |
| 35 to 44 Years | 39 (9.0%) | 251 (58.2%) |
| 45 to 54 Years | 112 (37.3%) | 188 (62.7%) |
| 55 to 64 Years | 127 (44.1%) | 132 (45.8%) |
| 65 to 74 Years | 481 (92.5%) | 362 (69.6%) |
| 75 Years and over | 356 (100.0%) | 286 (80.3%) |
| Total | 1,486 (40.9%) | 2,503 (69.0%) |
Disability Status by Sex by Age in Valley Springs
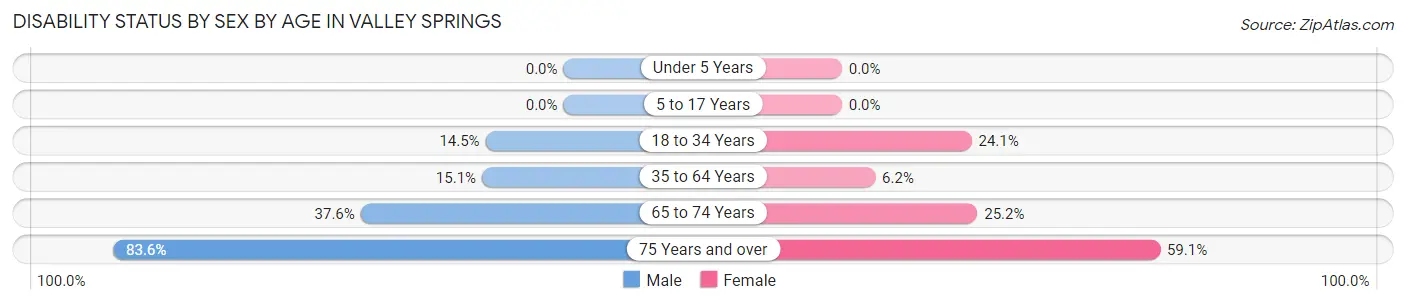
| Age Bracket | Male | Female |
| Under 5 Years | 0 (0.0%) | 0 (0.0%) |
| 5 to 17 Years | 0 (0.0%) | 0 (0.0%) |
| 18 to 34 Years | 97 (14.5%) | 111 (24.1%) |
| 35 to 64 Years | 93 (15.1%) | 25 (6.2%) |
| 65 to 74 Years | 70 (37.6%) | 84 (25.2%) |
| 75 Years and over | 173 (83.6%) | 88 (59.1%) |
Disability Class by Sex by Age in Valley Springs
Disability Class: Hearing Difficulty
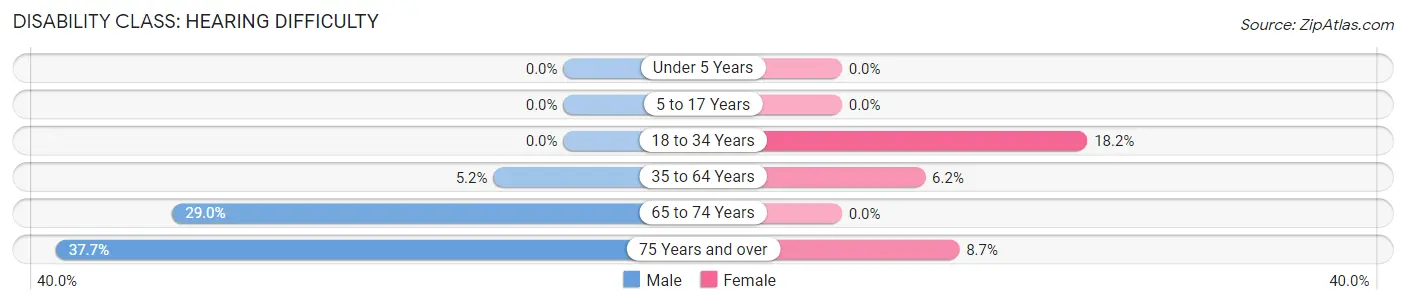
| Age Bracket | Male | Female |
| Under 5 Years | 0 (0.0%) | 0 (0.0%) |
| 5 to 17 Years | 0 (0.0%) | 0 (0.0%) |
| 18 to 34 Years | 0 (0.0%) | 84 (18.2%) |
| 35 to 64 Years | 32 (5.2%) | 25 (6.2%) |
| 65 to 74 Years | 54 (29.0%) | 0 (0.0%) |
| 75 Years and over | 78 (37.7%) | 13 (8.7%) |
Disability Class: Vision Difficulty
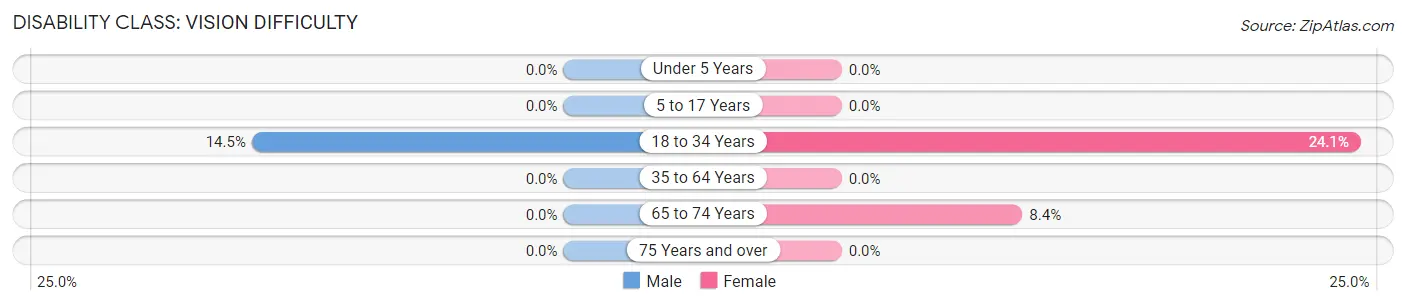
| Age Bracket | Male | Female |
| Under 5 Years | 0 (0.0%) | 0 (0.0%) |
| 5 to 17 Years | 0 (0.0%) | 0 (0.0%) |
| 18 to 34 Years | 97 (14.5%) | 111 (24.1%) |
| 35 to 64 Years | 0 (0.0%) | 0 (0.0%) |
| 65 to 74 Years | 0 (0.0%) | 28 (8.4%) |
| 75 Years and over | 0 (0.0%) | 0 (0.0%) |
Disability Class: Cognitive Difficulty
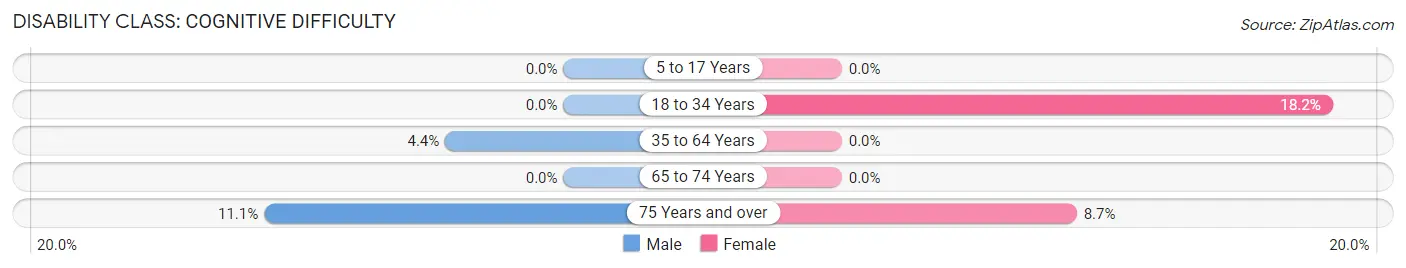
| Age Bracket | Male | Female |
| 5 to 17 Years | 0 (0.0%) | 0 (0.0%) |
| 18 to 34 Years | 0 (0.0%) | 84 (18.2%) |
| 35 to 64 Years | 27 (4.4%) | 0 (0.0%) |
| 65 to 74 Years | 0 (0.0%) | 0 (0.0%) |
| 75 Years and over | 23 (11.1%) | 13 (8.7%) |
Disability Class: Ambulatory Difficulty
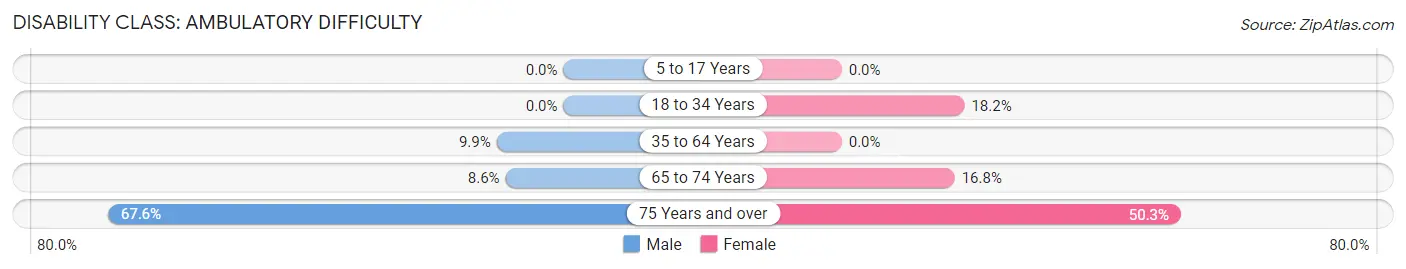
| Age Bracket | Male | Female |
| 5 to 17 Years | 0 (0.0%) | 0 (0.0%) |
| 18 to 34 Years | 0 (0.0%) | 84 (18.2%) |
| 35 to 64 Years | 61 (9.9%) | 0 (0.0%) |
| 65 to 74 Years | 16 (8.6%) | 56 (16.8%) |
| 75 Years and over | 140 (67.6%) | 75 (50.3%) |
Disability Class: Self-Care Difficulty
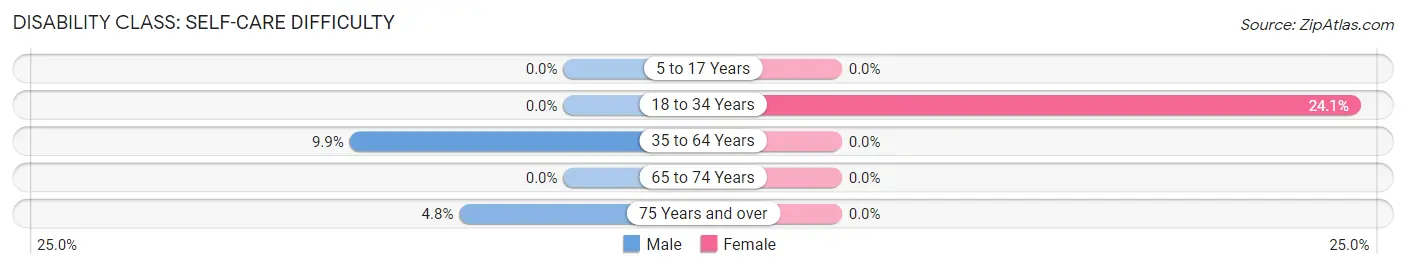
| Age Bracket | Male | Female |
| 5 to 17 Years | 0 (0.0%) | 0 (0.0%) |
| 18 to 34 Years | 0 (0.0%) | 111 (24.1%) |
| 35 to 64 Years | 61 (9.9%) | 0 (0.0%) |
| 65 to 74 Years | 0 (0.0%) | 0 (0.0%) |
| 75 Years and over | 10 (4.8%) | 0 (0.0%) |
Technology Access in Valley Springs
Computing Device Access in Valley Springs
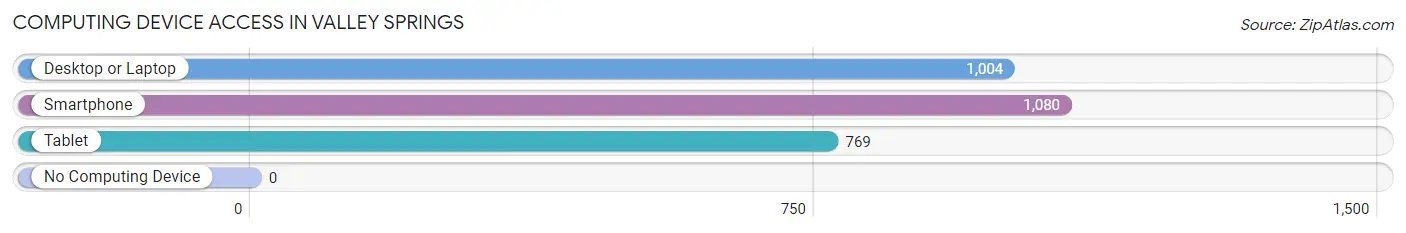
| Device Type | # Households | % Households |
| Desktop or Laptop | 1,004 | 83.0% |
| Smartphone | 1,080 | 89.3% |
| Tablet | 769 | 63.6% |
| No Computing Device | 0 | 0.0% |
| Total | 1,209 | 100.0% |
Internet Access in Valley Springs
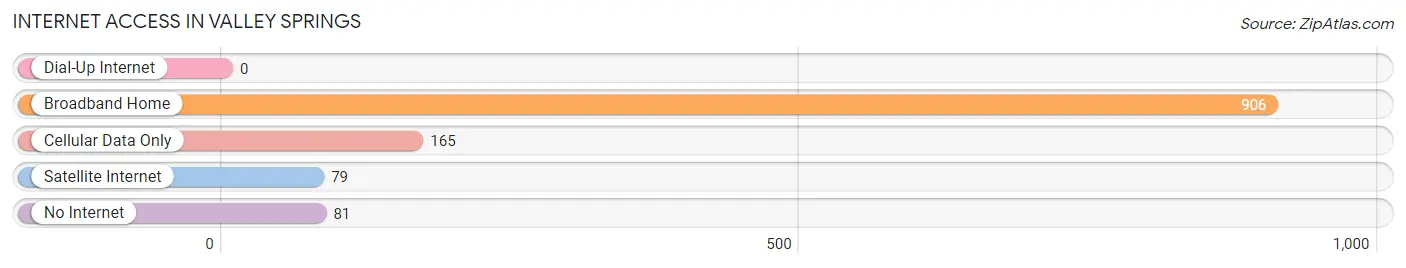
| Internet Type | # Households | % Households |
| Dial-Up Internet | 0 | 0.0% |
| Broadband Home | 906 | 74.9% |
| Cellular Data Only | 165 | 13.7% |
| Satellite Internet | 79 | 6.5% |
| No Internet | 81 | 6.7% |
| Total | 1,209 | 100.0% |
Valley Springs Summary
Valley Springs is a small unincorporated community located in Calaveras County, California. It is situated in the foothills of the Sierra Nevada Mountains, approximately 40 miles east of Stockton and 80 miles southeast of Sacramento. The population of Valley Springs was estimated to be 3,553 in 2019.
History
Valley Springs was originally inhabited by the Miwok and Yokut Native American tribes. The first European settlers arrived in the area in the mid-1800s, and the town was officially founded in 1852. The town was named after the nearby Valley Springs Creek, which was named by a group of miners who discovered the creek in 1848.
The town quickly grew in size and importance, becoming a major stop on the stagecoach route between Stockton and Sacramento. In the late 1800s, the town was home to several businesses, including a hotel, a blacksmith shop, a general store, and a post office.
Geography
Valley Springs is located in the foothills of the Sierra Nevada Mountains, at an elevation of 1,100 feet. The town is situated in a valley surrounded by rolling hills and oak-covered mountains. The climate is mild, with hot summers and cool winters.
The town is located near several lakes, including Lake Camanche, Lake Tulloch, and New Hogan Lake. The Mokelumne River runs through the town, providing a source of recreation and irrigation for the area.
Economy
The economy of Valley Springs is largely based on agriculture and tourism. The town is home to several wineries, and the surrounding area is known for its production of walnuts, almonds, and other crops.
Tourism is also an important part of the local economy. The town is home to several popular attractions, including the Calaveras Big Trees State Park, the Moaning Caverns, and the New Hogan Lake.
Demographics
As of 2019, the population of Valley Springs was estimated to be 3,553. The racial makeup of the town was 87.3% White, 4.2% Hispanic or Latino, 2.2% Asian, 1.7% African American, and 0.7% Native American.
The median household income in Valley Springs was $60,945 in 2019, and the median home value was $323,400. The town has a low unemployment rate of 3.2%.
Valley Springs is a small, rural community with a strong sense of community and a rich history. The town is home to a diverse population and a thriving economy, making it an attractive place to live and visit.
Common Questions
What is Per Capita Income in Valley Springs?
Per Capita income in Valley Springs is $35,697.
What is the Median Family Income in Valley Springs?
Median Family Income in Valley Springs is $79,643.
What is the Median Household income in Valley Springs?
Median Household Income in Valley Springs is $90,408.
What is Income or Wage Gap in Valley Springs?
Income or Wage Gap in Valley Springs is 54.5%.
Women in Valley Springs earn 45.5 cents for every dollar earned by a man.
What is Inequality or Gini Index in Valley Springs?
Inequality or Gini Index in Valley Springs is 0.31.
What is the Total Population of Valley Springs?
Total Population of Valley Springs is 3,630.
What is the Total Male Population of Valley Springs?
Total Male Population of Valley Springs is 1,997.
What is the Total Female Population of Valley Springs?
Total Female Population of Valley Springs is 1,633.
What is the Ratio of Males per 100 Females in Valley Springs?
There are 122.29 Males per 100 Females in Valley Springs.
What is the Ratio of Females per 100 Males in Valley Springs?
There are 81.77 Females per 100 Males in Valley Springs.
What is the Median Population Age in Valley Springs?
Median Population Age in Valley Springs is 37.5 Years.
What is the Average Family Size in Valley Springs
Average Family Size in Valley Springs is 3.3 People.
What is the Average Household Size in Valley Springs
Average Household Size in Valley Springs is 3.0 People.
How Large is the Labor Force in Valley Springs?
There are 1,798 People in the Labor Forcein in Valley Springs.
What is the Percentage of People in the Labor Force in Valley Springs?
56.2% of People are in the Labor Force in Valley Springs.
What is the Unemployment Rate in Valley Springs?
Unemployment Rate in Valley Springs is 7.5%.