Tulelake, CA Map & Demographics
Tulelake Map
Tulelake Overview
$15,204
PER CAPITA INCOME
$41,680
AVG FAMILY INCOME
$41,154
AVG HOUSEHOLD INCOME
$7,734
FAMILY INCOME DEFICIT
0.38
INEQUALITY / GINI INDEX
811
TOTAL POPULATION
341
MALE POPULATION
470
FEMALE POPULATION
72.55
MALES / 100 FEMALES
137.83
FEMALES / 100 MALES
39.4
MEDIAN AGE
3.8
AVG FAMILY SIZE
3.4
AVG HOUSEHOLD SIZE
226
LABOR FORCE [ PEOPLE ]
39.5%
PERCENT IN LABOR FORCE
11.9%
UNEMPLOYMENT RATE
Tulelake Zip Codes
Tulelake Area Codes
Income in Tulelake
Income Overview in Tulelake
Per Capita Income in Tulelake is $15,204, while median incomes of families and households are $41,680 and $41,154 respectively.
| Characteristic | Number | Measure |
| Per Capita Income | 811 | $15,204 |
| Median Family Income | 189 | $41,680 |
| Mean Family Income | 189 | $54,670 |
| Median Household Income | 240 | $41,154 |
| Mean Household Income | 240 | $50,077 |
| Income Deficit | 189 | $7,734 |
| Wage / Income Gap (%) | 811 | 0.00% |
| Wage / Income Gap ($) | 811 | 100.00¢ per $1 |
| Gini / Inequality Index | 811 | 0.38 |
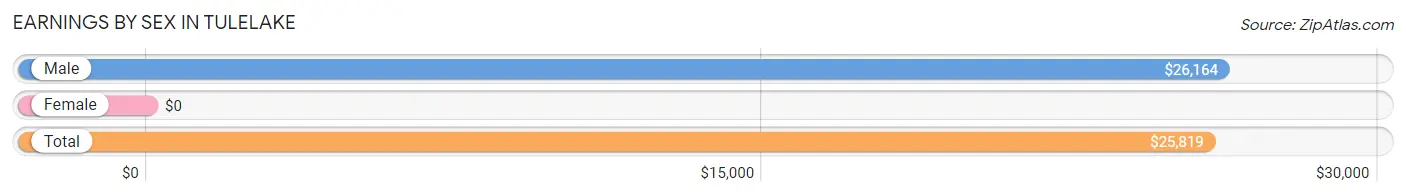
Earnings by Sex in Tulelake
| Sex | Number | Average Earnings |
| Male | 147 (67.1%) | $26,164 |
| Female | 72 (32.9%) | $0 |
| Total | 219 (100.0%) | $25,819 |
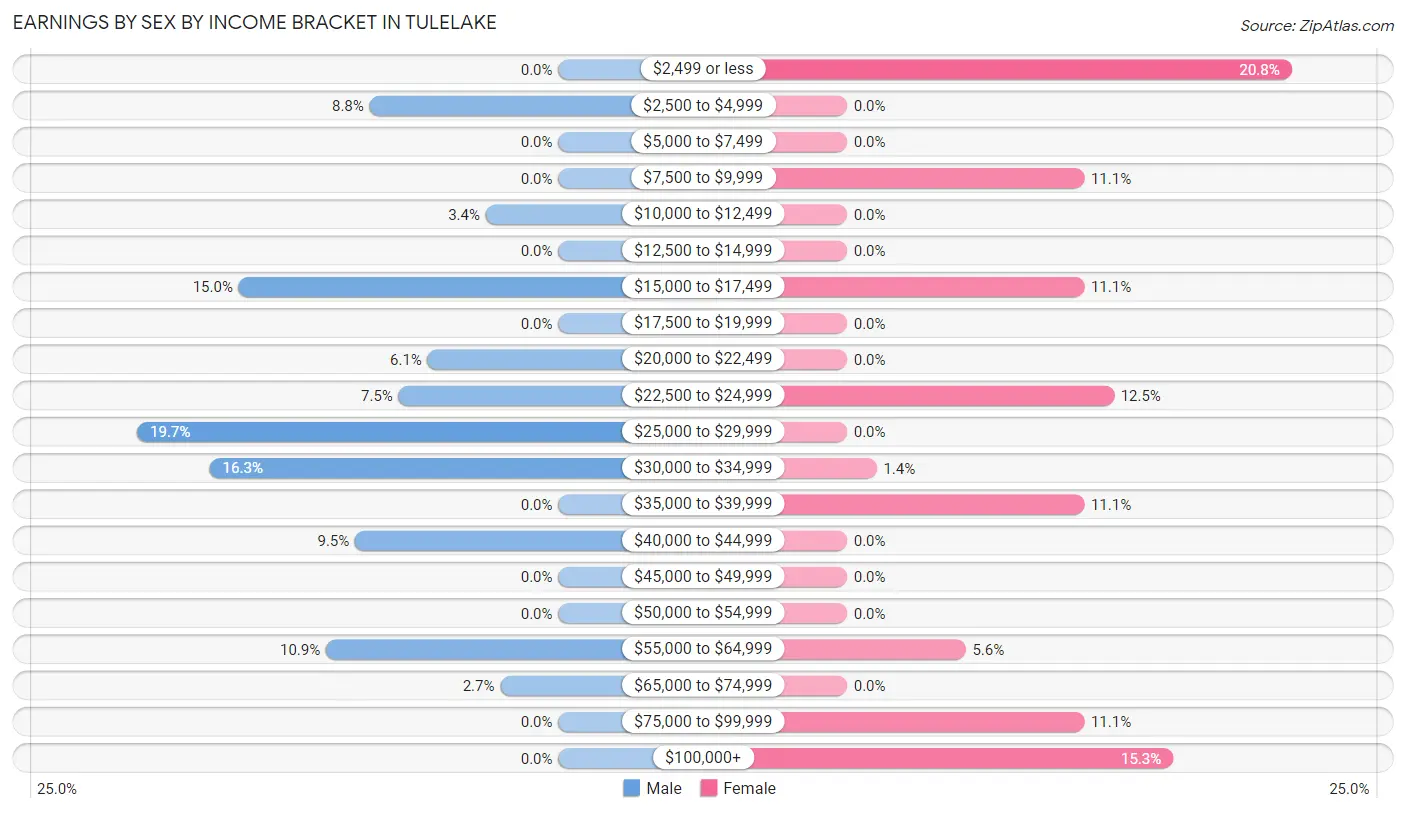
Earnings by Sex by Income Bracket in Tulelake
The most common earnings brackets in Tulelake are $25,000 to $29,999 for men (29 | 19.7%) and $2,499 or less for women (15 | 20.8%).
| Income | Male | Female |
| $2,499 or less | 0 (0.0%) | 15 (20.8%) |
| $2,500 to $4,999 | 13 (8.8%) | 0 (0.0%) |
| $5,000 to $7,499 | 0 (0.0%) | 0 (0.0%) |
| $7,500 to $9,999 | 0 (0.0%) | 8 (11.1%) |
| $10,000 to $12,499 | 5 (3.4%) | 0 (0.0%) |
| $12,500 to $14,999 | 0 (0.0%) | 0 (0.0%) |
| $15,000 to $17,499 | 22 (15.0%) | 8 (11.1%) |
| $17,500 to $19,999 | 0 (0.0%) | 0 (0.0%) |
| $20,000 to $22,499 | 9 (6.1%) | 0 (0.0%) |
| $22,500 to $24,999 | 11 (7.5%) | 9 (12.5%) |
| $25,000 to $29,999 | 29 (19.7%) | 0 (0.0%) |
| $30,000 to $34,999 | 24 (16.3%) | 1 (1.4%) |
| $35,000 to $39,999 | 0 (0.0%) | 8 (11.1%) |
| $40,000 to $44,999 | 14 (9.5%) | 0 (0.0%) |
| $45,000 to $49,999 | 0 (0.0%) | 0 (0.0%) |
| $50,000 to $54,999 | 0 (0.0%) | 0 (0.0%) |
| $55,000 to $64,999 | 16 (10.9%) | 4 (5.6%) |
| $65,000 to $74,999 | 4 (2.7%) | 0 (0.0%) |
| $75,000 to $99,999 | 0 (0.0%) | 8 (11.1%) |
| $100,000+ | 0 (0.0%) | 11 (15.3%) |
| Total | 147 (100.0%) | 72 (100.0%) |
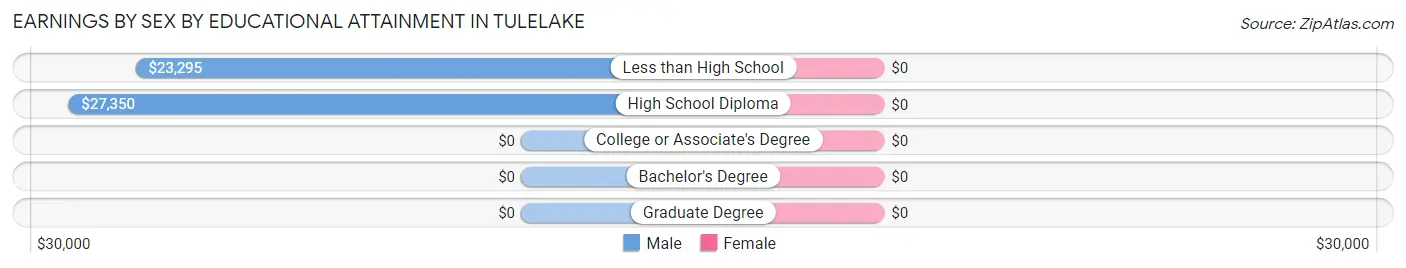
Earnings by Sex by Educational Attainment in Tulelake
| Educational Attainment | Male Income | Female Income |
| Less than High School | $23,295 | $0 |
| High School Diploma | $27,350 | $0 |
| College or Associate's Degree | - | - |
| Bachelor's Degree | - | - |
| Graduate Degree | - | - |
| Total | $26,853 | $0 |
Family Income in Tulelake
Family Income Brackets in Tulelake
According to the Tulelake family income data, there are 58 families falling into the $35,000 to $49,999 income range, which is the most common income bracket and makes up 30.7% of all families.
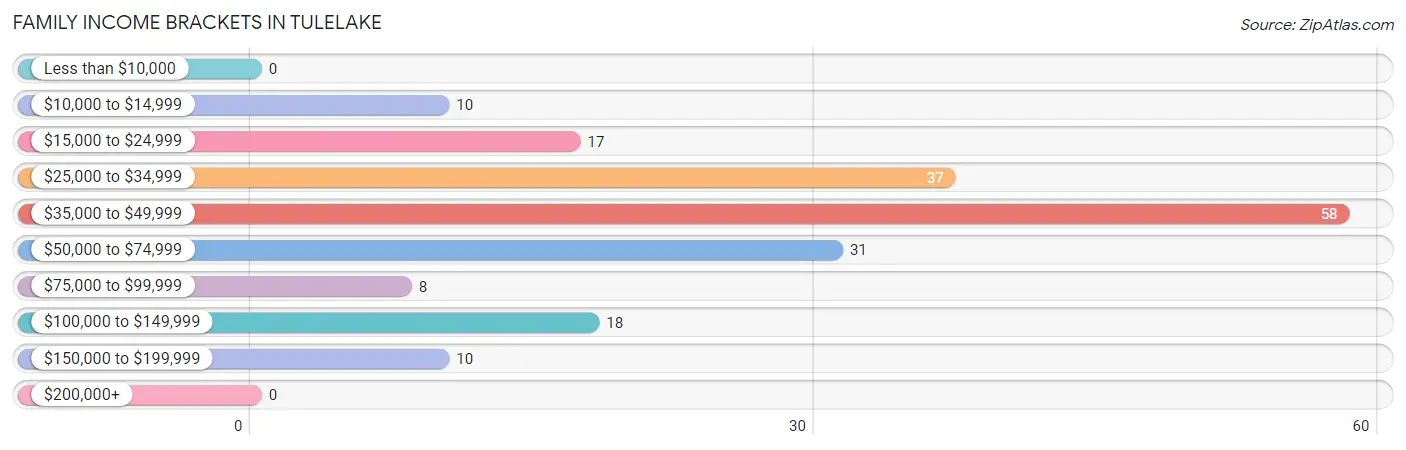
| Income Bracket | # Families | % Families |
| Less than $10,000 | 0 | 0.0% |
| $10,000 to $14,999 | 10 | 5.3% |
| $15,000 to $24,999 | 17 | 9.0% |
| $25,000 to $34,999 | 37 | 19.6% |
| $35,000 to $49,999 | 58 | 30.7% |
| $50,000 to $74,999 | 31 | 16.4% |
| $75,000 to $99,999 | 8 | 4.2% |
| $100,000 to $149,999 | 18 | 9.5% |
| $150,000 to $199,999 | 10 | 5.3% |
| $200,000+ | 0 | 0.0% |
Family Income by Famaliy Size in Tulelake
2-person families (76 | 40.2%) account for the highest median family income in Tulelake with $47,083 per family, while 2-person families (76 | 40.2%) have the highest median income of $23,542 per family member.
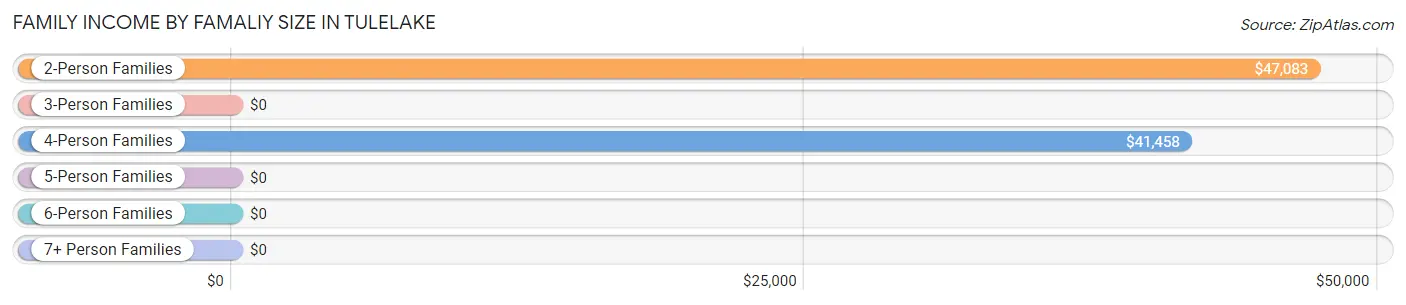
| Income Bracket | # Families | Median Income |
| 2-Person Families | 76 (40.2%) | $47,083 |
| 3-Person Families | 23 (12.2%) | $0 |
| 4-Person Families | 59 (31.2%) | $41,458 |
| 5-Person Families | 12 (6.4%) | $0 |
| 6-Person Families | 9 (4.8%) | $0 |
| 7+ Person Families | 10 (5.3%) | $0 |
| Total | 189 (100.0%) | $41,680 |
Family Income by Number of Earners in Tulelake
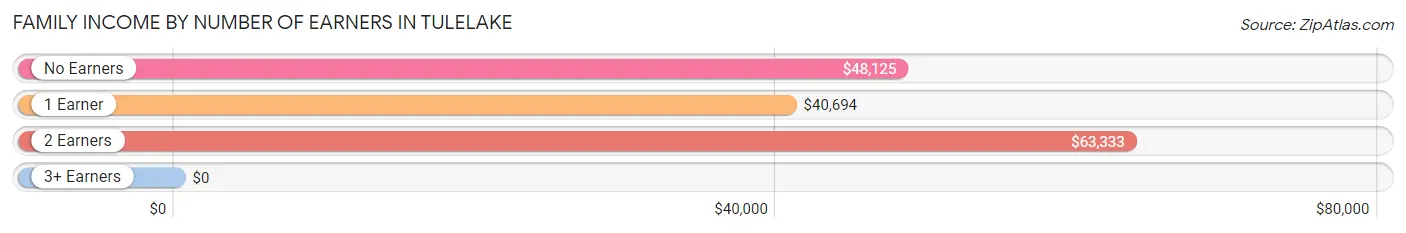
| Number of Earners | # Families | Median Income |
| No Earners | 44 (23.3%) | $48,125 |
| 1 Earner | 89 (47.1%) | $40,694 |
| 2 Earners | 56 (29.6%) | $63,333 |
| 3+ Earners | 0 (0.0%) | $0 |
| Total | 189 (100.0%) | $41,680 |
Household Income in Tulelake
Household Income Brackets in Tulelake
With 63 households falling in the category, the $35,000 to $49,999 income range is the most frequent in Tulelake, accounting for 26.3% of all households.
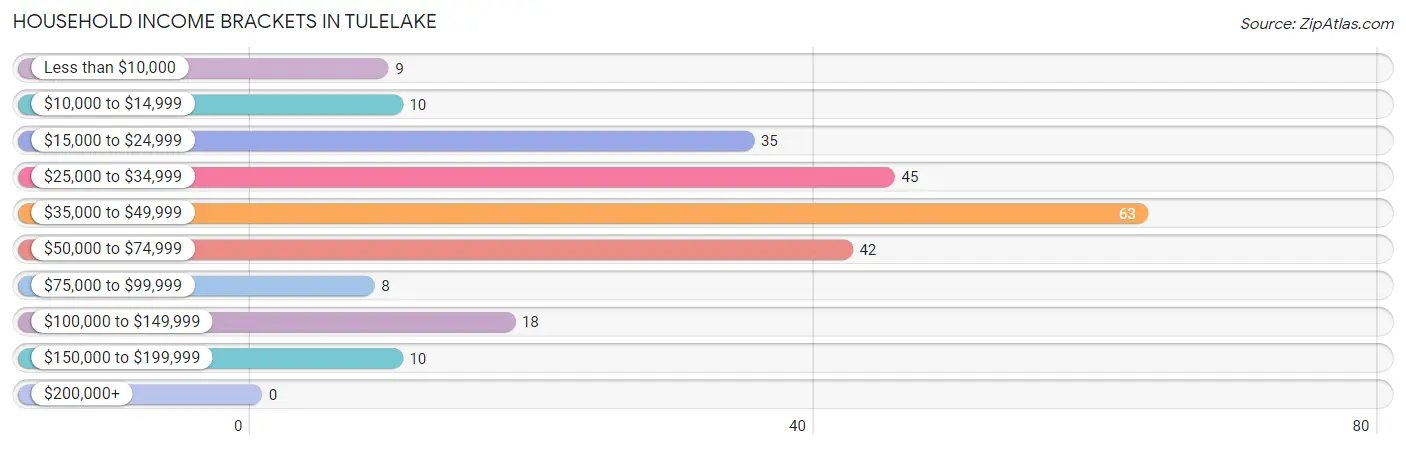
| Income Bracket | # Households | % Households |
| Less than $10,000 | 9 | 3.8% |
| $10,000 to $14,999 | 10 | 4.2% |
| $15,000 to $24,999 | 35 | 14.6% |
| $25,000 to $34,999 | 45 | 18.8% |
| $35,000 to $49,999 | 63 | 26.3% |
| $50,000 to $74,999 | 42 | 17.5% |
| $75,000 to $99,999 | 8 | 3.3% |
| $100,000 to $149,999 | 18 | 7.5% |
| $150,000 to $199,999 | 10 | 4.2% |
| $200,000+ | 0 | 0.0% |
Household Income by Householder Age in Tulelake
The median household income in Tulelake is $41,154, with the highest median household income of $43,750 found in the 25 to 44 years age bracket for the primary householder. A total of 117 households (48.7%) fall into this category. Meanwhile, the 15 to 24 years age bracket for the primary householder has the lowest median household income of $0, with 6 households (2.5%) in this group.
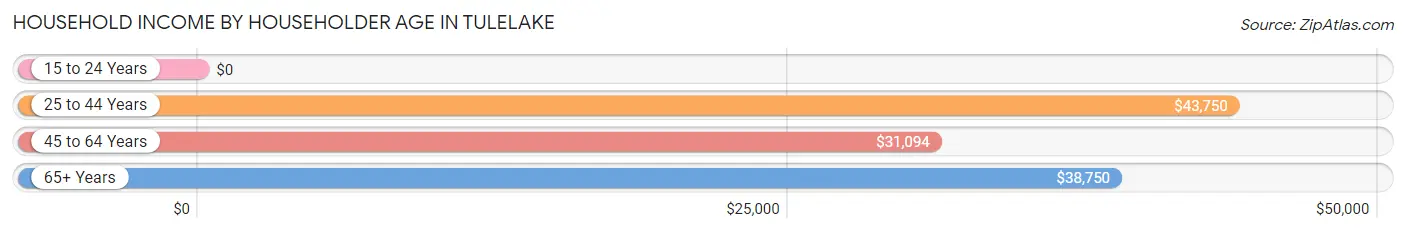
| Income Bracket | # Households | Median Income |
| 15 to 24 Years | 6 (2.5%) | $0 |
| 25 to 44 Years | 117 (48.7%) | $43,750 |
| 45 to 64 Years | 61 (25.4%) | $31,094 |
| 65+ Years | 56 (23.3%) | $38,750 |
| Total | 240 (100.0%) | $41,154 |
Poverty in Tulelake
Income Below Poverty by Sex and Age in Tulelake
With 32.6% poverty level for males and 40.6% for females among the residents of Tulelake, 5 year old males and 25 to 34 year old females are the most vulnerable to poverty, with 14 males (100.0%) and 31 females (88.6%) in their respective age groups living below the poverty level.
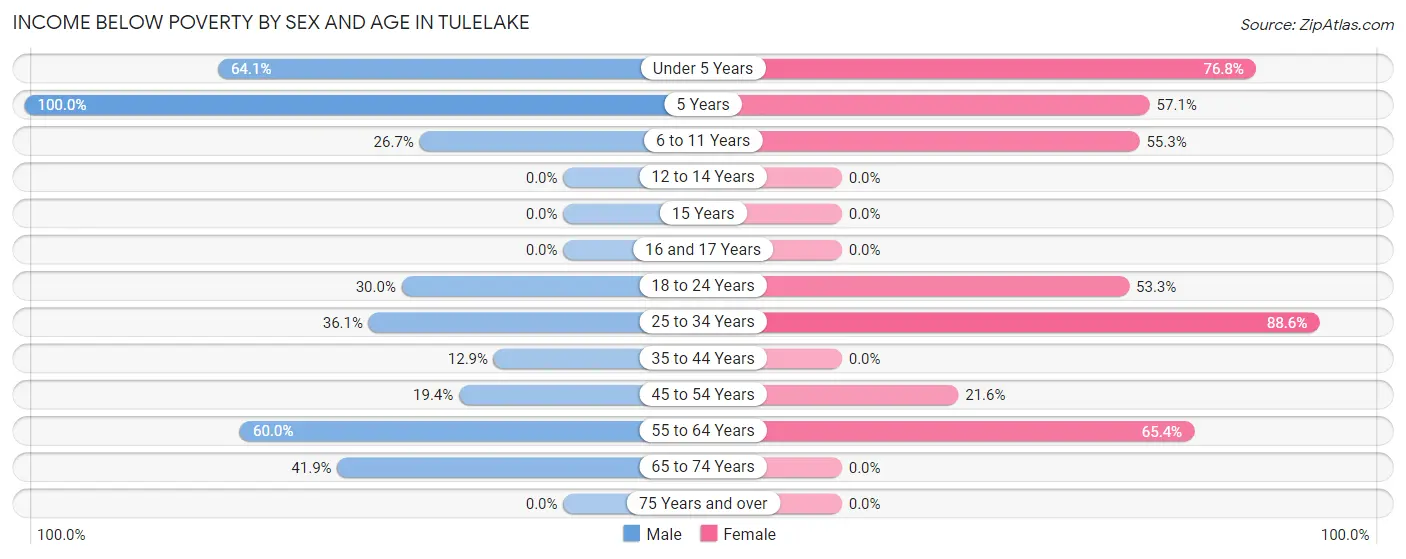
| Age Bracket | Male | Female |
| Under 5 Years | 25 (64.1%) | 53 (76.8%) |
| 5 Years | 14 (100.0%) | 4 (57.1%) |
| 6 to 11 Years | 8 (26.7%) | 21 (55.3%) |
| 12 to 14 Years | 0 (0.0%) | 0 (0.0%) |
| 15 Years | 0 (0.0%) | 0 (0.0%) |
| 16 and 17 Years | 0 (0.0%) | 0 (0.0%) |
| 18 to 24 Years | 6 (30.0%) | 8 (53.3%) |
| 25 to 34 Years | 26 (36.1%) | 31 (88.6%) |
| 35 to 44 Years | 4 (12.9%) | 0 (0.0%) |
| 45 to 54 Years | 6 (19.4%) | 8 (21.6%) |
| 55 to 64 Years | 9 (60.0%) | 66 (65.3%) |
| 65 to 74 Years | 13 (41.9%) | 0 (0.0%) |
| 75 Years and over | 0 (0.0%) | 0 (0.0%) |
| Total | 111 (32.6%) | 191 (40.6%) |
Income Above Poverty by Sex and Age in Tulelake
According to the poverty statistics in Tulelake, males aged 12 to 14 years and females aged 12 to 14 years are the age groups that are most secure financially, with 100.0% of males and 100.0% of females in these age groups living above the poverty line.
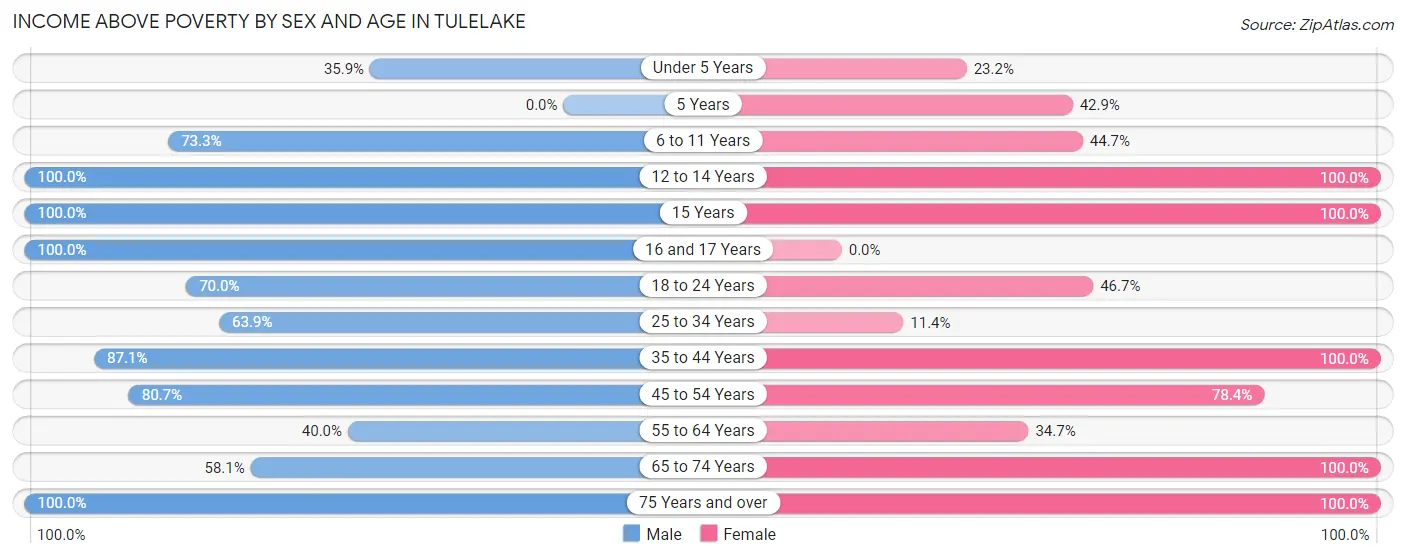
| Age Bracket | Male | Female |
| Under 5 Years | 14 (35.9%) | 16 (23.2%) |
| 5 Years | 0 (0.0%) | 3 (42.9%) |
| 6 to 11 Years | 22 (73.3%) | 17 (44.7%) |
| 12 to 14 Years | 8 (100.0%) | 3 (100.0%) |
| 15 Years | 5 (100.0%) | 26 (100.0%) |
| 16 and 17 Years | 5 (100.0%) | 0 (0.0%) |
| 18 to 24 Years | 14 (70.0%) | 7 (46.7%) |
| 25 to 34 Years | 46 (63.9%) | 4 (11.4%) |
| 35 to 44 Years | 27 (87.1%) | 52 (100.0%) |
| 45 to 54 Years | 25 (80.6%) | 29 (78.4%) |
| 55 to 64 Years | 6 (40.0%) | 35 (34.6%) |
| 65 to 74 Years | 18 (58.1%) | 58 (100.0%) |
| 75 Years and over | 40 (100.0%) | 29 (100.0%) |
| Total | 230 (67.4%) | 279 (59.4%) |
Income Below Poverty Among Married-Couple Families in Tulelake
The poverty statistics for married-couple families in Tulelake show that 33.6% or 47 of the total 140 families live below the poverty line. Families with 3 or 4 children have the highest poverty rate of 100.0%, comprising of 4 families. On the other hand, families with no children have the lowest poverty rate of 16.9%, which includes 11 families.
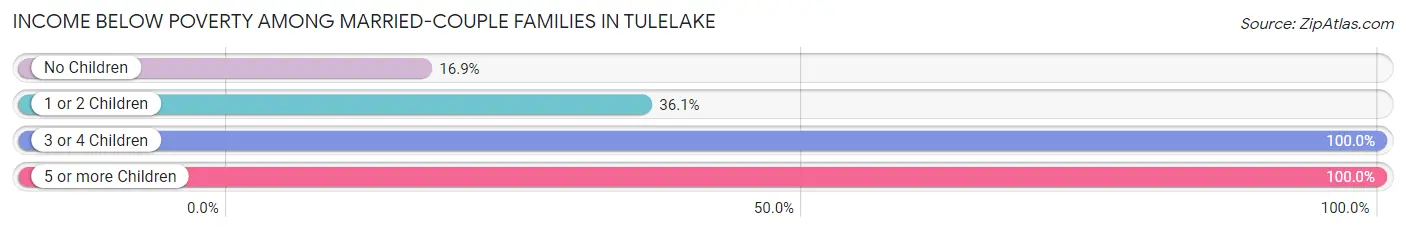
| Children | Above Poverty | Below Poverty |
| No Children | 54 (83.1%) | 11 (16.9%) |
| 1 or 2 Children | 39 (63.9%) | 22 (36.1%) |
| 3 or 4 Children | 0 (0.0%) | 4 (100.0%) |
| 5 or more Children | 0 (0.0%) | 10 (100.0%) |
| Total | 93 (66.4%) | 47 (33.6%) |
Income Below Poverty Among Single-Parent Households in Tulelake
| Children | Single Father | Single Mother |
| No Children | 0 (0.0%) | 0 (0.0%) |
| 1 or 2 Children | 0 (0.0%) | 0 (0.0%) |
| 3 or 4 Children | 0 (0.0%) | 0 (0.0%) |
| 5 or more Children | 0 (0.0%) | 0 (0.0%) |
| Total | 0 (0.0%) | 0 (0.0%) |
Income Below Poverty Among Married-Couple vs Single-Parent Households in Tulelake
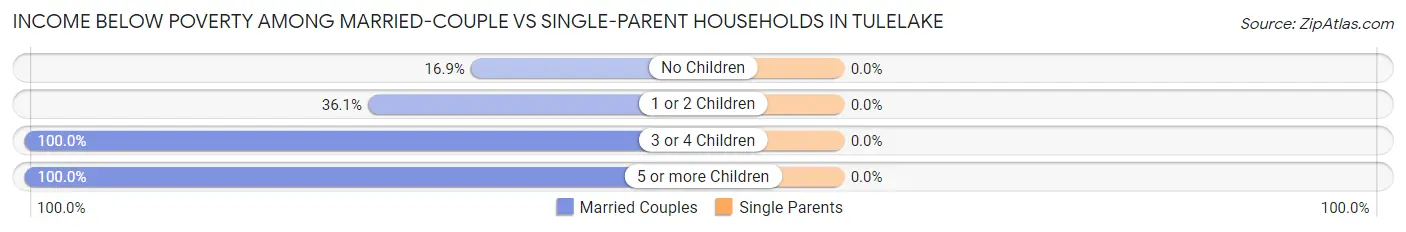
| Children | Married-Couple Families | Single-Parent Households |
| No Children | 11 (16.9%) | 0 (0.0%) |
| 1 or 2 Children | 22 (36.1%) | 0 (0.0%) |
| 3 or 4 Children | 4 (100.0%) | 0 (0.0%) |
| 5 or more Children | 10 (100.0%) | 0 (0.0%) |
| Total | 47 (33.6%) | 0 (0.0%) |
Race in Tulelake
The most populous races in Tulelake are White / Caucasian (601 | 74.1%), Hispanic or Latino (369 | 45.5%), and Two or more Races (143 | 17.6%).
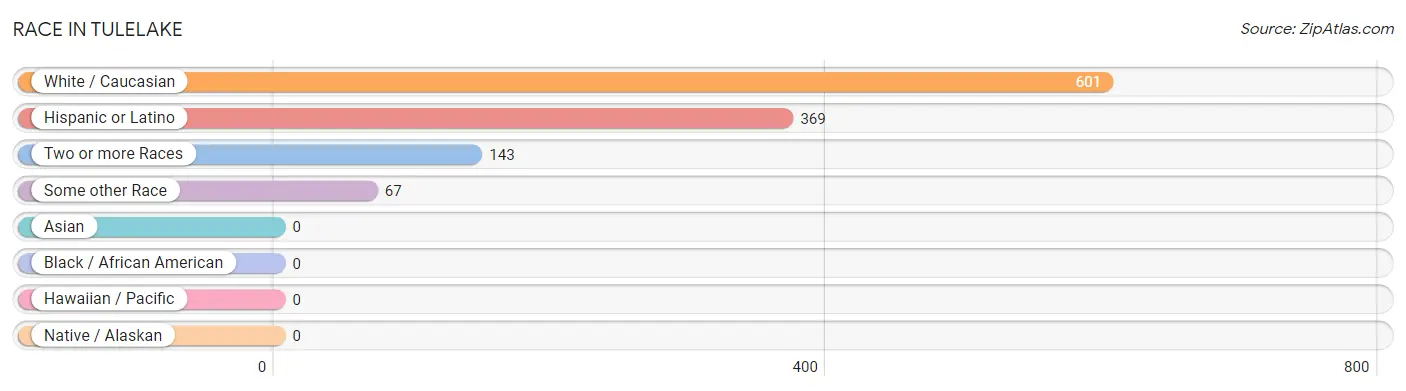
| Race | # Population | % Population |
| Asian | 0 | 0.0% |
| Black / African American | 0 | 0.0% |
| Hawaiian / Pacific | 0 | 0.0% |
| Hispanic or Latino | 369 | 45.5% |
| Native / Alaskan | 0 | 0.0% |
| White / Caucasian | 601 | 74.1% |
| Two or more Races | 143 | 17.6% |
| Some other Race | 67 | 8.3% |
| Total | 811 | 100.0% |
Ancestry in Tulelake
The most populous ancestries reported in Tulelake are Mexican (366 | 45.1%), Irish (92 | 11.3%), German (46 | 5.7%), English (14 | 1.7%), and Thai (14 | 1.7%), together accounting for 65.6% of all Tulelake residents.
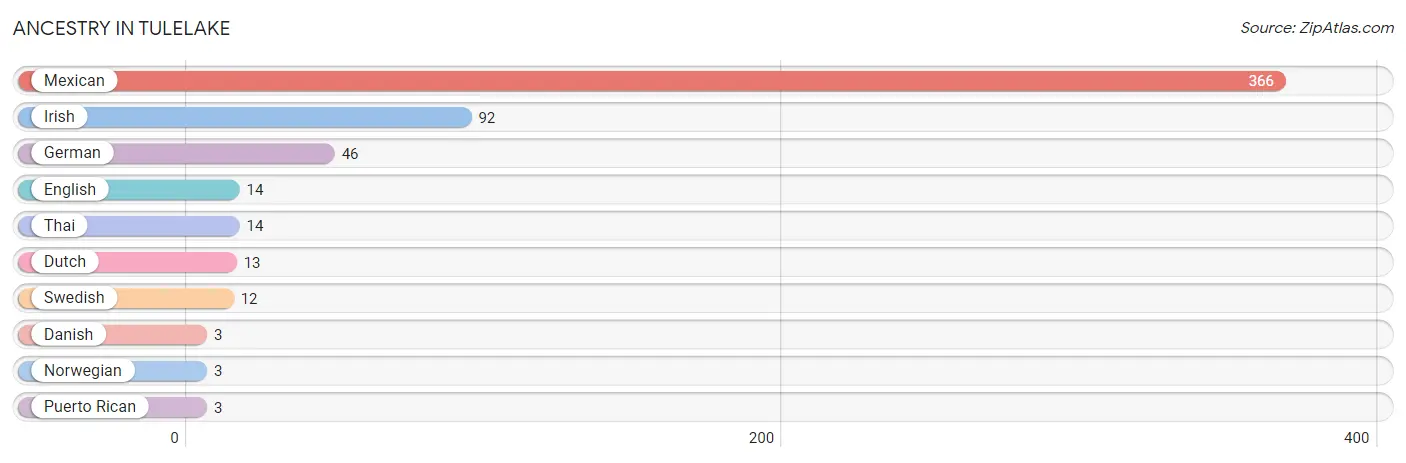
| Ancestry | # Population | % Population |
| Danish | 3 | 0.4% |
| Dutch | 13 | 1.6% |
| English | 14 | 1.7% |
| German | 46 | 5.7% |
| Irish | 92 | 11.3% |
| Mexican | 366 | 45.1% |
| Norwegian | 3 | 0.4% |
| Puerto Rican | 3 | 0.4% |
| Swedish | 12 | 1.5% |
| Thai | 14 | 1.7% | View All 10 Rows |
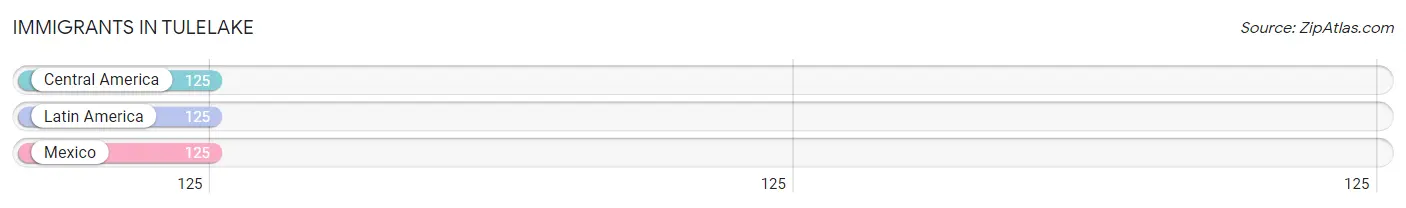
Immigrants in Tulelake
The most numerous immigrant groups reported in Tulelake came from Central America (125 | 15.4%), Latin America (125 | 15.4%), and Mexico (125 | 15.4%), together accounting for 46.2% of all Tulelake residents.
| Immigration Origin | # Population | % Population |
| Central America | 125 | 15.4% |
| Latin America | 125 | 15.4% |
| Mexico | 125 | 15.4% | View All 3 Rows |
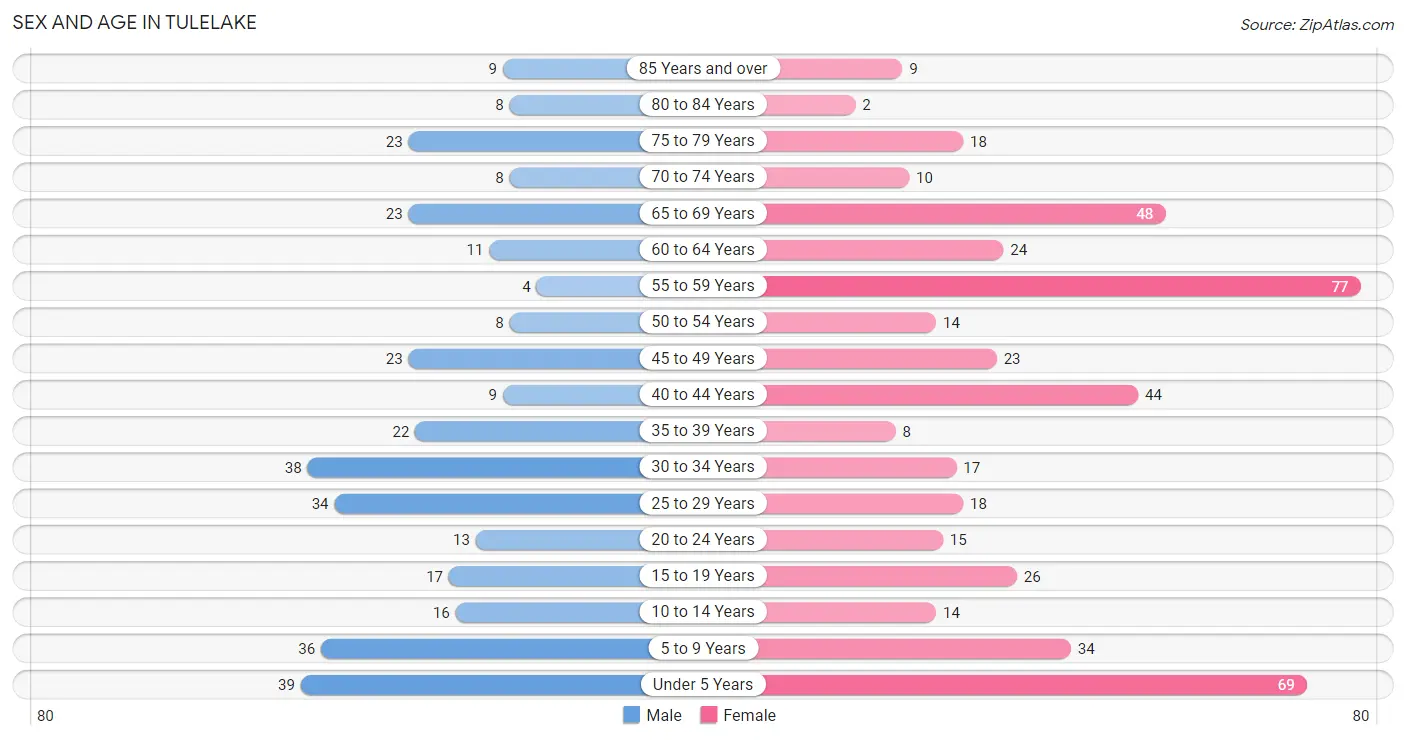
Sex and Age in Tulelake
Sex and Age in Tulelake
The most populous age groups in Tulelake are Under 5 Years (39 | 11.4%) for men and 55 to 59 Years (77 | 16.4%) for women.
| Age Bracket | Male | Female |
| Under 5 Years | 39 (11.4%) | 69 (14.7%) |
| 5 to 9 Years | 36 (10.6%) | 34 (7.2%) |
| 10 to 14 Years | 16 (4.7%) | 14 (3.0%) |
| 15 to 19 Years | 17 (5.0%) | 26 (5.5%) |
| 20 to 24 Years | 13 (3.8%) | 15 (3.2%) |
| 25 to 29 Years | 34 (10.0%) | 18 (3.8%) |
| 30 to 34 Years | 38 (11.1%) | 17 (3.6%) |
| 35 to 39 Years | 22 (6.5%) | 8 (1.7%) |
| 40 to 44 Years | 9 (2.6%) | 44 (9.4%) |
| 45 to 49 Years | 23 (6.7%) | 23 (4.9%) |
| 50 to 54 Years | 8 (2.4%) | 14 (3.0%) |
| 55 to 59 Years | 4 (1.2%) | 77 (16.4%) |
| 60 to 64 Years | 11 (3.2%) | 24 (5.1%) |
| 65 to 69 Years | 23 (6.7%) | 48 (10.2%) |
| 70 to 74 Years | 8 (2.4%) | 10 (2.1%) |
| 75 to 79 Years | 23 (6.7%) | 18 (3.8%) |
| 80 to 84 Years | 8 (2.4%) | 2 (0.4%) |
| 85 Years and over | 9 (2.6%) | 9 (1.9%) |
| Total | 341 (100.0%) | 470 (100.0%) |
Families and Households in Tulelake
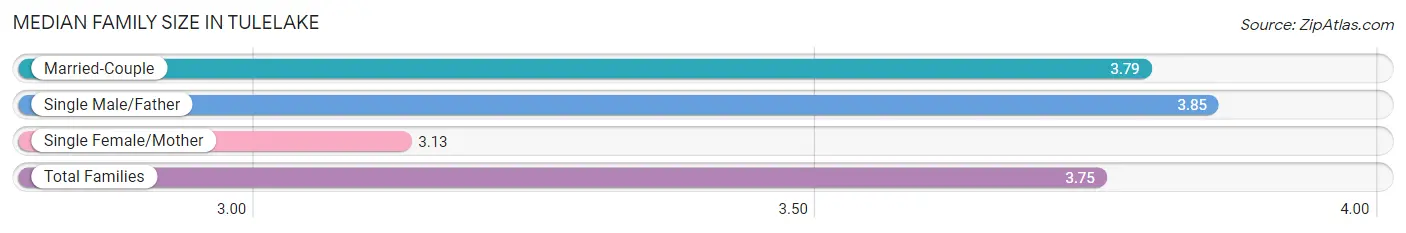
Median Family Size in Tulelake
The median family size in Tulelake is 3.75 persons per family, with single male/father families (33 | 17.5%) accounting for the largest median family size of 3.85 persons per family. On the other hand, single female/mother families (16 | 8.5%) represent the smallest median family size with 3.13 persons per family.
| Family Type | # Families | Family Size |
| Married-Couple | 140 (74.1%) | 3.79 |
| Single Male/Father | 33 (17.5%) | 3.85 |
| Single Female/Mother | 16 (8.5%) | 3.13 |
| Total Families | 189 (100.0%) | 3.75 |
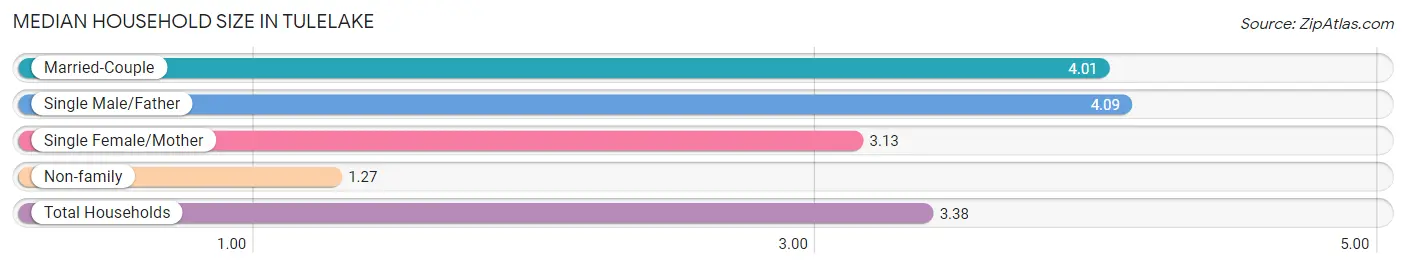
Median Household Size in Tulelake
The median household size in Tulelake is 3.38 persons per household, with single male/father households (33 | 13.8%) accounting for the largest median household size of 4.09 persons per household. non-family households (51 | 21.2%) represent the smallest median household size with 1.27 persons per household.
| Household Type | # Households | Household Size |
| Married-Couple | 140 (58.3%) | 4.01 |
| Single Male/Father | 33 (13.8%) | 4.09 |
| Single Female/Mother | 16 (6.7%) | 3.13 |
| Non-family | 51 (21.2%) | 1.27 |
| Total Households | 240 (100.0%) | 3.38 |
Household Size by Marriage Status in Tulelake
Out of a total of 240 households in Tulelake, 189 (78.7%) are family households, while 51 (21.2%) are nonfamily households. The most numerous type of family households are 2-person households, comprising 68, and the most common type of nonfamily households are 1-person households, comprising 40.
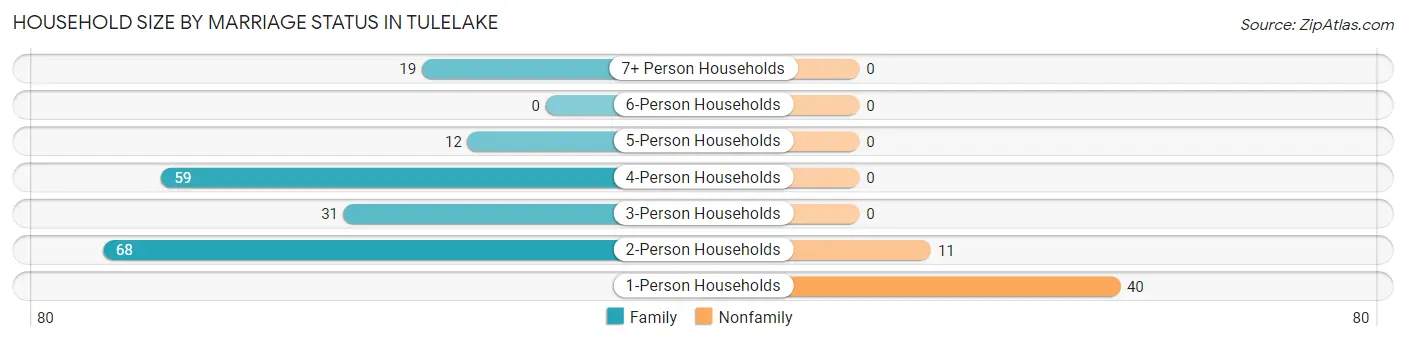
| Household Size | Family Households | Nonfamily Households |
| 1-Person Households | - | 40 (16.7%) |
| 2-Person Households | 68 (28.3%) | 11 (4.6%) |
| 3-Person Households | 31 (12.9%) | 0 (0.0%) |
| 4-Person Households | 59 (24.6%) | 0 (0.0%) |
| 5-Person Households | 12 (5.0%) | 0 (0.0%) |
| 6-Person Households | 0 (0.0%) | 0 (0.0%) |
| 7+ Person Households | 19 (7.9%) | 0 (0.0%) |
| Total | 189 (78.7%) | 51 (21.2%) |
Female Fertility in Tulelake
Fertility by Age in Tulelake
Average fertility rate in Tulelake is 39.0 births per 1,000 women. Women in the age bracket of 20 to 34 years have the highest fertility rate with 120.0 births per 1,000 women. Women in the age bracket of 20 to 34 years acount for 100.0% of all women with births.
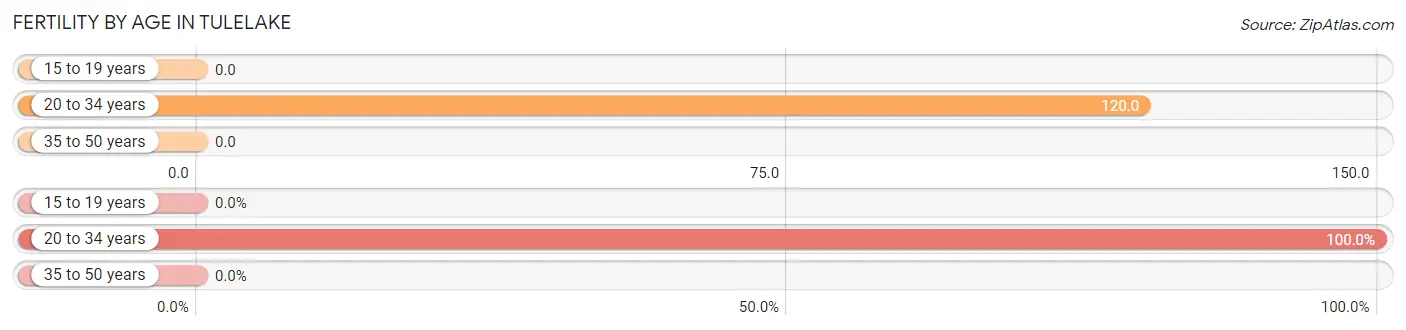
| Age Bracket | Women with Births | Births / 1,000 Women |
| 15 to 19 years | 0 (0.0%) | 0.0 |
| 20 to 34 years | 6 (100.0%) | 120.0 |
| 35 to 50 years | 0 (0.0%) | 0.0 |
| Total | 6 (100.0%) | 39.0 |
Fertility by Age by Marriage Status in Tulelake
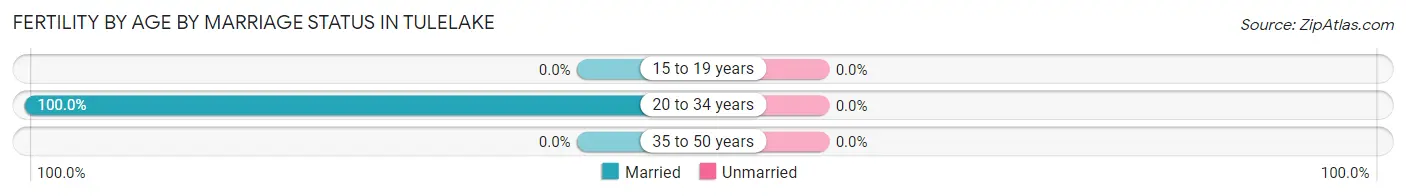
| Age Bracket | Married | Unmarried |
| 15 to 19 years | 0 (0.0%) | 0 (0.0%) |
| 20 to 34 years | 6 (100.0%) | 0 (0.0%) |
| 35 to 50 years | 0 (0.0%) | 0 (0.0%) |
| Total | 6 (100.0%) | 0 (0.0%) |
Fertility by Education in Tulelake
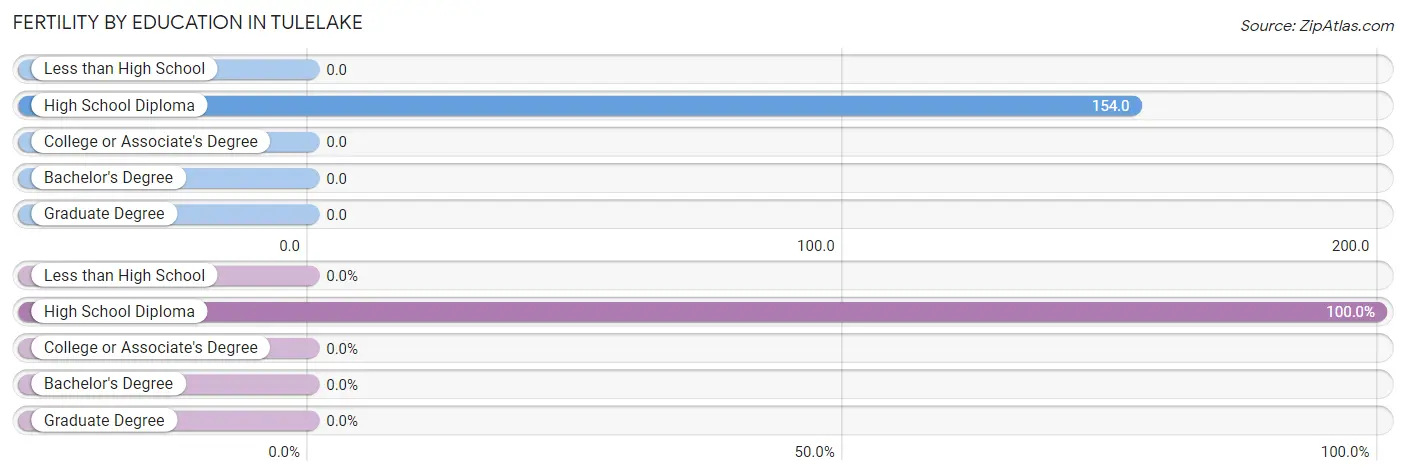
| Educational Attainment | Women with Births | Births / 1,000 Women |
| Less than High School | 0 (0.0%) | 0.0 |
| High School Diploma | 6 (100.0%) | 154.0 |
| College or Associate's Degree | 0 (0.0%) | 0.0 |
| Bachelor's Degree | 0 (0.0%) | 0.0 |
| Graduate Degree | 0 (0.0%) | 0.0 |
| Total | 6 (100.0%) | 39.0 |
Fertility by Education by Marriage Status in Tulelake
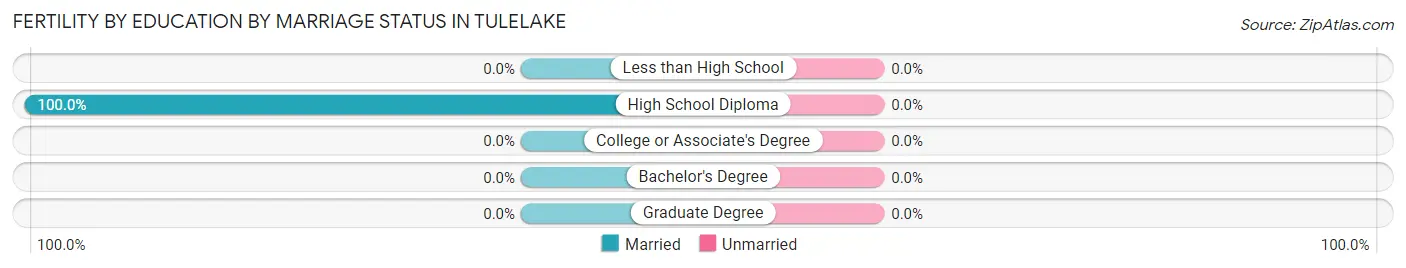
| Educational Attainment | Married | Unmarried |
| Less than High School | 0 (0.0%) | 0 (0.0%) |
| High School Diploma | 6 (100.0%) | 0 (0.0%) |
| College or Associate's Degree | 0 (0.0%) | 0 (0.0%) |
| Bachelor's Degree | 0 (0.0%) | 0 (0.0%) |
| Graduate Degree | 0 (0.0%) | 0 (0.0%) |
| Total | 6 (100.0%) | 0 (0.0%) |
Employment Characteristics in Tulelake
Employment by Class of Employer in Tulelake
Among the 181 employed individuals in Tulelake, private company employees (124 | 68.5%), local government employees (27 | 14.9%), and self-employed (not incorporated) (14 | 7.7%) make up the most common classes of employment.
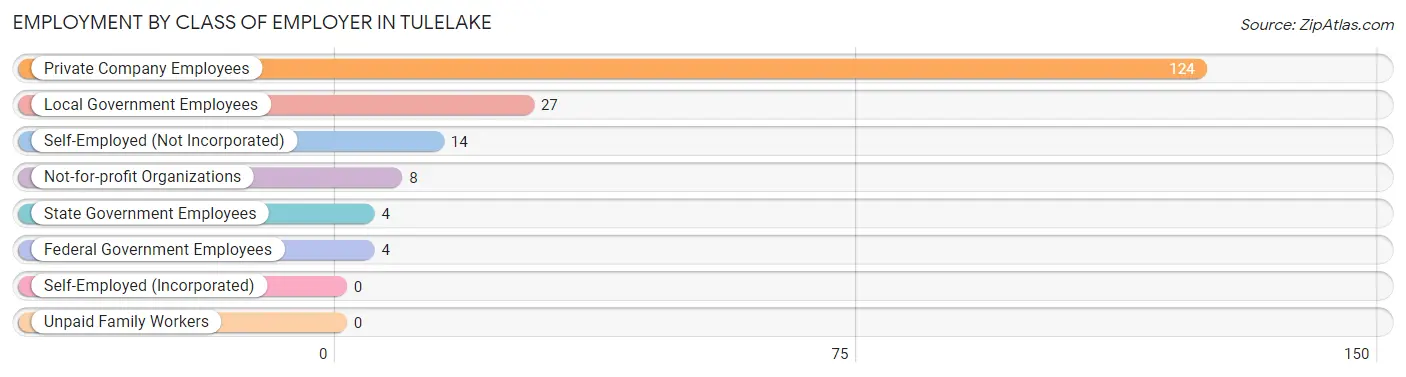
| Employer Class | # Employees | % Employees |
| Private Company Employees | 124 | 68.5% |
| Self-Employed (Incorporated) | 0 | 0.0% |
| Self-Employed (Not Incorporated) | 14 | 7.7% |
| Not-for-profit Organizations | 8 | 4.4% |
| Local Government Employees | 27 | 14.9% |
| State Government Employees | 4 | 2.2% |
| Federal Government Employees | 4 | 2.2% |
| Unpaid Family Workers | 0 | 0.0% |
| Total | 181 | 100.0% |
Employment Status by Age in Tulelake
According to the labor force statistics for Tulelake, out of the total population over 16 years of age (572), 39.5% or 226 individuals are in the labor force, with 11.9% or 27 of them unemployed. The age group with the highest labor force participation rate is 35 to 44 years, with 85.5% or 71 individuals in the labor force. Within the labor force, the 20 to 24 years age range has the highest percentage of unemployed individuals, with 70.0% or 14 of them being unemployed.
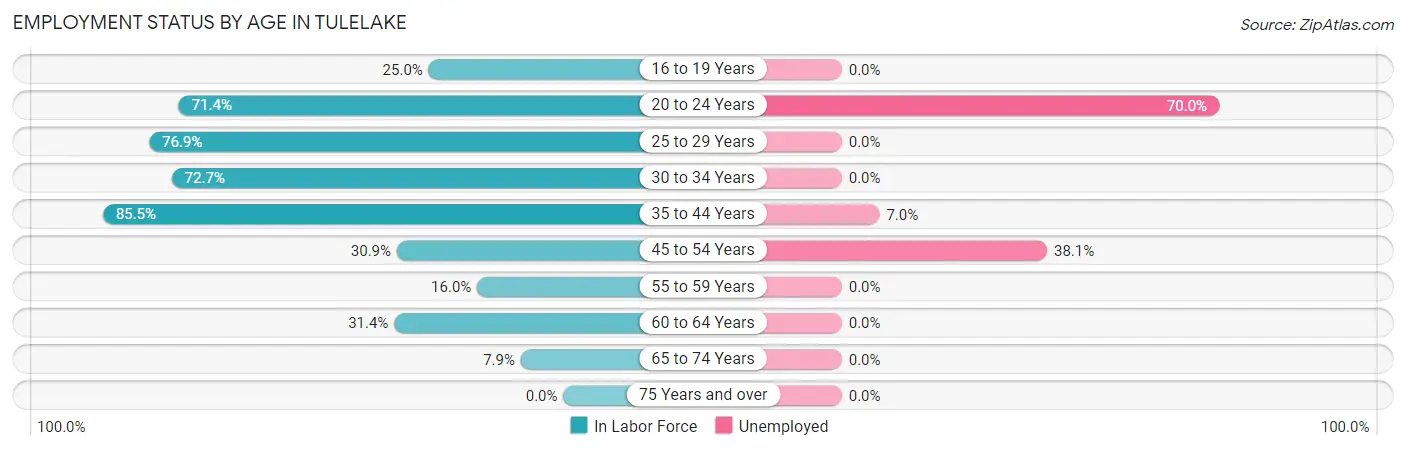
| Age Bracket | In Labor Force | Unemployed |
| 16 to 19 Years | 3 (25.0%) | 0 (0.0%) |
| 20 to 24 Years | 20 (71.4%) | 14 (70.0%) |
| 25 to 29 Years | 40 (76.9%) | 0 (0.0%) |
| 30 to 34 Years | 40 (72.7%) | 0 (0.0%) |
| 35 to 44 Years | 71 (85.5%) | 5 (7.0%) |
| 45 to 54 Years | 21 (30.9%) | 8 (38.1%) |
| 55 to 59 Years | 13 (16.0%) | 0 (0.0%) |
| 60 to 64 Years | 11 (31.4%) | 0 (0.0%) |
| 65 to 74 Years | 7 (7.9%) | 0 (0.0%) |
| 75 Years and over | 0 (0.0%) | 0 (0.0%) |
| Total | 226 (39.5%) | 27 (11.9%) |
Employment Status by Educational Attainment in Tulelake
According to labor force statistics for Tulelake, 52.4% of individuals (196) out of the total population between 25 and 64 years of age (374) are in the labor force, with 6.6% or 13 of them being unemployed. The group with the highest labor force participation rate are those with the educational attainment of bachelor's degree or higher, with 100.0% or 19 individuals in the labor force. Within the labor force, individuals with less than high school education have the highest percentage of unemployment, with 9.8% or 8 of them being unemployed.
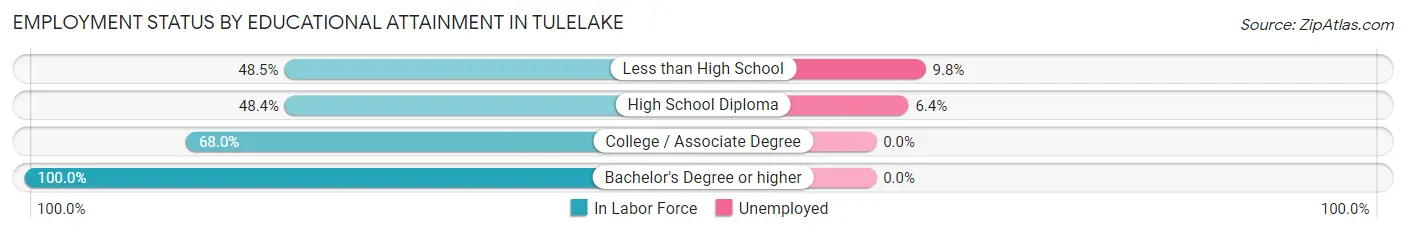
| Educational Attainment | In Labor Force | Unemployed |
| Less than High School | 82 (48.5%) | 17 (9.8%) |
| High School Diploma | 78 (48.4%) | 10 (6.4%) |
| College / Associate Degree | 17 (68.0%) | 0 (0.0%) |
| Bachelor's Degree or higher | 19 (100.0%) | 0 (0.0%) |
| Total | 196 (52.4%) | 25 (6.6%) |
Employment Occupations by Sex in Tulelake
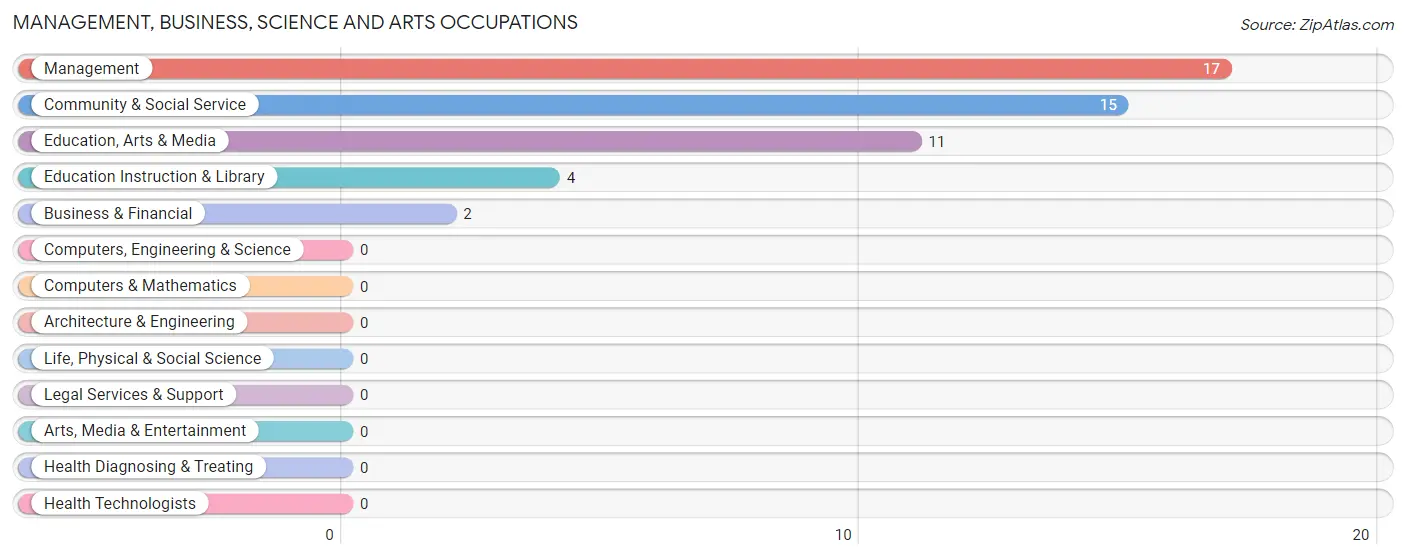
Management, Business, Science and Arts Occupations
The most common Management, Business, Science and Arts occupations in Tulelake are Management (17 | 8.5%), Community & Social Service (15 | 7.5%), Education, Arts & Media (11 | 5.5%), Education Instruction & Library (4 | 2.0%), and Business & Financial (2 | 1.0%).
Management, Business, Science and Arts Occupations by Sex
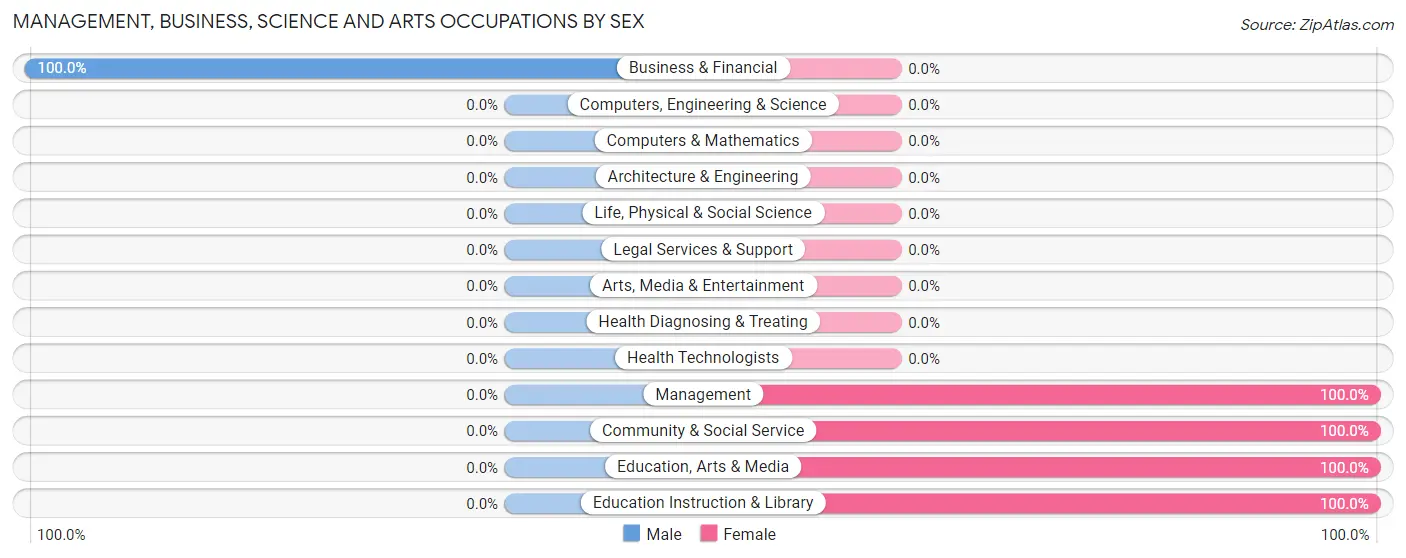
| Occupation | Male | Female |
| Management | 0 (0.0%) | 17 (100.0%) |
| Business & Financial | 2 (100.0%) | 0 (0.0%) |
| Computers, Engineering & Science | 0 (0.0%) | 0 (0.0%) |
| Computers & Mathematics | 0 (0.0%) | 0 (0.0%) |
| Architecture & Engineering | 0 (0.0%) | 0 (0.0%) |
| Life, Physical & Social Science | 0 (0.0%) | 0 (0.0%) |
| Community & Social Service | 0 (0.0%) | 15 (100.0%) |
| Education, Arts & Media | 0 (0.0%) | 11 (100.0%) |
| Legal Services & Support | 0 (0.0%) | 0 (0.0%) |
| Education Instruction & Library | 0 (0.0%) | 4 (100.0%) |
| Arts, Media & Entertainment | 0 (0.0%) | 0 (0.0%) |
| Health Diagnosing & Treating | 0 (0.0%) | 0 (0.0%) |
| Health Technologists | 0 (0.0%) | 0 (0.0%) |
| Total (Category) | 2 (5.9%) | 32 (94.1%) |
| Total (Overall) | 127 (63.8%) | 72 (36.2%) |
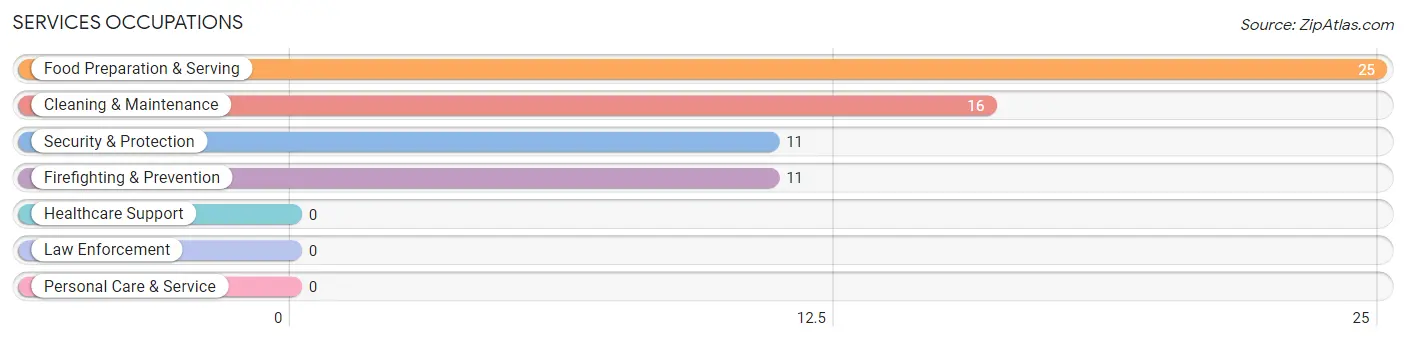
Services Occupations
The most common Services occupations in Tulelake are Food Preparation & Serving (25 | 12.6%), Cleaning & Maintenance (16 | 8.0%), Security & Protection (11 | 5.5%), and Firefighting & Prevention (11 | 5.5%).
Services Occupations by Sex
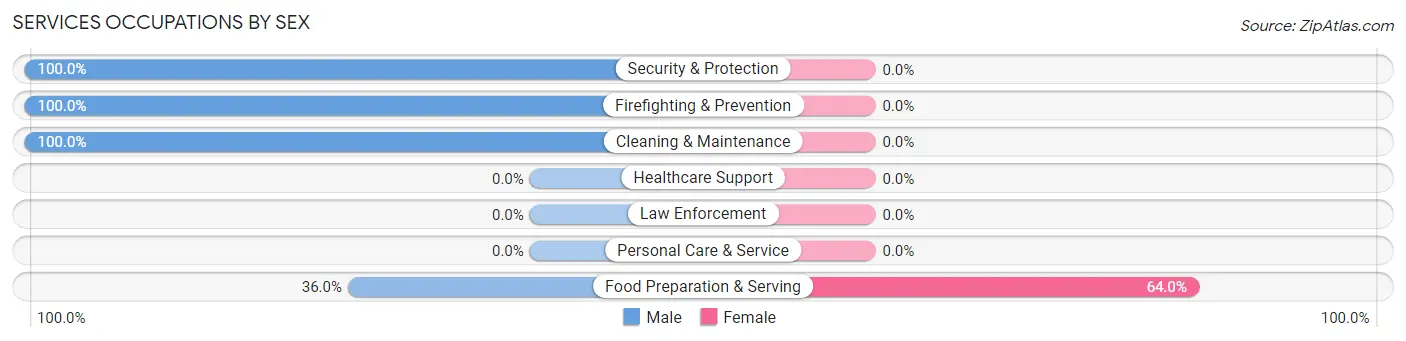
| Occupation | Male | Female |
| Healthcare Support | 0 (0.0%) | 0 (0.0%) |
| Security & Protection | 11 (100.0%) | 0 (0.0%) |
| Firefighting & Prevention | 11 (100.0%) | 0 (0.0%) |
| Law Enforcement | 0 (0.0%) | 0 (0.0%) |
| Food Preparation & Serving | 9 (36.0%) | 16 (64.0%) |
| Cleaning & Maintenance | 16 (100.0%) | 0 (0.0%) |
| Personal Care & Service | 0 (0.0%) | 0 (0.0%) |
| Total (Category) | 36 (69.2%) | 16 (30.8%) |
| Total (Overall) | 127 (63.8%) | 72 (36.2%) |
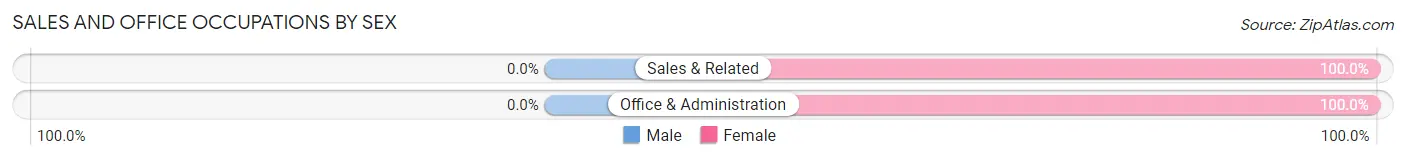
Sales and Office Occupations
The most common Sales and Office occupations in Tulelake are Sales & Related (6 | 3.0%), and Office & Administration (1 | 0.5%).
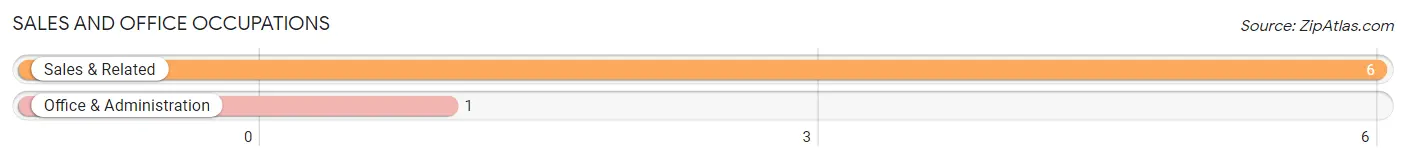
Sales and Office Occupations by Sex
| Occupation | Male | Female |
| Sales & Related | 0 (0.0%) | 6 (100.0%) |
| Office & Administration | 0 (0.0%) | 1 (100.0%) |
| Total (Category) | 0 (0.0%) | 7 (100.0%) |
| Total (Overall) | 127 (63.8%) | 72 (36.2%) |
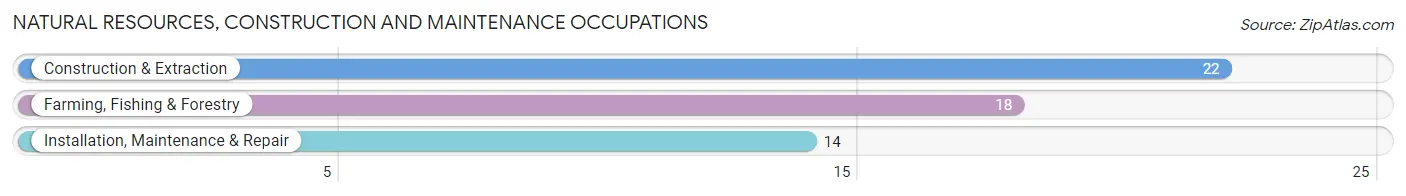
Natural Resources, Construction and Maintenance Occupations
The most common Natural Resources, Construction and Maintenance occupations in Tulelake are Construction & Extraction (22 | 11.1%), Farming, Fishing & Forestry (18 | 9.0%), and Installation, Maintenance & Repair (14 | 7.0%).
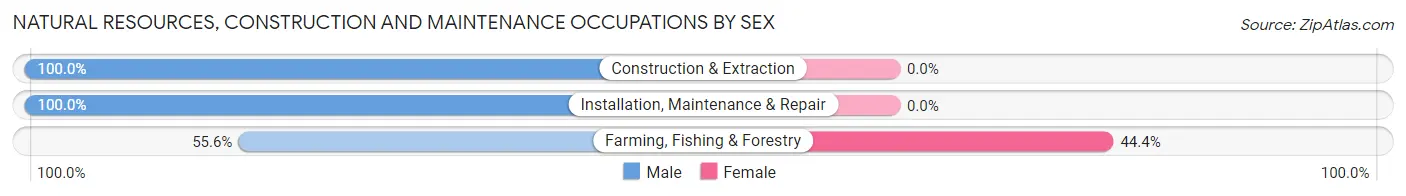
Natural Resources, Construction and Maintenance Occupations by Sex
| Occupation | Male | Female |
| Farming, Fishing & Forestry | 10 (55.6%) | 8 (44.4%) |
| Construction & Extraction | 22 (100.0%) | 0 (0.0%) |
| Installation, Maintenance & Repair | 14 (100.0%) | 0 (0.0%) |
| Total (Category) | 46 (85.2%) | 8 (14.8%) |
| Total (Overall) | 127 (63.8%) | 72 (36.2%) |
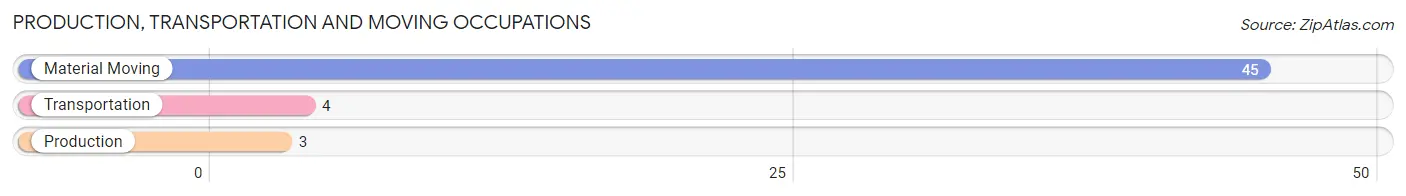
Production, Transportation and Moving Occupations
The most common Production, Transportation and Moving occupations in Tulelake are Material Moving (45 | 22.6%), Transportation (4 | 2.0%), and Production (3 | 1.5%).
Production, Transportation and Moving Occupations by Sex
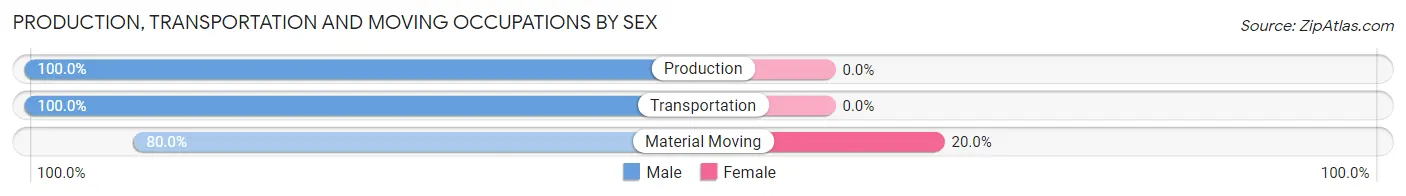
| Occupation | Male | Female |
| Production | 3 (100.0%) | 0 (0.0%) |
| Transportation | 4 (100.0%) | 0 (0.0%) |
| Material Moving | 36 (80.0%) | 9 (20.0%) |
| Total (Category) | 43 (82.7%) | 9 (17.3%) |
| Total (Overall) | 127 (63.8%) | 72 (36.2%) |
Employment Industries by Sex in Tulelake
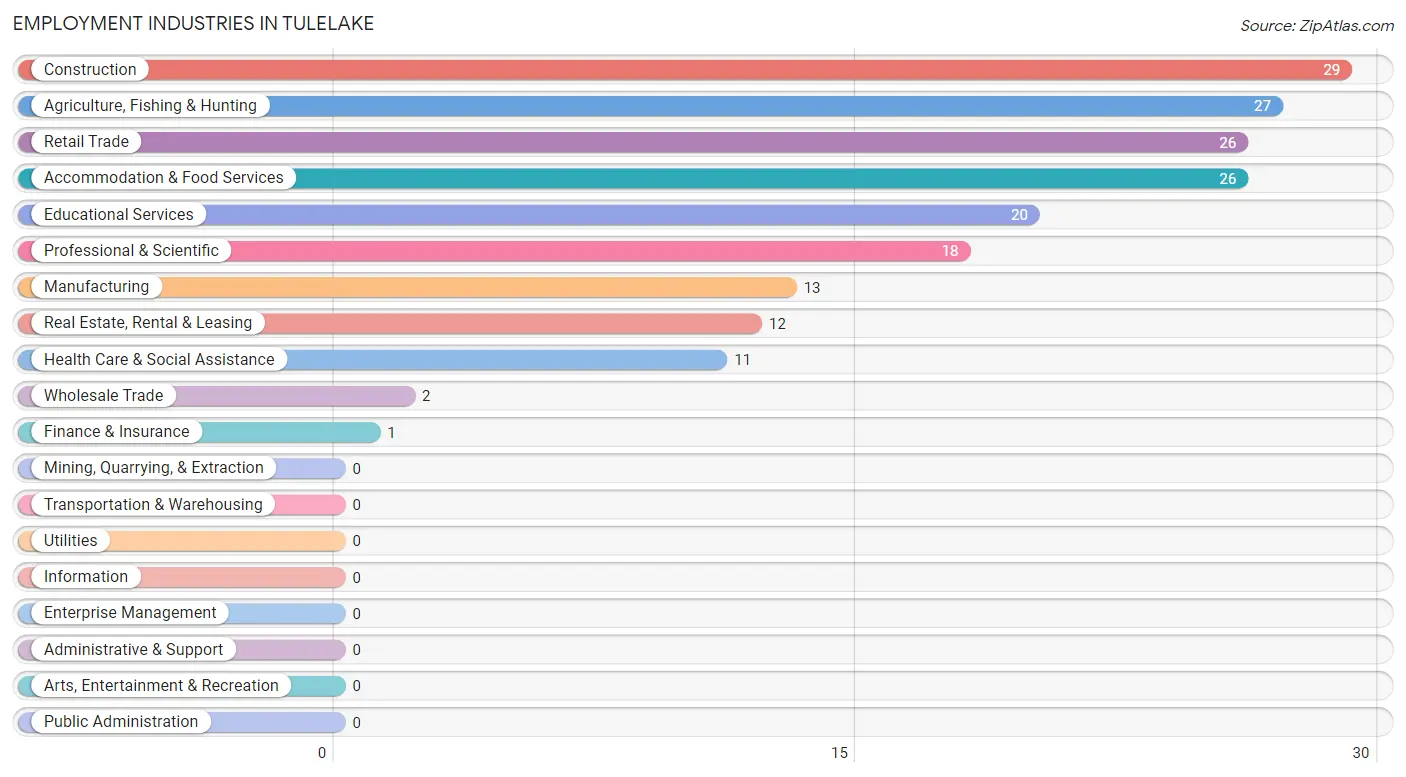
Employment Industries in Tulelake
The major employment industries in Tulelake include Construction (29 | 14.6%), Agriculture, Fishing & Hunting (27 | 13.6%), Retail Trade (26 | 13.1%), Accommodation & Food Services (26 | 13.1%), and Educational Services (20 | 10.1%).
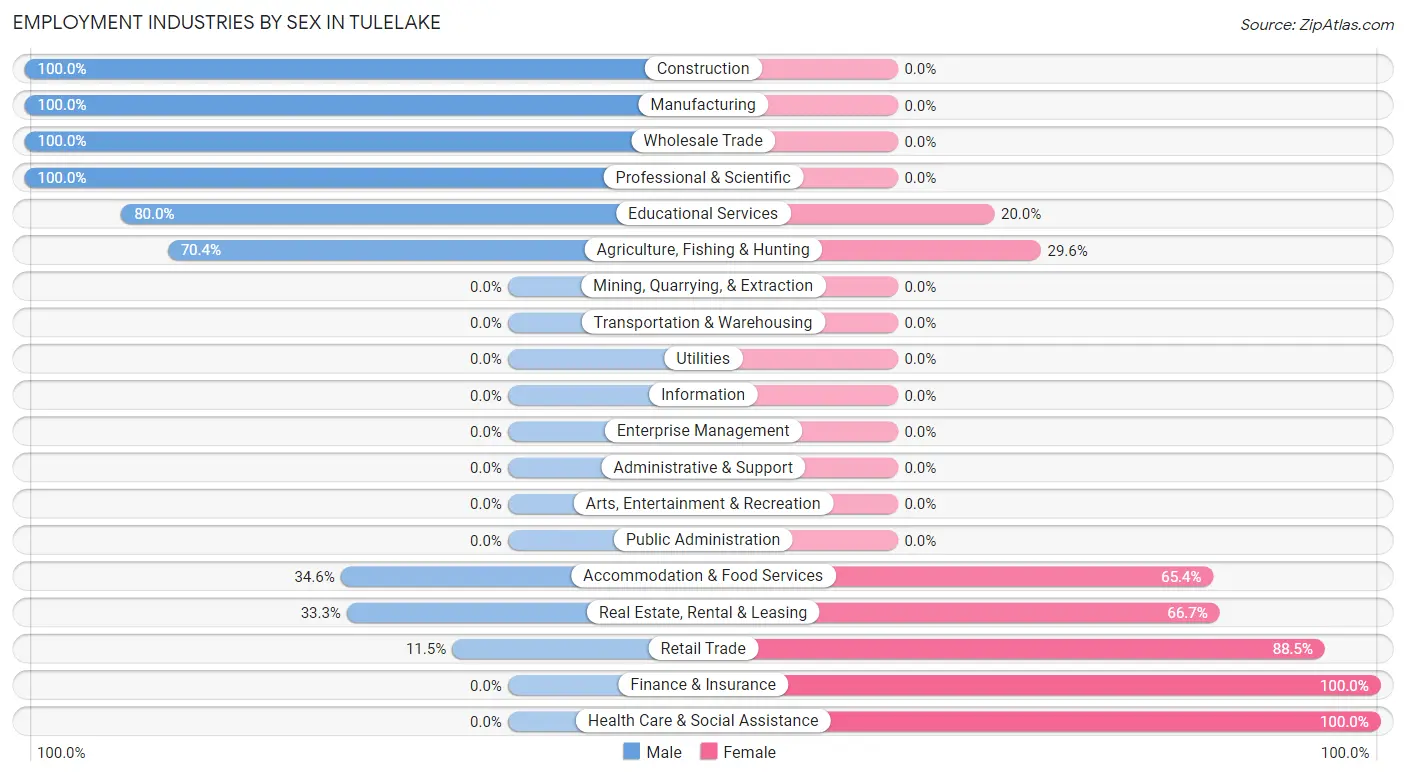
Employment Industries by Sex in Tulelake
The Tulelake industries that see more men than women are Construction (100.0%), Manufacturing (100.0%), and Wholesale Trade (100.0%), whereas the industries that tend to have a higher number of women are Finance & Insurance (100.0%), Health Care & Social Assistance (100.0%), and Retail Trade (88.5%).
| Industry | Male | Female |
| Agriculture, Fishing & Hunting | 19 (70.4%) | 8 (29.6%) |
| Mining, Quarrying, & Extraction | 0 (0.0%) | 0 (0.0%) |
| Construction | 29 (100.0%) | 0 (0.0%) |
| Manufacturing | 13 (100.0%) | 0 (0.0%) |
| Wholesale Trade | 2 (100.0%) | 0 (0.0%) |
| Retail Trade | 3 (11.5%) | 23 (88.5%) |
| Transportation & Warehousing | 0 (0.0%) | 0 (0.0%) |
| Utilities | 0 (0.0%) | 0 (0.0%) |
| Information | 0 (0.0%) | 0 (0.0%) |
| Finance & Insurance | 0 (0.0%) | 1 (100.0%) |
| Real Estate, Rental & Leasing | 4 (33.3%) | 8 (66.7%) |
| Professional & Scientific | 18 (100.0%) | 0 (0.0%) |
| Enterprise Management | 0 (0.0%) | 0 (0.0%) |
| Administrative & Support | 0 (0.0%) | 0 (0.0%) |
| Educational Services | 16 (80.0%) | 4 (20.0%) |
| Health Care & Social Assistance | 0 (0.0%) | 11 (100.0%) |
| Arts, Entertainment & Recreation | 0 (0.0%) | 0 (0.0%) |
| Accommodation & Food Services | 9 (34.6%) | 17 (65.4%) |
| Public Administration | 0 (0.0%) | 0 (0.0%) |
| Total | 127 (63.8%) | 72 (36.2%) |
Education in Tulelake
School Enrollment in Tulelake
The most common levels of schooling among the 147 students in Tulelake are elementary school (53 | 36.0%), high school (39 | 26.5%), and nursery / preschool (26 | 17.7%).
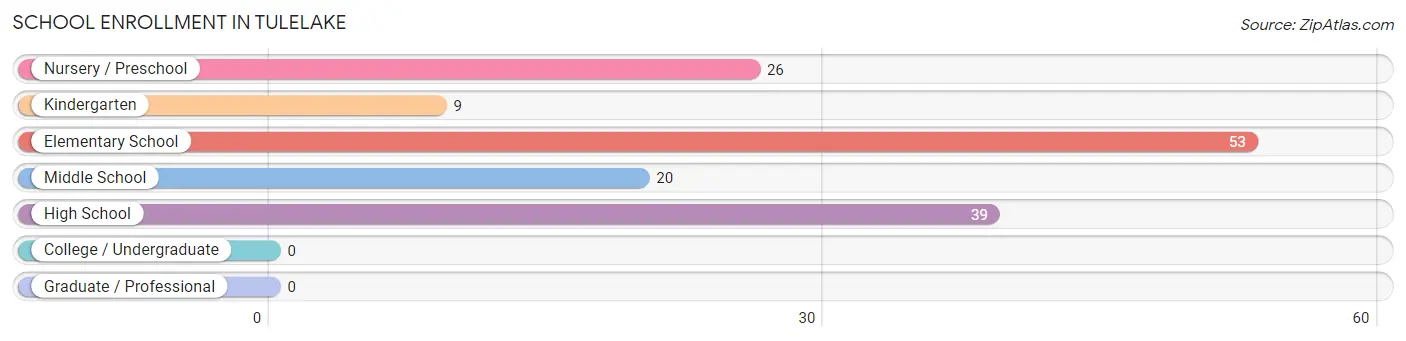
| School Level | # Students | % Students |
| Nursery / Preschool | 26 | 17.7% |
| Kindergarten | 9 | 6.1% |
| Elementary School | 53 | 36.0% |
| Middle School | 20 | 13.6% |
| High School | 39 | 26.5% |
| College / Undergraduate | 0 | 0.0% |
| Graduate / Professional | 0 | 0.0% |
| Total | 147 | 100.0% |
School Enrollment by Age by Funding Source in Tulelake
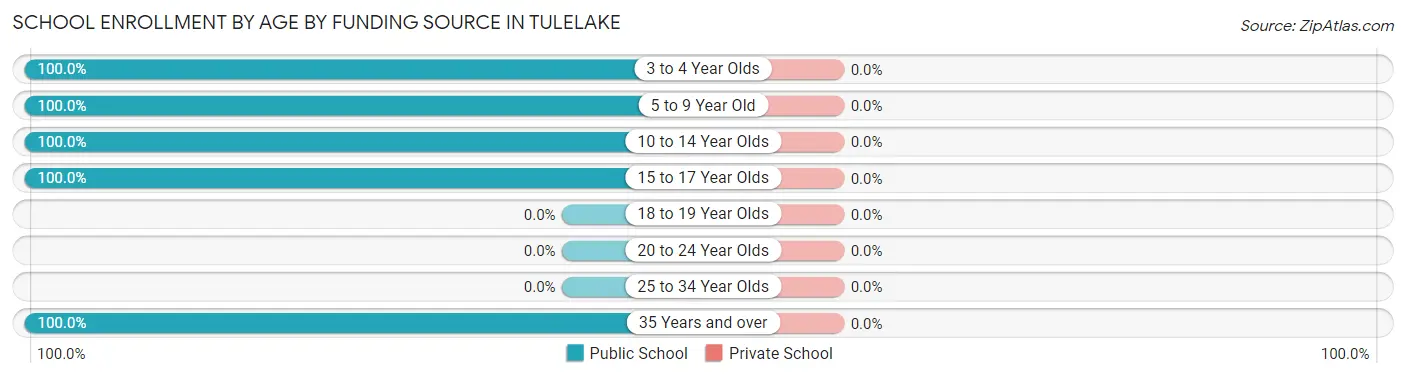
| Age Bracket | Public School | Private School |
| 3 to 4 Year Olds | 16 (100.0%) | 0 (0.0%) |
| 5 to 9 Year Old | 62 (100.0%) | 0 (0.0%) |
| 10 to 14 Year Olds | 30 (100.0%) | 0 (0.0%) |
| 15 to 17 Year Olds | 36 (100.0%) | 0 (0.0%) |
| 18 to 19 Year Olds | 0 (0.0%) | 0 (0.0%) |
| 20 to 24 Year Olds | 0 (0.0%) | 0 (0.0%) |
| 25 to 34 Year Olds | 0 (0.0%) | 0 (0.0%) |
| 35 Years and over | 3 (100.0%) | 0 (0.0%) |
| Total | 147 (100.0%) | 0 (0.0%) |
Educational Attainment by Field of Study in Tulelake
Arts & humanities (15 | 51.7%), business (10 | 34.5%), and education (4 | 13.8%) are the most common fields of study among 29 individuals in Tulelake who have obtained a bachelor's degree or higher.
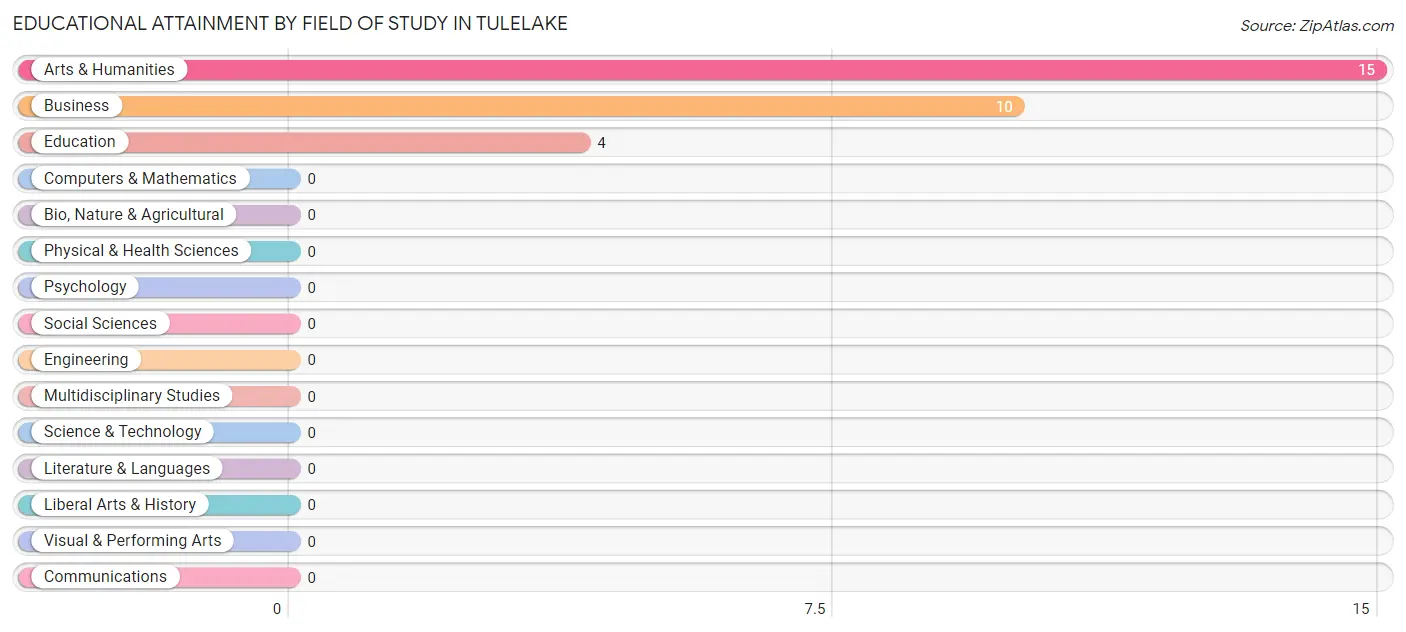
| Field of Study | # Graduates | % Graduates |
| Computers & Mathematics | 0 | 0.0% |
| Bio, Nature & Agricultural | 0 | 0.0% |
| Physical & Health Sciences | 0 | 0.0% |
| Psychology | 0 | 0.0% |
| Social Sciences | 0 | 0.0% |
| Engineering | 0 | 0.0% |
| Multidisciplinary Studies | 0 | 0.0% |
| Science & Technology | 0 | 0.0% |
| Business | 10 | 34.5% |
| Education | 4 | 13.8% |
| Literature & Languages | 0 | 0.0% |
| Liberal Arts & History | 0 | 0.0% |
| Visual & Performing Arts | 0 | 0.0% |
| Communications | 0 | 0.0% |
| Arts & Humanities | 15 | 51.7% |
| Total | 29 | 100.0% |
Transportation & Commute in Tulelake
Vehicle Availability by Sex in Tulelake
The most prevalent vehicle ownership categories in Tulelake are males with 1 vehicle (48, accounting for 41.0%) and females with 1 vehicle (26, making up 75.0%).
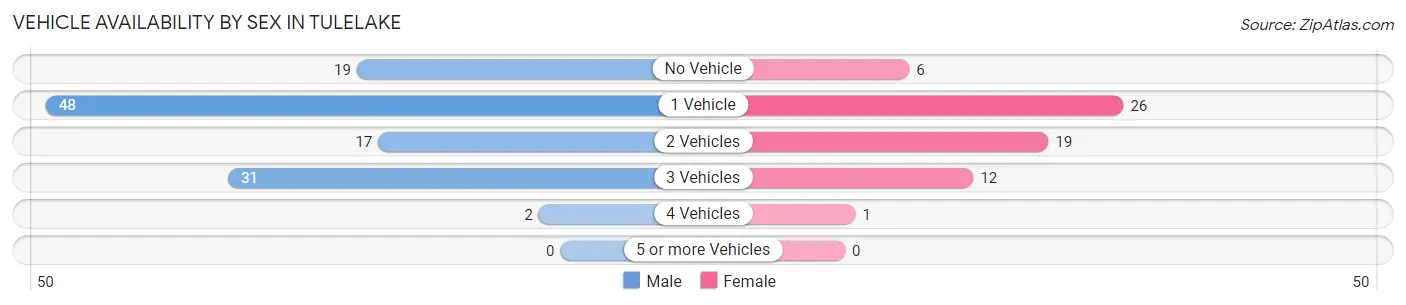
| Vehicles Available | Male | Female |
| No Vehicle | 19 (16.2%) | 6 (9.4%) |
| 1 Vehicle | 48 (41.0%) | 26 (40.6%) |
| 2 Vehicles | 17 (14.5%) | 19 (29.7%) |
| 3 Vehicles | 31 (26.5%) | 12 (18.8%) |
| 4 Vehicles | 2 (1.7%) | 1 (1.6%) |
| 5 or more Vehicles | 0 (0.0%) | 0 (0.0%) |
| Total | 117 (100.0%) | 64 (100.0%) |
Commute Time in Tulelake
The most frequently occuring commute durations in Tulelake are 10 to 14 minutes (65 commuters, 35.9%), 60 to 89 minutes (29 commuters, 16.0%), and 20 to 24 minutes (28 commuters, 15.5%).
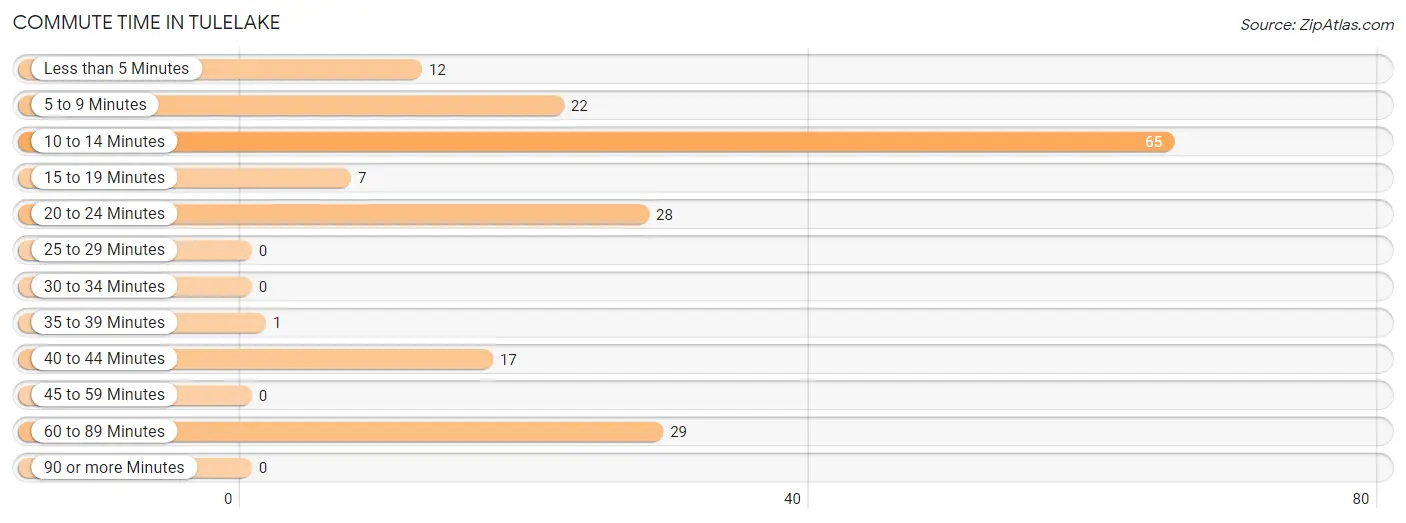
| Commute Time | # Commuters | % Commuters |
| Less than 5 Minutes | 12 | 6.6% |
| 5 to 9 Minutes | 22 | 12.1% |
| 10 to 14 Minutes | 65 | 35.9% |
| 15 to 19 Minutes | 7 | 3.9% |
| 20 to 24 Minutes | 28 | 15.5% |
| 25 to 29 Minutes | 0 | 0.0% |
| 30 to 34 Minutes | 0 | 0.0% |
| 35 to 39 Minutes | 1 | 0.5% |
| 40 to 44 Minutes | 17 | 9.4% |
| 45 to 59 Minutes | 0 | 0.0% |
| 60 to 89 Minutes | 29 | 16.0% |
| 90 or more Minutes | 0 | 0.0% |
Commute Time by Sex in Tulelake
The most common commute times in Tulelake are 10 to 14 minutes (31 commuters, 26.5%) for males and 10 to 14 minutes (34 commuters, 53.1%) for females.
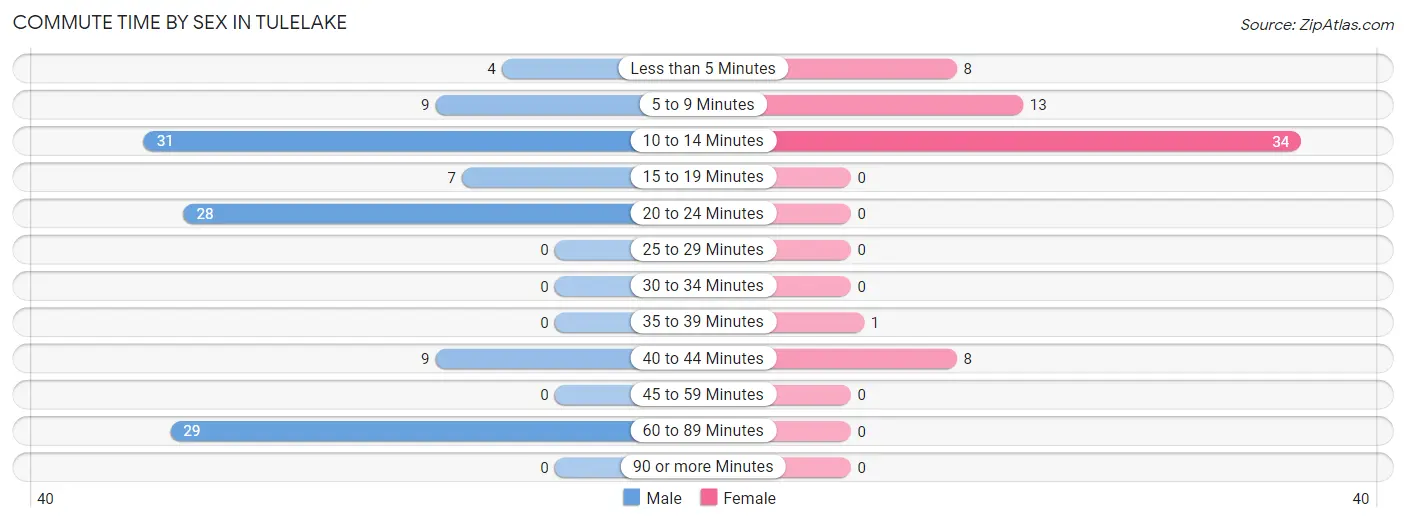
| Commute Time | Male | Female |
| Less than 5 Minutes | 4 (3.4%) | 8 (12.5%) |
| 5 to 9 Minutes | 9 (7.7%) | 13 (20.3%) |
| 10 to 14 Minutes | 31 (26.5%) | 34 (53.1%) |
| 15 to 19 Minutes | 7 (6.0%) | 0 (0.0%) |
| 20 to 24 Minutes | 28 (23.9%) | 0 (0.0%) |
| 25 to 29 Minutes | 0 (0.0%) | 0 (0.0%) |
| 30 to 34 Minutes | 0 (0.0%) | 0 (0.0%) |
| 35 to 39 Minutes | 0 (0.0%) | 1 (1.6%) |
| 40 to 44 Minutes | 9 (7.7%) | 8 (12.5%) |
| 45 to 59 Minutes | 0 (0.0%) | 0 (0.0%) |
| 60 to 89 Minutes | 29 (24.8%) | 0 (0.0%) |
| 90 or more Minutes | 0 (0.0%) | 0 (0.0%) |
Time of Departure to Work by Sex in Tulelake
The most frequent times of departure to work in Tulelake are 7:00 AM to 7:29 AM (36, 30.8%) for males and 7:30 AM to 7:59 AM (21, 32.8%) for females.
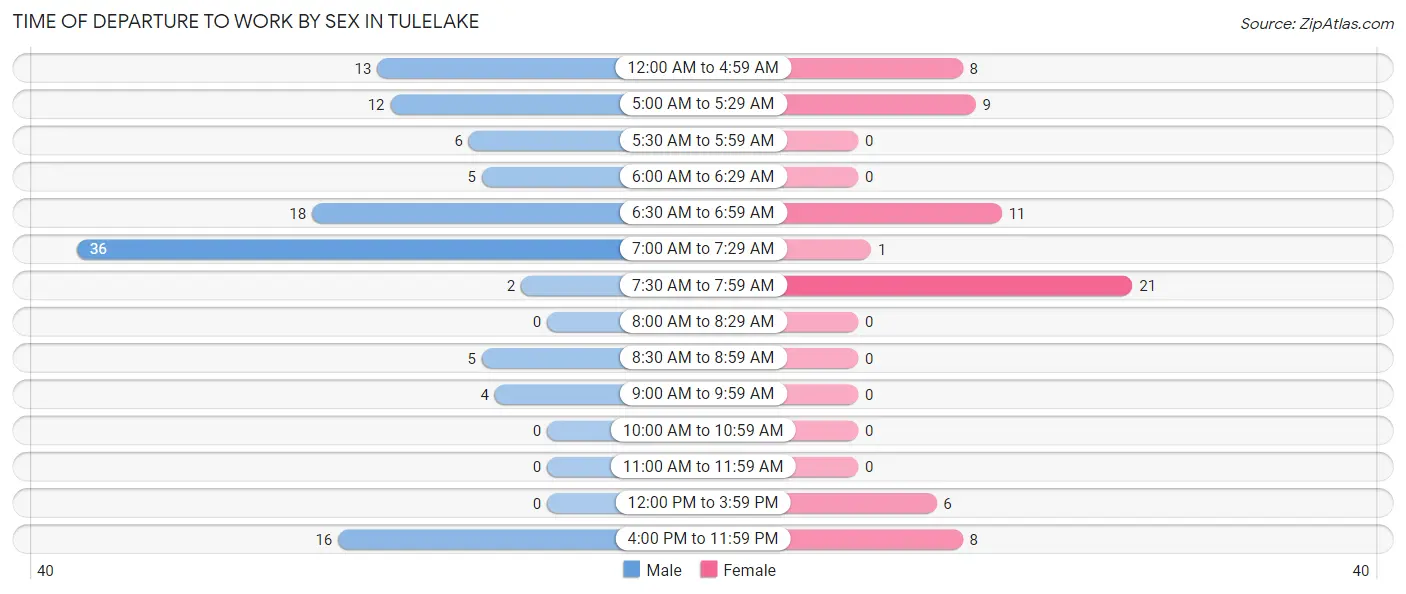
| Time of Departure | Male | Female |
| 12:00 AM to 4:59 AM | 13 (11.1%) | 8 (12.5%) |
| 5:00 AM to 5:29 AM | 12 (10.3%) | 9 (14.1%) |
| 5:30 AM to 5:59 AM | 6 (5.1%) | 0 (0.0%) |
| 6:00 AM to 6:29 AM | 5 (4.3%) | 0 (0.0%) |
| 6:30 AM to 6:59 AM | 18 (15.4%) | 11 (17.2%) |
| 7:00 AM to 7:29 AM | 36 (30.8%) | 1 (1.6%) |
| 7:30 AM to 7:59 AM | 2 (1.7%) | 21 (32.8%) |
| 8:00 AM to 8:29 AM | 0 (0.0%) | 0 (0.0%) |
| 8:30 AM to 8:59 AM | 5 (4.3%) | 0 (0.0%) |
| 9:00 AM to 9:59 AM | 4 (3.4%) | 0 (0.0%) |
| 10:00 AM to 10:59 AM | 0 (0.0%) | 0 (0.0%) |
| 11:00 AM to 11:59 AM | 0 (0.0%) | 0 (0.0%) |
| 12:00 PM to 3:59 PM | 0 (0.0%) | 6 (9.4%) |
| 4:00 PM to 11:59 PM | 16 (13.7%) | 8 (12.5%) |
| Total | 117 (100.0%) | 64 (100.0%) |
Housing Occupancy in Tulelake
Occupancy by Ownership in Tulelake
Of the total 240 dwellings in Tulelake, owner-occupied units account for 151 (62.9%), while renter-occupied units make up 89 (37.1%).
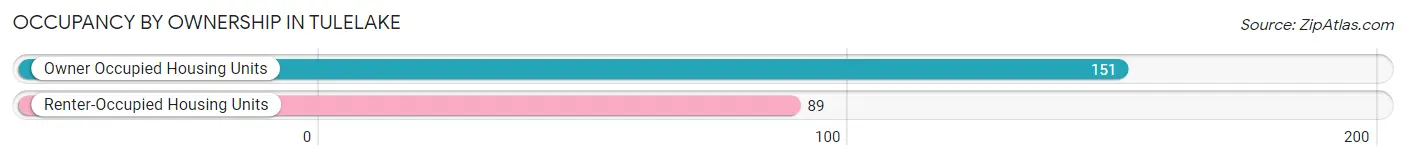
| Occupancy | # Housing Units | % Housing Units |
| Owner Occupied Housing Units | 151 | 62.9% |
| Renter-Occupied Housing Units | 89 | 37.1% |
| Total Occupied Housing Units | 240 | 100.0% |
Occupancy by Household Size in Tulelake
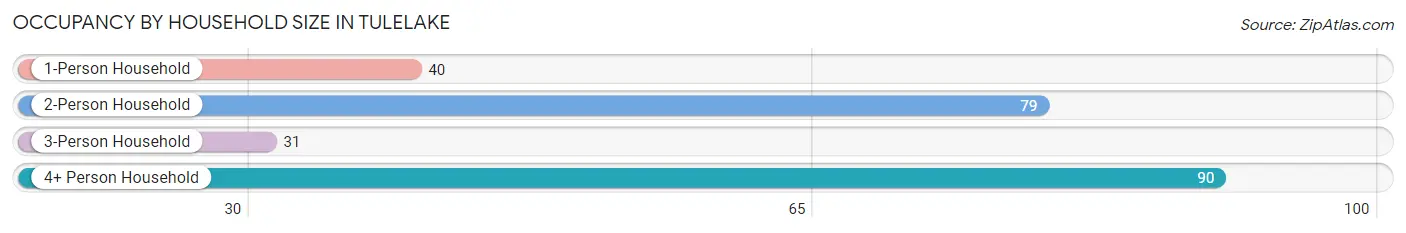
| Household Size | # Housing Units | % Housing Units |
| 1-Person Household | 40 | 16.7% |
| 2-Person Household | 79 | 32.9% |
| 3-Person Household | 31 | 12.9% |
| 4+ Person Household | 90 | 37.5% |
| Total Housing Units | 240 | 100.0% |
Occupancy by Ownership by Household Size in Tulelake
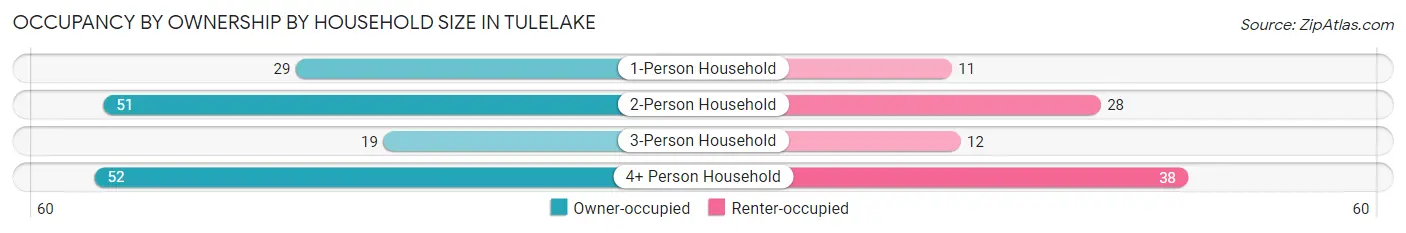
| Household Size | Owner-occupied | Renter-occupied |
| 1-Person Household | 29 (72.5%) | 11 (27.5%) |
| 2-Person Household | 51 (64.6%) | 28 (35.4%) |
| 3-Person Household | 19 (61.3%) | 12 (38.7%) |
| 4+ Person Household | 52 (57.8%) | 38 (42.2%) |
| Total Housing Units | 151 (62.9%) | 89 (37.1%) |
Occupancy by Educational Attainment in Tulelake
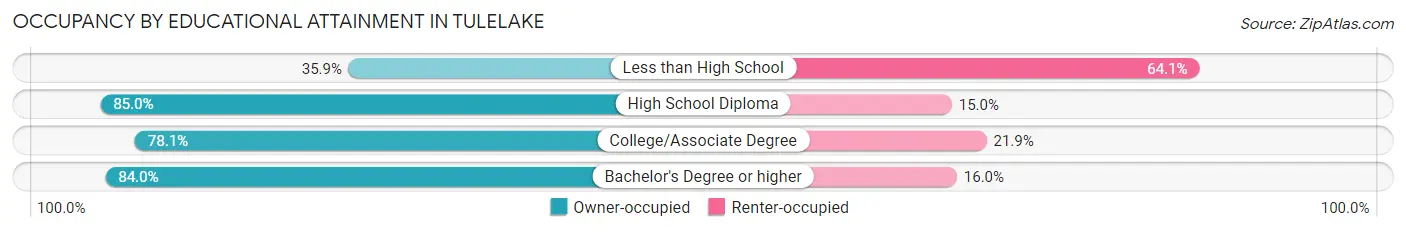
| Household Size | Owner-occupied | Renter-occupied |
| Less than High School | 37 (35.9%) | 66 (64.1%) |
| High School Diploma | 68 (85.0%) | 12 (15.0%) |
| College/Associate Degree | 25 (78.1%) | 7 (21.9%) |
| Bachelor's Degree or higher | 21 (84.0%) | 4 (16.0%) |
Occupancy by Age of Householder in Tulelake
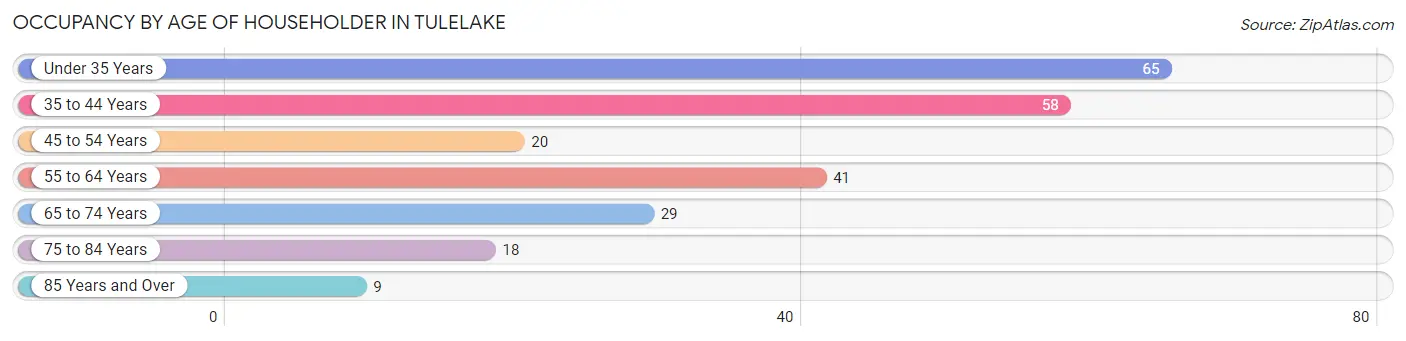
| Age Bracket | # Households | % Households |
| Under 35 Years | 65 | 27.1% |
| 35 to 44 Years | 58 | 24.2% |
| 45 to 54 Years | 20 | 8.3% |
| 55 to 64 Years | 41 | 17.1% |
| 65 to 74 Years | 29 | 12.1% |
| 75 to 84 Years | 18 | 7.5% |
| 85 Years and Over | 9 | 3.7% |
| Total | 240 | 100.0% |
Housing Finances in Tulelake
Median Income by Occupancy in Tulelake
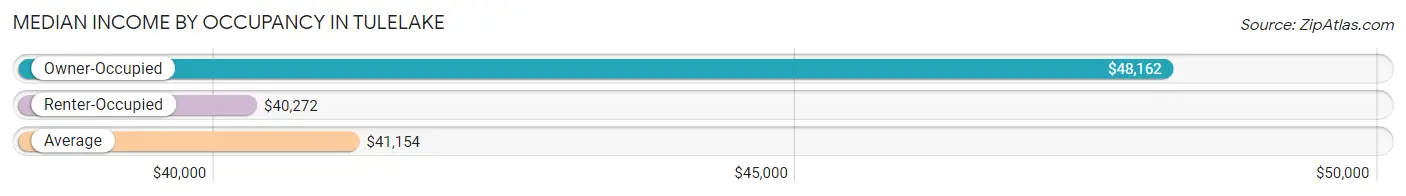
| Occupancy Type | # Households | Median Income |
| Owner-Occupied | 151 (62.9%) | $48,162 |
| Renter-Occupied | 89 (37.1%) | $40,272 |
| Average | 240 (100.0%) | $41,154 |
Occupancy by Householder Income Bracket in Tulelake
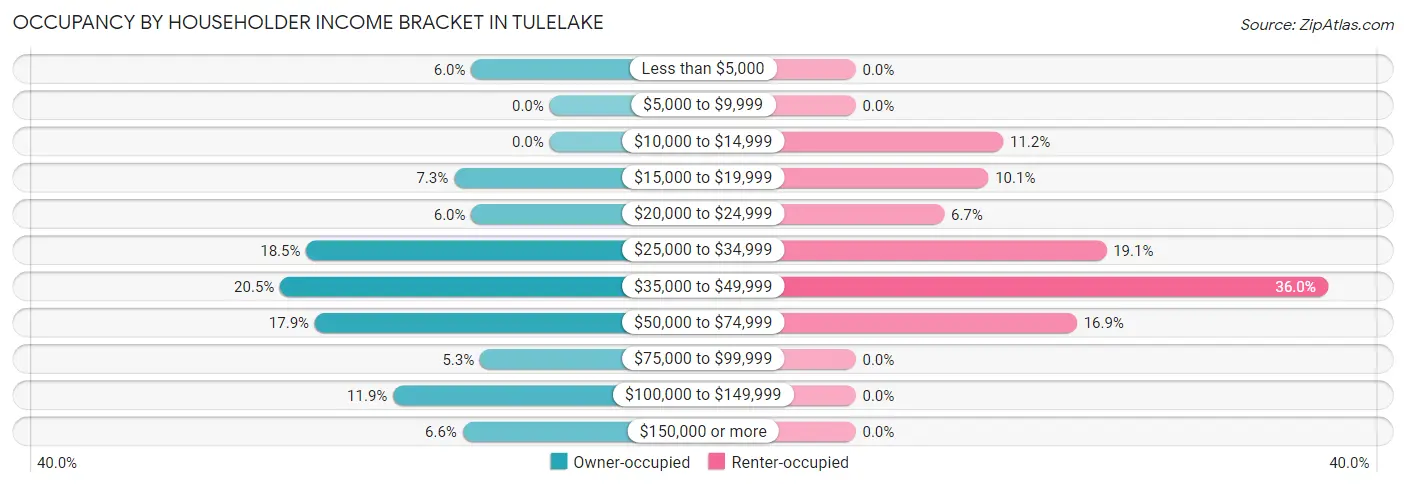
| Income Bracket | Owner-occupied | Renter-occupied |
| Less than $5,000 | 9 (6.0%) | 0 (0.0%) |
| $5,000 to $9,999 | 0 (0.0%) | 0 (0.0%) |
| $10,000 to $14,999 | 0 (0.0%) | 10 (11.2%) |
| $15,000 to $19,999 | 11 (7.3%) | 9 (10.1%) |
| $20,000 to $24,999 | 9 (6.0%) | 6 (6.7%) |
| $25,000 to $34,999 | 28 (18.5%) | 17 (19.1%) |
| $35,000 to $49,999 | 31 (20.5%) | 32 (36.0%) |
| $50,000 to $74,999 | 27 (17.9%) | 15 (16.9%) |
| $75,000 to $99,999 | 8 (5.3%) | 0 (0.0%) |
| $100,000 to $149,999 | 18 (11.9%) | 0 (0.0%) |
| $150,000 or more | 10 (6.6%) | 0 (0.0%) |
| Total | 151 (100.0%) | 89 (100.0%) |
Monthly Housing Cost Tiers in Tulelake
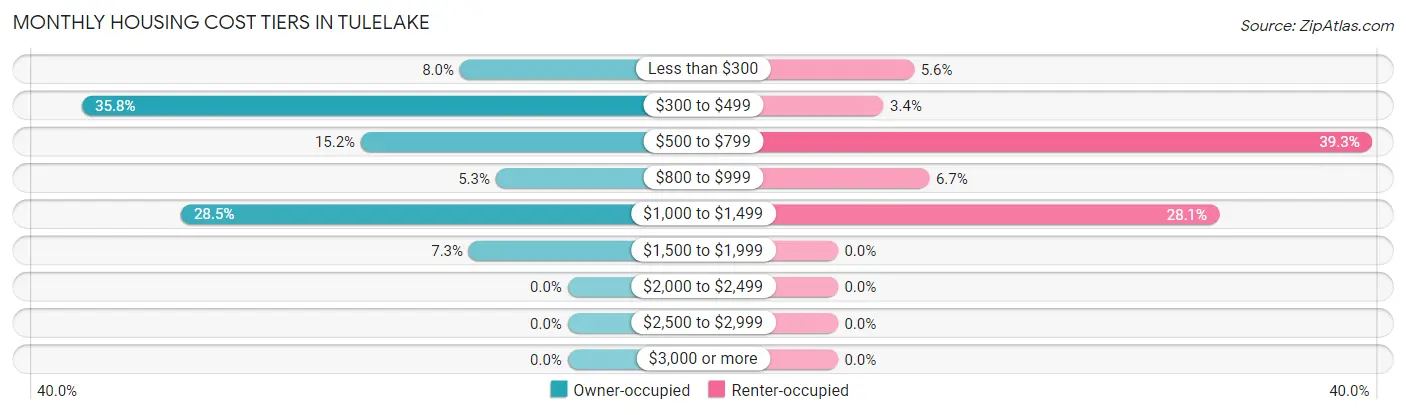
| Monthly Cost | Owner-occupied | Renter-occupied |
| Less than $300 | 12 (8.0%) | 5 (5.6%) |
| $300 to $499 | 54 (35.8%) | 3 (3.4%) |
| $500 to $799 | 23 (15.2%) | 35 (39.3%) |
| $800 to $999 | 8 (5.3%) | 6 (6.7%) |
| $1,000 to $1,499 | 43 (28.5%) | 25 (28.1%) |
| $1,500 to $1,999 | 11 (7.3%) | 0 (0.0%) |
| $2,000 to $2,499 | 0 (0.0%) | 0 (0.0%) |
| $2,500 to $2,999 | 0 (0.0%) | 0 (0.0%) |
| $3,000 or more | 0 (0.0%) | 0 (0.0%) |
| Total | 151 (100.0%) | 89 (100.0%) |
Physical Housing Characteristics in Tulelake
Housing Structures in Tulelake
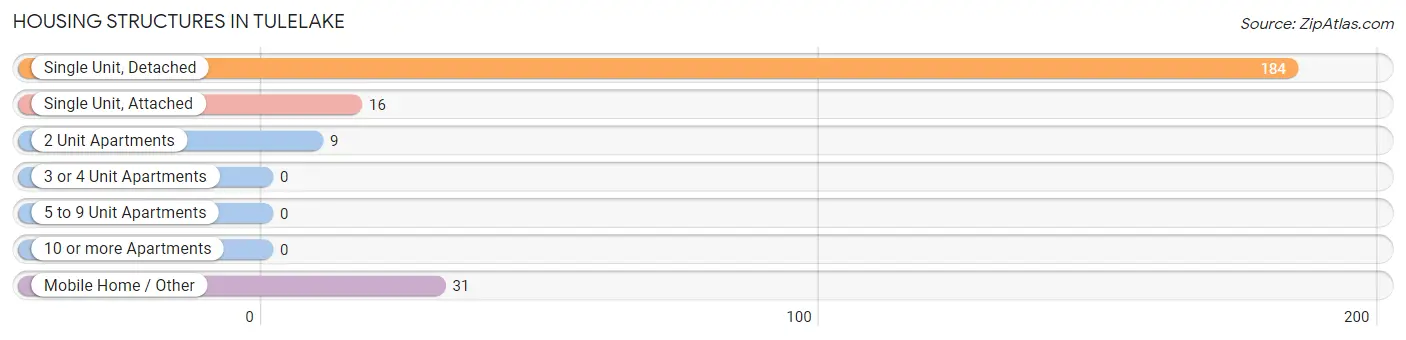
| Structure Type | # Housing Units | % Housing Units |
| Single Unit, Detached | 184 | 76.7% |
| Single Unit, Attached | 16 | 6.7% |
| 2 Unit Apartments | 9 | 3.7% |
| 3 or 4 Unit Apartments | 0 | 0.0% |
| 5 to 9 Unit Apartments | 0 | 0.0% |
| 10 or more Apartments | 0 | 0.0% |
| Mobile Home / Other | 31 | 12.9% |
| Total | 240 | 100.0% |
Housing Structures by Occupancy in Tulelake
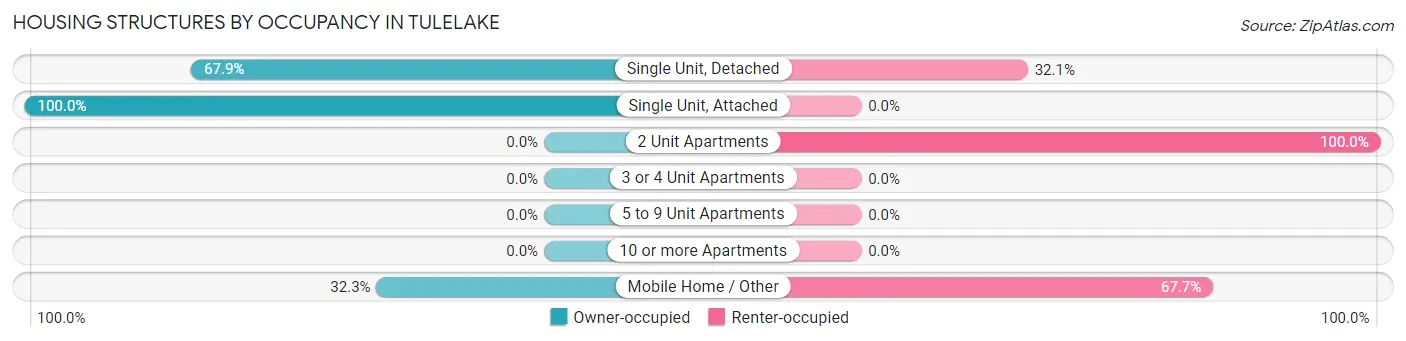
| Structure Type | Owner-occupied | Renter-occupied |
| Single Unit, Detached | 125 (67.9%) | 59 (32.1%) |
| Single Unit, Attached | 16 (100.0%) | 0 (0.0%) |
| 2 Unit Apartments | 0 (0.0%) | 9 (100.0%) |
| 3 or 4 Unit Apartments | 0 (0.0%) | 0 (0.0%) |
| 5 to 9 Unit Apartments | 0 (0.0%) | 0 (0.0%) |
| 10 or more Apartments | 0 (0.0%) | 0 (0.0%) |
| Mobile Home / Other | 10 (32.3%) | 21 (67.7%) |
| Total | 151 (62.9%) | 89 (37.1%) |
Housing Structures by Number of Rooms in Tulelake
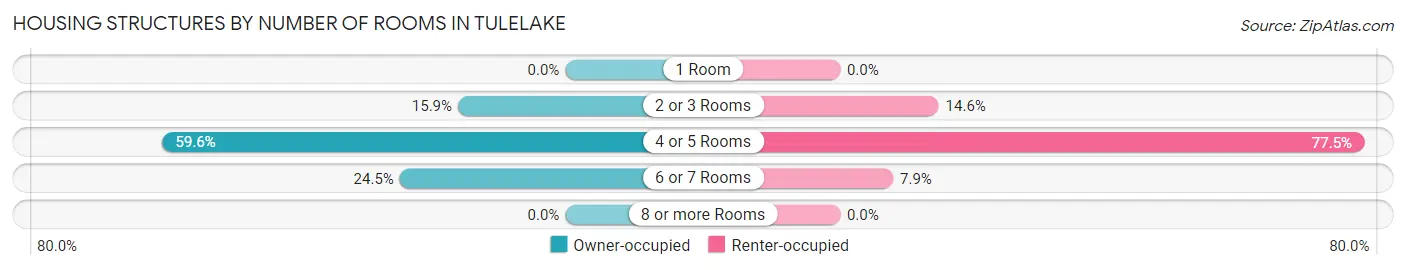
| Number of Rooms | Owner-occupied | Renter-occupied |
| 1 Room | 0 (0.0%) | 0 (0.0%) |
| 2 or 3 Rooms | 24 (15.9%) | 13 (14.6%) |
| 4 or 5 Rooms | 90 (59.6%) | 69 (77.5%) |
| 6 or 7 Rooms | 37 (24.5%) | 7 (7.9%) |
| 8 or more Rooms | 0 (0.0%) | 0 (0.0%) |
| Total | 151 (100.0%) | 89 (100.0%) |
Housing Structure by Heating Type in Tulelake
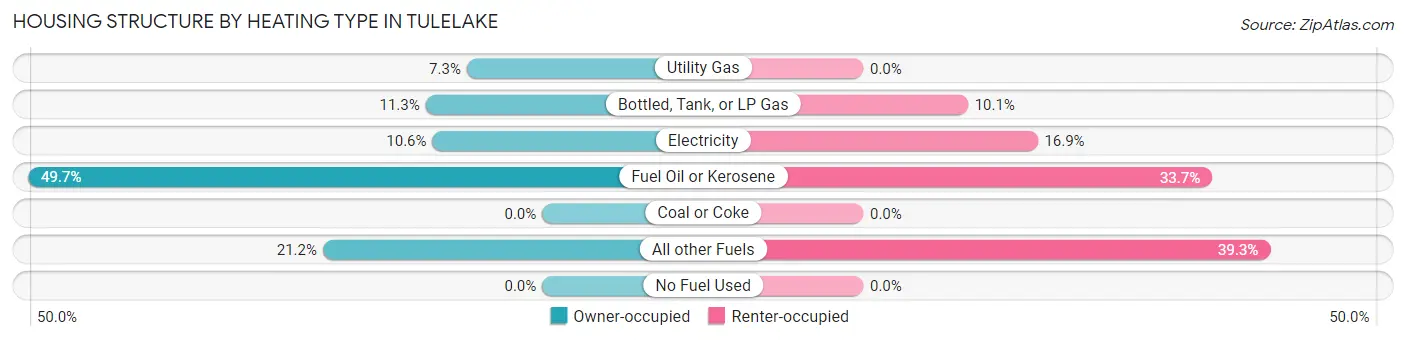
| Heating Type | Owner-occupied | Renter-occupied |
| Utility Gas | 11 (7.3%) | 0 (0.0%) |
| Bottled, Tank, or LP Gas | 17 (11.3%) | 9 (10.1%) |
| Electricity | 16 (10.6%) | 15 (16.9%) |
| Fuel Oil or Kerosene | 75 (49.7%) | 30 (33.7%) |
| Coal or Coke | 0 (0.0%) | 0 (0.0%) |
| All other Fuels | 32 (21.2%) | 35 (39.3%) |
| No Fuel Used | 0 (0.0%) | 0 (0.0%) |
| Total | 151 (100.0%) | 89 (100.0%) |
Household Vehicle Usage in Tulelake
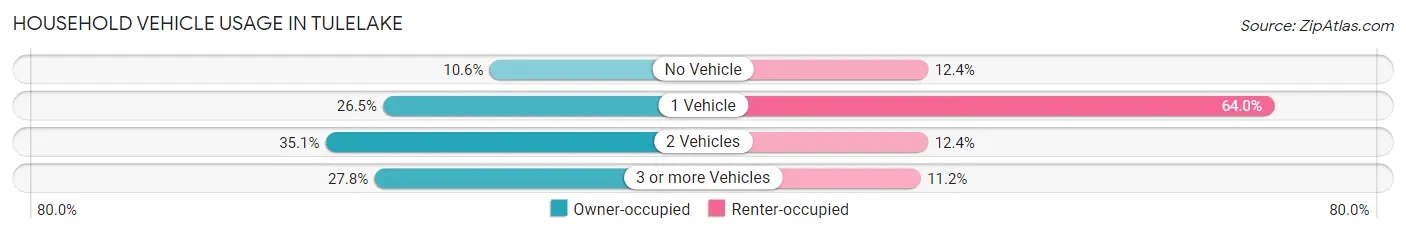
| Vehicles per Household | Owner-occupied | Renter-occupied |
| No Vehicle | 16 (10.6%) | 11 (12.4%) |
| 1 Vehicle | 40 (26.5%) | 57 (64.0%) |
| 2 Vehicles | 53 (35.1%) | 11 (12.4%) |
| 3 or more Vehicles | 42 (27.8%) | 10 (11.2%) |
| Total | 151 (100.0%) | 89 (100.0%) |
Real Estate & Mortgages in Tulelake
Real Estate and Mortgage Overview in Tulelake
| Characteristic | Without Mortgage | With Mortgage |
| Housing Units | 83 | 68 |
| Median Property Value | $125,400 | $150,000 |
| Median Household Income | $29,740 | $0 |
| Monthly Housing Costs | $398 | $0 |
| Real Estate Taxes | $557 | $0 |
Property Value by Mortgage Status in Tulelake
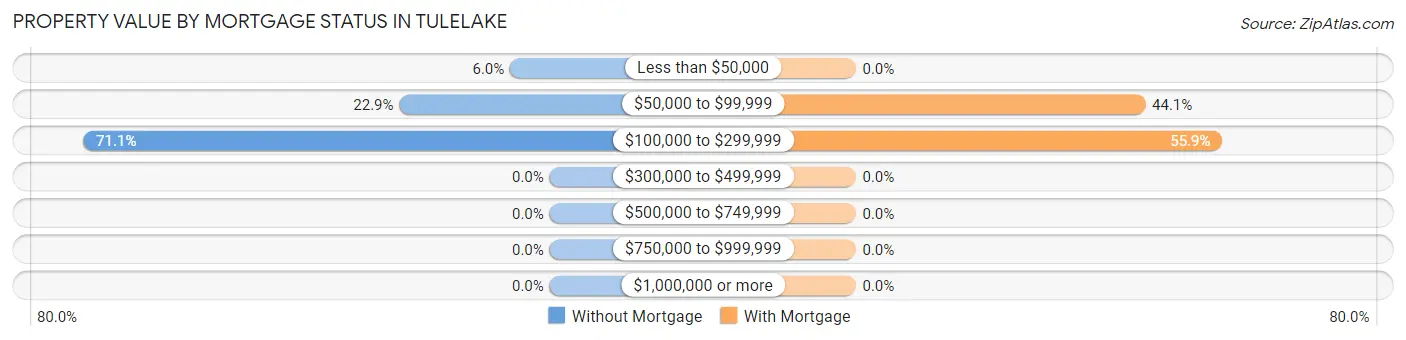
| Property Value | Without Mortgage | With Mortgage |
| Less than $50,000 | 5 (6.0%) | 0 (0.0%) |
| $50,000 to $99,999 | 19 (22.9%) | 30 (44.1%) |
| $100,000 to $299,999 | 59 (71.1%) | 38 (55.9%) |
| $300,000 to $499,999 | 0 (0.0%) | 0 (0.0%) |
| $500,000 to $749,999 | 0 (0.0%) | 0 (0.0%) |
| $750,000 to $999,999 | 0 (0.0%) | 0 (0.0%) |
| $1,000,000 or more | 0 (0.0%) | 0 (0.0%) |
| Total | 83 (100.0%) | 68 (100.0%) |
Household Income by Mortgage Status in Tulelake
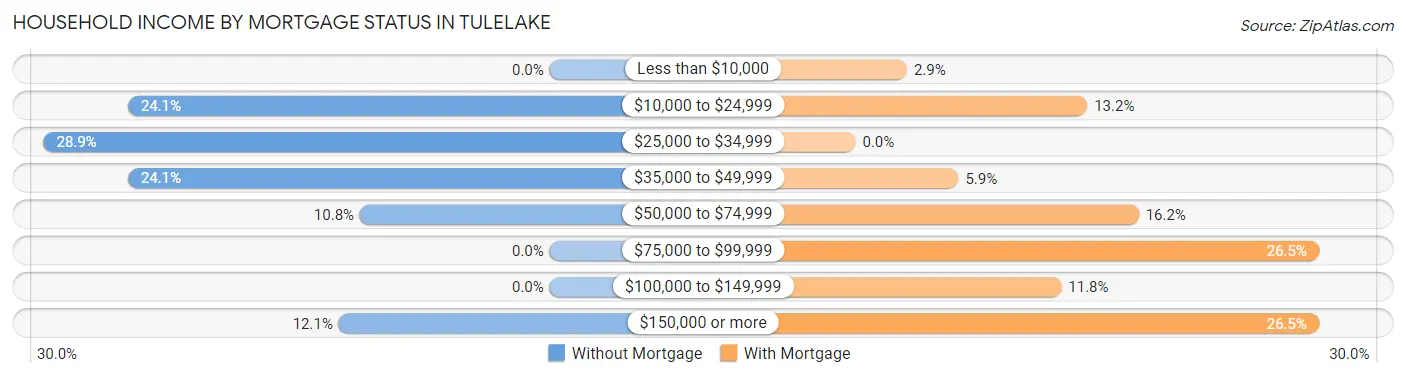
| Household Income | Without Mortgage | With Mortgage |
| Less than $10,000 | 0 (0.0%) | 2 (2.9%) |
| $10,000 to $24,999 | 20 (24.1%) | 9 (13.2%) |
| $25,000 to $34,999 | 24 (28.9%) | 0 (0.0%) |
| $35,000 to $49,999 | 20 (24.1%) | 4 (5.9%) |
| $50,000 to $74,999 | 9 (10.8%) | 11 (16.2%) |
| $75,000 to $99,999 | 0 (0.0%) | 18 (26.5%) |
| $100,000 to $149,999 | 0 (0.0%) | 8 (11.8%) |
| $150,000 or more | 10 (12.0%) | 18 (26.5%) |
| Total | 83 (100.0%) | 68 (100.0%) |
Property Value to Household Income Ratio in Tulelake
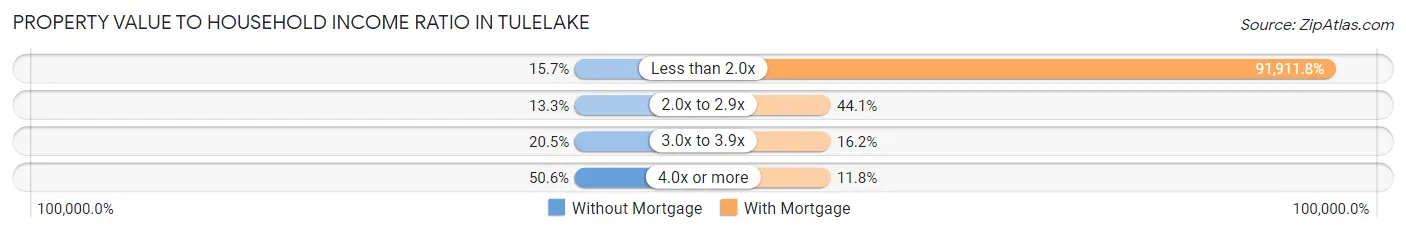
| Value-to-Income Ratio | Without Mortgage | With Mortgage |
| Less than 2.0x | 13 (15.7%) | 62,500 (91,911.8%) |
| 2.0x to 2.9x | 11 (13.3%) | 30 (44.1%) |
| 3.0x to 3.9x | 17 (20.5%) | 11 (16.2%) |
| 4.0x or more | 42 (50.6%) | 8 (11.8%) |
| Total | 83 (100.0%) | 68 (100.0%) |
Real Estate Taxes by Mortgage Status in Tulelake
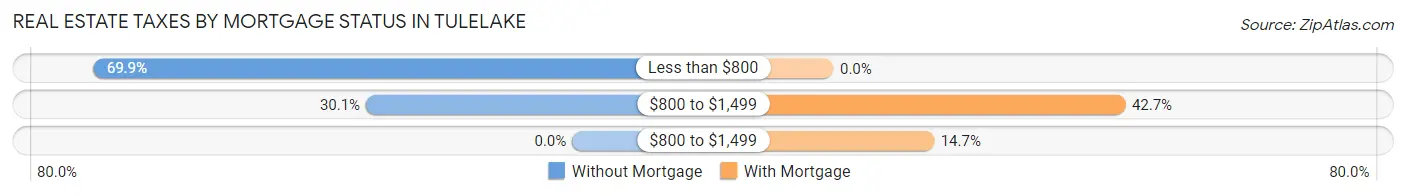
| Property Taxes | Without Mortgage | With Mortgage |
| Less than $800 | 58 (69.9%) | 0 (0.0%) |
| $800 to $1,499 | 25 (30.1%) | 29 (42.6%) |
| $800 to $1,499 | 0 (0.0%) | 10 (14.7%) |
| Total | 83 (100.0%) | 68 (100.0%) |
Health & Disability in Tulelake
Health Insurance Coverage by Age in Tulelake
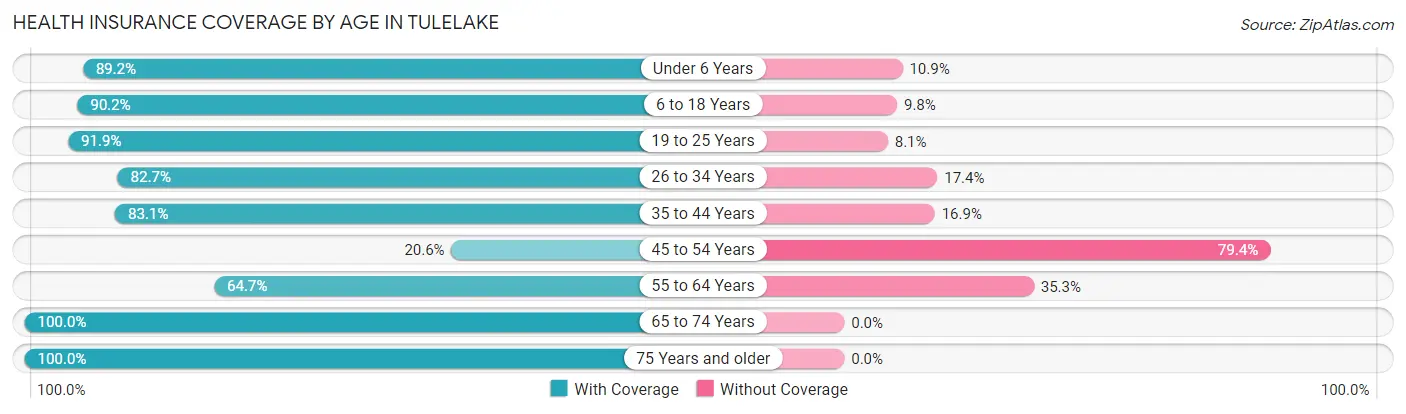
| Age Bracket | With Coverage | Without Coverage |
| Under 6 Years | 115 (89.1%) | 14 (10.8%) |
| 6 to 18 Years | 110 (90.2%) | 12 (9.8%) |
| 19 to 25 Years | 34 (91.9%) | 3 (8.1%) |
| 26 to 34 Years | 81 (82.7%) | 17 (17.3%) |
| 35 to 44 Years | 69 (83.1%) | 14 (16.9%) |
| 45 to 54 Years | 14 (20.6%) | 54 (79.4%) |
| 55 to 64 Years | 75 (64.7%) | 41 (35.3%) |
| 65 to 74 Years | 89 (100.0%) | 0 (0.0%) |
| 75 Years and older | 69 (100.0%) | 0 (0.0%) |
| Total | 656 (80.9%) | 155 (19.1%) |
Health Insurance Coverage by Citizenship Status in Tulelake
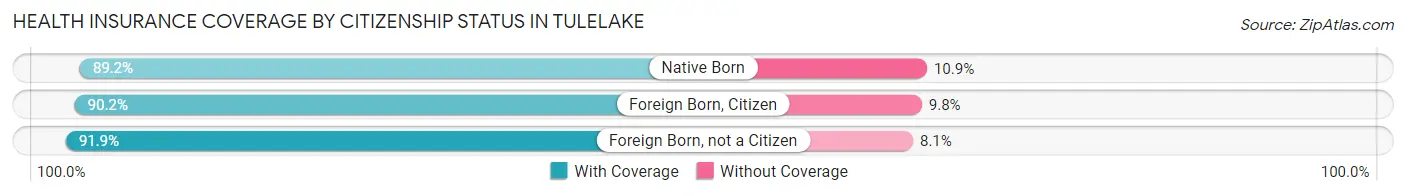
| Citizenship Status | With Coverage | Without Coverage |
| Native Born | 115 (89.1%) | 14 (10.8%) |
| Foreign Born, Citizen | 110 (90.2%) | 12 (9.8%) |
| Foreign Born, not a Citizen | 34 (91.9%) | 3 (8.1%) |
Health Insurance Coverage by Household Income in Tulelake
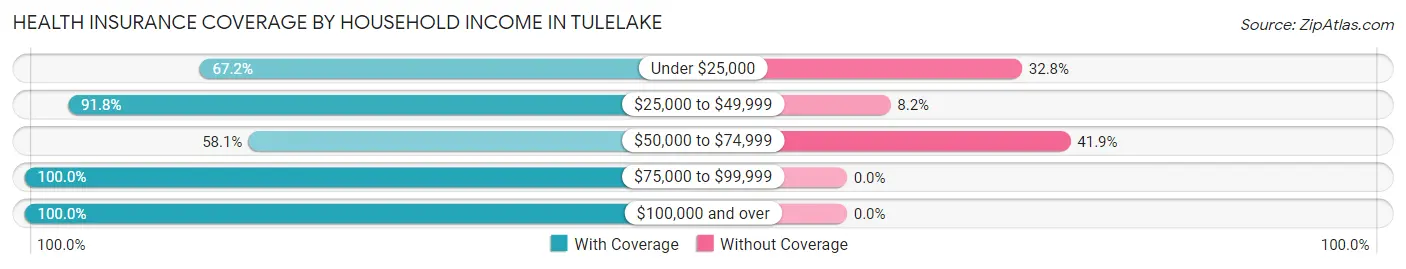
| Household Income | With Coverage | Without Coverage |
| Under $25,000 | 125 (67.2%) | 61 (32.8%) |
| $25,000 to $49,999 | 360 (91.8%) | 32 (8.2%) |
| $50,000 to $74,999 | 86 (58.1%) | 62 (41.9%) |
| $75,000 to $99,999 | 17 (100.0%) | 0 (0.0%) |
| $100,000 and over | 68 (100.0%) | 0 (0.0%) |
Public vs Private Health Insurance Coverage by Age in Tulelake
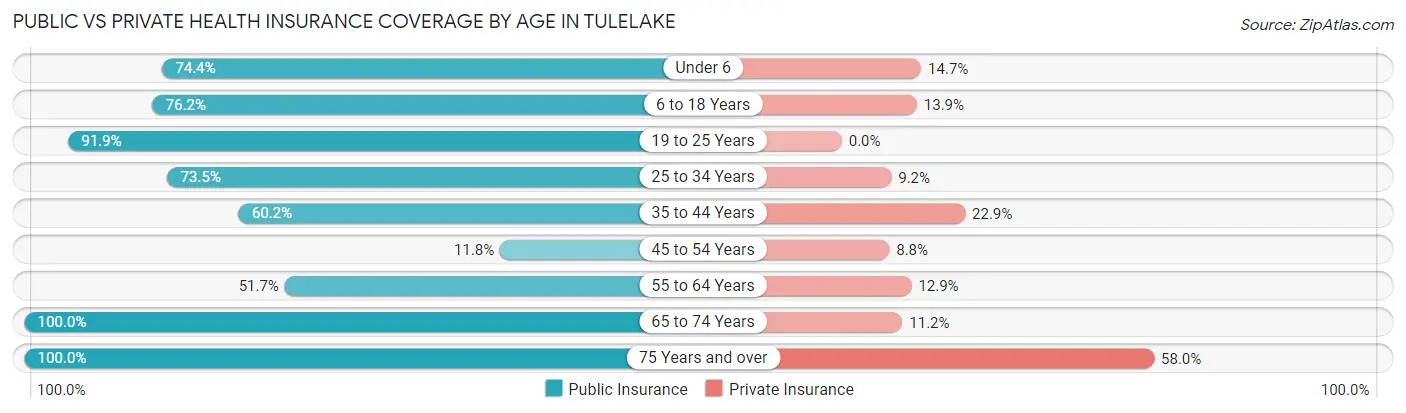
| Age Bracket | Public Insurance | Private Insurance |
| Under 6 | 96 (74.4%) | 19 (14.7%) |
| 6 to 18 Years | 93 (76.2%) | 17 (13.9%) |
| 19 to 25 Years | 34 (91.9%) | 0 (0.0%) |
| 25 to 34 Years | 72 (73.5%) | 9 (9.2%) |
| 35 to 44 Years | 50 (60.2%) | 19 (22.9%) |
| 45 to 54 Years | 8 (11.8%) | 6 (8.8%) |
| 55 to 64 Years | 60 (51.7%) | 15 (12.9%) |
| 65 to 74 Years | 89 (100.0%) | 10 (11.2%) |
| 75 Years and over | 69 (100.0%) | 40 (58.0%) |
| Total | 571 (70.4%) | 135 (16.7%) |
Disability Status by Sex by Age in Tulelake
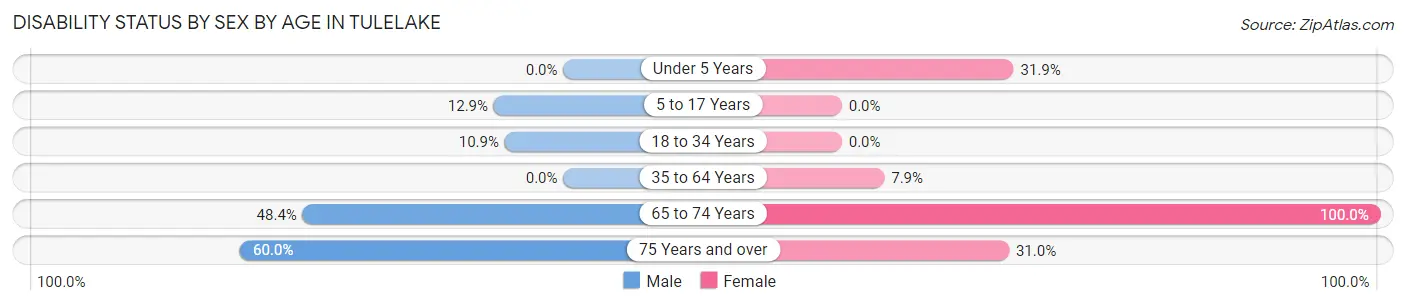
| Age Bracket | Male | Female |
| Under 5 Years | 0 (0.0%) | 22 (31.9%) |
| 5 to 17 Years | 8 (12.9%) | 0 (0.0%) |
| 18 to 34 Years | 10 (10.9%) | 0 (0.0%) |
| 35 to 64 Years | 0 (0.0%) | 15 (7.9%) |
| 65 to 74 Years | 15 (48.4%) | 58 (100.0%) |
| 75 Years and over | 24 (60.0%) | 9 (31.0%) |
Disability Class by Sex by Age in Tulelake
Disability Class: Hearing Difficulty
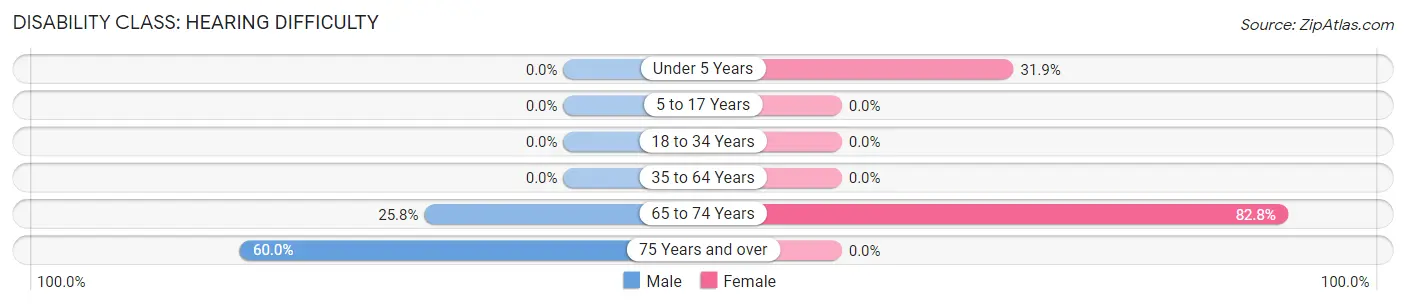
| Age Bracket | Male | Female |
| Under 5 Years | 0 (0.0%) | 22 (31.9%) |
| 5 to 17 Years | 0 (0.0%) | 0 (0.0%) |
| 18 to 34 Years | 0 (0.0%) | 0 (0.0%) |
| 35 to 64 Years | 0 (0.0%) | 0 (0.0%) |
| 65 to 74 Years | 8 (25.8%) | 48 (82.8%) |
| 75 Years and over | 24 (60.0%) | 0 (0.0%) |
Disability Class: Vision Difficulty
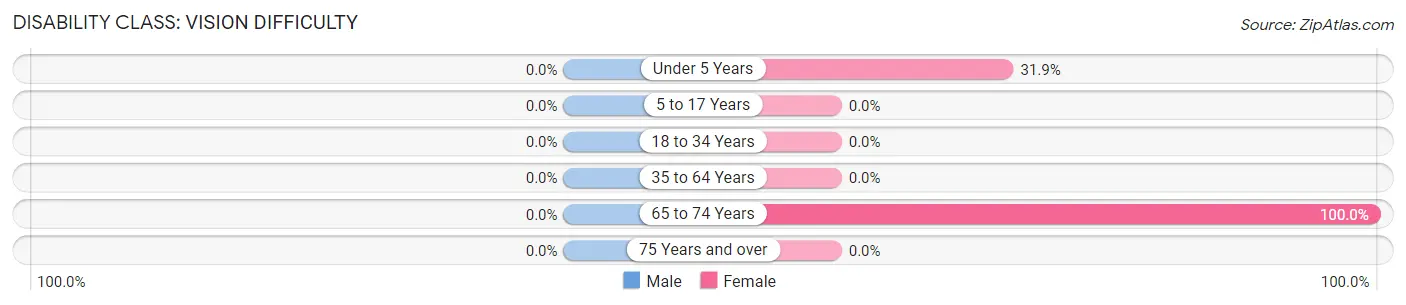
| Age Bracket | Male | Female |
| Under 5 Years | 0 (0.0%) | 22 (31.9%) |
| 5 to 17 Years | 0 (0.0%) | 0 (0.0%) |
| 18 to 34 Years | 0 (0.0%) | 0 (0.0%) |
| 35 to 64 Years | 0 (0.0%) | 0 (0.0%) |
| 65 to 74 Years | 0 (0.0%) | 58 (100.0%) |
| 75 Years and over | 0 (0.0%) | 0 (0.0%) |
Disability Class: Cognitive Difficulty
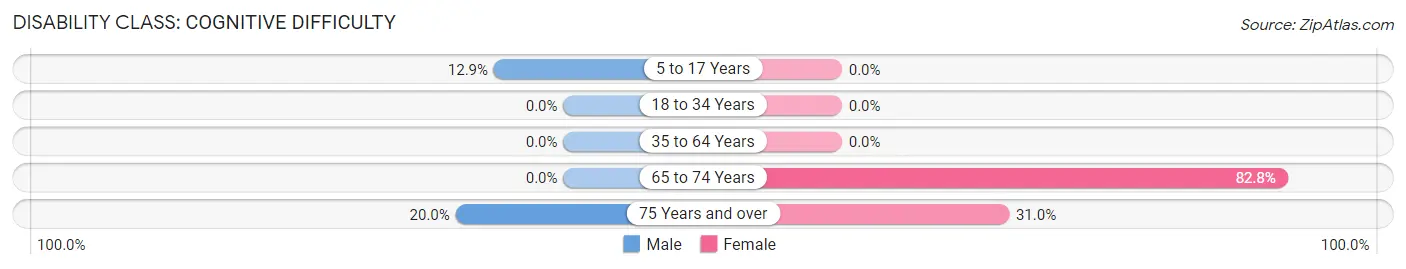
| Age Bracket | Male | Female |
| 5 to 17 Years | 8 (12.9%) | 0 (0.0%) |
| 18 to 34 Years | 0 (0.0%) | 0 (0.0%) |
| 35 to 64 Years | 0 (0.0%) | 0 (0.0%) |
| 65 to 74 Years | 0 (0.0%) | 48 (82.8%) |
| 75 Years and over | 8 (20.0%) | 9 (31.0%) |
Disability Class: Ambulatory Difficulty
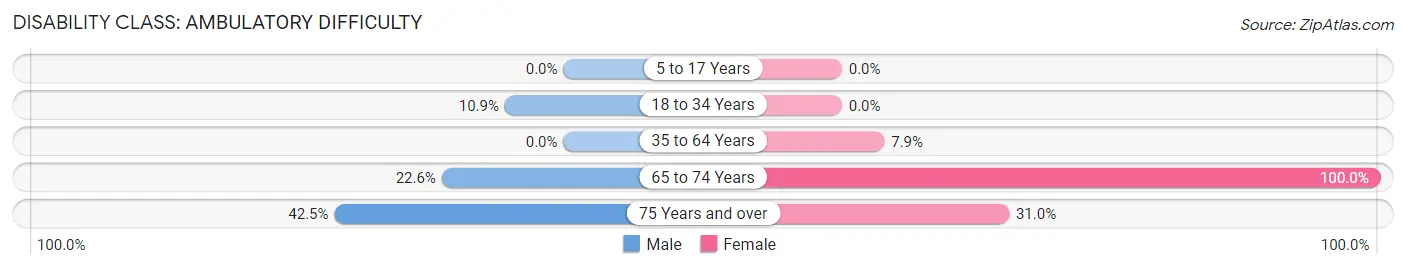
| Age Bracket | Male | Female |
| 5 to 17 Years | 0 (0.0%) | 0 (0.0%) |
| 18 to 34 Years | 10 (10.9%) | 0 (0.0%) |
| 35 to 64 Years | 0 (0.0%) | 15 (7.9%) |
| 65 to 74 Years | 7 (22.6%) | 58 (100.0%) |
| 75 Years and over | 17 (42.5%) | 9 (31.0%) |
Disability Class: Self-Care Difficulty
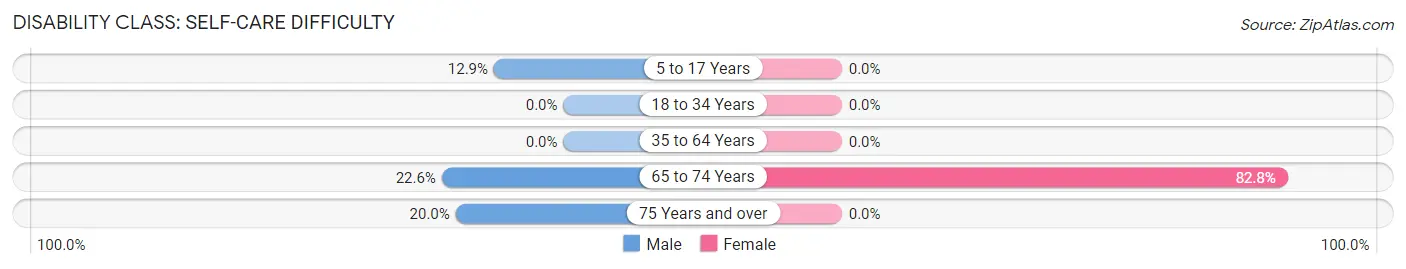
| Age Bracket | Male | Female |
| 5 to 17 Years | 8 (12.9%) | 0 (0.0%) |
| 18 to 34 Years | 0 (0.0%) | 0 (0.0%) |
| 35 to 64 Years | 0 (0.0%) | 0 (0.0%) |
| 65 to 74 Years | 7 (22.6%) | 48 (82.8%) |
| 75 Years and over | 8 (20.0%) | 0 (0.0%) |
Technology Access in Tulelake
Computing Device Access in Tulelake
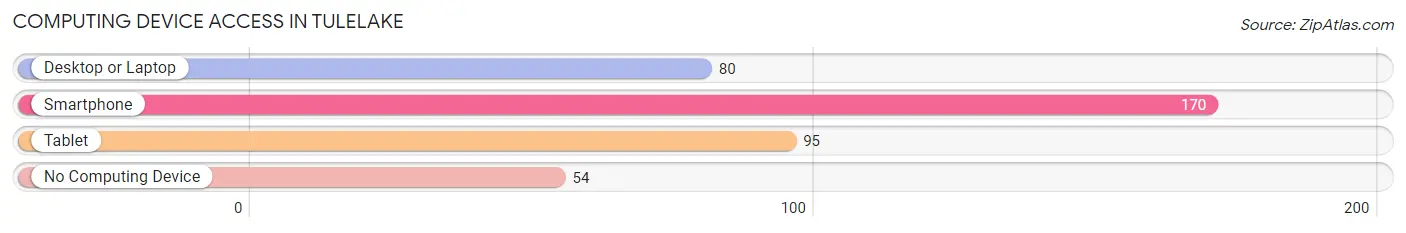
| Device Type | # Households | % Households |
| Desktop or Laptop | 80 | 33.3% |
| Smartphone | 170 | 70.8% |
| Tablet | 95 | 39.6% |
| No Computing Device | 54 | 22.5% |
| Total | 240 | 100.0% |
Internet Access in Tulelake
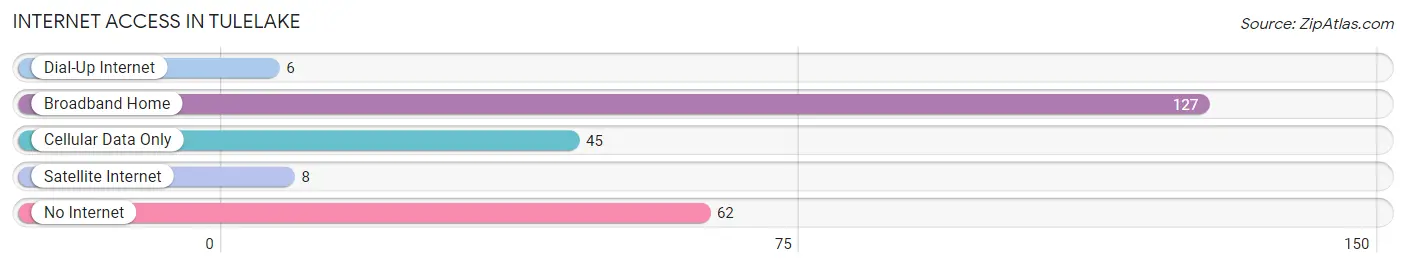
| Internet Type | # Households | % Households |
| Dial-Up Internet | 6 | 2.5% |
| Broadband Home | 127 | 52.9% |
| Cellular Data Only | 45 | 18.8% |
| Satellite Internet | 8 | 3.3% |
| No Internet | 62 | 25.8% |
| Total | 240 | 100.0% |
Tulelake Summary
Tulelake is a small town located in Siskiyou County, California, United States. It is situated in the northeastern corner of the state, near the Oregon border. The town is located in the Tule Lake Basin, a large, shallow lake that was once part of the larger Klamath Lake. The town is surrounded by the Tule Lake National Wildlife Refuge, which is home to a variety of wildlife, including bald eagles, ospreys, and migratory waterfowl.
History
Tulelake was first settled in the late 1800s by homesteaders who were attracted to the area by its fertile soil and abundant water. The town was originally known as "Tule Lake Station" and was a stop on the Oregon and California Railroad. In the early 1900s, the town was renamed "Tulelake" and became a popular destination for tourists and outdoor enthusiasts.
In 1942, the United States government established the Tule Lake War Relocation Center, a Japanese internment camp, in the area. The camp was one of the largest and most controversial of the internment camps, and it housed over 18,000 Japanese Americans during World War II. After the war, the camp was closed and the land was returned to the local community.
Geography
Tulelake is located in the Tule Lake Basin, a large, shallow lake that was once part of the larger Klamath Lake. The town is surrounded by the Tule Lake National Wildlife Refuge, which is home to a variety of wildlife, including bald eagles, ospreys, and migratory waterfowl. The town is located in the northeastern corner of California, near the Oregon border.
The climate in Tulelake is semi-arid, with hot summers and cold winters. The average annual temperature is around 50°F (10°C). The area receives an average of 10 inches (25 cm) of precipitation per year, mostly in the form of snow in the winter months.
Economy
Tulelake's economy is largely based on agriculture. The town is home to several large farms, which produce a variety of crops, including potatoes, onions, alfalfa, and wheat. The town is also home to several small businesses, including restaurants, gas stations, and convenience stores.
Demographics
As of the 2010 census, the population of Tulelake was 1,845. The racial makeup of the town was 94.3% White, 0.3% African American, 0.7% Native American, 0.3% Asian, 0.1% Pacific Islander, and 3.3% from other races. The median household income was $35,938, and the median family income was $41,250.
Tulelake is a small, rural town with a close-knit community. The town is home to several churches, a library, and a museum. The town also hosts several annual events, including the Tulelake-Butte Valley Fair and the Tulelake-Butte Valley Potato Festival.
Common Questions
What is Per Capita Income in Tulelake?
Per Capita income in Tulelake is $15,204.
What is the Median Family Income in Tulelake?
Median Family Income in Tulelake is $41,680.
What is the Median Household income in Tulelake?
Median Household Income in Tulelake is $41,154.
What is Family Income Deficit in Tulelake?
Family Income Deficit in Tulelake is $7,734.
Families that are below poverty line in Tulelake earn $7,734 less on average than the poverty threshold level.
What is Inequality or Gini Index in Tulelake?
Inequality or Gini Index in Tulelake is 0.38.
What is the Total Population of Tulelake?
Total Population of Tulelake is 811.
What is the Total Male Population of Tulelake?
Total Male Population of Tulelake is 341.
What is the Total Female Population of Tulelake?
Total Female Population of Tulelake is 470.
What is the Ratio of Males per 100 Females in Tulelake?
There are 72.55 Males per 100 Females in Tulelake.
What is the Ratio of Females per 100 Males in Tulelake?
There are 137.83 Females per 100 Males in Tulelake.
What is the Median Population Age in Tulelake?
Median Population Age in Tulelake is 39.4 Years.
What is the Average Family Size in Tulelake
Average Family Size in Tulelake is 3.8 People.
What is the Average Household Size in Tulelake
Average Household Size in Tulelake is 3.4 People.
How Large is the Labor Force in Tulelake?
There are 226 People in the Labor Forcein in Tulelake.
What is the Percentage of People in the Labor Force in Tulelake?
39.5% of People are in the Labor Force in Tulelake.
What is the Unemployment Rate in Tulelake?
Unemployment Rate in Tulelake is 11.9%.