Truckee, CA Map & Demographics
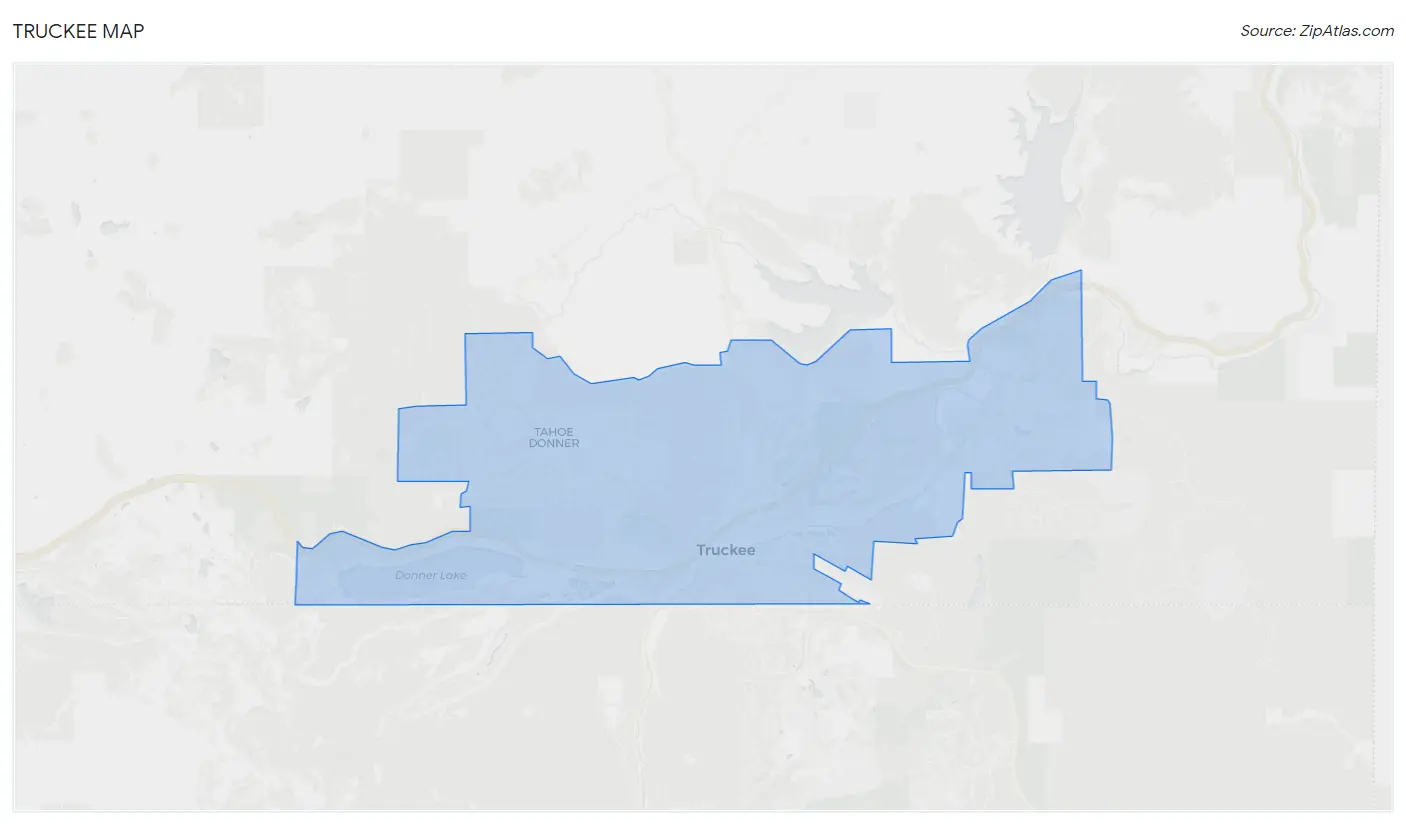
Truckee Map
Truckee Overview
$63,792
PER CAPITA INCOME
$139,917
AVG FAMILY INCOME
$107,423
AVG HOUSEHOLD INCOME
40.2%
WAGE / INCOME GAP [ % ]
59.8¢/ $1
WAGE / INCOME GAP [ $ ]
0.49
INEQUALITY / GINI INDEX
16,784
TOTAL POPULATION
8,637
MALE POPULATION
8,147
FEMALE POPULATION
106.01
MALES / 100 FEMALES
94.33
FEMALES / 100 MALES
41.9
MEDIAN AGE
3.0
AVG FAMILY SIZE
2.7
AVG HOUSEHOLD SIZE
9,025
LABOR FORCE [ PEOPLE ]
66.6%
PERCENT IN LABOR FORCE
5.7%
UNEMPLOYMENT RATE
Truckee Zip Codes
Truckee Area Codes
Income in Truckee
Income Overview in Truckee
Per Capita Income in Truckee is $63,792, while median incomes of families and households are $139,917 and $107,423 respectively.
| Characteristic | Number | Measure |
| Per Capita Income | 16,784 | $63,792 |
| Median Family Income | 4,377 | $139,917 |
| Mean Family Income | 4,377 | $187,522 |
| Median Household Income | 6,279 | $107,423 |
| Mean Household Income | 6,279 | $165,212 |
| Income Deficit | 4,377 | $0 |
| Wage / Income Gap (%) | 16,784 | 40.19% |
| Wage / Income Gap ($) | 16,784 | 59.81¢ per $1 |
| Gini / Inequality Index | 16,784 | 0.49 |
Earnings by Sex in Truckee
Average Earnings in Truckee are $57,969, $66,505 for men and $39,778 for women, a difference of 40.2%.
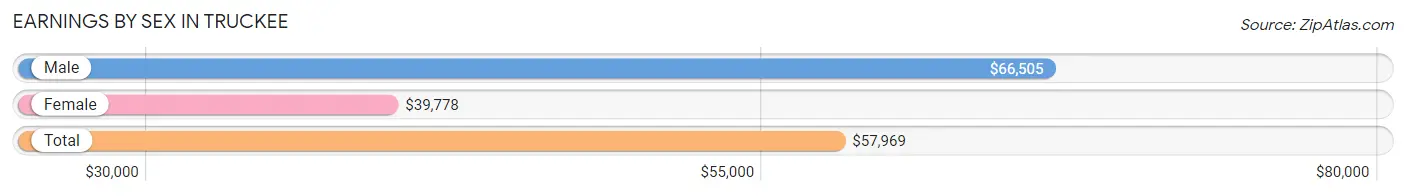
| Sex | Number | Average Earnings |
| Male | 5,447 (56.0%) | $66,505 |
| Female | 4,279 (44.0%) | $39,778 |
| Total | 9,726 (100.0%) | $57,969 |
Earnings by Sex by Income Bracket in Truckee
The most common earnings brackets in Truckee are $100,000+ for men (1,637 | 30.0%) and $100,000+ for women (1,067 | 24.9%).
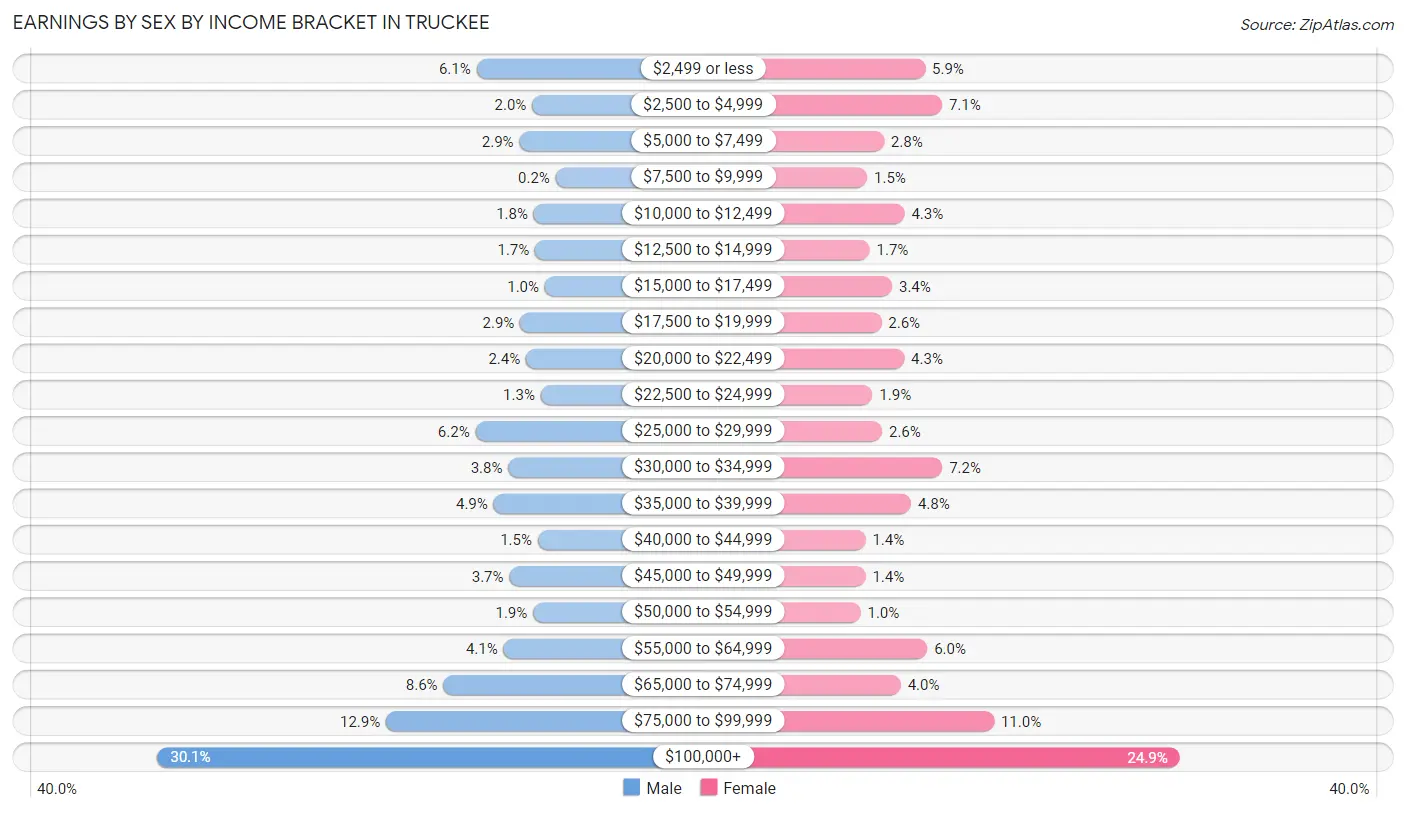
| Income | Male | Female |
| $2,499 or less | 334 (6.1%) | 251 (5.9%) |
| $2,500 to $4,999 | 107 (2.0%) | 305 (7.1%) |
| $5,000 to $7,499 | 159 (2.9%) | 119 (2.8%) |
| $7,500 to $9,999 | 11 (0.2%) | 65 (1.5%) |
| $10,000 to $12,499 | 100 (1.8%) | 185 (4.3%) |
| $12,500 to $14,999 | 95 (1.7%) | 73 (1.7%) |
| $15,000 to $17,499 | 55 (1.0%) | 145 (3.4%) |
| $17,500 to $19,999 | 156 (2.9%) | 111 (2.6%) |
| $20,000 to $22,499 | 132 (2.4%) | 184 (4.3%) |
| $22,500 to $24,999 | 72 (1.3%) | 82 (1.9%) |
| $25,000 to $29,999 | 338 (6.2%) | 113 (2.6%) |
| $30,000 to $34,999 | 204 (3.7%) | 306 (7.1%) |
| $35,000 to $39,999 | 264 (4.9%) | 206 (4.8%) |
| $40,000 to $44,999 | 84 (1.5%) | 60 (1.4%) |
| $45,000 to $49,999 | 200 (3.7%) | 60 (1.4%) |
| $50,000 to $54,999 | 103 (1.9%) | 44 (1.0%) |
| $55,000 to $64,999 | 224 (4.1%) | 258 (6.0%) |
| $65,000 to $74,999 | 469 (8.6%) | 173 (4.0%) |
| $75,000 to $99,999 | 703 (12.9%) | 472 (11.0%) |
| $100,000+ | 1,637 (30.0%) | 1,067 (24.9%) |
| Total | 5,447 (100.0%) | 4,279 (100.0%) |
Earnings by Sex by Educational Attainment in Truckee
Average earnings in Truckee are $70,228 for men and $57,263 for women, a difference of 18.5%. Men with an educational attainment of graduate degree enjoy the highest average annual earnings of $131,302, while those with less than high school education earn the least with $36,216. Women with an educational attainment of graduate degree earn the most with the average annual earnings of $96,958, while those with high school diploma education have the smallest earnings of $32,886.
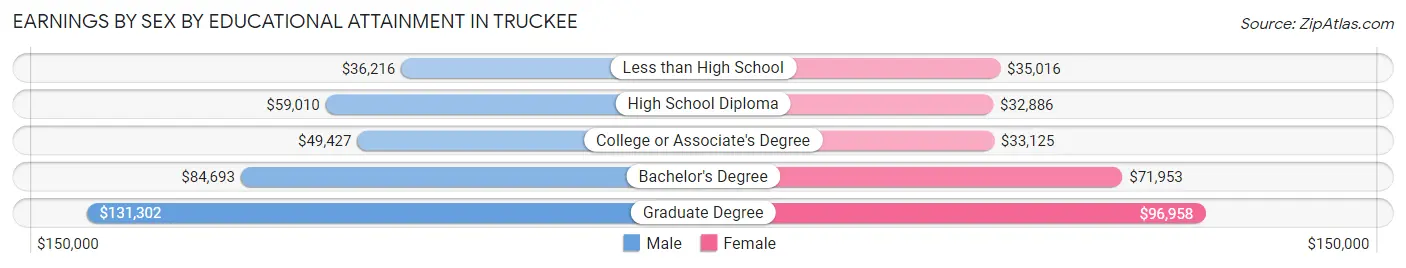
| Educational Attainment | Male Income | Female Income |
| Less than High School | $36,216 | $35,016 |
| High School Diploma | $59,010 | $32,886 |
| College or Associate's Degree | $49,427 | $33,125 |
| Bachelor's Degree | $84,693 | $71,953 |
| Graduate Degree | $131,302 | $96,958 |
| Total | $70,228 | $57,263 |
Family Income in Truckee
Family Income Brackets in Truckee
According to the Truckee family income data, there are 1,401 families falling into the $200,000+ income range, which is the most common income bracket and makes up 32.0% of all families. Conversely, the $10,000 to $14,999 income bracket is the least frequent group with only 13 families (0.3%) belonging to this category.
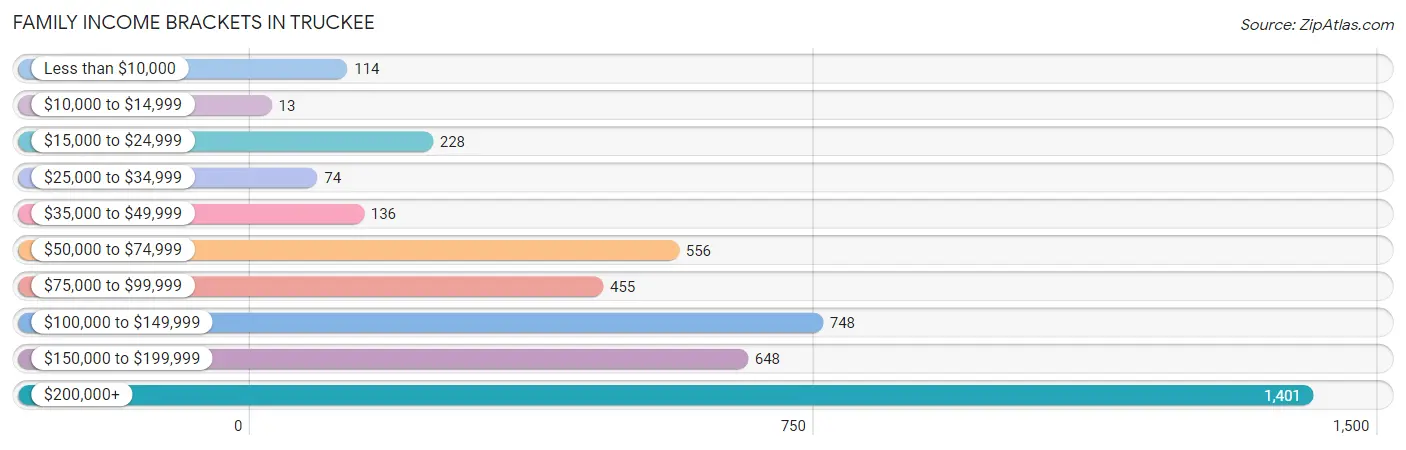
| Income Bracket | # Families | % Families |
| Less than $10,000 | 114 | 2.6% |
| $10,000 to $14,999 | 13 | 0.3% |
| $15,000 to $24,999 | 228 | 5.2% |
| $25,000 to $34,999 | 74 | 1.7% |
| $35,000 to $49,999 | 136 | 3.1% |
| $50,000 to $74,999 | 556 | 12.7% |
| $75,000 to $99,999 | 455 | 10.4% |
| $100,000 to $149,999 | 748 | 17.1% |
| $150,000 to $199,999 | 648 | 14.8% |
| $200,000+ | 1,401 | 32.0% |
Family Income by Famaliy Size in Truckee
4-person families (872 | 19.9%) account for the highest median family income in Truckee with $178,810 per family, while 3-person families (1,070 | 24.4%) have the highest median income of $53,561 per family member.
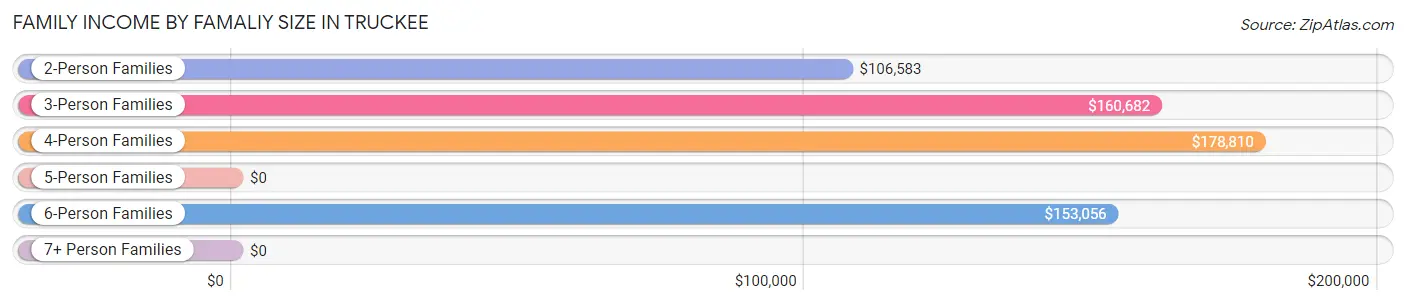
| Income Bracket | # Families | Median Income |
| 2-Person Families | 2,107 (48.1%) | $106,583 |
| 3-Person Families | 1,070 (24.4%) | $160,682 |
| 4-Person Families | 872 (19.9%) | $178,810 |
| 5-Person Families | 293 (6.7%) | $0 |
| 6-Person Families | 34 (0.8%) | $153,056 |
| 7+ Person Families | 1 (0.0%) | $0 |
| Total | 4,377 (100.0%) | $139,917 |
Family Income by Number of Earners in Truckee
The median family income in Truckee is $139,917, with families comprising 3+ earners (460) having the highest median family income of $211,696, while families with no earners (708) have the lowest median family income of $75,957, accounting for 10.5% and 16.2% of families, respectively.
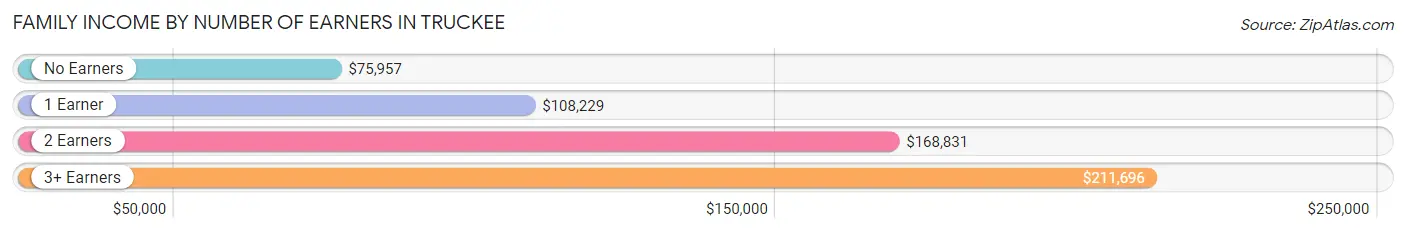
| Number of Earners | # Families | Median Income |
| No Earners | 708 (16.2%) | $75,957 |
| 1 Earner | 1,145 (26.2%) | $108,229 |
| 2 Earners | 2,064 (47.2%) | $168,831 |
| 3+ Earners | 460 (10.5%) | $211,696 |
| Total | 4,377 (100.0%) | $139,917 |
Household Income in Truckee
Household Income Brackets in Truckee
With 1,714 households falling in the category, the $200,000+ income range is the most frequent in Truckee, accounting for 27.3% of all households. In contrast, only 107 households (1.7%) fall into the $10,000 to $14,999 income bracket, making it the least populous group.
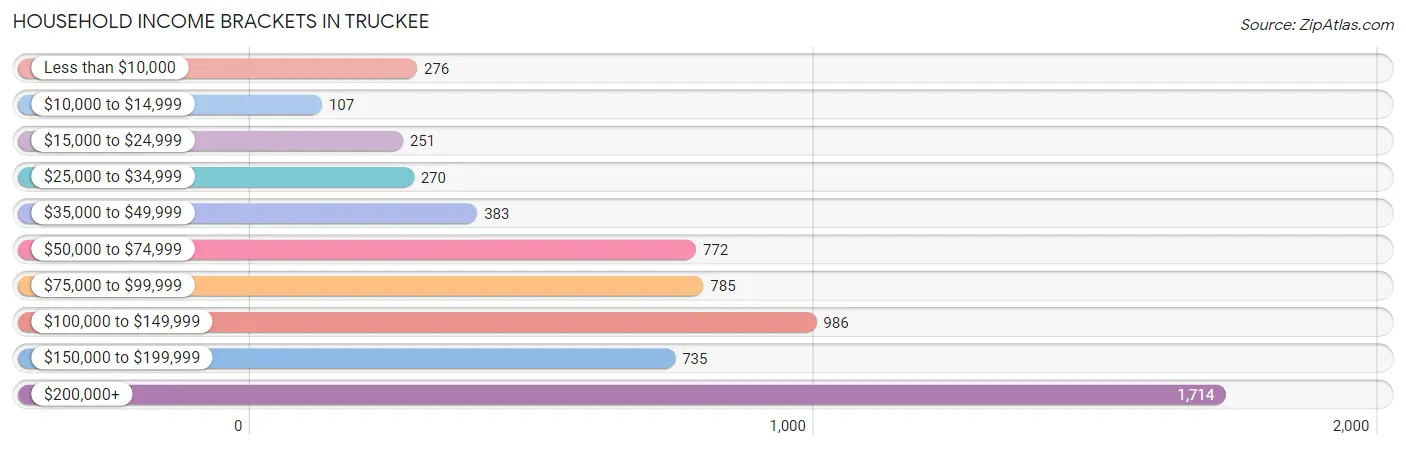
| Income Bracket | # Households | % Households |
| Less than $10,000 | 276 | 4.4% |
| $10,000 to $14,999 | 107 | 1.7% |
| $15,000 to $24,999 | 251 | 4.0% |
| $25,000 to $34,999 | 270 | 4.3% |
| $35,000 to $49,999 | 383 | 6.1% |
| $50,000 to $74,999 | 772 | 12.3% |
| $75,000 to $99,999 | 785 | 12.5% |
| $100,000 to $149,999 | 986 | 15.7% |
| $150,000 to $199,999 | 735 | 11.7% |
| $200,000+ | 1,714 | 27.3% |
Household Income by Householder Age in Truckee
The median household income in Truckee is $107,423, with the highest median household income of $124,097 found in the 25 to 44 years age bracket for the primary householder. A total of 2,039 households (32.5%) fall into this category.
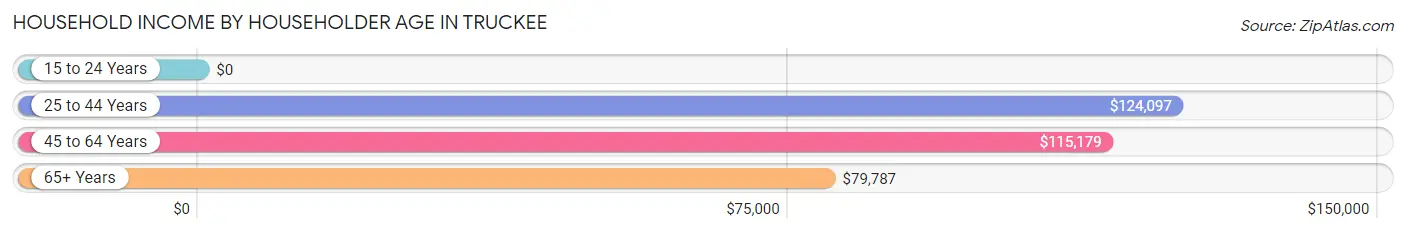
| Income Bracket | # Households | Median Income |
| 15 to 24 Years | 0 (0.0%) | $0 |
| 25 to 44 Years | 2,039 (32.5%) | $124,097 |
| 45 to 64 Years | 2,605 (41.5%) | $115,179 |
| 65+ Years | 1,635 (26.0%) | $79,787 |
| Total | 6,279 (100.0%) | $107,423 |
Poverty in Truckee
Income Below Poverty by Sex and Age in Truckee
With 7.5% poverty level for males and 10.5% for females among the residents of Truckee, 75 year old and over males and 15 year old females are the most vulnerable to poverty, with 58 males (14.0%) and 34 females (30.6%) in their respective age groups living below the poverty level.
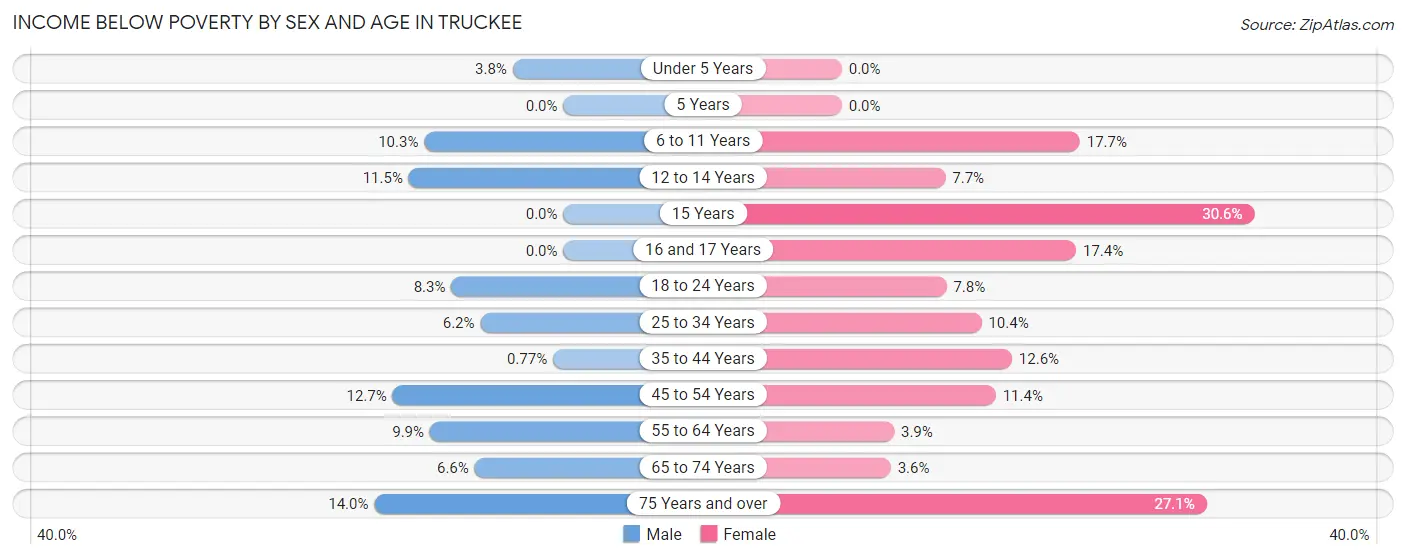
| Age Bracket | Male | Female |
| Under 5 Years | 23 (3.8%) | 0 (0.0%) |
| 5 Years | 0 (0.0%) | 0 (0.0%) |
| 6 to 11 Years | 56 (10.3%) | 144 (17.7%) |
| 12 to 14 Years | 38 (11.5%) | 17 (7.7%) |
| 15 Years | 0 (0.0%) | 34 (30.6%) |
| 16 and 17 Years | 0 (0.0%) | 40 (17.4%) |
| 18 to 24 Years | 43 (8.3%) | 31 (7.8%) |
| 25 to 34 Years | 62 (6.2%) | 90 (10.4%) |
| 35 to 44 Years | 10 (0.8%) | 164 (12.6%) |
| 45 to 54 Years | 171 (12.7%) | 132 (11.4%) |
| 55 to 64 Years | 114 (9.9%) | 51 (3.9%) |
| 65 to 74 Years | 77 (6.6%) | 26 (3.6%) |
| 75 Years and over | 58 (14.0%) | 127 (27.1%) |
| Total | 652 (7.5%) | 856 (10.5%) |
Income Above Poverty by Sex and Age in Truckee
According to the poverty statistics in Truckee, males aged 5 years and females aged under 5 years are the age groups that are most secure financially, with 100.0% of males and 100.0% of females in these age groups living above the poverty line.
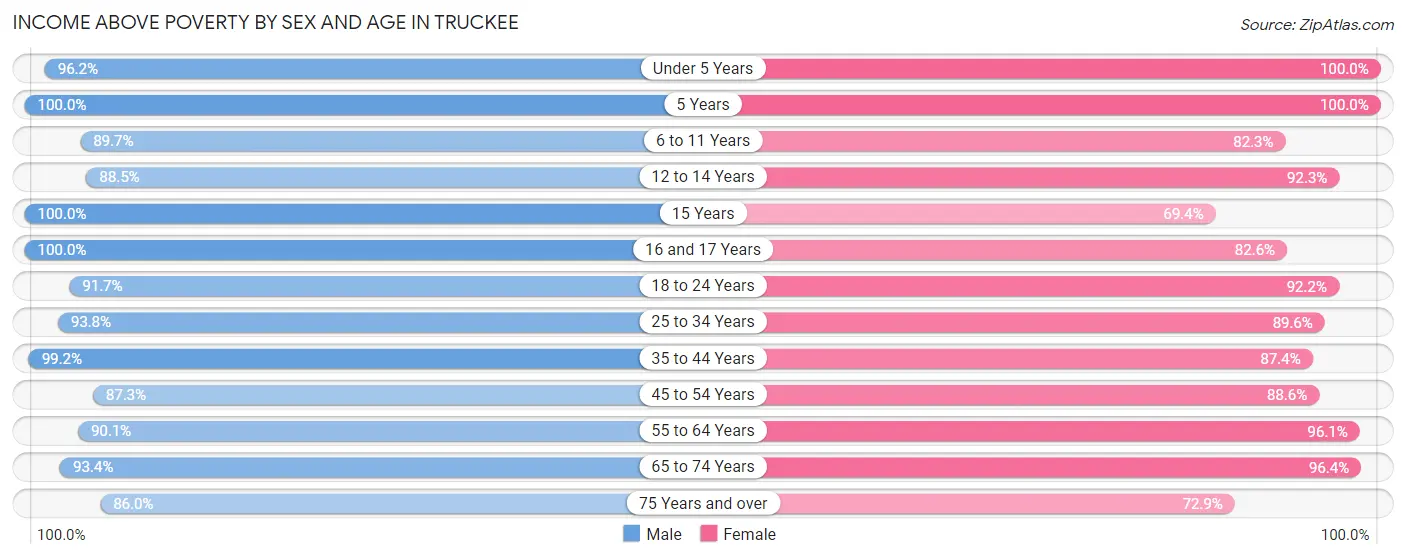
| Age Bracket | Male | Female |
| Under 5 Years | 589 (96.2%) | 511 (100.0%) |
| 5 Years | 35 (100.0%) | 40 (100.0%) |
| 6 to 11 Years | 486 (89.7%) | 671 (82.3%) |
| 12 to 14 Years | 293 (88.5%) | 204 (92.3%) |
| 15 Years | 13 (100.0%) | 77 (69.4%) |
| 16 and 17 Years | 199 (100.0%) | 190 (82.6%) |
| 18 to 24 Years | 474 (91.7%) | 368 (92.2%) |
| 25 to 34 Years | 944 (93.8%) | 778 (89.6%) |
| 35 to 44 Years | 1,289 (99.2%) | 1,135 (87.4%) |
| 45 to 54 Years | 1,178 (87.3%) | 1,023 (88.6%) |
| 55 to 64 Years | 1,036 (90.1%) | 1,262 (96.1%) |
| 65 to 74 Years | 1,092 (93.4%) | 690 (96.4%) |
| 75 Years and over | 355 (86.0%) | 342 (72.9%) |
| Total | 7,983 (92.4%) | 7,291 (89.5%) |
Income Below Poverty Among Married-Couple Families in Truckee
The poverty statistics for married-couple families in Truckee show that 3.8% or 146 of the total 3,870 families live below the poverty line. Families with no children have the highest poverty rate of 4.5%, comprising of 98 families. On the other hand, families with 3 or 4 children have the lowest poverty rate of 0.0%, which includes 0 families.
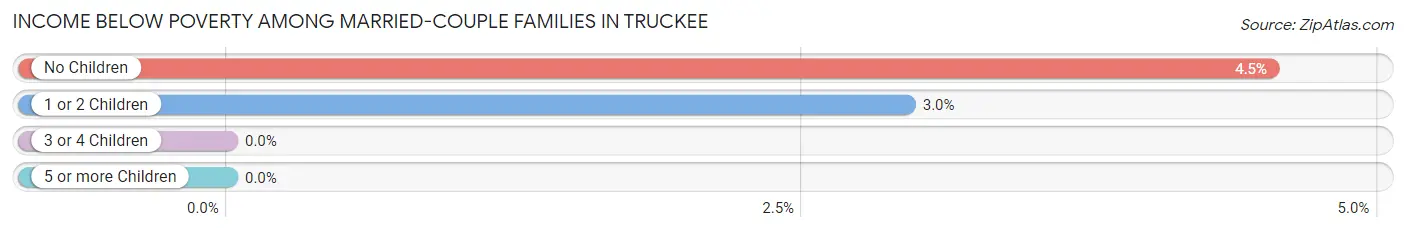
| Children | Above Poverty | Below Poverty |
| No Children | 2,064 (95.5%) | 98 (4.5%) |
| 1 or 2 Children | 1,580 (97.1%) | 48 (2.9%) |
| 3 or 4 Children | 79 (100.0%) | 0 (0.0%) |
| 5 or more Children | 1 (100.0%) | 0 (0.0%) |
| Total | 3,724 (96.2%) | 146 (3.8%) |
Income Below Poverty Among Single-Parent Households in Truckee
According to the poverty data in Truckee, 7.6% or 15 single-father households and 47.3% or 147 single-mother households are living below the poverty line. Among single-father households, those with 1 or 2 children have the highest poverty rate, with 15 households (10.1%) experiencing poverty. Likewise, among single-mother households, those with 1 or 2 children have the highest poverty rate, with 126 households (51.6%) falling below the poverty line.
| Children | Single Father | Single Mother |
| No Children | 0 (0.0%) | 21 (31.3%) |
| 1 or 2 Children | 15 (10.1%) | 126 (51.6%) |
| 3 or 4 Children | 0 (0.0%) | 0 (0.0%) |
| 5 or more Children | 0 (0.0%) | 0 (0.0%) |
| Total | 15 (7.6%) | 147 (47.3%) |
Income Below Poverty Among Married-Couple vs Single-Parent Households in Truckee
The poverty data for Truckee shows that 146 of the married-couple family households (3.8%) and 162 of the single-parent households (32.0%) are living below the poverty level. Within the married-couple family households, those with no children have the highest poverty rate, with 98 households (4.5%) falling below the poverty line. Among the single-parent households, those with 1 or 2 children have the highest poverty rate, with 141 household (36.0%) living below poverty.
| Children | Married-Couple Families | Single-Parent Households |
| No Children | 98 (4.5%) | 21 (18.3%) |
| 1 or 2 Children | 48 (2.9%) | 141 (36.0%) |
| 3 or 4 Children | 0 (0.0%) | 0 (0.0%) |
| 5 or more Children | 0 (0.0%) | 0 (0.0%) |
| Total | 146 (3.8%) | 162 (32.0%) |
Race in Truckee
The most populous races in Truckee are White / Caucasian (14,357 | 85.5%), Hispanic or Latino (2,481 | 14.8%), and Two or more Races (1,552 | 9.2%).
| Race | # Population | % Population |
| Asian | 229 | 1.4% |
| Black / African American | 25 | 0.2% |
| Hawaiian / Pacific | 58 | 0.4% |
| Hispanic or Latino | 2,481 | 14.8% |
| Native / Alaskan | 0 | 0.0% |
| White / Caucasian | 14,357 | 85.5% |
| Two or more Races | 1,552 | 9.2% |
| Some other Race | 563 | 3.4% |
| Total | 16,784 | 100.0% |
Ancestry in Truckee
The most populous ancestries reported in Truckee are English (2,475 | 14.7%), German (2,358 | 14.1%), Irish (2,208 | 13.2%), Mexican (1,562 | 9.3%), and Italian (953 | 5.7%), together accounting for 57.0% of all Truckee residents.
| Ancestry | # Population | % Population |
| American | 448 | 2.7% |
| Arab | 33 | 0.2% |
| Argentinean | 57 | 0.3% |
| Armenian | 29 | 0.2% |
| Australian | 48 | 0.3% |
| Austrian | 16 | 0.1% |
| Bhutanese | 114 | 0.7% |
| Brazilian | 24 | 0.1% |
| British | 231 | 1.4% |
| Bulgarian | 9 | 0.1% |
| Canadian | 202 | 1.2% |
| Central American | 214 | 1.3% |
| Cherokee | 8 | 0.1% |
| Chilean | 88 | 0.5% |
| Colombian | 122 | 0.7% |
| Cree | 11 | 0.1% |
| Croatian | 23 | 0.1% |
| Cuban | 25 | 0.2% |
| Czech | 229 | 1.4% |
| Danish | 188 | 1.1% |
| Dominican | 50 | 0.3% |
| Dutch | 250 | 1.5% |
| Eastern European | 56 | 0.3% |
| English | 2,475 | 14.7% |
| European | 748 | 4.5% |
| Finnish | 41 | 0.2% |
| French | 570 | 3.4% |
| French Canadian | 349 | 2.1% |
| German | 2,358 | 14.1% |
| Greek | 27 | 0.2% |
| Guamanian / Chamorro | 98 | 0.6% |
| Guatemalan | 92 | 0.5% |
| Hungarian | 49 | 0.3% |
| Icelander | 23 | 0.1% |
| Indian (Asian) | 124 | 0.7% |
| Iranian | 15 | 0.1% |
| Irish | 2,208 | 13.2% |
| Italian | 953 | 5.7% |
| Korean | 30 | 0.2% |
| Lithuanian | 11 | 0.1% |
| Mexican | 1,562 | 9.3% |
| Native Hawaiian | 11 | 0.1% |
| Northern European | 53 | 0.3% |
| Norwegian | 565 | 3.4% |
| Peruvian | 54 | 0.3% |
| Polish | 486 | 2.9% |
| Portuguese | 248 | 1.5% |
| Puerto Rican | 79 | 0.5% |
| Russian | 355 | 2.1% |
| Salvadoran | 122 | 0.7% |
| Scandinavian | 85 | 0.5% |
| Scotch-Irish | 139 | 0.8% |
| Scottish | 587 | 3.5% |
| Sioux | 12 | 0.1% |
| Slovak | 82 | 0.5% |
| South American | 321 | 1.9% |
| Spanish | 55 | 0.3% |
| Swedish | 253 | 1.5% |
| Swiss | 70 | 0.4% |
| Syrian | 33 | 0.2% |
| Thai | 7 | 0.0% |
| Ukrainian | 42 | 0.3% |
| Welsh | 137 | 0.8% | View All 63 Rows |
Immigrants in Truckee
The most numerous immigrant groups reported in Truckee came from Latin America (1,126 | 6.7%), Central America (853 | 5.1%), Mexico (677 | 4.0%), Europe (343 | 2.0%), and South America (273 | 1.6%), together accounting for 19.5% of all Truckee residents.
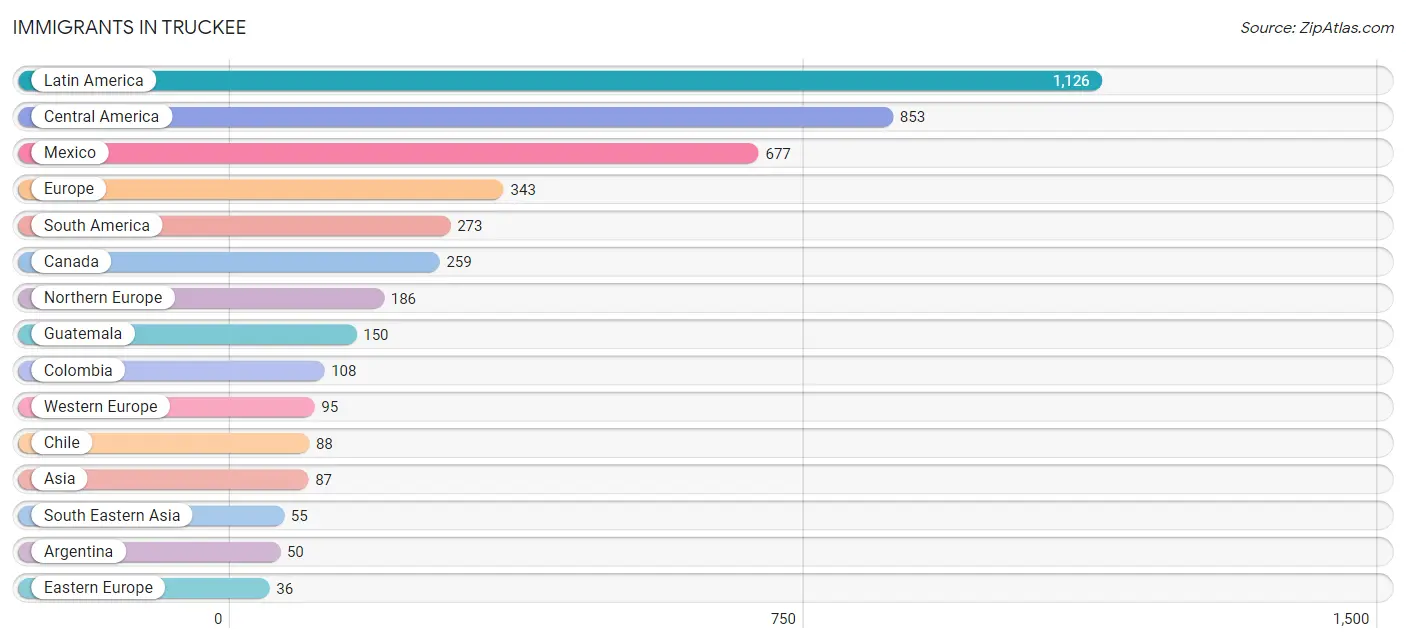
| Immigration Origin | # Population | % Population |
| Argentina | 50 | 0.3% |
| Asia | 87 | 0.5% |
| Australia | 25 | 0.2% |
| Austria | 11 | 0.1% |
| Brazil | 14 | 0.1% |
| Canada | 259 | 1.5% |
| Central America | 853 | 5.1% |
| Chile | 88 | 0.5% |
| China | 8 | 0.1% |
| Colombia | 108 | 0.6% |
| Czechoslovakia | 25 | 0.2% |
| Denmark | 33 | 0.2% |
| Eastern Asia | 17 | 0.1% |
| Eastern Europe | 36 | 0.2% |
| El Salvador | 26 | 0.2% |
| England | 12 | 0.1% |
| Europe | 343 | 2.0% |
| France | 9 | 0.1% |
| Germany | 27 | 0.2% |
| Guatemala | 150 | 0.9% |
| Iran | 15 | 0.1% |
| Ireland | 11 | 0.1% |
| Italy | 26 | 0.2% |
| Japan | 9 | 0.1% |
| Latin America | 1,126 | 6.7% |
| Malaysia | 12 | 0.1% |
| Mexico | 677 | 4.0% |
| Netherlands | 34 | 0.2% |
| Northern Europe | 186 | 1.1% |
| Norway | 26 | 0.2% |
| Oceania | 25 | 0.2% |
| Peru | 13 | 0.1% |
| Philippines | 30 | 0.2% |
| Russia | 11 | 0.1% |
| Scotland | 28 | 0.2% |
| Singapore | 13 | 0.1% |
| South America | 273 | 1.6% |
| South Central Asia | 15 | 0.1% |
| South Eastern Asia | 55 | 0.3% |
| Southern Europe | 26 | 0.2% |
| Sweden | 15 | 0.1% |
| Switzerland | 14 | 0.1% |
| Western Europe | 95 | 0.6% | View All 43 Rows |
Sex and Age in Truckee
Sex and Age in Truckee
The most populous age groups in Truckee are 35 to 39 Years (724 | 8.4%) for men and 35 to 39 Years (872 | 10.7%) for women.
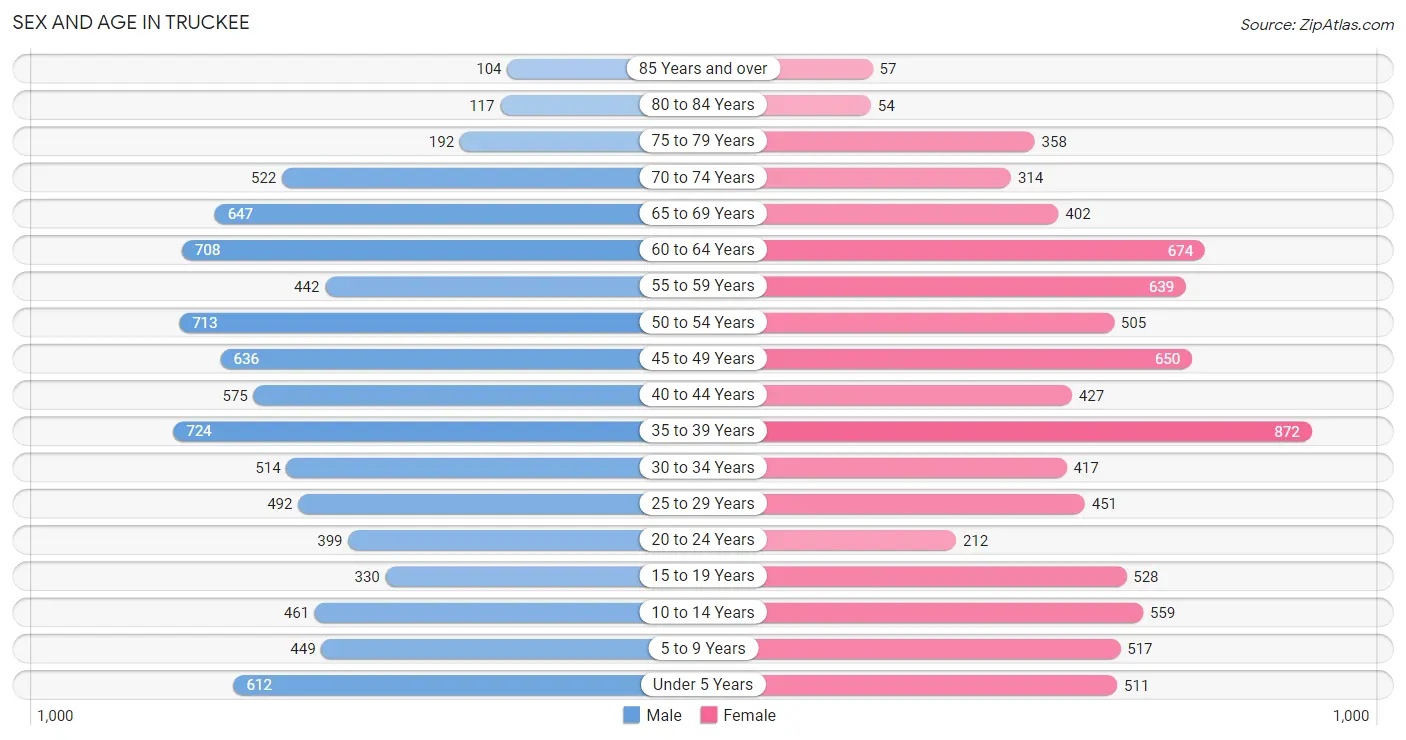
| Age Bracket | Male | Female |
| Under 5 Years | 612 (7.1%) | 511 (6.3%) |
| 5 to 9 Years | 449 (5.2%) | 517 (6.4%) |
| 10 to 14 Years | 461 (5.3%) | 559 (6.9%) |
| 15 to 19 Years | 330 (3.8%) | 528 (6.5%) |
| 20 to 24 Years | 399 (4.6%) | 212 (2.6%) |
| 25 to 29 Years | 492 (5.7%) | 451 (5.5%) |
| 30 to 34 Years | 514 (5.9%) | 417 (5.1%) |
| 35 to 39 Years | 724 (8.4%) | 872 (10.7%) |
| 40 to 44 Years | 575 (6.7%) | 427 (5.2%) |
| 45 to 49 Years | 636 (7.4%) | 650 (8.0%) |
| 50 to 54 Years | 713 (8.3%) | 505 (6.2%) |
| 55 to 59 Years | 442 (5.1%) | 639 (7.8%) |
| 60 to 64 Years | 708 (8.2%) | 674 (8.3%) |
| 65 to 69 Years | 647 (7.5%) | 402 (4.9%) |
| 70 to 74 Years | 522 (6.0%) | 314 (3.8%) |
| 75 to 79 Years | 192 (2.2%) | 358 (4.4%) |
| 80 to 84 Years | 117 (1.3%) | 54 (0.7%) |
| 85 Years and over | 104 (1.2%) | 57 (0.7%) |
| Total | 8,637 (100.0%) | 8,147 (100.0%) |
Families and Households in Truckee
Median Family Size in Truckee
The median family size in Truckee is 3.04 persons per family, with married-couple families (3,870 | 88.4%) accounting for the largest median family size of 3.08 persons per family. On the other hand, single male/father families (196 | 4.5%) represent the smallest median family size with 2.64 persons per family.
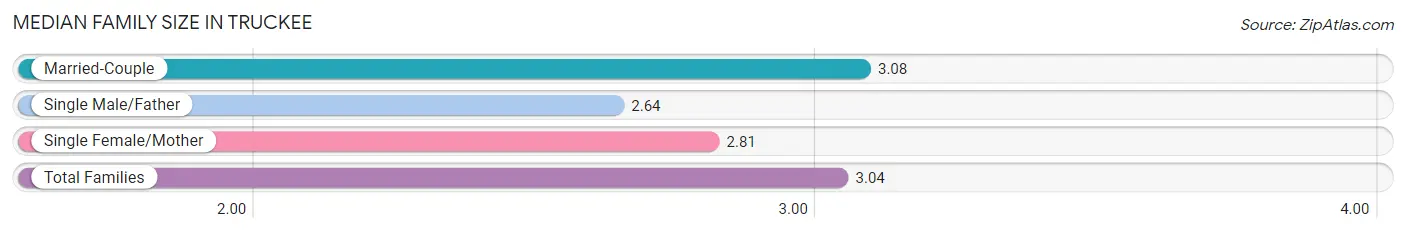
| Family Type | # Families | Family Size |
| Married-Couple | 3,870 (88.4%) | 3.08 |
| Single Male/Father | 196 (4.5%) | 2.64 |
| Single Female/Mother | 311 (7.1%) | 2.81 |
| Total Families | 4,377 (100.0%) | 3.04 |
Median Household Size in Truckee
The median household size in Truckee is 2.66 persons per household, with single female/mother households (311 | 5.0%) accounting for the largest median household size of 3.38 persons per household. non-family households (1,902 | 30.3%) represent the smallest median household size with 1.55 persons per household.
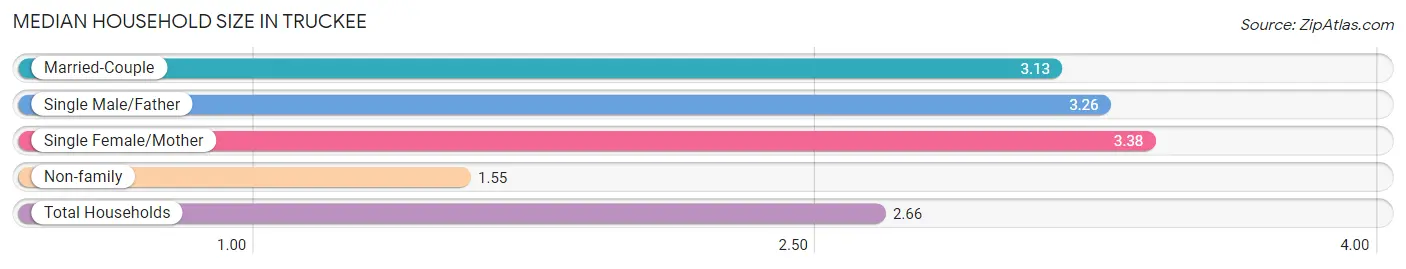
| Household Type | # Households | Household Size |
| Married-Couple | 3,870 (61.6%) | 3.13 |
| Single Male/Father | 196 (3.1%) | 3.26 |
| Single Female/Mother | 311 (5.0%) | 3.38 |
| Non-family | 1,902 (30.3%) | 1.55 |
| Total Households | 6,279 (100.0%) | 2.66 |
Household Size by Marriage Status in Truckee
Out of a total of 6,279 households in Truckee, 4,377 (69.7%) are family households, while 1,902 (30.3%) are nonfamily households. The most numerous type of family households are 2-person households, comprising 2,029, and the most common type of nonfamily households are 1-person households, comprising 1,350.
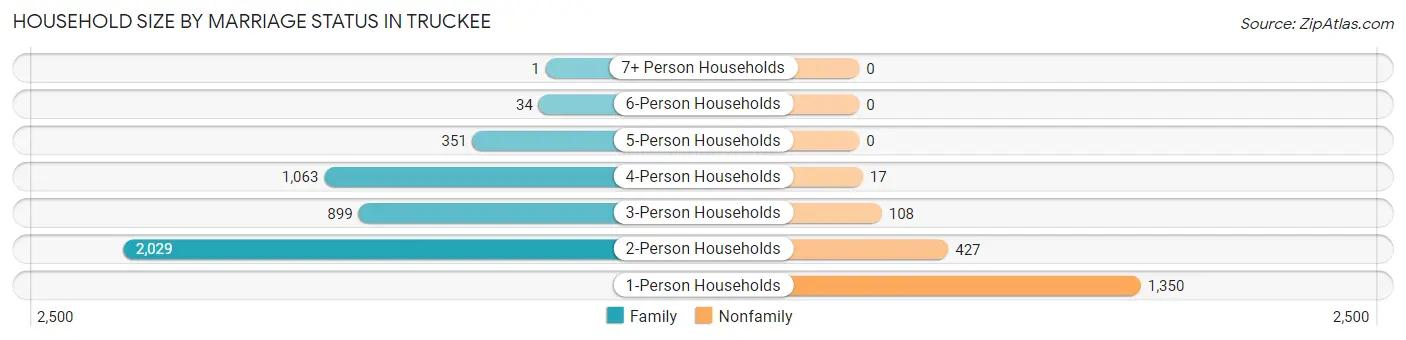
| Household Size | Family Households | Nonfamily Households |
| 1-Person Households | - | 1,350 (21.5%) |
| 2-Person Households | 2,029 (32.3%) | 427 (6.8%) |
| 3-Person Households | 899 (14.3%) | 108 (1.7%) |
| 4-Person Households | 1,063 (16.9%) | 17 (0.3%) |
| 5-Person Households | 351 (5.6%) | 0 (0.0%) |
| 6-Person Households | 34 (0.5%) | 0 (0.0%) |
| 7+ Person Households | 1 (0.0%) | 0 (0.0%) |
| Total | 4,377 (69.7%) | 1,902 (30.3%) |
Female Fertility in Truckee
Fertility by Age in Truckee
Average fertility rate in Truckee is 55.0 births per 1,000 women. Women in the age bracket of 20 to 34 years have the highest fertility rate with 94.0 births per 1,000 women. Women in the age bracket of 20 to 34 years acount for 49.3% of all women with births.
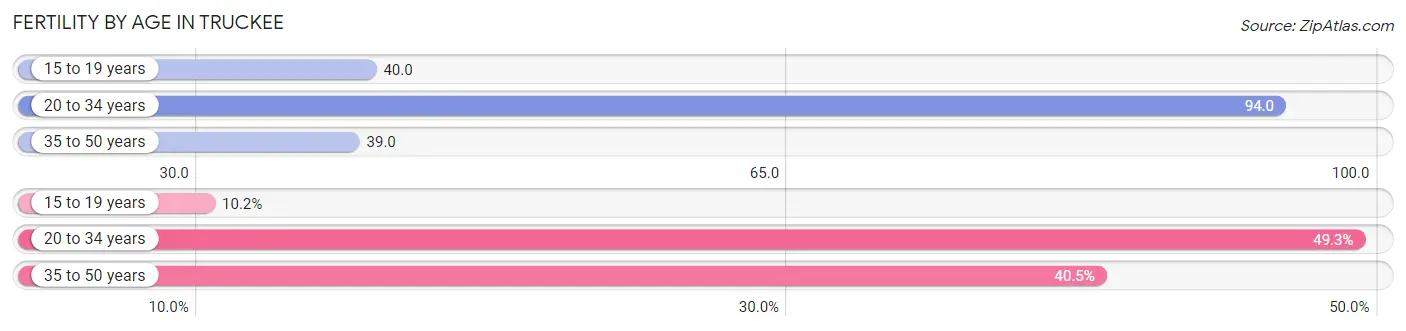
| Age Bracket | Women with Births | Births / 1,000 Women |
| 15 to 19 years | 21 (10.2%) | 40.0 |
| 20 to 34 years | 101 (49.3%) | 94.0 |
| 35 to 50 years | 83 (40.5%) | 39.0 |
| Total | 205 (100.0%) | 55.0 |
Fertility by Age by Marriage Status in Truckee
81.0% of women with births (205) in Truckee are married. The highest percentage of unmarried women with births falls into 15 to 19 years age bracket with 100.0% of them unmarried at the time of birth, while the lowest percentage of unmarried women with births belong to 35 to 50 years age bracket with 0.0% of them unmarried.
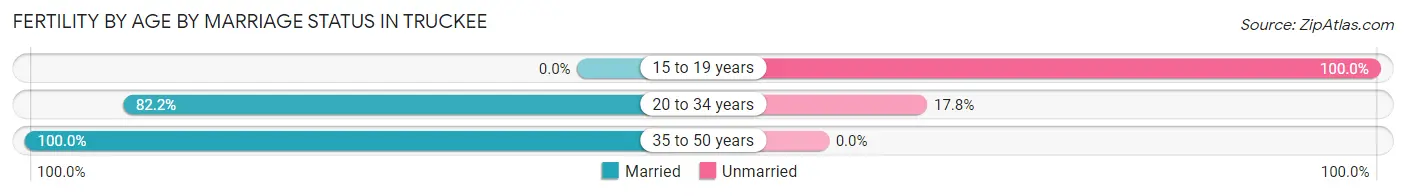
| Age Bracket | Married | Unmarried |
| 15 to 19 years | 0 (0.0%) | 21 (100.0%) |
| 20 to 34 years | 83 (82.2%) | 18 (17.8%) |
| 35 to 50 years | 83 (100.0%) | 0 (0.0%) |
| Total | 166 (81.0%) | 39 (19.0%) |
Fertility by Education in Truckee
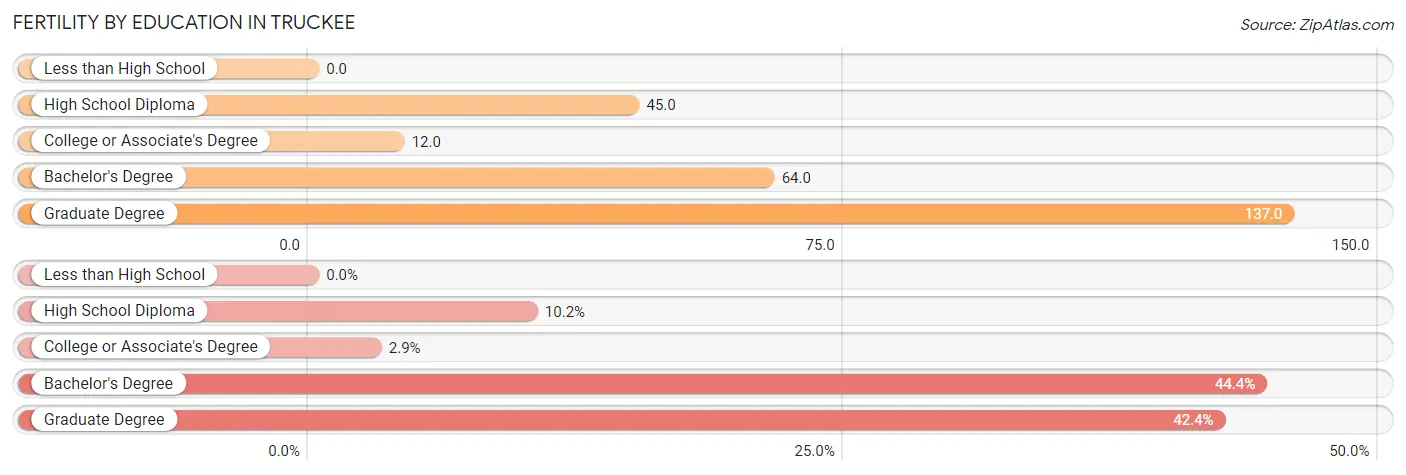
| Educational Attainment | Women with Births | Births / 1,000 Women |
| Less than High School | 0 (0.0%) | 0.0 |
| High School Diploma | 21 (10.2%) | 45.0 |
| College or Associate's Degree | 6 (2.9%) | 12.0 |
| Bachelor's Degree | 91 (44.4%) | 64.0 |
| Graduate Degree | 87 (42.4%) | 137.0 |
| Total | 205 (100.0%) | 55.0 |
Fertility by Education by Marriage Status in Truckee
19.0% of women with births in Truckee are unmarried. Women with the educational attainment of college or associate's degree are most likely to be married with 100.0% of them married at childbirth, while women with the educational attainment of high school diploma are least likely to be married with 100.0% of them unmarried at childbirth.
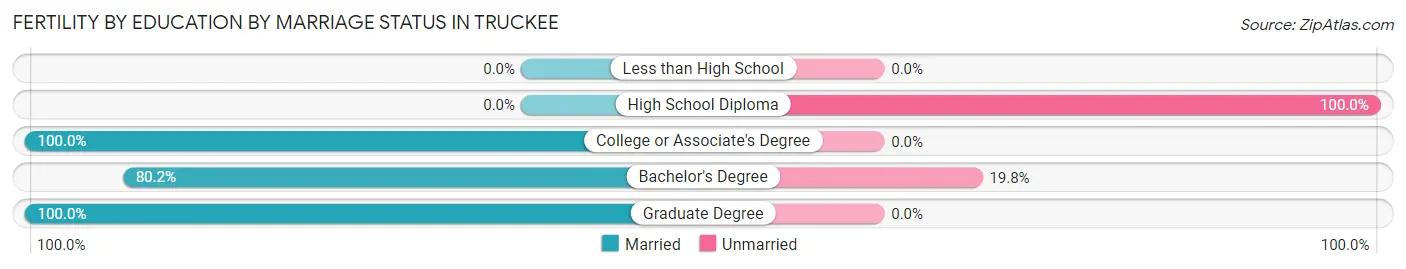
| Educational Attainment | Married | Unmarried |
| Less than High School | 0 (0.0%) | 0 (0.0%) |
| High School Diploma | 0 (0.0%) | 21 (100.0%) |
| College or Associate's Degree | 6 (100.0%) | 0 (0.0%) |
| Bachelor's Degree | 73 (80.2%) | 18 (19.8%) |
| Graduate Degree | 87 (100.0%) | 0 (0.0%) |
| Total | 166 (81.0%) | 39 (19.0%) |
Employment Characteristics in Truckee
Employment by Class of Employer in Truckee
Among the 8,339 employed individuals in Truckee, private company employees (5,054 | 60.6%), self-employed (not incorporated) (985 | 11.8%), and not-for-profit organizations (660 | 7.9%) make up the most common classes of employment.
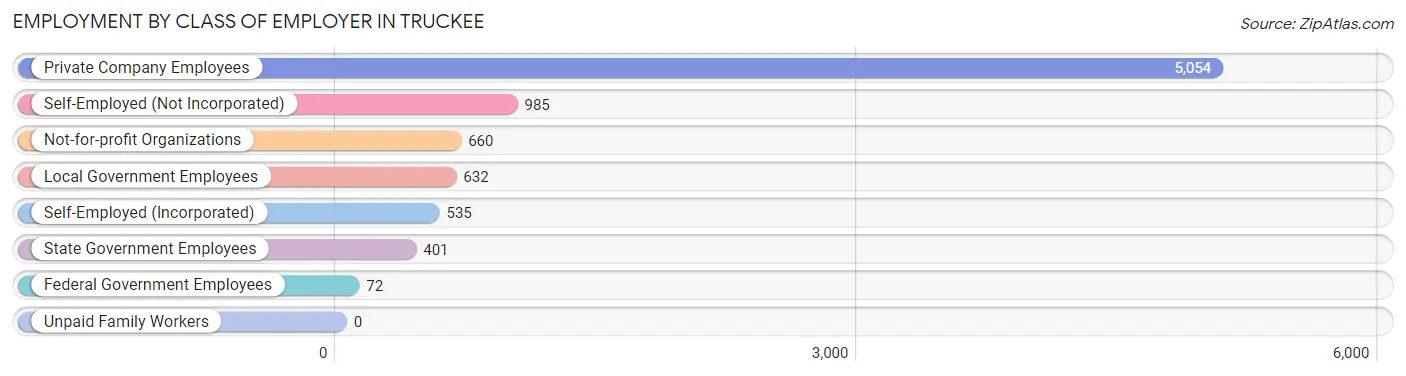
| Employer Class | # Employees | % Employees |
| Private Company Employees | 5,054 | 60.6% |
| Self-Employed (Incorporated) | 535 | 6.4% |
| Self-Employed (Not Incorporated) | 985 | 11.8% |
| Not-for-profit Organizations | 660 | 7.9% |
| Local Government Employees | 632 | 7.6% |
| State Government Employees | 401 | 4.8% |
| Federal Government Employees | 72 | 0.9% |
| Unpaid Family Workers | 0 | 0.0% |
| Total | 8,339 | 100.0% |
Employment Status by Age in Truckee
According to the labor force statistics for Truckee, out of the total population over 16 years of age (13,551), 66.6% or 9,025 individuals are in the labor force, with 5.7% or 514 of them unemployed. The age group with the highest labor force participation rate is 25 to 29 years, with 88.5% or 835 individuals in the labor force. Within the labor force, the 75 years and over age range has the highest percentage of unemployed individuals, with 29.0% or 9 of them being unemployed.
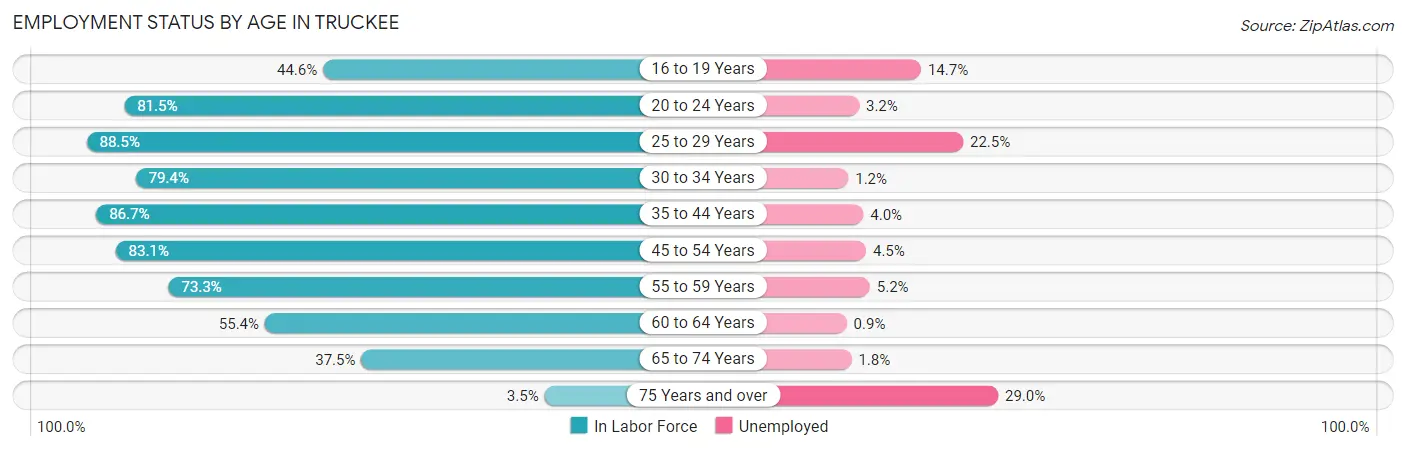
| Age Bracket | In Labor Force | Unemployed |
| 16 to 19 Years | 327 (44.6%) | 48 (14.7%) |
| 20 to 24 Years | 498 (81.5%) | 16 (3.2%) |
| 25 to 29 Years | 835 (88.5%) | 188 (22.5%) |
| 30 to 34 Years | 739 (79.4%) | 9 (1.2%) |
| 35 to 44 Years | 2,252 (86.7%) | 90 (4.0%) |
| 45 to 54 Years | 2,081 (83.1%) | 94 (4.5%) |
| 55 to 59 Years | 792 (73.3%) | 41 (5.2%) |
| 60 to 64 Years | 766 (55.4%) | 7 (0.9%) |
| 65 to 74 Years | 707 (37.5%) | 13 (1.8%) |
| 75 Years and over | 31 (3.5%) | 9 (29.0%) |
| Total | 9,025 (66.6%) | 514 (5.7%) |
Employment Status by Educational Attainment in Truckee
According to labor force statistics for Truckee, 79.1% of individuals (7,466) out of the total population between 25 and 64 years of age (9,439) are in the labor force, with 5.7% or 426 of them being unemployed. The group with the highest labor force participation rate are those with the educational attainment of bachelor's degree or higher, with 81.0% or 4,532 individuals in the labor force. Within the labor force, individuals with college / associate degree education have the highest percentage of unemployment, with 9.5% or 147 of them being unemployed.
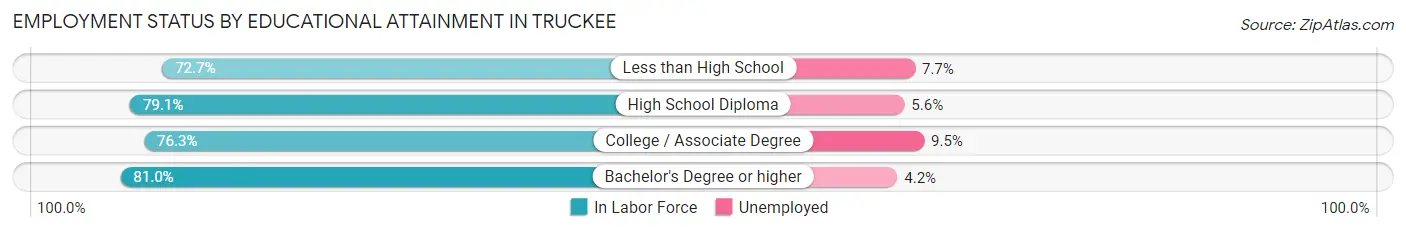
| Educational Attainment | In Labor Force | Unemployed |
| Less than High School | 558 (72.7%) | 59 (7.7%) |
| High School Diploma | 825 (79.1%) | 58 (5.6%) |
| College / Associate Degree | 1,551 (76.3%) | 193 (9.5%) |
| Bachelor's Degree or higher | 4,532 (81.0%) | 235 (4.2%) |
| Total | 7,466 (79.1%) | 538 (5.7%) |
Employment Occupations by Sex in Truckee
Management, Business, Science and Arts Occupations
The most common Management, Business, Science and Arts occupations in Truckee are Management (1,468 | 17.2%), Community & Social Service (1,110 | 13.0%), Business & Financial (692 | 8.1%), Health Diagnosing & Treating (653 | 7.7%), and Health Technologists (653 | 7.7%).
Management, Business, Science and Arts Occupations by Sex
Within the Management, Business, Science and Arts occupations in Truckee, the most male-oriented occupations are Computers & Mathematics (81.5%), Computers, Engineering & Science (68.8%), and Architecture & Engineering (63.4%), while the most female-oriented occupations are Education, Arts & Media (75.0%), Education Instruction & Library (74.7%), and Legal Services & Support (69.2%).
| Occupation | Male | Female |
| Management | 782 (53.3%) | 686 (46.7%) |
| Business & Financial | 412 (59.5%) | 280 (40.5%) |
| Computers, Engineering & Science | 436 (68.8%) | 198 (31.2%) |
| Computers & Mathematics | 233 (81.5%) | 53 (18.5%) |
| Architecture & Engineering | 147 (63.4%) | 85 (36.6%) |
| Life, Physical & Social Science | 56 (48.3%) | 60 (51.7%) |
| Community & Social Service | 370 (33.3%) | 740 (66.7%) |
| Education, Arts & Media | 19 (25.0%) | 57 (75.0%) |
| Legal Services & Support | 52 (30.8%) | 117 (69.2%) |
| Education Instruction & Library | 116 (25.3%) | 342 (74.7%) |
| Arts, Media & Entertainment | 183 (45.0%) | 224 (55.0%) |
| Health Diagnosing & Treating | 276 (42.3%) | 377 (57.7%) |
| Health Technologists | 276 (42.3%) | 377 (57.7%) |
| Total (Category) | 2,276 (49.9%) | 2,281 (50.0%) |
| Total (Overall) | 4,786 (56.2%) | 3,727 (43.8%) |
Services Occupations
The most common Services occupations in Truckee are Food Preparation & Serving (436 | 5.1%), Cleaning & Maintenance (373 | 4.4%), Security & Protection (175 | 2.1%), Firefighting & Prevention (140 | 1.6%), and Healthcare Support (109 | 1.3%).
Services Occupations by Sex
Within the Services occupations in Truckee, the most male-oriented occupations are Law Enforcement (100.0%), Security & Protection (63.4%), and Firefighting & Prevention (54.3%), while the most female-oriented occupations are Personal Care & Service (89.2%), Healthcare Support (82.6%), and Food Preparation & Serving (64.9%).
| Occupation | Male | Female |
| Healthcare Support | 19 (17.4%) | 90 (82.6%) |
| Security & Protection | 111 (63.4%) | 64 (36.6%) |
| Firefighting & Prevention | 76 (54.3%) | 64 (45.7%) |
| Law Enforcement | 35 (100.0%) | 0 (0.0%) |
| Food Preparation & Serving | 153 (35.1%) | 283 (64.9%) |
| Cleaning & Maintenance | 177 (47.4%) | 196 (52.5%) |
| Personal Care & Service | 10 (10.7%) | 83 (89.2%) |
| Total (Category) | 470 (39.6%) | 716 (60.4%) |
| Total (Overall) | 4,786 (56.2%) | 3,727 (43.8%) |
Sales and Office Occupations
The most common Sales and Office occupations in Truckee are Sales & Related (937 | 11.0%), and Office & Administration (526 | 6.2%).

Sales and Office Occupations by Sex
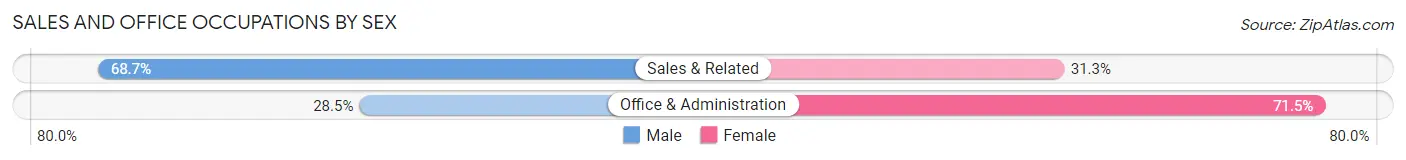
| Occupation | Male | Female |
| Sales & Related | 644 (68.7%) | 293 (31.3%) |
| Office & Administration | 150 (28.5%) | 376 (71.5%) |
| Total (Category) | 794 (54.3%) | 669 (45.7%) |
| Total (Overall) | 4,786 (56.2%) | 3,727 (43.8%) |
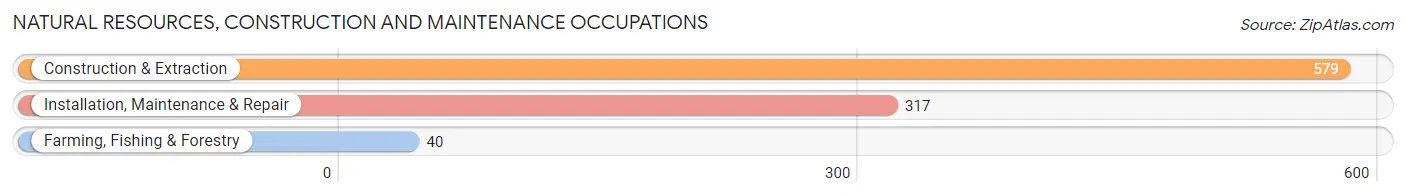
Natural Resources, Construction and Maintenance Occupations
The most common Natural Resources, Construction and Maintenance occupations in Truckee are Construction & Extraction (579 | 6.8%), Installation, Maintenance & Repair (317 | 3.7%), and Farming, Fishing & Forestry (40 | 0.5%).
Natural Resources, Construction and Maintenance Occupations by Sex
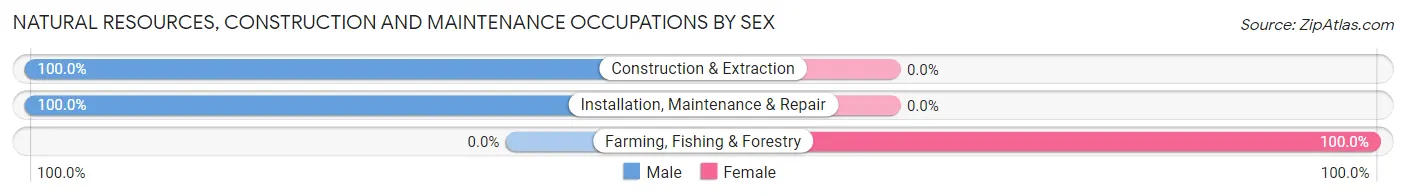
| Occupation | Male | Female |
| Farming, Fishing & Forestry | 0 (0.0%) | 40 (100.0%) |
| Construction & Extraction | 579 (100.0%) | 0 (0.0%) |
| Installation, Maintenance & Repair | 317 (100.0%) | 0 (0.0%) |
| Total (Category) | 896 (95.7%) | 40 (4.3%) |
| Total (Overall) | 4,786 (56.2%) | 3,727 (43.8%) |
Production, Transportation and Moving Occupations
The most common Production, Transportation and Moving occupations in Truckee are Production (179 | 2.1%), Transportation (111 | 1.3%), and Material Moving (81 | 0.9%).
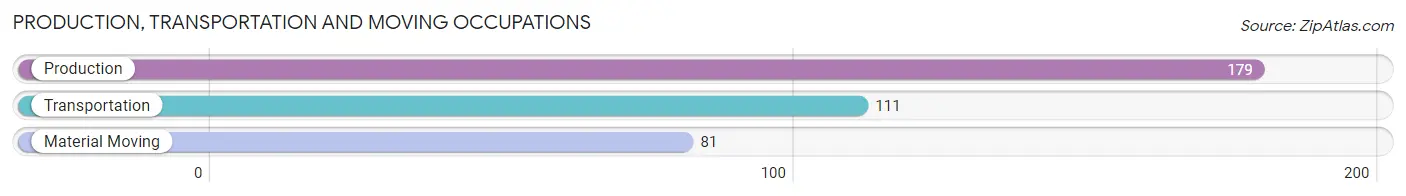
Production, Transportation and Moving Occupations by Sex
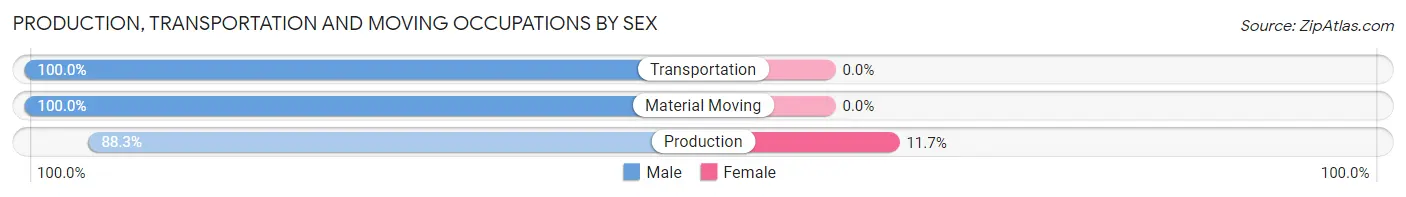
| Occupation | Male | Female |
| Production | 158 (88.3%) | 21 (11.7%) |
| Transportation | 111 (100.0%) | 0 (0.0%) |
| Material Moving | 81 (100.0%) | 0 (0.0%) |
| Total (Category) | 350 (94.3%) | 21 (5.7%) |
| Total (Overall) | 4,786 (56.2%) | 3,727 (43.8%) |
Employment Industries by Sex in Truckee
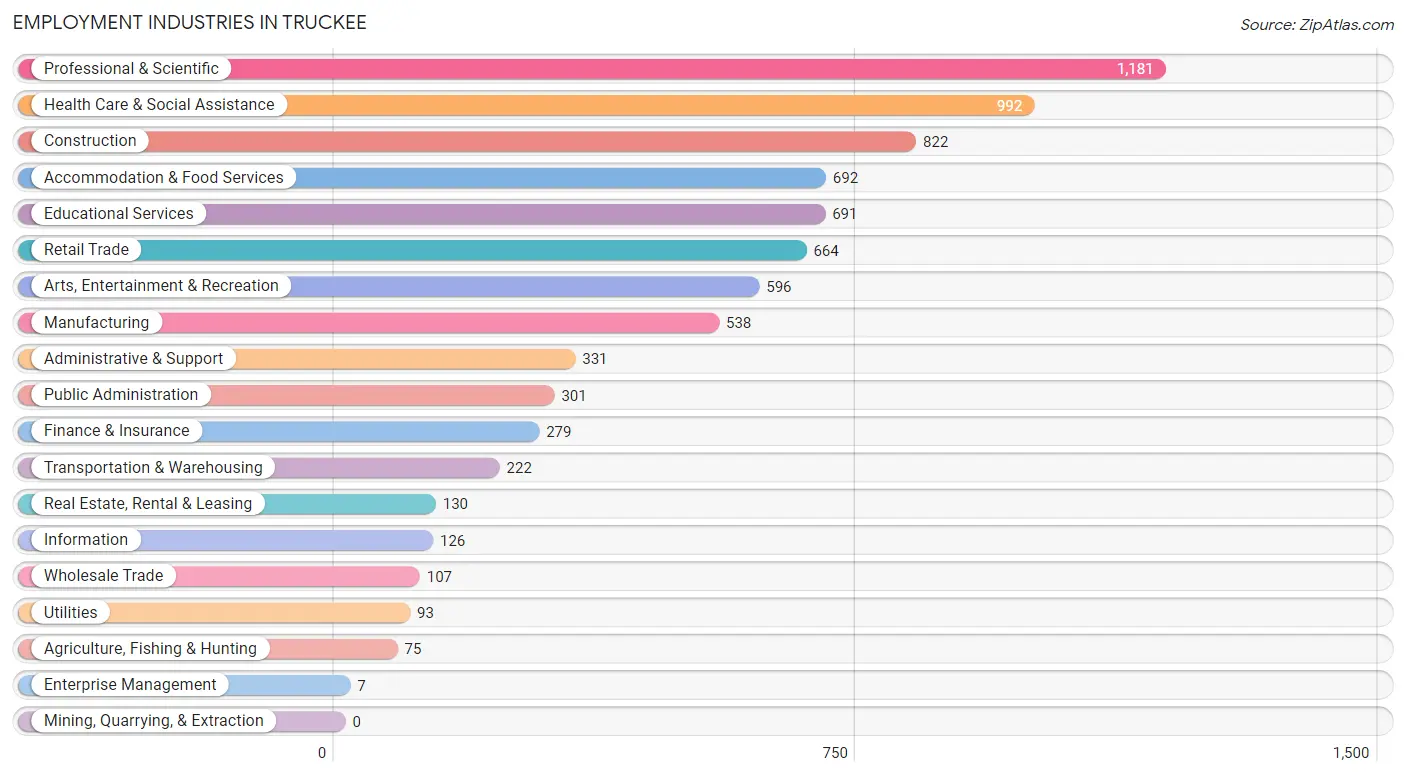
Employment Industries in Truckee
The major employment industries in Truckee include Professional & Scientific (1,181 | 13.9%), Health Care & Social Assistance (992 | 11.7%), Construction (822 | 9.7%), Accommodation & Food Services (692 | 8.1%), and Educational Services (691 | 8.1%).
Employment Industries by Sex in Truckee
The Truckee industries that see more men than women are Enterprise Management (100.0%), Construction (90.3%), and Utilities (77.4%), whereas the industries that tend to have a higher number of women are Educational Services (73.8%), Accommodation & Food Services (63.9%), and Health Care & Social Assistance (58.8%).
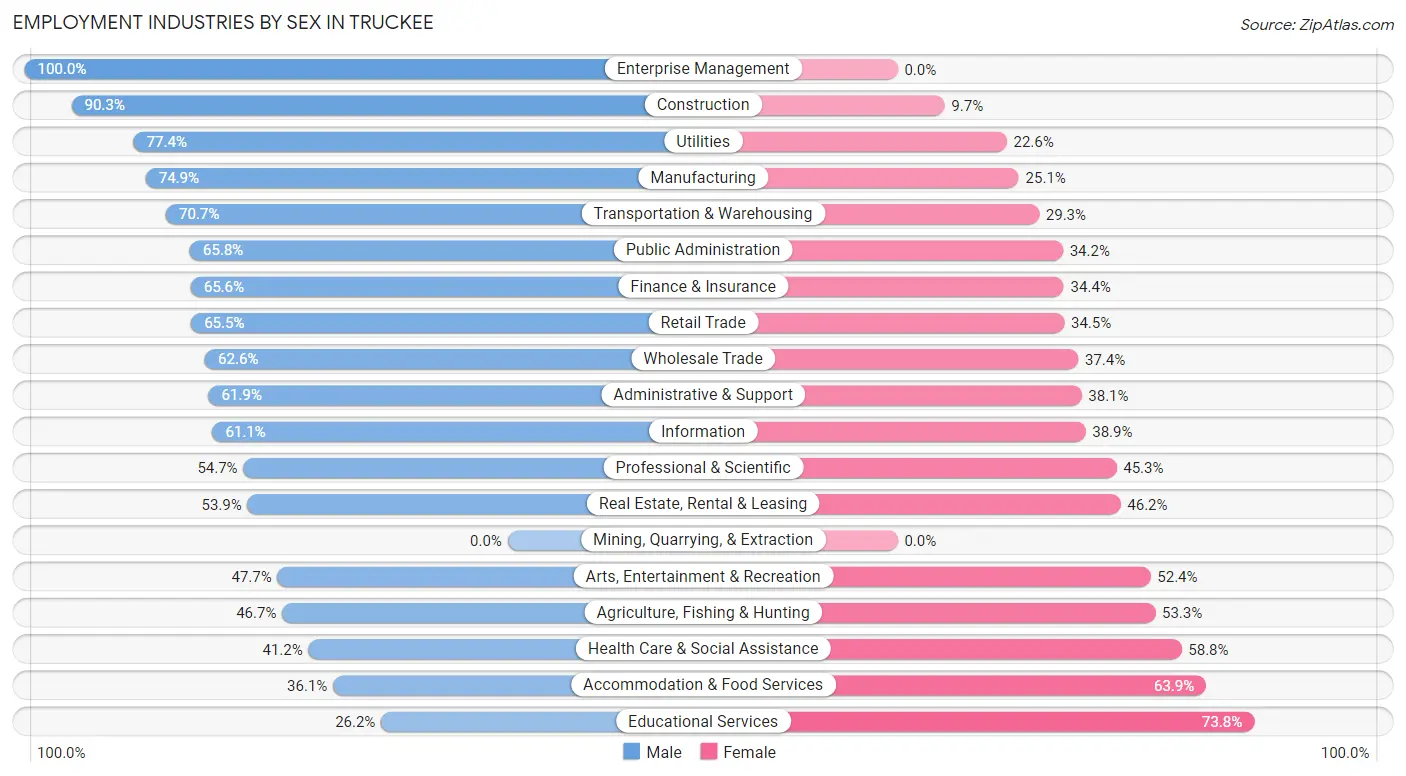
| Industry | Male | Female |
| Agriculture, Fishing & Hunting | 35 (46.7%) | 40 (53.3%) |
| Mining, Quarrying, & Extraction | 0 (0.0%) | 0 (0.0%) |
| Construction | 742 (90.3%) | 80 (9.7%) |
| Manufacturing | 403 (74.9%) | 135 (25.1%) |
| Wholesale Trade | 67 (62.6%) | 40 (37.4%) |
| Retail Trade | 435 (65.5%) | 229 (34.5%) |
| Transportation & Warehousing | 157 (70.7%) | 65 (29.3%) |
| Utilities | 72 (77.4%) | 21 (22.6%) |
| Information | 77 (61.1%) | 49 (38.9%) |
| Finance & Insurance | 183 (65.6%) | 96 (34.4%) |
| Real Estate, Rental & Leasing | 70 (53.8%) | 60 (46.2%) |
| Professional & Scientific | 646 (54.7%) | 535 (45.3%) |
| Enterprise Management | 7 (100.0%) | 0 (0.0%) |
| Administrative & Support | 205 (61.9%) | 126 (38.1%) |
| Educational Services | 181 (26.2%) | 510 (73.8%) |
| Health Care & Social Assistance | 409 (41.2%) | 583 (58.8%) |
| Arts, Entertainment & Recreation | 284 (47.6%) | 312 (52.3%) |
| Accommodation & Food Services | 250 (36.1%) | 442 (63.9%) |
| Public Administration | 198 (65.8%) | 103 (34.2%) |
| Total | 4,786 (56.2%) | 3,727 (43.8%) |
Education in Truckee
School Enrollment in Truckee
The most common levels of schooling among the 3,569 students in Truckee are high school (885 | 24.8%), elementary school (720 | 20.2%), and middle school (707 | 19.8%).
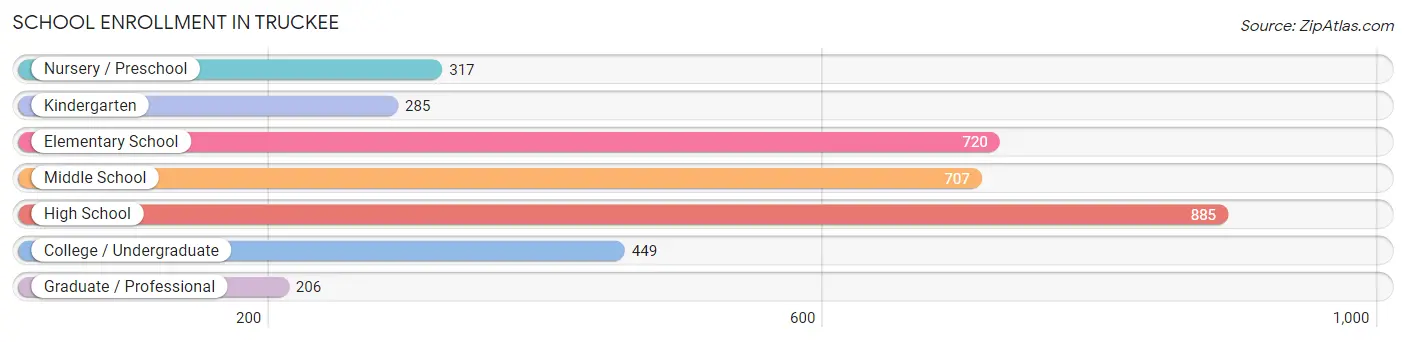
| School Level | # Students | % Students |
| Nursery / Preschool | 317 | 8.9% |
| Kindergarten | 285 | 8.0% |
| Elementary School | 720 | 20.2% |
| Middle School | 707 | 19.8% |
| High School | 885 | 24.8% |
| College / Undergraduate | 449 | 12.6% |
| Graduate / Professional | 206 | 5.8% |
| Total | 3,569 | 100.0% |
School Enrollment by Age by Funding Source in Truckee
Out of a total of 3,569 students who are enrolled in schools in Truckee, 785 (22.0%) attend a private institution, while the remaining 2,784 (78.0%) are enrolled in public schools. The age group of 20 to 24 year olds has the highest likelihood of being enrolled in private schools, with 94 (44.8% in the age bracket) enrolled. Conversely, the age group of 18 to 19 year olds has the lowest likelihood of being enrolled in a private school, with 200 (100.0% in the age bracket) attending a public institution.
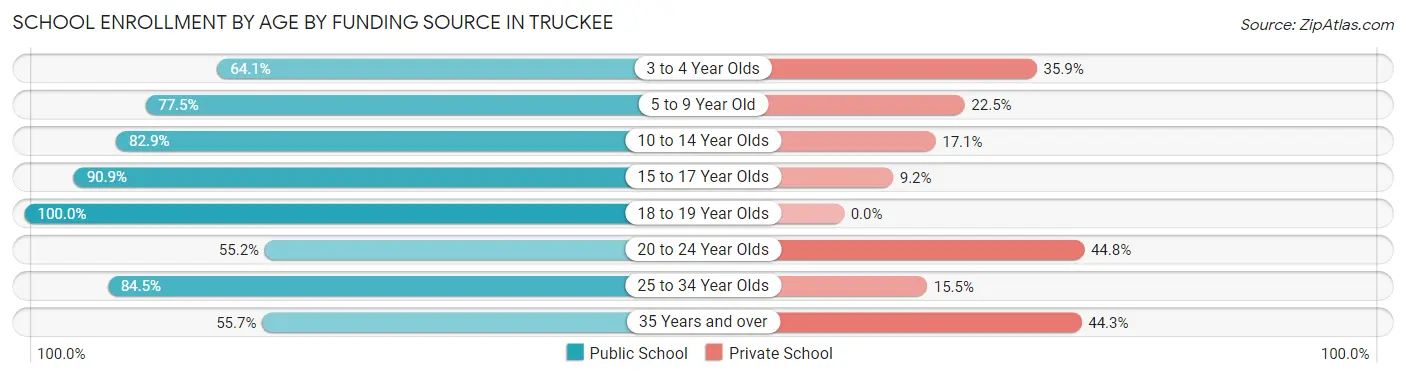
| Age Bracket | Public School | Private School |
| 3 to 4 Year Olds | 198 (64.1%) | 111 (35.9%) |
| 5 to 9 Year Old | 727 (77.5%) | 211 (22.5%) |
| 10 to 14 Year Olds | 846 (82.9%) | 174 (17.1%) |
| 15 to 17 Year Olds | 457 (90.8%) | 46 (9.1%) |
| 18 to 19 Year Olds | 200 (100.0%) | 0 (0.0%) |
| 20 to 24 Year Olds | 116 (55.2%) | 94 (44.8%) |
| 25 to 34 Year Olds | 71 (84.5%) | 13 (15.5%) |
| 35 Years and over | 170 (55.7%) | 135 (44.3%) |
| Total | 2,784 (78.0%) | 785 (22.0%) |
Educational Attainment by Field of Study in Truckee
Business (1,129 | 14.7%), social sciences (1,079 | 14.1%), engineering (724 | 9.5%), bio, nature & agricultural (664 | 8.7%), and science & technology (633 | 8.3%) are the most common fields of study among 7,653 individuals in Truckee who have obtained a bachelor's degree or higher.
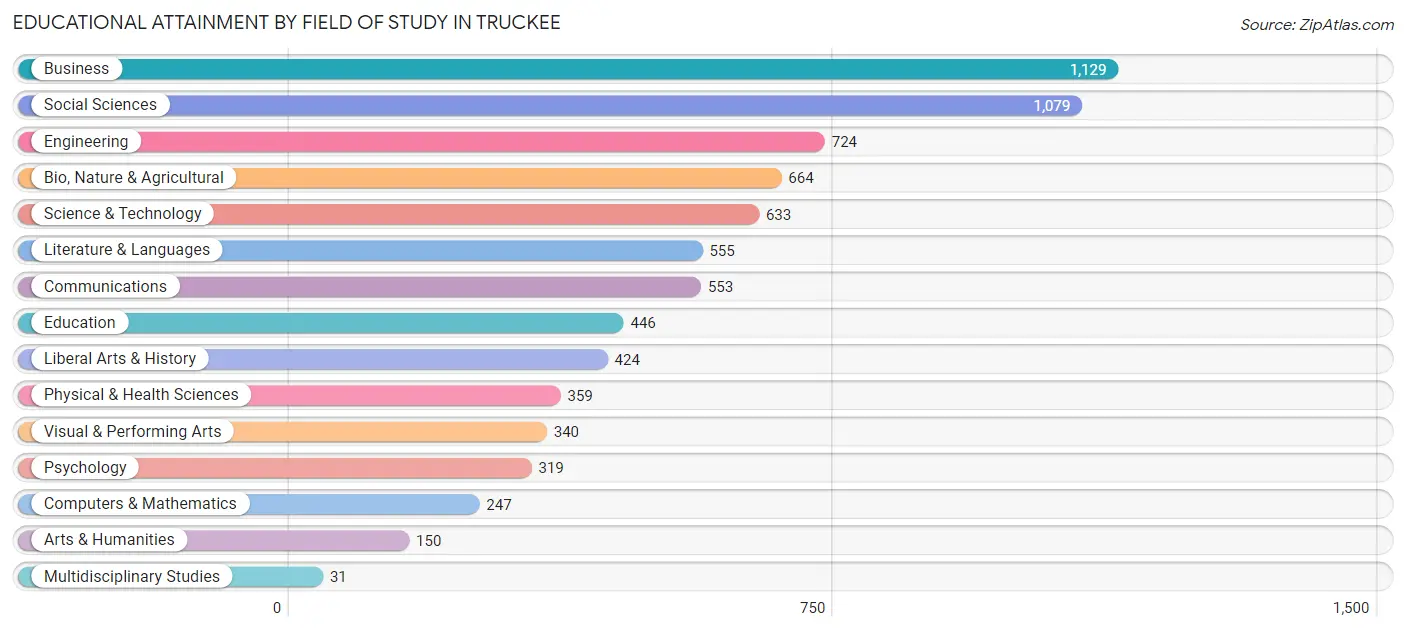
| Field of Study | # Graduates | % Graduates |
| Computers & Mathematics | 247 | 3.2% |
| Bio, Nature & Agricultural | 664 | 8.7% |
| Physical & Health Sciences | 359 | 4.7% |
| Psychology | 319 | 4.2% |
| Social Sciences | 1,079 | 14.1% |
| Engineering | 724 | 9.5% |
| Multidisciplinary Studies | 31 | 0.4% |
| Science & Technology | 633 | 8.3% |
| Business | 1,129 | 14.7% |
| Education | 446 | 5.8% |
| Literature & Languages | 555 | 7.2% |
| Liberal Arts & History | 424 | 5.5% |
| Visual & Performing Arts | 340 | 4.4% |
| Communications | 553 | 7.2% |
| Arts & Humanities | 150 | 2.0% |
| Total | 7,653 | 100.0% |
Transportation & Commute in Truckee
Vehicle Availability by Sex in Truckee
The most prevalent vehicle ownership categories in Truckee are males with 2 vehicles (2,149, accounting for 45.9%) and females with 2 vehicles (1,788, making up 59.2%).
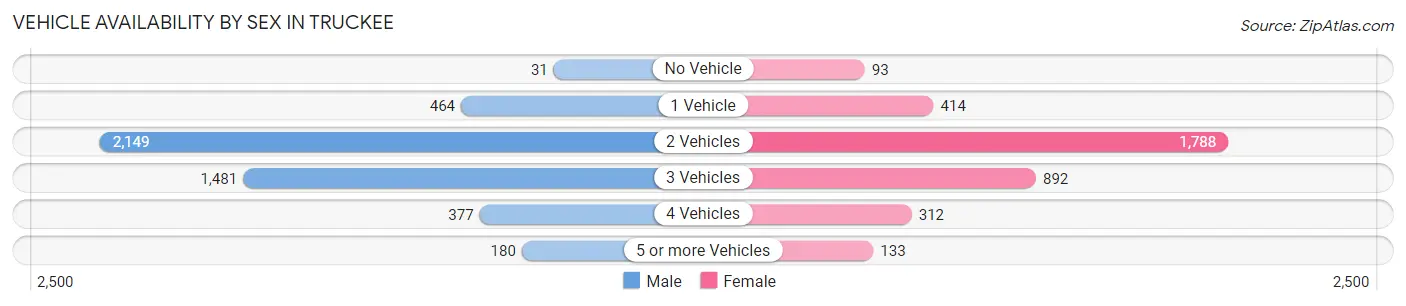
| Vehicles Available | Male | Female |
| No Vehicle | 31 (0.7%) | 93 (2.6%) |
| 1 Vehicle | 464 (9.9%) | 414 (11.4%) |
| 2 Vehicles | 2,149 (45.9%) | 1,788 (49.2%) |
| 3 Vehicles | 1,481 (31.6%) | 892 (24.6%) |
| 4 Vehicles | 377 (8.1%) | 312 (8.6%) |
| 5 or more Vehicles | 180 (3.8%) | 133 (3.7%) |
| Total | 4,682 (100.0%) | 3,632 (100.0%) |
Commute Time in Truckee
The most frequently occuring commute durations in Truckee are 10 to 14 minutes (1,243 commuters, 20.2%), 15 to 19 minutes (998 commuters, 16.2%), and 5 to 9 minutes (982 commuters, 16.0%).
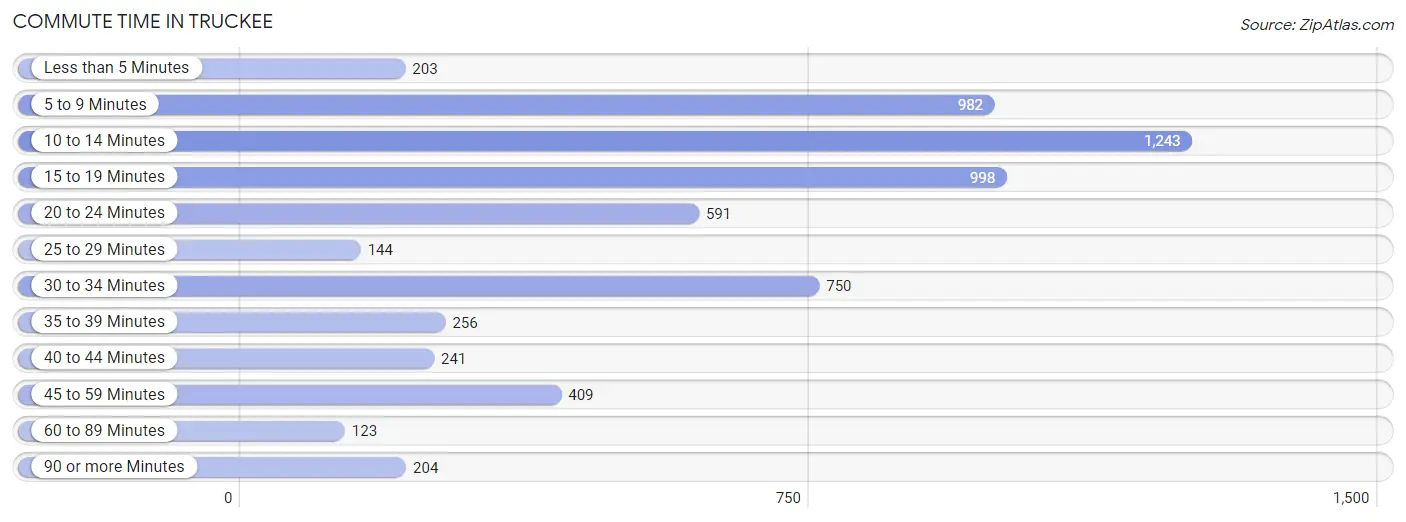
| Commute Time | # Commuters | % Commuters |
| Less than 5 Minutes | 203 | 3.3% |
| 5 to 9 Minutes | 982 | 16.0% |
| 10 to 14 Minutes | 1,243 | 20.2% |
| 15 to 19 Minutes | 998 | 16.2% |
| 20 to 24 Minutes | 591 | 9.6% |
| 25 to 29 Minutes | 144 | 2.3% |
| 30 to 34 Minutes | 750 | 12.2% |
| 35 to 39 Minutes | 256 | 4.2% |
| 40 to 44 Minutes | 241 | 3.9% |
| 45 to 59 Minutes | 409 | 6.7% |
| 60 to 89 Minutes | 123 | 2.0% |
| 90 or more Minutes | 204 | 3.3% |
Commute Time by Sex in Truckee
The most common commute times in Truckee are 15 to 19 minutes (647 commuters, 18.1%) for males and 10 to 14 minutes (599 commuters, 23.2%) for females.
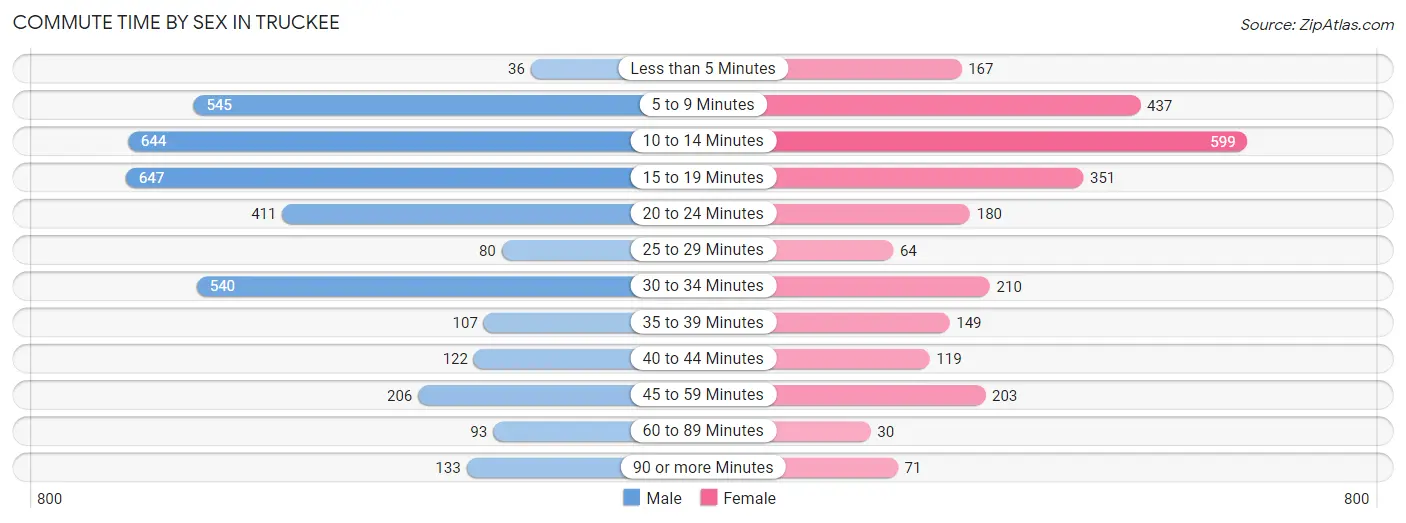
| Commute Time | Male | Female |
| Less than 5 Minutes | 36 (1.0%) | 167 (6.5%) |
| 5 to 9 Minutes | 545 (15.3%) | 437 (16.9%) |
| 10 to 14 Minutes | 644 (18.1%) | 599 (23.2%) |
| 15 to 19 Minutes | 647 (18.1%) | 351 (13.6%) |
| 20 to 24 Minutes | 411 (11.5%) | 180 (7.0%) |
| 25 to 29 Minutes | 80 (2.2%) | 64 (2.5%) |
| 30 to 34 Minutes | 540 (15.1%) | 210 (8.1%) |
| 35 to 39 Minutes | 107 (3.0%) | 149 (5.8%) |
| 40 to 44 Minutes | 122 (3.4%) | 119 (4.6%) |
| 45 to 59 Minutes | 206 (5.8%) | 203 (7.9%) |
| 60 to 89 Minutes | 93 (2.6%) | 30 (1.2%) |
| 90 or more Minutes | 133 (3.7%) | 71 (2.8%) |
Time of Departure to Work by Sex in Truckee
The most frequent times of departure to work in Truckee are 7:00 AM to 7:29 AM (805, 22.6%) for males and 7:30 AM to 7:59 AM (586, 22.7%) for females.
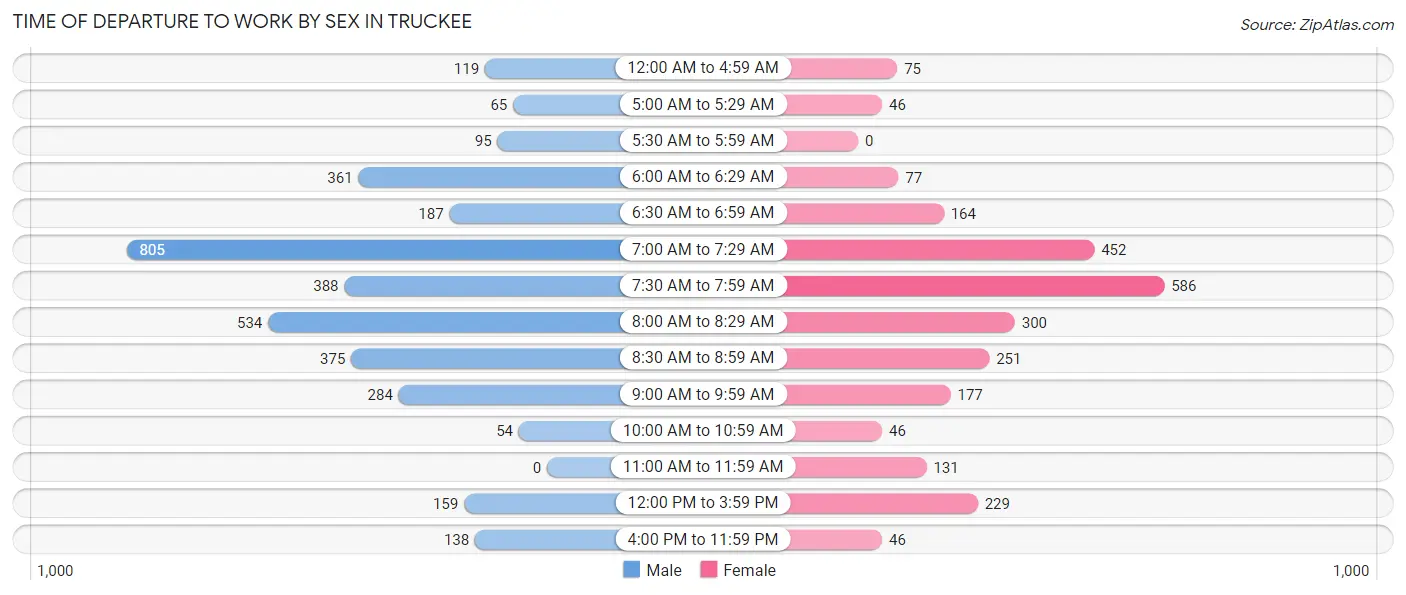
| Time of Departure | Male | Female |
| 12:00 AM to 4:59 AM | 119 (3.3%) | 75 (2.9%) |
| 5:00 AM to 5:29 AM | 65 (1.8%) | 46 (1.8%) |
| 5:30 AM to 5:59 AM | 95 (2.7%) | 0 (0.0%) |
| 6:00 AM to 6:29 AM | 361 (10.1%) | 77 (3.0%) |
| 6:30 AM to 6:59 AM | 187 (5.2%) | 164 (6.4%) |
| 7:00 AM to 7:29 AM | 805 (22.6%) | 452 (17.5%) |
| 7:30 AM to 7:59 AM | 388 (10.9%) | 586 (22.7%) |
| 8:00 AM to 8:29 AM | 534 (15.0%) | 300 (11.6%) |
| 8:30 AM to 8:59 AM | 375 (10.5%) | 251 (9.7%) |
| 9:00 AM to 9:59 AM | 284 (8.0%) | 177 (6.9%) |
| 10:00 AM to 10:59 AM | 54 (1.5%) | 46 (1.8%) |
| 11:00 AM to 11:59 AM | 0 (0.0%) | 131 (5.1%) |
| 12:00 PM to 3:59 PM | 159 (4.5%) | 229 (8.9%) |
| 4:00 PM to 11:59 PM | 138 (3.9%) | 46 (1.8%) |
| Total | 3,564 (100.0%) | 2,580 (100.0%) |
Housing Occupancy in Truckee
Occupancy by Ownership in Truckee
Of the total 6,279 dwellings in Truckee, owner-occupied units account for 4,866 (77.5%), while renter-occupied units make up 1,413 (22.5%).
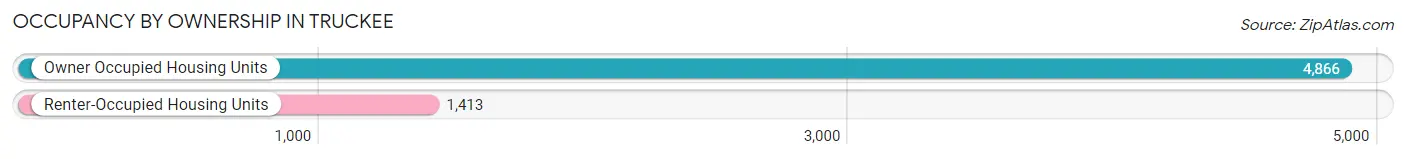
| Occupancy | # Housing Units | % Housing Units |
| Owner Occupied Housing Units | 4,866 | 77.5% |
| Renter-Occupied Housing Units | 1,413 | 22.5% |
| Total Occupied Housing Units | 6,279 | 100.0% |
Occupancy by Household Size in Truckee
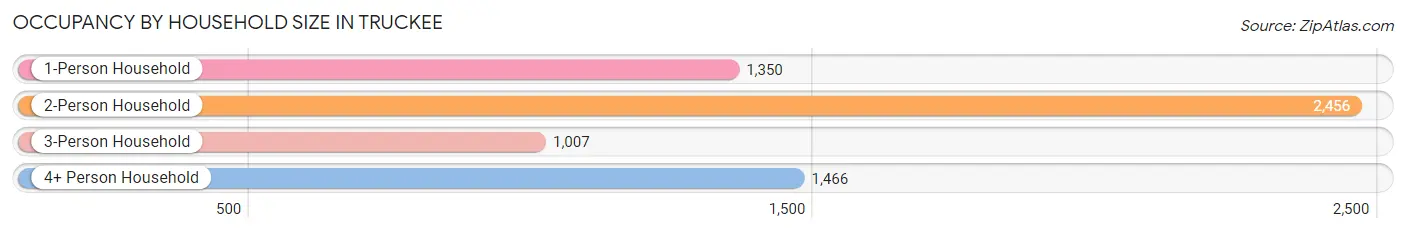
| Household Size | # Housing Units | % Housing Units |
| 1-Person Household | 1,350 | 21.5% |
| 2-Person Household | 2,456 | 39.1% |
| 3-Person Household | 1,007 | 16.0% |
| 4+ Person Household | 1,466 | 23.4% |
| Total Housing Units | 6,279 | 100.0% |
Occupancy by Ownership by Household Size in Truckee
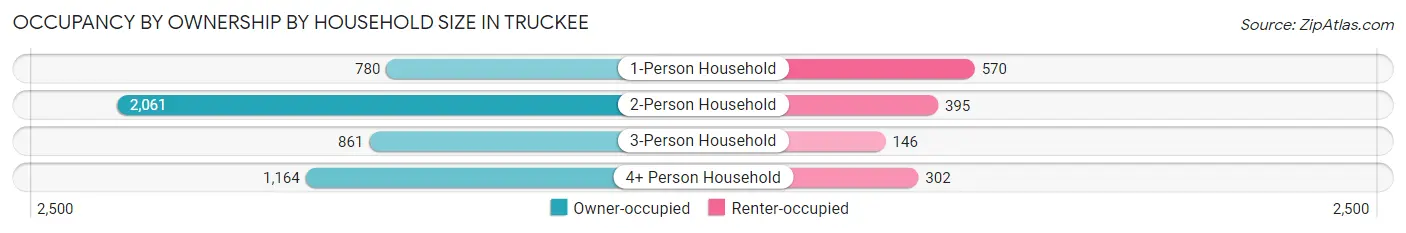
| Household Size | Owner-occupied | Renter-occupied |
| 1-Person Household | 780 (57.8%) | 570 (42.2%) |
| 2-Person Household | 2,061 (83.9%) | 395 (16.1%) |
| 3-Person Household | 861 (85.5%) | 146 (14.5%) |
| 4+ Person Household | 1,164 (79.4%) | 302 (20.6%) |
| Total Housing Units | 4,866 (77.5%) | 1,413 (22.5%) |
Occupancy by Educational Attainment in Truckee
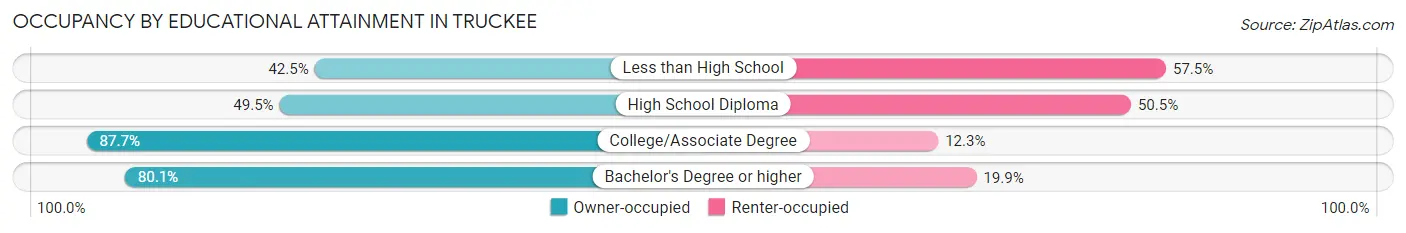
| Household Size | Owner-occupied | Renter-occupied |
| Less than High School | 148 (42.5%) | 200 (57.5%) |
| High School Diploma | 238 (49.5%) | 243 (50.5%) |
| College/Associate Degree | 1,318 (87.7%) | 185 (12.3%) |
| Bachelor's Degree or higher | 3,162 (80.1%) | 785 (19.9%) |
Occupancy by Age of Householder in Truckee
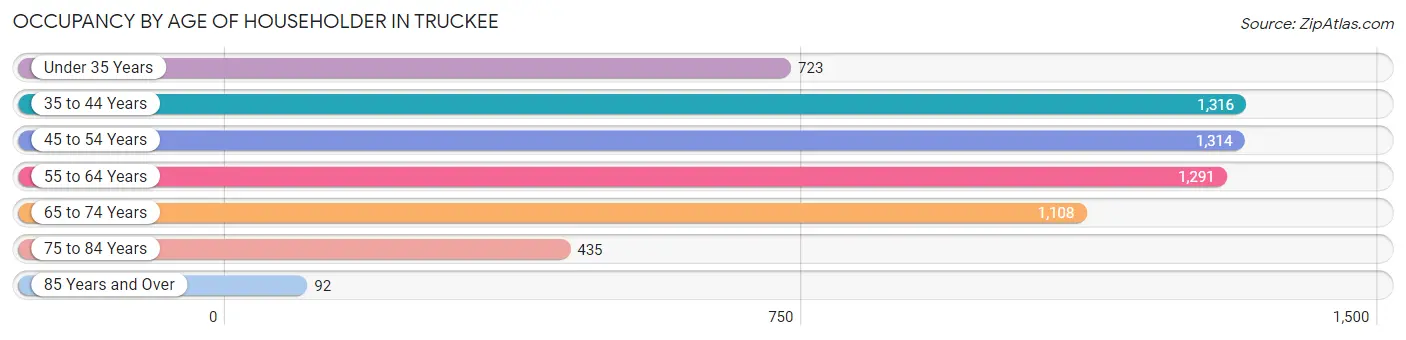
| Age Bracket | # Households | % Households |
| Under 35 Years | 723 | 11.5% |
| 35 to 44 Years | 1,316 | 21.0% |
| 45 to 54 Years | 1,314 | 20.9% |
| 55 to 64 Years | 1,291 | 20.6% |
| 65 to 74 Years | 1,108 | 17.6% |
| 75 to 84 Years | 435 | 6.9% |
| 85 Years and Over | 92 | 1.5% |
| Total | 6,279 | 100.0% |
Housing Finances in Truckee
Median Income by Occupancy in Truckee
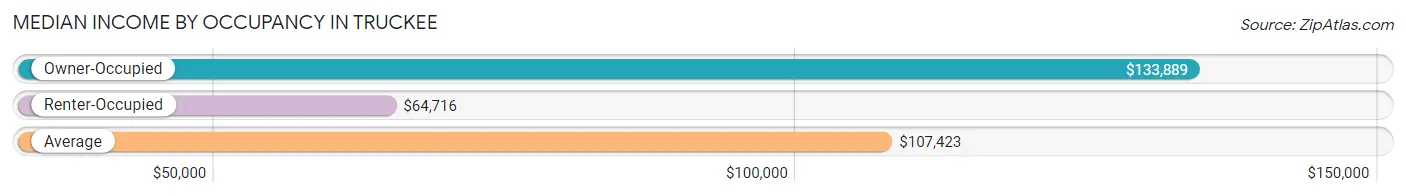
| Occupancy Type | # Households | Median Income |
| Owner-Occupied | 4,866 (77.5%) | $133,889 |
| Renter-Occupied | 1,413 (22.5%) | $64,716 |
| Average | 6,279 (100.0%) | $107,423 |
Occupancy by Householder Income Bracket in Truckee
| Income Bracket | Owner-occupied | Renter-occupied |
| Less than $5,000 | 180 (3.7%) | 94 (6.7%) |
| $5,000 to $9,999 | 5 (0.1%) | 0 (0.0%) |
| $10,000 to $14,999 | 53 (1.1%) | 52 (3.7%) |
| $15,000 to $19,999 | 41 (0.8%) | 77 (5.4%) |
| $20,000 to $24,999 | 58 (1.2%) | 77 (5.4%) |
| $25,000 to $34,999 | 183 (3.8%) | 88 (6.2%) |
| $35,000 to $49,999 | 273 (5.6%) | 109 (7.7%) |
| $50,000 to $74,999 | 499 (10.2%) | 274 (19.4%) |
| $75,000 to $99,999 | 602 (12.4%) | 181 (12.8%) |
| $100,000 to $149,999 | 748 (15.4%) | 238 (16.8%) |
| $150,000 or more | 2,224 (45.7%) | 223 (15.8%) |
| Total | 4,866 (100.0%) | 1,413 (100.0%) |
Monthly Housing Cost Tiers in Truckee
| Monthly Cost | Owner-occupied | Renter-occupied |
| Less than $300 | 11 (0.2%) | 17 (1.2%) |
| $300 to $499 | 20 (0.4%) | 57 (4.0%) |
| $500 to $799 | 496 (10.2%) | 63 (4.5%) |
| $800 to $999 | 199 (4.1%) | 169 (12.0%) |
| $1,000 to $1,499 | 531 (10.9%) | 188 (13.3%) |
| $1,500 to $1,999 | 405 (8.3%) | 160 (11.3%) |
| $2,000 to $2,499 | 514 (10.6%) | 270 (19.1%) |
| $2,500 to $2,999 | 835 (17.2%) | 117 (8.3%) |
| $3,000 or more | 1,855 (38.1%) | 312 (22.1%) |
| Total | 4,866 (100.0%) | 1,413 (100.0%) |
Physical Housing Characteristics in Truckee
Housing Structures in Truckee
| Structure Type | # Housing Units | % Housing Units |
| Single Unit, Detached | 5,201 | 82.8% |
| Single Unit, Attached | 93 | 1.5% |
| 2 Unit Apartments | 102 | 1.6% |
| 3 or 4 Unit Apartments | 234 | 3.7% |
| 5 to 9 Unit Apartments | 142 | 2.3% |
| 10 or more Apartments | 299 | 4.8% |
| Mobile Home / Other | 208 | 3.3% |
| Total | 6,279 | 100.0% |
Housing Structures by Occupancy in Truckee
| Structure Type | Owner-occupied | Renter-occupied |
| Single Unit, Detached | 4,407 (84.7%) | 794 (15.3%) |
| Single Unit, Attached | 72 (77.4%) | 21 (22.6%) |
| 2 Unit Apartments | 65 (63.7%) | 37 (36.3%) |
| 3 or 4 Unit Apartments | 107 (45.7%) | 127 (54.3%) |
| 5 to 9 Unit Apartments | 56 (39.4%) | 86 (60.6%) |
| 10 or more Apartments | 0 (0.0%) | 299 (100.0%) |
| Mobile Home / Other | 159 (76.4%) | 49 (23.6%) |
| Total | 4,866 (77.5%) | 1,413 (22.5%) |
Housing Structures by Number of Rooms in Truckee
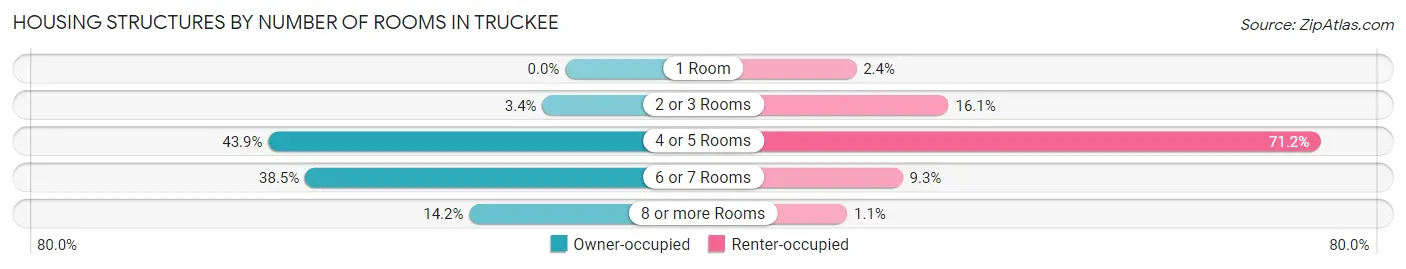
| Number of Rooms | Owner-occupied | Renter-occupied |
| 1 Room | 0 (0.0%) | 34 (2.4%) |
| 2 or 3 Rooms | 164 (3.4%) | 227 (16.1%) |
| 4 or 5 Rooms | 2,138 (43.9%) | 1,006 (71.2%) |
| 6 or 7 Rooms | 1,873 (38.5%) | 131 (9.3%) |
| 8 or more Rooms | 691 (14.2%) | 15 (1.1%) |
| Total | 4,866 (100.0%) | 1,413 (100.0%) |
Housing Structure by Heating Type in Truckee
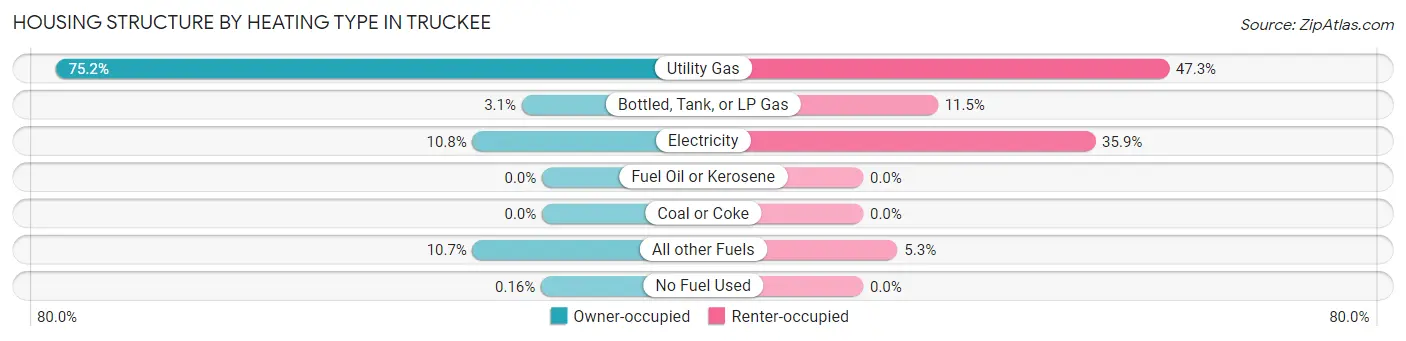
| Heating Type | Owner-occupied | Renter-occupied |
| Utility Gas | 3,660 (75.2%) | 668 (47.3%) |
| Bottled, Tank, or LP Gas | 153 (3.1%) | 163 (11.5%) |
| Electricity | 523 (10.7%) | 507 (35.9%) |
| Fuel Oil or Kerosene | 0 (0.0%) | 0 (0.0%) |
| Coal or Coke | 0 (0.0%) | 0 (0.0%) |
| All other Fuels | 522 (10.7%) | 75 (5.3%) |
| No Fuel Used | 8 (0.2%) | 0 (0.0%) |
| Total | 4,866 (100.0%) | 1,413 (100.0%) |
Household Vehicle Usage in Truckee
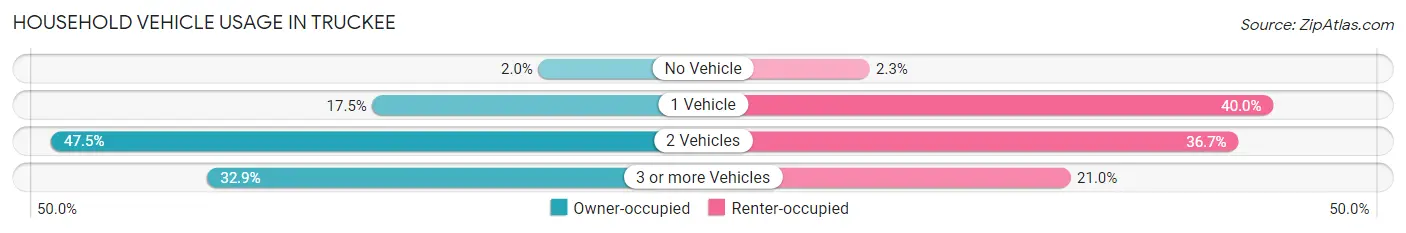
| Vehicles per Household | Owner-occupied | Renter-occupied |
| No Vehicle | 98 (2.0%) | 32 (2.3%) |
| 1 Vehicle | 852 (17.5%) | 565 (40.0%) |
| 2 Vehicles | 2,313 (47.5%) | 519 (36.7%) |
| 3 or more Vehicles | 1,603 (32.9%) | 297 (21.0%) |
| Total | 4,866 (100.0%) | 1,413 (100.0%) |
Real Estate & Mortgages in Truckee
Real Estate and Mortgage Overview in Truckee
| Characteristic | Without Mortgage | With Mortgage |
| Housing Units | 1,446 | 3,420 |
| Median Property Value | $726,400 | $810,200 |
| Median Household Income | $77,326 | $1,816 |
| Monthly Housing Costs | $1,015 | $1,826 |
| Real Estate Taxes | $4,528 | $54 |
Property Value by Mortgage Status in Truckee
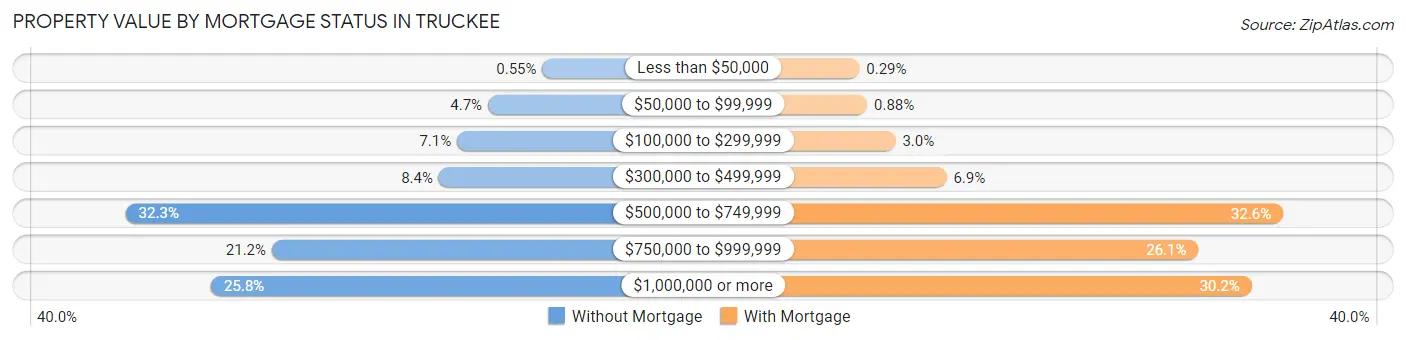
| Property Value | Without Mortgage | With Mortgage |
| Less than $50,000 | 8 (0.5%) | 10 (0.3%) |
| $50,000 to $99,999 | 68 (4.7%) | 30 (0.9%) |
| $100,000 to $299,999 | 102 (7.0%) | 104 (3.0%) |
| $300,000 to $499,999 | 122 (8.4%) | 237 (6.9%) |
| $500,000 to $749,999 | 467 (32.3%) | 1,114 (32.6%) |
| $750,000 to $999,999 | 306 (21.2%) | 893 (26.1%) |
| $1,000,000 or more | 373 (25.8%) | 1,032 (30.2%) |
| Total | 1,446 (100.0%) | 3,420 (100.0%) |
Household Income by Mortgage Status in Truckee
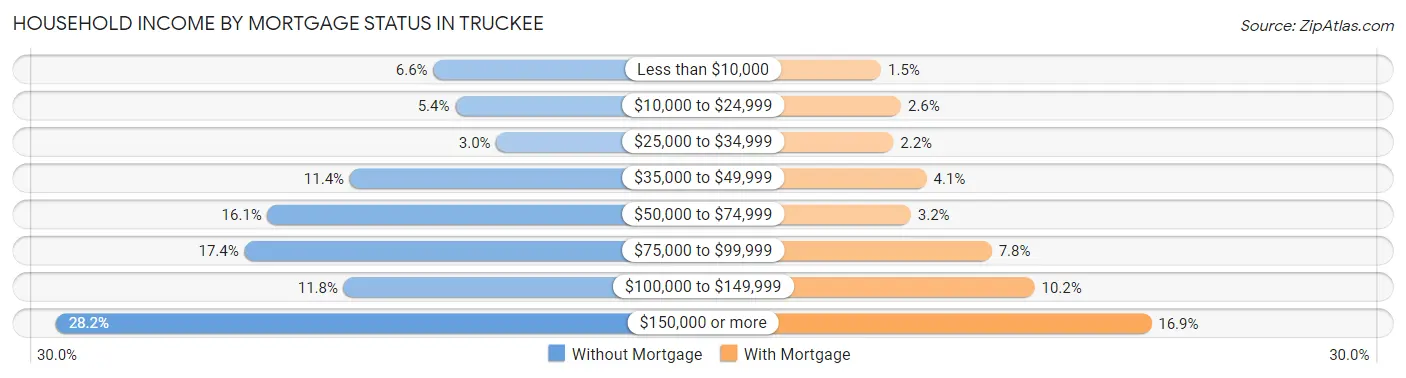
| Household Income | Without Mortgage | With Mortgage |
| Less than $10,000 | 96 (6.6%) | 50 (1.5%) |
| $10,000 to $24,999 | 78 (5.4%) | 89 (2.6%) |
| $25,000 to $34,999 | 44 (3.0%) | 74 (2.2%) |
| $35,000 to $49,999 | 165 (11.4%) | 139 (4.1%) |
| $50,000 to $74,999 | 233 (16.1%) | 108 (3.2%) |
| $75,000 to $99,999 | 252 (17.4%) | 266 (7.8%) |
| $100,000 to $149,999 | 170 (11.8%) | 350 (10.2%) |
| $150,000 or more | 408 (28.2%) | 578 (16.9%) |
| Total | 1,446 (100.0%) | 3,420 (100.0%) |
Property Value to Household Income Ratio in Truckee
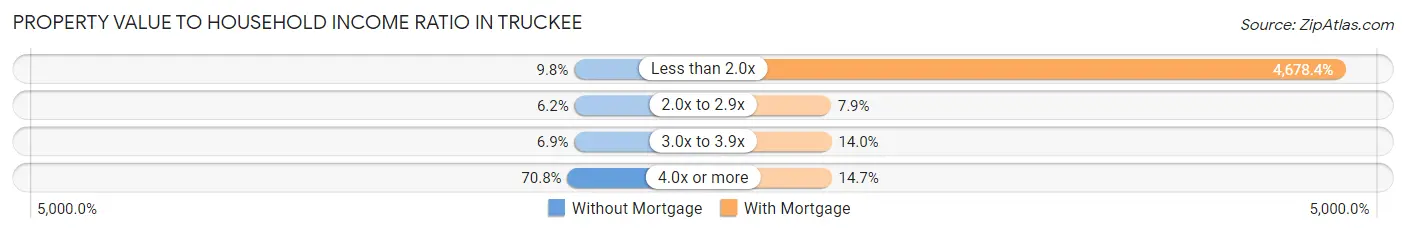
| Value-to-Income Ratio | Without Mortgage | With Mortgage |
| Less than 2.0x | 142 (9.8%) | 160,000 (4,678.4%) |
| 2.0x to 2.9x | 89 (6.1%) | 270 (7.9%) |
| 3.0x to 3.9x | 100 (6.9%) | 478 (14.0%) |
| 4.0x or more | 1,024 (70.8%) | 503 (14.7%) |
| Total | 1,446 (100.0%) | 3,420 (100.0%) |
Real Estate Taxes by Mortgage Status in Truckee
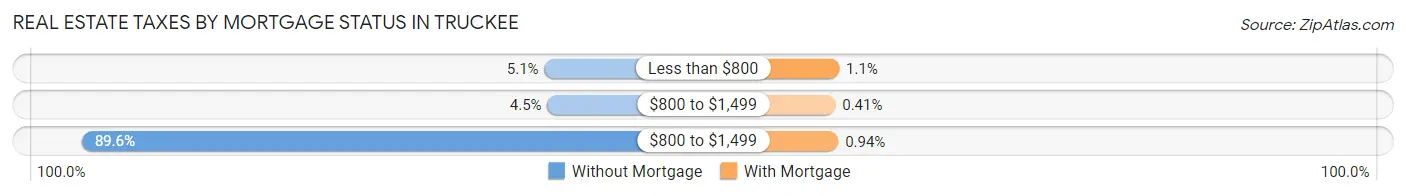
| Property Taxes | Without Mortgage | With Mortgage |
| Less than $800 | 73 (5.1%) | 38 (1.1%) |
| $800 to $1,499 | 65 (4.5%) | 14 (0.4%) |
| $800 to $1,499 | 1,295 (89.6%) | 32 (0.9%) |
| Total | 1,446 (100.0%) | 3,420 (100.0%) |
Health & Disability in Truckee
Health Insurance Coverage by Age in Truckee
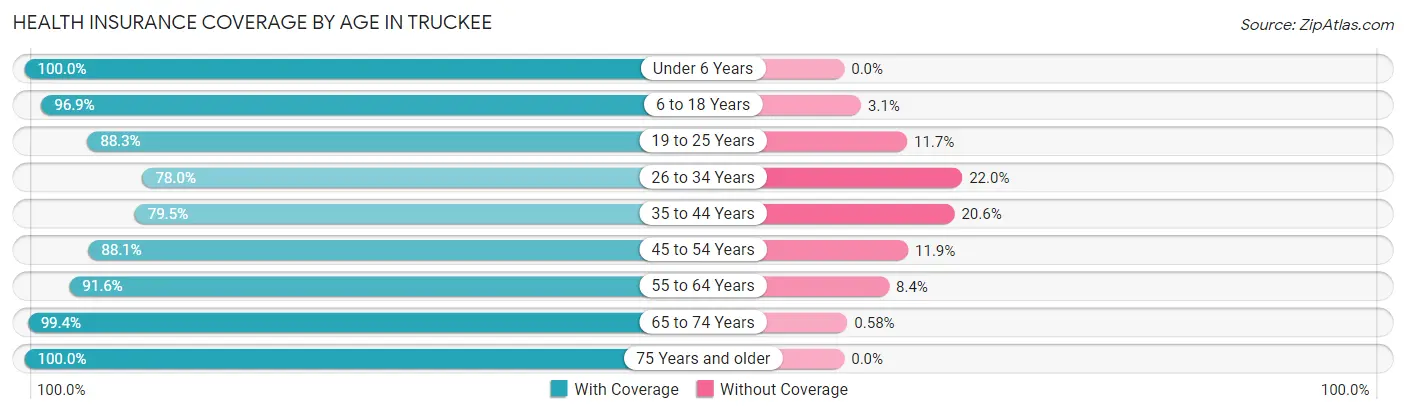
| Age Bracket | With Coverage | Without Coverage |
| Under 6 Years | 1,198 (100.0%) | 0 (0.0%) |
| 6 to 18 Years | 2,603 (96.9%) | 84 (3.1%) |
| 19 to 25 Years | 717 (88.3%) | 95 (11.7%) |
| 26 to 34 Years | 1,369 (78.0%) | 386 (22.0%) |
| 35 to 44 Years | 2,064 (79.4%) | 534 (20.5%) |
| 45 to 54 Years | 2,206 (88.1%) | 298 (11.9%) |
| 55 to 64 Years | 2,257 (91.6%) | 206 (8.4%) |
| 65 to 74 Years | 1,874 (99.4%) | 11 (0.6%) |
| 75 Years and older | 882 (100.0%) | 0 (0.0%) |
| Total | 15,170 (90.4%) | 1,614 (9.6%) |
Health Insurance Coverage by Citizenship Status in Truckee
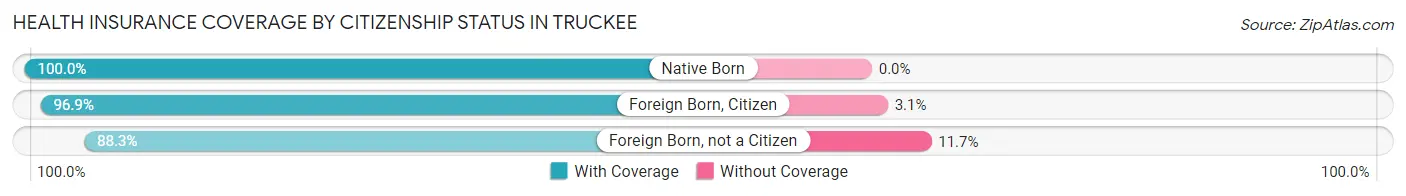
| Citizenship Status | With Coverage | Without Coverage |
| Native Born | 1,198 (100.0%) | 0 (0.0%) |
| Foreign Born, Citizen | 2,603 (96.9%) | 84 (3.1%) |
| Foreign Born, not a Citizen | 717 (88.3%) | 95 (11.7%) |
Health Insurance Coverage by Household Income in Truckee
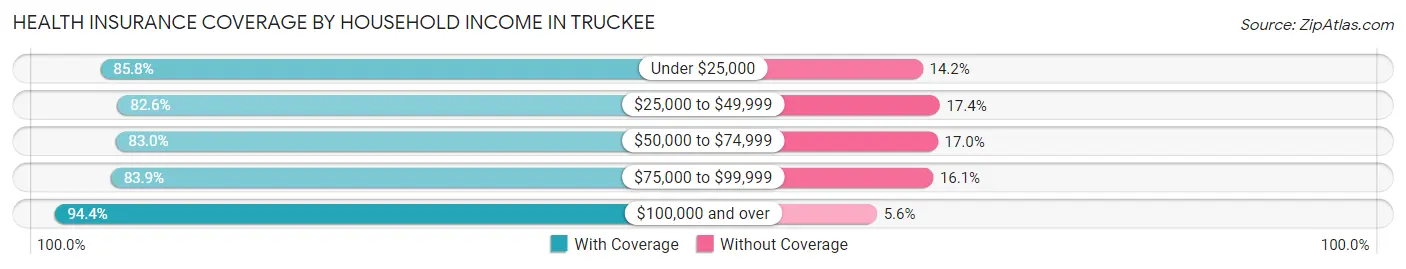
| Household Income | With Coverage | Without Coverage |
| Under $25,000 | 1,070 (85.8%) | 177 (14.2%) |
| $25,000 to $49,999 | 1,061 (82.6%) | 223 (17.4%) |
| $50,000 to $74,999 | 1,416 (83.0%) | 290 (17.0%) |
| $75,000 to $99,999 | 1,762 (83.9%) | 339 (16.1%) |
| $100,000 and over | 9,807 (94.4%) | 582 (5.6%) |
Public vs Private Health Insurance Coverage by Age in Truckee
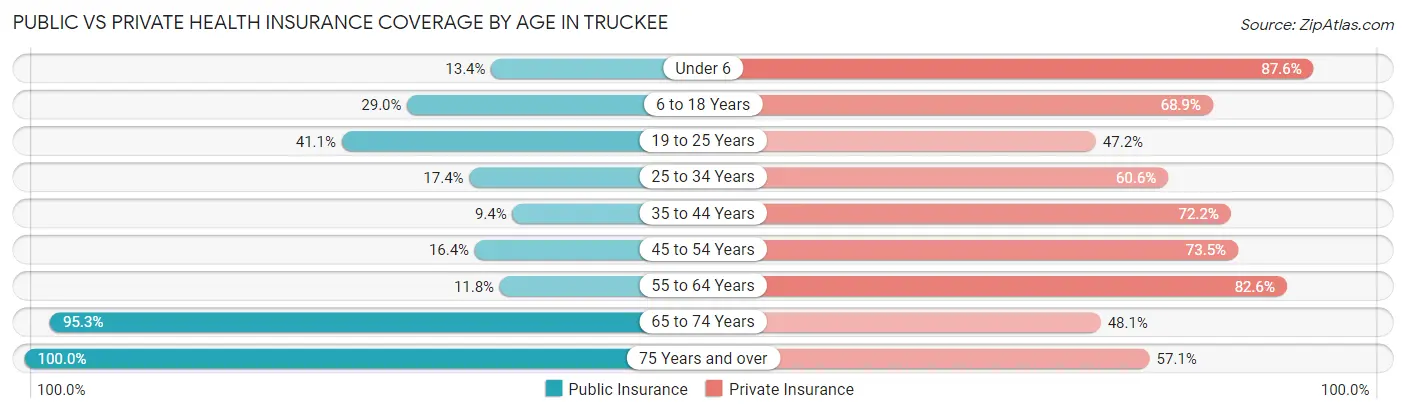
| Age Bracket | Public Insurance | Private Insurance |
| Under 6 | 160 (13.4%) | 1,049 (87.6%) |
| 6 to 18 Years | 778 (28.9%) | 1,850 (68.9%) |
| 19 to 25 Years | 334 (41.1%) | 383 (47.2%) |
| 25 to 34 Years | 306 (17.4%) | 1,063 (60.6%) |
| 35 to 44 Years | 245 (9.4%) | 1,875 (72.2%) |
| 45 to 54 Years | 411 (16.4%) | 1,841 (73.5%) |
| 55 to 64 Years | 290 (11.8%) | 2,034 (82.6%) |
| 65 to 74 Years | 1,796 (95.3%) | 906 (48.1%) |
| 75 Years and over | 882 (100.0%) | 504 (57.1%) |
| Total | 5,202 (31.0%) | 11,505 (68.5%) |
Disability Status by Sex by Age in Truckee
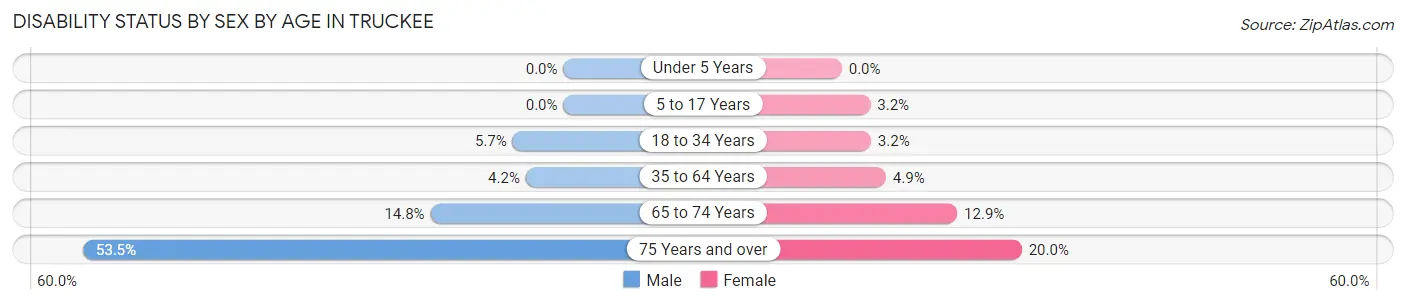
| Age Bracket | Male | Female |
| Under 5 Years | 0 (0.0%) | 0 (0.0%) |
| 5 to 17 Years | 0 (0.0%) | 45 (3.2%) |
| 18 to 34 Years | 86 (5.7%) | 41 (3.2%) |
| 35 to 64 Years | 159 (4.2%) | 185 (4.9%) |
| 65 to 74 Years | 173 (14.8%) | 92 (12.9%) |
| 75 Years and over | 221 (53.5%) | 94 (20.0%) |
Disability Class by Sex by Age in Truckee
Disability Class: Hearing Difficulty
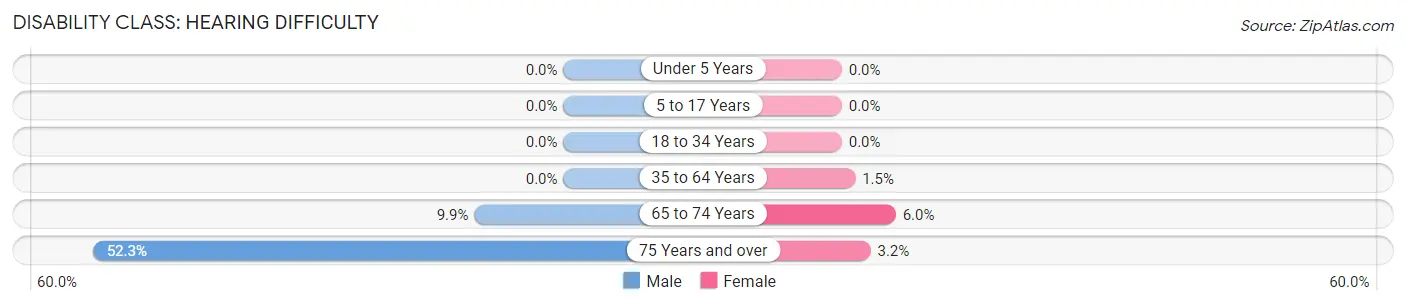
| Age Bracket | Male | Female |
| Under 5 Years | 0 (0.0%) | 0 (0.0%) |
| 5 to 17 Years | 0 (0.0%) | 0 (0.0%) |
| 18 to 34 Years | 0 (0.0%) | 0 (0.0%) |
| 35 to 64 Years | 0 (0.0%) | 56 (1.5%) |
| 65 to 74 Years | 116 (9.9%) | 43 (6.0%) |
| 75 Years and over | 216 (52.3%) | 15 (3.2%) |
Disability Class: Vision Difficulty
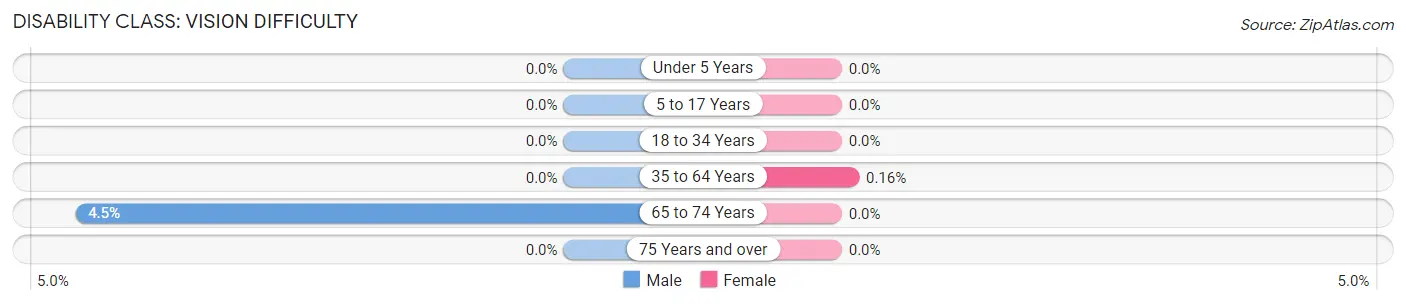
| Age Bracket | Male | Female |
| Under 5 Years | 0 (0.0%) | 0 (0.0%) |
| 5 to 17 Years | 0 (0.0%) | 0 (0.0%) |
| 18 to 34 Years | 0 (0.0%) | 0 (0.0%) |
| 35 to 64 Years | 0 (0.0%) | 6 (0.2%) |
| 65 to 74 Years | 53 (4.5%) | 0 (0.0%) |
| 75 Years and over | 0 (0.0%) | 0 (0.0%) |
Disability Class: Cognitive Difficulty
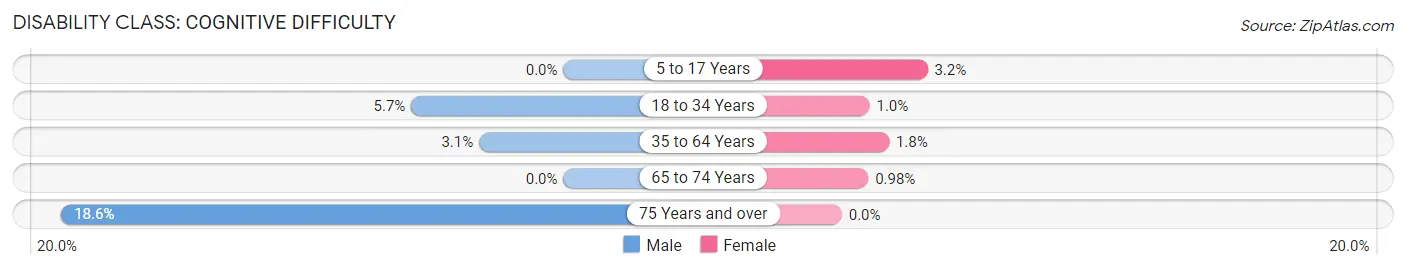
| Age Bracket | Male | Female |
| 5 to 17 Years | 0 (0.0%) | 45 (3.2%) |
| 18 to 34 Years | 86 (5.7%) | 13 (1.0%) |
| 35 to 64 Years | 119 (3.1%) | 66 (1.8%) |
| 65 to 74 Years | 0 (0.0%) | 7 (1.0%) |
| 75 Years and over | 77 (18.6%) | 0 (0.0%) |
Disability Class: Ambulatory Difficulty
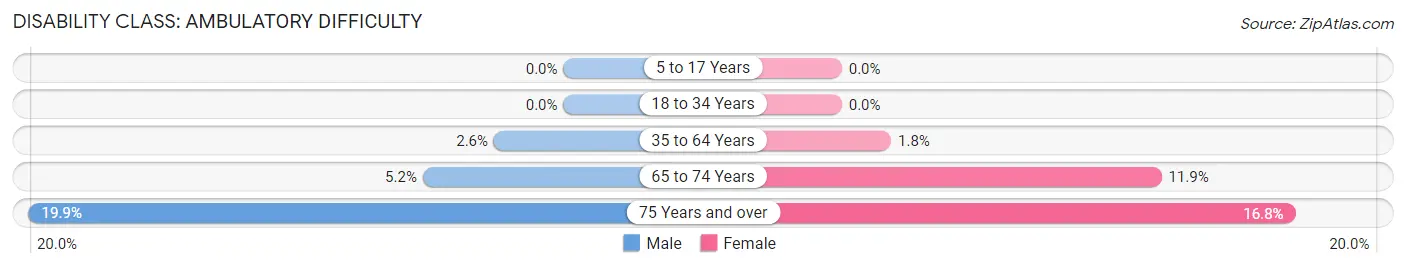
| Age Bracket | Male | Female |
| 5 to 17 Years | 0 (0.0%) | 0 (0.0%) |
| 18 to 34 Years | 0 (0.0%) | 0 (0.0%) |
| 35 to 64 Years | 98 (2.6%) | 69 (1.8%) |
| 65 to 74 Years | 61 (5.2%) | 85 (11.9%) |
| 75 Years and over | 82 (19.9%) | 79 (16.8%) |
Disability Class: Self-Care Difficulty
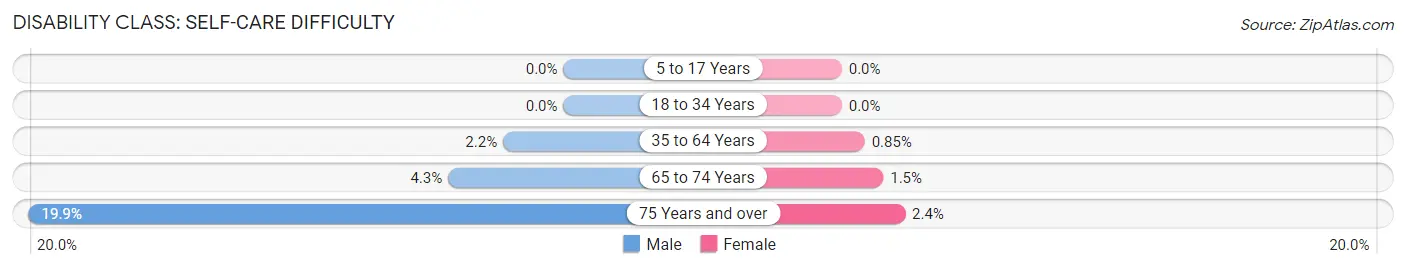
| Age Bracket | Male | Female |
| 5 to 17 Years | 0 (0.0%) | 0 (0.0%) |
| 18 to 34 Years | 0 (0.0%) | 0 (0.0%) |
| 35 to 64 Years | 85 (2.2%) | 32 (0.9%) |
| 65 to 74 Years | 50 (4.3%) | 11 (1.5%) |
| 75 Years and over | 82 (19.9%) | 11 (2.4%) |
Technology Access in Truckee
Computing Device Access in Truckee
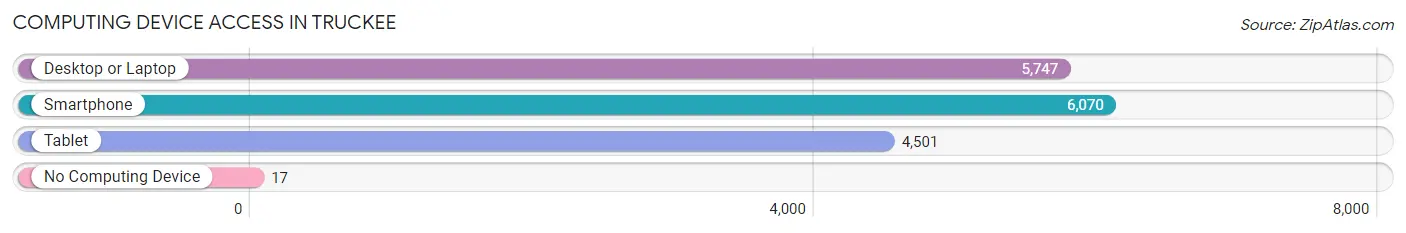
| Device Type | # Households | % Households |
| Desktop or Laptop | 5,747 | 91.5% |
| Smartphone | 6,070 | 96.7% |
| Tablet | 4,501 | 71.7% |
| No Computing Device | 17 | 0.3% |
| Total | 6,279 | 100.0% |
Internet Access in Truckee
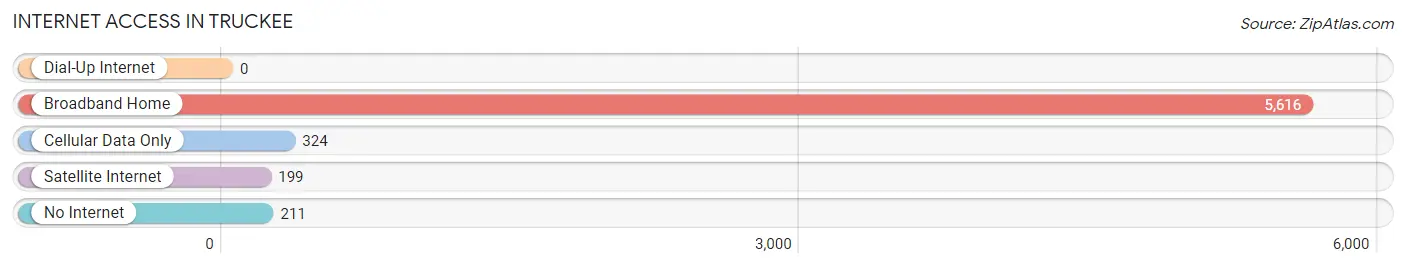
| Internet Type | # Households | % Households |
| Dial-Up Internet | 0 | 0.0% |
| Broadband Home | 5,616 | 89.4% |
| Cellular Data Only | 324 | 5.2% |
| Satellite Internet | 199 | 3.2% |
| No Internet | 211 | 3.4% |
| Total | 6,279 | 100.0% |
Truckee Summary
Truckee is a small town located in the Sierra Nevada mountain range in Nevada County, California. It is situated at the intersection of Interstate 80 and State Route 89, approximately 30 miles west of Reno, Nevada. The town is known for its proximity to Lake Tahoe, the Truckee River, and the Donner Pass. Truckee is a popular destination for outdoor recreation, including skiing, snowboarding, hiking, biking, and fishing.
History
Truckee was originally inhabited by the Washoe people, who lived in the area for thousands of years before the arrival of European settlers. The first recorded European settler in the area was a trapper named John A. Truckee, who arrived in 1844. The town was named after him. In the late 1800s, the Central Pacific Railroad built a line through the area, connecting Truckee to the rest of the country. This allowed the town to become a major hub for the logging and mining industries.
In the early 1900s, Truckee began to attract tourists, who were drawn to the area’s natural beauty and outdoor recreation opportunities. The town was incorporated in 1993.
Geography
Truckee is located in the Sierra Nevada mountain range in Nevada County, California. It is situated at the intersection of Interstate 80 and State Route 89, approximately 30 miles west of Reno, Nevada. The town is surrounded by the Tahoe National Forest and is located at the base of Donner Pass. The Truckee River runs through the town, and Lake Tahoe is located just a few miles away.
The town has a total area of 8.3 square miles, with a population of 16,180 as of the 2010 census. The elevation of the town is 5,935 feet above sea level.
Economy
Truckee’s economy is largely based on tourism and outdoor recreation. The town is a popular destination for skiing, snowboarding, hiking, biking, and fishing. The town is also home to several restaurants, bars, and shops.
The town is also home to several manufacturing and technology companies, including Sierra Nevada Corporation, which produces aerospace and defense products.
Demographics
As of the 2010 census, the population of Truckee was 16,180. The racial makeup of the town was 87.3% White, 0.7% African American, 0.7% Native American, 1.2% Asian, 0.2% Pacific Islander, 6.7% from other races, and 3.2% from two or more races. Hispanic or Latino of any race were 14.3% of the population.
The median income for a household in the town was $60,945, and the median income for a family was $71,917. The per capita income for the town was $35,945. About 8.2% of families and 11.2% of the population were below the poverty line, including 15.2% of those under age 18 and 4.2% of those age 65 or over.
Common Questions
What is Per Capita Income in Truckee?
Per Capita income in Truckee is $63,792.
What is the Median Family Income in Truckee?
Median Family Income in Truckee is $139,917.
What is the Median Household income in Truckee?
Median Household Income in Truckee is $107,423.
What is Income or Wage Gap in Truckee?
Income or Wage Gap in Truckee is 40.2%.
Women in Truckee earn 59.8 cents for every dollar earned by a man.
What is Inequality or Gini Index in Truckee?
Inequality or Gini Index in Truckee is 0.49.
What is the Total Population of Truckee?
Total Population of Truckee is 16,784.
What is the Total Male Population of Truckee?
Total Male Population of Truckee is 8,637.
What is the Total Female Population of Truckee?
Total Female Population of Truckee is 8,147.
What is the Ratio of Males per 100 Females in Truckee?
There are 106.01 Males per 100 Females in Truckee.
What is the Ratio of Females per 100 Males in Truckee?
There are 94.33 Females per 100 Males in Truckee.
What is the Median Population Age in Truckee?
Median Population Age in Truckee is 41.9 Years.
What is the Average Family Size in Truckee
Average Family Size in Truckee is 3.0 People.
What is the Average Household Size in Truckee
Average Household Size in Truckee is 2.7 People.
How Large is the Labor Force in Truckee?
There are 9,025 People in the Labor Forcein in Truckee.
What is the Percentage of People in the Labor Force in Truckee?
66.6% of People are in the Labor Force in Truckee.
What is the Unemployment Rate in Truckee?
Unemployment Rate in Truckee is 5.7%.