Tranquillity, CA Map & Demographics
Tranquillity Map
Tranquillity Overview
$25,280
PER CAPITA INCOME
$37,298
AVG FAMILY INCOME
$54,632
AVG HOUSEHOLD INCOME
0.36
INEQUALITY / GINI INDEX
786
TOTAL POPULATION
420
MALE POPULATION
366
FEMALE POPULATION
114.75
MALES / 100 FEMALES
87.14
FEMALES / 100 MALES
42.4
MEDIAN AGE
3.2
AVG FAMILY SIZE
3.1
AVG HOUSEHOLD SIZE
321
LABOR FORCE [ PEOPLE ]
49.9%
PERCENT IN LABOR FORCE
19.0%
UNEMPLOYMENT RATE
Tranquillity Zip Codes
Tranquillity Area Codes
Income in Tranquillity
Income Overview in Tranquillity
Per Capita Income in Tranquillity is $25,280, while median incomes of families and households are $37,298 and $54,632 respectively.
| Characteristic | Number | Measure |
| Per Capita Income | 786 | $25,280 |
| Median Family Income | 218 | $37,298 |
| Mean Family Income | 218 | $60,092 |
| Median Household Income | 254 | $54,632 |
| Mean Household Income | 254 | $72,867 |
| Income Deficit | 218 | $0 |
| Wage / Income Gap (%) | 786 | 0.00% |
| Wage / Income Gap ($) | 786 | 100.00¢ per $1 |
| Gini / Inequality Index | 786 | 0.36 |
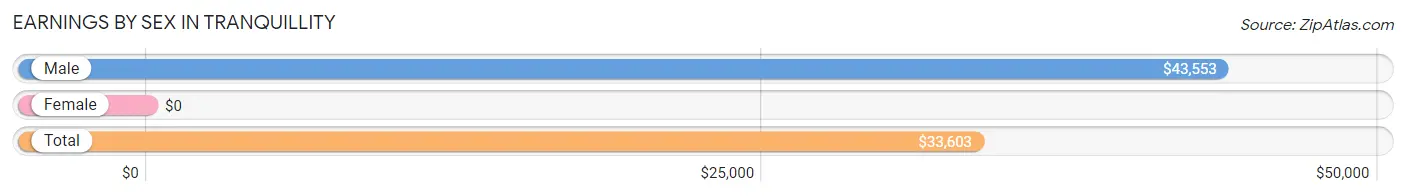
Earnings by Sex in Tranquillity
| Sex | Number | Average Earnings |
| Male | 216 (67.3%) | $43,553 |
| Female | 105 (32.7%) | $0 |
| Total | 321 (100.0%) | $33,603 |
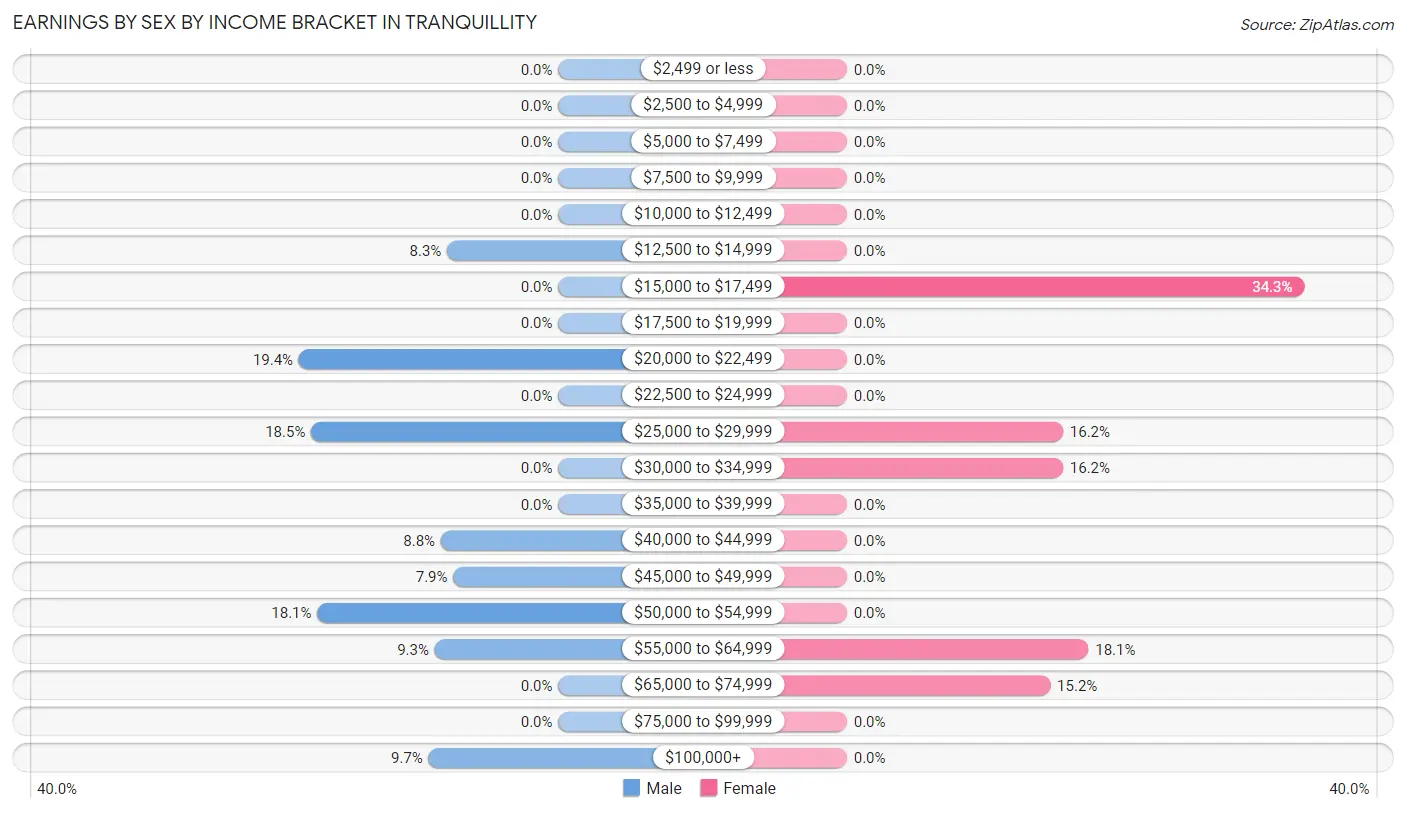
Earnings by Sex by Income Bracket in Tranquillity
The most common earnings brackets in Tranquillity are $20,000 to $22,499 for men (42 | 19.4%) and $15,000 to $17,499 for women (36 | 34.3%).
| Income | Male | Female |
| $2,499 or less | 0 (0.0%) | 0 (0.0%) |
| $2,500 to $4,999 | 0 (0.0%) | 0 (0.0%) |
| $5,000 to $7,499 | 0 (0.0%) | 0 (0.0%) |
| $7,500 to $9,999 | 0 (0.0%) | 0 (0.0%) |
| $10,000 to $12,499 | 0 (0.0%) | 0 (0.0%) |
| $12,500 to $14,999 | 18 (8.3%) | 0 (0.0%) |
| $15,000 to $17,499 | 0 (0.0%) | 36 (34.3%) |
| $17,500 to $19,999 | 0 (0.0%) | 0 (0.0%) |
| $20,000 to $22,499 | 42 (19.4%) | 0 (0.0%) |
| $22,500 to $24,999 | 0 (0.0%) | 0 (0.0%) |
| $25,000 to $29,999 | 40 (18.5%) | 17 (16.2%) |
| $30,000 to $34,999 | 0 (0.0%) | 17 (16.2%) |
| $35,000 to $39,999 | 0 (0.0%) | 0 (0.0%) |
| $40,000 to $44,999 | 19 (8.8%) | 0 (0.0%) |
| $45,000 to $49,999 | 17 (7.9%) | 0 (0.0%) |
| $50,000 to $54,999 | 39 (18.1%) | 0 (0.0%) |
| $55,000 to $64,999 | 20 (9.3%) | 19 (18.1%) |
| $65,000 to $74,999 | 0 (0.0%) | 16 (15.2%) |
| $75,000 to $99,999 | 0 (0.0%) | 0 (0.0%) |
| $100,000+ | 21 (9.7%) | 0 (0.0%) |
| Total | 216 (100.0%) | 105 (100.0%) |
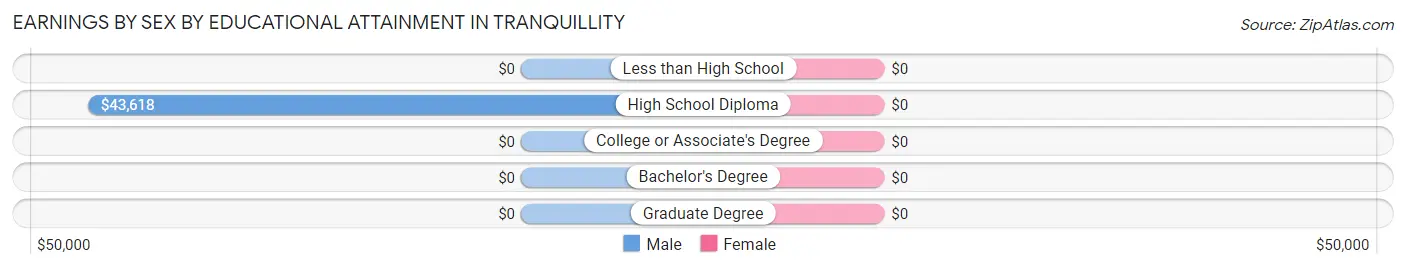
Earnings by Sex by Educational Attainment in Tranquillity
| Educational Attainment | Male Income | Female Income |
| Less than High School | - | - |
| High School Diploma | $43,618 | $0 |
| College or Associate's Degree | - | - |
| Bachelor's Degree | - | - |
| Graduate Degree | - | - |
| Total | $43,553 | $0 |
Family Income in Tranquillity
Family Income Brackets in Tranquillity
According to the Tranquillity family income data, there are 62 families falling into the $35,000 to $49,999 income range, which is the most common income bracket and makes up 28.4% of all families.
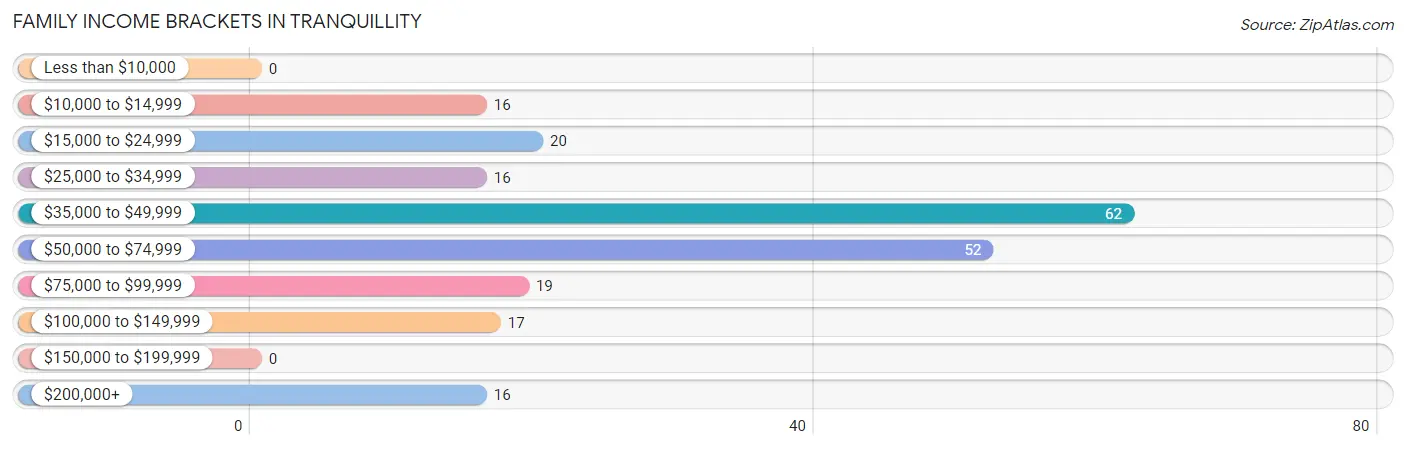
| Income Bracket | # Families | % Families |
| Less than $10,000 | 0 | 0.0% |
| $10,000 to $14,999 | 16 | 7.3% |
| $15,000 to $24,999 | 20 | 9.2% |
| $25,000 to $34,999 | 16 | 7.3% |
| $35,000 to $49,999 | 62 | 28.4% |
| $50,000 to $74,999 | 52 | 23.9% |
| $75,000 to $99,999 | 19 | 8.7% |
| $100,000 to $149,999 | 17 | 7.8% |
| $150,000 to $199,999 | 0 | 0.0% |
| $200,000+ | 16 | 7.3% |
Family Income by Famaliy Size in Tranquillity
2-person families (150 | 68.8%) account for the highest median family income in Tranquillity with $36,573 per family, while 2-person families (150 | 68.8%) have the highest median income of $18,286 per family member.
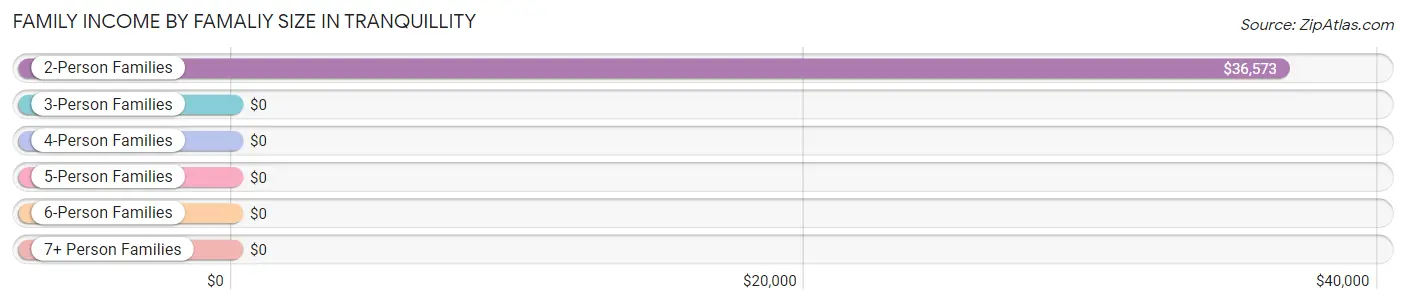
| Income Bracket | # Families | Median Income |
| 2-Person Families | 150 (68.8%) | $36,573 |
| 3-Person Families | 0 (0.0%) | $0 |
| 4-Person Families | 16 (7.3%) | $0 |
| 5-Person Families | 37 (17.0%) | $0 |
| 6-Person Families | 0 (0.0%) | $0 |
| 7+ Person Families | 15 (6.9%) | $0 |
| Total | 218 (100.0%) | $37,298 |
Family Income by Number of Earners in Tranquillity
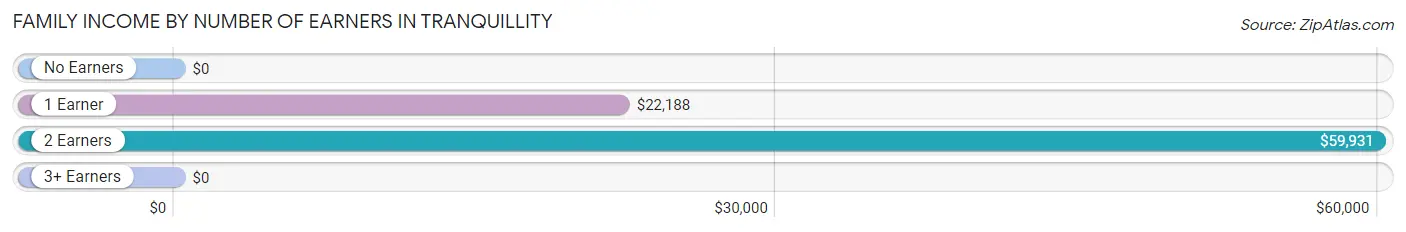
| Number of Earners | # Families | Median Income |
| No Earners | 78 (35.8%) | $0 |
| 1 Earner | 67 (30.7%) | $22,188 |
| 2 Earners | 73 (33.5%) | $59,931 |
| 3+ Earners | 0 (0.0%) | $0 |
| Total | 218 (100.0%) | $37,298 |
Household Income in Tranquillity
Household Income Brackets in Tranquillity
With 88 households falling in the category, the $50,000 to $74,999 income range is the most frequent in Tranquillity, accounting for 34.6% of all households.
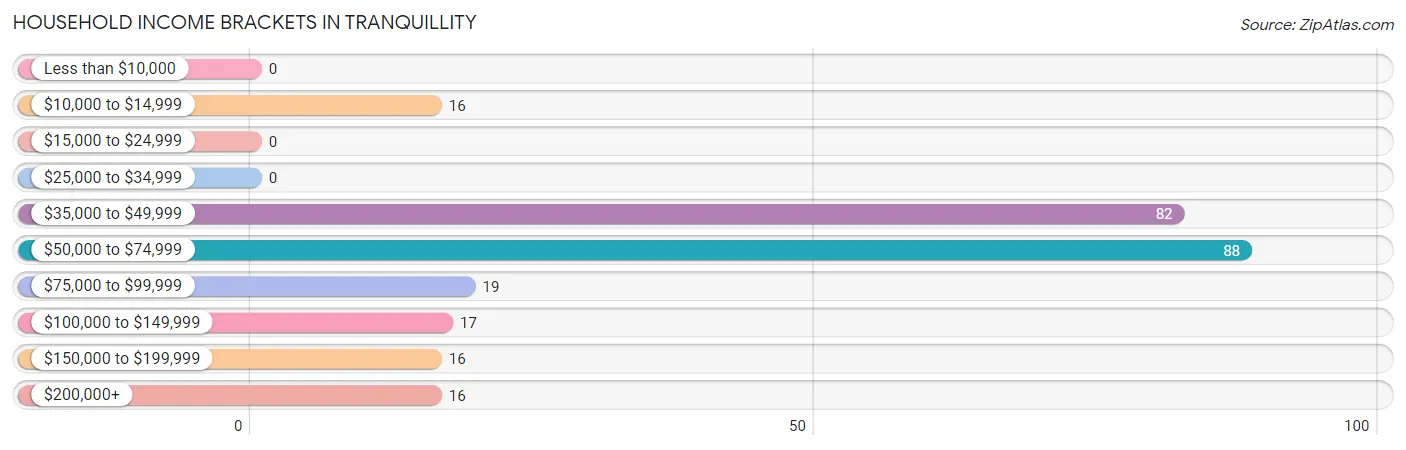
| Income Bracket | # Households | % Households |
| Less than $10,000 | 0 | 0.0% |
| $10,000 to $14,999 | 16 | 6.3% |
| $15,000 to $24,999 | 0 | 0.0% |
| $25,000 to $34,999 | 0 | 0.0% |
| $35,000 to $49,999 | 82 | 32.3% |
| $50,000 to $74,999 | 88 | 34.6% |
| $75,000 to $99,999 | 19 | 7.5% |
| $100,000 to $149,999 | 17 | 6.7% |
| $150,000 to $199,999 | 16 | 6.3% |
| $200,000+ | 16 | 6.3% |
Household Income by Householder Age in Tranquillity
The median household income in Tranquillity is $54,632, with the highest median household income of $56,250 found in the 25 to 44 years age bracket for the primary householder. A total of 108 households (42.5%) fall into this category.
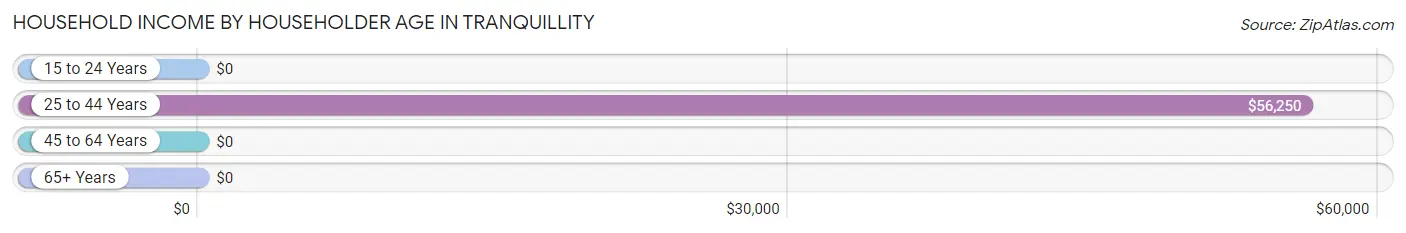
| Income Bracket | # Households | Median Income |
| 15 to 24 Years | 0 (0.0%) | $0 |
| 25 to 44 Years | 108 (42.5%) | $56,250 |
| 45 to 64 Years | 68 (26.8%) | $0 |
| 65+ Years | 78 (30.7%) | $0 |
| Total | 254 (100.0%) | $54,632 |
Poverty in Tranquillity
Income Below Poverty by Sex and Age in Tranquillity
With 8.8% poverty level for males and 10.1% for females among the residents of Tranquillity, under 5 year old males and 18 to 24 year old females are the most vulnerable to poverty, with 19 males (48.7%) and 21 females (48.8%) in their respective age groups living below the poverty level.
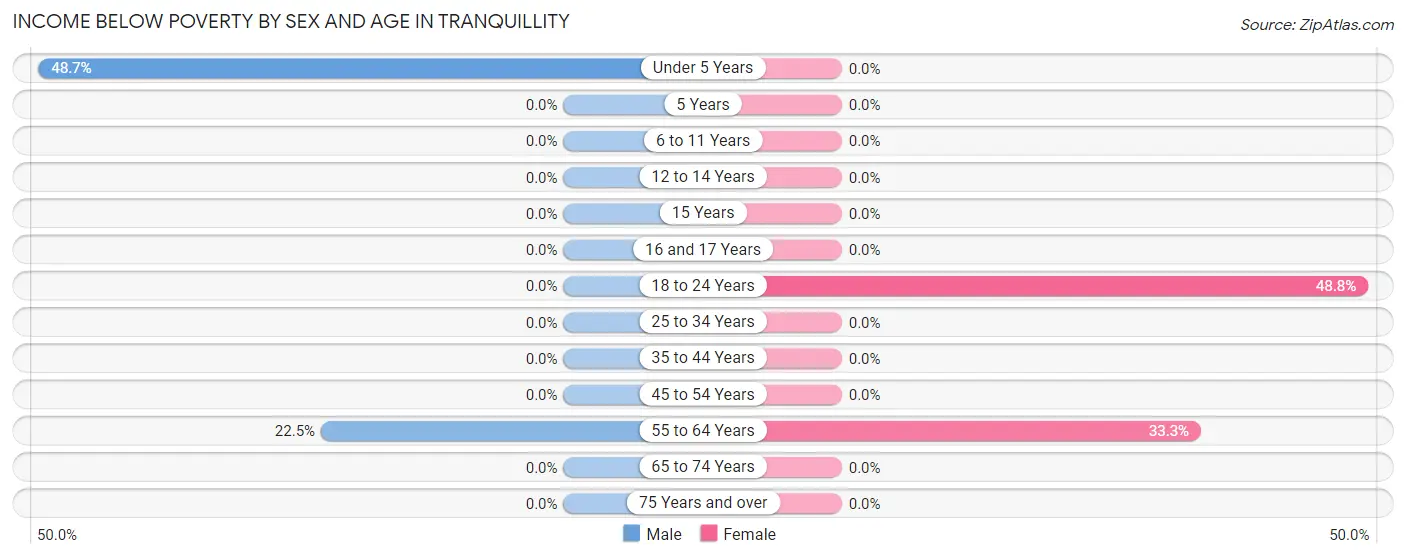
| Age Bracket | Male | Female |
| Under 5 Years | 19 (48.7%) | 0 (0.0%) |
| 5 Years | 0 (0.0%) | 0 (0.0%) |
| 6 to 11 Years | 0 (0.0%) | 0 (0.0%) |
| 12 to 14 Years | 0 (0.0%) | 0 (0.0%) |
| 15 Years | 0 (0.0%) | 0 (0.0%) |
| 16 and 17 Years | 0 (0.0%) | 0 (0.0%) |
| 18 to 24 Years | 0 (0.0%) | 21 (48.8%) |
| 25 to 34 Years | 0 (0.0%) | 0 (0.0%) |
| 35 to 44 Years | 0 (0.0%) | 0 (0.0%) |
| 45 to 54 Years | 0 (0.0%) | 0 (0.0%) |
| 55 to 64 Years | 18 (22.5%) | 16 (33.3%) |
| 65 to 74 Years | 0 (0.0%) | 0 (0.0%) |
| 75 Years and over | 0 (0.0%) | 0 (0.0%) |
| Total | 37 (8.8%) | 37 (10.1%) |
Income Above Poverty by Sex and Age in Tranquillity
According to the poverty statistics in Tranquillity, males aged 6 to 11 years and females aged under 5 years are the age groups that are most secure financially, with 100.0% of males and 100.0% of females in these age groups living above the poverty line.
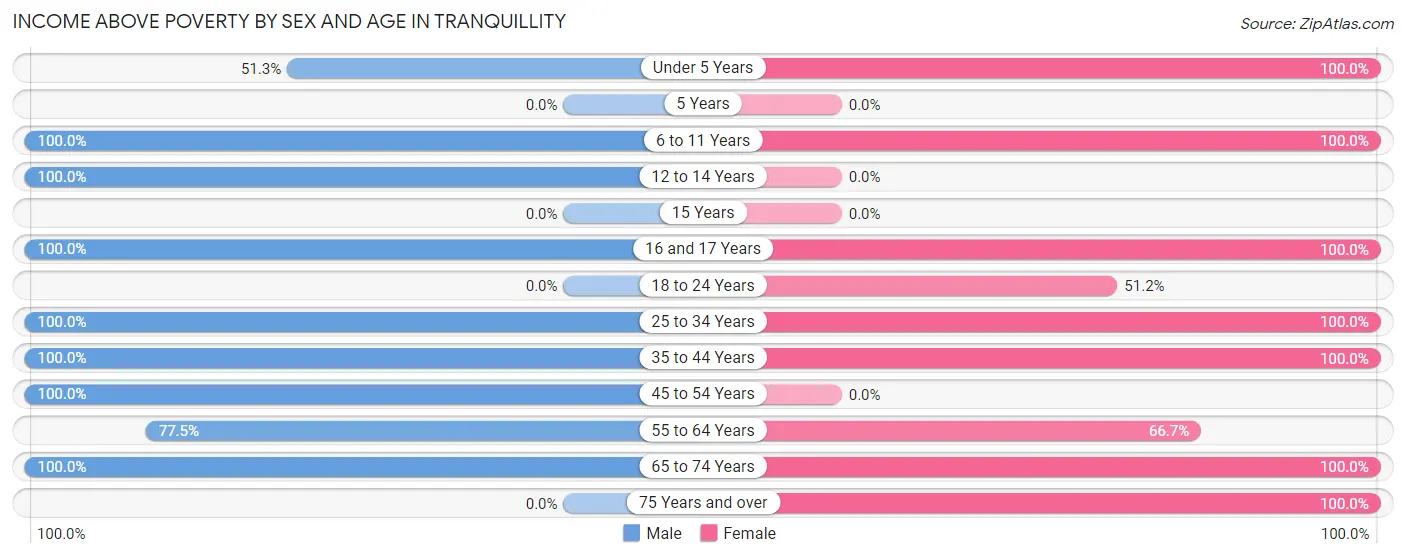
| Age Bracket | Male | Female |
| Under 5 Years | 20 (51.3%) | 18 (100.0%) |
| 5 Years | 0 (0.0%) | 0 (0.0%) |
| 6 to 11 Years | 17 (100.0%) | 37 (100.0%) |
| 12 to 14 Years | 32 (100.0%) | 0 (0.0%) |
| 15 Years | 0 (0.0%) | 0 (0.0%) |
| 16 and 17 Years | 37 (100.0%) | 20 (100.0%) |
| 18 to 24 Years | 0 (0.0%) | 22 (51.2%) |
| 25 to 34 Years | 20 (100.0%) | 18 (100.0%) |
| 35 to 44 Years | 77 (100.0%) | 86 (100.0%) |
| 45 to 54 Years | 39 (100.0%) | 0 (0.0%) |
| 55 to 64 Years | 62 (77.5%) | 32 (66.7%) |
| 65 to 74 Years | 79 (100.0%) | 78 (100.0%) |
| 75 Years and over | 0 (0.0%) | 18 (100.0%) |
| Total | 383 (91.2%) | 329 (89.9%) |
Income Below Poverty Among Married-Couple Families in Tranquillity
The poverty statistics for married-couple families in Tranquillity show that 8.8% or 16 of the total 182 families live below the poverty line. Families with 1 or 2 children have the highest poverty rate of 47.1%, comprising of 16 families. On the other hand, families with no children have the lowest poverty rate of 0.0%, which includes 0 families.
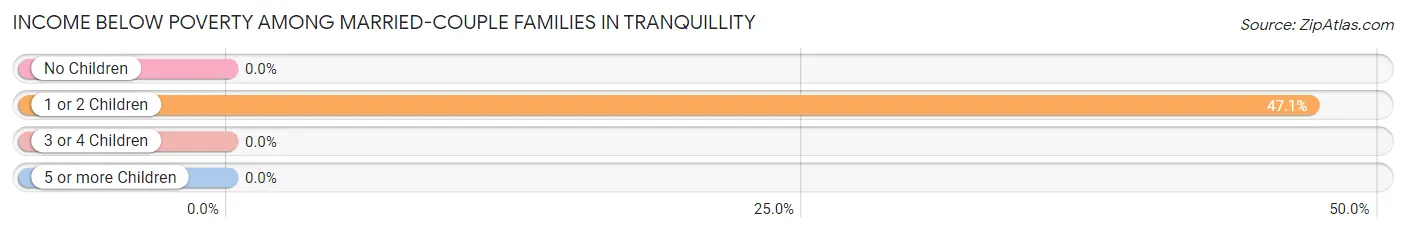
| Children | Above Poverty | Below Poverty |
| No Children | 114 (100.0%) | 0 (0.0%) |
| 1 or 2 Children | 18 (52.9%) | 16 (47.1%) |
| 3 or 4 Children | 34 (100.0%) | 0 (0.0%) |
| 5 or more Children | 0 (0.0%) | 0 (0.0%) |
| Total | 166 (91.2%) | 16 (8.8%) |
Income Below Poverty Among Single-Parent Households in Tranquillity
| Children | Single Father | Single Mother |
| No Children | 0 (0.0%) | 0 (0.0%) |
| 1 or 2 Children | 0 (0.0%) | 0 (0.0%) |
| 3 or 4 Children | 0 (0.0%) | 0 (0.0%) |
| 5 or more Children | 0 (0.0%) | 0 (0.0%) |
| Total | 0 (0.0%) | 0 (0.0%) |
Income Below Poverty Among Married-Couple vs Single-Parent Households in Tranquillity
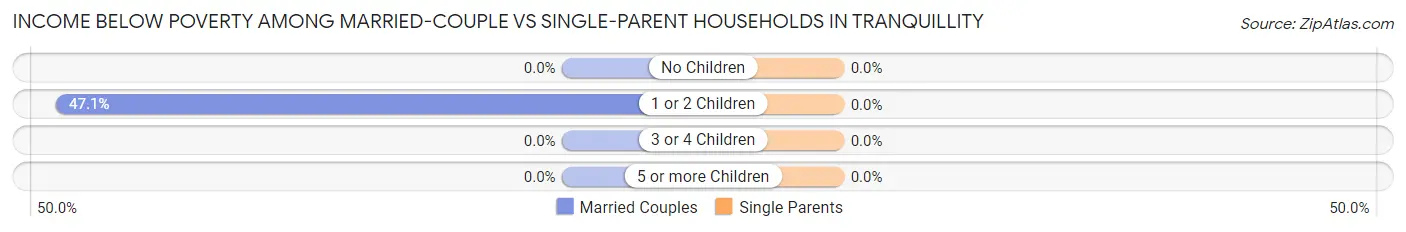
| Children | Married-Couple Families | Single-Parent Households |
| No Children | 0 (0.0%) | 0 (0.0%) |
| 1 or 2 Children | 16 (47.1%) | 0 (0.0%) |
| 3 or 4 Children | 0 (0.0%) | 0 (0.0%) |
| 5 or more Children | 0 (0.0%) | 0 (0.0%) |
| Total | 16 (8.8%) | 0 (0.0%) |
Race in Tranquillity
The most populous races in Tranquillity are Hispanic or Latino (681 | 86.6%), Some other Race (472 | 60.1%), and White / Caucasian (223 | 28.4%).
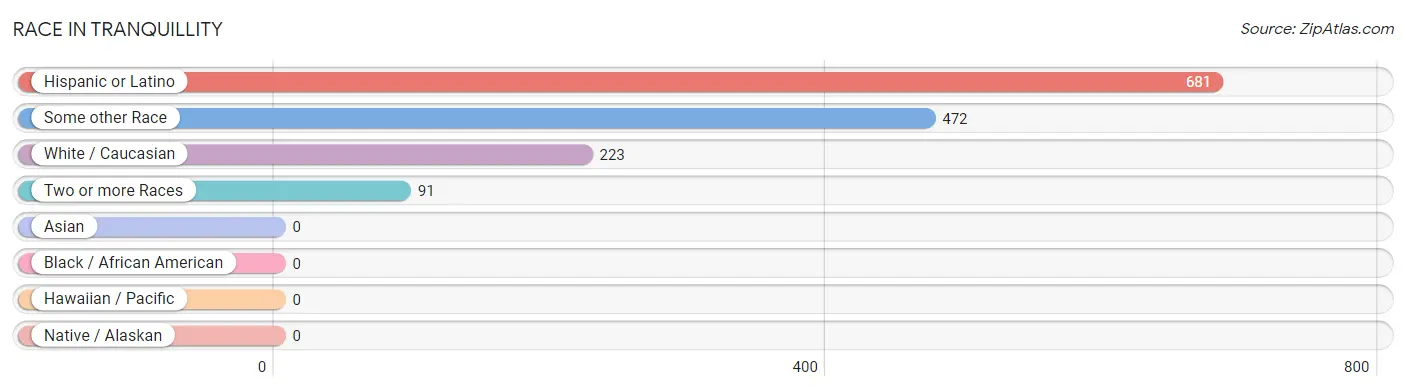
| Race | # Population | % Population |
| Asian | 0 | 0.0% |
| Black / African American | 0 | 0.0% |
| Hawaiian / Pacific | 0 | 0.0% |
| Hispanic or Latino | 681 | 86.6% |
| Native / Alaskan | 0 | 0.0% |
| White / Caucasian | 223 | 28.4% |
| Two or more Races | 91 | 11.6% |
| Some other Race | 472 | 60.1% |
| Total | 786 | 100.0% |
Ancestry in Tranquillity
The most populous ancestries reported in Tranquillity are Mexican (681 | 86.6%), Irish (72 | 9.2%), German (32 | 4.1%), Scotch-Irish (17 | 2.2%), and Luxembourger (16 | 2.0%), together accounting for 104.1% of all Tranquillity residents.
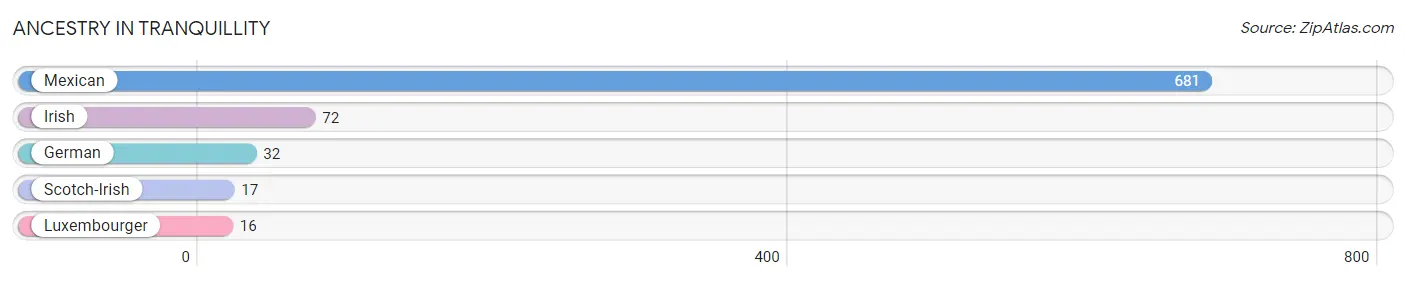
| Ancestry | # Population | % Population |
| German | 32 | 4.1% |
| Irish | 72 | 9.2% |
| Luxembourger | 16 | 2.0% |
| Mexican | 681 | 86.6% |
| Scotch-Irish | 17 | 2.2% | View All 5 Rows |
Immigrants in Tranquillity
The most numerous immigrant groups reported in Tranquillity came from Central America (276 | 35.1%), Latin America (276 | 35.1%), and Mexico (276 | 35.1%), together accounting for 105.3% of all Tranquillity residents.
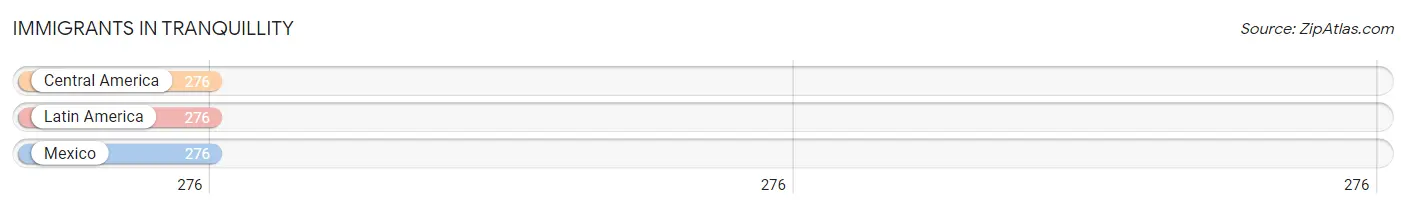
| Immigration Origin | # Population | % Population |
| Central America | 276 | 35.1% |
| Latin America | 276 | 35.1% |
| Mexico | 276 | 35.1% | View All 3 Rows |
Sex and Age in Tranquillity
Sex and Age in Tranquillity
The most populous age groups in Tranquillity are 70 to 74 Years (79 | 18.8%) for men and 70 to 74 Years (78 | 21.3%) for women.
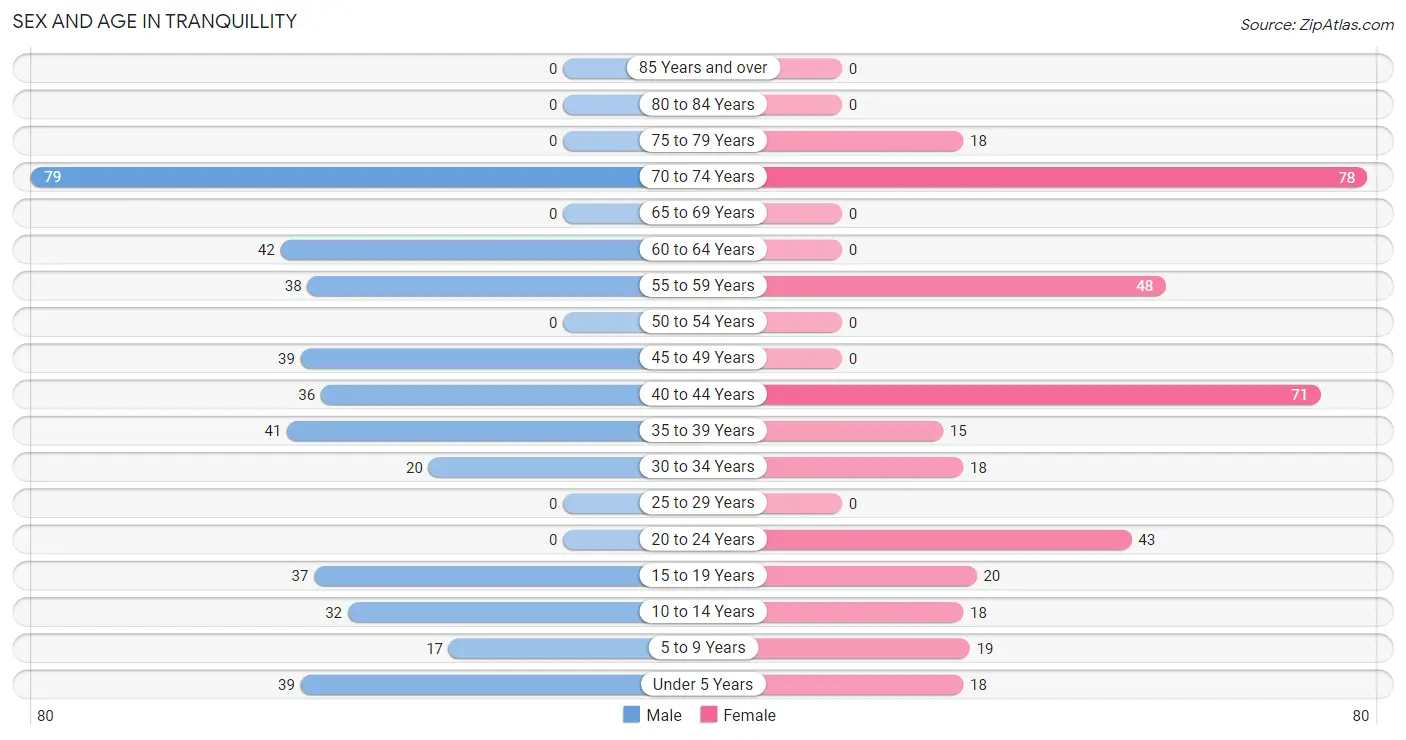
| Age Bracket | Male | Female |
| Under 5 Years | 39 (9.3%) | 18 (4.9%) |
| 5 to 9 Years | 17 (4.1%) | 19 (5.2%) |
| 10 to 14 Years | 32 (7.6%) | 18 (4.9%) |
| 15 to 19 Years | 37 (8.8%) | 20 (5.5%) |
| 20 to 24 Years | 0 (0.0%) | 43 (11.7%) |
| 25 to 29 Years | 0 (0.0%) | 0 (0.0%) |
| 30 to 34 Years | 20 (4.8%) | 18 (4.9%) |
| 35 to 39 Years | 41 (9.8%) | 15 (4.1%) |
| 40 to 44 Years | 36 (8.6%) | 71 (19.4%) |
| 45 to 49 Years | 39 (9.3%) | 0 (0.0%) |
| 50 to 54 Years | 0 (0.0%) | 0 (0.0%) |
| 55 to 59 Years | 38 (9.0%) | 48 (13.1%) |
| 60 to 64 Years | 42 (10.0%) | 0 (0.0%) |
| 65 to 69 Years | 0 (0.0%) | 0 (0.0%) |
| 70 to 74 Years | 79 (18.8%) | 78 (21.3%) |
| 75 to 79 Years | 0 (0.0%) | 18 (4.9%) |
| 80 to 84 Years | 0 (0.0%) | 0 (0.0%) |
| 85 Years and over | 0 (0.0%) | 0 (0.0%) |
| Total | 420 (100.0%) | 366 (100.0%) |
Families and Households in Tranquillity
Median Family Size in Tranquillity
The median family size in Tranquillity is 3.17 persons per family, with married-couple families (182 | 83.5%) accounting for the largest median family size of 3.36 persons per family. On the other hand, single male/father families (20 | 9.2%) represent the smallest median family size with 2.00 persons per family.
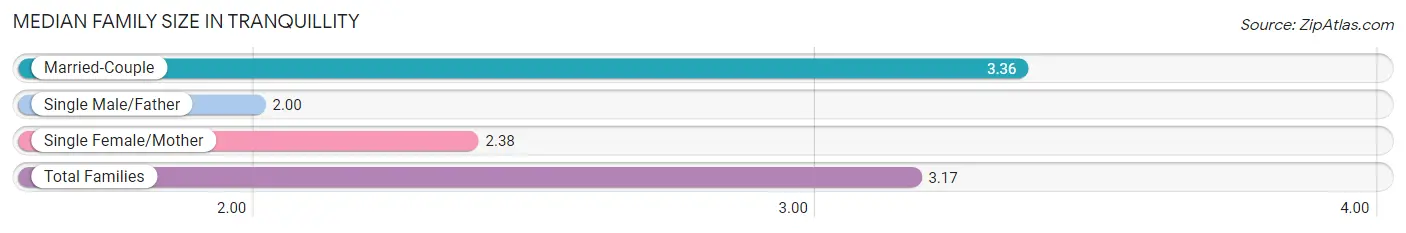
| Family Type | # Families | Family Size |
| Married-Couple | 182 (83.5%) | 3.36 |
| Single Male/Father | 20 (9.2%) | 2.00 |
| Single Female/Mother | 16 (7.3%) | 2.38 |
| Total Families | 218 (100.0%) | 3.17 |
Median Household Size in Tranquillity
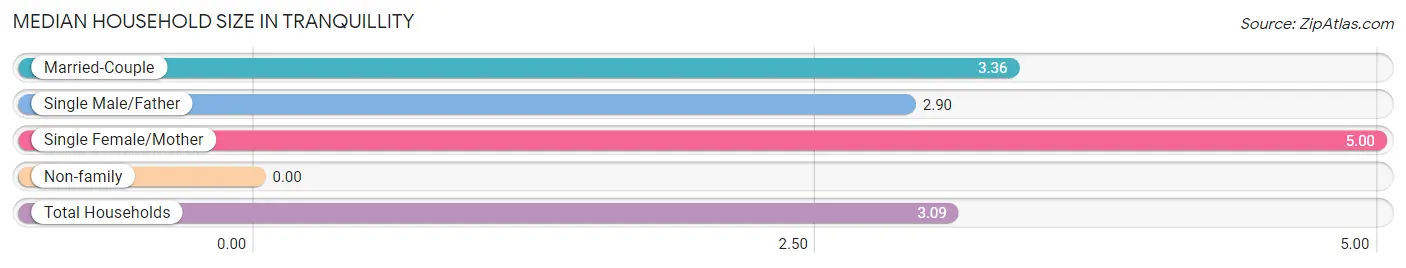
| Household Type | # Households | Household Size |
| Married-Couple | 182 (71.7%) | 3.36 |
| Single Male/Father | 20 (7.9%) | 2.90 |
| Single Female/Mother | 16 (6.3%) | 5.00 |
| Non-family | 36 (14.2%) | - |
| Total Households | 254 (100.0%) | 3.09 |
Household Size by Marriage Status in Tranquillity
Out of a total of 254 households in Tranquillity, 218 (85.8%) are family households, while 36 (14.2%) are nonfamily households. The most numerous type of family households are 2-person households, comprising 114, and the most common type of nonfamily households are 1-person households, comprising 36.
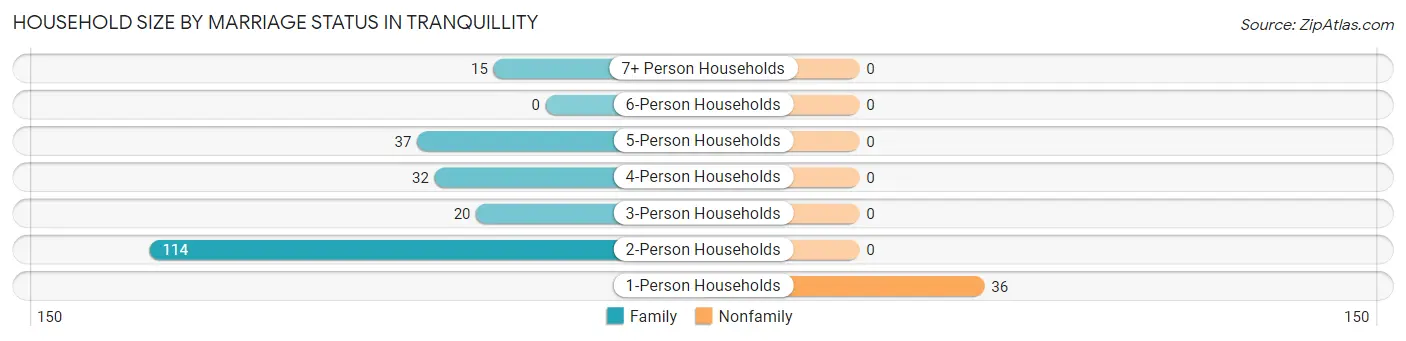
| Household Size | Family Households | Nonfamily Households |
| 1-Person Households | - | 36 (14.2%) |
| 2-Person Households | 114 (44.9%) | 0 (0.0%) |
| 3-Person Households | 20 (7.9%) | 0 (0.0%) |
| 4-Person Households | 32 (12.6%) | 0 (0.0%) |
| 5-Person Households | 37 (14.6%) | 0 (0.0%) |
| 6-Person Households | 0 (0.0%) | 0 (0.0%) |
| 7+ Person Households | 15 (5.9%) | 0 (0.0%) |
| Total | 218 (85.8%) | 36 (14.2%) |
Female Fertility in Tranquillity
Fertility by Age in Tranquillity
| Age Bracket | Women with Births | Births / 1,000 Women |
| 15 to 19 years | 0 (0.0%) | 0.0 |
| 20 to 34 years | 0 (0.0%) | 0.0 |
| 35 to 50 years | 0 (0.0%) | 0.0 |
| Total | 0 (0.0%) | 0.0 |
Fertility by Age by Marriage Status in Tranquillity
| Age Bracket | Married | Unmarried |
| 15 to 19 years | 0 (0.0%) | 0 (0.0%) |
| 20 to 34 years | 0 (0.0%) | 0 (0.0%) |
| 35 to 50 years | 0 (0.0%) | 0 (0.0%) |
| Total | 0 (0.0%) | 0 (0.0%) |
Fertility by Education in Tranquillity
| Educational Attainment | Women with Births | Births / 1,000 Women |
| Less than High School | 0 (0.0%) | 0.0 |
| High School Diploma | 0 (0.0%) | 0.0 |
| College or Associate's Degree | 0 (0.0%) | 0.0 |
| Bachelor's Degree | 0 (0.0%) | 0.0 |
| Graduate Degree | 0 (0.0%) | 0.0 |
| Total | 0 (0.0%) | 0.0 |
Fertility by Education by Marriage Status in Tranquillity
| Educational Attainment | Married | Unmarried |
| Less than High School | 0 (0.0%) | 0 (0.0%) |
| High School Diploma | 0 (0.0%) | 0 (0.0%) |
| College or Associate's Degree | 0 (0.0%) | 0 (0.0%) |
| Bachelor's Degree | 0 (0.0%) | 0 (0.0%) |
| Graduate Degree | 0 (0.0%) | 0 (0.0%) |
| Total | 0 (0.0%) | 0 (0.0%) |
Employment Characteristics in Tranquillity
Employment by Class of Employer in Tranquillity
Among the 239 employed individuals in Tranquillity, private company employees (221 | 92.5%), and local government employees (18 | 7.5%) make up the most common classes of employment.
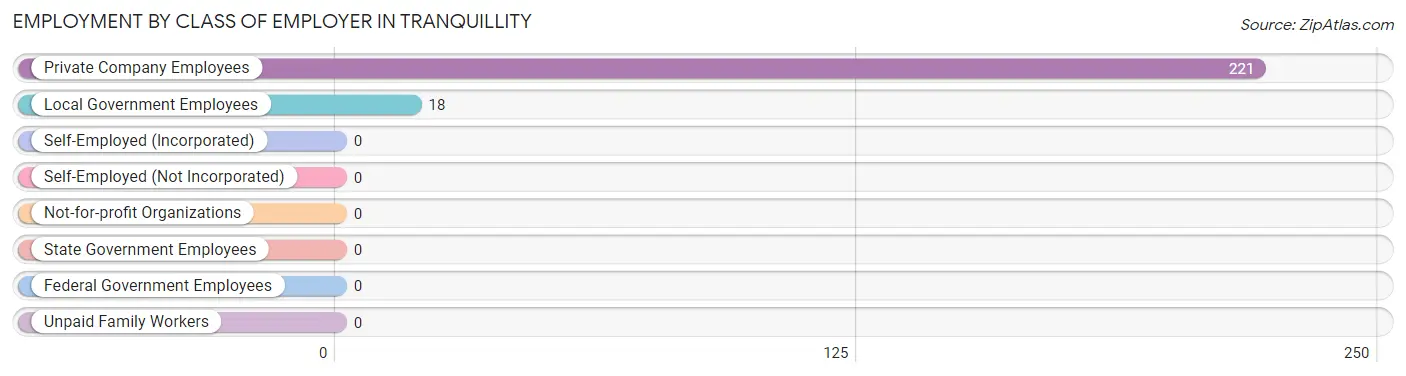
| Employer Class | # Employees | % Employees |
| Private Company Employees | 221 | 92.5% |
| Self-Employed (Incorporated) | 0 | 0.0% |
| Self-Employed (Not Incorporated) | 0 | 0.0% |
| Not-for-profit Organizations | 0 | 0.0% |
| Local Government Employees | 18 | 7.5% |
| State Government Employees | 0 | 0.0% |
| Federal Government Employees | 0 | 0.0% |
| Unpaid Family Workers | 0 | 0.0% |
| Total | 239 | 100.0% |
Employment Status by Age in Tranquillity
According to the labor force statistics for Tranquillity, out of the total population over 16 years of age (643), 49.9% or 321 individuals are in the labor force, with 19.0% or 61 of them unemployed. The age group with the highest labor force participation rate is 30 to 34 years, with 100.0% or 38 individuals in the labor force. Within the labor force, the 45 to 54 years age range has the highest percentage of unemployed individuals, with 53.8% or 21 of them being unemployed.
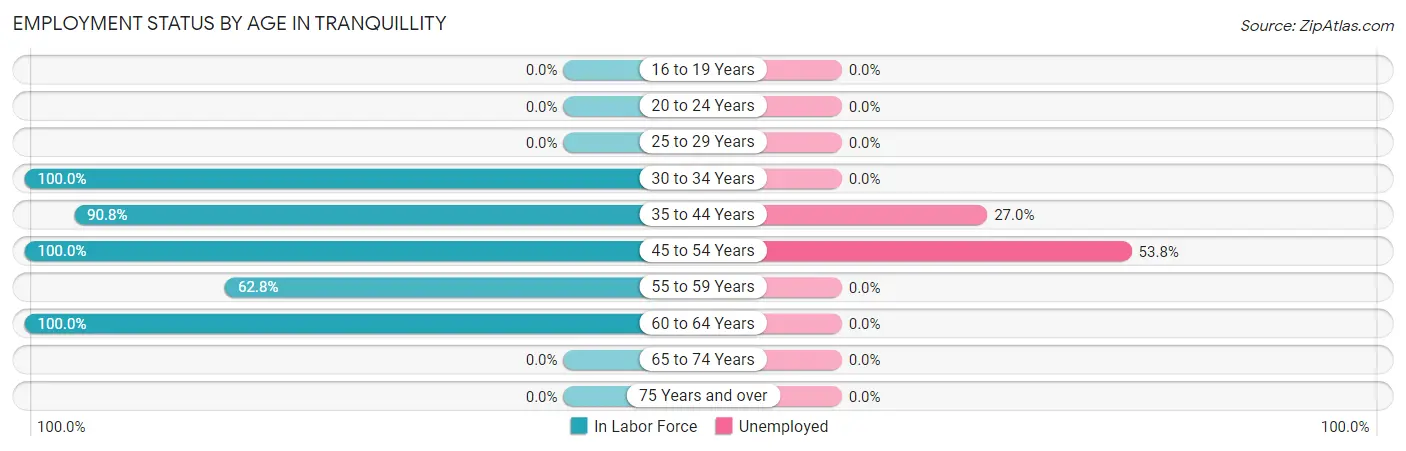
| Age Bracket | In Labor Force | Unemployed |
| 16 to 19 Years | 0 (0.0%) | 0 (0.0%) |
| 20 to 24 Years | 0 (0.0%) | 0 (0.0%) |
| 25 to 29 Years | 0 (0.0%) | 0 (0.0%) |
| 30 to 34 Years | 38 (100.0%) | 0 (0.0%) |
| 35 to 44 Years | 148 (90.8%) | 40 (27.0%) |
| 45 to 54 Years | 39 (100.0%) | 21 (53.8%) |
| 55 to 59 Years | 54 (62.8%) | 0 (0.0%) |
| 60 to 64 Years | 42 (100.0%) | 0 (0.0%) |
| 65 to 74 Years | 0 (0.0%) | 0 (0.0%) |
| 75 Years and over | 0 (0.0%) | 0 (0.0%) |
| Total | 321 (49.9%) | 61 (19.0%) |
Employment Status by Educational Attainment in Tranquillity
According to labor force statistics for Tranquillity, 87.2% of individuals (321) out of the total population between 25 and 64 years of age (368) are in the labor force, with 19.0% or 61 of them being unemployed. The group with the highest labor force participation rate are those with the educational attainment of college / associate degree, with 100.0% or 72 individuals in the labor force. Within the labor force, individuals with high school diploma education have the highest percentage of unemployment, with 28.2% or 22 of them being unemployed.
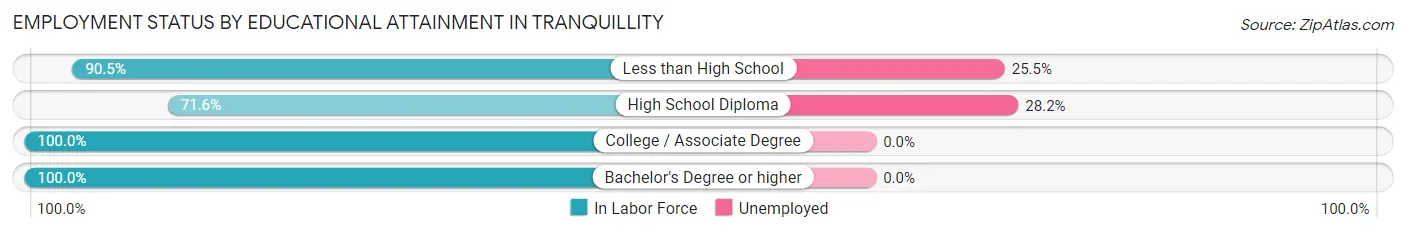
| Educational Attainment | In Labor Force | Unemployed |
| Less than High School | 153 (90.5%) | 43 (25.5%) |
| High School Diploma | 78 (71.6%) | 31 (28.2%) |
| College / Associate Degree | 72 (100.0%) | 0 (0.0%) |
| Bachelor's Degree or higher | 18 (100.0%) | 0 (0.0%) |
| Total | 321 (87.2%) | 70 (19.0%) |
Employment Occupations by Sex in Tranquillity
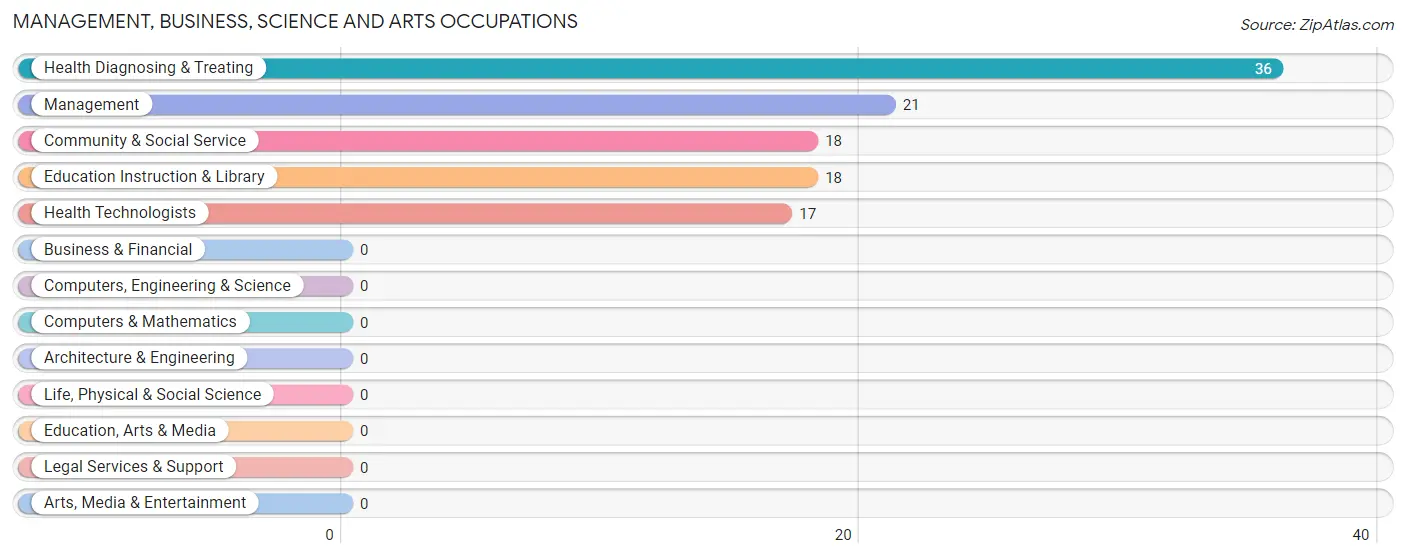
Management, Business, Science and Arts Occupations
The most common Management, Business, Science and Arts occupations in Tranquillity are Health Diagnosing & Treating (36 | 13.9%), Management (21 | 8.1%), Community & Social Service (18 | 6.9%), Education Instruction & Library (18 | 6.9%), and Health Technologists (17 | 6.5%).
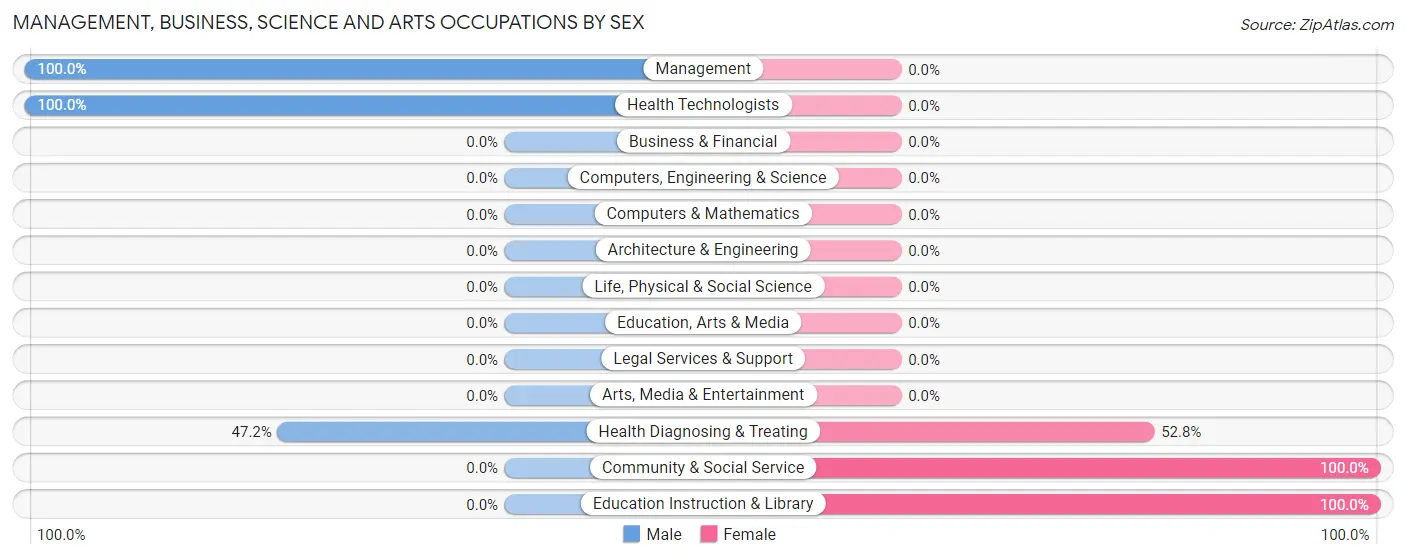
Management, Business, Science and Arts Occupations by Sex
Within the Management, Business, Science and Arts occupations in Tranquillity, the most male-oriented occupations are Management (100.0%), Health Technologists (100.0%), and Health Diagnosing & Treating (47.2%), while the most female-oriented occupations are Community & Social Service (100.0%), Education Instruction & Library (100.0%), and Health Diagnosing & Treating (52.8%).
| Occupation | Male | Female |
| Management | 21 (100.0%) | 0 (0.0%) |
| Business & Financial | 0 (0.0%) | 0 (0.0%) |
| Computers, Engineering & Science | 0 (0.0%) | 0 (0.0%) |
| Computers & Mathematics | 0 (0.0%) | 0 (0.0%) |
| Architecture & Engineering | 0 (0.0%) | 0 (0.0%) |
| Life, Physical & Social Science | 0 (0.0%) | 0 (0.0%) |
| Community & Social Service | 0 (0.0%) | 18 (100.0%) |
| Education, Arts & Media | 0 (0.0%) | 0 (0.0%) |
| Legal Services & Support | 0 (0.0%) | 0 (0.0%) |
| Education Instruction & Library | 0 (0.0%) | 18 (100.0%) |
| Arts, Media & Entertainment | 0 (0.0%) | 0 (0.0%) |
| Health Diagnosing & Treating | 17 (47.2%) | 19 (52.8%) |
| Health Technologists | 17 (100.0%) | 0 (0.0%) |
| Total (Category) | 38 (50.7%) | 37 (49.3%) |
| Total (Overall) | 173 (66.5%) | 87 (33.5%) |
Services Occupations
Services Occupations by Sex
| Occupation | Male | Female |
| Healthcare Support | 0 (0.0%) | 0 (0.0%) |
| Security & Protection | 0 (0.0%) | 0 (0.0%) |
| Firefighting & Prevention | 0 (0.0%) | 0 (0.0%) |
| Law Enforcement | 0 (0.0%) | 0 (0.0%) |
| Food Preparation & Serving | 0 (0.0%) | 0 (0.0%) |
| Cleaning & Maintenance | 0 (0.0%) | 0 (0.0%) |
| Personal Care & Service | 0 (0.0%) | 0 (0.0%) |
| Total (Category) | 0 (0.0%) | 0 (0.0%) |
| Total (Overall) | 173 (66.5%) | 87 (33.5%) |
Sales and Office Occupations
The most common Sales and Office occupations in Tranquillity are , and Office & Administration (37 | 14.2%).
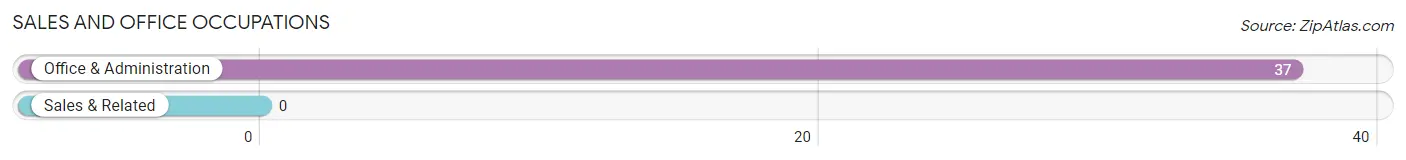
Sales and Office Occupations by Sex
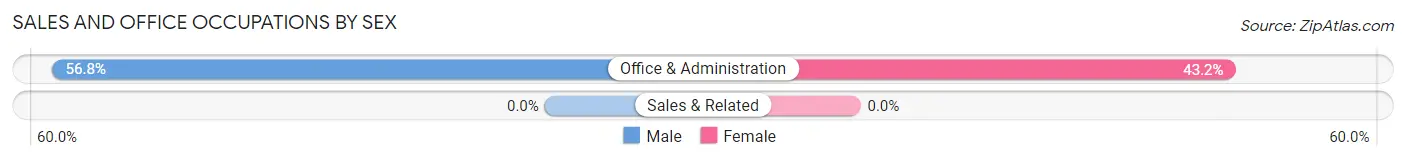
| Occupation | Male | Female |
| Sales & Related | 0 (0.0%) | 0 (0.0%) |
| Office & Administration | 21 (56.8%) | 16 (43.2%) |
| Total (Category) | 21 (56.8%) | 16 (43.2%) |
| Total (Overall) | 173 (66.5%) | 87 (33.5%) |
Natural Resources, Construction and Maintenance Occupations
The most common Natural Resources, Construction and Maintenance occupations in Tranquillity are Farming, Fishing & Forestry (92 | 35.4%), and Construction & Extraction (19 | 7.3%).
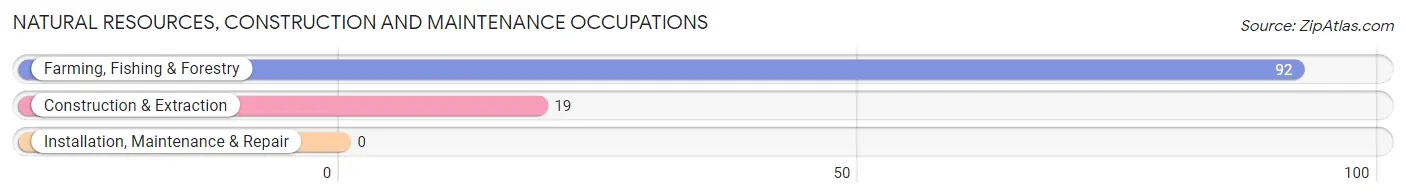
Natural Resources, Construction and Maintenance Occupations by Sex
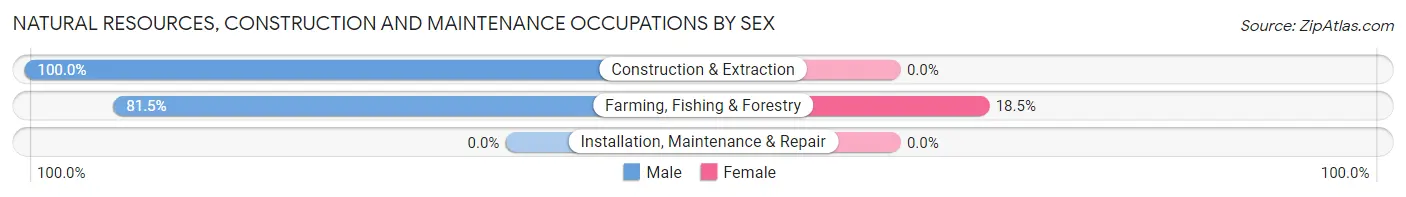
| Occupation | Male | Female |
| Farming, Fishing & Forestry | 75 (81.5%) | 17 (18.5%) |
| Construction & Extraction | 19 (100.0%) | 0 (0.0%) |
| Installation, Maintenance & Repair | 0 (0.0%) | 0 (0.0%) |
| Total (Category) | 94 (84.7%) | 17 (15.3%) |
| Total (Overall) | 173 (66.5%) | 87 (33.5%) |
Production, Transportation and Moving Occupations
The most common Production, Transportation and Moving occupations in Tranquillity are , and Production (37 | 14.2%).
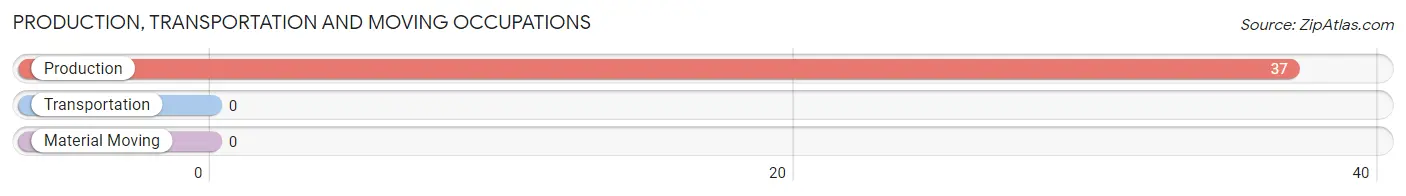
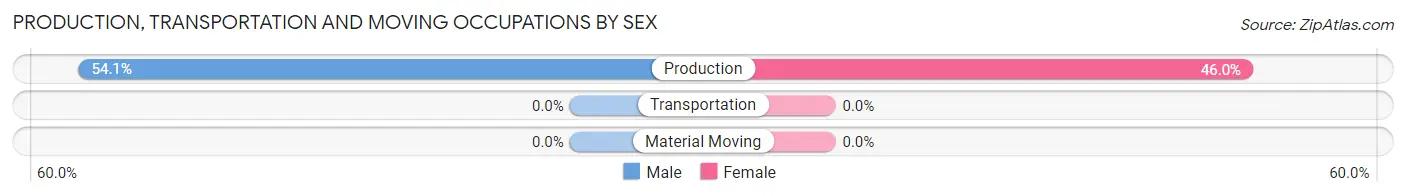
Production, Transportation and Moving Occupations by Sex
| Occupation | Male | Female |
| Production | 20 (54.0%) | 17 (46.0%) |
| Transportation | 0 (0.0%) | 0 (0.0%) |
| Material Moving | 0 (0.0%) | 0 (0.0%) |
| Total (Category) | 20 (54.0%) | 17 (46.0%) |
| Total (Overall) | 173 (66.5%) | 87 (33.5%) |
Employment Industries by Sex in Tranquillity
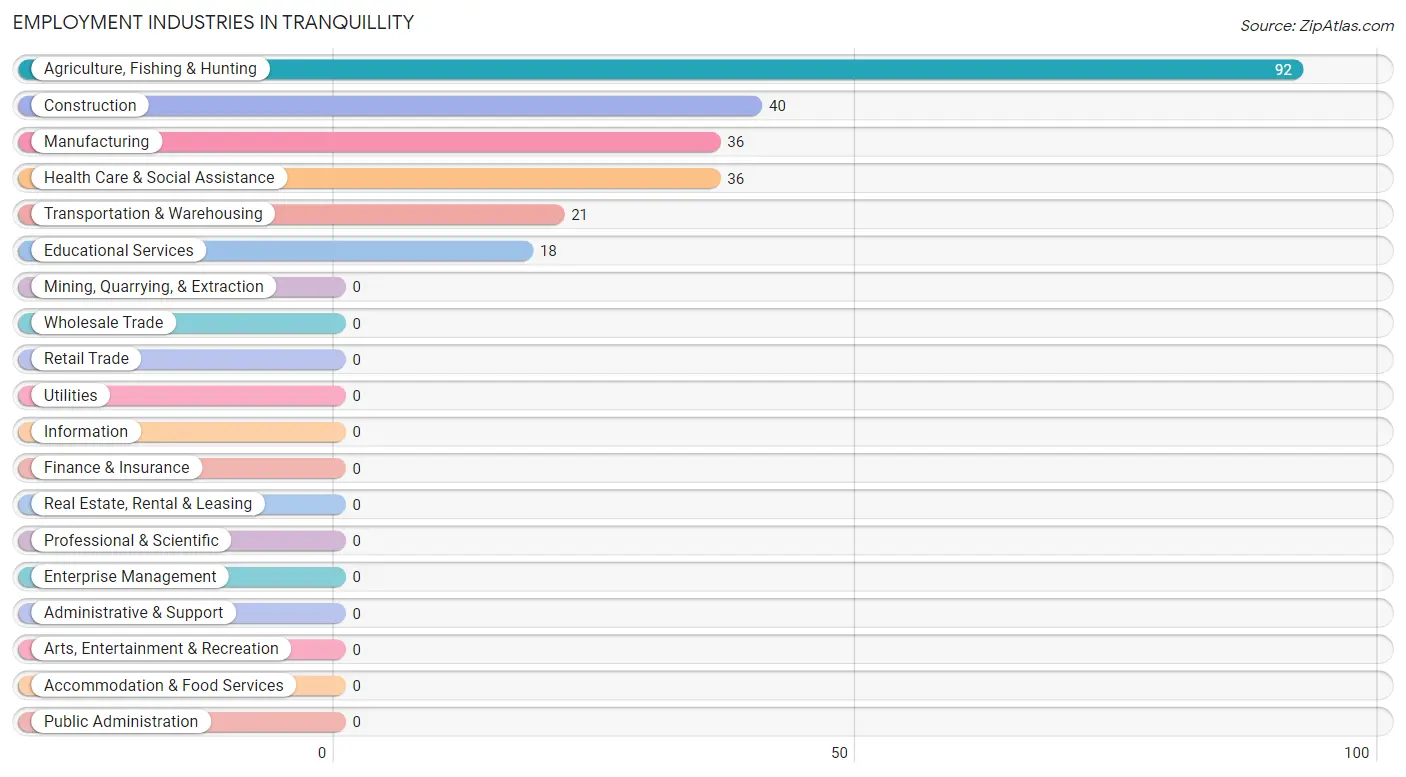
Employment Industries in Tranquillity
The major employment industries in Tranquillity include Agriculture, Fishing & Hunting (92 | 35.4%), Construction (40 | 15.4%), Manufacturing (36 | 13.9%), Health Care & Social Assistance (36 | 13.9%), and Transportation & Warehousing (21 | 8.1%).
Employment Industries by Sex in Tranquillity
The Tranquillity industries that see more men than women are Construction (100.0%), Transportation & Warehousing (100.0%), and Agriculture, Fishing & Hunting (81.5%), whereas the industries that tend to have a higher number of women are Educational Services (100.0%), Health Care & Social Assistance (52.8%), and Manufacturing (44.4%).
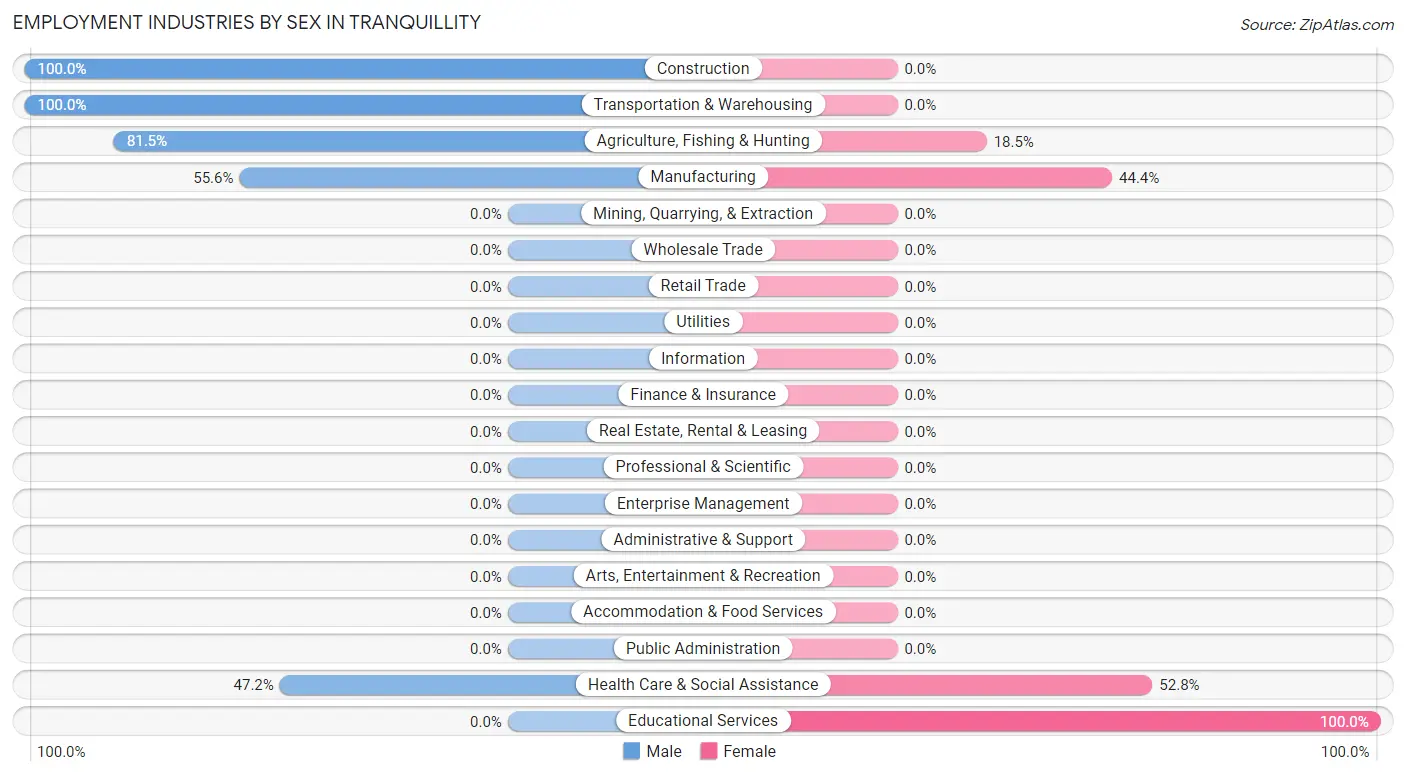
| Industry | Male | Female |
| Agriculture, Fishing & Hunting | 75 (81.5%) | 17 (18.5%) |
| Mining, Quarrying, & Extraction | 0 (0.0%) | 0 (0.0%) |
| Construction | 40 (100.0%) | 0 (0.0%) |
| Manufacturing | 20 (55.6%) | 16 (44.4%) |
| Wholesale Trade | 0 (0.0%) | 0 (0.0%) |
| Retail Trade | 0 (0.0%) | 0 (0.0%) |
| Transportation & Warehousing | 21 (100.0%) | 0 (0.0%) |
| Utilities | 0 (0.0%) | 0 (0.0%) |
| Information | 0 (0.0%) | 0 (0.0%) |
| Finance & Insurance | 0 (0.0%) | 0 (0.0%) |
| Real Estate, Rental & Leasing | 0 (0.0%) | 0 (0.0%) |
| Professional & Scientific | 0 (0.0%) | 0 (0.0%) |
| Enterprise Management | 0 (0.0%) | 0 (0.0%) |
| Administrative & Support | 0 (0.0%) | 0 (0.0%) |
| Educational Services | 0 (0.0%) | 18 (100.0%) |
| Health Care & Social Assistance | 17 (47.2%) | 19 (52.8%) |
| Arts, Entertainment & Recreation | 0 (0.0%) | 0 (0.0%) |
| Accommodation & Food Services | 0 (0.0%) | 0 (0.0%) |
| Public Administration | 0 (0.0%) | 0 (0.0%) |
| Total | 173 (66.5%) | 87 (33.5%) |
Education in Tranquillity
School Enrollment in Tranquillity
The most common levels of schooling among the 165 students in Tranquillity are high school (73 | 44.2%), elementary school (36 | 21.8%), and middle school (34 | 20.6%).
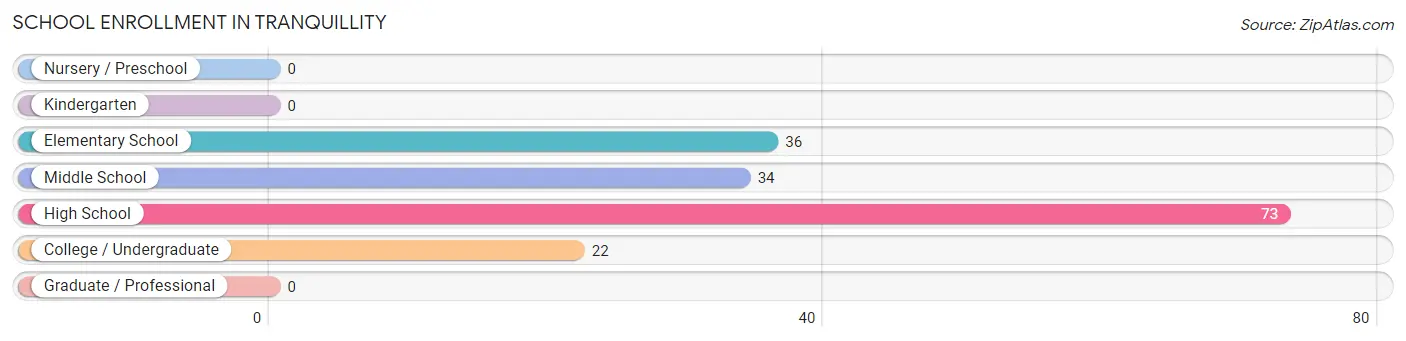
| School Level | # Students | % Students |
| Nursery / Preschool | 0 | 0.0% |
| Kindergarten | 0 | 0.0% |
| Elementary School | 36 | 21.8% |
| Middle School | 34 | 20.6% |
| High School | 73 | 44.2% |
| College / Undergraduate | 22 | 13.3% |
| Graduate / Professional | 0 | 0.0% |
| Total | 165 | 100.0% |
School Enrollment by Age by Funding Source in Tranquillity
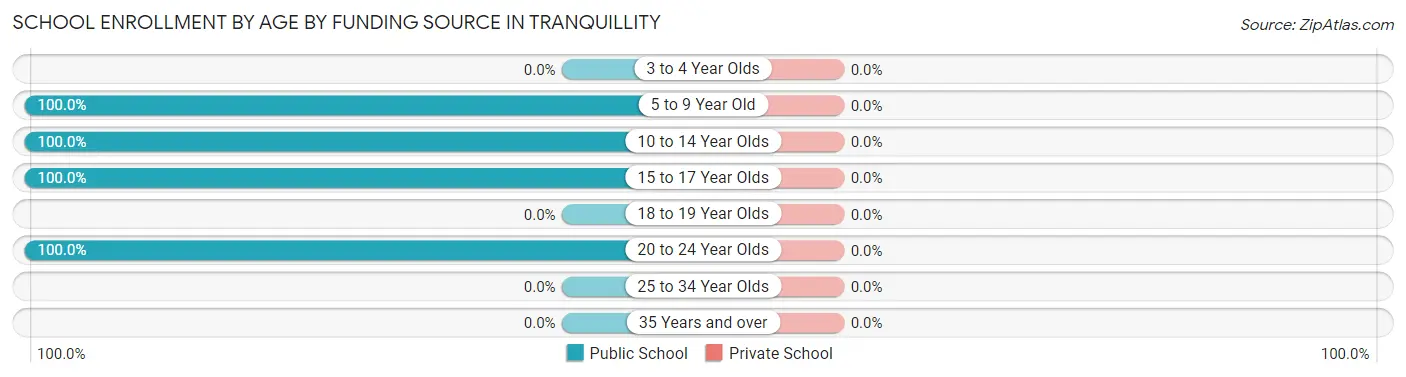
| Age Bracket | Public School | Private School |
| 3 to 4 Year Olds | 0 (0.0%) | 0 (0.0%) |
| 5 to 9 Year Old | 36 (100.0%) | 0 (0.0%) |
| 10 to 14 Year Olds | 50 (100.0%) | 0 (0.0%) |
| 15 to 17 Year Olds | 57 (100.0%) | 0 (0.0%) |
| 18 to 19 Year Olds | 0 (0.0%) | 0 (0.0%) |
| 20 to 24 Year Olds | 22 (100.0%) | 0 (0.0%) |
| 25 to 34 Year Olds | 0 (0.0%) | 0 (0.0%) |
| 35 Years and over | 0 (0.0%) | 0 (0.0%) |
| Total | 165 (100.0%) | 0 (0.0%) |
Educational Attainment by Field of Study in Tranquillity
, and education (18 | 100.0%) are the most common fields of study among 18 individuals in Tranquillity who have obtained a bachelor's degree or higher.
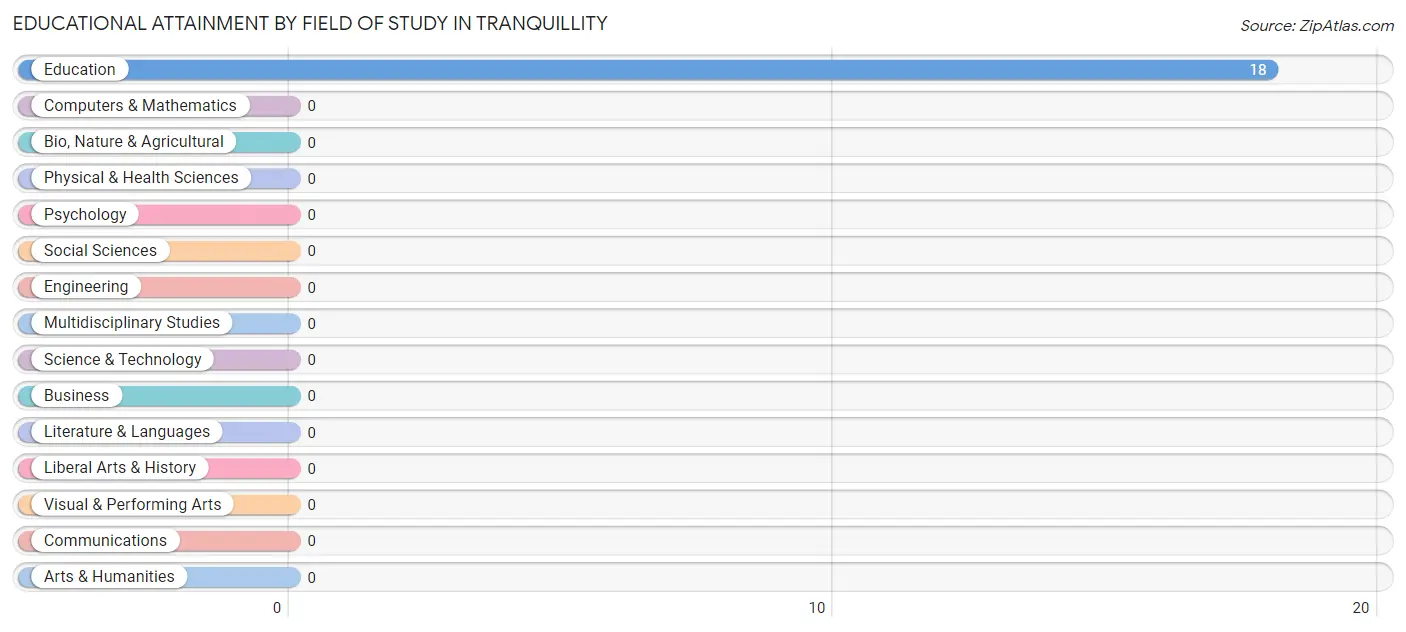
| Field of Study | # Graduates | % Graduates |
| Computers & Mathematics | 0 | 0.0% |
| Bio, Nature & Agricultural | 0 | 0.0% |
| Physical & Health Sciences | 0 | 0.0% |
| Psychology | 0 | 0.0% |
| Social Sciences | 0 | 0.0% |
| Engineering | 0 | 0.0% |
| Multidisciplinary Studies | 0 | 0.0% |
| Science & Technology | 0 | 0.0% |
| Business | 0 | 0.0% |
| Education | 18 | 100.0% |
| Literature & Languages | 0 | 0.0% |
| Liberal Arts & History | 0 | 0.0% |
| Visual & Performing Arts | 0 | 0.0% |
| Communications | 0 | 0.0% |
| Arts & Humanities | 0 | 0.0% |
| Total | 18 | 100.0% |
Transportation & Commute in Tranquillity
Vehicle Availability by Sex in Tranquillity
The most prevalent vehicle ownership categories in Tranquillity are males with 2 vehicles (92, accounting for 60.5%) and females with 2 vehicles (54, making up 105.8%).
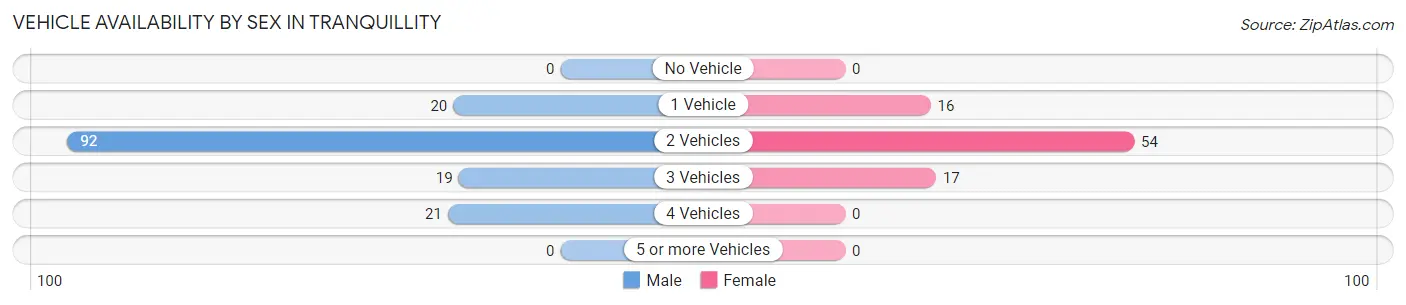
| Vehicles Available | Male | Female |
| No Vehicle | 0 (0.0%) | 0 (0.0%) |
| 1 Vehicle | 20 (13.2%) | 16 (18.4%) |
| 2 Vehicles | 92 (60.5%) | 54 (62.1%) |
| 3 Vehicles | 19 (12.5%) | 17 (19.5%) |
| 4 Vehicles | 21 (13.8%) | 0 (0.0%) |
| 5 or more Vehicles | 0 (0.0%) | 0 (0.0%) |
| Total | 152 (100.0%) | 87 (100.0%) |
Commute Time in Tranquillity
The most frequently occuring commute durations in Tranquillity are 30 to 34 minutes (72 commuters, 39.8%), 5 to 9 minutes (53 commuters, 29.3%), and 10 to 14 minutes (35 commuters, 19.3%).
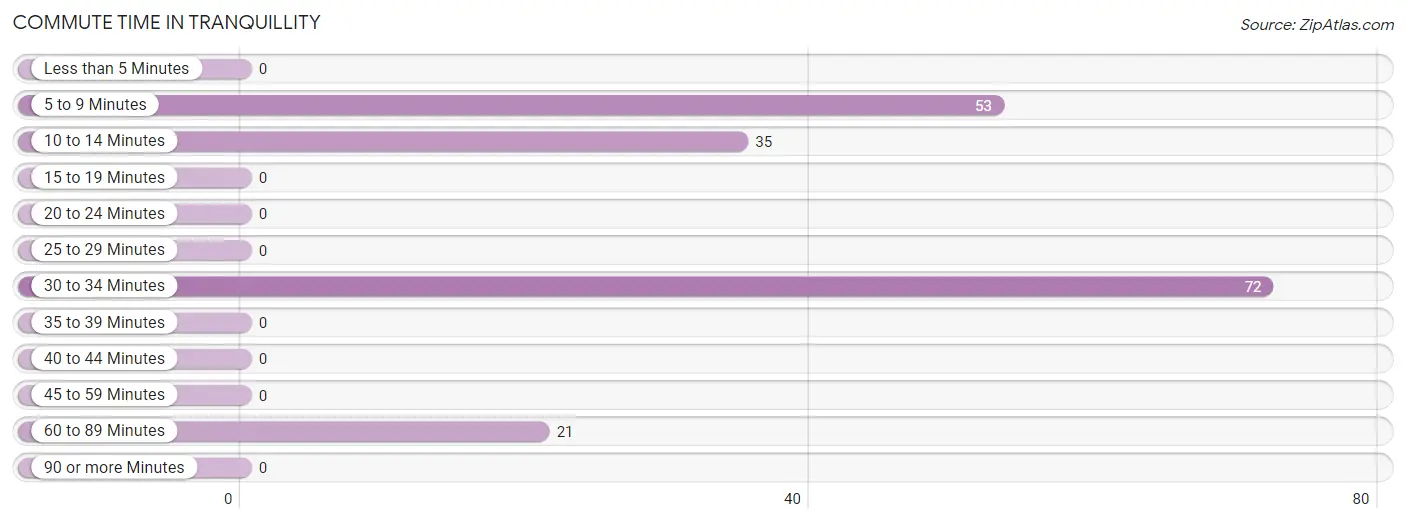
| Commute Time | # Commuters | % Commuters |
| Less than 5 Minutes | 0 | 0.0% |
| 5 to 9 Minutes | 53 | 29.3% |
| 10 to 14 Minutes | 35 | 19.3% |
| 15 to 19 Minutes | 0 | 0.0% |
| 20 to 24 Minutes | 0 | 0.0% |
| 25 to 29 Minutes | 0 | 0.0% |
| 30 to 34 Minutes | 72 | 39.8% |
| 35 to 39 Minutes | 0 | 0.0% |
| 40 to 44 Minutes | 0 | 0.0% |
| 45 to 59 Minutes | 0 | 0.0% |
| 60 to 89 Minutes | 21 | 11.6% |
| 90 or more Minutes | 0 | 0.0% |
Commute Time by Sex in Tranquillity
The most common commute times in Tranquillity are 30 to 34 minutes (55 commuters, 48.7%) for males and 5 to 9 minutes (34 commuters, 50.0%) for females.
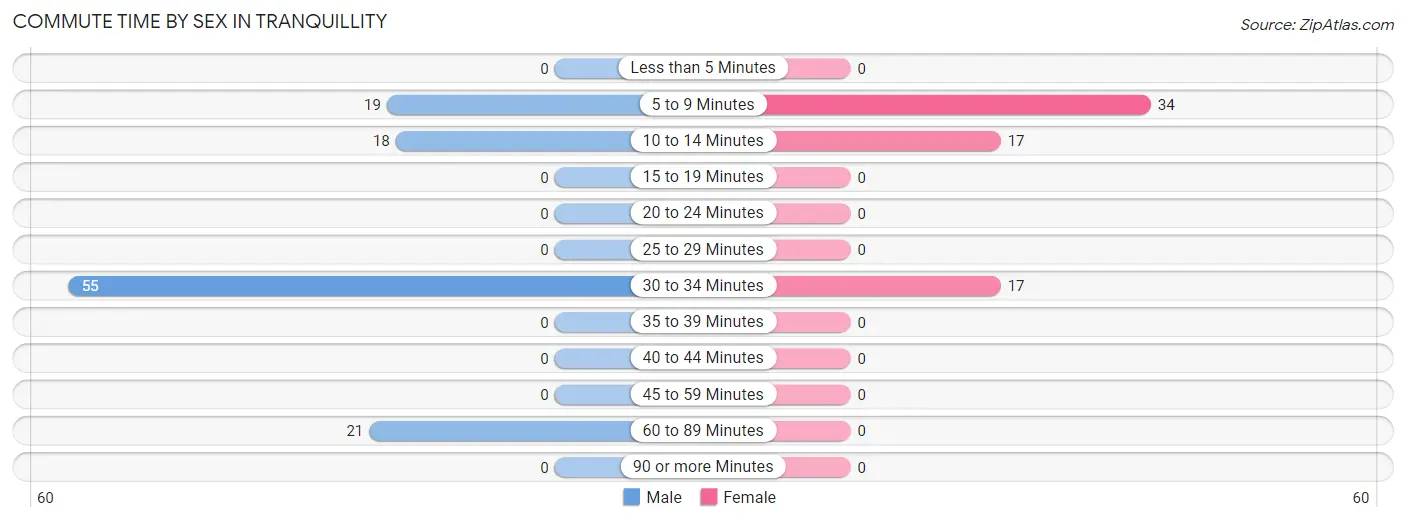
| Commute Time | Male | Female |
| Less than 5 Minutes | 0 (0.0%) | 0 (0.0%) |
| 5 to 9 Minutes | 19 (16.8%) | 34 (50.0%) |
| 10 to 14 Minutes | 18 (15.9%) | 17 (25.0%) |
| 15 to 19 Minutes | 0 (0.0%) | 0 (0.0%) |
| 20 to 24 Minutes | 0 (0.0%) | 0 (0.0%) |
| 25 to 29 Minutes | 0 (0.0%) | 0 (0.0%) |
| 30 to 34 Minutes | 55 (48.7%) | 17 (25.0%) |
| 35 to 39 Minutes | 0 (0.0%) | 0 (0.0%) |
| 40 to 44 Minutes | 0 (0.0%) | 0 (0.0%) |
| 45 to 59 Minutes | 0 (0.0%) | 0 (0.0%) |
| 60 to 89 Minutes | 21 (18.6%) | 0 (0.0%) |
| 90 or more Minutes | 0 (0.0%) | 0 (0.0%) |
Time of Departure to Work by Sex in Tranquillity
The most frequent times of departure to work in Tranquillity are 8:00 AM to 8:29 AM (21, 18.6%) for males and 12:00 AM to 4:59 AM (33, 48.5%) for females.
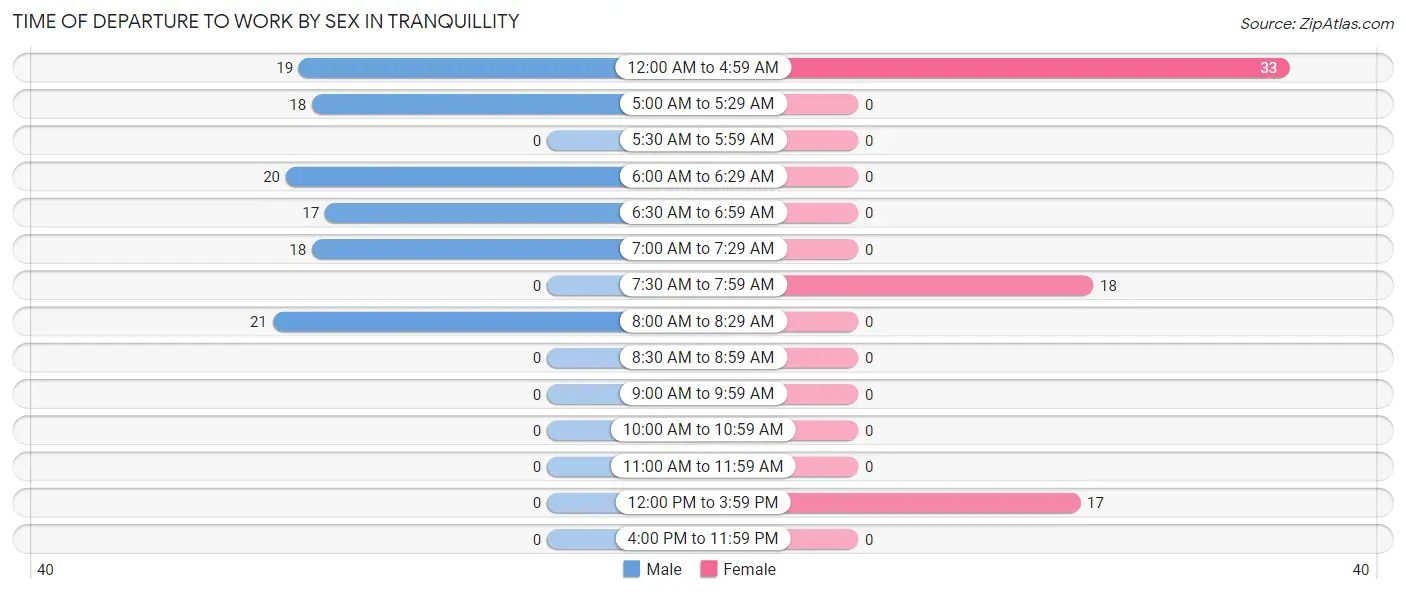
| Time of Departure | Male | Female |
| 12:00 AM to 4:59 AM | 19 (16.8%) | 33 (48.5%) |
| 5:00 AM to 5:29 AM | 18 (15.9%) | 0 (0.0%) |
| 5:30 AM to 5:59 AM | 0 (0.0%) | 0 (0.0%) |
| 6:00 AM to 6:29 AM | 20 (17.7%) | 0 (0.0%) |
| 6:30 AM to 6:59 AM | 17 (15.0%) | 0 (0.0%) |
| 7:00 AM to 7:29 AM | 18 (15.9%) | 0 (0.0%) |
| 7:30 AM to 7:59 AM | 0 (0.0%) | 18 (26.5%) |
| 8:00 AM to 8:29 AM | 21 (18.6%) | 0 (0.0%) |
| 8:30 AM to 8:59 AM | 0 (0.0%) | 0 (0.0%) |
| 9:00 AM to 9:59 AM | 0 (0.0%) | 0 (0.0%) |
| 10:00 AM to 10:59 AM | 0 (0.0%) | 0 (0.0%) |
| 11:00 AM to 11:59 AM | 0 (0.0%) | 0 (0.0%) |
| 12:00 PM to 3:59 PM | 0 (0.0%) | 17 (25.0%) |
| 4:00 PM to 11:59 PM | 0 (0.0%) | 0 (0.0%) |
| Total | 113 (100.0%) | 68 (100.0%) |
Housing Occupancy in Tranquillity
Occupancy by Ownership in Tranquillity
Of the total 254 dwellings in Tranquillity, owner-occupied units account for 164 (64.6%), while renter-occupied units make up 90 (35.4%).
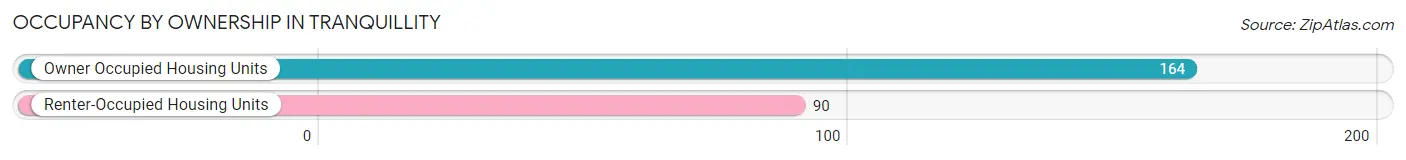
| Occupancy | # Housing Units | % Housing Units |
| Owner Occupied Housing Units | 164 | 64.6% |
| Renter-Occupied Housing Units | 90 | 35.4% |
| Total Occupied Housing Units | 254 | 100.0% |
Occupancy by Household Size in Tranquillity
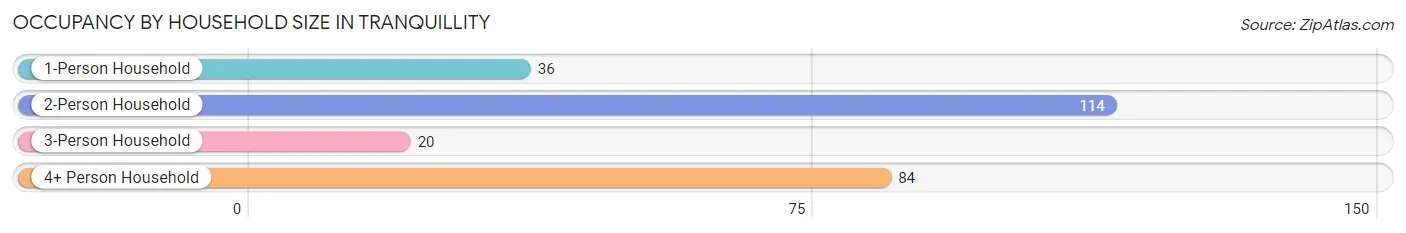
| Household Size | # Housing Units | % Housing Units |
| 1-Person Household | 36 | 14.2% |
| 2-Person Household | 114 | 44.9% |
| 3-Person Household | 20 | 7.9% |
| 4+ Person Household | 84 | 33.1% |
| Total Housing Units | 254 | 100.0% |
Occupancy by Ownership by Household Size in Tranquillity
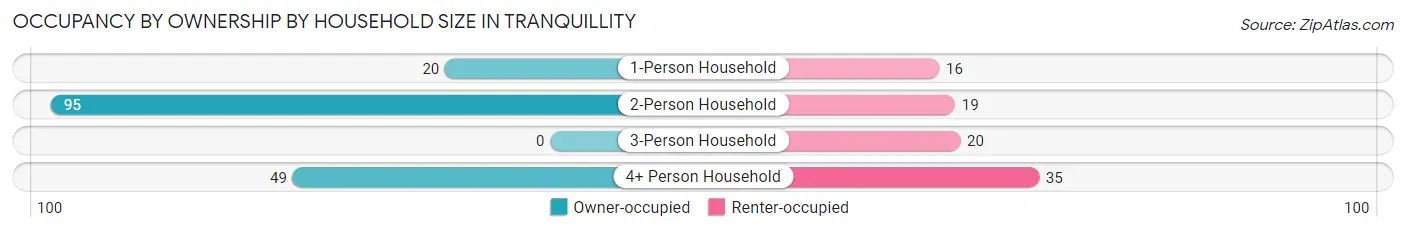
| Household Size | Owner-occupied | Renter-occupied |
| 1-Person Household | 20 (55.6%) | 16 (44.4%) |
| 2-Person Household | 95 (83.3%) | 19 (16.7%) |
| 3-Person Household | 0 (0.0%) | 20 (100.0%) |
| 4+ Person Household | 49 (58.3%) | 35 (41.7%) |
| Total Housing Units | 164 (64.6%) | 90 (35.4%) |
Occupancy by Educational Attainment in Tranquillity
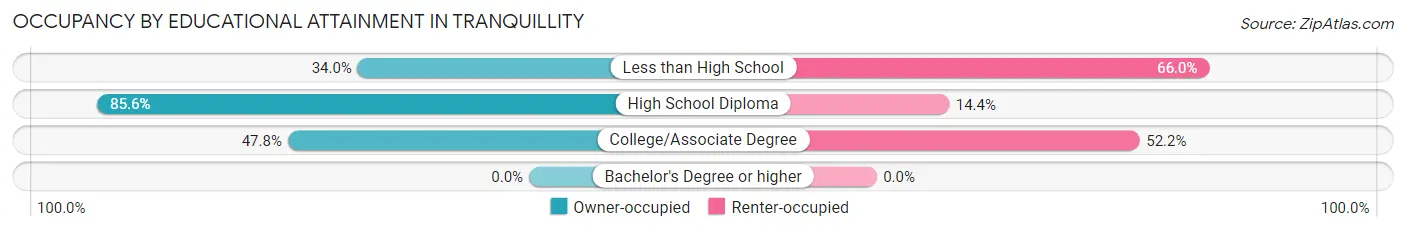
| Household Size | Owner-occupied | Renter-occupied |
| Less than High School | 18 (34.0%) | 35 (66.0%) |
| High School Diploma | 113 (85.6%) | 19 (14.4%) |
| College/Associate Degree | 33 (47.8%) | 36 (52.2%) |
| Bachelor's Degree or higher | 0 (0.0%) | 0 (0.0%) |
Occupancy by Age of Householder in Tranquillity
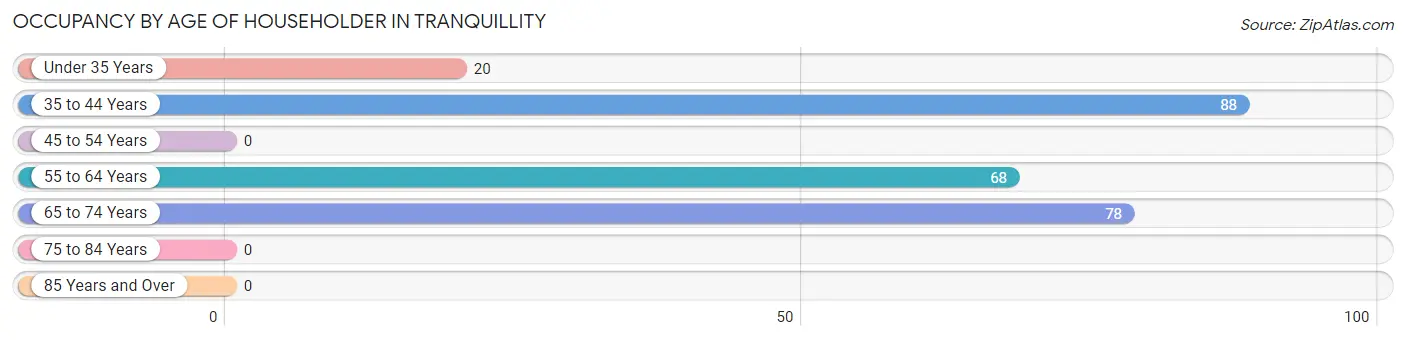
| Age Bracket | # Households | % Households |
| Under 35 Years | 20 | 7.9% |
| 35 to 44 Years | 88 | 34.6% |
| 45 to 54 Years | 0 | 0.0% |
| 55 to 64 Years | 68 | 26.8% |
| 65 to 74 Years | 78 | 30.7% |
| 75 to 84 Years | 0 | 0.0% |
| 85 Years and Over | 0 | 0.0% |
| Total | 254 | 100.0% |
Housing Finances in Tranquillity
Median Income by Occupancy in Tranquillity
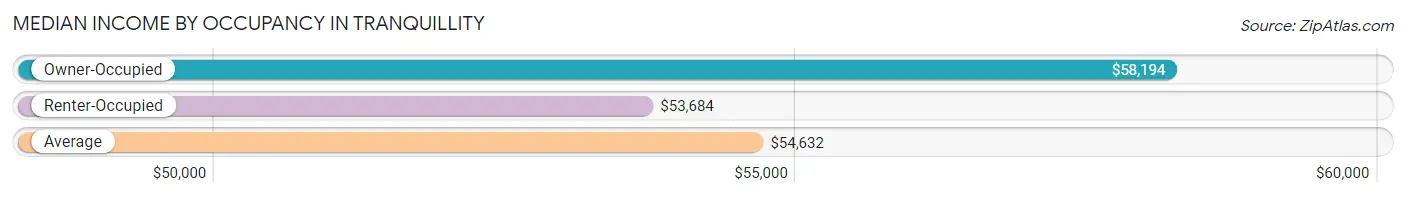
| Occupancy Type | # Households | Median Income |
| Owner-Occupied | 164 (64.6%) | $58,194 |
| Renter-Occupied | 90 (35.4%) | $53,684 |
| Average | 254 (100.0%) | $54,632 |
Occupancy by Householder Income Bracket in Tranquillity
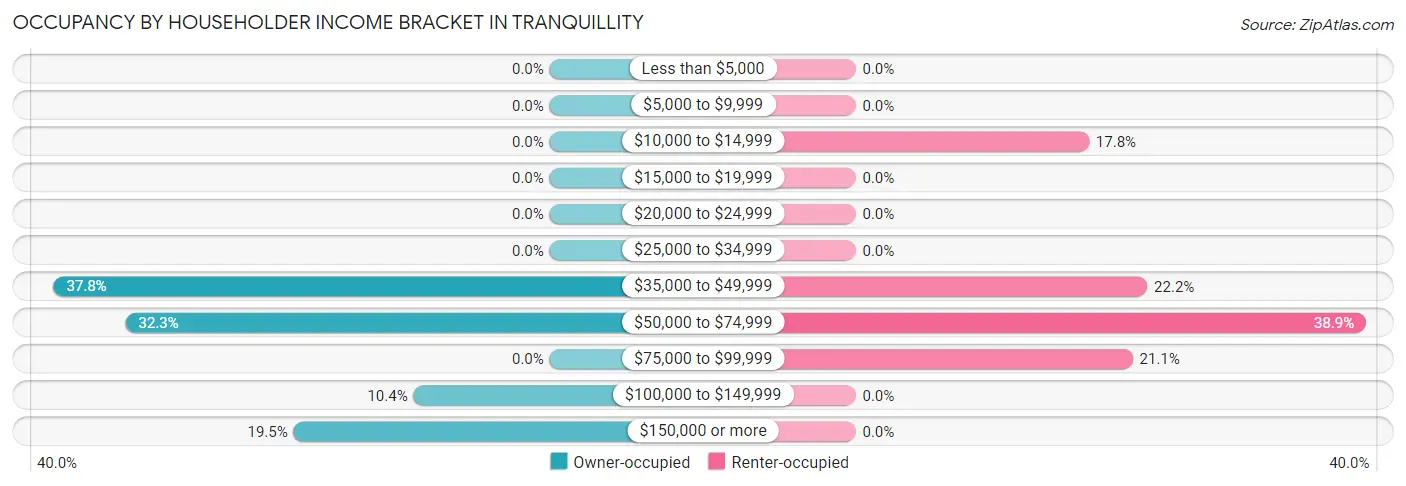
| Income Bracket | Owner-occupied | Renter-occupied |
| Less than $5,000 | 0 (0.0%) | 0 (0.0%) |
| $5,000 to $9,999 | 0 (0.0%) | 0 (0.0%) |
| $10,000 to $14,999 | 0 (0.0%) | 16 (17.8%) |
| $15,000 to $19,999 | 0 (0.0%) | 0 (0.0%) |
| $20,000 to $24,999 | 0 (0.0%) | 0 (0.0%) |
| $25,000 to $34,999 | 0 (0.0%) | 0 (0.0%) |
| $35,000 to $49,999 | 62 (37.8%) | 20 (22.2%) |
| $50,000 to $74,999 | 53 (32.3%) | 35 (38.9%) |
| $75,000 to $99,999 | 0 (0.0%) | 19 (21.1%) |
| $100,000 to $149,999 | 17 (10.4%) | 0 (0.0%) |
| $150,000 or more | 32 (19.5%) | 0 (0.0%) |
| Total | 164 (100.0%) | 90 (100.0%) |
Monthly Housing Cost Tiers in Tranquillity
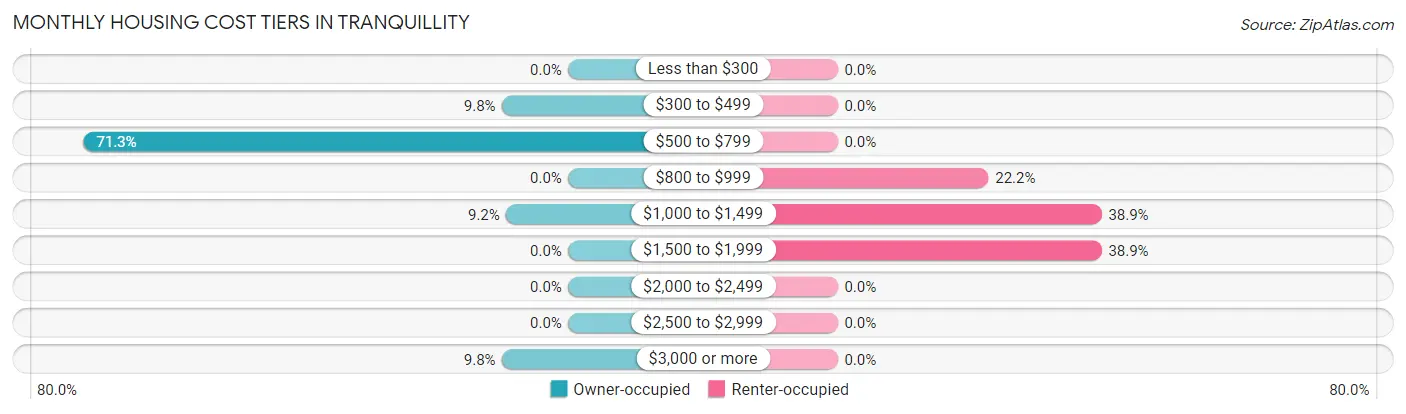
| Monthly Cost | Owner-occupied | Renter-occupied |
| Less than $300 | 0 (0.0%) | 0 (0.0%) |
| $300 to $499 | 16 (9.8%) | 0 (0.0%) |
| $500 to $799 | 117 (71.3%) | 0 (0.0%) |
| $800 to $999 | 0 (0.0%) | 20 (22.2%) |
| $1,000 to $1,499 | 15 (9.1%) | 35 (38.9%) |
| $1,500 to $1,999 | 0 (0.0%) | 35 (38.9%) |
| $2,000 to $2,499 | 0 (0.0%) | 0 (0.0%) |
| $2,500 to $2,999 | 0 (0.0%) | 0 (0.0%) |
| $3,000 or more | 16 (9.8%) | 0 (0.0%) |
| Total | 164 (100.0%) | 90 (100.0%) |
Physical Housing Characteristics in Tranquillity
Housing Structures in Tranquillity
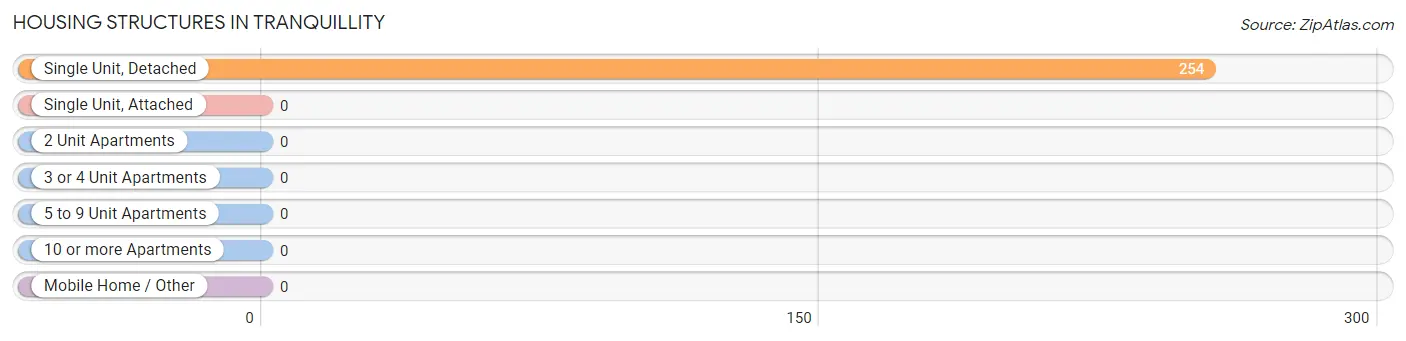
| Structure Type | # Housing Units | % Housing Units |
| Single Unit, Detached | 254 | 100.0% |
| Single Unit, Attached | 0 | 0.0% |
| 2 Unit Apartments | 0 | 0.0% |
| 3 or 4 Unit Apartments | 0 | 0.0% |
| 5 to 9 Unit Apartments | 0 | 0.0% |
| 10 or more Apartments | 0 | 0.0% |
| Mobile Home / Other | 0 | 0.0% |
| Total | 254 | 100.0% |
Housing Structures by Occupancy in Tranquillity
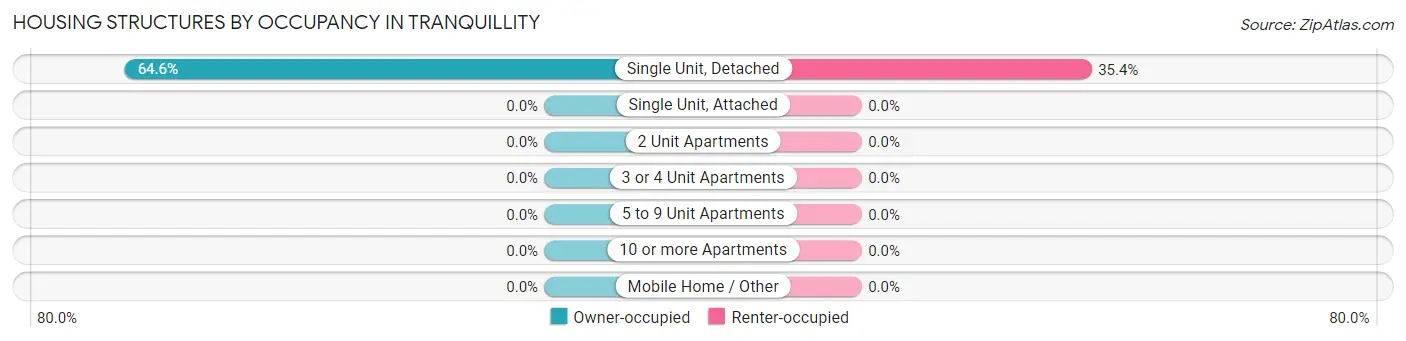
| Structure Type | Owner-occupied | Renter-occupied |
| Single Unit, Detached | 164 (64.6%) | 90 (35.4%) |
| Single Unit, Attached | 0 (0.0%) | 0 (0.0%) |
| 2 Unit Apartments | 0 (0.0%) | 0 (0.0%) |
| 3 or 4 Unit Apartments | 0 (0.0%) | 0 (0.0%) |
| 5 to 9 Unit Apartments | 0 (0.0%) | 0 (0.0%) |
| 10 or more Apartments | 0 (0.0%) | 0 (0.0%) |
| Mobile Home / Other | 0 (0.0%) | 0 (0.0%) |
| Total | 164 (64.6%) | 90 (35.4%) |
Housing Structures by Number of Rooms in Tranquillity
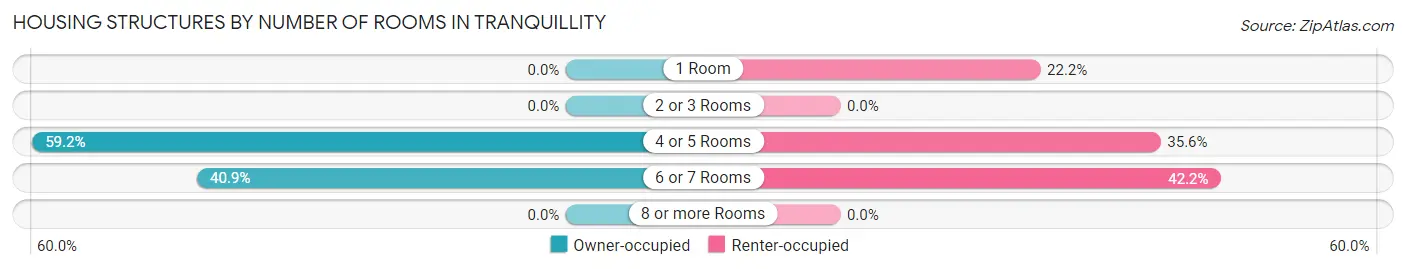
| Number of Rooms | Owner-occupied | Renter-occupied |
| 1 Room | 0 (0.0%) | 20 (22.2%) |
| 2 or 3 Rooms | 0 (0.0%) | 0 (0.0%) |
| 4 or 5 Rooms | 97 (59.2%) | 32 (35.6%) |
| 6 or 7 Rooms | 67 (40.8%) | 38 (42.2%) |
| 8 or more Rooms | 0 (0.0%) | 0 (0.0%) |
| Total | 164 (100.0%) | 90 (100.0%) |
Housing Structure by Heating Type in Tranquillity
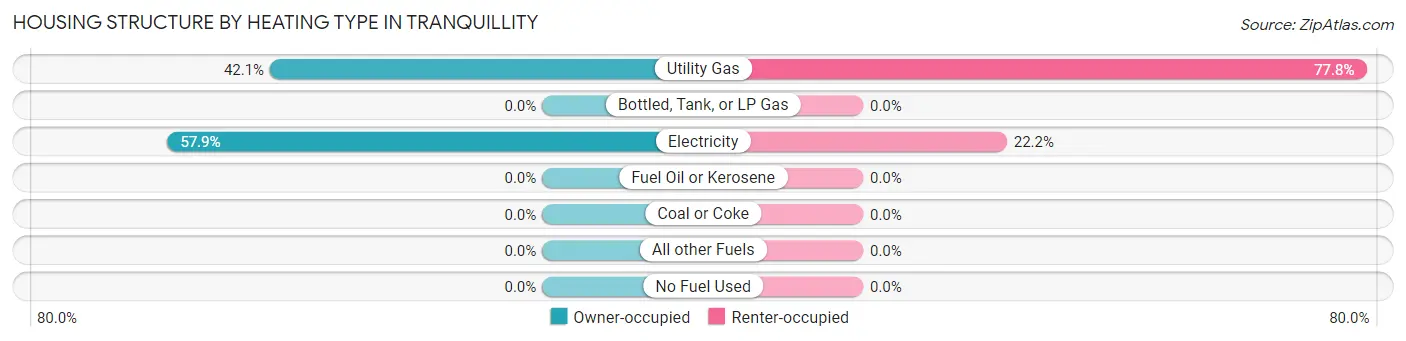
| Heating Type | Owner-occupied | Renter-occupied |
| Utility Gas | 69 (42.1%) | 70 (77.8%) |
| Bottled, Tank, or LP Gas | 0 (0.0%) | 0 (0.0%) |
| Electricity | 95 (57.9%) | 20 (22.2%) |
| Fuel Oil or Kerosene | 0 (0.0%) | 0 (0.0%) |
| Coal or Coke | 0 (0.0%) | 0 (0.0%) |
| All other Fuels | 0 (0.0%) | 0 (0.0%) |
| No Fuel Used | 0 (0.0%) | 0 (0.0%) |
| Total | 164 (100.0%) | 90 (100.0%) |
Household Vehicle Usage in Tranquillity
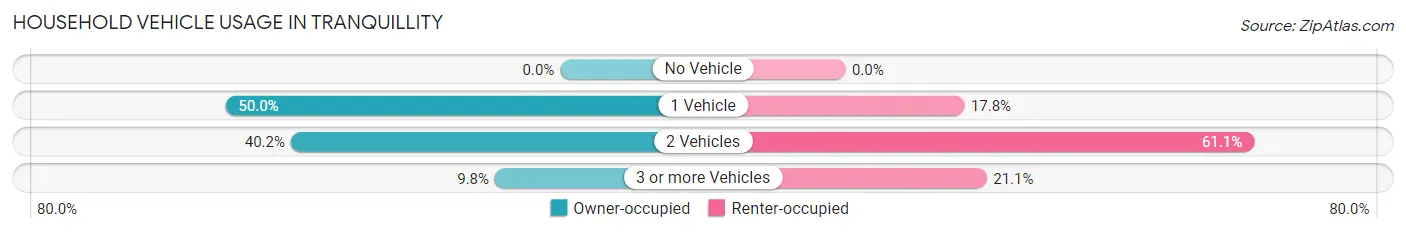
| Vehicles per Household | Owner-occupied | Renter-occupied |
| No Vehicle | 0 (0.0%) | 0 (0.0%) |
| 1 Vehicle | 82 (50.0%) | 16 (17.8%) |
| 2 Vehicles | 66 (40.2%) | 55 (61.1%) |
| 3 or more Vehicles | 16 (9.8%) | 19 (21.1%) |
| Total | 164 (100.0%) | 90 (100.0%) |
Real Estate & Mortgages in Tranquillity
Real Estate and Mortgage Overview in Tranquillity
| Characteristic | Without Mortgage | With Mortgage |
| Housing Units | 95 | 69 |
| Median Property Value | $339,900 | $161,000 |
| Median Household Income | - | - |
| Monthly Housing Costs | $723 | $16 |
| Real Estate Taxes | $3,399 | $0 |
Property Value by Mortgage Status in Tranquillity
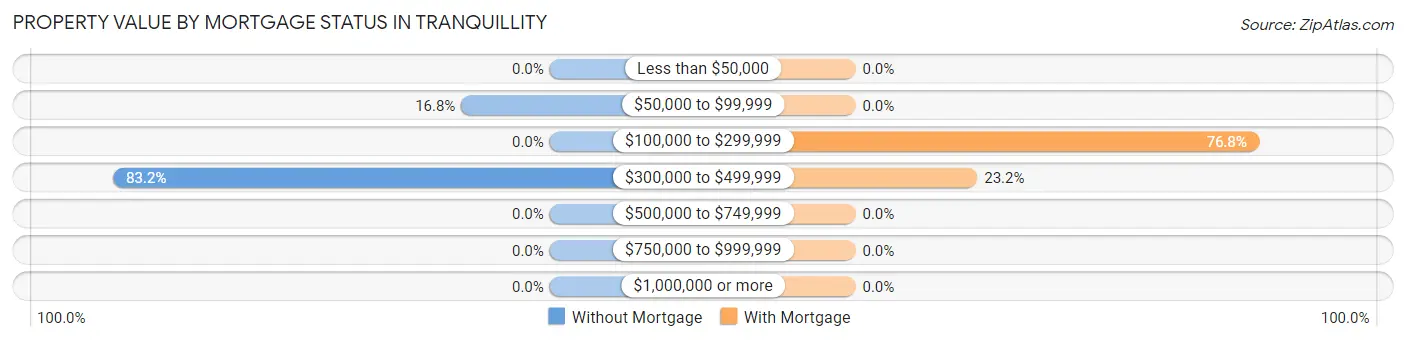
| Property Value | Without Mortgage | With Mortgage |
| Less than $50,000 | 0 (0.0%) | 0 (0.0%) |
| $50,000 to $99,999 | 16 (16.8%) | 0 (0.0%) |
| $100,000 to $299,999 | 0 (0.0%) | 53 (76.8%) |
| $300,000 to $499,999 | 79 (83.2%) | 16 (23.2%) |
| $500,000 to $749,999 | 0 (0.0%) | 0 (0.0%) |
| $750,000 to $999,999 | 0 (0.0%) | 0 (0.0%) |
| $1,000,000 or more | 0 (0.0%) | 0 (0.0%) |
| Total | 95 (100.0%) | 69 (100.0%) |
Household Income by Mortgage Status in Tranquillity
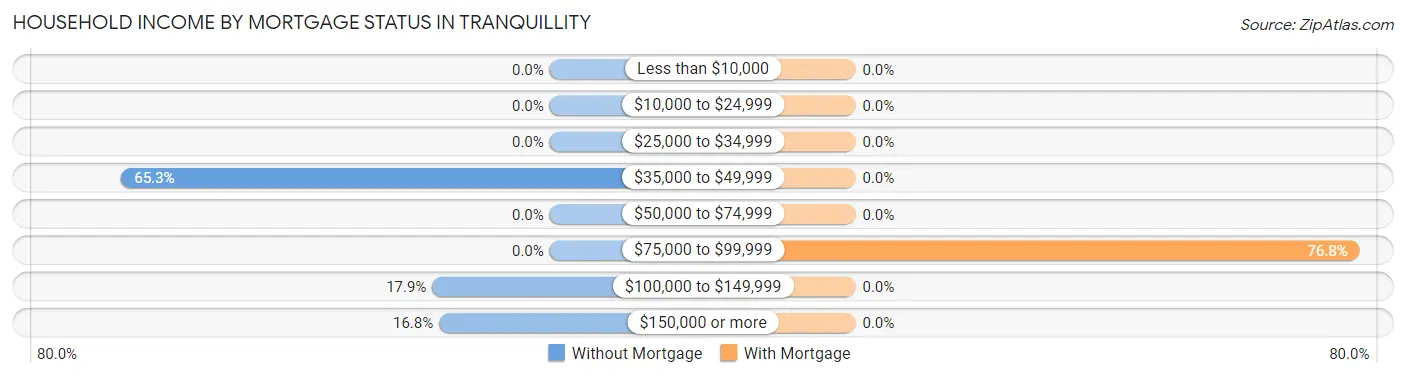
| Household Income | Without Mortgage | With Mortgage |
| Less than $10,000 | 0 (0.0%) | 0 (0.0%) |
| $10,000 to $24,999 | 0 (0.0%) | 0 (0.0%) |
| $25,000 to $34,999 | 0 (0.0%) | 0 (0.0%) |
| $35,000 to $49,999 | 62 (65.3%) | 0 (0.0%) |
| $50,000 to $74,999 | 0 (0.0%) | 0 (0.0%) |
| $75,000 to $99,999 | 0 (0.0%) | 53 (76.8%) |
| $100,000 to $149,999 | 17 (17.9%) | 0 (0.0%) |
| $150,000 or more | 16 (16.8%) | 0 (0.0%) |
| Total | 95 (100.0%) | 69 (100.0%) |
Property Value to Household Income Ratio in Tranquillity
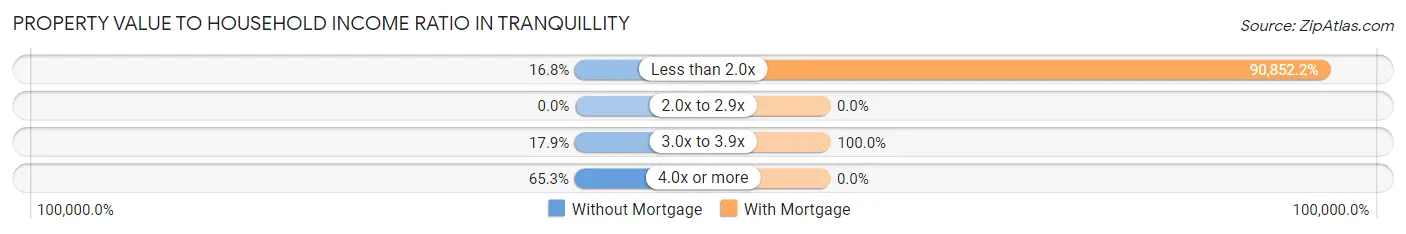
| Value-to-Income Ratio | Without Mortgage | With Mortgage |
| Less than 2.0x | 16 (16.8%) | 62,688 (90,852.2%) |
| 2.0x to 2.9x | 0 (0.0%) | 0 (0.0%) |
| 3.0x to 3.9x | 17 (17.9%) | 69 (100.0%) |
| 4.0x or more | 62 (65.3%) | 0 (0.0%) |
| Total | 95 (100.0%) | 69 (100.0%) |
Real Estate Taxes by Mortgage Status in Tranquillity
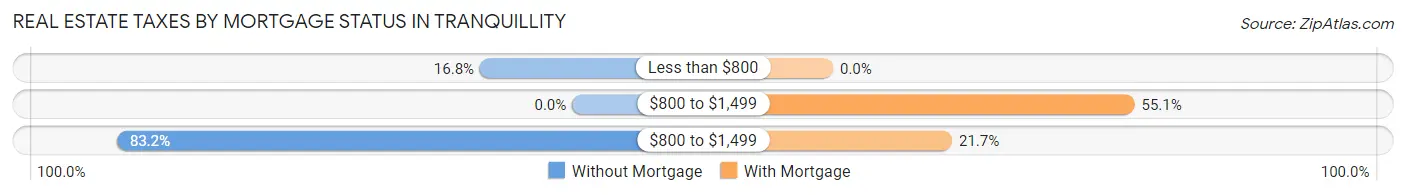
| Property Taxes | Without Mortgage | With Mortgage |
| Less than $800 | 16 (16.8%) | 0 (0.0%) |
| $800 to $1,499 | 0 (0.0%) | 38 (55.1%) |
| $800 to $1,499 | 79 (83.2%) | 15 (21.7%) |
| Total | 95 (100.0%) | 69 (100.0%) |
Health & Disability in Tranquillity
Health Insurance Coverage by Age in Tranquillity
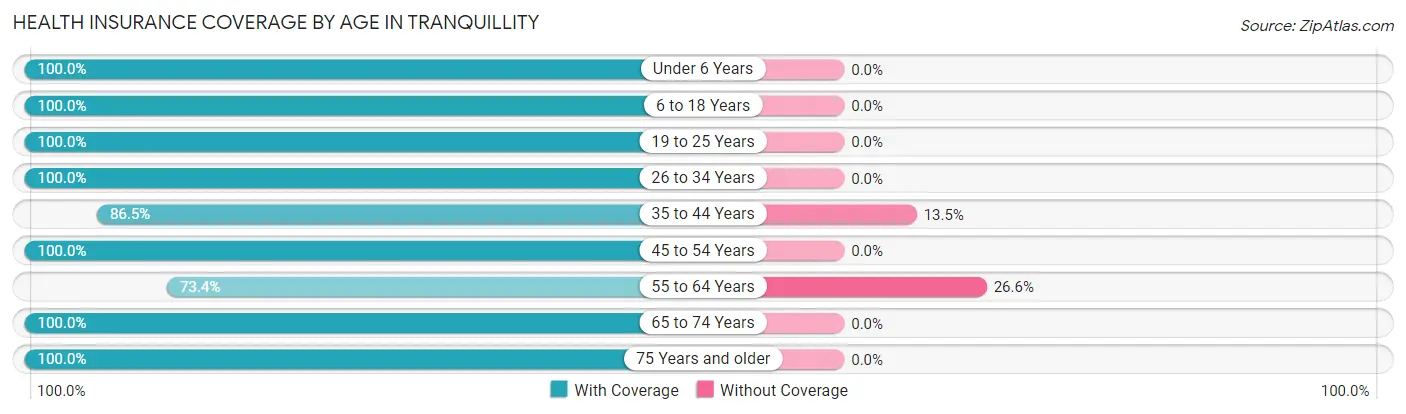
| Age Bracket | With Coverage | Without Coverage |
| Under 6 Years | 57 (100.0%) | 0 (0.0%) |
| 6 to 18 Years | 143 (100.0%) | 0 (0.0%) |
| 19 to 25 Years | 43 (100.0%) | 0 (0.0%) |
| 26 to 34 Years | 38 (100.0%) | 0 (0.0%) |
| 35 to 44 Years | 141 (86.5%) | 22 (13.5%) |
| 45 to 54 Years | 39 (100.0%) | 0 (0.0%) |
| 55 to 64 Years | 94 (73.4%) | 34 (26.6%) |
| 65 to 74 Years | 157 (100.0%) | 0 (0.0%) |
| 75 Years and older | 18 (100.0%) | 0 (0.0%) |
| Total | 730 (92.9%) | 56 (7.1%) |
Health Insurance Coverage by Citizenship Status in Tranquillity
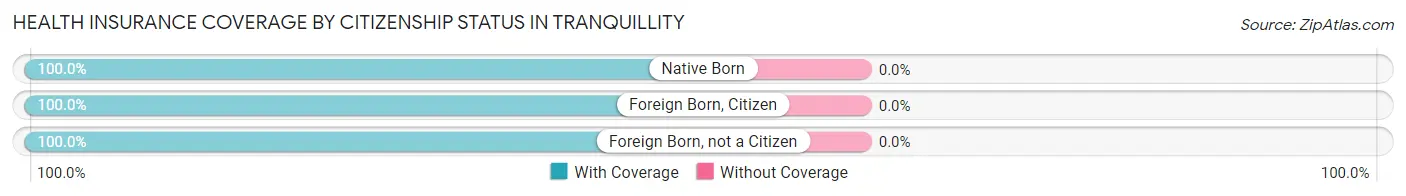
| Citizenship Status | With Coverage | Without Coverage |
| Native Born | 57 (100.0%) | 0 (0.0%) |
| Foreign Born, Citizen | 143 (100.0%) | 0 (0.0%) |
| Foreign Born, not a Citizen | 43 (100.0%) | 0 (0.0%) |
Health Insurance Coverage by Household Income in Tranquillity
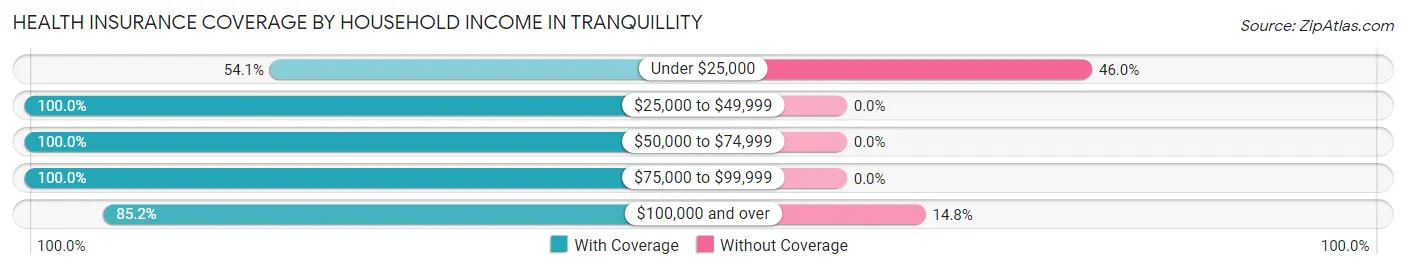
| Household Income | With Coverage | Without Coverage |
| Under $25,000 | 40 (54.0%) | 34 (46.0%) |
| $25,000 to $49,999 | 182 (100.0%) | 0 (0.0%) |
| $50,000 to $74,999 | 290 (100.0%) | 0 (0.0%) |
| $75,000 to $99,999 | 91 (100.0%) | 0 (0.0%) |
| $100,000 and over | 127 (85.2%) | 22 (14.8%) |
Public vs Private Health Insurance Coverage by Age in Tranquillity
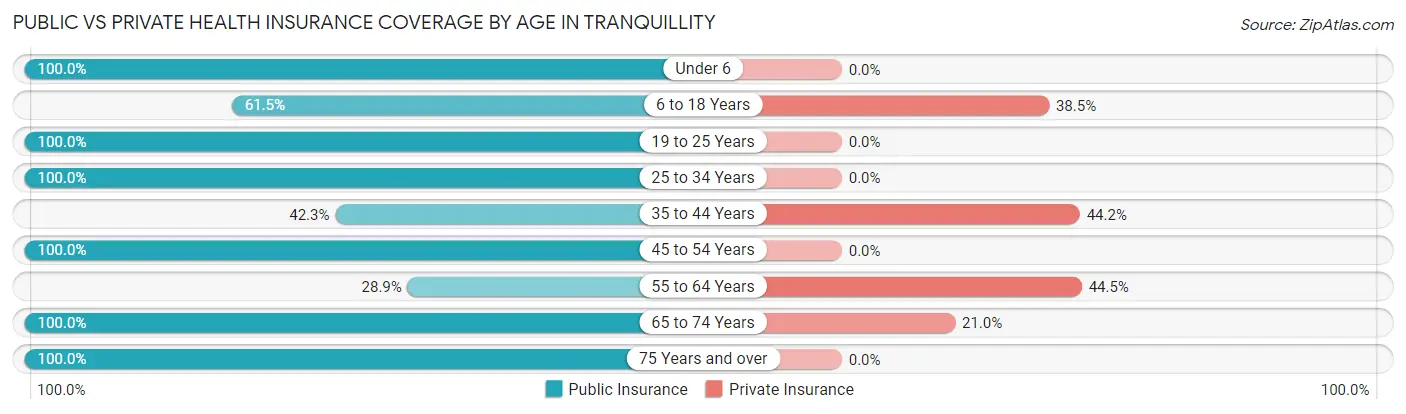
| Age Bracket | Public Insurance | Private Insurance |
| Under 6 | 57 (100.0%) | 0 (0.0%) |
| 6 to 18 Years | 88 (61.5%) | 55 (38.5%) |
| 19 to 25 Years | 43 (100.0%) | 0 (0.0%) |
| 25 to 34 Years | 38 (100.0%) | 0 (0.0%) |
| 35 to 44 Years | 69 (42.3%) | 72 (44.2%) |
| 45 to 54 Years | 39 (100.0%) | 0 (0.0%) |
| 55 to 64 Years | 37 (28.9%) | 57 (44.5%) |
| 65 to 74 Years | 157 (100.0%) | 33 (21.0%) |
| 75 Years and over | 18 (100.0%) | 0 (0.0%) |
| Total | 546 (69.5%) | 217 (27.6%) |
Disability Status by Sex by Age in Tranquillity
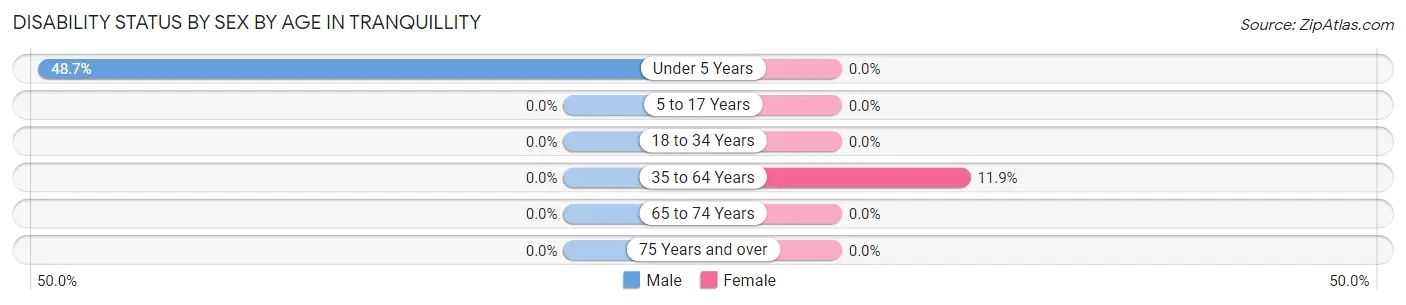
| Age Bracket | Male | Female |
| Under 5 Years | 19 (48.7%) | 0 (0.0%) |
| 5 to 17 Years | 0 (0.0%) | 0 (0.0%) |
| 18 to 34 Years | 0 (0.0%) | 0 (0.0%) |
| 35 to 64 Years | 0 (0.0%) | 16 (11.9%) |
| 65 to 74 Years | 0 (0.0%) | 0 (0.0%) |
| 75 Years and over | 0 (0.0%) | 0 (0.0%) |
Disability Class by Sex by Age in Tranquillity
Disability Class: Hearing Difficulty
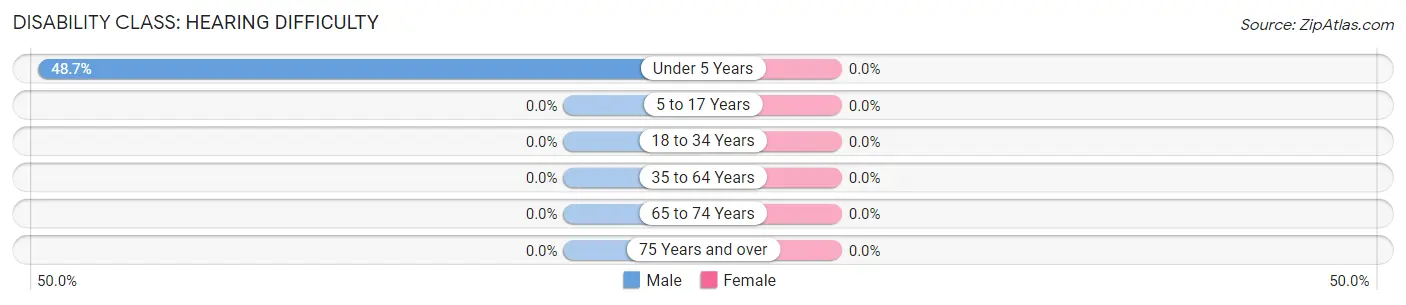
| Age Bracket | Male | Female |
| Under 5 Years | 19 (48.7%) | 0 (0.0%) |
| 5 to 17 Years | 0 (0.0%) | 0 (0.0%) |
| 18 to 34 Years | 0 (0.0%) | 0 (0.0%) |
| 35 to 64 Years | 0 (0.0%) | 0 (0.0%) |
| 65 to 74 Years | 0 (0.0%) | 0 (0.0%) |
| 75 Years and over | 0 (0.0%) | 0 (0.0%) |
Disability Class: Vision Difficulty
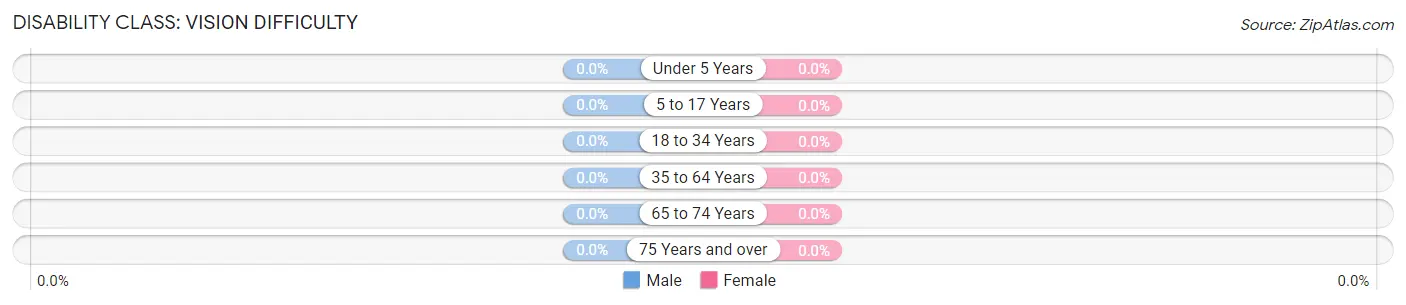
| Age Bracket | Male | Female |
| Under 5 Years | 0 (0.0%) | 0 (0.0%) |
| 5 to 17 Years | 0 (0.0%) | 0 (0.0%) |
| 18 to 34 Years | 0 (0.0%) | 0 (0.0%) |
| 35 to 64 Years | 0 (0.0%) | 0 (0.0%) |
| 65 to 74 Years | 0 (0.0%) | 0 (0.0%) |
| 75 Years and over | 0 (0.0%) | 0 (0.0%) |
Disability Class: Cognitive Difficulty
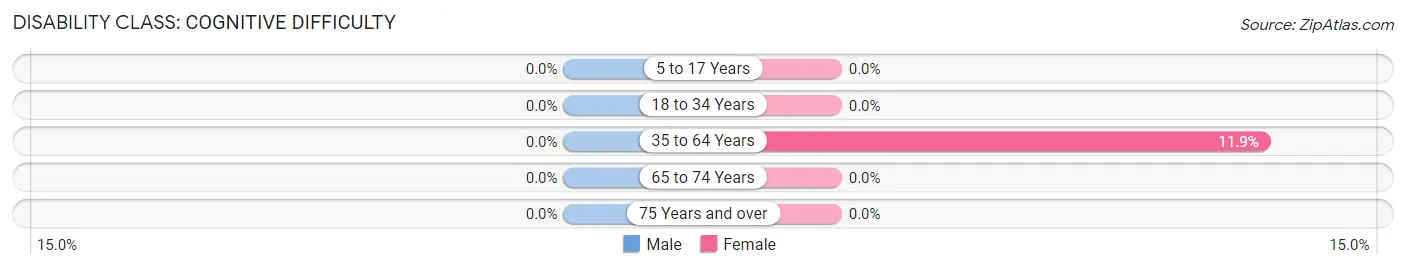
| Age Bracket | Male | Female |
| 5 to 17 Years | 0 (0.0%) | 0 (0.0%) |
| 18 to 34 Years | 0 (0.0%) | 0 (0.0%) |
| 35 to 64 Years | 0 (0.0%) | 16 (11.9%) |
| 65 to 74 Years | 0 (0.0%) | 0 (0.0%) |
| 75 Years and over | 0 (0.0%) | 0 (0.0%) |
Disability Class: Ambulatory Difficulty
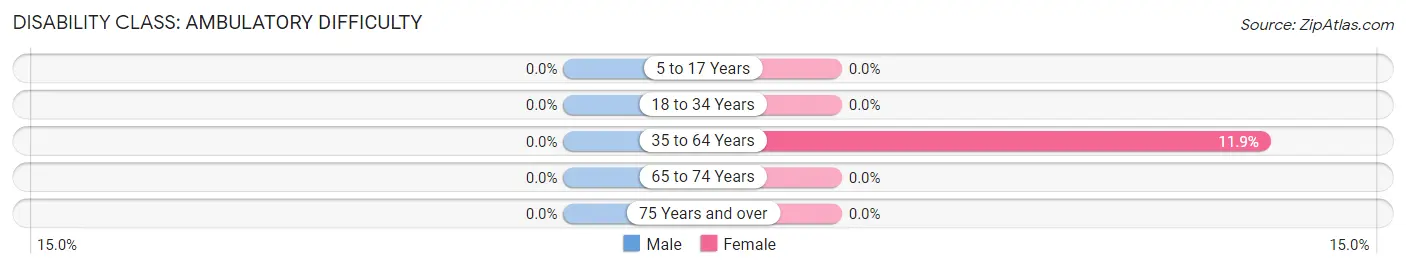
| Age Bracket | Male | Female |
| 5 to 17 Years | 0 (0.0%) | 0 (0.0%) |
| 18 to 34 Years | 0 (0.0%) | 0 (0.0%) |
| 35 to 64 Years | 0 (0.0%) | 16 (11.9%) |
| 65 to 74 Years | 0 (0.0%) | 0 (0.0%) |
| 75 Years and over | 0 (0.0%) | 0 (0.0%) |
Disability Class: Self-Care Difficulty
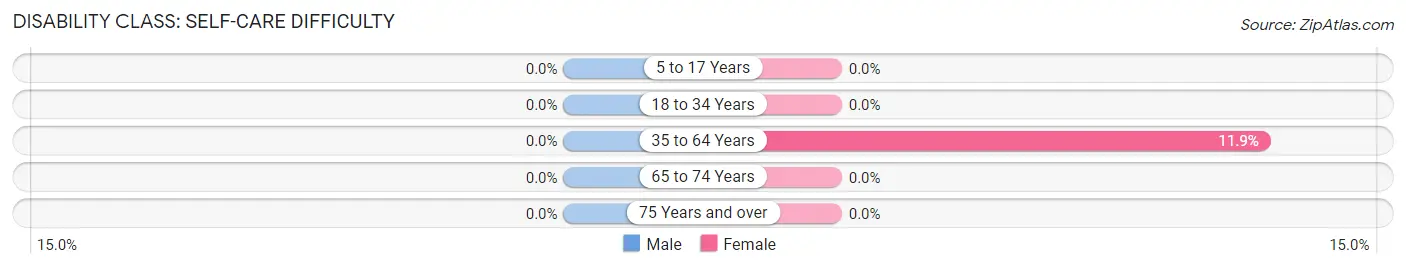
| Age Bracket | Male | Female |
| 5 to 17 Years | 0 (0.0%) | 0 (0.0%) |
| 18 to 34 Years | 0 (0.0%) | 0 (0.0%) |
| 35 to 64 Years | 0 (0.0%) | 16 (11.9%) |
| 65 to 74 Years | 0 (0.0%) | 0 (0.0%) |
| 75 Years and over | 0 (0.0%) | 0 (0.0%) |
Technology Access in Tranquillity
Computing Device Access in Tranquillity
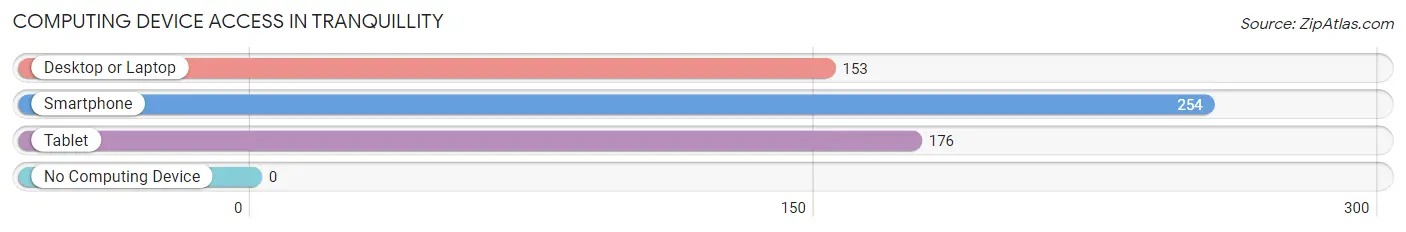
| Device Type | # Households | % Households |
| Desktop or Laptop | 153 | 60.2% |
| Smartphone | 254 | 100.0% |
| Tablet | 176 | 69.3% |
| No Computing Device | 0 | 0.0% |
| Total | 254 | 100.0% |
Internet Access in Tranquillity
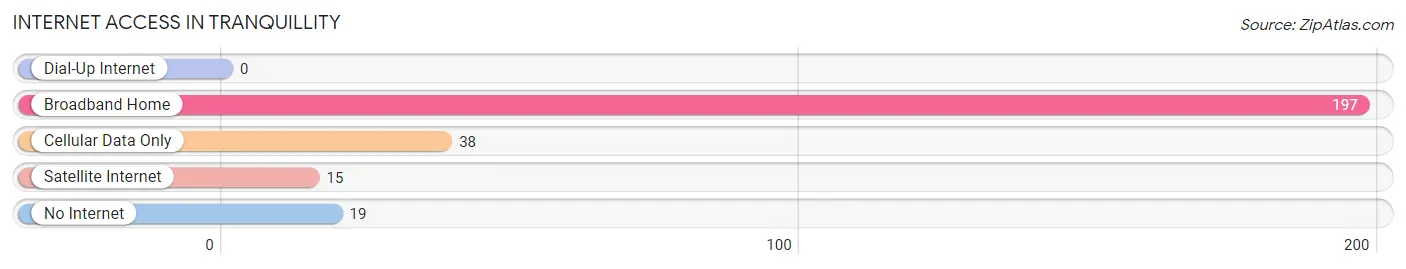
| Internet Type | # Households | % Households |
| Dial-Up Internet | 0 | 0.0% |
| Broadband Home | 197 | 77.6% |
| Cellular Data Only | 38 | 15.0% |
| Satellite Internet | 15 | 5.9% |
| No Internet | 19 | 7.5% |
| Total | 254 | 100.0% |
Tranquillity Summary
Tranquillity is a small unincorporated community located in Fresno County, California. It is situated in the San Joaquin Valley, approximately 10 miles east of the city of Coalinga. The population of Tranquillity was 1,845 as of the 2010 census.
Geography
Tranquillity is located at an elevation of approximately 300 feet above sea level. The community is situated in the San Joaquin Valley, which is a large agricultural region in central California. The climate in the area is semi-arid, with hot summers and mild winters. The average annual precipitation is approximately 8 inches.
The terrain in the area is mostly flat, with some rolling hills. The soil is mostly sandy loam, with some areas of clay. The area is mostly used for agricultural purposes, with some residential development.
History
Tranquillity was founded in 1891 by a group of settlers from the Midwest. The town was originally named “Tranquil”, but the name was changed to “Tranquillity” in 1895. The town was incorporated in 1906.
The town was originally a farming community, with the main crops being wheat, barley, and alfalfa. The town also had a small lumber mill.
In the early 1900s, the town began to grow and develop. The first school was built in 1910, and the first post office was established in 1911. The town also had a hotel, a general store, and a blacksmith shop.
In the 1920s, the town began to decline. The lumber mill closed, and the population began to decline. The town was eventually disincorporated in the 1950s.
Economy
The economy of Tranquillity is largely based on agriculture. The main crops grown in the area are wheat, barley, alfalfa, and cotton. The town also has a few small businesses, including a gas station, a grocery store, and a few restaurants.
Demographics
As of the 2010 census, the population of Tranquillity was 1,845. The racial makeup of the town was 73.3% White, 0.7% African American, 0.3% Native American, 0.2% Asian, 0.1% Pacific Islander, 22.7% from other races, and 2.7% from two or more races. Hispanic or Latino of any race were 33.3% of the population.
The median household income in Tranquillity was $30,938, and the median family income was $35,625. The per capita income was $14,845. About 20.2% of the population was below the poverty line.
Conclusion
Tranquillity is a small unincorporated community located in Fresno County, California. It is situated in the San Joaquin Valley, approximately 10 miles east of the city of Coalinga. The population of Tranquillity was 1,845 as of the 2010 census. The economy of Tranquillity is largely based on agriculture, with the main crops being wheat, barley, alfalfa, and cotton. The racial makeup of the town was 73.3% White, 0.7% African American, 0.3% Native American, 0.2% Asian, 0.1% Pacific Islander, 22.7% from other races, and 2.7% from two or more races. Hispanic or Latino of any race were 33.3% of the population. The median household income in Tranquillity was $30,938, and the median family income was $35,625. The per capita income was $14,845. About 20.2% of the population was below the poverty line.
Common Questions
What is Per Capita Income in Tranquillity?
Per Capita income in Tranquillity is $25,280.
What is the Median Family Income in Tranquillity?
Median Family Income in Tranquillity is $37,298.
What is the Median Household income in Tranquillity?
Median Household Income in Tranquillity is $54,632.
What is Inequality or Gini Index in Tranquillity?
Inequality or Gini Index in Tranquillity is 0.36.
What is the Total Population of Tranquillity?
Total Population of Tranquillity is 786.
What is the Total Male Population of Tranquillity?
Total Male Population of Tranquillity is 420.
What is the Total Female Population of Tranquillity?
Total Female Population of Tranquillity is 366.
What is the Ratio of Males per 100 Females in Tranquillity?
There are 114.75 Males per 100 Females in Tranquillity.
What is the Ratio of Females per 100 Males in Tranquillity?
There are 87.14 Females per 100 Males in Tranquillity.
What is the Median Population Age in Tranquillity?
Median Population Age in Tranquillity is 42.4 Years.
What is the Average Family Size in Tranquillity
Average Family Size in Tranquillity is 3.2 People.
What is the Average Household Size in Tranquillity
Average Household Size in Tranquillity is 3.1 People.
How Large is the Labor Force in Tranquillity?
There are 321 People in the Labor Forcein in Tranquillity.
What is the Percentage of People in the Labor Force in Tranquillity?
49.9% of People are in the Labor Force in Tranquillity.
What is the Unemployment Rate in Tranquillity?
Unemployment Rate in Tranquillity is 19.0%.