Thornton, CA Map & Demographics
Thornton Map
Thornton Overview
$18,655
PER CAPITA INCOME
$44,196
AVG FAMILY INCOME
$43,839
AVG HOUSEHOLD INCOME
63.4%
WAGE / INCOME GAP [ % ]
36.6¢/ $1
WAGE / INCOME GAP [ $ ]
$8,221
FAMILY INCOME DEFICIT
0.43
INEQUALITY / GINI INDEX
873
TOTAL POPULATION
419
MALE POPULATION
454
FEMALE POPULATION
92.29
MALES / 100 FEMALES
108.35
FEMALES / 100 MALES
29.6
MEDIAN AGE
3.5
AVG FAMILY SIZE
3.2
AVG HOUSEHOLD SIZE
381
LABOR FORCE [ PEOPLE ]
59.3%
PERCENT IN LABOR FORCE
7.9%
UNEMPLOYMENT RATE
Thornton Zip Codes
Thornton Area Codes
Income in Thornton
Income Overview in Thornton
Per Capita Income in Thornton is $18,655, while median incomes of families and households are $44,196 and $43,839 respectively.
| Characteristic | Number | Measure |
| Per Capita Income | 873 | $18,655 |
| Median Family Income | 209 | $44,196 |
| Mean Family Income | 209 | $58,316 |
| Median Household Income | 273 | $43,839 |
| Mean Household Income | 273 | $57,481 |
| Income Deficit | 209 | $8,221 |
| Wage / Income Gap (%) | 873 | 63.37% |
| Wage / Income Gap ($) | 873 | 36.63¢ per $1 |
| Gini / Inequality Index | 873 | 0.43 |
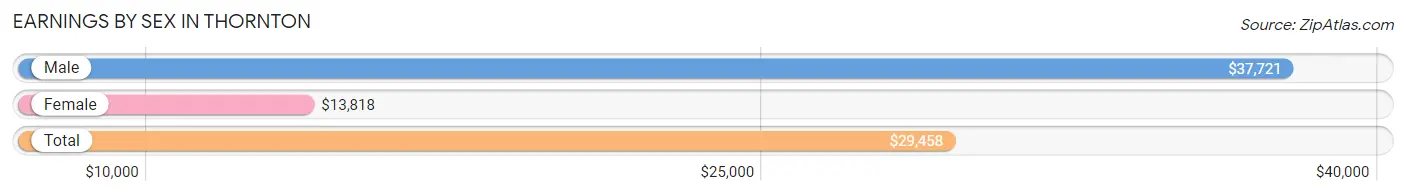
Earnings by Sex in Thornton
Average Earnings in Thornton are $29,458, $37,721 for men and $13,818 for women, a difference of 63.4%.
| Sex | Number | Average Earnings |
| Male | 211 (53.8%) | $37,721 |
| Female | 181 (46.2%) | $13,818 |
| Total | 392 (100.0%) | $29,458 |
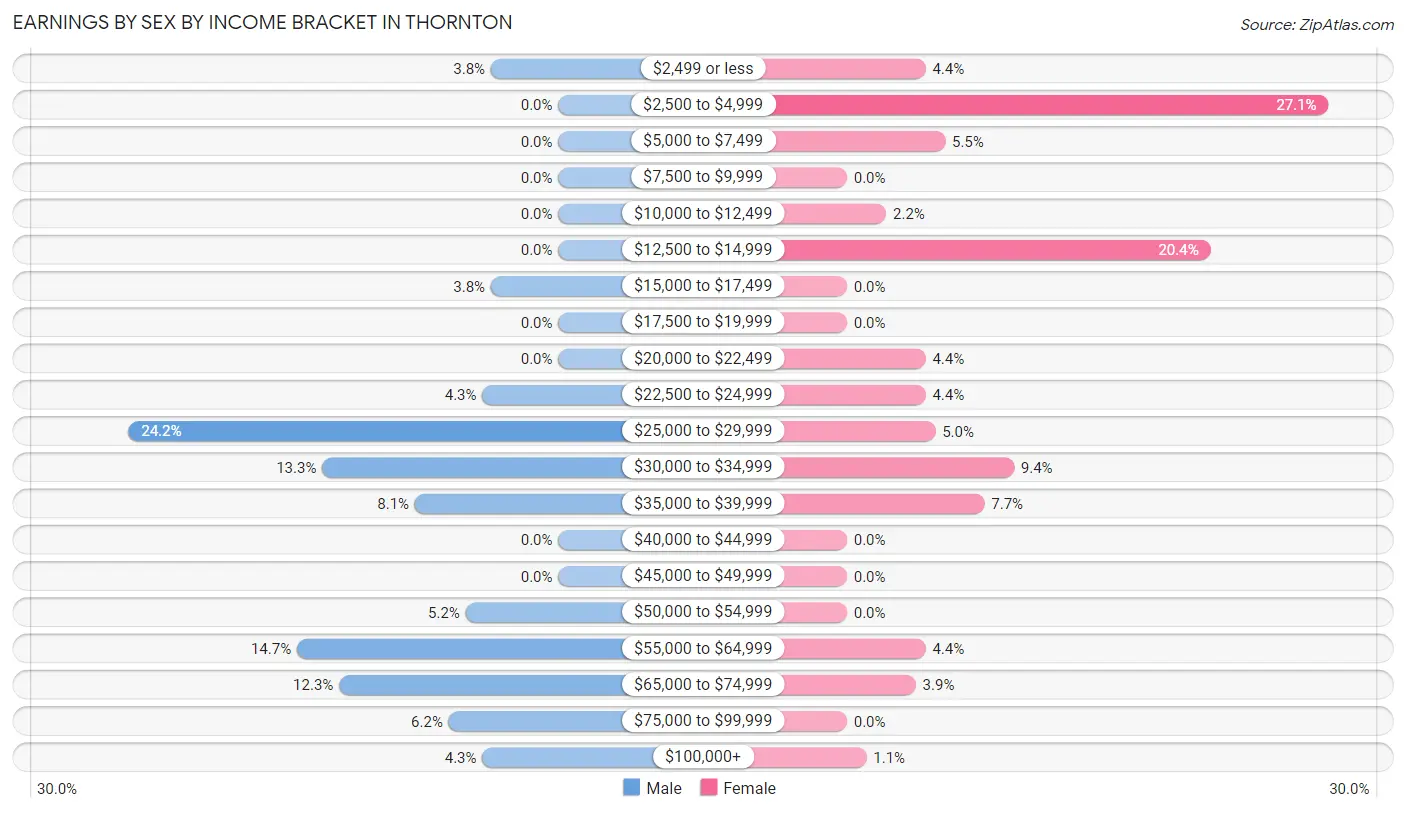
Earnings by Sex by Income Bracket in Thornton
The most common earnings brackets in Thornton are $25,000 to $29,999 for men (51 | 24.2%) and $2,500 to $4,999 for women (49 | 27.1%).
| Income | Male | Female |
| $2,499 or less | 8 (3.8%) | 8 (4.4%) |
| $2,500 to $4,999 | 0 (0.0%) | 49 (27.1%) |
| $5,000 to $7,499 | 0 (0.0%) | 10 (5.5%) |
| $7,500 to $9,999 | 0 (0.0%) | 0 (0.0%) |
| $10,000 to $12,499 | 0 (0.0%) | 4 (2.2%) |
| $12,500 to $14,999 | 0 (0.0%) | 37 (20.4%) |
| $15,000 to $17,499 | 8 (3.8%) | 0 (0.0%) |
| $17,500 to $19,999 | 0 (0.0%) | 0 (0.0%) |
| $20,000 to $22,499 | 0 (0.0%) | 8 (4.4%) |
| $22,500 to $24,999 | 9 (4.3%) | 8 (4.4%) |
| $25,000 to $29,999 | 51 (24.2%) | 9 (5.0%) |
| $30,000 to $34,999 | 28 (13.3%) | 17 (9.4%) |
| $35,000 to $39,999 | 17 (8.1%) | 14 (7.7%) |
| $40,000 to $44,999 | 0 (0.0%) | 0 (0.0%) |
| $45,000 to $49,999 | 0 (0.0%) | 0 (0.0%) |
| $50,000 to $54,999 | 11 (5.2%) | 0 (0.0%) |
| $55,000 to $64,999 | 31 (14.7%) | 8 (4.4%) |
| $65,000 to $74,999 | 26 (12.3%) | 7 (3.9%) |
| $75,000 to $99,999 | 13 (6.2%) | 0 (0.0%) |
| $100,000+ | 9 (4.3%) | 2 (1.1%) |
| Total | 211 (100.0%) | 181 (100.0%) |
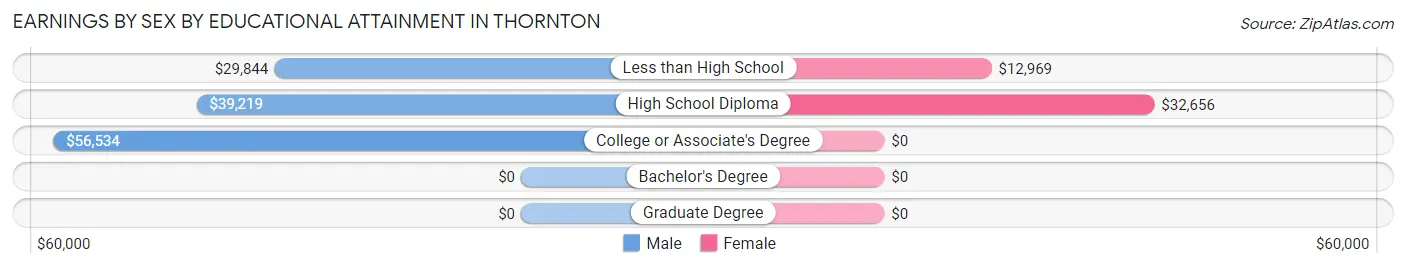
Earnings by Sex by Educational Attainment in Thornton
Average earnings in Thornton are $46,250 for men and $14,527 for women, a difference of 68.6%. Men with an educational attainment of college or associate's degree enjoy the highest average annual earnings of $56,534, while those with less than high school education earn the least with $29,844. Women with an educational attainment of high school diploma earn the most with the average annual earnings of $32,656, while those with less than high school education have the smallest earnings of $12,969.
| Educational Attainment | Male Income | Female Income |
| Less than High School | $29,844 | $12,969 |
| High School Diploma | $39,219 | $32,656 |
| College or Associate's Degree | $56,534 | $0 |
| Bachelor's Degree | - | - |
| Graduate Degree | - | - |
| Total | $46,250 | $14,527 |
Family Income in Thornton
Family Income Brackets in Thornton
According to the Thornton family income data, there are 37 families falling into the $25,000 to $34,999 income range, which is the most common income bracket and makes up 17.7% of all families.
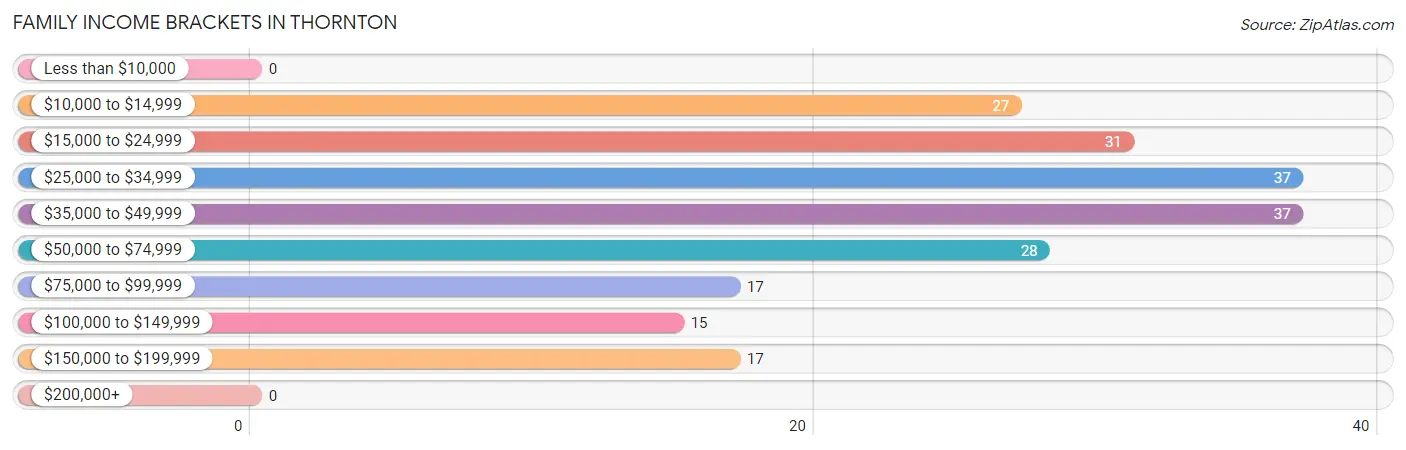
| Income Bracket | # Families | % Families |
| Less than $10,000 | 0 | 0.0% |
| $10,000 to $14,999 | 27 | 12.9% |
| $15,000 to $24,999 | 31 | 14.8% |
| $25,000 to $34,999 | 37 | 17.7% |
| $35,000 to $49,999 | 37 | 17.7% |
| $50,000 to $74,999 | 28 | 13.4% |
| $75,000 to $99,999 | 17 | 8.1% |
| $100,000 to $149,999 | 15 | 7.2% |
| $150,000 to $199,999 | 17 | 8.1% |
| $200,000+ | 0 | 0.0% |
Family Income by Famaliy Size in Thornton
3-person families (33 | 15.8%) account for the highest median family income in Thornton with $49,297 per family, while 3-person families (33 | 15.8%) have the highest median income of $16,432 per family member.
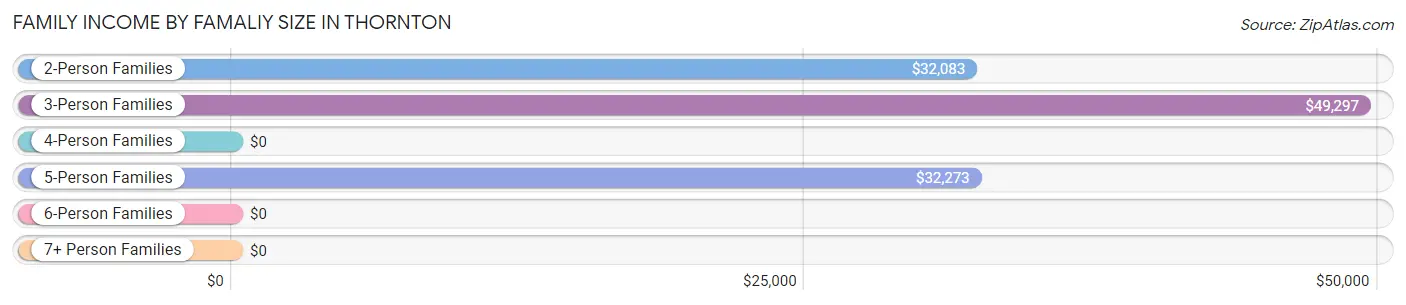
| Income Bracket | # Families | Median Income |
| 2-Person Families | 89 (42.6%) | $32,083 |
| 3-Person Families | 33 (15.8%) | $49,297 |
| 4-Person Families | 24 (11.5%) | $0 |
| 5-Person Families | 52 (24.9%) | $32,273 |
| 6-Person Families | 4 (1.9%) | $0 |
| 7+ Person Families | 7 (3.4%) | $0 |
| Total | 209 (100.0%) | $44,196 |
Family Income by Number of Earners in Thornton
The median family income in Thornton is $44,196, with families comprising 3+ earners (27) having the highest median family income of $180,469, while families with no earners (40) have the lowest median family income of $18,056, accounting for 12.9% and 19.1% of families, respectively.
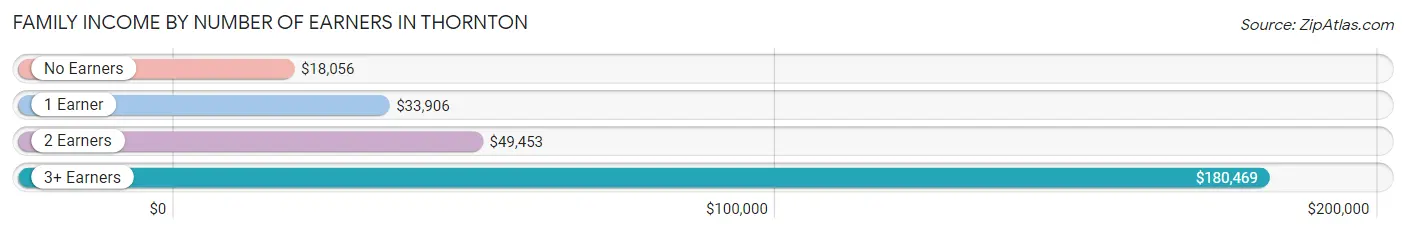
| Number of Earners | # Families | Median Income |
| No Earners | 40 (19.1%) | $18,056 |
| 1 Earner | 101 (48.3%) | $33,906 |
| 2 Earners | 41 (19.6%) | $49,453 |
| 3+ Earners | 27 (12.9%) | $180,469 |
| Total | 209 (100.0%) | $44,196 |
Household Income in Thornton
Household Income Brackets in Thornton
With 54 households falling in the category, the $35,000 to $49,999 income range is the most frequent in Thornton, accounting for 19.8% of all households.
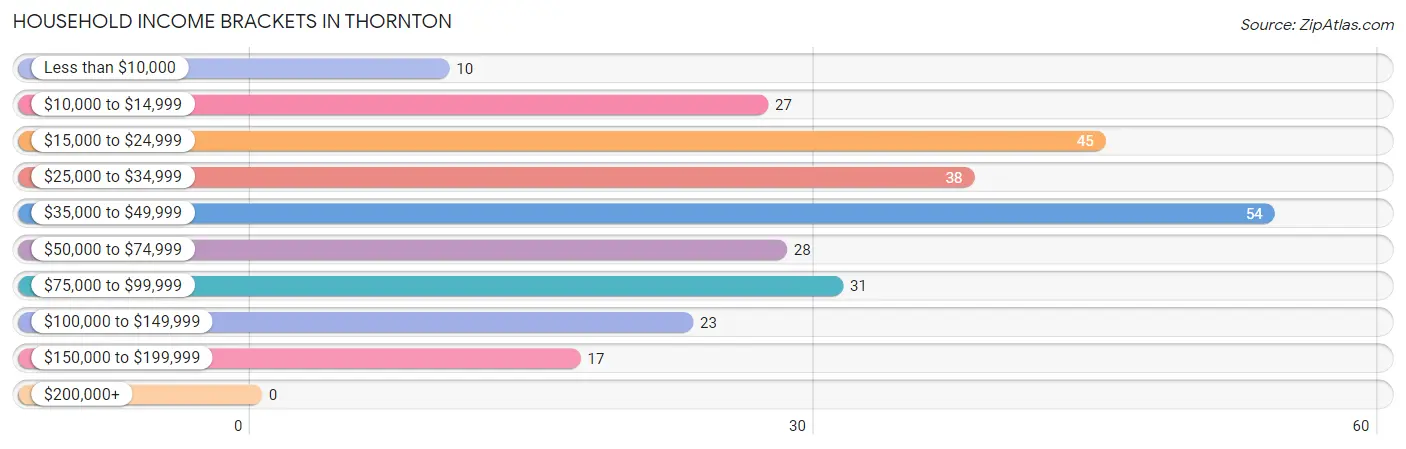
| Income Bracket | # Households | % Households |
| Less than $10,000 | 10 | 3.7% |
| $10,000 to $14,999 | 27 | 9.9% |
| $15,000 to $24,999 | 45 | 16.5% |
| $25,000 to $34,999 | 38 | 13.9% |
| $35,000 to $49,999 | 54 | 19.8% |
| $50,000 to $74,999 | 28 | 10.3% |
| $75,000 to $99,999 | 31 | 11.4% |
| $100,000 to $149,999 | 23 | 8.4% |
| $150,000 to $199,999 | 17 | 6.2% |
| $200,000+ | 0 | 0.0% |
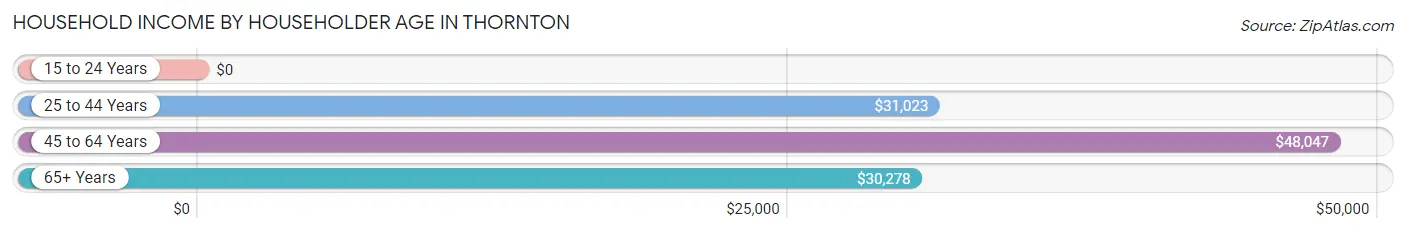
Household Income by Householder Age in Thornton
The median household income in Thornton is $43,839, with the highest median household income of $48,047 found in the 45 to 64 years age bracket for the primary householder. A total of 121 households (44.3%) fall into this category. Meanwhile, the 15 to 24 years age bracket for the primary householder has the lowest median household income of $0, with 9 households (3.3%) in this group.
| Income Bracket | # Households | Median Income |
| 15 to 24 Years | 9 (3.3%) | $0 |
| 25 to 44 Years | 99 (36.3%) | $31,023 |
| 45 to 64 Years | 121 (44.3%) | $48,047 |
| 65+ Years | 44 (16.1%) | $30,278 |
| Total | 273 (100.0%) | $43,839 |
Poverty in Thornton
Income Below Poverty by Sex and Age in Thornton
With 30.6% poverty level for males and 42.1% for females among the residents of Thornton, 12 to 14 year old males and 5 year old females are the most vulnerable to poverty, with 9 males (100.0%) and 10 females (100.0%) in their respective age groups living below the poverty level.
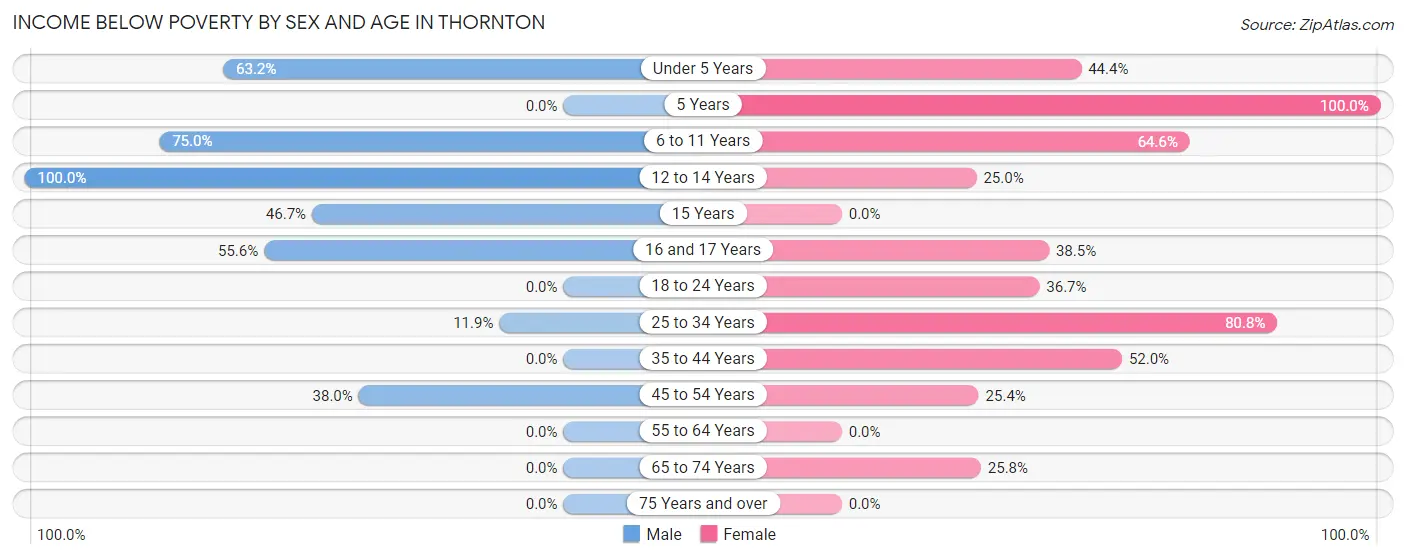
| Age Bracket | Male | Female |
| Under 5 Years | 12 (63.2%) | 8 (44.4%) |
| 5 Years | 0 (0.0%) | 10 (100.0%) |
| 6 to 11 Years | 48 (75.0%) | 31 (64.6%) |
| 12 to 14 Years | 9 (100.0%) | 6 (25.0%) |
| 15 Years | 7 (46.7%) | 0 (0.0%) |
| 16 and 17 Years | 20 (55.6%) | 5 (38.5%) |
| 18 to 24 Years | 0 (0.0%) | 22 (36.7%) |
| 25 to 34 Years | 10 (11.9%) | 59 (80.8%) |
| 35 to 44 Years | 0 (0.0%) | 26 (52.0%) |
| 45 to 54 Years | 19 (38.0%) | 16 (25.4%) |
| 55 to 64 Years | 0 (0.0%) | 0 (0.0%) |
| 65 to 74 Years | 0 (0.0%) | 8 (25.8%) |
| 75 Years and over | 0 (0.0%) | 0 (0.0%) |
| Total | 125 (30.6%) | 191 (42.1%) |
Income Above Poverty by Sex and Age in Thornton
According to the poverty statistics in Thornton, males aged 5 years and females aged 55 to 64 years are the age groups that are most secure financially, with 100.0% of males and 100.0% of females in these age groups living above the poverty line.
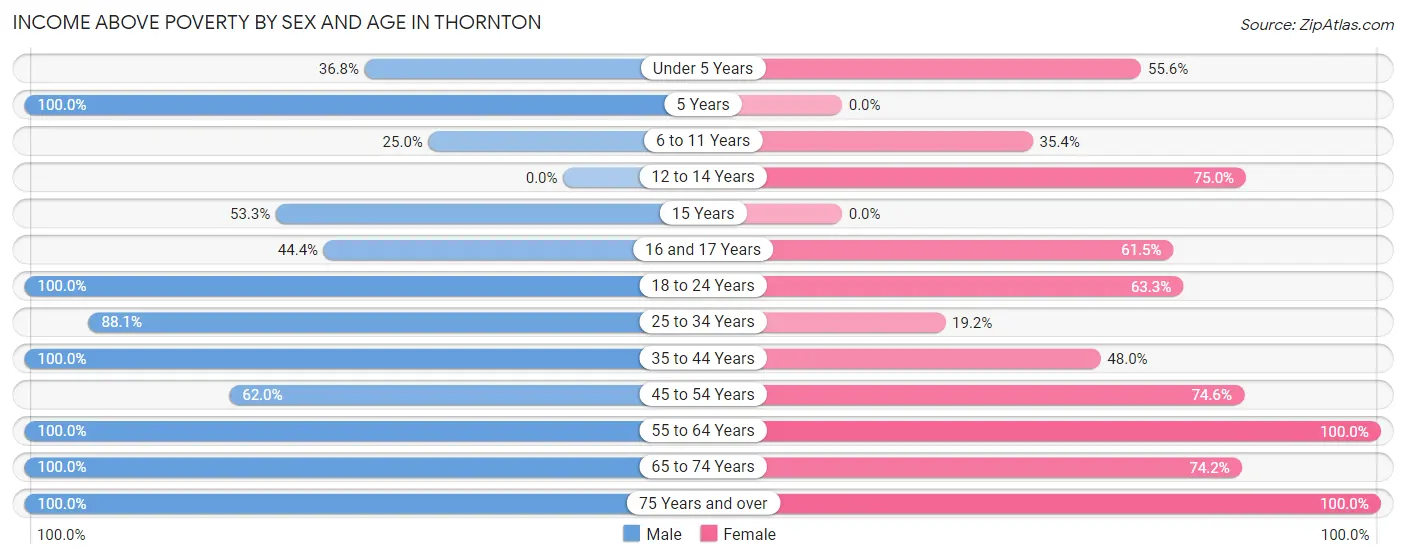
| Age Bracket | Male | Female |
| Under 5 Years | 7 (36.8%) | 10 (55.6%) |
| 5 Years | 12 (100.0%) | 0 (0.0%) |
| 6 to 11 Years | 16 (25.0%) | 17 (35.4%) |
| 12 to 14 Years | 0 (0.0%) | 18 (75.0%) |
| 15 Years | 8 (53.3%) | 0 (0.0%) |
| 16 and 17 Years | 16 (44.4%) | 8 (61.5%) |
| 18 to 24 Years | 23 (100.0%) | 38 (63.3%) |
| 25 to 34 Years | 74 (88.1%) | 14 (19.2%) |
| 35 to 44 Years | 18 (100.0%) | 24 (48.0%) |
| 45 to 54 Years | 31 (62.0%) | 47 (74.6%) |
| 55 to 64 Years | 51 (100.0%) | 44 (100.0%) |
| 65 to 74 Years | 10 (100.0%) | 23 (74.2%) |
| 75 Years and over | 17 (100.0%) | 20 (100.0%) |
| Total | 283 (69.4%) | 263 (57.9%) |
Income Below Poverty Among Married-Couple Families in Thornton
The poverty statistics for married-couple families in Thornton show that 29.8% or 28 of the total 94 families live below the poverty line. Families with 3 or 4 children have the highest poverty rate of 100.0%, comprising of 11 families. On the other hand, families with no children have the lowest poverty rate of 0.0%, which includes 0 families.
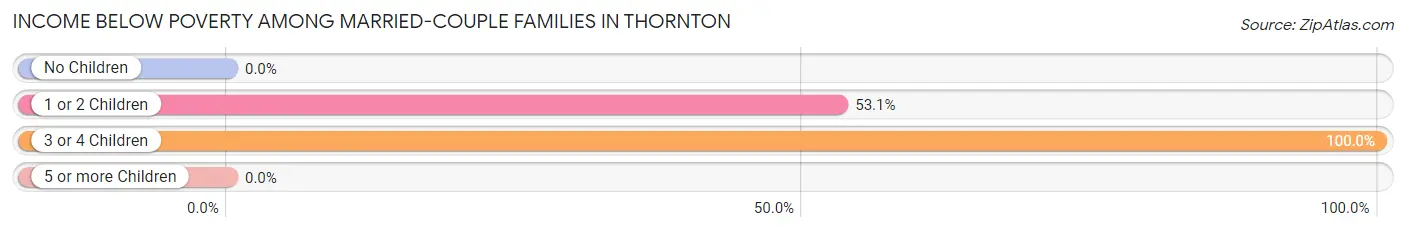
| Children | Above Poverty | Below Poverty |
| No Children | 51 (100.0%) | 0 (0.0%) |
| 1 or 2 Children | 15 (46.9%) | 17 (53.1%) |
| 3 or 4 Children | 0 (0.0%) | 11 (100.0%) |
| 5 or more Children | 0 (0.0%) | 0 (0.0%) |
| Total | 66 (70.2%) | 28 (29.8%) |
Income Below Poverty Among Single-Parent Households in Thornton
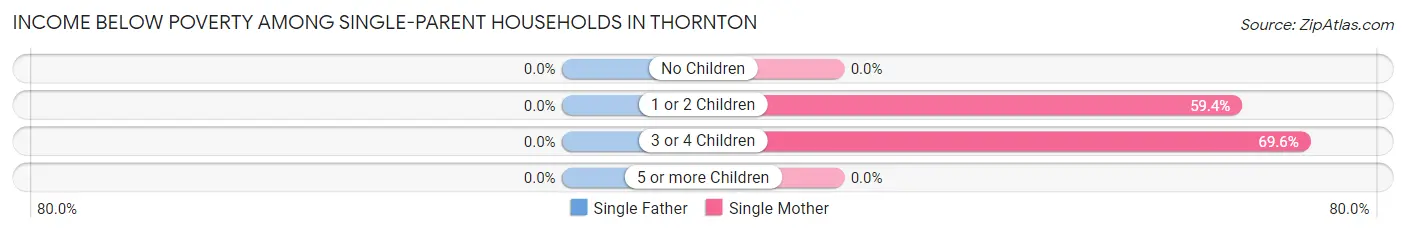
| Children | Single Father | Single Mother |
| No Children | 0 (0.0%) | 0 (0.0%) |
| 1 or 2 Children | 0 (0.0%) | 19 (59.4%) |
| 3 or 4 Children | 0 (0.0%) | 16 (69.6%) |
| 5 or more Children | 0 (0.0%) | 0 (0.0%) |
| Total | 0 (0.0%) | 35 (40.7%) |
Income Below Poverty Among Married-Couple vs Single-Parent Households in Thornton
The poverty data for Thornton shows that 28 of the married-couple family households (29.8%) and 35 of the single-parent households (30.4%) are living below the poverty level. Within the married-couple family households, those with 3 or 4 children have the highest poverty rate, with 11 households (100.0%) falling below the poverty line. Among the single-parent households, those with 3 or 4 children have the highest poverty rate, with 16 household (50.0%) living below poverty.
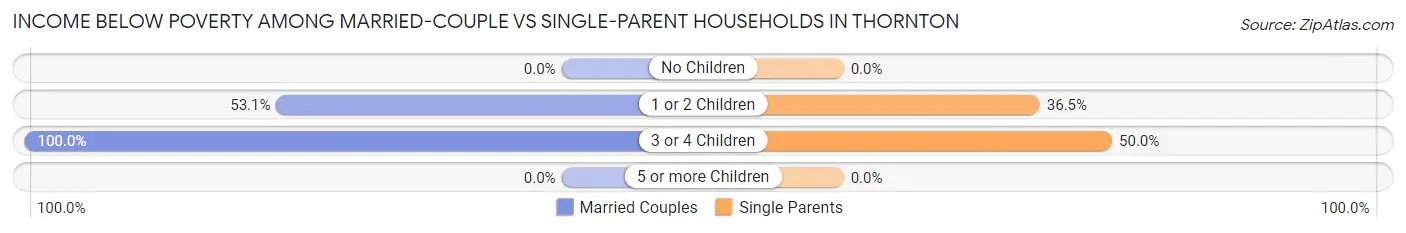
| Children | Married-Couple Families | Single-Parent Households |
| No Children | 0 (0.0%) | 0 (0.0%) |
| 1 or 2 Children | 17 (53.1%) | 19 (36.5%) |
| 3 or 4 Children | 11 (100.0%) | 16 (50.0%) |
| 5 or more Children | 0 (0.0%) | 0 (0.0%) |
| Total | 28 (29.8%) | 35 (30.4%) |
Race in Thornton
The most populous races in Thornton are Hispanic or Latino (514 | 58.9%), White / Caucasian (319 | 36.5%), and Some other Race (239 | 27.4%).
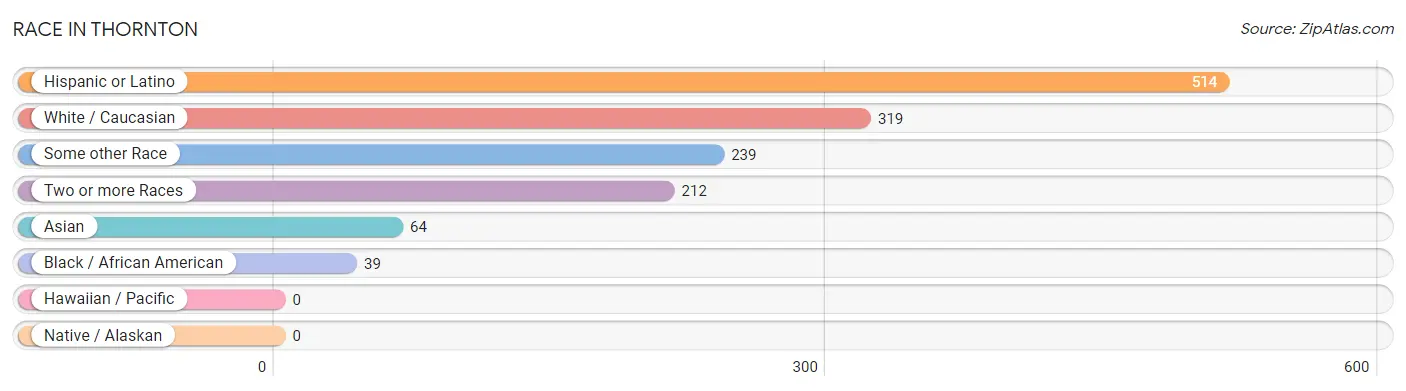
| Race | # Population | % Population |
| Asian | 64 | 7.3% |
| Black / African American | 39 | 4.5% |
| Hawaiian / Pacific | 0 | 0.0% |
| Hispanic or Latino | 514 | 58.9% |
| Native / Alaskan | 0 | 0.0% |
| White / Caucasian | 319 | 36.5% |
| Two or more Races | 212 | 24.3% |
| Some other Race | 239 | 27.4% |
| Total | 873 | 100.0% |
Ancestry in Thornton
The most populous ancestries reported in Thornton are Mexican (489 | 56.0%), Irish (117 | 13.4%), Korean (90 | 10.3%), English (67 | 7.7%), and German (47 | 5.4%), together accounting for 92.8% of all Thornton residents.
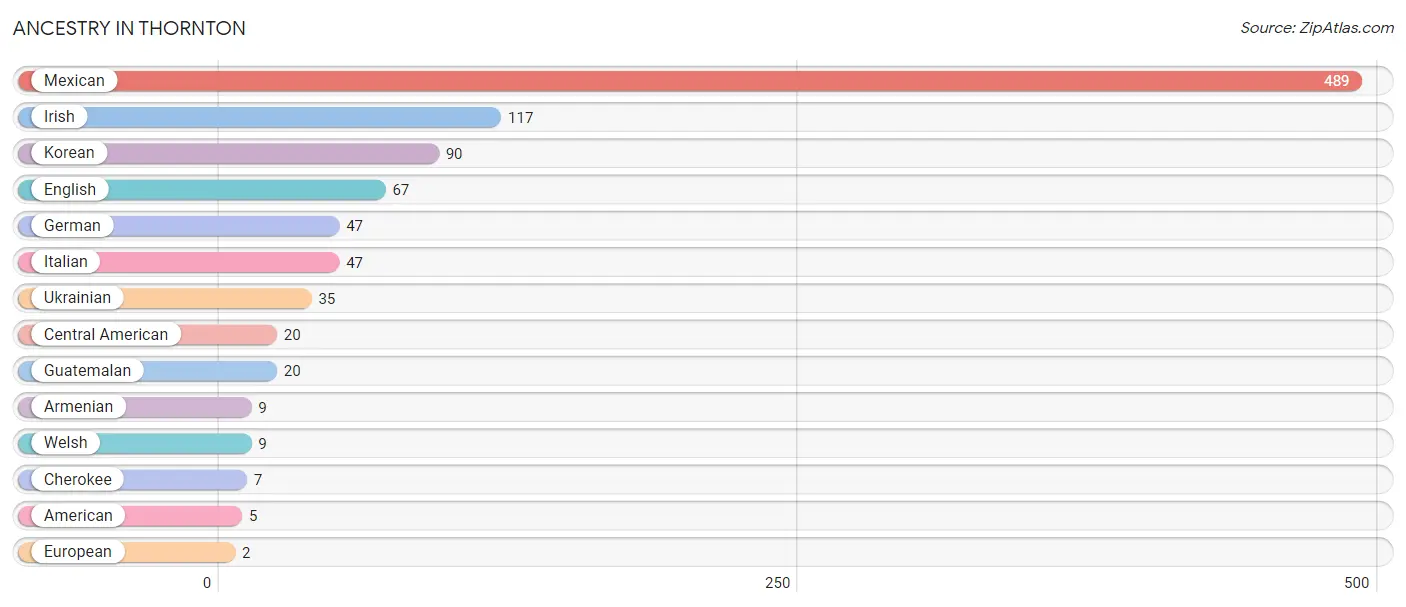
| Ancestry | # Population | % Population |
| American | 5 | 0.6% |
| Armenian | 9 | 1.0% |
| Central American | 20 | 2.3% |
| Cherokee | 7 | 0.8% |
| English | 67 | 7.7% |
| European | 2 | 0.2% |
| German | 47 | 5.4% |
| Guatemalan | 20 | 2.3% |
| Irish | 117 | 13.4% |
| Italian | 47 | 5.4% |
| Korean | 90 | 10.3% |
| Mexican | 489 | 56.0% |
| Ukrainian | 35 | 4.0% |
| Welsh | 9 | 1.0% | View All 14 Rows |
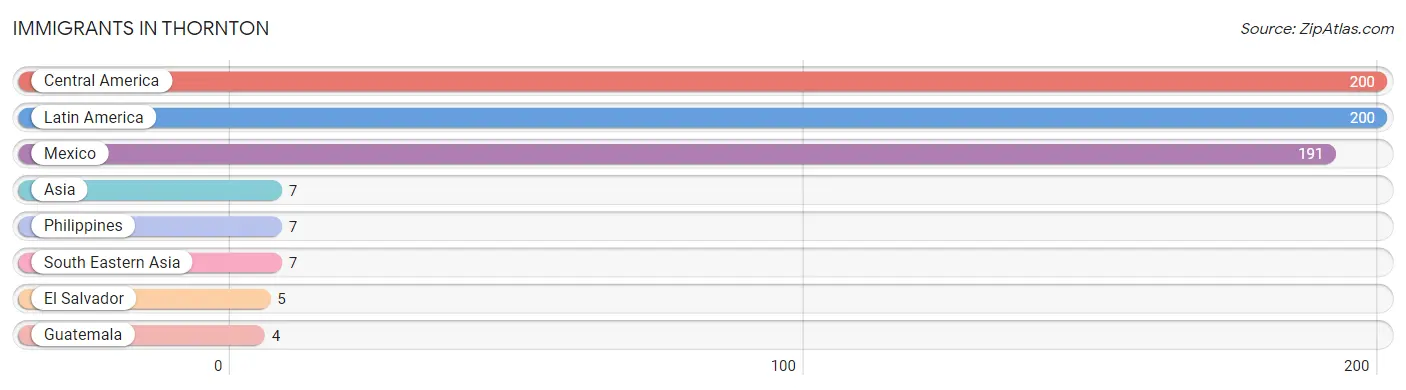
Immigrants in Thornton
The most numerous immigrant groups reported in Thornton came from Central America (200 | 22.9%), Latin America (200 | 22.9%), Mexico (191 | 21.9%), Asia (7 | 0.8%), and Philippines (7 | 0.8%), together accounting for 69.3% of all Thornton residents.
| Immigration Origin | # Population | % Population |
| Asia | 7 | 0.8% |
| Central America | 200 | 22.9% |
| El Salvador | 5 | 0.6% |
| Guatemala | 4 | 0.5% |
| Latin America | 200 | 22.9% |
| Mexico | 191 | 21.9% |
| Philippines | 7 | 0.8% |
| South Eastern Asia | 7 | 0.8% | View All 8 Rows |
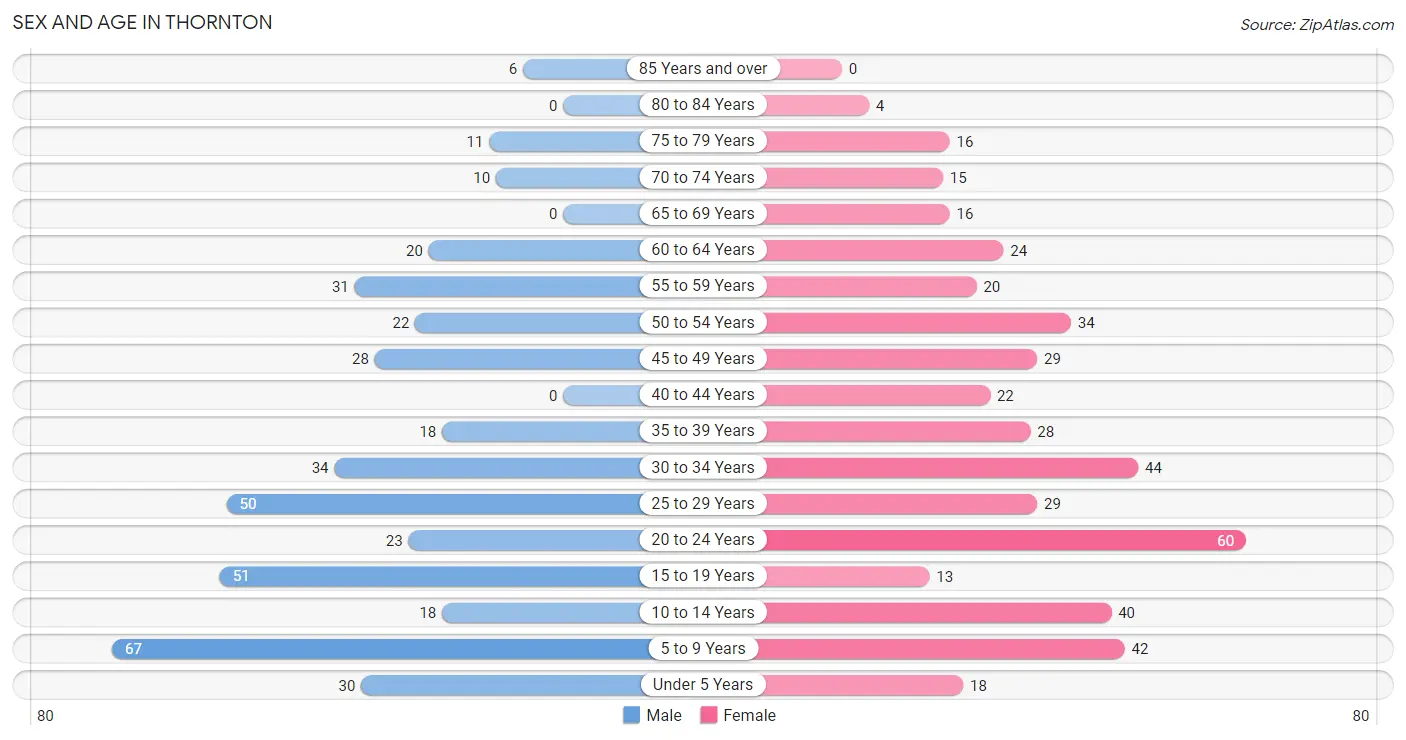
Sex and Age in Thornton
Sex and Age in Thornton
The most populous age groups in Thornton are 5 to 9 Years (67 | 16.0%) for men and 20 to 24 Years (60 | 13.2%) for women.
| Age Bracket | Male | Female |
| Under 5 Years | 30 (7.2%) | 18 (4.0%) |
| 5 to 9 Years | 67 (16.0%) | 42 (9.2%) |
| 10 to 14 Years | 18 (4.3%) | 40 (8.8%) |
| 15 to 19 Years | 51 (12.2%) | 13 (2.9%) |
| 20 to 24 Years | 23 (5.5%) | 60 (13.2%) |
| 25 to 29 Years | 50 (11.9%) | 29 (6.4%) |
| 30 to 34 Years | 34 (8.1%) | 44 (9.7%) |
| 35 to 39 Years | 18 (4.3%) | 28 (6.2%) |
| 40 to 44 Years | 0 (0.0%) | 22 (4.9%) |
| 45 to 49 Years | 28 (6.7%) | 29 (6.4%) |
| 50 to 54 Years | 22 (5.2%) | 34 (7.5%) |
| 55 to 59 Years | 31 (7.4%) | 20 (4.4%) |
| 60 to 64 Years | 20 (4.8%) | 24 (5.3%) |
| 65 to 69 Years | 0 (0.0%) | 16 (3.5%) |
| 70 to 74 Years | 10 (2.4%) | 15 (3.3%) |
| 75 to 79 Years | 11 (2.6%) | 16 (3.5%) |
| 80 to 84 Years | 0 (0.0%) | 4 (0.9%) |
| 85 Years and over | 6 (1.4%) | 0 (0.0%) |
| Total | 419 (100.0%) | 454 (100.0%) |
Families and Households in Thornton
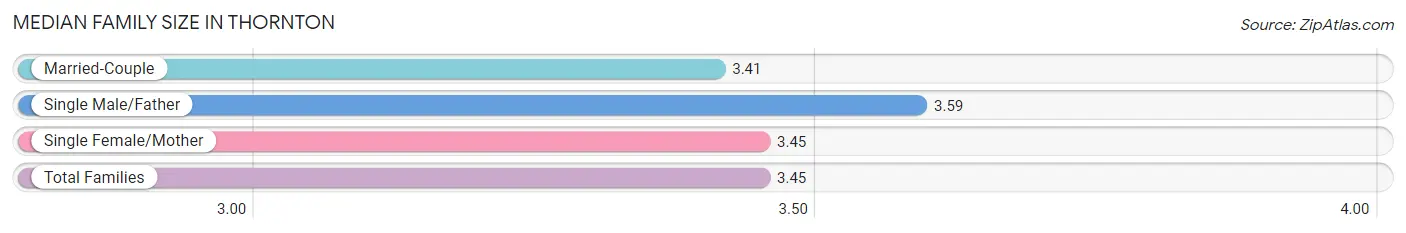
Median Family Size in Thornton
The median family size in Thornton is 3.45 persons per family, with single male/father families (29 | 13.9%) accounting for the largest median family size of 3.59 persons per family. On the other hand, married-couple families (94 | 45.0%) represent the smallest median family size with 3.41 persons per family.
| Family Type | # Families | Family Size |
| Married-Couple | 94 (45.0%) | 3.41 |
| Single Male/Father | 29 (13.9%) | 3.59 |
| Single Female/Mother | 86 (41.1%) | 3.45 |
| Total Families | 209 (100.0%) | 3.45 |
Median Household Size in Thornton
The median household size in Thornton is 3.20 persons per household, with single male/father households (29 | 10.6%) accounting for the largest median household size of 4.59 persons per household. non-family households (64 | 23.4%) represent the smallest median household size with 1.13 persons per household.

| Household Type | # Households | Household Size |
| Married-Couple | 94 (34.4%) | 3.41 |
| Single Male/Father | 29 (10.6%) | 4.59 |
| Single Female/Mother | 86 (31.5%) | 4.03 |
| Non-family | 64 (23.4%) | 1.13 |
| Total Households | 273 (100.0%) | 3.20 |
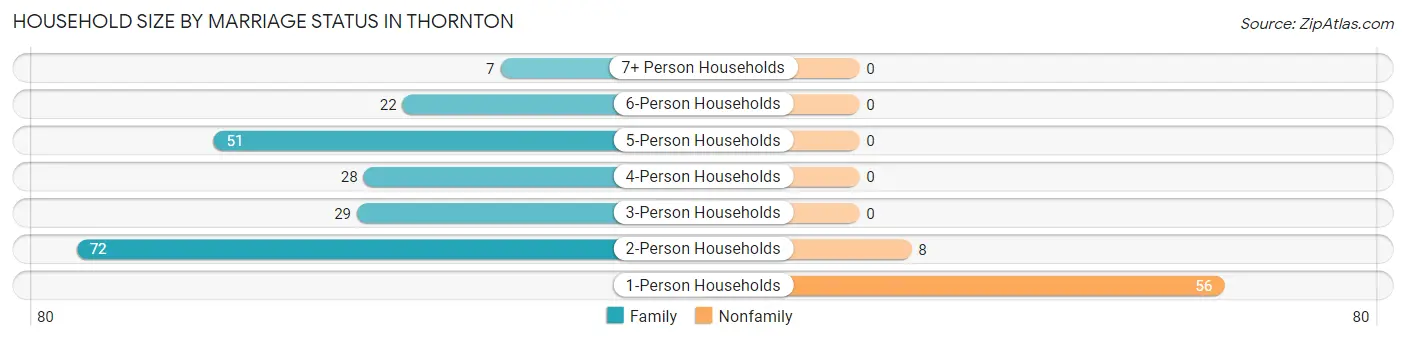
Household Size by Marriage Status in Thornton
Out of a total of 273 households in Thornton, 209 (76.6%) are family households, while 64 (23.4%) are nonfamily households. The most numerous type of family households are 2-person households, comprising 72, and the most common type of nonfamily households are 1-person households, comprising 56.
| Household Size | Family Households | Nonfamily Households |
| 1-Person Households | - | 56 (20.5%) |
| 2-Person Households | 72 (26.4%) | 8 (2.9%) |
| 3-Person Households | 29 (10.6%) | 0 (0.0%) |
| 4-Person Households | 28 (10.3%) | 0 (0.0%) |
| 5-Person Households | 51 (18.7%) | 0 (0.0%) |
| 6-Person Households | 22 (8.1%) | 0 (0.0%) |
| 7+ Person Households | 7 (2.6%) | 0 (0.0%) |
| Total | 209 (76.6%) | 64 (23.4%) |
Female Fertility in Thornton
Fertility by Age in Thornton
Average fertility rate in Thornton is 49.0 births per 1,000 women. Women in the age bracket of 20 to 34 years have the highest fertility rate with 83.0 births per 1,000 women. Women in the age bracket of 20 to 34 years acount for 100.0% of all women with births.
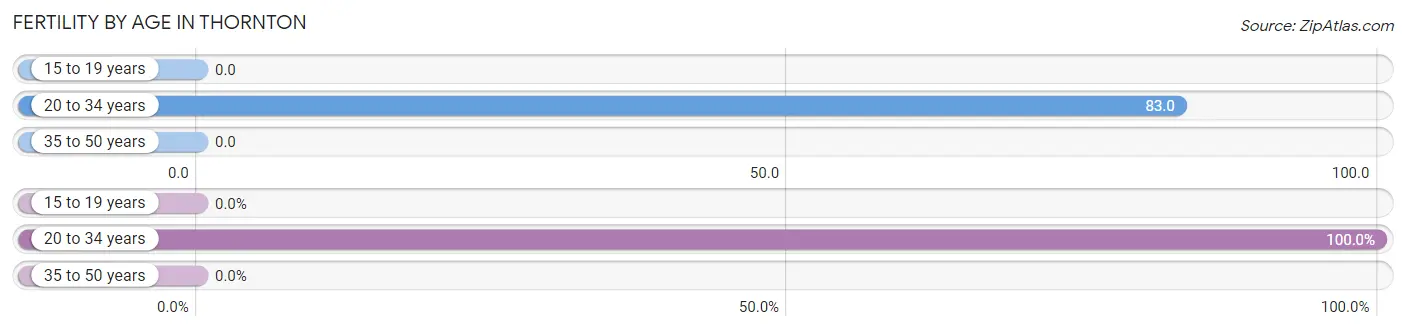
| Age Bracket | Women with Births | Births / 1,000 Women |
| 15 to 19 years | 0 (0.0%) | 0.0 |
| 20 to 34 years | 11 (100.0%) | 83.0 |
| 35 to 50 years | 0 (0.0%) | 0.0 |
| Total | 11 (100.0%) | 49.0 |
Fertility by Age by Marriage Status in Thornton
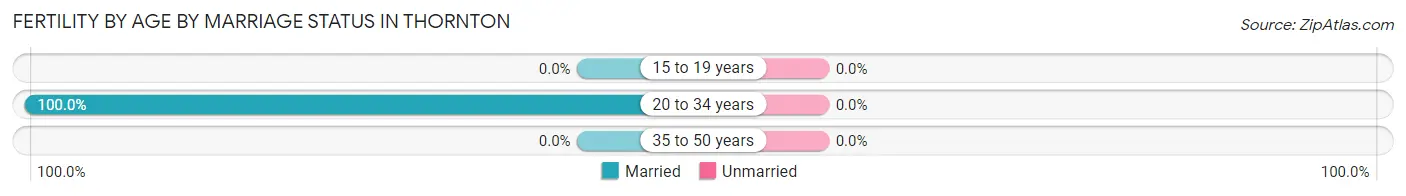
| Age Bracket | Married | Unmarried |
| 15 to 19 years | 0 (0.0%) | 0 (0.0%) |
| 20 to 34 years | 11 (100.0%) | 0 (0.0%) |
| 35 to 50 years | 0 (0.0%) | 0 (0.0%) |
| Total | 11 (100.0%) | 0 (0.0%) |
Fertility by Education in Thornton
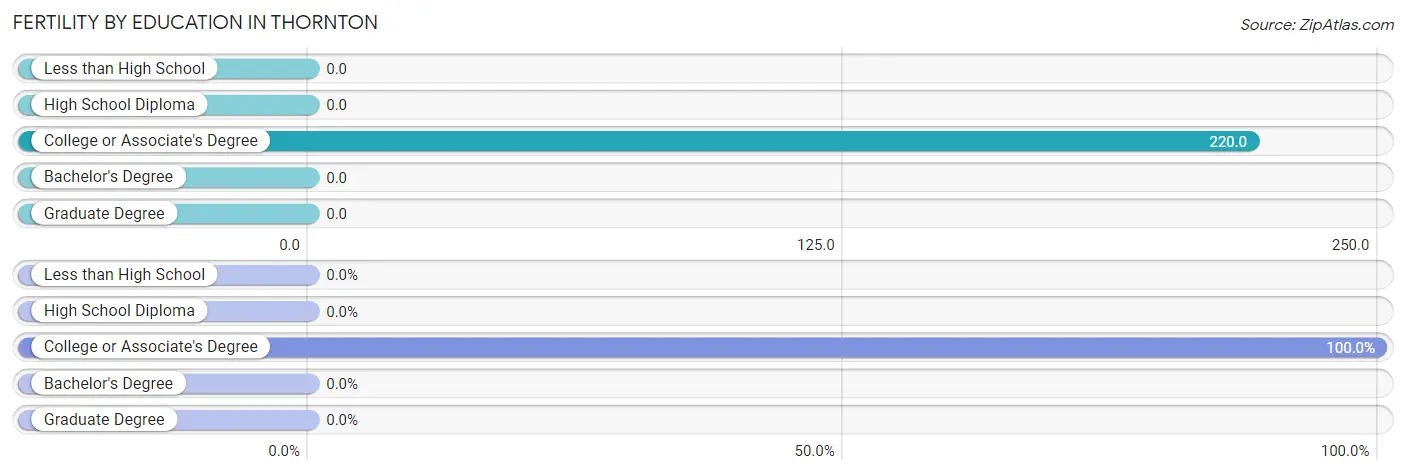
| Educational Attainment | Women with Births | Births / 1,000 Women |
| Less than High School | 0 (0.0%) | 0.0 |
| High School Diploma | 0 (0.0%) | 0.0 |
| College or Associate's Degree | 11 (100.0%) | 220.0 |
| Bachelor's Degree | 0 (0.0%) | 0.0 |
| Graduate Degree | 0 (0.0%) | 0.0 |
| Total | 11 (100.0%) | 49.0 |
Fertility by Education by Marriage Status in Thornton
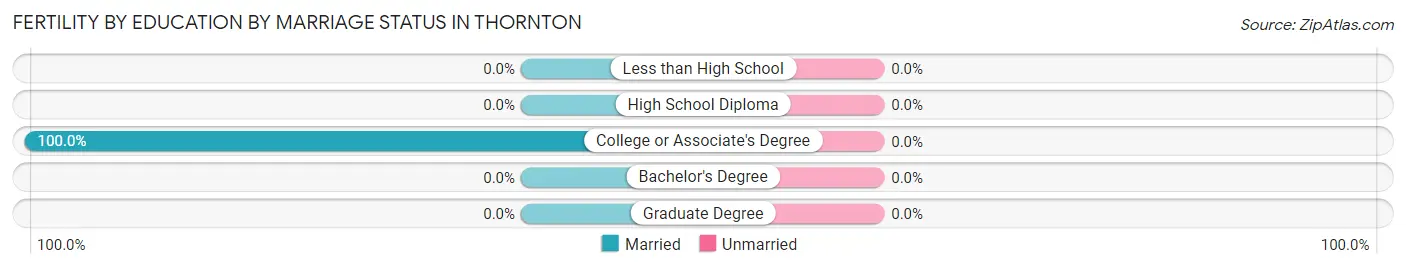
| Educational Attainment | Married | Unmarried |
| Less than High School | 0 (0.0%) | 0 (0.0%) |
| High School Diploma | 0 (0.0%) | 0 (0.0%) |
| College or Associate's Degree | 11 (100.0%) | 0 (0.0%) |
| Bachelor's Degree | 0 (0.0%) | 0 (0.0%) |
| Graduate Degree | 0 (0.0%) | 0 (0.0%) |
| Total | 11 (100.0%) | 0 (0.0%) |
Employment Characteristics in Thornton
Employment by Class of Employer in Thornton
Among the 351 employed individuals in Thornton, private company employees (263 | 74.9%), local government employees (31 | 8.8%), and not-for-profit organizations (24 | 6.8%) make up the most common classes of employment.
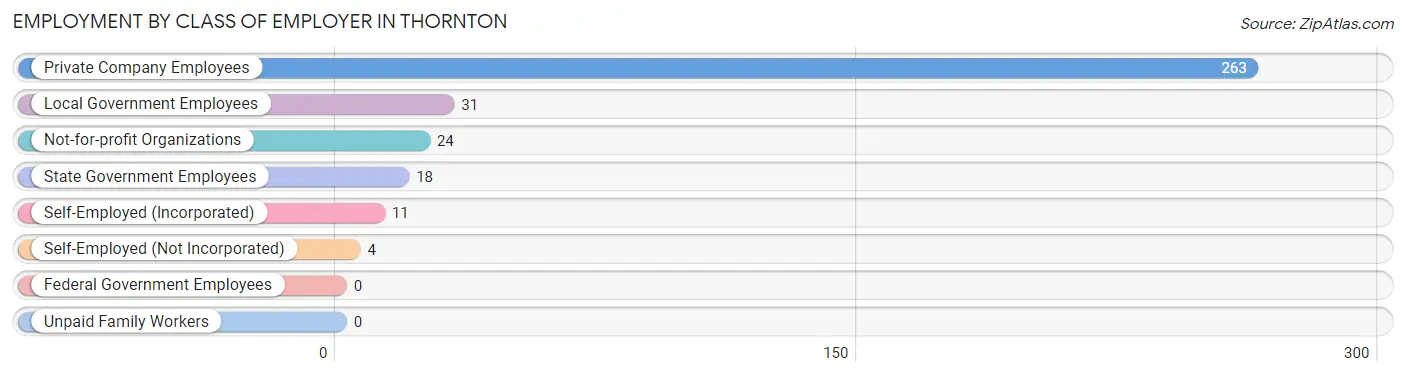
| Employer Class | # Employees | % Employees |
| Private Company Employees | 263 | 74.9% |
| Self-Employed (Incorporated) | 11 | 3.1% |
| Self-Employed (Not Incorporated) | 4 | 1.1% |
| Not-for-profit Organizations | 24 | 6.8% |
| Local Government Employees | 31 | 8.8% |
| State Government Employees | 18 | 5.1% |
| Federal Government Employees | 0 | 0.0% |
| Unpaid Family Workers | 0 | 0.0% |
| Total | 351 | 100.0% |
Employment Status by Age in Thornton
According to the labor force statistics for Thornton, out of the total population over 16 years of age (643), 59.3% or 381 individuals are in the labor force, with 7.9% or 30 of them unemployed. The age group with the highest labor force participation rate is 30 to 34 years, with 89.7% or 70 individuals in the labor force. Within the labor force, the 20 to 24 years age range has the highest percentage of unemployed individuals, with 25.0% or 18 of them being unemployed.
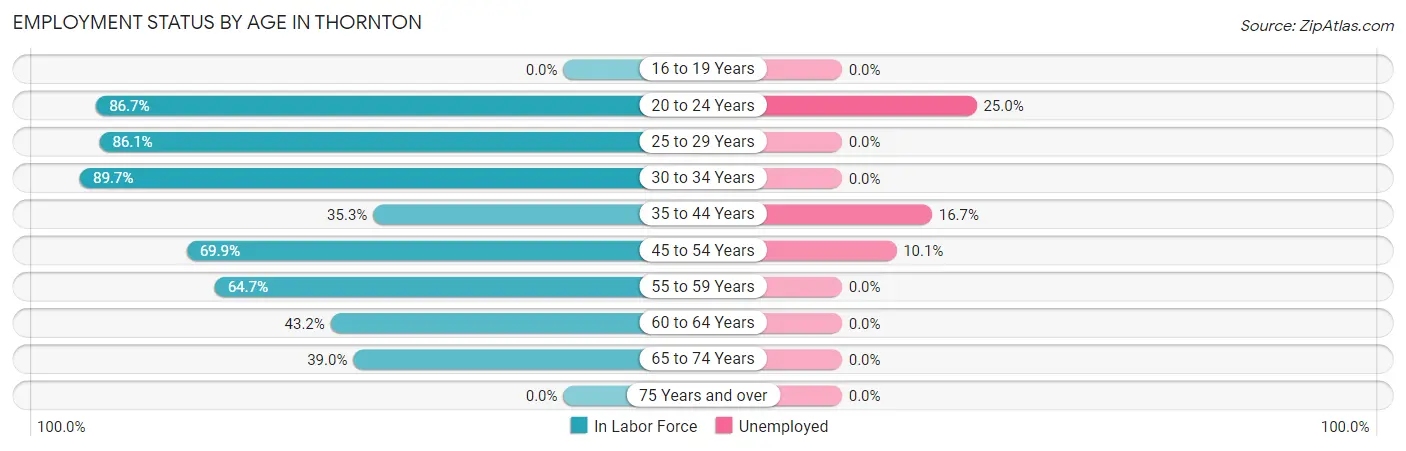
| Age Bracket | In Labor Force | Unemployed |
| 16 to 19 Years | 0 (0.0%) | 0 (0.0%) |
| 20 to 24 Years | 72 (86.7%) | 18 (25.0%) |
| 25 to 29 Years | 68 (86.1%) | 0 (0.0%) |
| 30 to 34 Years | 70 (89.7%) | 0 (0.0%) |
| 35 to 44 Years | 24 (35.3%) | 4 (16.7%) |
| 45 to 54 Years | 79 (69.9%) | 8 (10.1%) |
| 55 to 59 Years | 33 (64.7%) | 0 (0.0%) |
| 60 to 64 Years | 19 (43.2%) | 0 (0.0%) |
| 65 to 74 Years | 16 (39.0%) | 0 (0.0%) |
| 75 Years and over | 0 (0.0%) | 0 (0.0%) |
| Total | 381 (59.3%) | 30 (7.9%) |
Employment Status by Educational Attainment in Thornton
According to labor force statistics for Thornton, 67.7% of individuals (293) out of the total population between 25 and 64 years of age (433) are in the labor force, with 4.1% or 12 of them being unemployed. The group with the highest labor force participation rate are those with the educational attainment of college / associate degree, with 81.4% or 79 individuals in the labor force. Within the labor force, individuals with less than high school education have the highest percentage of unemployment, with 7.8% or 8 of them being unemployed.
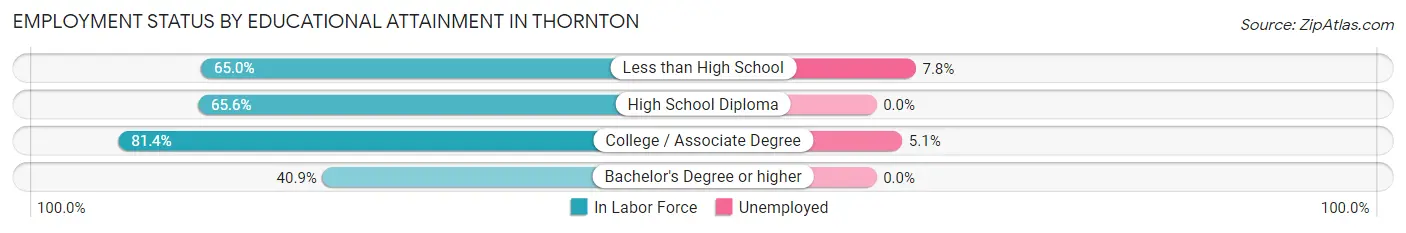
| Educational Attainment | In Labor Force | Unemployed |
| Less than High School | 102 (65.0%) | 12 (7.8%) |
| High School Diploma | 103 (65.6%) | 0 (0.0%) |
| College / Associate Degree | 79 (81.4%) | 5 (5.1%) |
| Bachelor's Degree or higher | 9 (40.9%) | 0 (0.0%) |
| Total | 293 (67.7%) | 18 (4.1%) |
Employment Occupations by Sex in Thornton
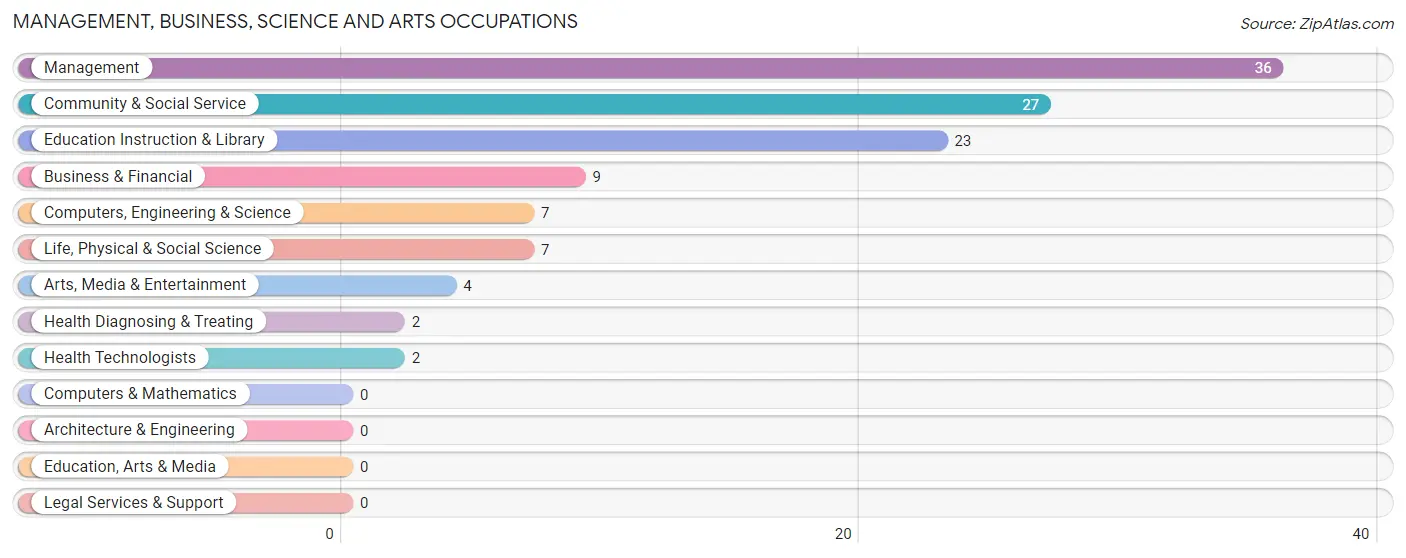
Management, Business, Science and Arts Occupations
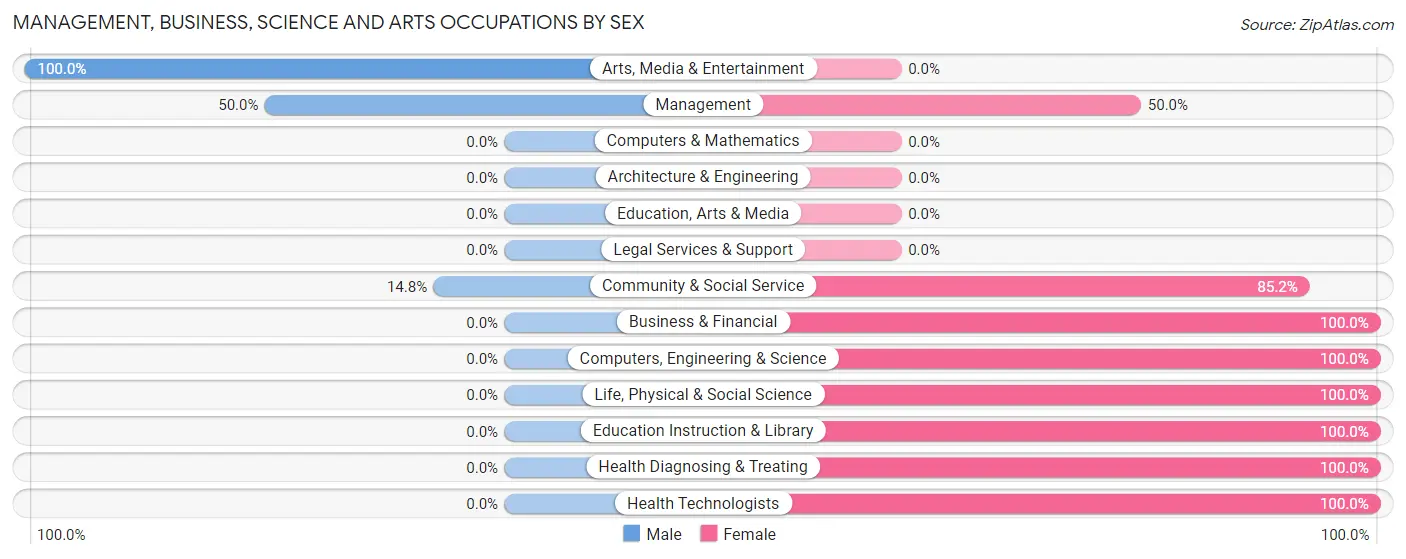
The most common Management, Business, Science and Arts occupations in Thornton are Management (36 | 10.3%), Community & Social Service (27 | 7.7%), Education Instruction & Library (23 | 6.6%), Business & Financial (9 | 2.6%), and Computers, Engineering & Science (7 | 2.0%).
Management, Business, Science and Arts Occupations by Sex
Within the Management, Business, Science and Arts occupations in Thornton, the most male-oriented occupations are Arts, Media & Entertainment (100.0%), Management (50.0%), and Community & Social Service (14.8%), while the most female-oriented occupations are Business & Financial (100.0%), Computers, Engineering & Science (100.0%), and Life, Physical & Social Science (100.0%).
| Occupation | Male | Female |
| Management | 18 (50.0%) | 18 (50.0%) |
| Business & Financial | 0 (0.0%) | 9 (100.0%) |
| Computers, Engineering & Science | 0 (0.0%) | 7 (100.0%) |
| Computers & Mathematics | 0 (0.0%) | 0 (0.0%) |
| Architecture & Engineering | 0 (0.0%) | 0 (0.0%) |
| Life, Physical & Social Science | 0 (0.0%) | 7 (100.0%) |
| Community & Social Service | 4 (14.8%) | 23 (85.2%) |
| Education, Arts & Media | 0 (0.0%) | 0 (0.0%) |
| Legal Services & Support | 0 (0.0%) | 0 (0.0%) |
| Education Instruction & Library | 0 (0.0%) | 23 (100.0%) |
| Arts, Media & Entertainment | 4 (100.0%) | 0 (0.0%) |
| Health Diagnosing & Treating | 0 (0.0%) | 2 (100.0%) |
| Health Technologists | 0 (0.0%) | 2 (100.0%) |
| Total (Category) | 22 (27.2%) | 59 (72.8%) |
| Total (Overall) | 194 (55.3%) | 157 (44.7%) |
Services Occupations
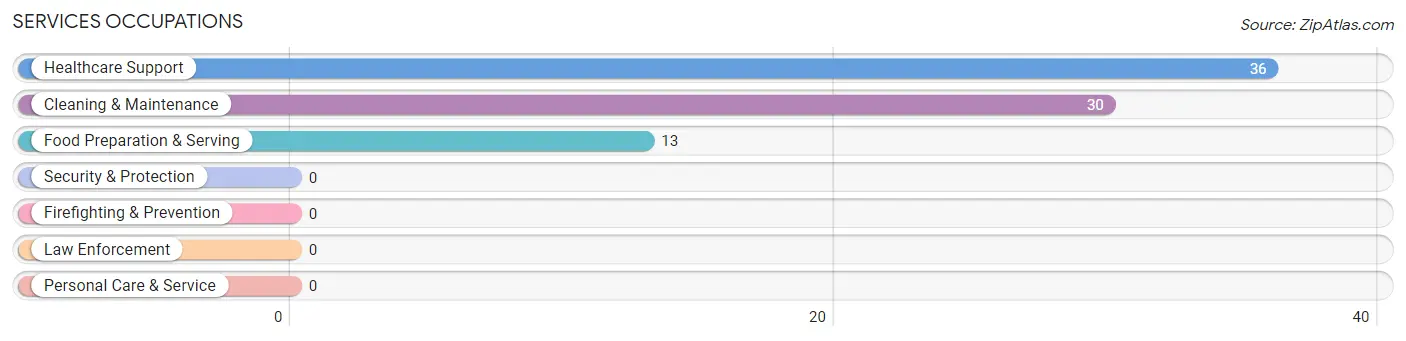
The most common Services occupations in Thornton are Healthcare Support (36 | 10.3%), Cleaning & Maintenance (30 | 8.6%), and Food Preparation & Serving (13 | 3.7%).
Services Occupations by Sex
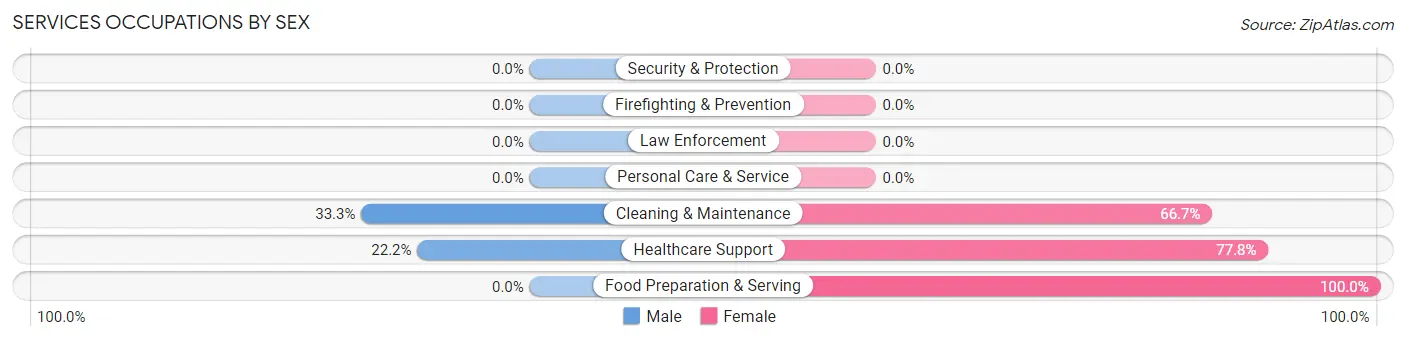
Within the Services occupations in Thornton, the most male-oriented occupations are Cleaning & Maintenance (33.3%), and Healthcare Support (22.2%), while the most female-oriented occupations are Food Preparation & Serving (100.0%), Healthcare Support (77.8%), and Cleaning & Maintenance (66.7%).
| Occupation | Male | Female |
| Healthcare Support | 8 (22.2%) | 28 (77.8%) |
| Security & Protection | 0 (0.0%) | 0 (0.0%) |
| Firefighting & Prevention | 0 (0.0%) | 0 (0.0%) |
| Law Enforcement | 0 (0.0%) | 0 (0.0%) |
| Food Preparation & Serving | 0 (0.0%) | 13 (100.0%) |
| Cleaning & Maintenance | 10 (33.3%) | 20 (66.7%) |
| Personal Care & Service | 0 (0.0%) | 0 (0.0%) |
| Total (Category) | 18 (22.8%) | 61 (77.2%) |
| Total (Overall) | 194 (55.3%) | 157 (44.7%) |
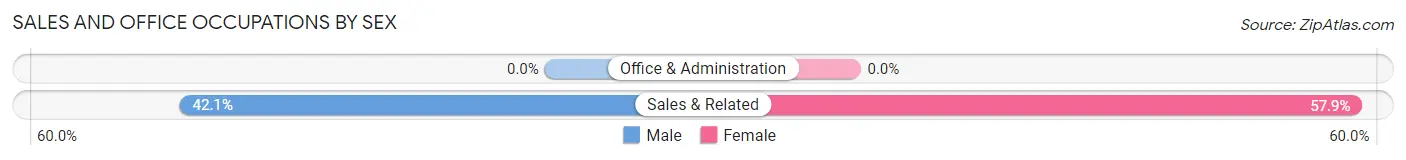
Sales and Office Occupations
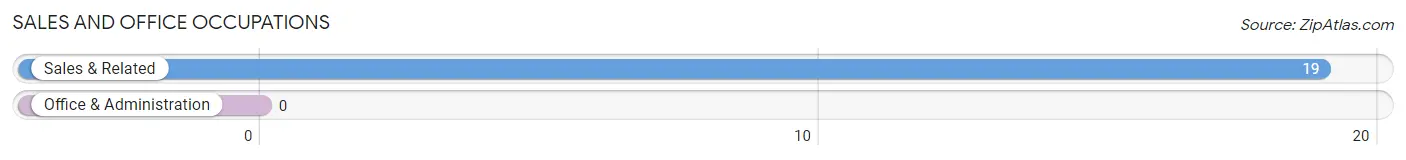
The most common Sales and Office occupations in Thornton are , and Sales & Related (19 | 5.4%).
Sales and Office Occupations by Sex
| Occupation | Male | Female |
| Sales & Related | 8 (42.1%) | 11 (57.9%) |
| Office & Administration | 0 (0.0%) | 0 (0.0%) |
| Total (Category) | 8 (42.1%) | 11 (57.9%) |
| Total (Overall) | 194 (55.3%) | 157 (44.7%) |
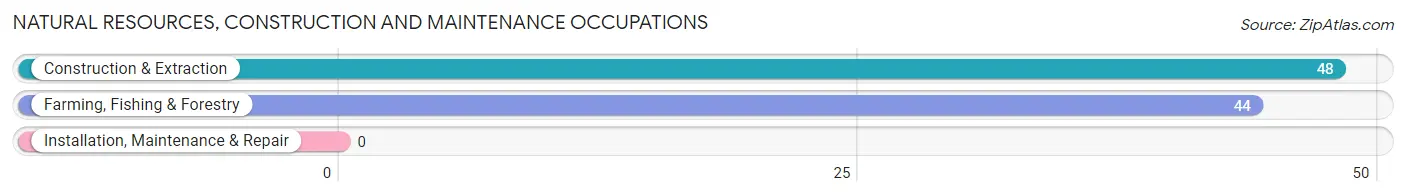
Natural Resources, Construction and Maintenance Occupations
The most common Natural Resources, Construction and Maintenance occupations in Thornton are Construction & Extraction (48 | 13.7%), and Farming, Fishing & Forestry (44 | 12.5%).
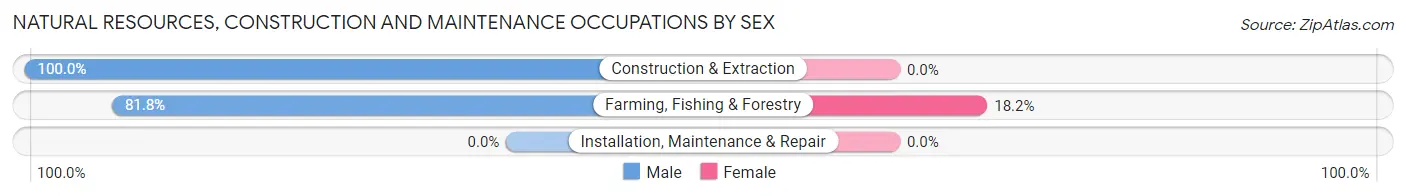
Natural Resources, Construction and Maintenance Occupations by Sex
| Occupation | Male | Female |
| Farming, Fishing & Forestry | 36 (81.8%) | 8 (18.2%) |
| Construction & Extraction | 48 (100.0%) | 0 (0.0%) |
| Installation, Maintenance & Repair | 0 (0.0%) | 0 (0.0%) |
| Total (Category) | 84 (91.3%) | 8 (8.7%) |
| Total (Overall) | 194 (55.3%) | 157 (44.7%) |
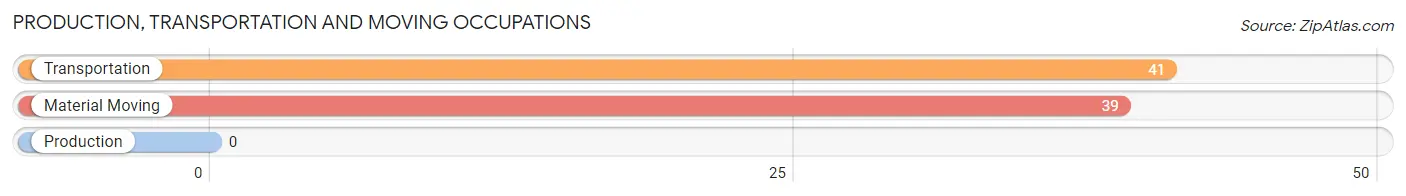
Production, Transportation and Moving Occupations
The most common Production, Transportation and Moving occupations in Thornton are Transportation (41 | 11.7%), and Material Moving (39 | 11.1%).
Production, Transportation and Moving Occupations by Sex
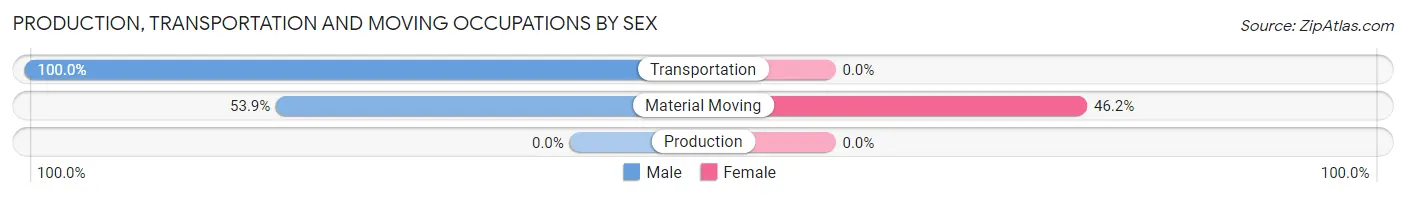
| Occupation | Male | Female |
| Production | 0 (0.0%) | 0 (0.0%) |
| Transportation | 41 (100.0%) | 0 (0.0%) |
| Material Moving | 21 (53.8%) | 18 (46.2%) |
| Total (Category) | 62 (77.5%) | 18 (22.5%) |
| Total (Overall) | 194 (55.3%) | 157 (44.7%) |
Employment Industries by Sex in Thornton
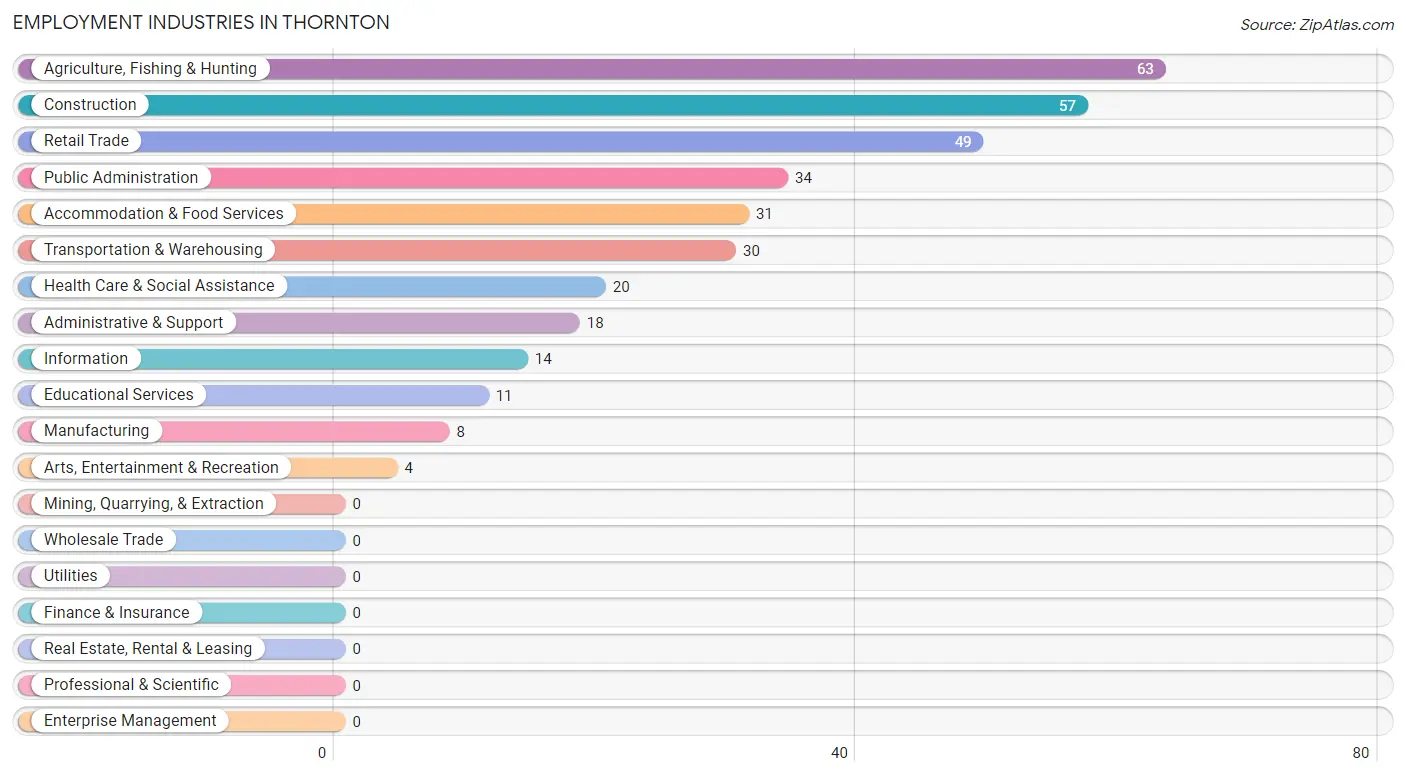
Employment Industries in Thornton
The major employment industries in Thornton include Agriculture, Fishing & Hunting (63 | 17.9%), Construction (57 | 16.2%), Retail Trade (49 | 14.0%), Public Administration (34 | 9.7%), and Accommodation & Food Services (31 | 8.8%).
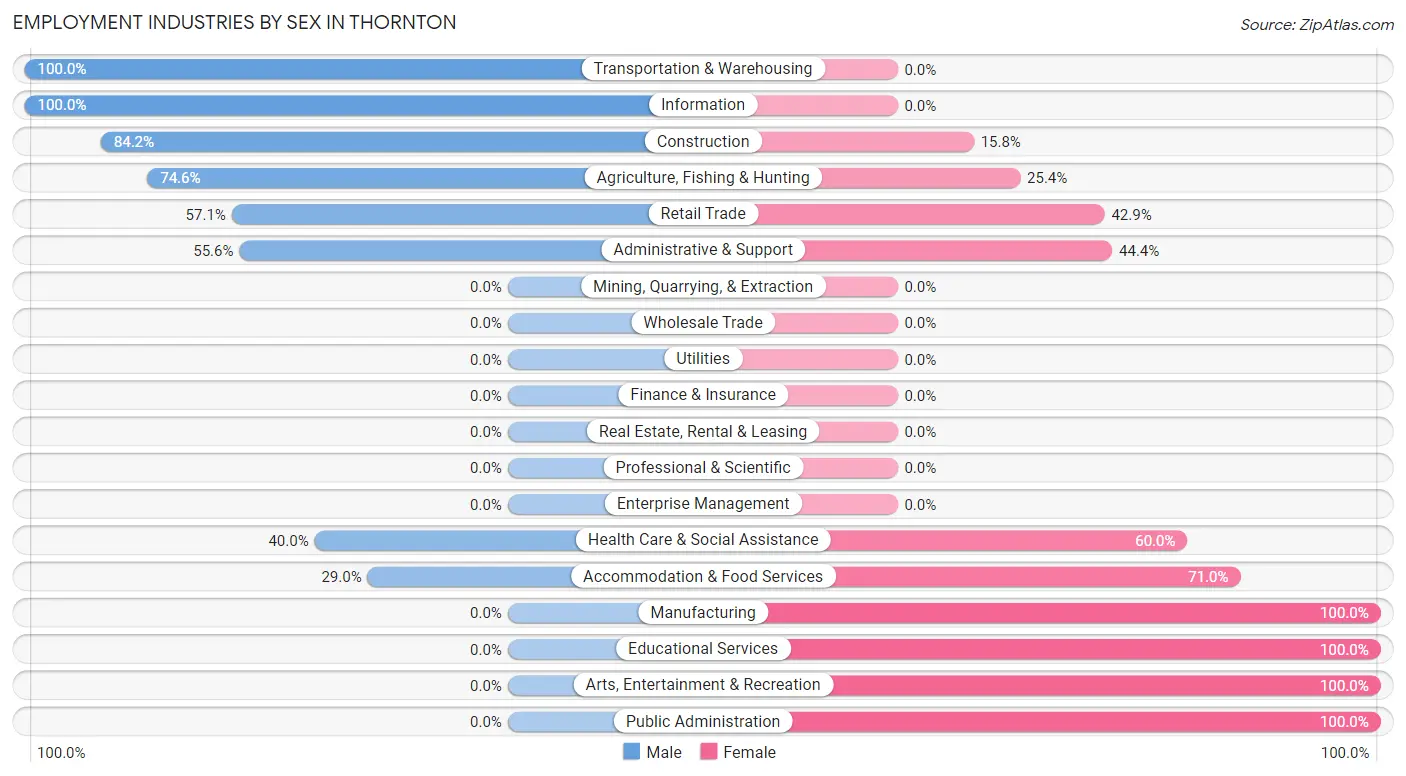
Employment Industries by Sex in Thornton
The Thornton industries that see more men than women are Transportation & Warehousing (100.0%), Information (100.0%), and Construction (84.2%), whereas the industries that tend to have a higher number of women are Manufacturing (100.0%), Educational Services (100.0%), and Arts, Entertainment & Recreation (100.0%).
| Industry | Male | Female |
| Agriculture, Fishing & Hunting | 47 (74.6%) | 16 (25.4%) |
| Mining, Quarrying, & Extraction | 0 (0.0%) | 0 (0.0%) |
| Construction | 48 (84.2%) | 9 (15.8%) |
| Manufacturing | 0 (0.0%) | 8 (100.0%) |
| Wholesale Trade | 0 (0.0%) | 0 (0.0%) |
| Retail Trade | 28 (57.1%) | 21 (42.9%) |
| Transportation & Warehousing | 30 (100.0%) | 0 (0.0%) |
| Utilities | 0 (0.0%) | 0 (0.0%) |
| Information | 14 (100.0%) | 0 (0.0%) |
| Finance & Insurance | 0 (0.0%) | 0 (0.0%) |
| Real Estate, Rental & Leasing | 0 (0.0%) | 0 (0.0%) |
| Professional & Scientific | 0 (0.0%) | 0 (0.0%) |
| Enterprise Management | 0 (0.0%) | 0 (0.0%) |
| Administrative & Support | 10 (55.6%) | 8 (44.4%) |
| Educational Services | 0 (0.0%) | 11 (100.0%) |
| Health Care & Social Assistance | 8 (40.0%) | 12 (60.0%) |
| Arts, Entertainment & Recreation | 0 (0.0%) | 4 (100.0%) |
| Accommodation & Food Services | 9 (29.0%) | 22 (71.0%) |
| Public Administration | 0 (0.0%) | 34 (100.0%) |
| Total | 194 (55.3%) | 157 (44.7%) |
Education in Thornton
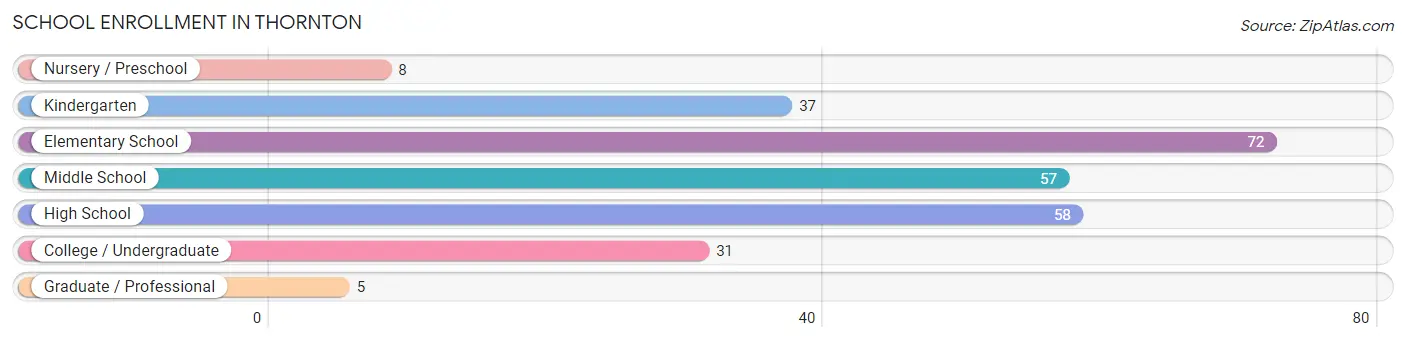
School Enrollment in Thornton
The most common levels of schooling among the 268 students in Thornton are elementary school (72 | 26.9%), high school (58 | 21.6%), and middle school (57 | 21.3%).
| School Level | # Students | % Students |
| Nursery / Preschool | 8 | 3.0% |
| Kindergarten | 37 | 13.8% |
| Elementary School | 72 | 26.9% |
| Middle School | 57 | 21.3% |
| High School | 58 | 21.6% |
| College / Undergraduate | 31 | 11.6% |
| Graduate / Professional | 5 | 1.9% |
| Total | 268 | 100.0% |
School Enrollment by Age by Funding Source in Thornton
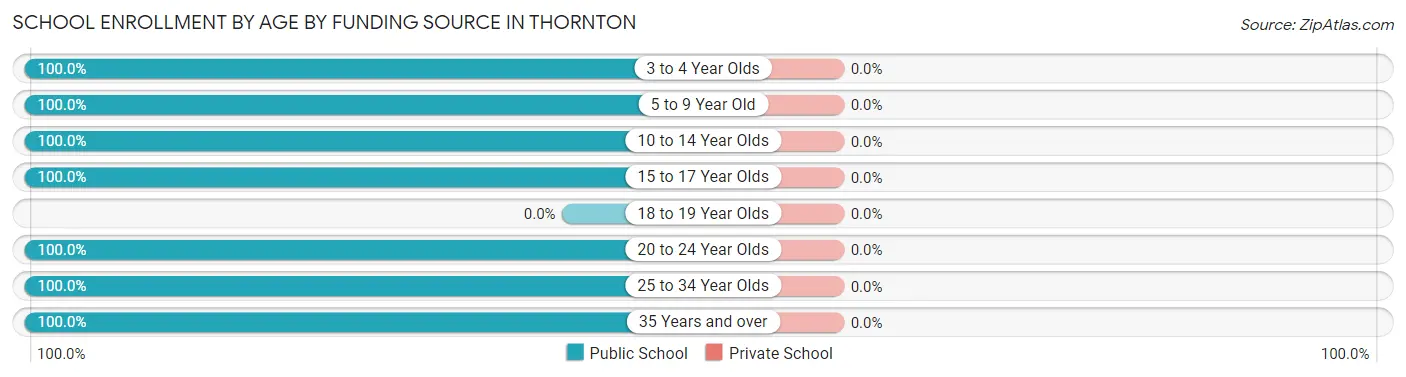
| Age Bracket | Public School | Private School |
| 3 to 4 Year Olds | 8 (100.0%) | 0 (0.0%) |
| 5 to 9 Year Old | 109 (100.0%) | 0 (0.0%) |
| 10 to 14 Year Olds | 58 (100.0%) | 0 (0.0%) |
| 15 to 17 Year Olds | 57 (100.0%) | 0 (0.0%) |
| 18 to 19 Year Olds | 0 (0.0%) | 0 (0.0%) |
| 20 to 24 Year Olds | 11 (100.0%) | 0 (0.0%) |
| 25 to 34 Year Olds | 20 (100.0%) | 0 (0.0%) |
| 35 Years and over | 5 (100.0%) | 0 (0.0%) |
| Total | 268 (100.0%) | 0 (0.0%) |
Educational Attainment by Field of Study in Thornton
Arts & humanities (12 | 40.0%), psychology (8 | 26.7%), communications (8 | 26.7%), and science & technology (2 | 6.7%) are the most common fields of study among 30 individuals in Thornton who have obtained a bachelor's degree or higher.
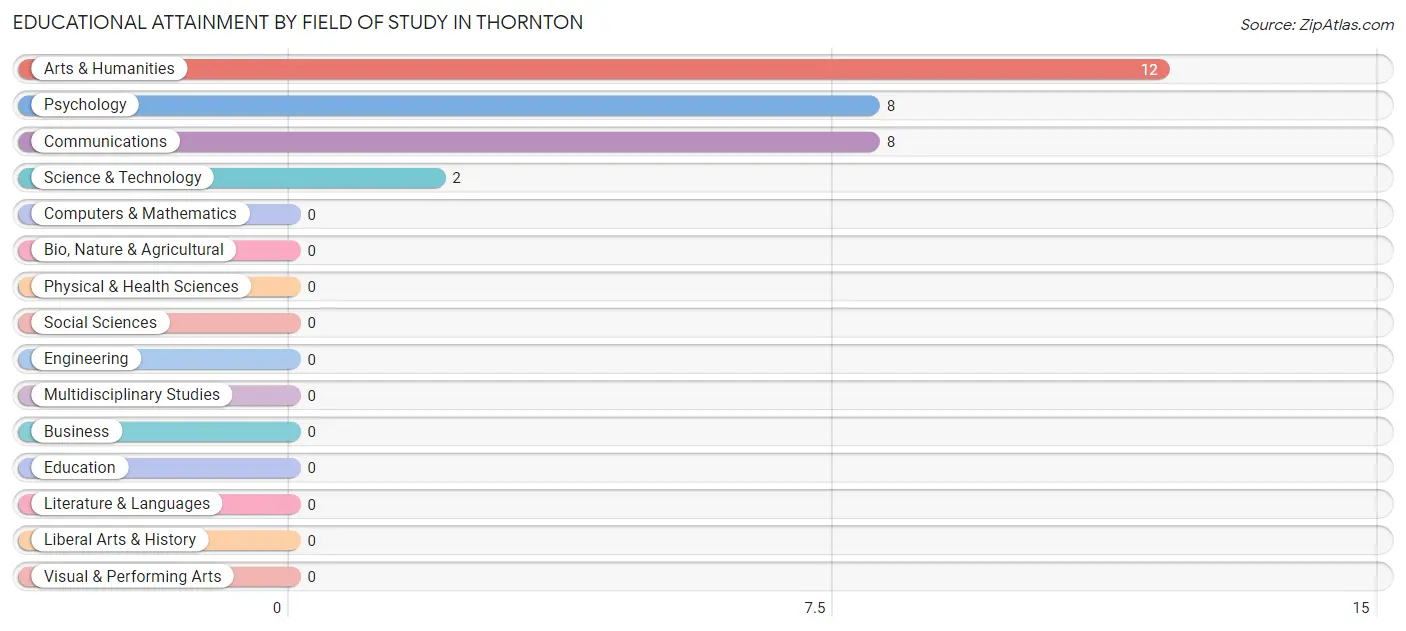
| Field of Study | # Graduates | % Graduates |
| Computers & Mathematics | 0 | 0.0% |
| Bio, Nature & Agricultural | 0 | 0.0% |
| Physical & Health Sciences | 0 | 0.0% |
| Psychology | 8 | 26.7% |
| Social Sciences | 0 | 0.0% |
| Engineering | 0 | 0.0% |
| Multidisciplinary Studies | 0 | 0.0% |
| Science & Technology | 2 | 6.7% |
| Business | 0 | 0.0% |
| Education | 0 | 0.0% |
| Literature & Languages | 0 | 0.0% |
| Liberal Arts & History | 0 | 0.0% |
| Visual & Performing Arts | 0 | 0.0% |
| Communications | 8 | 26.7% |
| Arts & Humanities | 12 | 40.0% |
| Total | 30 | 100.0% |
Transportation & Commute in Thornton
Vehicle Availability by Sex in Thornton
The most prevalent vehicle ownership categories in Thornton are males with 5 or more vehicles (44, accounting for 22.7%) and females with 5 or more vehicles (36, making up 28.0%).
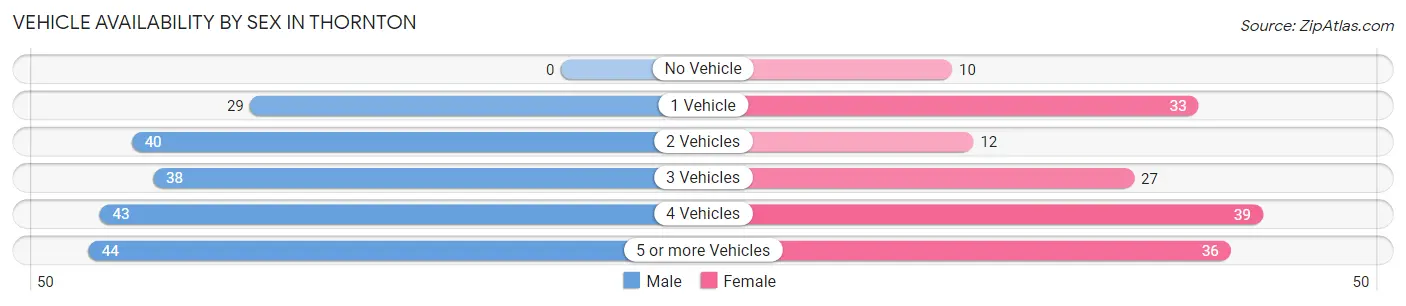
| Vehicles Available | Male | Female |
| No Vehicle | 0 (0.0%) | 10 (6.4%) |
| 1 Vehicle | 29 (14.9%) | 33 (21.0%) |
| 2 Vehicles | 40 (20.6%) | 12 (7.6%) |
| 3 Vehicles | 38 (19.6%) | 27 (17.2%) |
| 4 Vehicles | 43 (22.2%) | 39 (24.8%) |
| 5 or more Vehicles | 44 (22.7%) | 36 (22.9%) |
| Total | 194 (100.0%) | 157 (100.0%) |
Commute Time in Thornton
The most frequently occuring commute durations in Thornton are 30 to 34 minutes (118 commuters, 34.6%), 20 to 24 minutes (89 commuters, 26.1%), and 60 to 89 minutes (52 commuters, 15.2%).
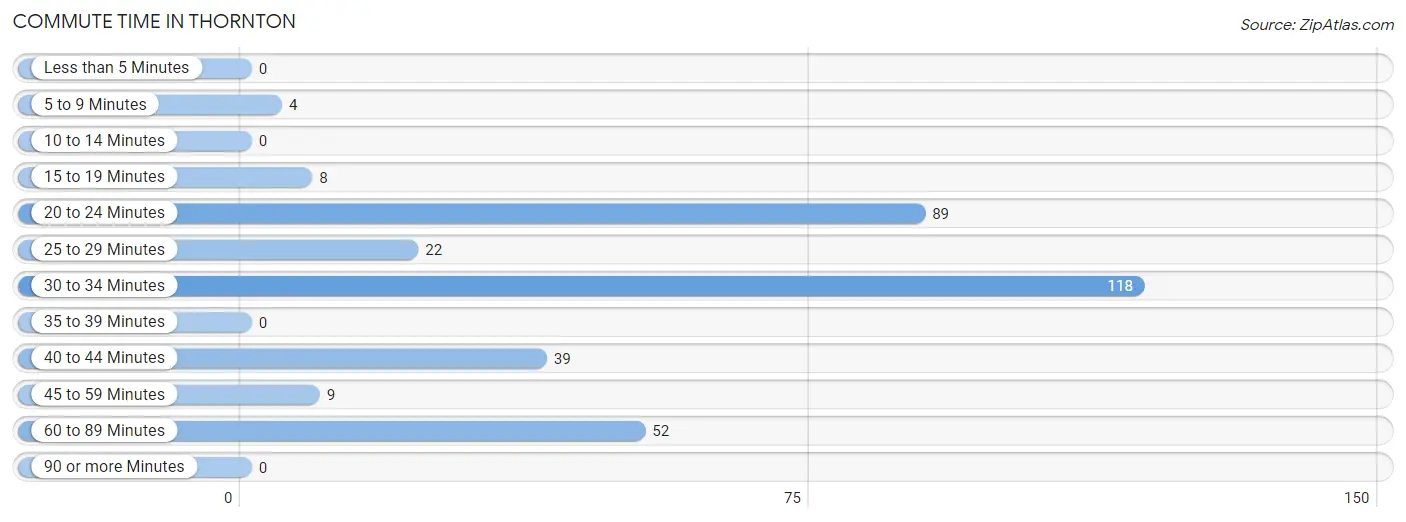
| Commute Time | # Commuters | % Commuters |
| Less than 5 Minutes | 0 | 0.0% |
| 5 to 9 Minutes | 4 | 1.2% |
| 10 to 14 Minutes | 0 | 0.0% |
| 15 to 19 Minutes | 8 | 2.4% |
| 20 to 24 Minutes | 89 | 26.1% |
| 25 to 29 Minutes | 22 | 6.5% |
| 30 to 34 Minutes | 118 | 34.6% |
| 35 to 39 Minutes | 0 | 0.0% |
| 40 to 44 Minutes | 39 | 11.4% |
| 45 to 59 Minutes | 9 | 2.6% |
| 60 to 89 Minutes | 52 | 15.2% |
| 90 or more Minutes | 0 | 0.0% |
Commute Time by Sex in Thornton
The most common commute times in Thornton are 30 to 34 minutes (78 commuters, 40.2%) for males and 20 to 24 minutes (48 commuters, 32.7%) for females.
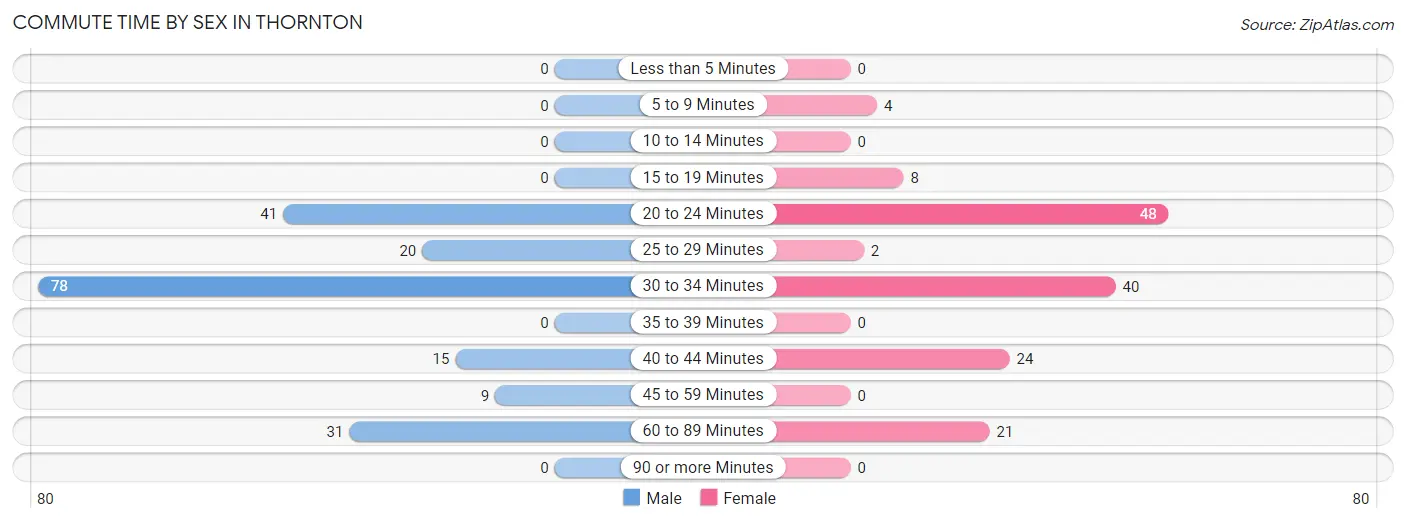
| Commute Time | Male | Female |
| Less than 5 Minutes | 0 (0.0%) | 0 (0.0%) |
| 5 to 9 Minutes | 0 (0.0%) | 4 (2.7%) |
| 10 to 14 Minutes | 0 (0.0%) | 0 (0.0%) |
| 15 to 19 Minutes | 0 (0.0%) | 8 (5.4%) |
| 20 to 24 Minutes | 41 (21.1%) | 48 (32.7%) |
| 25 to 29 Minutes | 20 (10.3%) | 2 (1.4%) |
| 30 to 34 Minutes | 78 (40.2%) | 40 (27.2%) |
| 35 to 39 Minutes | 0 (0.0%) | 0 (0.0%) |
| 40 to 44 Minutes | 15 (7.7%) | 24 (16.3%) |
| 45 to 59 Minutes | 9 (4.6%) | 0 (0.0%) |
| 60 to 89 Minutes | 31 (16.0%) | 21 (14.3%) |
| 90 or more Minutes | 0 (0.0%) | 0 (0.0%) |
Time of Departure to Work by Sex in Thornton
The most frequent times of departure to work in Thornton are 6:00 AM to 6:29 AM (59, 30.4%) for males and 7:00 AM to 7:29 AM (47, 32.0%) for females.
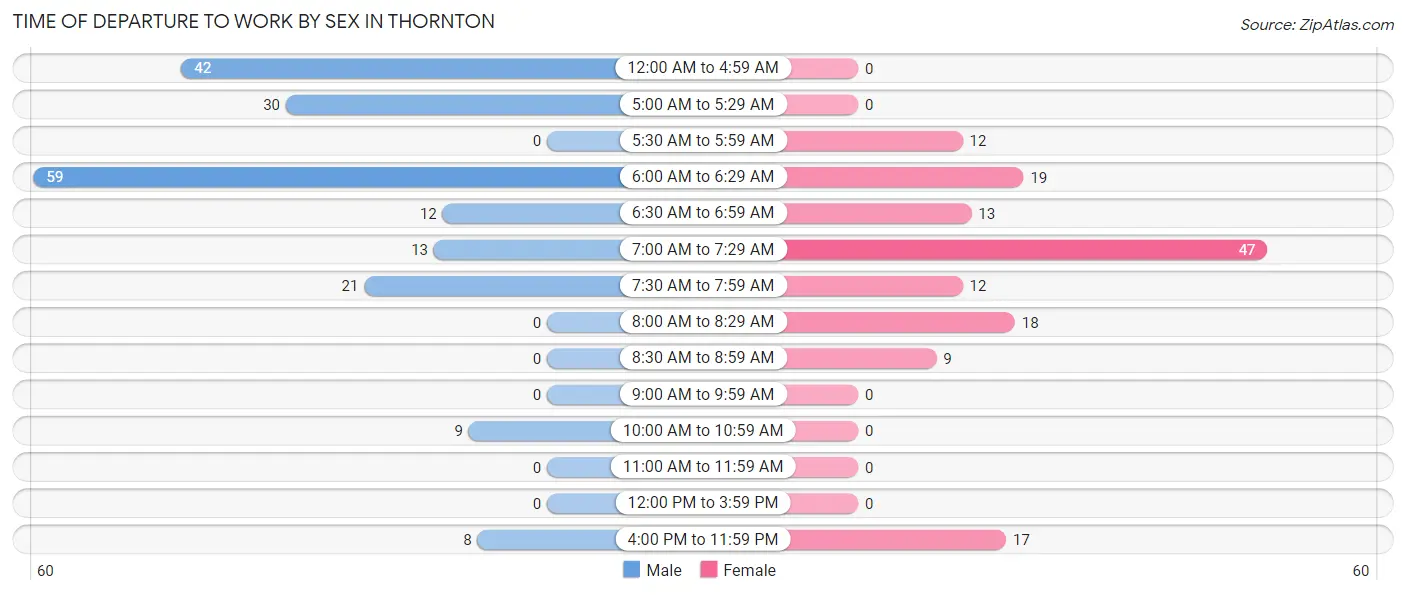
| Time of Departure | Male | Female |
| 12:00 AM to 4:59 AM | 42 (21.6%) | 0 (0.0%) |
| 5:00 AM to 5:29 AM | 30 (15.5%) | 0 (0.0%) |
| 5:30 AM to 5:59 AM | 0 (0.0%) | 12 (8.2%) |
| 6:00 AM to 6:29 AM | 59 (30.4%) | 19 (12.9%) |
| 6:30 AM to 6:59 AM | 12 (6.2%) | 13 (8.8%) |
| 7:00 AM to 7:29 AM | 13 (6.7%) | 47 (32.0%) |
| 7:30 AM to 7:59 AM | 21 (10.8%) | 12 (8.2%) |
| 8:00 AM to 8:29 AM | 0 (0.0%) | 18 (12.2%) |
| 8:30 AM to 8:59 AM | 0 (0.0%) | 9 (6.1%) |
| 9:00 AM to 9:59 AM | 0 (0.0%) | 0 (0.0%) |
| 10:00 AM to 10:59 AM | 9 (4.6%) | 0 (0.0%) |
| 11:00 AM to 11:59 AM | 0 (0.0%) | 0 (0.0%) |
| 12:00 PM to 3:59 PM | 0 (0.0%) | 0 (0.0%) |
| 4:00 PM to 11:59 PM | 8 (4.1%) | 17 (11.6%) |
| Total | 194 (100.0%) | 147 (100.0%) |
Housing Occupancy in Thornton
Occupancy by Ownership in Thornton
Of the total 273 dwellings in Thornton, owner-occupied units account for 140 (51.3%), while renter-occupied units make up 133 (48.7%).
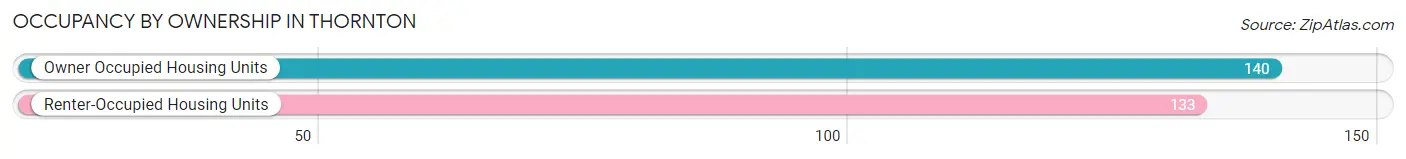
| Occupancy | # Housing Units | % Housing Units |
| Owner Occupied Housing Units | 140 | 51.3% |
| Renter-Occupied Housing Units | 133 | 48.7% |
| Total Occupied Housing Units | 273 | 100.0% |
Occupancy by Household Size in Thornton
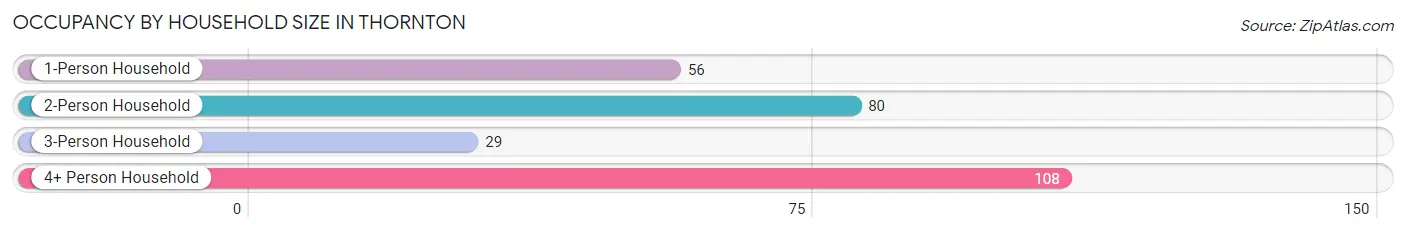
| Household Size | # Housing Units | % Housing Units |
| 1-Person Household | 56 | 20.5% |
| 2-Person Household | 80 | 29.3% |
| 3-Person Household | 29 | 10.6% |
| 4+ Person Household | 108 | 39.6% |
| Total Housing Units | 273 | 100.0% |
Occupancy by Ownership by Household Size in Thornton
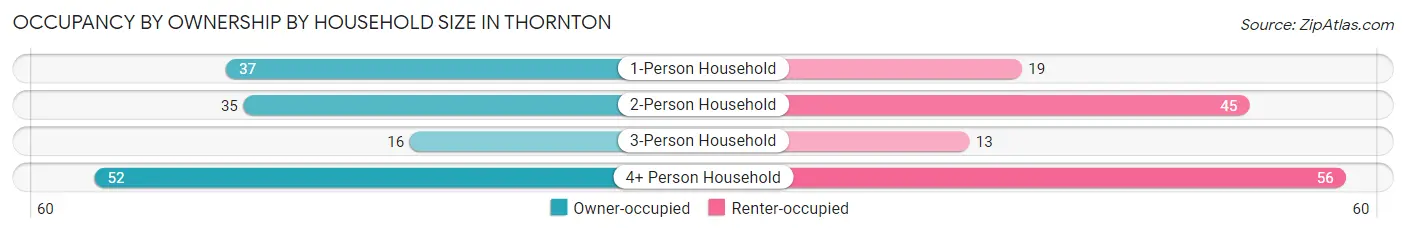
| Household Size | Owner-occupied | Renter-occupied |
| 1-Person Household | 37 (66.1%) | 19 (33.9%) |
| 2-Person Household | 35 (43.8%) | 45 (56.2%) |
| 3-Person Household | 16 (55.2%) | 13 (44.8%) |
| 4+ Person Household | 52 (48.1%) | 56 (51.8%) |
| Total Housing Units | 140 (51.3%) | 133 (48.7%) |
Occupancy by Educational Attainment in Thornton
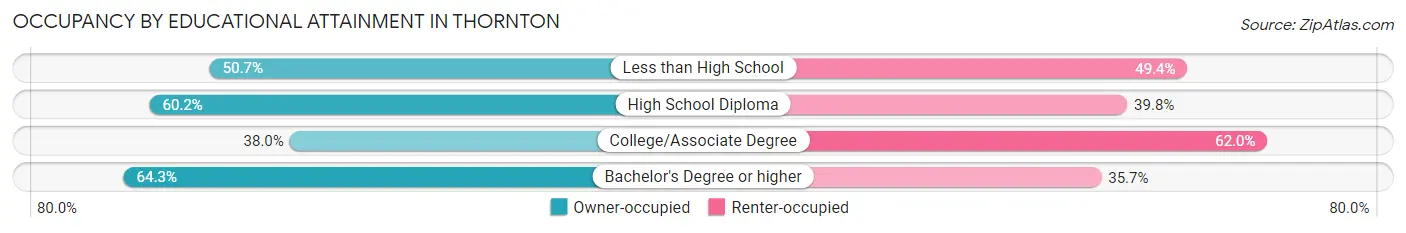
| Household Size | Owner-occupied | Renter-occupied |
| Less than High School | 39 (50.6%) | 38 (49.3%) |
| High School Diploma | 62 (60.2%) | 41 (39.8%) |
| College/Associate Degree | 30 (38.0%) | 49 (62.0%) |
| Bachelor's Degree or higher | 9 (64.3%) | 5 (35.7%) |
Occupancy by Age of Householder in Thornton
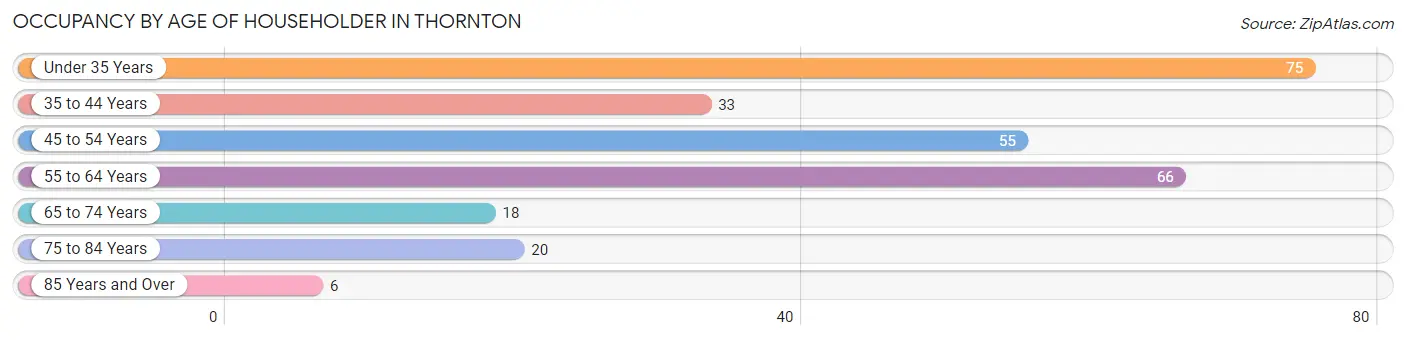
| Age Bracket | # Households | % Households |
| Under 35 Years | 75 | 27.5% |
| 35 to 44 Years | 33 | 12.1% |
| 45 to 54 Years | 55 | 20.2% |
| 55 to 64 Years | 66 | 24.2% |
| 65 to 74 Years | 18 | 6.6% |
| 75 to 84 Years | 20 | 7.3% |
| 85 Years and Over | 6 | 2.2% |
| Total | 273 | 100.0% |
Housing Finances in Thornton
Median Income by Occupancy in Thornton
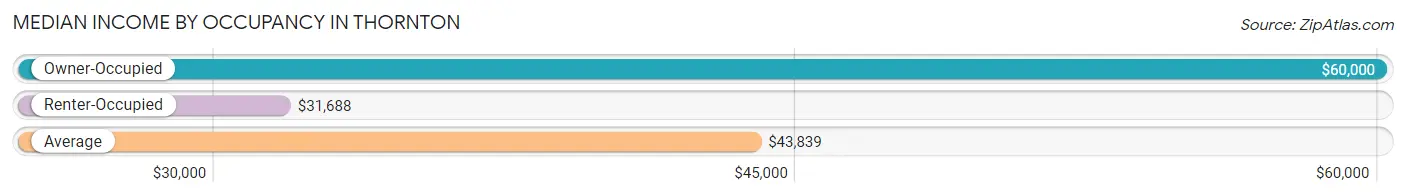
| Occupancy Type | # Households | Median Income |
| Owner-Occupied | 140 (51.3%) | $60,000 |
| Renter-Occupied | 133 (48.7%) | $31,688 |
| Average | 273 (100.0%) | $43,839 |
Occupancy by Householder Income Bracket in Thornton
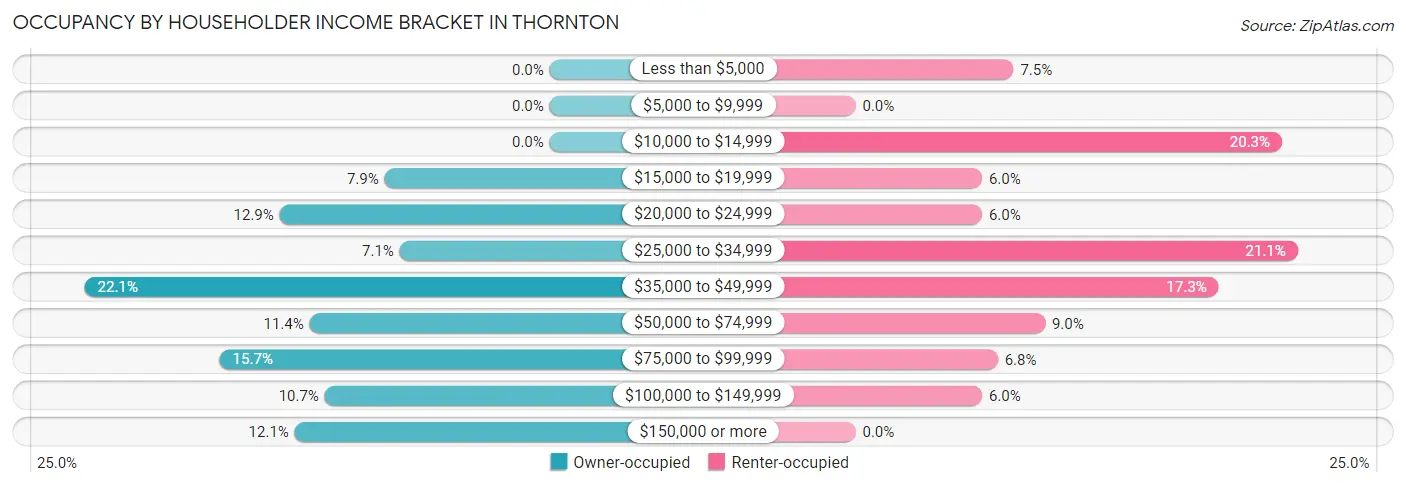
| Income Bracket | Owner-occupied | Renter-occupied |
| Less than $5,000 | 0 (0.0%) | 10 (7.5%) |
| $5,000 to $9,999 | 0 (0.0%) | 0 (0.0%) |
| $10,000 to $14,999 | 0 (0.0%) | 27 (20.3%) |
| $15,000 to $19,999 | 11 (7.9%) | 8 (6.0%) |
| $20,000 to $24,999 | 18 (12.9%) | 8 (6.0%) |
| $25,000 to $34,999 | 10 (7.1%) | 28 (21.0%) |
| $35,000 to $49,999 | 31 (22.1%) | 23 (17.3%) |
| $50,000 to $74,999 | 16 (11.4%) | 12 (9.0%) |
| $75,000 to $99,999 | 22 (15.7%) | 9 (6.8%) |
| $100,000 to $149,999 | 15 (10.7%) | 8 (6.0%) |
| $150,000 or more | 17 (12.1%) | 0 (0.0%) |
| Total | 140 (100.0%) | 133 (100.0%) |
Monthly Housing Cost Tiers in Thornton
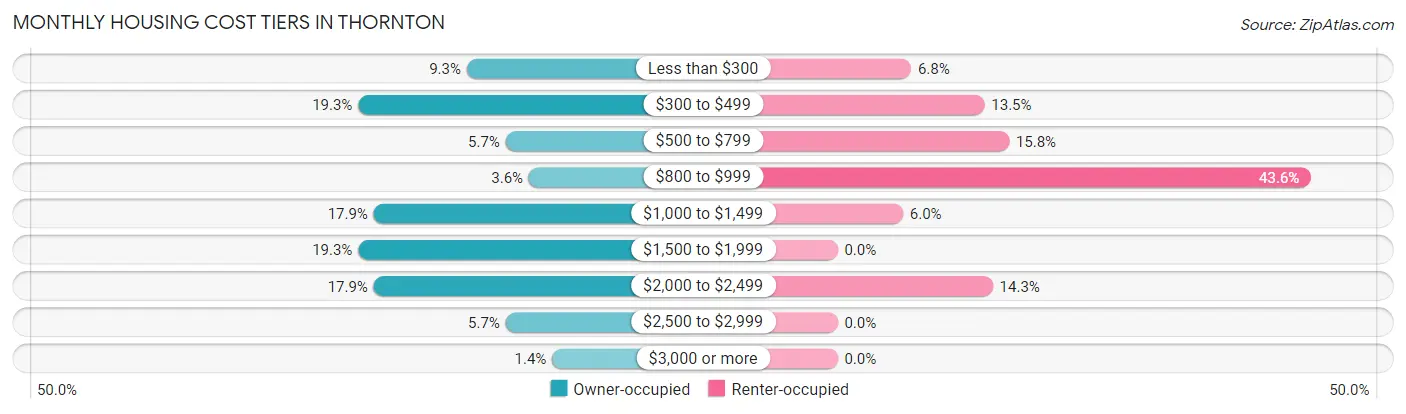
| Monthly Cost | Owner-occupied | Renter-occupied |
| Less than $300 | 13 (9.3%) | 9 (6.8%) |
| $300 to $499 | 27 (19.3%) | 18 (13.5%) |
| $500 to $799 | 8 (5.7%) | 21 (15.8%) |
| $800 to $999 | 5 (3.6%) | 58 (43.6%) |
| $1,000 to $1,499 | 25 (17.9%) | 8 (6.0%) |
| $1,500 to $1,999 | 27 (19.3%) | 0 (0.0%) |
| $2,000 to $2,499 | 25 (17.9%) | 19 (14.3%) |
| $2,500 to $2,999 | 8 (5.7%) | 0 (0.0%) |
| $3,000 or more | 2 (1.4%) | 0 (0.0%) |
| Total | 140 (100.0%) | 133 (100.0%) |
Physical Housing Characteristics in Thornton
Housing Structures in Thornton
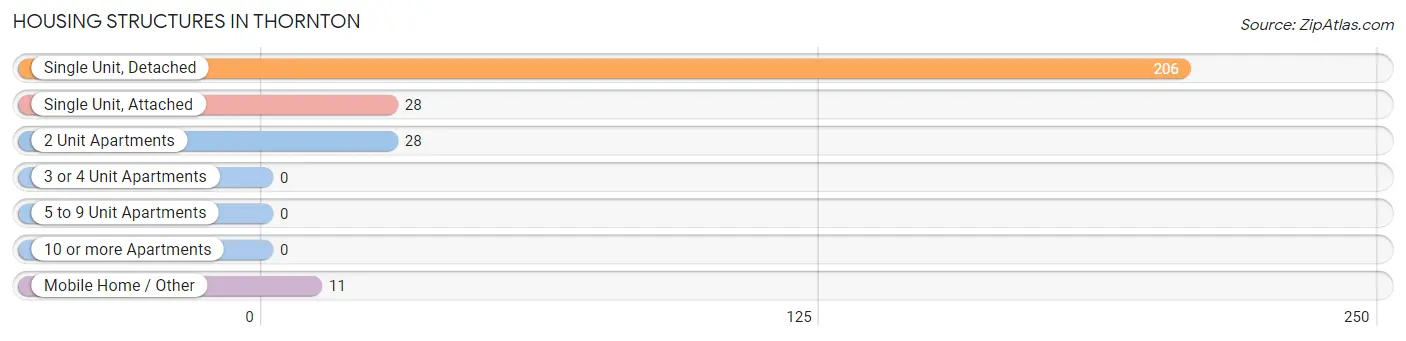
| Structure Type | # Housing Units | % Housing Units |
| Single Unit, Detached | 206 | 75.5% |
| Single Unit, Attached | 28 | 10.3% |
| 2 Unit Apartments | 28 | 10.3% |
| 3 or 4 Unit Apartments | 0 | 0.0% |
| 5 to 9 Unit Apartments | 0 | 0.0% |
| 10 or more Apartments | 0 | 0.0% |
| Mobile Home / Other | 11 | 4.0% |
| Total | 273 | 100.0% |
Housing Structures by Occupancy in Thornton
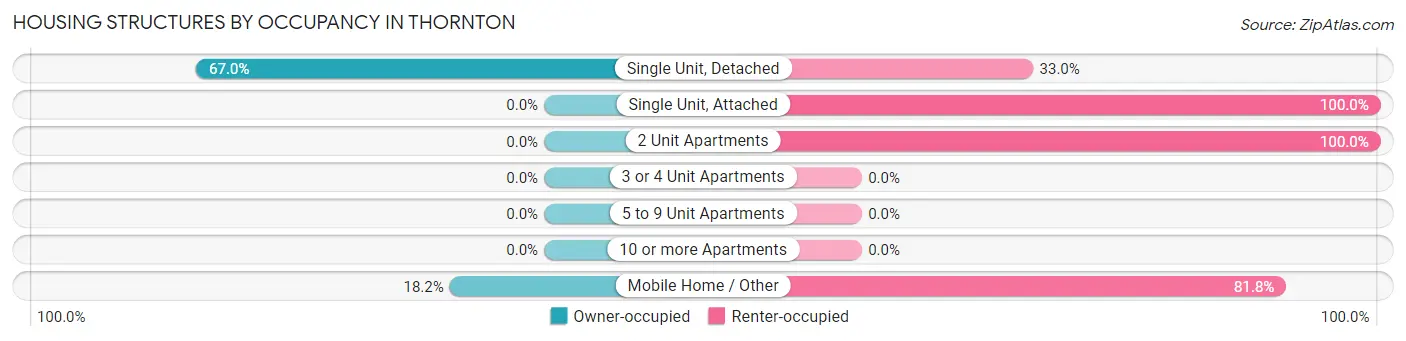
| Structure Type | Owner-occupied | Renter-occupied |
| Single Unit, Detached | 138 (67.0%) | 68 (33.0%) |
| Single Unit, Attached | 0 (0.0%) | 28 (100.0%) |
| 2 Unit Apartments | 0 (0.0%) | 28 (100.0%) |
| 3 or 4 Unit Apartments | 0 (0.0%) | 0 (0.0%) |
| 5 to 9 Unit Apartments | 0 (0.0%) | 0 (0.0%) |
| 10 or more Apartments | 0 (0.0%) | 0 (0.0%) |
| Mobile Home / Other | 2 (18.2%) | 9 (81.8%) |
| Total | 140 (51.3%) | 133 (48.7%) |
Housing Structures by Number of Rooms in Thornton
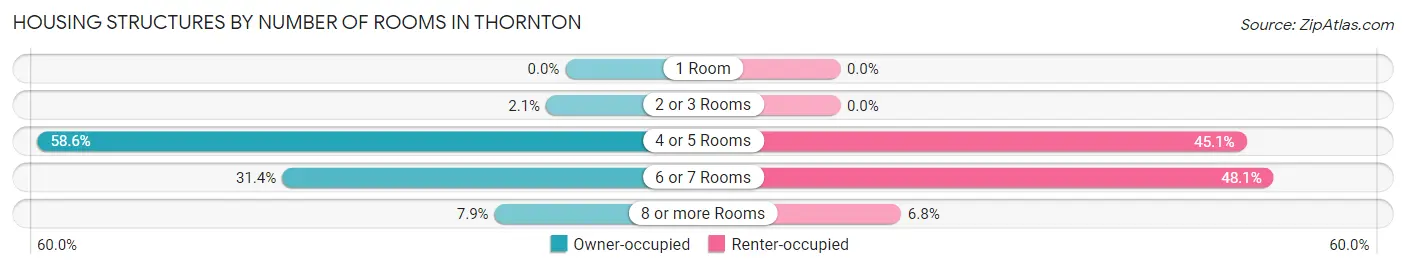
| Number of Rooms | Owner-occupied | Renter-occupied |
| 1 Room | 0 (0.0%) | 0 (0.0%) |
| 2 or 3 Rooms | 3 (2.1%) | 0 (0.0%) |
| 4 or 5 Rooms | 82 (58.6%) | 60 (45.1%) |
| 6 or 7 Rooms | 44 (31.4%) | 64 (48.1%) |
| 8 or more Rooms | 11 (7.9%) | 9 (6.8%) |
| Total | 140 (100.0%) | 133 (100.0%) |
Housing Structure by Heating Type in Thornton
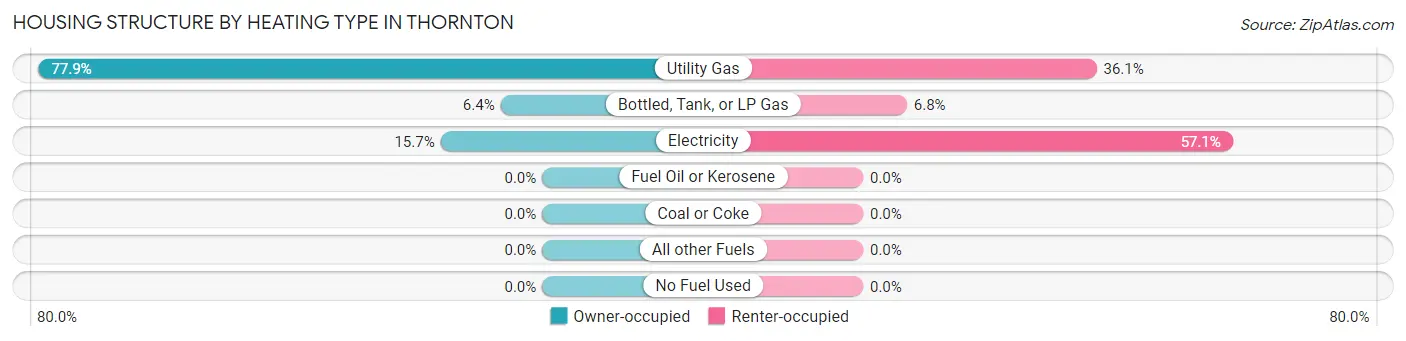
| Heating Type | Owner-occupied | Renter-occupied |
| Utility Gas | 109 (77.9%) | 48 (36.1%) |
| Bottled, Tank, or LP Gas | 9 (6.4%) | 9 (6.8%) |
| Electricity | 22 (15.7%) | 76 (57.1%) |
| Fuel Oil or Kerosene | 0 (0.0%) | 0 (0.0%) |
| Coal or Coke | 0 (0.0%) | 0 (0.0%) |
| All other Fuels | 0 (0.0%) | 0 (0.0%) |
| No Fuel Used | 0 (0.0%) | 0 (0.0%) |
| Total | 140 (100.0%) | 133 (100.0%) |
Household Vehicle Usage in Thornton
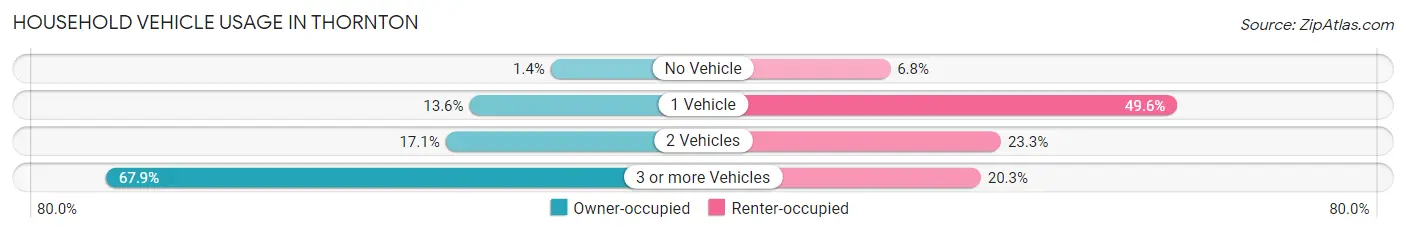
| Vehicles per Household | Owner-occupied | Renter-occupied |
| No Vehicle | 2 (1.4%) | 9 (6.8%) |
| 1 Vehicle | 19 (13.6%) | 66 (49.6%) |
| 2 Vehicles | 24 (17.1%) | 31 (23.3%) |
| 3 or more Vehicles | 95 (67.9%) | 27 (20.3%) |
| Total | 140 (100.0%) | 133 (100.0%) |
Real Estate & Mortgages in Thornton
Real Estate and Mortgage Overview in Thornton
| Characteristic | Without Mortgage | With Mortgage |
| Housing Units | 48 | 92 |
| Median Property Value | $350,000 | $424,200 |
| Median Household Income | $71,429 | $17 |
| Monthly Housing Costs | $329 | $2 |
| Real Estate Taxes | $1,488 | $0 |
Property Value by Mortgage Status in Thornton
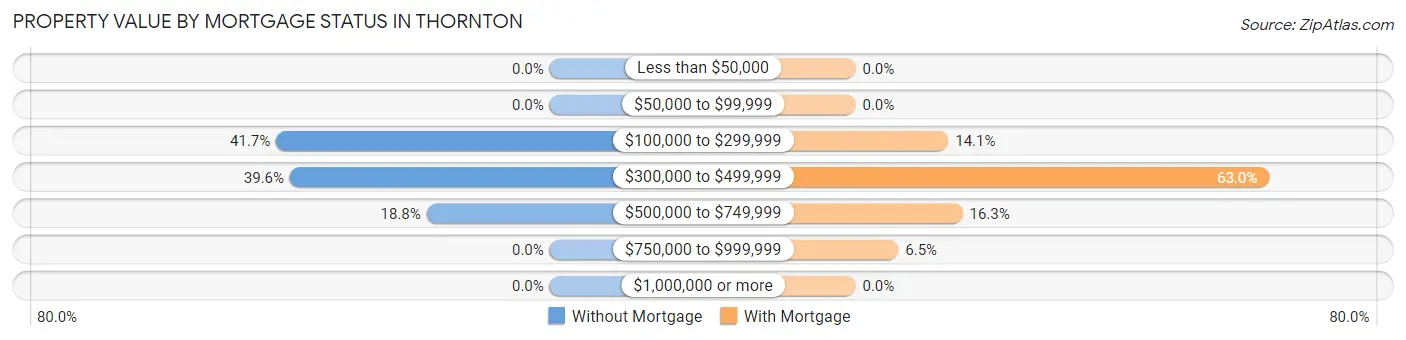
| Property Value | Without Mortgage | With Mortgage |
| Less than $50,000 | 0 (0.0%) | 0 (0.0%) |
| $50,000 to $99,999 | 0 (0.0%) | 0 (0.0%) |
| $100,000 to $299,999 | 20 (41.7%) | 13 (14.1%) |
| $300,000 to $499,999 | 19 (39.6%) | 58 (63.0%) |
| $500,000 to $749,999 | 9 (18.8%) | 15 (16.3%) |
| $750,000 to $999,999 | 0 (0.0%) | 6 (6.5%) |
| $1,000,000 or more | 0 (0.0%) | 0 (0.0%) |
| Total | 48 (100.0%) | 92 (100.0%) |
Household Income by Mortgage Status in Thornton
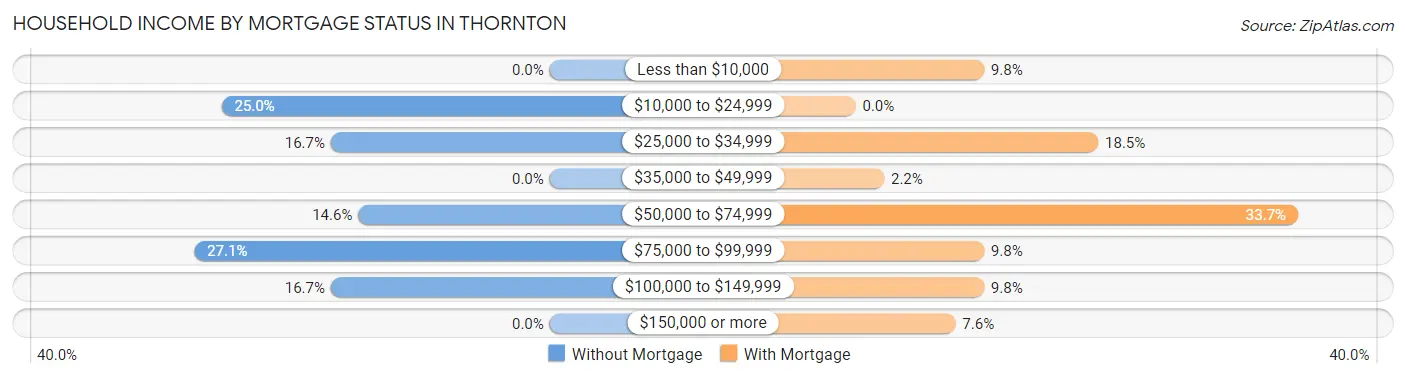
| Household Income | Without Mortgage | With Mortgage |
| Less than $10,000 | 0 (0.0%) | 9 (9.8%) |
| $10,000 to $24,999 | 12 (25.0%) | 0 (0.0%) |
| $25,000 to $34,999 | 8 (16.7%) | 17 (18.5%) |
| $35,000 to $49,999 | 0 (0.0%) | 2 (2.2%) |
| $50,000 to $74,999 | 7 (14.6%) | 31 (33.7%) |
| $75,000 to $99,999 | 13 (27.1%) | 9 (9.8%) |
| $100,000 to $149,999 | 8 (16.7%) | 9 (9.8%) |
| $150,000 or more | 0 (0.0%) | 7 (7.6%) |
| Total | 48 (100.0%) | 92 (100.0%) |
Property Value to Household Income Ratio in Thornton
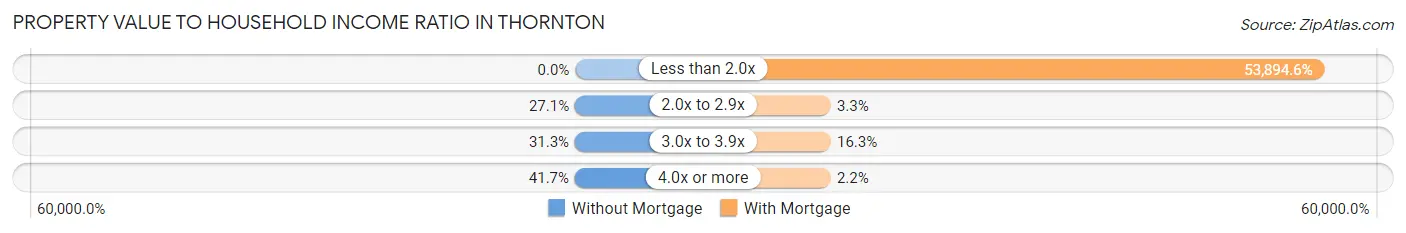
| Value-to-Income Ratio | Without Mortgage | With Mortgage |
| Less than 2.0x | 0 (0.0%) | 49,583 (53,894.6%) |
| 2.0x to 2.9x | 13 (27.1%) | 3 (3.3%) |
| 3.0x to 3.9x | 15 (31.2%) | 15 (16.3%) |
| 4.0x or more | 20 (41.7%) | 2 (2.2%) |
| Total | 48 (100.0%) | 92 (100.0%) |
Real Estate Taxes by Mortgage Status in Thornton
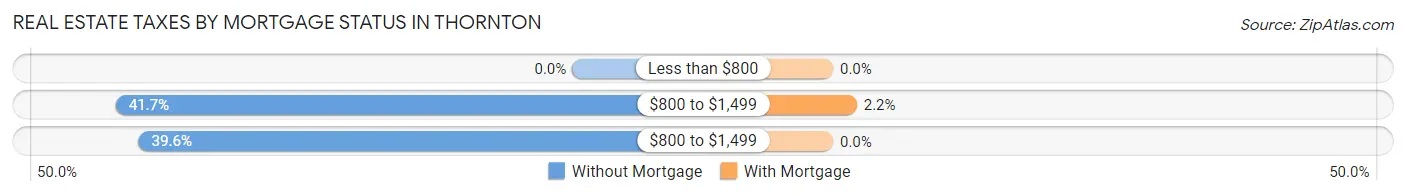
| Property Taxes | Without Mortgage | With Mortgage |
| Less than $800 | 0 (0.0%) | 0 (0.0%) |
| $800 to $1,499 | 20 (41.7%) | 2 (2.2%) |
| $800 to $1,499 | 19 (39.6%) | 0 (0.0%) |
| Total | 48 (100.0%) | 92 (100.0%) |
Health & Disability in Thornton
Health Insurance Coverage by Age in Thornton
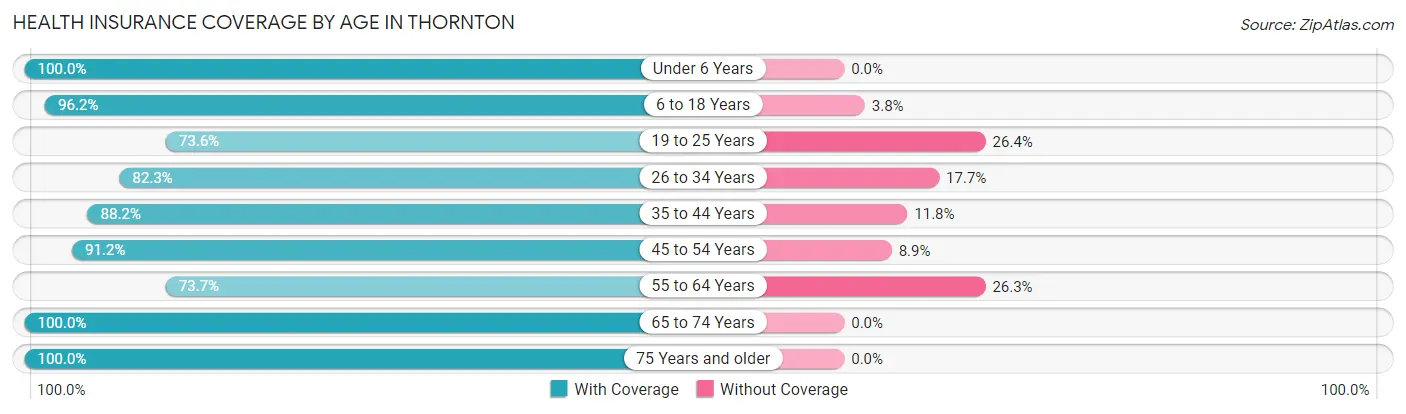
| Age Bracket | With Coverage | Without Coverage |
| Under 6 Years | 70 (100.0%) | 0 (0.0%) |
| 6 to 18 Years | 201 (96.2%) | 8 (3.8%) |
| 19 to 25 Years | 81 (73.6%) | 29 (26.4%) |
| 26 to 34 Years | 107 (82.3%) | 23 (17.7%) |
| 35 to 44 Years | 60 (88.2%) | 8 (11.8%) |
| 45 to 54 Years | 103 (91.1%) | 10 (8.8%) |
| 55 to 64 Years | 70 (73.7%) | 25 (26.3%) |
| 65 to 74 Years | 41 (100.0%) | 0 (0.0%) |
| 75 Years and older | 37 (100.0%) | 0 (0.0%) |
| Total | 770 (88.2%) | 103 (11.8%) |
Health Insurance Coverage by Citizenship Status in Thornton
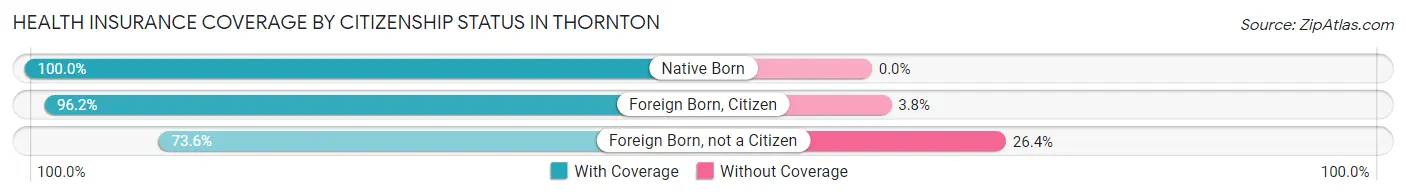
| Citizenship Status | With Coverage | Without Coverage |
| Native Born | 70 (100.0%) | 0 (0.0%) |
| Foreign Born, Citizen | 201 (96.2%) | 8 (3.8%) |
| Foreign Born, not a Citizen | 81 (73.6%) | 29 (26.4%) |
Health Insurance Coverage by Household Income in Thornton
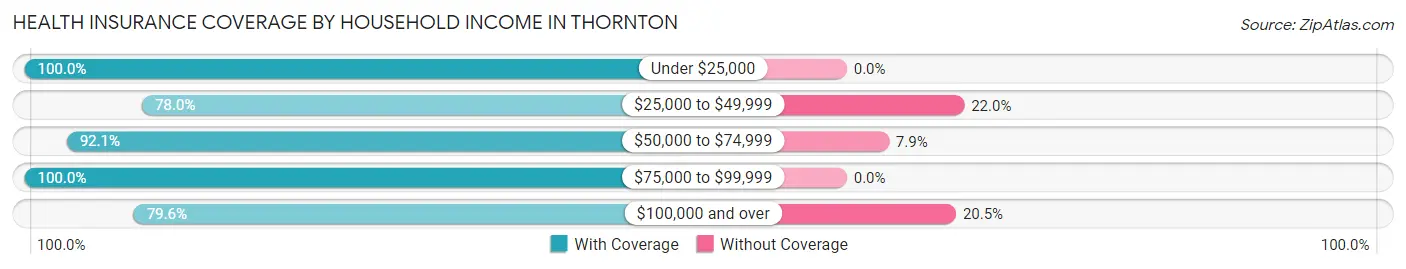
| Household Income | With Coverage | Without Coverage |
| Under $25,000 | 206 (100.0%) | 0 (0.0%) |
| $25,000 to $49,999 | 195 (78.0%) | 55 (22.0%) |
| $50,000 to $74,999 | 140 (92.1%) | 12 (7.9%) |
| $75,000 to $99,999 | 89 (100.0%) | 0 (0.0%) |
| $100,000 and over | 140 (79.5%) | 36 (20.4%) |
Public vs Private Health Insurance Coverage by Age in Thornton
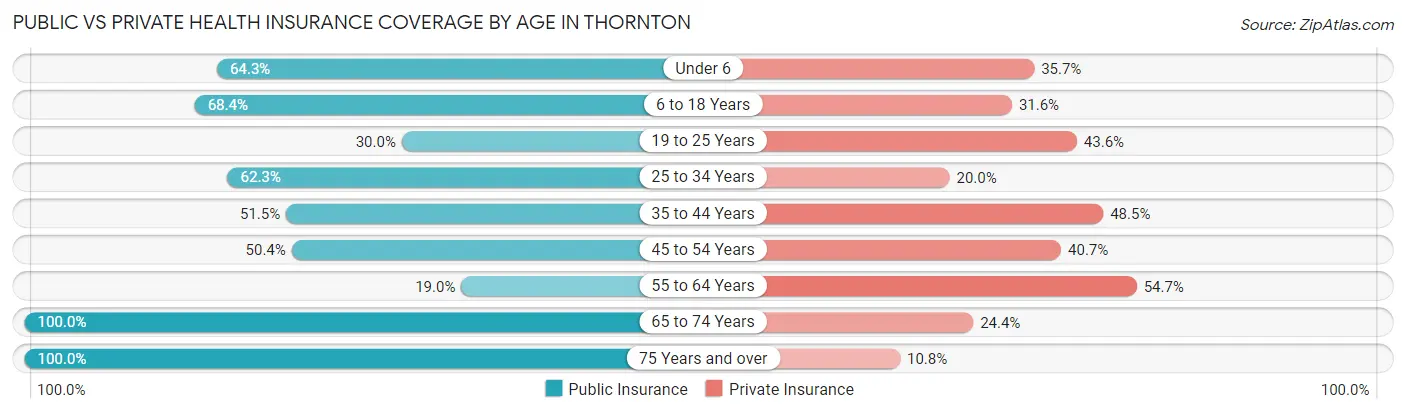
| Age Bracket | Public Insurance | Private Insurance |
| Under 6 | 45 (64.3%) | 25 (35.7%) |
| 6 to 18 Years | 143 (68.4%) | 66 (31.6%) |
| 19 to 25 Years | 33 (30.0%) | 48 (43.6%) |
| 25 to 34 Years | 81 (62.3%) | 26 (20.0%) |
| 35 to 44 Years | 35 (51.5%) | 33 (48.5%) |
| 45 to 54 Years | 57 (50.4%) | 46 (40.7%) |
| 55 to 64 Years | 18 (19.0%) | 52 (54.7%) |
| 65 to 74 Years | 41 (100.0%) | 10 (24.4%) |
| 75 Years and over | 37 (100.0%) | 4 (10.8%) |
| Total | 490 (56.1%) | 310 (35.5%) |
Disability Status by Sex by Age in Thornton
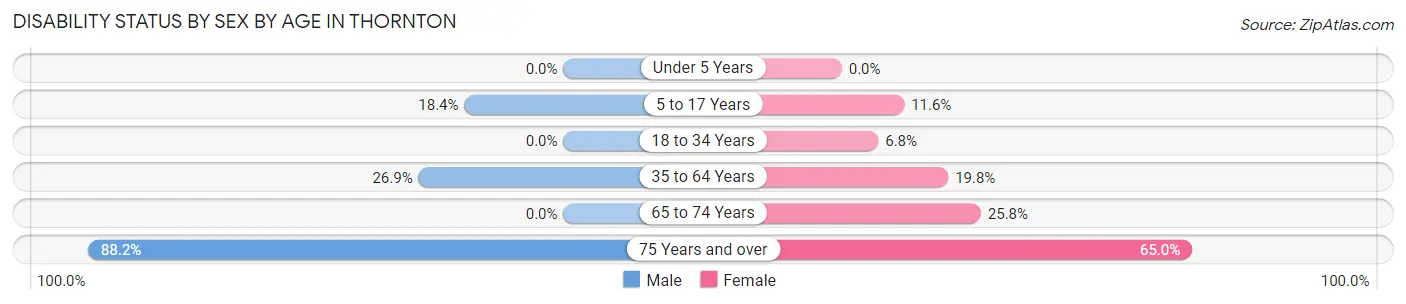
| Age Bracket | Male | Female |
| Under 5 Years | 0 (0.0%) | 0 (0.0%) |
| 5 to 17 Years | 25 (18.4%) | 11 (11.6%) |
| 18 to 34 Years | 0 (0.0%) | 9 (6.8%) |
| 35 to 64 Years | 32 (26.9%) | 31 (19.8%) |
| 65 to 74 Years | 0 (0.0%) | 8 (25.8%) |
| 75 Years and over | 15 (88.2%) | 13 (65.0%) |
Disability Class by Sex by Age in Thornton
Disability Class: Hearing Difficulty
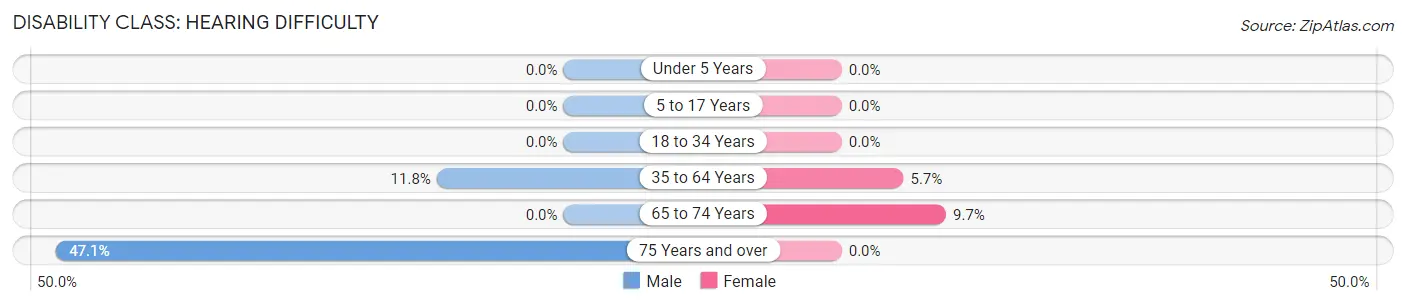
| Age Bracket | Male | Female |
| Under 5 Years | 0 (0.0%) | 0 (0.0%) |
| 5 to 17 Years | 0 (0.0%) | 0 (0.0%) |
| 18 to 34 Years | 0 (0.0%) | 0 (0.0%) |
| 35 to 64 Years | 14 (11.8%) | 9 (5.7%) |
| 65 to 74 Years | 0 (0.0%) | 3 (9.7%) |
| 75 Years and over | 8 (47.1%) | 0 (0.0%) |
Disability Class: Vision Difficulty
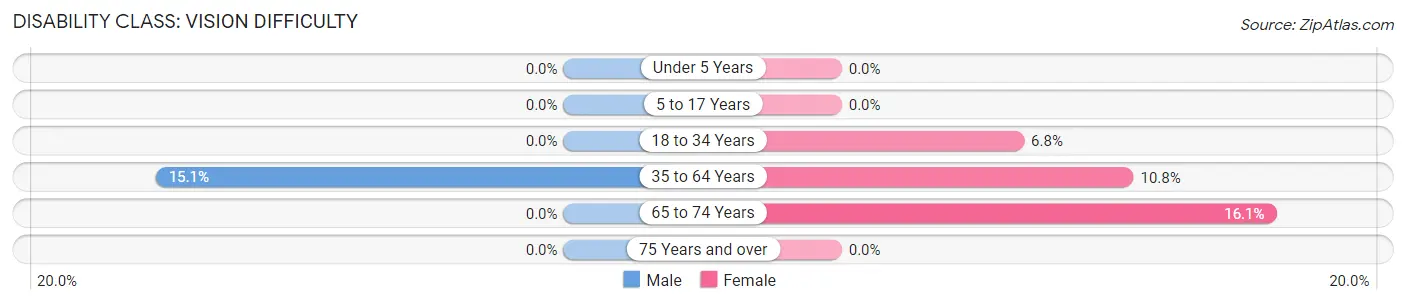
| Age Bracket | Male | Female |
| Under 5 Years | 0 (0.0%) | 0 (0.0%) |
| 5 to 17 Years | 0 (0.0%) | 0 (0.0%) |
| 18 to 34 Years | 0 (0.0%) | 9 (6.8%) |
| 35 to 64 Years | 18 (15.1%) | 17 (10.8%) |
| 65 to 74 Years | 0 (0.0%) | 5 (16.1%) |
| 75 Years and over | 0 (0.0%) | 0 (0.0%) |
Disability Class: Cognitive Difficulty
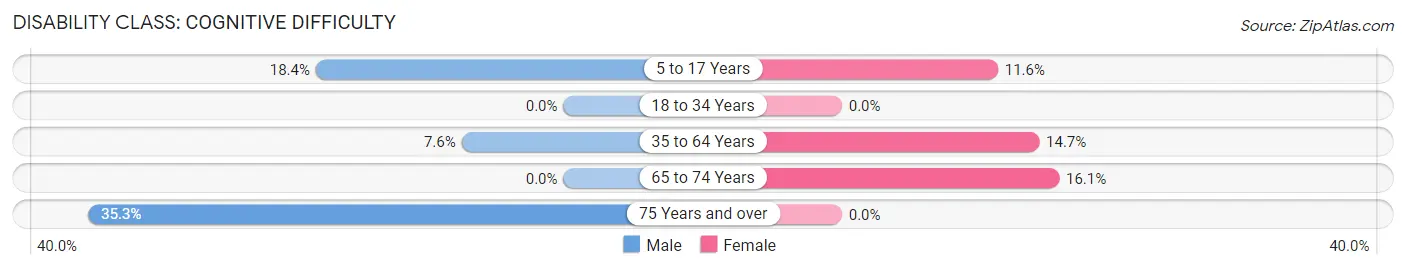
| Age Bracket | Male | Female |
| 5 to 17 Years | 25 (18.4%) | 11 (11.6%) |
| 18 to 34 Years | 0 (0.0%) | 0 (0.0%) |
| 35 to 64 Years | 9 (7.6%) | 23 (14.6%) |
| 65 to 74 Years | 0 (0.0%) | 5 (16.1%) |
| 75 Years and over | 6 (35.3%) | 0 (0.0%) |
Disability Class: Ambulatory Difficulty
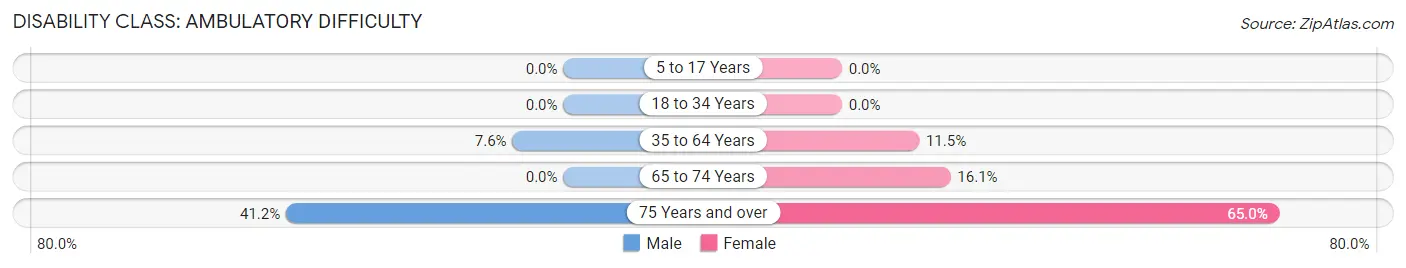
| Age Bracket | Male | Female |
| 5 to 17 Years | 0 (0.0%) | 0 (0.0%) |
| 18 to 34 Years | 0 (0.0%) | 0 (0.0%) |
| 35 to 64 Years | 9 (7.6%) | 18 (11.5%) |
| 65 to 74 Years | 0 (0.0%) | 5 (16.1%) |
| 75 Years and over | 7 (41.2%) | 13 (65.0%) |
Disability Class: Self-Care Difficulty
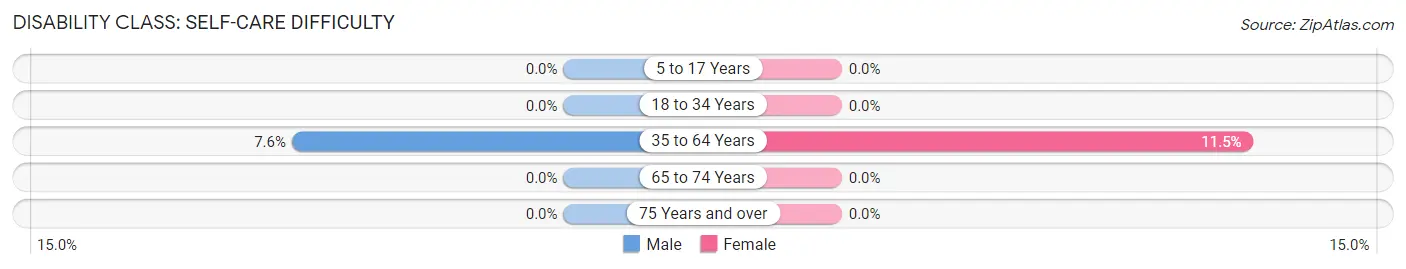
| Age Bracket | Male | Female |
| 5 to 17 Years | 0 (0.0%) | 0 (0.0%) |
| 18 to 34 Years | 0 (0.0%) | 0 (0.0%) |
| 35 to 64 Years | 9 (7.6%) | 18 (11.5%) |
| 65 to 74 Years | 0 (0.0%) | 0 (0.0%) |
| 75 Years and over | 0 (0.0%) | 0 (0.0%) |
Technology Access in Thornton
Computing Device Access in Thornton
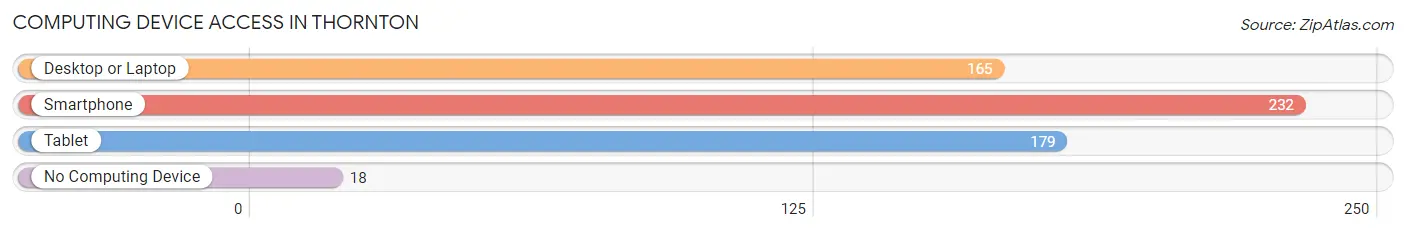
| Device Type | # Households | % Households |
| Desktop or Laptop | 165 | 60.4% |
| Smartphone | 232 | 85.0% |
| Tablet | 179 | 65.6% |
| No Computing Device | 18 | 6.6% |
| Total | 273 | 100.0% |
Internet Access in Thornton
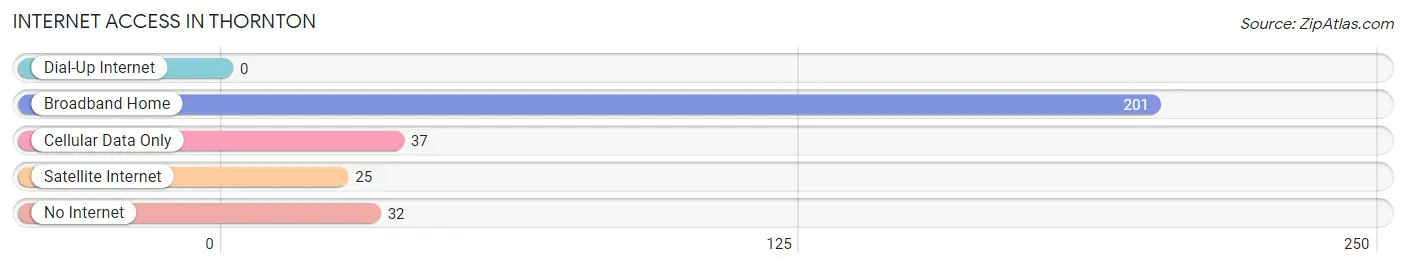
| Internet Type | # Households | % Households |
| Dial-Up Internet | 0 | 0.0% |
| Broadband Home | 201 | 73.6% |
| Cellular Data Only | 37 | 13.6% |
| Satellite Internet | 25 | 9.2% |
| No Internet | 32 | 11.7% |
| Total | 273 | 100.0% |
Thornton Summary
Thornton is a small city located in the San Francisco Bay Area of California. It is situated in the northern part of Santa Clara County, approximately 25 miles south of San Francisco and 40 miles north of San Jose. The city is bordered by the cities of Mountain View, Sunnyvale, and Palo Alto. Thornton has a population of approximately 8,000 people and covers an area of 2.2 square miles.
History
Thornton was founded in 1852 by William Thornton, a former gold miner who had come to California during the Gold Rush. He purchased a large tract of land in the area and began to develop it for farming. The area was originally known as Thorntonville, but the name was changed to Thornton in 1887.
The city was incorporated in 1956 and has since grown to become a vibrant community. Thornton is home to a variety of businesses, including technology companies, retail stores, and restaurants.
Geography
Thornton is located in the northern part of Santa Clara County, approximately 25 miles south of San Francisco and 40 miles north of San Jose. The city is bordered by the cities of Mountain View, Sunnyvale, and Palo Alto.
The city is situated in a valley surrounded by hills and mountains. The highest point in the city is the summit of Mount Umunhum, which rises to an elevation of 3,486 feet. The city is also home to several creeks and streams, including Stevens Creek, which flows through the city.
Economy
Thornton is home to a variety of businesses, including technology companies, retail stores, and restaurants. The city is also home to several large employers, including Google, Apple, and LinkedIn.
The city is also home to several educational institutions, including Foothill College and De Anza College. The city is also home to several parks and recreational areas, including the Thornton State Beach and the Thornton Open Space Preserve.
Demographics
As of the 2010 census, Thornton had a population of 8,000 people. The racial makeup of the city was 57.2% White, 24.3% Asian, 11.2% Hispanic or Latino, and 6.3% African American.
The median household income in Thornton was $90,000, and the median family income was $103,000. The per capita income in the city was $37,000.
Thornton is a diverse city with a variety of cultures and backgrounds. The city is home to a variety of religious institutions, including churches, temples, and mosques. The city is also home to a variety of recreational activities, including hiking, biking, and fishing.
Common Questions
What is Per Capita Income in Thornton?
Per Capita income in Thornton is $18,655.
What is the Median Family Income in Thornton?
Median Family Income in Thornton is $44,196.
What is the Median Household income in Thornton?
Median Household Income in Thornton is $43,839.
What is Income or Wage Gap in Thornton?
Income or Wage Gap in Thornton is 63.4%.
Women in Thornton earn 36.6 cents for every dollar earned by a man.
What is Family Income Deficit in Thornton?
Family Income Deficit in Thornton is $8,221.
Families that are below poverty line in Thornton earn $8,221 less on average than the poverty threshold level.
What is Inequality or Gini Index in Thornton?
Inequality or Gini Index in Thornton is 0.43.
What is the Total Population of Thornton?
Total Population of Thornton is 873.
What is the Total Male Population of Thornton?
Total Male Population of Thornton is 419.
What is the Total Female Population of Thornton?
Total Female Population of Thornton is 454.
What is the Ratio of Males per 100 Females in Thornton?
There are 92.29 Males per 100 Females in Thornton.
What is the Ratio of Females per 100 Males in Thornton?
There are 108.35 Females per 100 Males in Thornton.
What is the Median Population Age in Thornton?
Median Population Age in Thornton is 29.6 Years.
What is the Average Family Size in Thornton
Average Family Size in Thornton is 3.5 People.
What is the Average Household Size in Thornton
Average Household Size in Thornton is 3.2 People.
How Large is the Labor Force in Thornton?
There are 381 People in the Labor Forcein in Thornton.
What is the Percentage of People in the Labor Force in Thornton?
59.3% of People are in the Labor Force in Thornton.
What is the Unemployment Rate in Thornton?
Unemployment Rate in Thornton is 7.9%.