Tehama, CA Map & Demographics
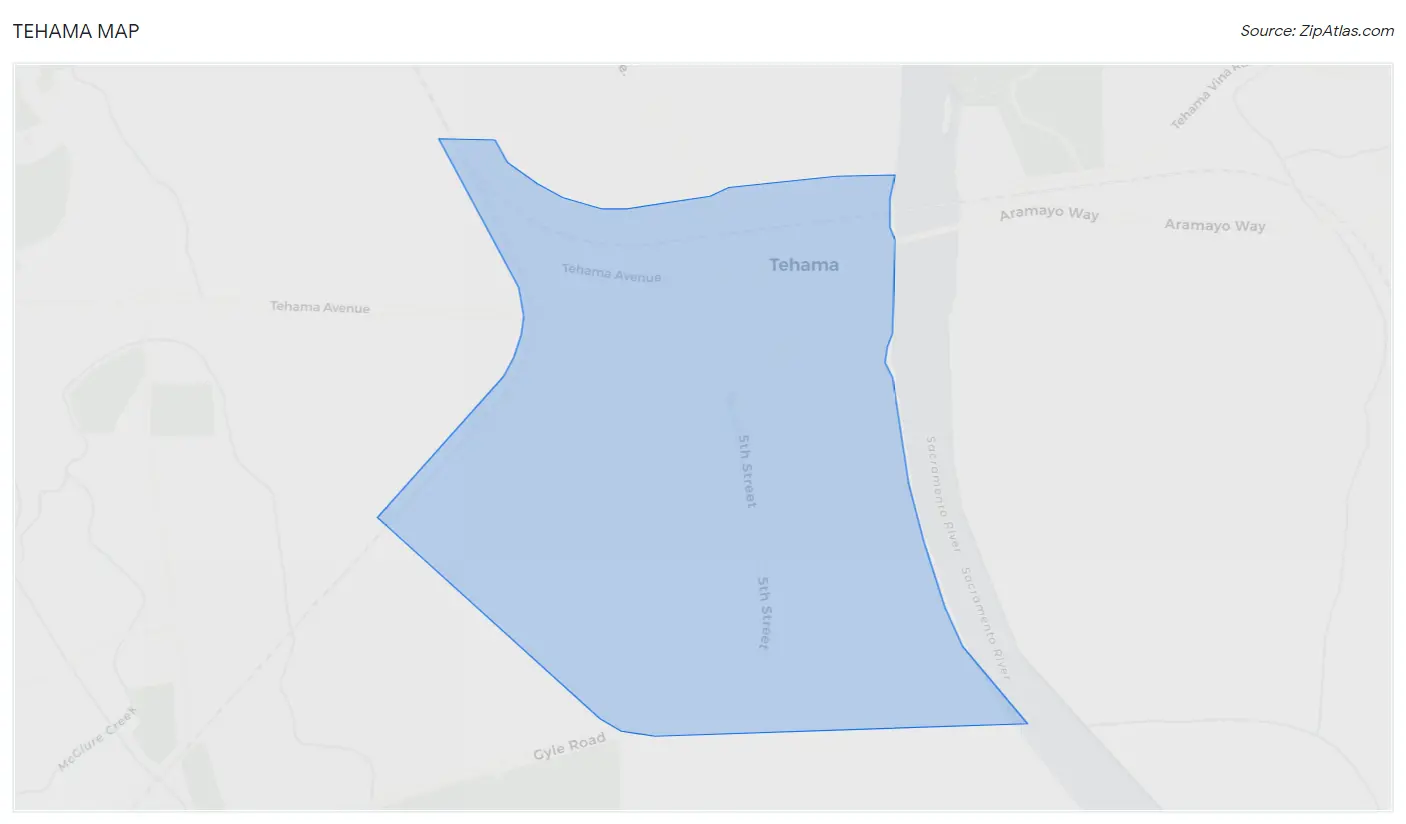
Tehama Map
Tehama Overview
$34,469
PER CAPITA INCOME
$81,250
AVG FAMILY INCOME
$53,750
AVG HOUSEHOLD INCOME
16.2%
WAGE / INCOME GAP [ % ]
83.8¢/ $1
WAGE / INCOME GAP [ $ ]
0.42
INEQUALITY / GINI INDEX
421
TOTAL POPULATION
218
MALE POPULATION
203
FEMALE POPULATION
107.39
MALES / 100 FEMALES
93.12
FEMALES / 100 MALES
49.6
MEDIAN AGE
2.8
AVG FAMILY SIZE
2.1
AVG HOUSEHOLD SIZE
181
LABOR FORCE [ PEOPLE ]
52.5%
PERCENT IN LABOR FORCE
1.1%
UNEMPLOYMENT RATE
Tehama Zip Codes
Tehama Area Codes
Income in Tehama
Income Overview in Tehama
Per Capita Income in Tehama is $34,469, while median incomes of families and households are $81,250 and $53,750 respectively.
| Characteristic | Number | Measure |
| Per Capita Income | 421 | $34,469 |
| Median Family Income | 112 | $81,250 |
| Mean Family Income | 112 | $94,511 |
| Median Household Income | 202 | $53,750 |
| Mean Household Income | 202 | $68,646 |
| Income Deficit | 112 | $0 |
| Wage / Income Gap (%) | 421 | 16.23% |
| Wage / Income Gap ($) | 421 | 83.77¢ per $1 |
| Gini / Inequality Index | 421 | 0.42 |
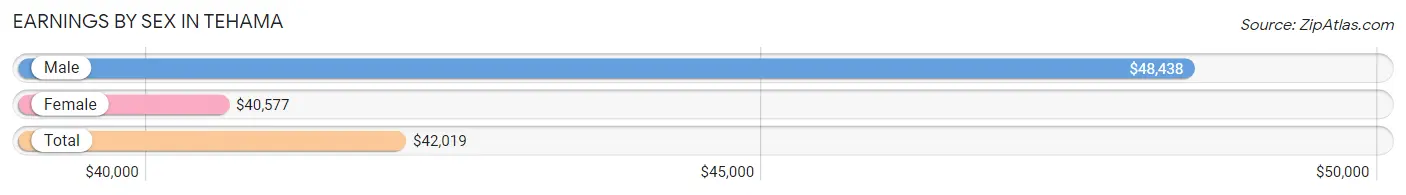
Earnings by Sex in Tehama
Average Earnings in Tehama are $42,019, $48,438 for men and $40,577 for women, a difference of 16.2%.
| Sex | Number | Average Earnings |
| Male | 95 (51.3%) | $48,438 |
| Female | 90 (48.6%) | $40,577 |
| Total | 185 (100.0%) | $42,019 |
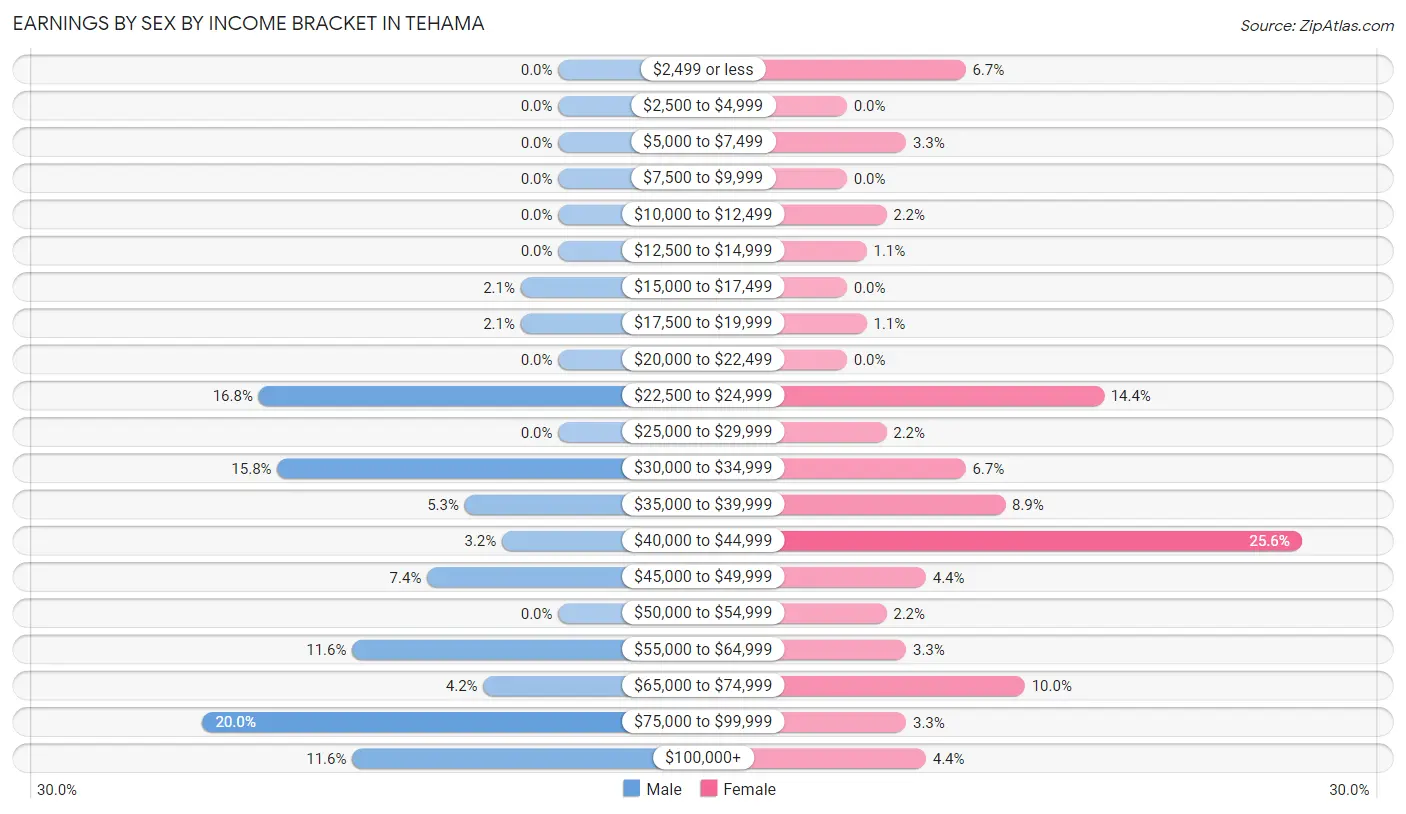
Earnings by Sex by Income Bracket in Tehama
The most common earnings brackets in Tehama are $75,000 to $99,999 for men (19 | 20.0%) and $40,000 to $44,999 for women (23 | 25.6%).
| Income | Male | Female |
| $2,499 or less | 0 (0.0%) | 6 (6.7%) |
| $2,500 to $4,999 | 0 (0.0%) | 0 (0.0%) |
| $5,000 to $7,499 | 0 (0.0%) | 3 (3.3%) |
| $7,500 to $9,999 | 0 (0.0%) | 0 (0.0%) |
| $10,000 to $12,499 | 0 (0.0%) | 2 (2.2%) |
| $12,500 to $14,999 | 0 (0.0%) | 1 (1.1%) |
| $15,000 to $17,499 | 2 (2.1%) | 0 (0.0%) |
| $17,500 to $19,999 | 2 (2.1%) | 1 (1.1%) |
| $20,000 to $22,499 | 0 (0.0%) | 0 (0.0%) |
| $22,500 to $24,999 | 16 (16.8%) | 13 (14.4%) |
| $25,000 to $29,999 | 0 (0.0%) | 2 (2.2%) |
| $30,000 to $34,999 | 15 (15.8%) | 6 (6.7%) |
| $35,000 to $39,999 | 5 (5.3%) | 8 (8.9%) |
| $40,000 to $44,999 | 3 (3.2%) | 23 (25.6%) |
| $45,000 to $49,999 | 7 (7.4%) | 4 (4.4%) |
| $50,000 to $54,999 | 0 (0.0%) | 2 (2.2%) |
| $55,000 to $64,999 | 11 (11.6%) | 3 (3.3%) |
| $65,000 to $74,999 | 4 (4.2%) | 9 (10.0%) |
| $75,000 to $99,999 | 19 (20.0%) | 3 (3.3%) |
| $100,000+ | 11 (11.6%) | 4 (4.4%) |
| Total | 95 (100.0%) | 90 (100.0%) |
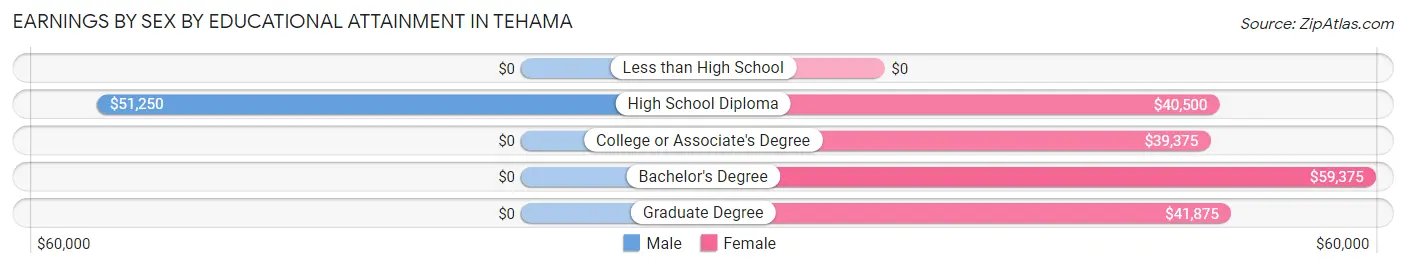
Earnings by Sex by Educational Attainment in Tehama
Average earnings in Tehama are $48,125 for men and $41,827 for women, a difference of 13.1%. Men with an educational attainment of high school diploma enjoy the highest average annual earnings of $51,250, while those with high school diploma education earn the least with $51,250. Women with an educational attainment of bachelor's degree earn the most with the average annual earnings of $59,375, while those with college or associate's degree education have the smallest earnings of $39,375.
| Educational Attainment | Male Income | Female Income |
| Less than High School | - | - |
| High School Diploma | $51,250 | $40,500 |
| College or Associate's Degree | - | - |
| Bachelor's Degree | - | - |
| Graduate Degree | - | - |
| Total | $48,125 | $41,827 |
Family Income in Tehama
Family Income Brackets in Tehama
According to the Tehama family income data, there are 31 families falling into the $75,000 to $99,999 income range, which is the most common income bracket and makes up 27.7% of all families.
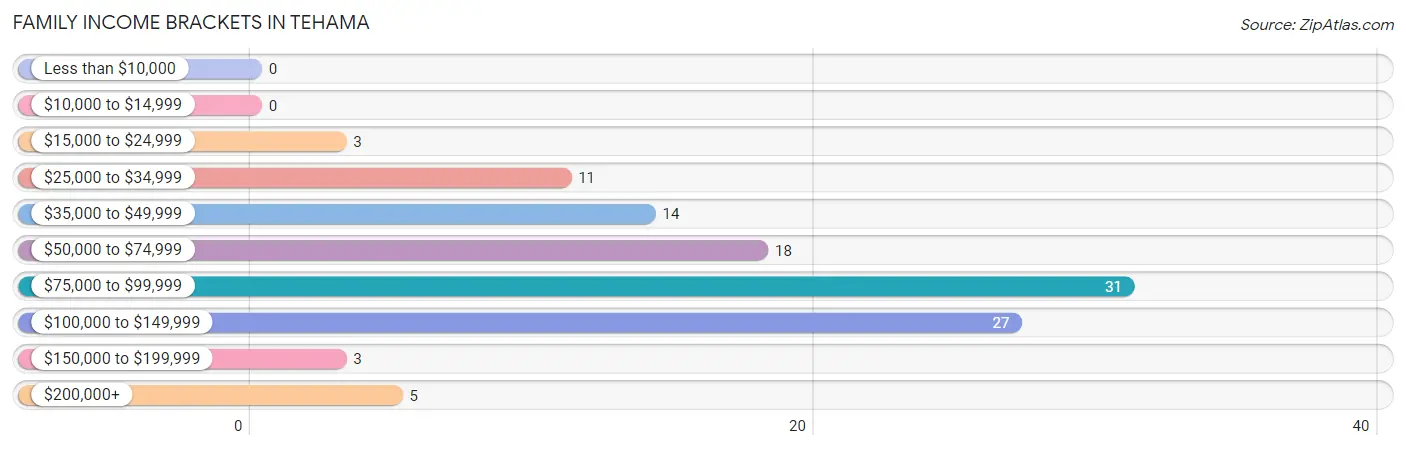
| Income Bracket | # Families | % Families |
| Less than $10,000 | 0 | 0.0% |
| $10,000 to $14,999 | 0 | 0.0% |
| $15,000 to $24,999 | 3 | 2.7% |
| $25,000 to $34,999 | 11 | 9.8% |
| $35,000 to $49,999 | 14 | 12.5% |
| $50,000 to $74,999 | 18 | 16.1% |
| $75,000 to $99,999 | 31 | 27.7% |
| $100,000 to $149,999 | 27 | 24.1% |
| $150,000 to $199,999 | 3 | 2.7% |
| $200,000+ | 5 | 4.5% |
Family Income by Famaliy Size in Tehama
5-person families (16 | 14.3%) account for the highest median family income in Tehama with $103,000 per family, while 2-person families (75 | 67.0%) have the highest median income of $36,875 per family member.
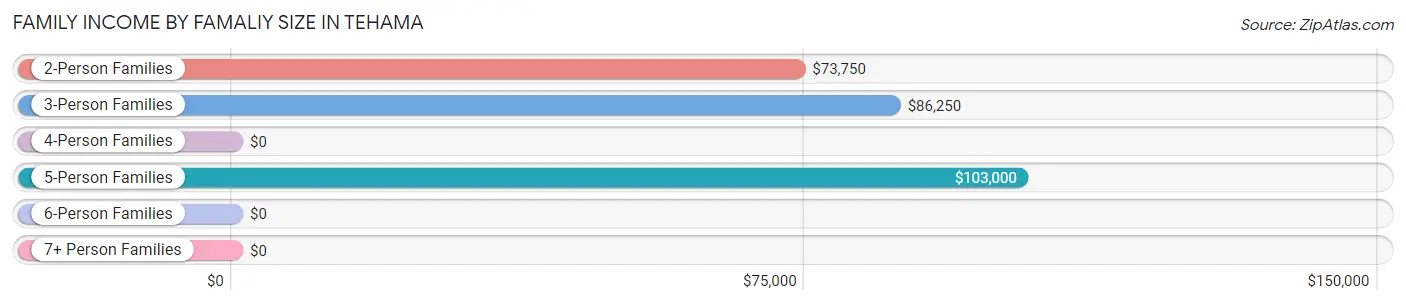
| Income Bracket | # Families | Median Income |
| 2-Person Families | 75 (67.0%) | $73,750 |
| 3-Person Families | 17 (15.2%) | $86,250 |
| 4-Person Families | 4 (3.6%) | $0 |
| 5-Person Families | 16 (14.3%) | $103,000 |
| 6-Person Families | 0 (0.0%) | $0 |
| 7+ Person Families | 0 (0.0%) | $0 |
| Total | 112 (100.0%) | $81,250 |
Family Income by Number of Earners in Tehama
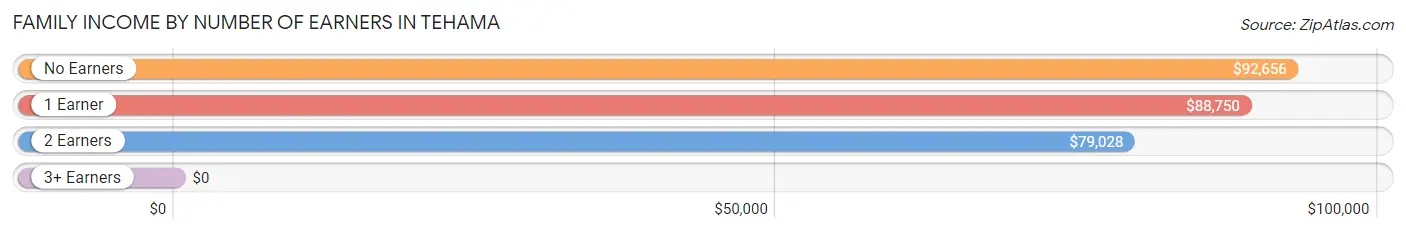
| Number of Earners | # Families | Median Income |
| No Earners | 19 (17.0%) | $92,656 |
| 1 Earner | 49 (43.8%) | $88,750 |
| 2 Earners | 41 (36.6%) | $79,028 |
| 3+ Earners | 3 (2.7%) | $0 |
| Total | 112 (100.0%) | $81,250 |
Household Income in Tehama
Household Income Brackets in Tehama
With 37 households falling in the category, the $75,000 to $99,999 income range is the most frequent in Tehama, accounting for 18.3% of all households. In contrast, only 3 households (1.5%) fall into the $150,000 to $199,999 income bracket, making it the least populous group.
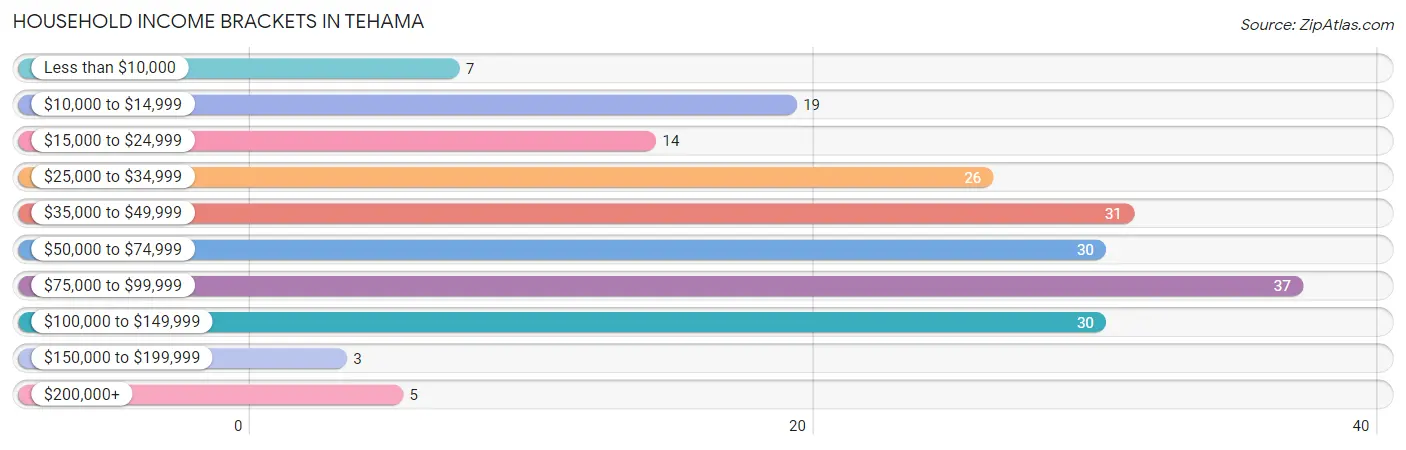
| Income Bracket | # Households | % Households |
| Less than $10,000 | 7 | 3.5% |
| $10,000 to $14,999 | 19 | 9.4% |
| $15,000 to $24,999 | 14 | 6.9% |
| $25,000 to $34,999 | 26 | 12.9% |
| $35,000 to $49,999 | 31 | 15.3% |
| $50,000 to $74,999 | 30 | 14.9% |
| $75,000 to $99,999 | 37 | 18.3% |
| $100,000 to $149,999 | 30 | 14.9% |
| $150,000 to $199,999 | 3 | 1.5% |
| $200,000+ | 5 | 2.5% |
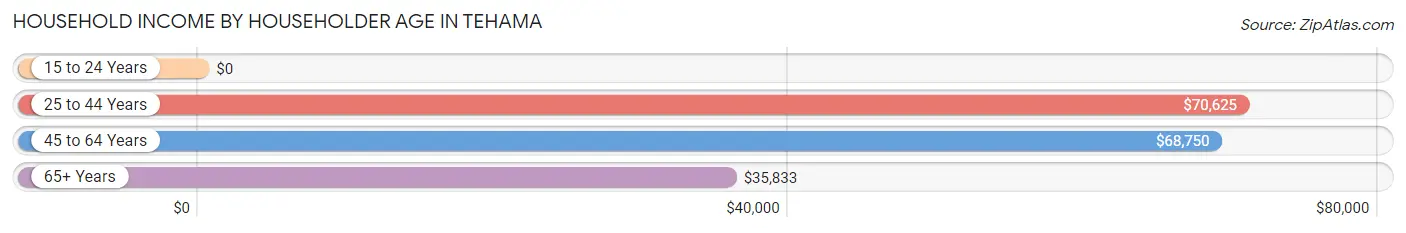
Household Income by Householder Age in Tehama
The median household income in Tehama is $53,750, with the highest median household income of $70,625 found in the 25 to 44 years age bracket for the primary householder. A total of 37 households (18.3%) fall into this category. Meanwhile, the 15 to 24 years age bracket for the primary householder has the lowest median household income of $0, with 7 households (3.5%) in this group.
| Income Bracket | # Households | Median Income |
| 15 to 24 Years | 7 (3.5%) | $0 |
| 25 to 44 Years | 37 (18.3%) | $70,625 |
| 45 to 64 Years | 80 (39.6%) | $68,750 |
| 65+ Years | 78 (38.6%) | $35,833 |
| Total | 202 (100.0%) | $53,750 |
Poverty in Tehama
Income Below Poverty by Sex and Age in Tehama
With 8.7% poverty level for males and 4.9% for females among the residents of Tehama, 65 to 74 year old males and 25 to 34 year old females are the most vulnerable to poverty, with 8 males (30.8%) and 4 females (26.7%) in their respective age groups living below the poverty level.
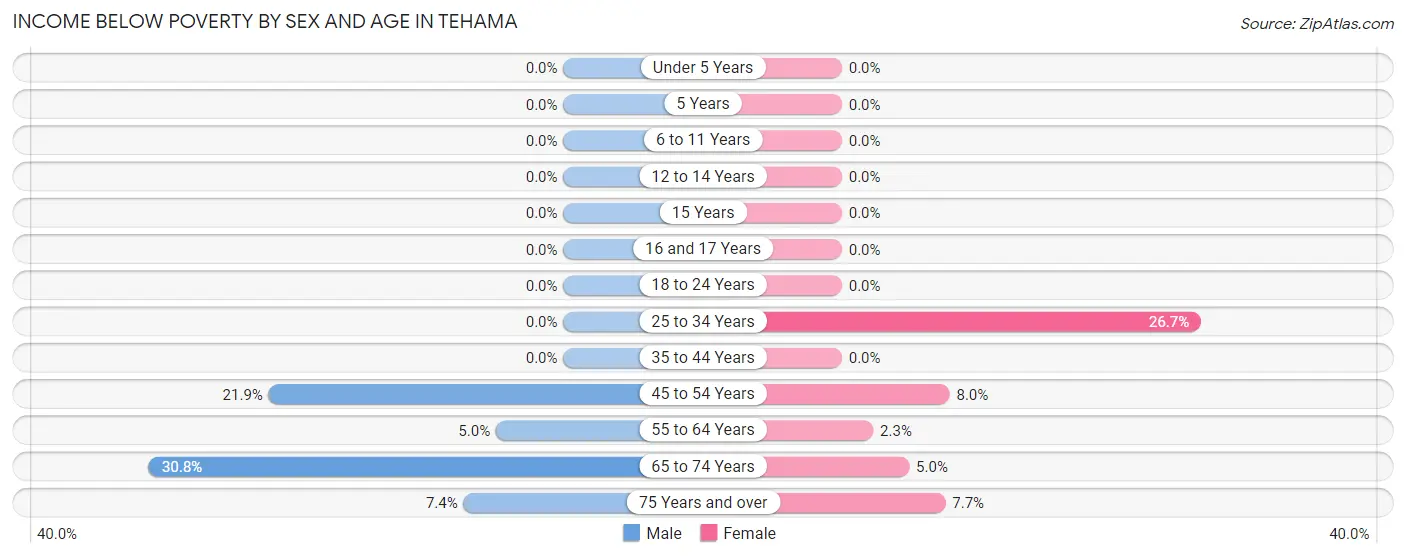
| Age Bracket | Male | Female |
| Under 5 Years | 0 (0.0%) | 0 (0.0%) |
| 5 Years | 0 (0.0%) | 0 (0.0%) |
| 6 to 11 Years | 0 (0.0%) | 0 (0.0%) |
| 12 to 14 Years | 0 (0.0%) | 0 (0.0%) |
| 15 Years | 0 (0.0%) | 0 (0.0%) |
| 16 and 17 Years | 0 (0.0%) | 0 (0.0%) |
| 18 to 24 Years | 0 (0.0%) | 0 (0.0%) |
| 25 to 34 Years | 0 (0.0%) | 4 (26.7%) |
| 35 to 44 Years | 0 (0.0%) | 0 (0.0%) |
| 45 to 54 Years | 7 (21.9%) | 2 (8.0%) |
| 55 to 64 Years | 2 (5.0%) | 1 (2.3%) |
| 65 to 74 Years | 8 (30.8%) | 1 (5.0%) |
| 75 Years and over | 2 (7.4%) | 2 (7.7%) |
| Total | 19 (8.7%) | 10 (4.9%) |
Income Above Poverty by Sex and Age in Tehama
According to the poverty statistics in Tehama, males aged under 5 years and females aged under 5 years are the age groups that are most secure financially, with 100.0% of males and 100.0% of females in these age groups living above the poverty line.
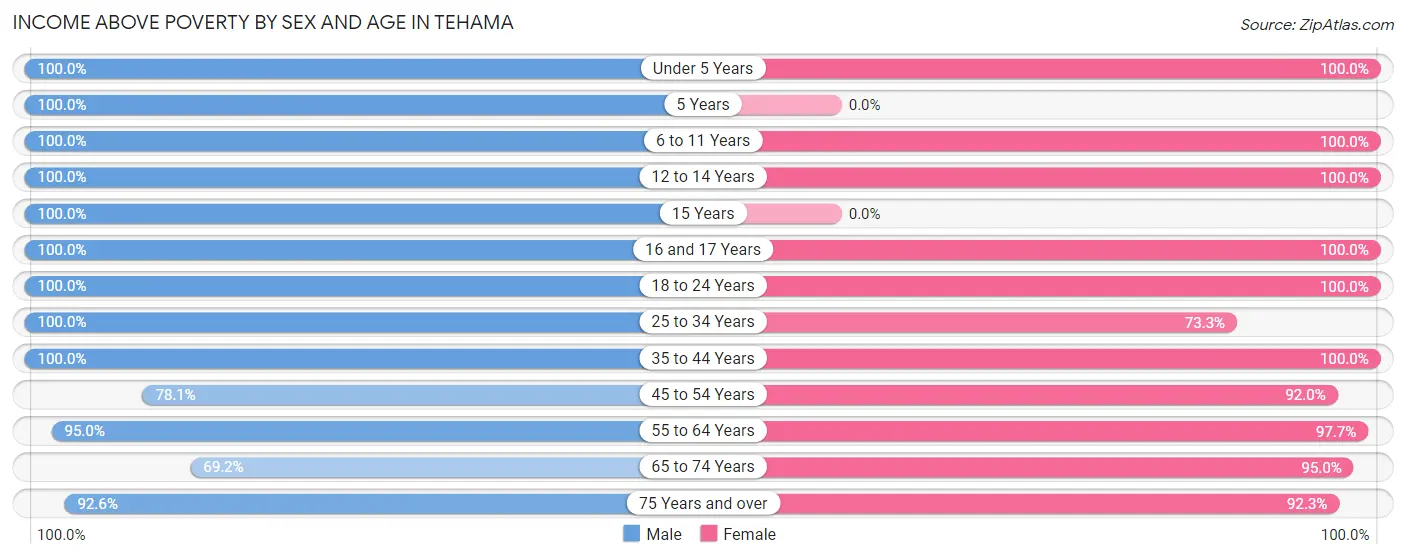
| Age Bracket | Male | Female |
| Under 5 Years | 6 (100.0%) | 4 (100.0%) |
| 5 Years | 3 (100.0%) | 0 (0.0%) |
| 6 to 11 Years | 18 (100.0%) | 16 (100.0%) |
| 12 to 14 Years | 13 (100.0%) | 8 (100.0%) |
| 15 Years | 8 (100.0%) | 0 (0.0%) |
| 16 and 17 Years | 1 (100.0%) | 2 (100.0%) |
| 18 to 24 Years | 3 (100.0%) | 13 (100.0%) |
| 25 to 34 Years | 9 (100.0%) | 11 (73.3%) |
| 35 to 44 Years | 32 (100.0%) | 31 (100.0%) |
| 45 to 54 Years | 25 (78.1%) | 23 (92.0%) |
| 55 to 64 Years | 38 (95.0%) | 42 (97.7%) |
| 65 to 74 Years | 18 (69.2%) | 19 (95.0%) |
| 75 Years and over | 25 (92.6%) | 24 (92.3%) |
| Total | 199 (91.3%) | 193 (95.1%) |
Income Below Poverty Among Married-Couple Families in Tehama
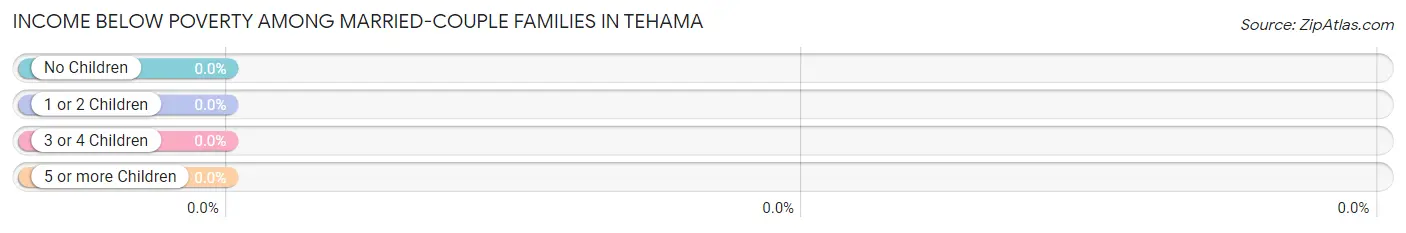
| Children | Above Poverty | Below Poverty |
| No Children | 69 (100.0%) | 0 (0.0%) |
| 1 or 2 Children | 7 (100.0%) | 0 (0.0%) |
| 3 or 4 Children | 16 (100.0%) | 0 (0.0%) |
| 5 or more Children | 0 (0.0%) | 0 (0.0%) |
| Total | 92 (100.0%) | 0 (0.0%) |
Income Below Poverty Among Single-Parent Households in Tehama
| Children | Single Father | Single Mother |
| No Children | 0 (0.0%) | 0 (0.0%) |
| 1 or 2 Children | 0 (0.0%) | 0 (0.0%) |
| 3 or 4 Children | 0 (0.0%) | 0 (0.0%) |
| 5 or more Children | 0 (0.0%) | 0 (0.0%) |
| Total | 0 (0.0%) | 0 (0.0%) |
Income Below Poverty Among Married-Couple vs Single-Parent Households in Tehama
| Children | Married-Couple Families | Single-Parent Households |
| No Children | 0 (0.0%) | 0 (0.0%) |
| 1 or 2 Children | 0 (0.0%) | 0 (0.0%) |
| 3 or 4 Children | 0 (0.0%) | 0 (0.0%) |
| 5 or more Children | 0 (0.0%) | 0 (0.0%) |
| Total | 0 (0.0%) | 0 (0.0%) |
Race in Tehama
The most populous races in Tehama are White / Caucasian (286 | 67.9%), Hispanic or Latino (101 | 24.0%), and Two or more Races (91 | 21.6%).
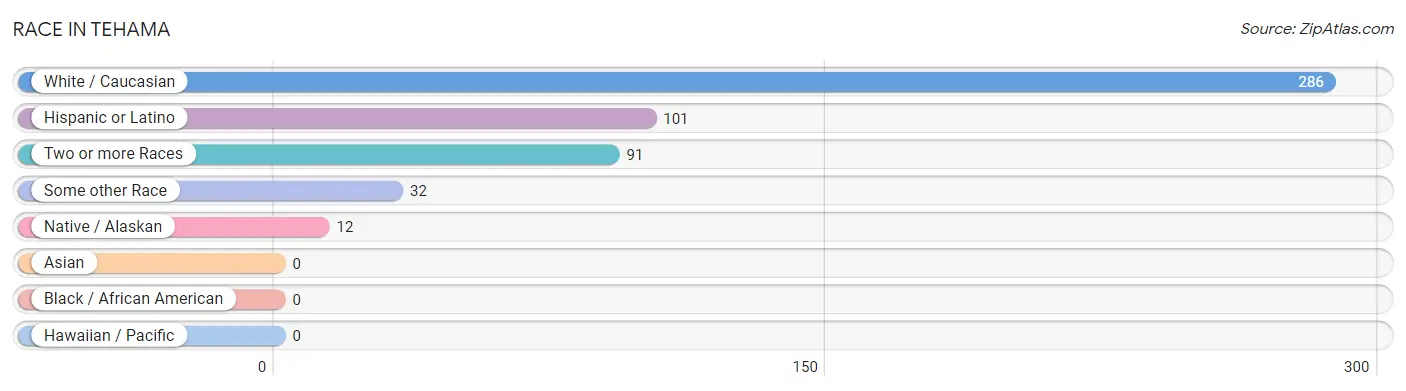
| Race | # Population | % Population |
| Asian | 0 | 0.0% |
| Black / African American | 0 | 0.0% |
| Hawaiian / Pacific | 0 | 0.0% |
| Hispanic or Latino | 101 | 24.0% |
| Native / Alaskan | 12 | 2.9% |
| White / Caucasian | 286 | 67.9% |
| Two or more Races | 91 | 21.6% |
| Some other Race | 32 | 7.6% |
| Total | 421 | 100.0% |
Ancestry in Tehama
The most populous ancestries reported in Tehama are Mexican (68 | 16.2%), German (49 | 11.6%), American (41 | 9.7%), Irish (32 | 7.6%), and Spaniard (29 | 6.9%), together accounting for 52.0% of all Tehama residents.
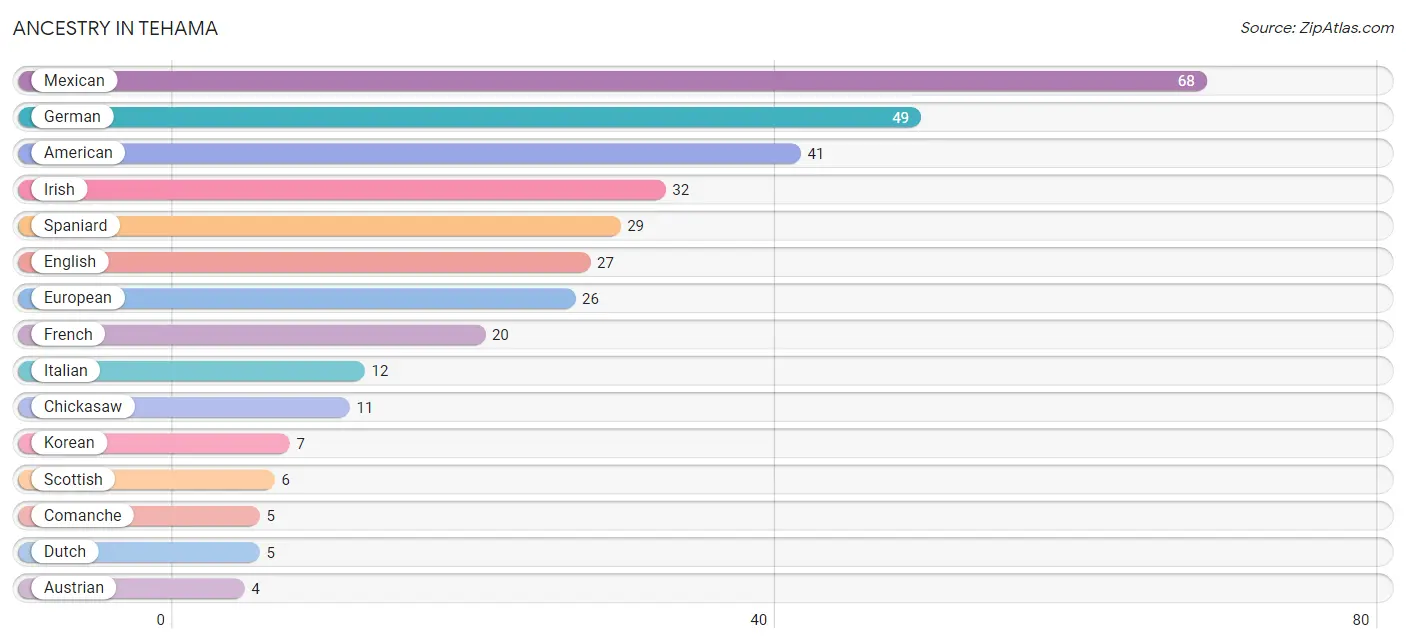
| Ancestry | # Population | % Population |
| American | 41 | 9.7% |
| Austrian | 4 | 0.9% |
| British | 2 | 0.5% |
| Chickasaw | 11 | 2.6% |
| Chippewa | 2 | 0.5% |
| Comanche | 5 | 1.2% |
| Cuban | 2 | 0.5% |
| Czech | 2 | 0.5% |
| Czechoslovakian | 2 | 0.5% |
| Danish | 1 | 0.2% |
| Dutch | 5 | 1.2% |
| Eastern European | 2 | 0.5% |
| English | 27 | 6.4% |
| European | 26 | 6.2% |
| French | 20 | 4.8% |
| French Canadian | 3 | 0.7% |
| German | 49 | 11.6% |
| Hungarian | 2 | 0.5% |
| Irish | 32 | 7.6% |
| Italian | 12 | 2.9% |
| Korean | 7 | 1.7% |
| Laotian | 2 | 0.5% |
| Mexican | 68 | 16.2% |
| Native Hawaiian | 3 | 0.7% |
| Norwegian | 3 | 0.7% |
| Puerto Rican | 2 | 0.5% |
| Scotch-Irish | 4 | 0.9% |
| Scottish | 6 | 1.4% |
| Spaniard | 29 | 6.9% |
| Swedish | 1 | 0.2% | View All 30 Rows |
Immigrants in Tehama
The most numerous immigrant groups reported in Tehama came from Central America (48 | 11.4%), Latin America (48 | 11.4%), Mexico (48 | 11.4%), Europe (4 | 0.9%), and Asia (2 | 0.5%), together accounting for 35.6% of all Tehama residents.
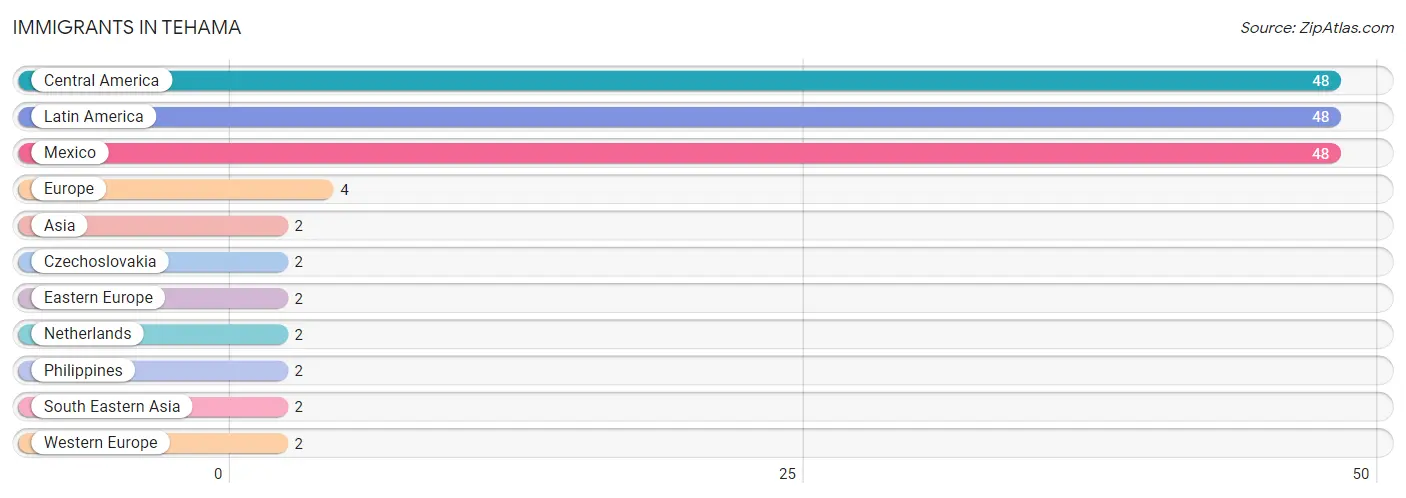
| Immigration Origin | # Population | % Population |
| Asia | 2 | 0.5% |
| Central America | 48 | 11.4% |
| Czechoslovakia | 2 | 0.5% |
| Eastern Europe | 2 | 0.5% |
| Europe | 4 | 0.9% |
| Latin America | 48 | 11.4% |
| Mexico | 48 | 11.4% |
| Netherlands | 2 | 0.5% |
| Philippines | 2 | 0.5% |
| South Eastern Asia | 2 | 0.5% |
| Western Europe | 2 | 0.5% | View All 11 Rows |
Sex and Age in Tehama
Sex and Age in Tehama
The most populous age groups in Tehama are 40 to 44 Years (25 | 11.5%) for men and 40 to 44 Years (24 | 11.8%) for women.
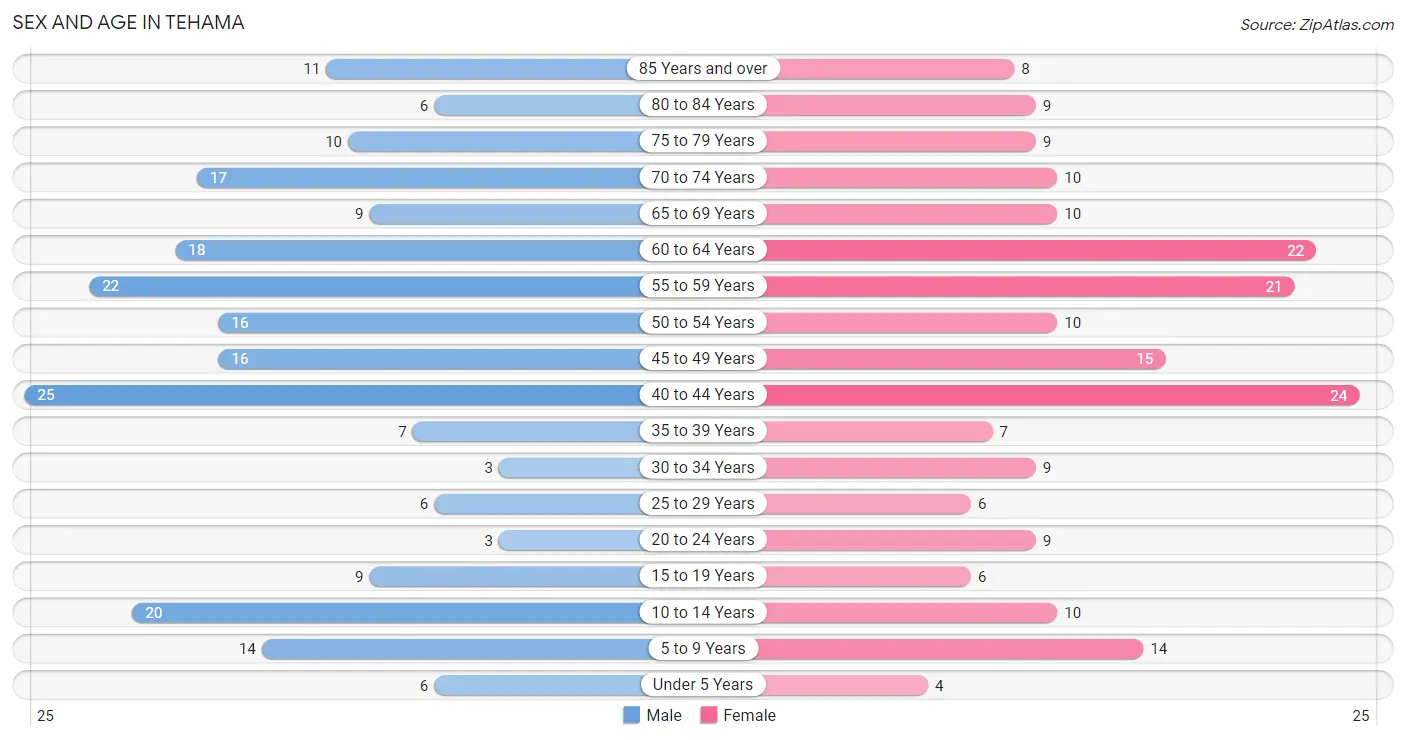
| Age Bracket | Male | Female |
| Under 5 Years | 6 (2.8%) | 4 (2.0%) |
| 5 to 9 Years | 14 (6.4%) | 14 (6.9%) |
| 10 to 14 Years | 20 (9.2%) | 10 (4.9%) |
| 15 to 19 Years | 9 (4.1%) | 6 (3.0%) |
| 20 to 24 Years | 3 (1.4%) | 9 (4.4%) |
| 25 to 29 Years | 6 (2.8%) | 6 (3.0%) |
| 30 to 34 Years | 3 (1.4%) | 9 (4.4%) |
| 35 to 39 Years | 7 (3.2%) | 7 (3.5%) |
| 40 to 44 Years | 25 (11.5%) | 24 (11.8%) |
| 45 to 49 Years | 16 (7.3%) | 15 (7.4%) |
| 50 to 54 Years | 16 (7.3%) | 10 (4.9%) |
| 55 to 59 Years | 22 (10.1%) | 21 (10.3%) |
| 60 to 64 Years | 18 (8.3%) | 22 (10.8%) |
| 65 to 69 Years | 9 (4.1%) | 10 (4.9%) |
| 70 to 74 Years | 17 (7.8%) | 10 (4.9%) |
| 75 to 79 Years | 10 (4.6%) | 9 (4.4%) |
| 80 to 84 Years | 6 (2.8%) | 9 (4.4%) |
| 85 Years and over | 11 (5.1%) | 8 (3.9%) |
| Total | 218 (100.0%) | 203 (100.0%) |
Families and Households in Tehama
Median Family Size in Tehama
The median family size in Tehama is 2.83 persons per family, with married-couple families (92 | 82.1%) accounting for the largest median family size of 2.91 persons per family. On the other hand, single male/father families (6 | 5.4%) represent the smallest median family size with 2.33 persons per family.
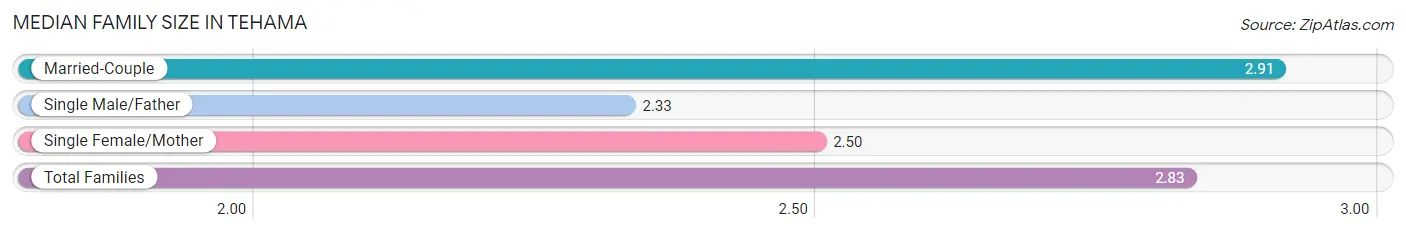
| Family Type | # Families | Family Size |
| Married-Couple | 92 (82.1%) | 2.91 |
| Single Male/Father | 6 (5.4%) | 2.33 |
| Single Female/Mother | 14 (12.5%) | 2.50 |
| Total Families | 112 (100.0%) | 2.83 |
Median Household Size in Tehama
The median household size in Tehama is 2.08 persons per household, with married-couple households (92 | 45.5%) accounting for the largest median household size of 2.96 persons per household. non-family households (90 | 44.6%) represent the smallest median household size with 1.11 persons per household.
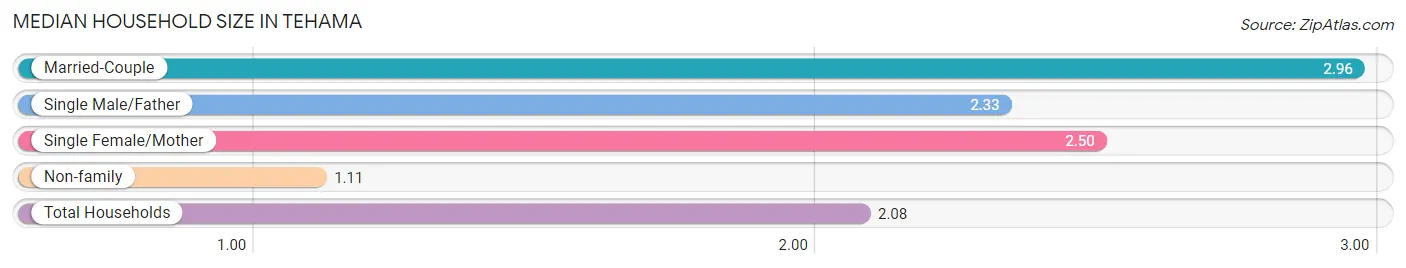
| Household Type | # Households | Household Size |
| Married-Couple | 92 (45.5%) | 2.96 |
| Single Male/Father | 6 (3.0%) | 2.33 |
| Single Female/Mother | 14 (6.9%) | 2.50 |
| Non-family | 90 (44.6%) | 1.11 |
| Total Households | 202 (100.0%) | 2.08 |
Household Size by Marriage Status in Tehama
Out of a total of 202 households in Tehama, 112 (55.4%) are family households, while 90 (44.6%) are nonfamily households. The most numerous type of family households are 2-person households, comprising 75, and the most common type of nonfamily households are 1-person households, comprising 79.
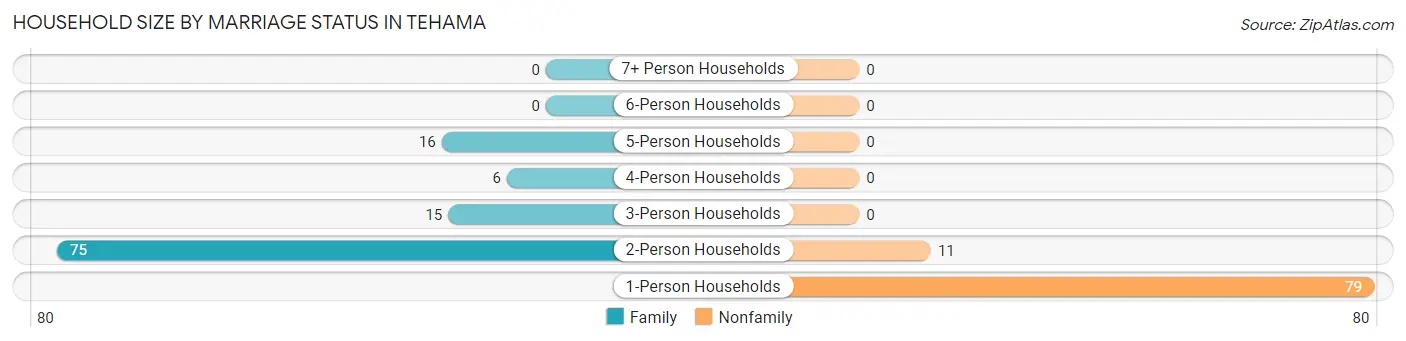
| Household Size | Family Households | Nonfamily Households |
| 1-Person Households | - | 79 (39.1%) |
| 2-Person Households | 75 (37.1%) | 11 (5.4%) |
| 3-Person Households | 15 (7.4%) | 0 (0.0%) |
| 4-Person Households | 6 (3.0%) | 0 (0.0%) |
| 5-Person Households | 16 (7.9%) | 0 (0.0%) |
| 6-Person Households | 0 (0.0%) | 0 (0.0%) |
| 7+ Person Households | 0 (0.0%) | 0 (0.0%) |
| Total | 112 (55.4%) | 90 (44.6%) |
Female Fertility in Tehama
Fertility by Age in Tehama
Average fertility rate in Tehama is 50.0 births per 1,000 women. Women in the age bracket of 20 to 34 years have the highest fertility rate with 167.0 births per 1,000 women. Women in the age bracket of 20 to 34 years acount for 100.0% of all women with births.
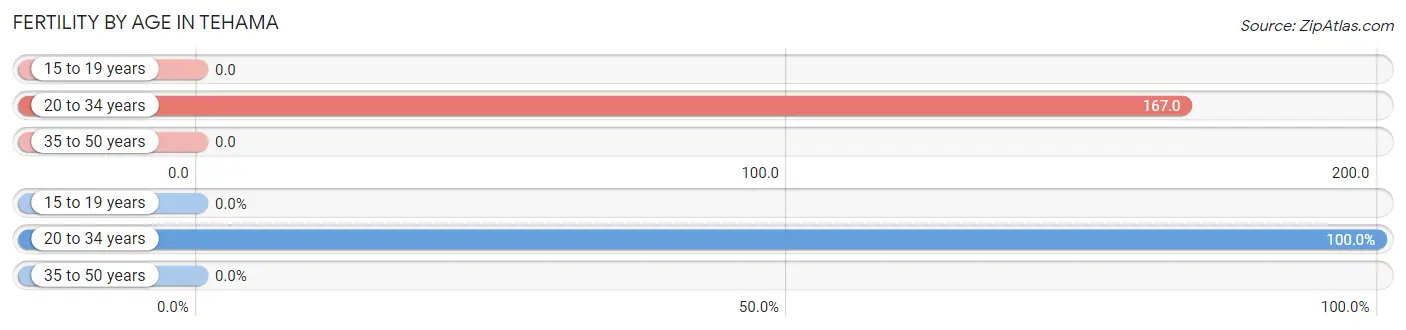
| Age Bracket | Women with Births | Births / 1,000 Women |
| 15 to 19 years | 0 (0.0%) | 0.0 |
| 20 to 34 years | 4 (100.0%) | 167.0 |
| 35 to 50 years | 0 (0.0%) | 0.0 |
| Total | 4 (100.0%) | 50.0 |
Fertility by Age by Marriage Status in Tehama
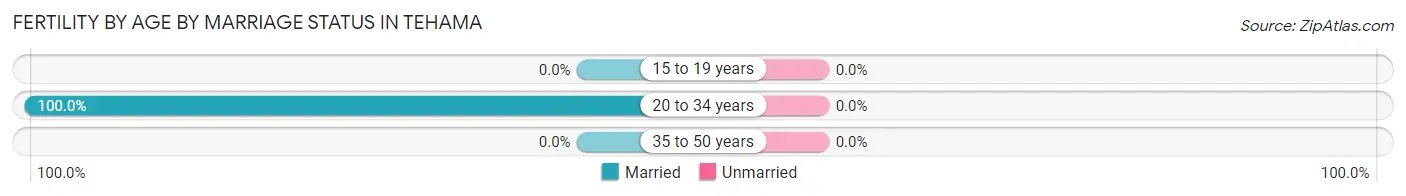
| Age Bracket | Married | Unmarried |
| 15 to 19 years | 0 (0.0%) | 0 (0.0%) |
| 20 to 34 years | 4 (100.0%) | 0 (0.0%) |
| 35 to 50 years | 0 (0.0%) | 0 (0.0%) |
| Total | 4 (100.0%) | 0 (0.0%) |
Fertility by Education in Tehama
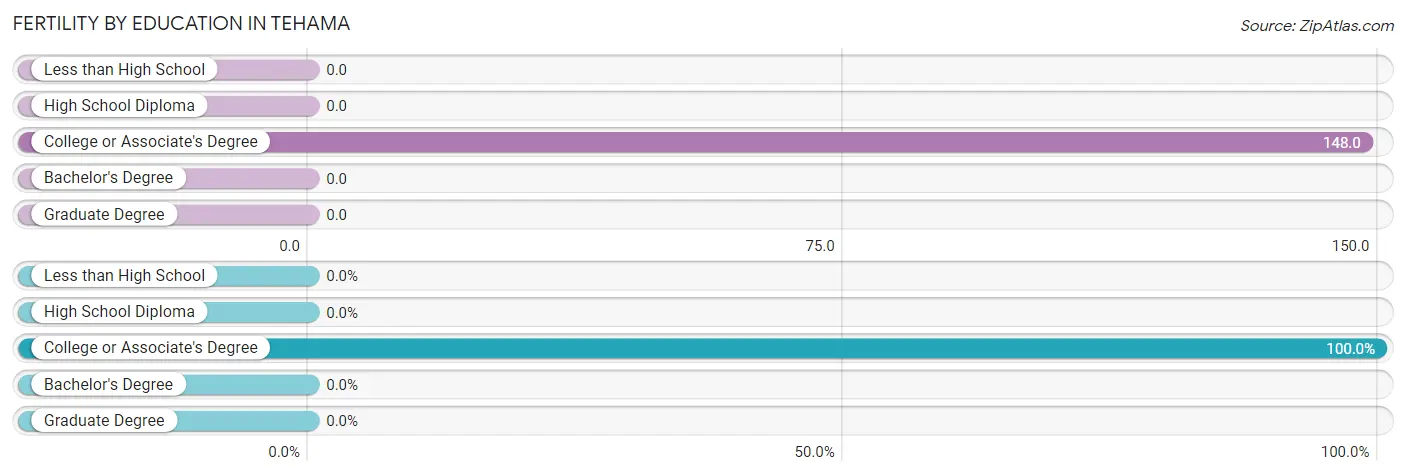
| Educational Attainment | Women with Births | Births / 1,000 Women |
| Less than High School | 0 (0.0%) | 0.0 |
| High School Diploma | 0 (0.0%) | 0.0 |
| College or Associate's Degree | 4 (100.0%) | 148.0 |
| Bachelor's Degree | 0 (0.0%) | 0.0 |
| Graduate Degree | 0 (0.0%) | 0.0 |
| Total | 4 (100.0%) | 50.0 |
Fertility by Education by Marriage Status in Tehama
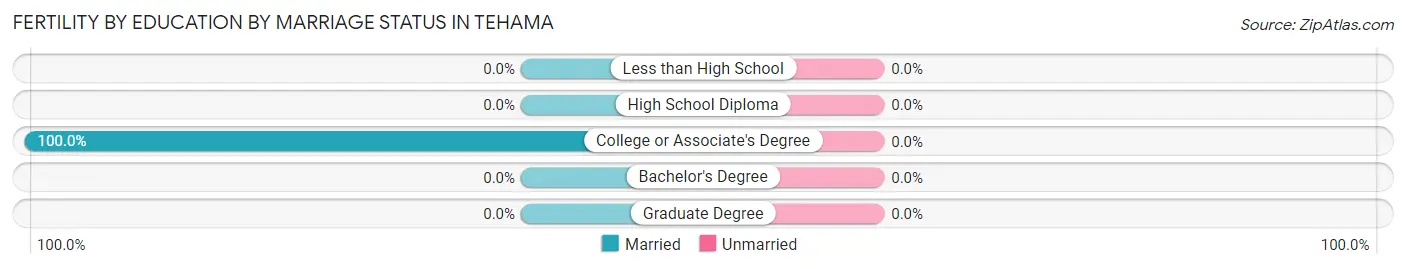
| Educational Attainment | Married | Unmarried |
| Less than High School | 0 (0.0%) | 0 (0.0%) |
| High School Diploma | 0 (0.0%) | 0 (0.0%) |
| College or Associate's Degree | 4 (100.0%) | 0 (0.0%) |
| Bachelor's Degree | 0 (0.0%) | 0 (0.0%) |
| Graduate Degree | 0 (0.0%) | 0 (0.0%) |
| Total | 4 (100.0%) | 0 (0.0%) |
Employment Characteristics in Tehama
Employment by Class of Employer in Tehama
Among the 178 employed individuals in Tehama, private company employees (106 | 59.6%), self-employed (not incorporated) (25 | 14.0%), and state government employees (18 | 10.1%) make up the most common classes of employment.
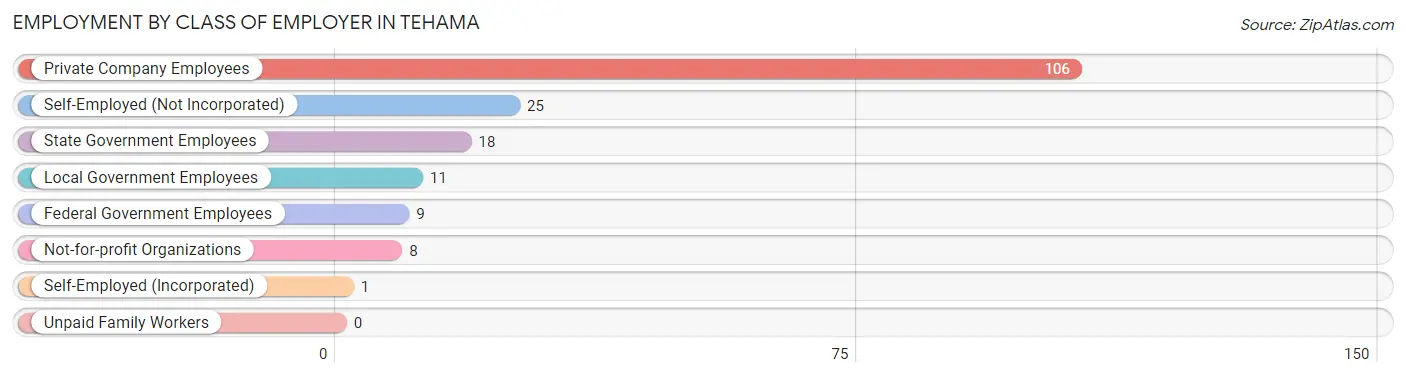
| Employer Class | # Employees | % Employees |
| Private Company Employees | 106 | 59.6% |
| Self-Employed (Incorporated) | 1 | 0.6% |
| Self-Employed (Not Incorporated) | 25 | 14.0% |
| Not-for-profit Organizations | 8 | 4.5% |
| Local Government Employees | 11 | 6.2% |
| State Government Employees | 18 | 10.1% |
| Federal Government Employees | 9 | 5.1% |
| Unpaid Family Workers | 0 | 0.0% |
| Total | 178 | 100.0% |
Employment Status by Age in Tehama
According to the labor force statistics for Tehama, out of the total population over 16 years of age (345), 52.5% or 181 individuals are in the labor force, with 1.1% or 2 of them unemployed. The age group with the highest labor force participation rate is 25 to 29 years, with 91.7% or 11 individuals in the labor force. Within the labor force, the 55 to 59 years age range has the highest percentage of unemployed individuals, with 6.9% or 2 of them being unemployed.
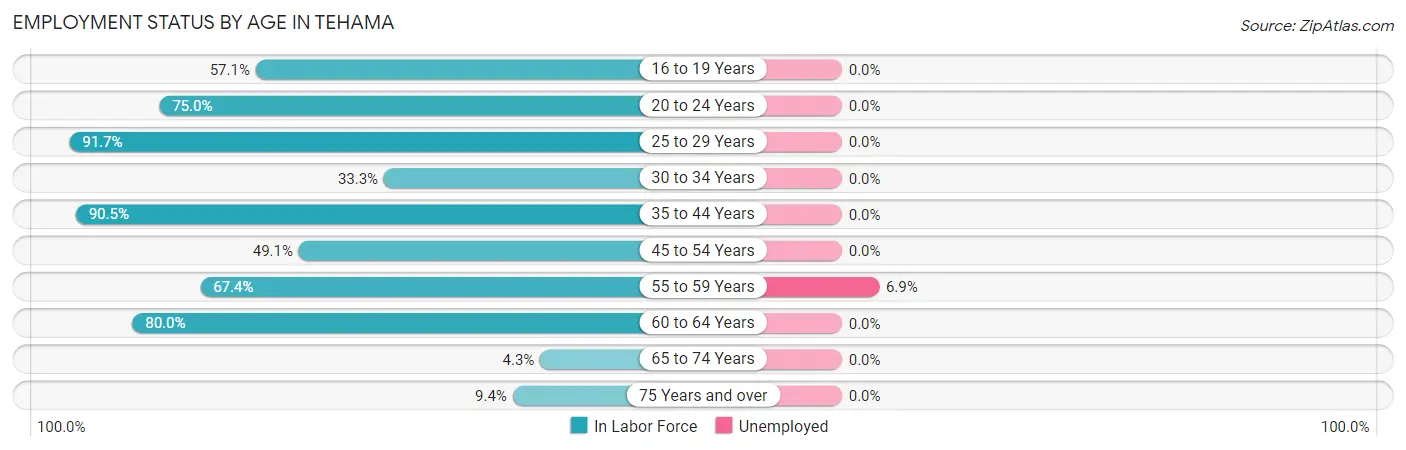
| Age Bracket | In Labor Force | Unemployed |
| 16 to 19 Years | 4 (57.1%) | 0 (0.0%) |
| 20 to 24 Years | 9 (75.0%) | 0 (0.0%) |
| 25 to 29 Years | 11 (91.7%) | 0 (0.0%) |
| 30 to 34 Years | 4 (33.3%) | 0 (0.0%) |
| 35 to 44 Years | 57 (90.5%) | 0 (0.0%) |
| 45 to 54 Years | 28 (49.1%) | 0 (0.0%) |
| 55 to 59 Years | 29 (67.4%) | 2 (6.9%) |
| 60 to 64 Years | 32 (80.0%) | 0 (0.0%) |
| 65 to 74 Years | 2 (4.3%) | 0 (0.0%) |
| 75 Years and over | 5 (9.4%) | 0 (0.0%) |
| Total | 181 (52.5%) | 2 (1.1%) |
Employment Status by Educational Attainment in Tehama
According to labor force statistics for Tehama, 70.9% of individuals (161) out of the total population between 25 and 64 years of age (227) are in the labor force, with 1.2% or 2 of them being unemployed. The group with the highest labor force participation rate are those with the educational attainment of bachelor's degree or higher, with 83.8% or 31 individuals in the labor force. Within the labor force, individuals with high school diploma education have the highest percentage of unemployment, with 2.7% or 2 of them being unemployed.
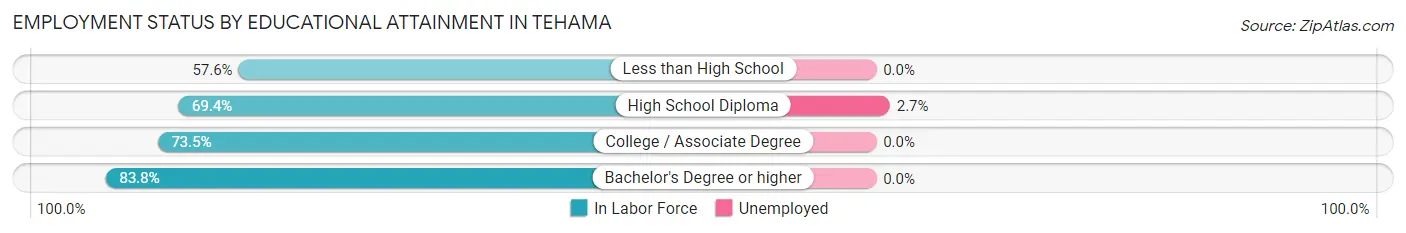
| Educational Attainment | In Labor Force | Unemployed |
| Less than High School | 19 (57.6%) | 0 (0.0%) |
| High School Diploma | 75 (69.4%) | 3 (2.7%) |
| College / Associate Degree | 36 (73.5%) | 0 (0.0%) |
| Bachelor's Degree or higher | 31 (83.8%) | 0 (0.0%) |
| Total | 161 (70.9%) | 3 (1.2%) |
Employment Occupations by Sex in Tehama
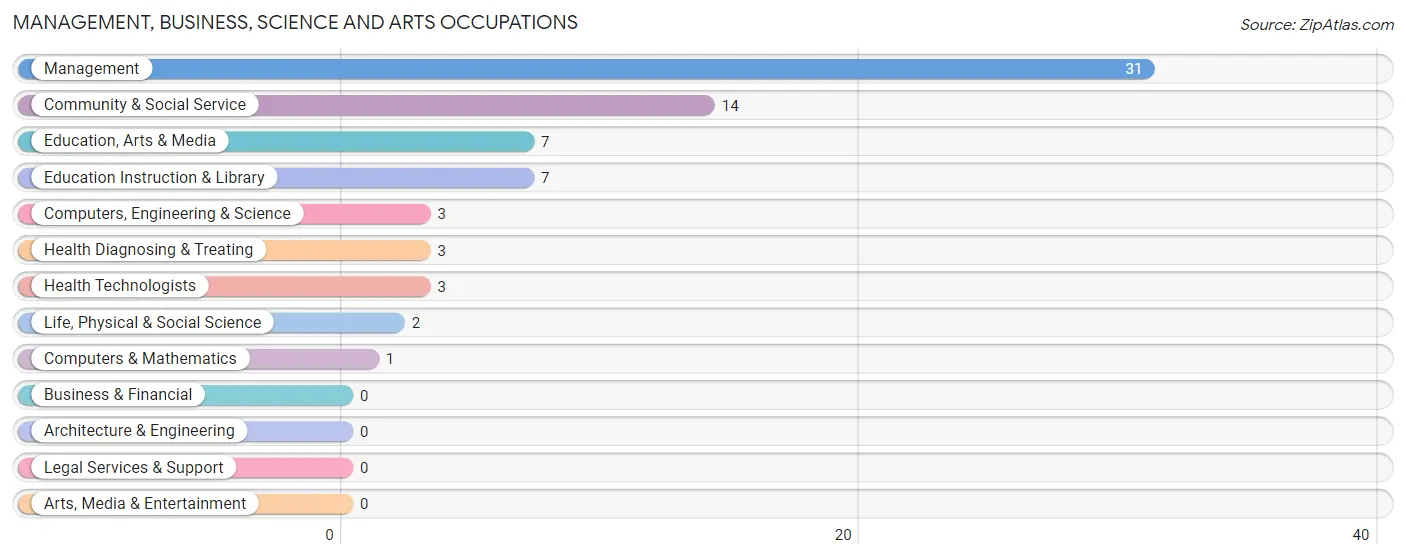
Management, Business, Science and Arts Occupations
The most common Management, Business, Science and Arts occupations in Tehama are Management (31 | 17.3%), Community & Social Service (14 | 7.8%), Education, Arts & Media (7 | 3.9%), Education Instruction & Library (7 | 3.9%), and Computers, Engineering & Science (3 | 1.7%).
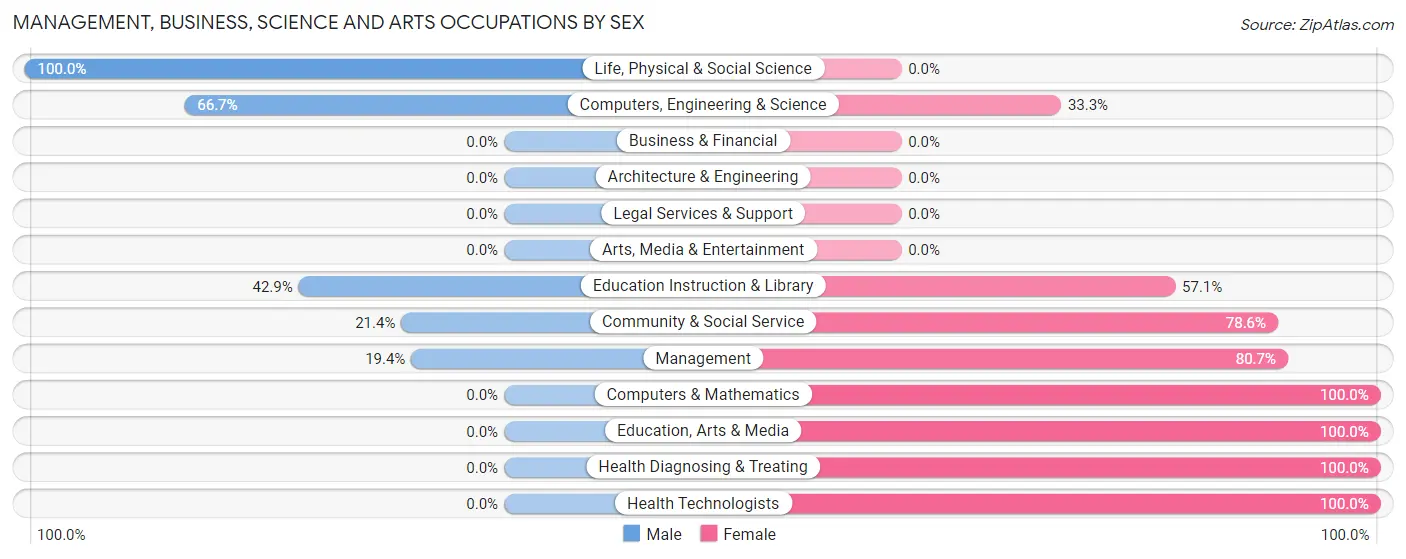
Management, Business, Science and Arts Occupations by Sex
Within the Management, Business, Science and Arts occupations in Tehama, the most male-oriented occupations are Life, Physical & Social Science (100.0%), Computers, Engineering & Science (66.7%), and Education Instruction & Library (42.9%), while the most female-oriented occupations are Computers & Mathematics (100.0%), Education, Arts & Media (100.0%), and Health Diagnosing & Treating (100.0%).
| Occupation | Male | Female |
| Management | 6 (19.4%) | 25 (80.6%) |
| Business & Financial | 0 (0.0%) | 0 (0.0%) |
| Computers, Engineering & Science | 2 (66.7%) | 1 (33.3%) |
| Computers & Mathematics | 0 (0.0%) | 1 (100.0%) |
| Architecture & Engineering | 0 (0.0%) | 0 (0.0%) |
| Life, Physical & Social Science | 2 (100.0%) | 0 (0.0%) |
| Community & Social Service | 3 (21.4%) | 11 (78.6%) |
| Education, Arts & Media | 0 (0.0%) | 7 (100.0%) |
| Legal Services & Support | 0 (0.0%) | 0 (0.0%) |
| Education Instruction & Library | 3 (42.9%) | 4 (57.1%) |
| Arts, Media & Entertainment | 0 (0.0%) | 0 (0.0%) |
| Health Diagnosing & Treating | 0 (0.0%) | 3 (100.0%) |
| Health Technologists | 0 (0.0%) | 3 (100.0%) |
| Total (Category) | 11 (21.6%) | 40 (78.4%) |
| Total (Overall) | 94 (52.5%) | 85 (47.5%) |
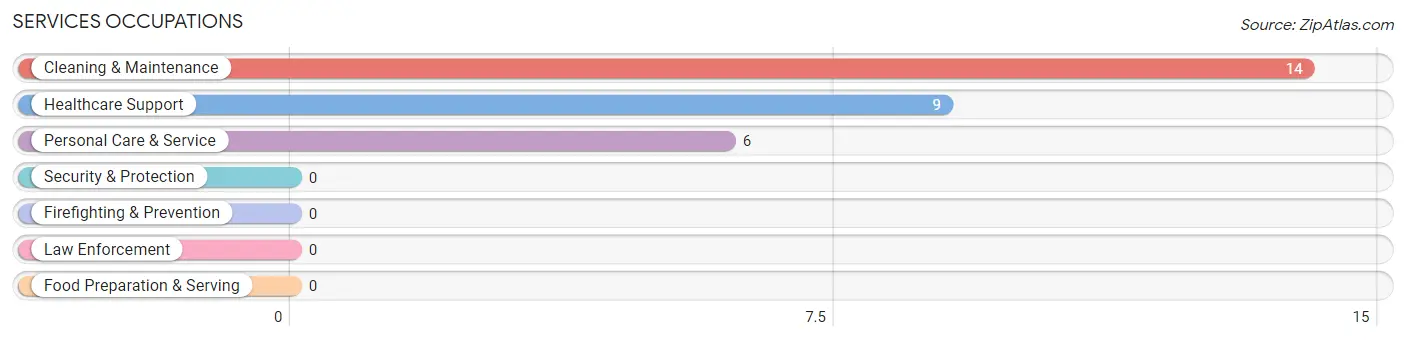
Services Occupations
The most common Services occupations in Tehama are Cleaning & Maintenance (14 | 7.8%), Healthcare Support (9 | 5.0%), and Personal Care & Service (6 | 3.4%).
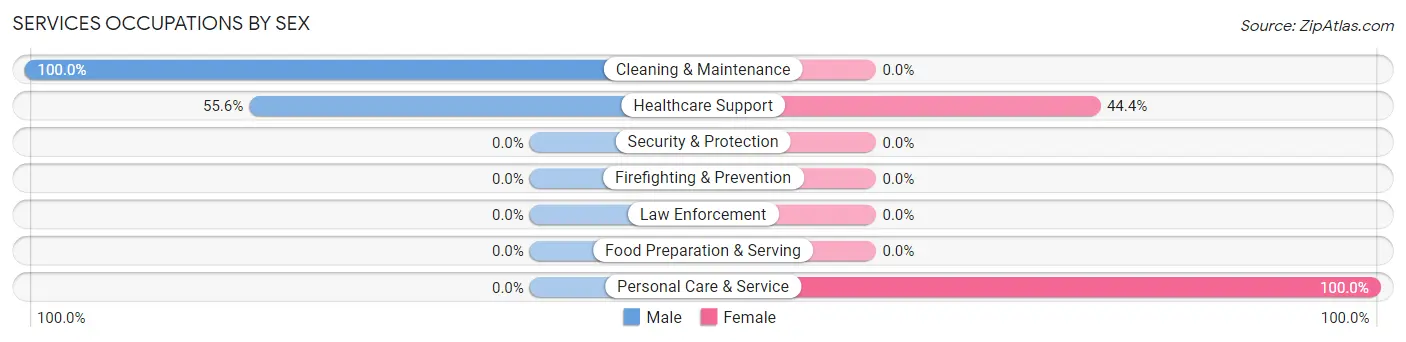
Services Occupations by Sex
Within the Services occupations in Tehama, the most male-oriented occupations are Cleaning & Maintenance (100.0%), and Healthcare Support (55.6%), while the most female-oriented occupations are Personal Care & Service (100.0%), and Healthcare Support (44.4%).
| Occupation | Male | Female |
| Healthcare Support | 5 (55.6%) | 4 (44.4%) |
| Security & Protection | 0 (0.0%) | 0 (0.0%) |
| Firefighting & Prevention | 0 (0.0%) | 0 (0.0%) |
| Law Enforcement | 0 (0.0%) | 0 (0.0%) |
| Food Preparation & Serving | 0 (0.0%) | 0 (0.0%) |
| Cleaning & Maintenance | 14 (100.0%) | 0 (0.0%) |
| Personal Care & Service | 0 (0.0%) | 6 (100.0%) |
| Total (Category) | 19 (65.5%) | 10 (34.5%) |
| Total (Overall) | 94 (52.5%) | 85 (47.5%) |
Sales and Office Occupations
The most common Sales and Office occupations in Tehama are Office & Administration (27 | 15.1%), and Sales & Related (26 | 14.5%).
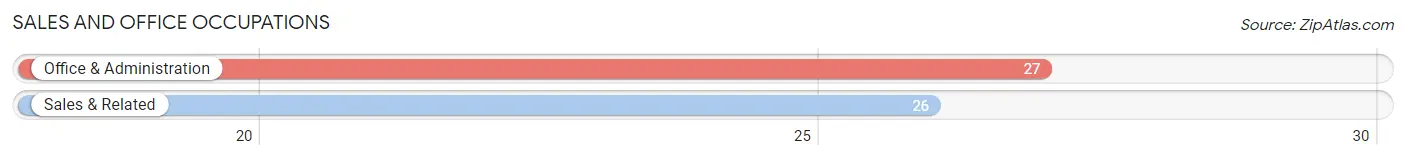
Sales and Office Occupations by Sex
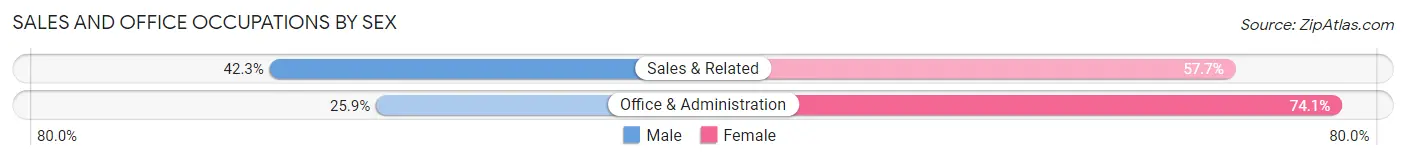
| Occupation | Male | Female |
| Sales & Related | 11 (42.3%) | 15 (57.7%) |
| Office & Administration | 7 (25.9%) | 20 (74.1%) |
| Total (Category) | 18 (34.0%) | 35 (66.0%) |
| Total (Overall) | 94 (52.5%) | 85 (47.5%) |
Natural Resources, Construction and Maintenance Occupations
The most common Natural Resources, Construction and Maintenance occupations in Tehama are Installation, Maintenance & Repair (11 | 6.1%), and Construction & Extraction (3 | 1.7%).
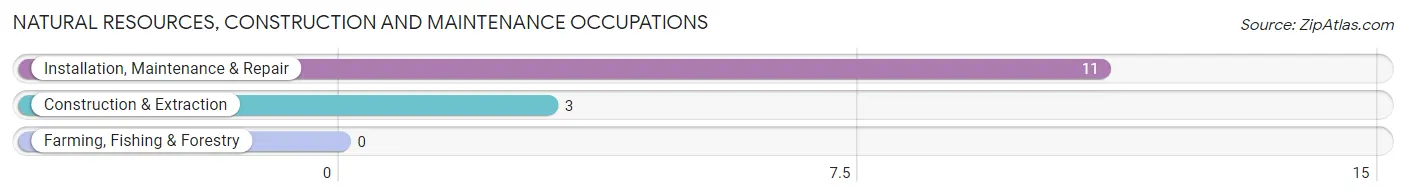
Natural Resources, Construction and Maintenance Occupations by Sex
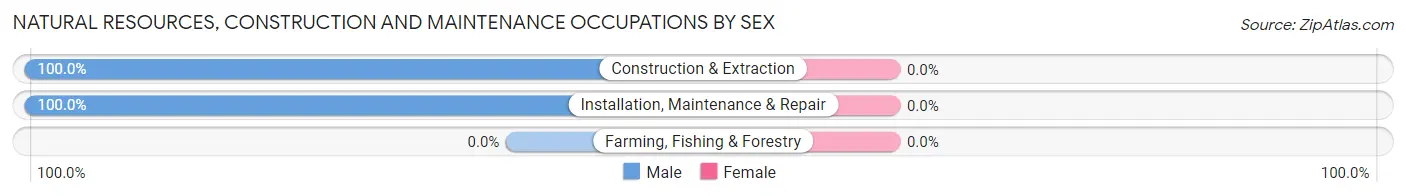
| Occupation | Male | Female |
| Farming, Fishing & Forestry | 0 (0.0%) | 0 (0.0%) |
| Construction & Extraction | 3 (100.0%) | 0 (0.0%) |
| Installation, Maintenance & Repair | 11 (100.0%) | 0 (0.0%) |
| Total (Category) | 14 (100.0%) | 0 (0.0%) |
| Total (Overall) | 94 (52.5%) | 85 (47.5%) |
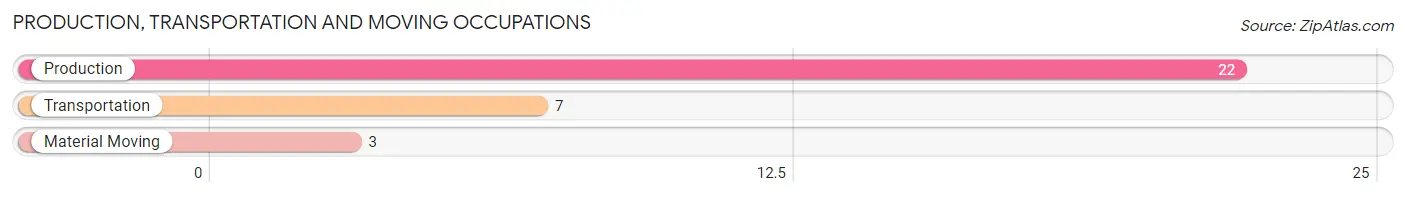
Production, Transportation and Moving Occupations
The most common Production, Transportation and Moving occupations in Tehama are Production (22 | 12.3%), Transportation (7 | 3.9%), and Material Moving (3 | 1.7%).
Production, Transportation and Moving Occupations by Sex
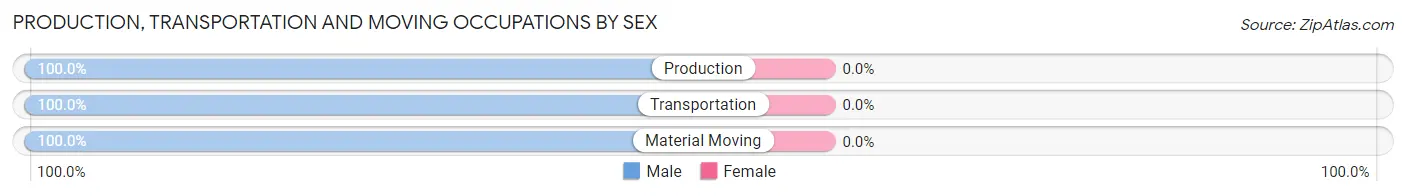
| Occupation | Male | Female |
| Production | 22 (100.0%) | 0 (0.0%) |
| Transportation | 7 (100.0%) | 0 (0.0%) |
| Material Moving | 3 (100.0%) | 0 (0.0%) |
| Total (Category) | 32 (100.0%) | 0 (0.0%) |
| Total (Overall) | 94 (52.5%) | 85 (47.5%) |
Employment Industries by Sex in Tehama
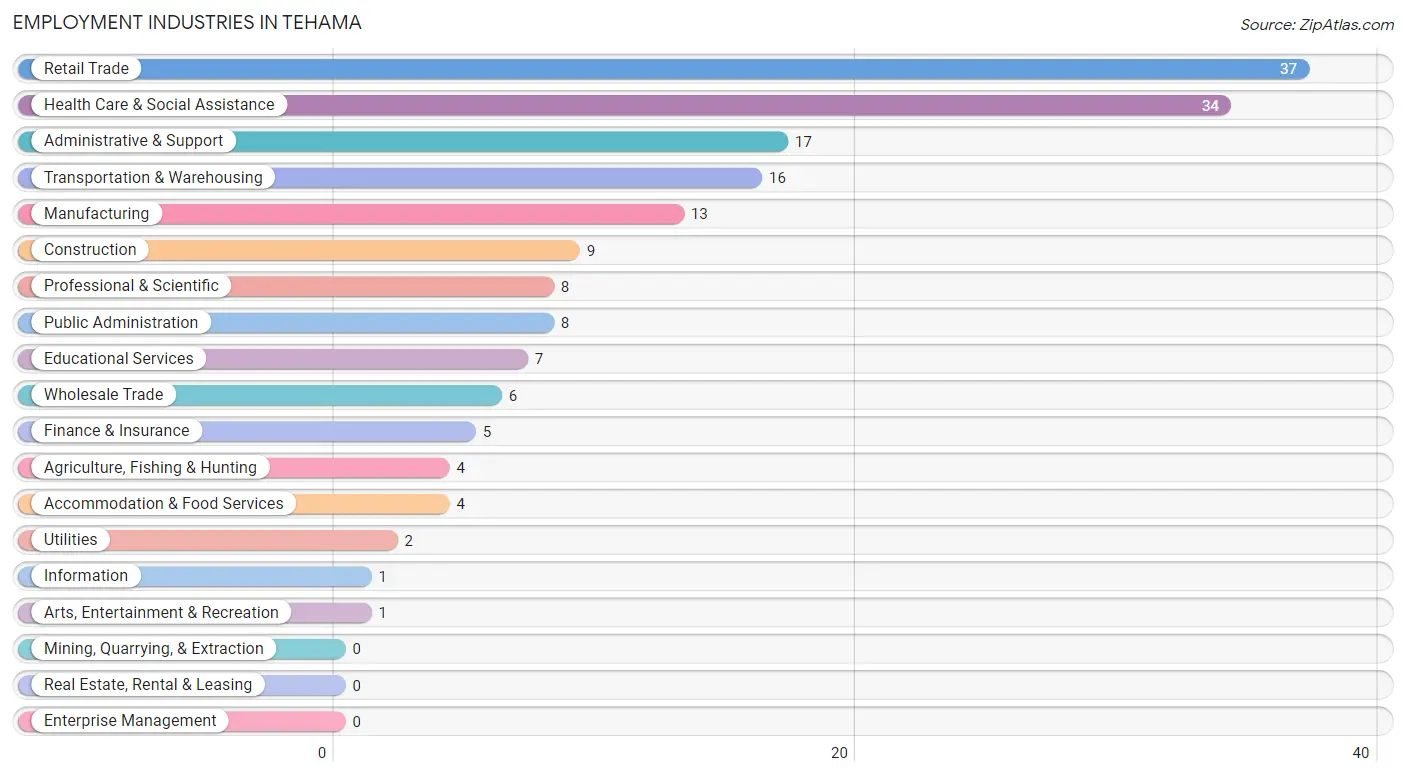
Employment Industries in Tehama
The major employment industries in Tehama include Retail Trade (37 | 20.7%), Health Care & Social Assistance (34 | 19.0%), Administrative & Support (17 | 9.5%), Transportation & Warehousing (16 | 8.9%), and Manufacturing (13 | 7.3%).
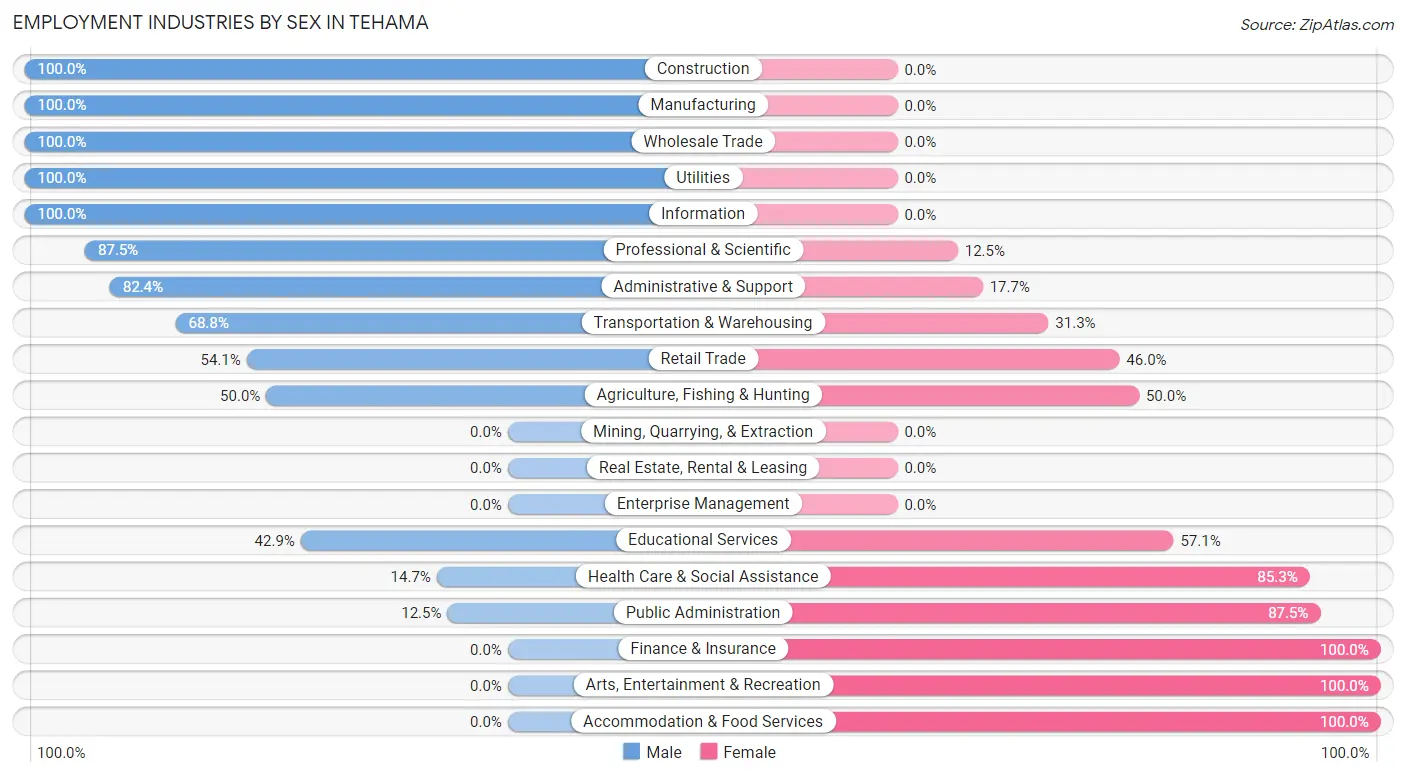
Employment Industries by Sex in Tehama
The Tehama industries that see more men than women are Construction (100.0%), Manufacturing (100.0%), and Wholesale Trade (100.0%), whereas the industries that tend to have a higher number of women are Finance & Insurance (100.0%), Arts, Entertainment & Recreation (100.0%), and Accommodation & Food Services (100.0%).
| Industry | Male | Female |
| Agriculture, Fishing & Hunting | 2 (50.0%) | 2 (50.0%) |
| Mining, Quarrying, & Extraction | 0 (0.0%) | 0 (0.0%) |
| Construction | 9 (100.0%) | 0 (0.0%) |
| Manufacturing | 13 (100.0%) | 0 (0.0%) |
| Wholesale Trade | 6 (100.0%) | 0 (0.0%) |
| Retail Trade | 20 (54.0%) | 17 (46.0%) |
| Transportation & Warehousing | 11 (68.8%) | 5 (31.2%) |
| Utilities | 2 (100.0%) | 0 (0.0%) |
| Information | 1 (100.0%) | 0 (0.0%) |
| Finance & Insurance | 0 (0.0%) | 5 (100.0%) |
| Real Estate, Rental & Leasing | 0 (0.0%) | 0 (0.0%) |
| Professional & Scientific | 7 (87.5%) | 1 (12.5%) |
| Enterprise Management | 0 (0.0%) | 0 (0.0%) |
| Administrative & Support | 14 (82.4%) | 3 (17.6%) |
| Educational Services | 3 (42.9%) | 4 (57.1%) |
| Health Care & Social Assistance | 5 (14.7%) | 29 (85.3%) |
| Arts, Entertainment & Recreation | 0 (0.0%) | 1 (100.0%) |
| Accommodation & Food Services | 0 (0.0%) | 4 (100.0%) |
| Public Administration | 1 (12.5%) | 7 (87.5%) |
| Total | 94 (52.5%) | 85 (47.5%) |
Education in Tehama
School Enrollment in Tehama
The most common levels of schooling among the 71 students in Tehama are elementary school (24 | 33.8%), middle school (22 | 31.0%), and college / undergraduate (17 | 23.9%).
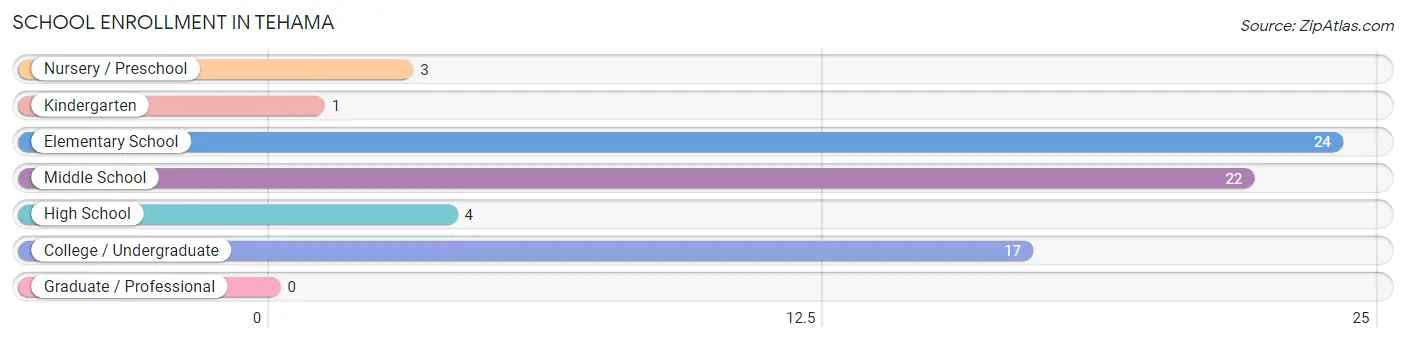
| School Level | # Students | % Students |
| Nursery / Preschool | 3 | 4.2% |
| Kindergarten | 1 | 1.4% |
| Elementary School | 24 | 33.8% |
| Middle School | 22 | 31.0% |
| High School | 4 | 5.6% |
| College / Undergraduate | 17 | 23.9% |
| Graduate / Professional | 0 | 0.0% |
| Total | 71 | 100.0% |
School Enrollment by Age by Funding Source in Tehama
Out of a total of 71 students who are enrolled in schools in Tehama, 4 (5.6%) attend a private institution, while the remaining 67 (94.4%) are enrolled in public schools. The age group of 35 years and over has the highest likelihood of being enrolled in private schools, with 1 (100.0% in the age bracket) enrolled. Conversely, the age group of 10 to 14 year olds has the lowest likelihood of being enrolled in a private school, with 23 (100.0% in the age bracket) attending a public institution.
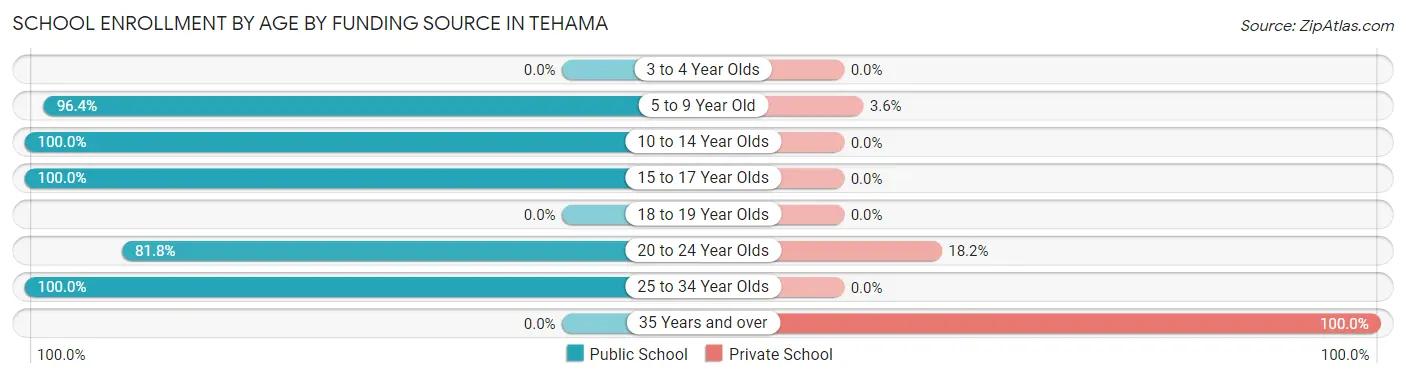
| Age Bracket | Public School | Private School |
| 3 to 4 Year Olds | 0 (0.0%) | 0 (0.0%) |
| 5 to 9 Year Old | 27 (96.4%) | 1 (3.6%) |
| 10 to 14 Year Olds | 23 (100.0%) | 0 (0.0%) |
| 15 to 17 Year Olds | 3 (100.0%) | 0 (0.0%) |
| 18 to 19 Year Olds | 0 (0.0%) | 0 (0.0%) |
| 20 to 24 Year Olds | 9 (81.8%) | 2 (18.2%) |
| 25 to 34 Year Olds | 5 (100.0%) | 0 (0.0%) |
| 35 Years and over | 0 (0.0%) | 1 (100.0%) |
| Total | 67 (94.4%) | 4 (5.6%) |
Educational Attainment by Field of Study in Tehama
Liberal arts & history (14 | 24.1%), arts & humanities (14 | 24.1%), social sciences (7 | 12.1%), education (7 | 12.1%), and bio, nature & agricultural (4 | 6.9%) are the most common fields of study among 58 individuals in Tehama who have obtained a bachelor's degree or higher.
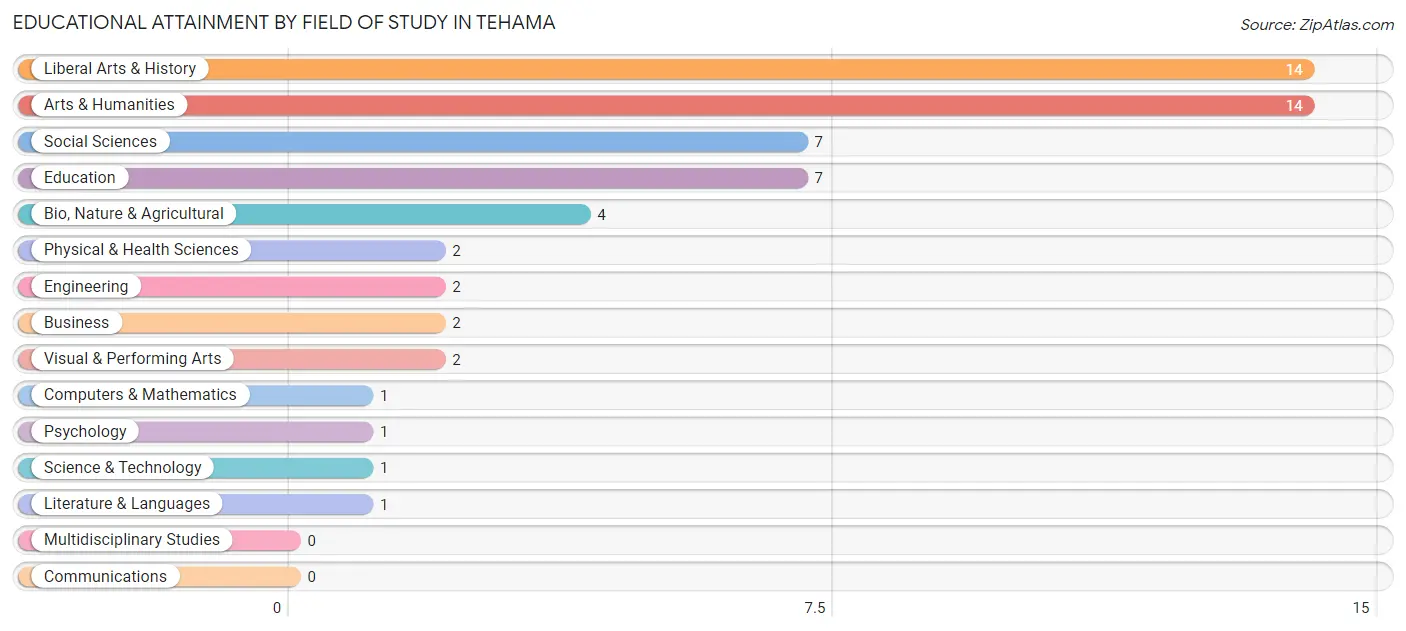
| Field of Study | # Graduates | % Graduates |
| Computers & Mathematics | 1 | 1.7% |
| Bio, Nature & Agricultural | 4 | 6.9% |
| Physical & Health Sciences | 2 | 3.5% |
| Psychology | 1 | 1.7% |
| Social Sciences | 7 | 12.1% |
| Engineering | 2 | 3.5% |
| Multidisciplinary Studies | 0 | 0.0% |
| Science & Technology | 1 | 1.7% |
| Business | 2 | 3.5% |
| Education | 7 | 12.1% |
| Literature & Languages | 1 | 1.7% |
| Liberal Arts & History | 14 | 24.1% |
| Visual & Performing Arts | 2 | 3.5% |
| Communications | 0 | 0.0% |
| Arts & Humanities | 14 | 24.1% |
| Total | 58 | 100.0% |
Transportation & Commute in Tehama
Vehicle Availability by Sex in Tehama
The most prevalent vehicle ownership categories in Tehama are males with 2 vehicles (63, accounting for 67.0%) and females with 2 vehicles (58, making up 75.0%).
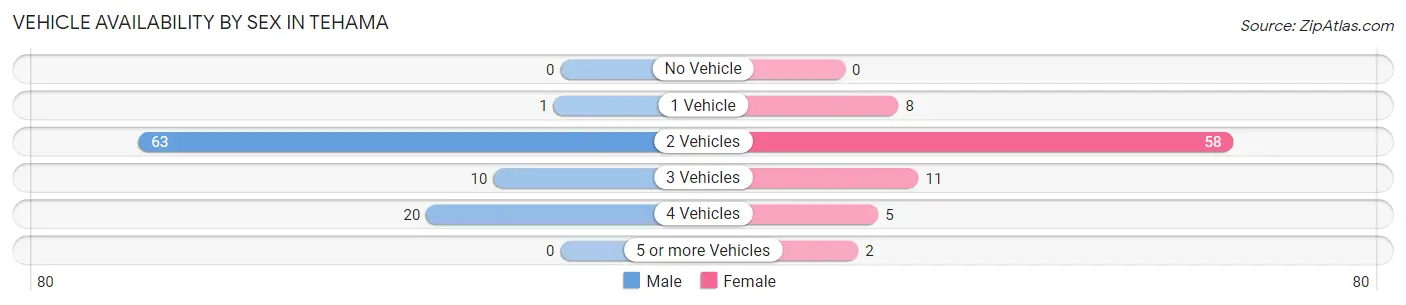
| Vehicles Available | Male | Female |
| No Vehicle | 0 (0.0%) | 0 (0.0%) |
| 1 Vehicle | 1 (1.1%) | 8 (9.5%) |
| 2 Vehicles | 63 (67.0%) | 58 (69.1%) |
| 3 Vehicles | 10 (10.6%) | 11 (13.1%) |
| 4 Vehicles | 20 (21.3%) | 5 (5.9%) |
| 5 or more Vehicles | 0 (0.0%) | 2 (2.4%) |
| Total | 94 (100.0%) | 84 (100.0%) |
Commute Time in Tehama
The most frequently occuring commute durations in Tehama are 10 to 14 minutes (33 commuters, 21.0%), 25 to 29 minutes (32 commuters, 20.4%), and 35 to 39 minutes (18 commuters, 11.5%).
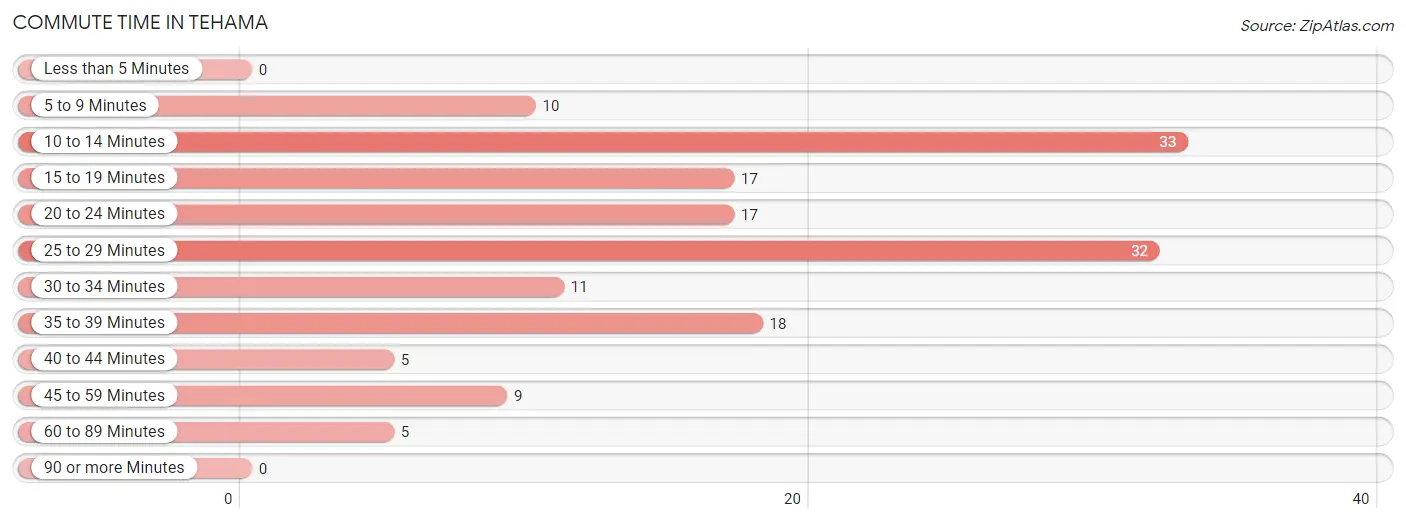
| Commute Time | # Commuters | % Commuters |
| Less than 5 Minutes | 0 | 0.0% |
| 5 to 9 Minutes | 10 | 6.4% |
| 10 to 14 Minutes | 33 | 21.0% |
| 15 to 19 Minutes | 17 | 10.8% |
| 20 to 24 Minutes | 17 | 10.8% |
| 25 to 29 Minutes | 32 | 20.4% |
| 30 to 34 Minutes | 11 | 7.0% |
| 35 to 39 Minutes | 18 | 11.5% |
| 40 to 44 Minutes | 5 | 3.2% |
| 45 to 59 Minutes | 9 | 5.7% |
| 60 to 89 Minutes | 5 | 3.2% |
| 90 or more Minutes | 0 | 0.0% |
Commute Time by Sex in Tehama
The most common commute times in Tehama are 25 to 29 minutes (19 commuters, 21.3%) for males and 10 to 14 minutes (15 commuters, 22.1%) for females.
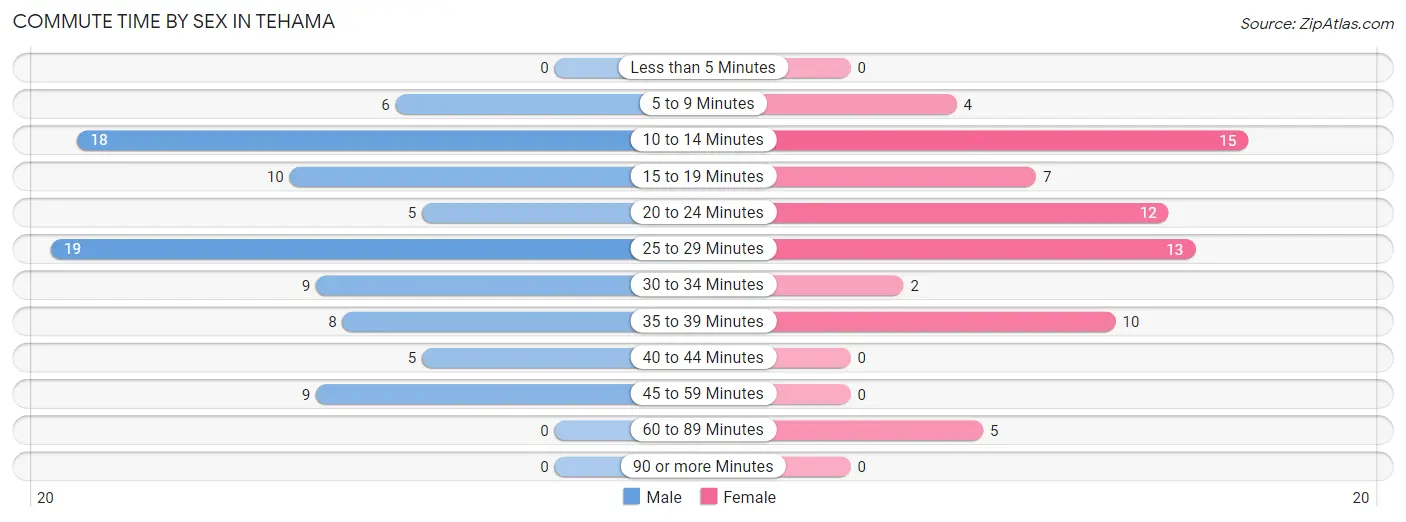
| Commute Time | Male | Female |
| Less than 5 Minutes | 0 (0.0%) | 0 (0.0%) |
| 5 to 9 Minutes | 6 (6.7%) | 4 (5.9%) |
| 10 to 14 Minutes | 18 (20.2%) | 15 (22.1%) |
| 15 to 19 Minutes | 10 (11.2%) | 7 (10.3%) |
| 20 to 24 Minutes | 5 (5.6%) | 12 (17.6%) |
| 25 to 29 Minutes | 19 (21.3%) | 13 (19.1%) |
| 30 to 34 Minutes | 9 (10.1%) | 2 (2.9%) |
| 35 to 39 Minutes | 8 (9.0%) | 10 (14.7%) |
| 40 to 44 Minutes | 5 (5.6%) | 0 (0.0%) |
| 45 to 59 Minutes | 9 (10.1%) | 0 (0.0%) |
| 60 to 89 Minutes | 0 (0.0%) | 5 (7.3%) |
| 90 or more Minutes | 0 (0.0%) | 0 (0.0%) |
Time of Departure to Work by Sex in Tehama
The most frequent times of departure to work in Tehama are 7:30 AM to 7:59 AM (27, 30.3%) for males and 6:30 AM to 6:59 AM (19, 27.9%) for females.
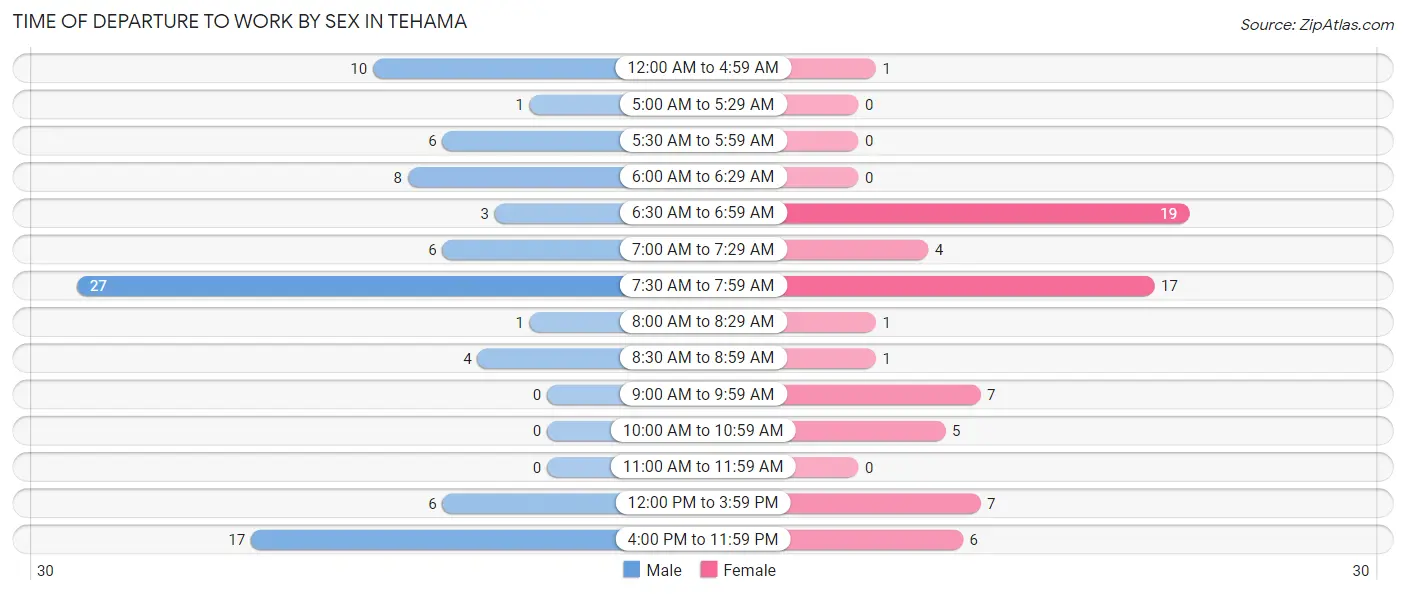
| Time of Departure | Male | Female |
| 12:00 AM to 4:59 AM | 10 (11.2%) | 1 (1.5%) |
| 5:00 AM to 5:29 AM | 1 (1.1%) | 0 (0.0%) |
| 5:30 AM to 5:59 AM | 6 (6.7%) | 0 (0.0%) |
| 6:00 AM to 6:29 AM | 8 (9.0%) | 0 (0.0%) |
| 6:30 AM to 6:59 AM | 3 (3.4%) | 19 (27.9%) |
| 7:00 AM to 7:29 AM | 6 (6.7%) | 4 (5.9%) |
| 7:30 AM to 7:59 AM | 27 (30.3%) | 17 (25.0%) |
| 8:00 AM to 8:29 AM | 1 (1.1%) | 1 (1.5%) |
| 8:30 AM to 8:59 AM | 4 (4.5%) | 1 (1.5%) |
| 9:00 AM to 9:59 AM | 0 (0.0%) | 7 (10.3%) |
| 10:00 AM to 10:59 AM | 0 (0.0%) | 5 (7.3%) |
| 11:00 AM to 11:59 AM | 0 (0.0%) | 0 (0.0%) |
| 12:00 PM to 3:59 PM | 6 (6.7%) | 7 (10.3%) |
| 4:00 PM to 11:59 PM | 17 (19.1%) | 6 (8.8%) |
| Total | 89 (100.0%) | 68 (100.0%) |
Housing Occupancy in Tehama
Occupancy by Ownership in Tehama
Of the total 202 dwellings in Tehama, owner-occupied units account for 137 (67.8%), while renter-occupied units make up 65 (32.2%).
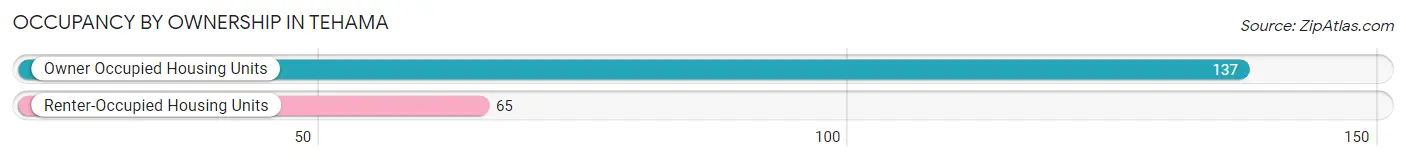
| Occupancy | # Housing Units | % Housing Units |
| Owner Occupied Housing Units | 137 | 67.8% |
| Renter-Occupied Housing Units | 65 | 32.2% |
| Total Occupied Housing Units | 202 | 100.0% |
Occupancy by Household Size in Tehama
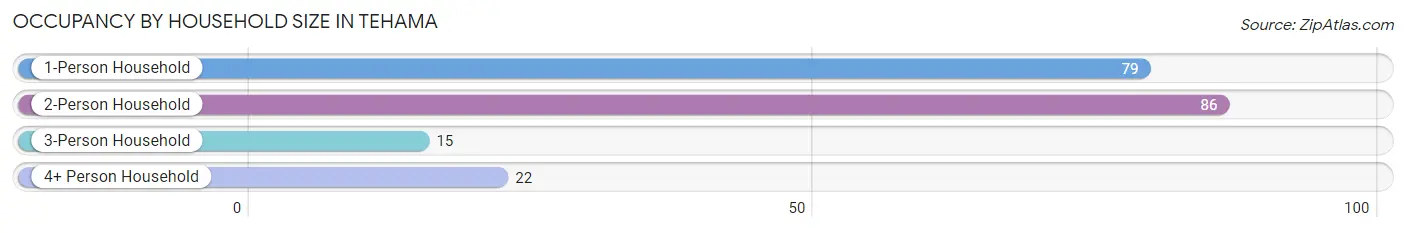
| Household Size | # Housing Units | % Housing Units |
| 1-Person Household | 79 | 39.1% |
| 2-Person Household | 86 | 42.6% |
| 3-Person Household | 15 | 7.4% |
| 4+ Person Household | 22 | 10.9% |
| Total Housing Units | 202 | 100.0% |
Occupancy by Ownership by Household Size in Tehama
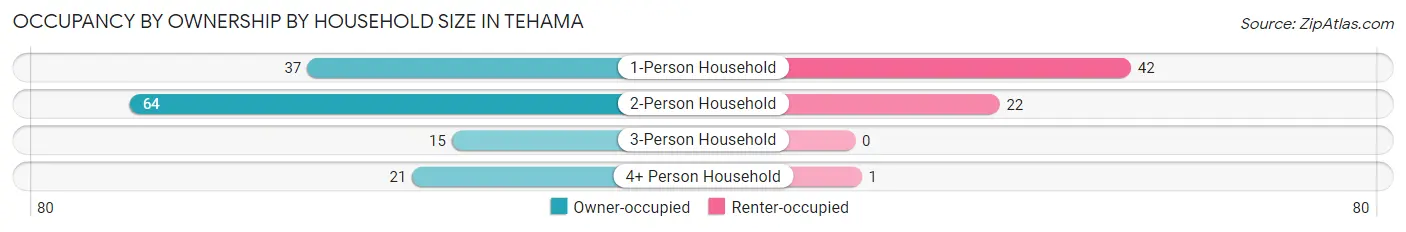
| Household Size | Owner-occupied | Renter-occupied |
| 1-Person Household | 37 (46.8%) | 42 (53.2%) |
| 2-Person Household | 64 (74.4%) | 22 (25.6%) |
| 3-Person Household | 15 (100.0%) | 0 (0.0%) |
| 4+ Person Household | 21 (95.5%) | 1 (4.5%) |
| Total Housing Units | 137 (67.8%) | 65 (32.2%) |
Occupancy by Educational Attainment in Tehama
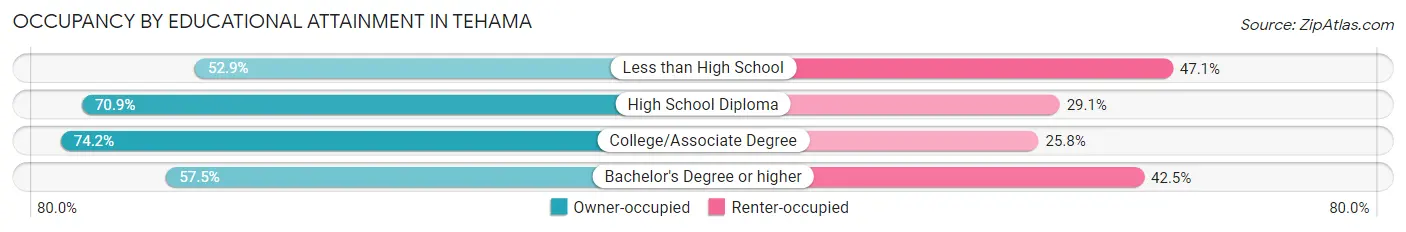
| Household Size | Owner-occupied | Renter-occupied |
| Less than High School | 9 (52.9%) | 8 (47.1%) |
| High School Diploma | 56 (70.9%) | 23 (29.1%) |
| College/Associate Degree | 49 (74.2%) | 17 (25.8%) |
| Bachelor's Degree or higher | 23 (57.5%) | 17 (42.5%) |
Occupancy by Age of Householder in Tehama
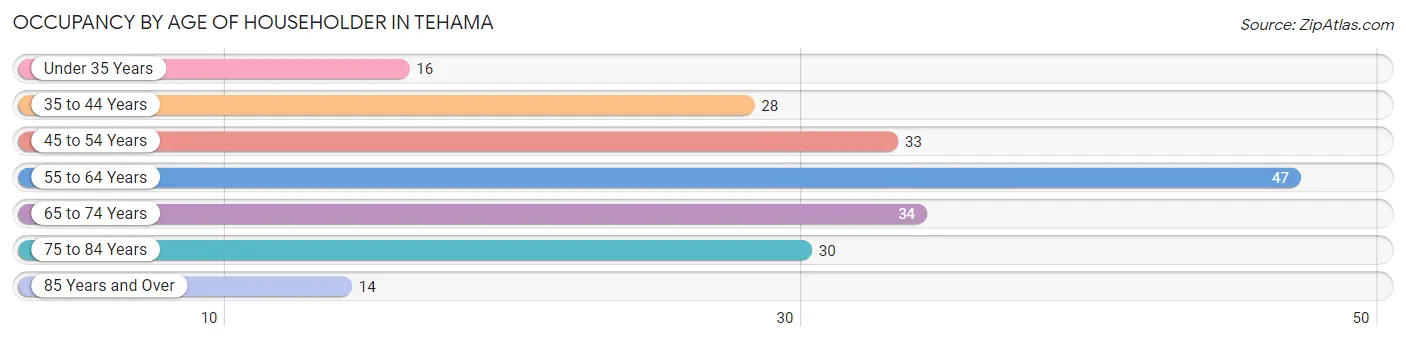
| Age Bracket | # Households | % Households |
| Under 35 Years | 16 | 7.9% |
| 35 to 44 Years | 28 | 13.9% |
| 45 to 54 Years | 33 | 16.3% |
| 55 to 64 Years | 47 | 23.3% |
| 65 to 74 Years | 34 | 16.8% |
| 75 to 84 Years | 30 | 14.8% |
| 85 Years and Over | 14 | 6.9% |
| Total | 202 | 100.0% |
Housing Finances in Tehama
Median Income by Occupancy in Tehama
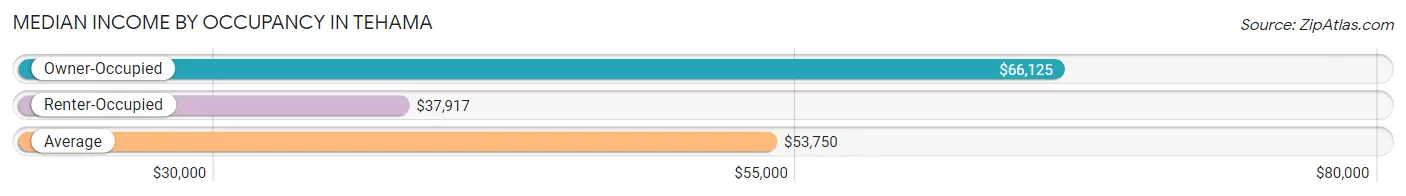
| Occupancy Type | # Households | Median Income |
| Owner-Occupied | 137 (67.8%) | $66,125 |
| Renter-Occupied | 65 (32.2%) | $37,917 |
| Average | 202 (100.0%) | $53,750 |
Occupancy by Householder Income Bracket in Tehama
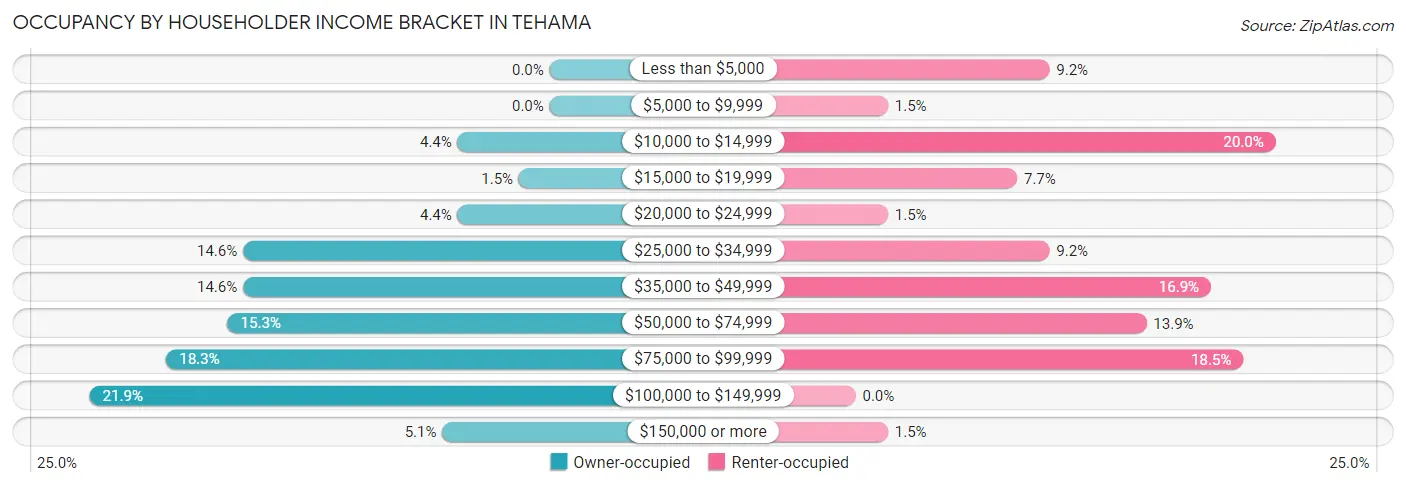
| Income Bracket | Owner-occupied | Renter-occupied |
| Less than $5,000 | 0 (0.0%) | 6 (9.2%) |
| $5,000 to $9,999 | 0 (0.0%) | 1 (1.5%) |
| $10,000 to $14,999 | 6 (4.4%) | 13 (20.0%) |
| $15,000 to $19,999 | 2 (1.5%) | 5 (7.7%) |
| $20,000 to $24,999 | 6 (4.4%) | 1 (1.5%) |
| $25,000 to $34,999 | 20 (14.6%) | 6 (9.2%) |
| $35,000 to $49,999 | 20 (14.6%) | 11 (16.9%) |
| $50,000 to $74,999 | 21 (15.3%) | 9 (13.9%) |
| $75,000 to $99,999 | 25 (18.2%) | 12 (18.5%) |
| $100,000 to $149,999 | 30 (21.9%) | 0 (0.0%) |
| $150,000 or more | 7 (5.1%) | 1 (1.5%) |
| Total | 137 (100.0%) | 65 (100.0%) |
Monthly Housing Cost Tiers in Tehama
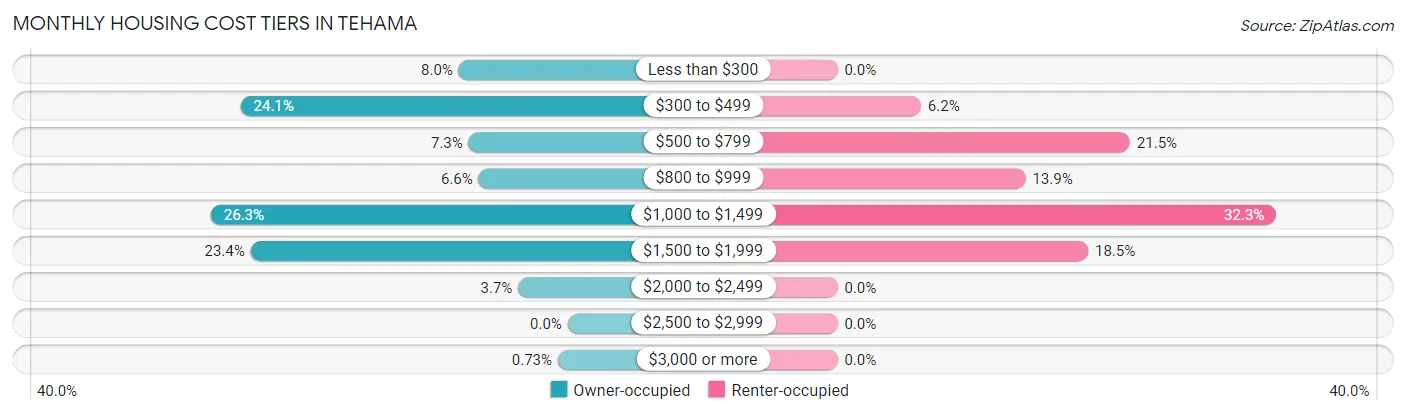
| Monthly Cost | Owner-occupied | Renter-occupied |
| Less than $300 | 11 (8.0%) | 0 (0.0%) |
| $300 to $499 | 33 (24.1%) | 4 (6.1%) |
| $500 to $799 | 10 (7.3%) | 14 (21.5%) |
| $800 to $999 | 9 (6.6%) | 9 (13.9%) |
| $1,000 to $1,499 | 36 (26.3%) | 21 (32.3%) |
| $1,500 to $1,999 | 32 (23.4%) | 12 (18.5%) |
| $2,000 to $2,499 | 5 (3.6%) | 0 (0.0%) |
| $2,500 to $2,999 | 0 (0.0%) | 0 (0.0%) |
| $3,000 or more | 1 (0.7%) | 0 (0.0%) |
| Total | 137 (100.0%) | 65 (100.0%) |
Physical Housing Characteristics in Tehama
Housing Structures in Tehama
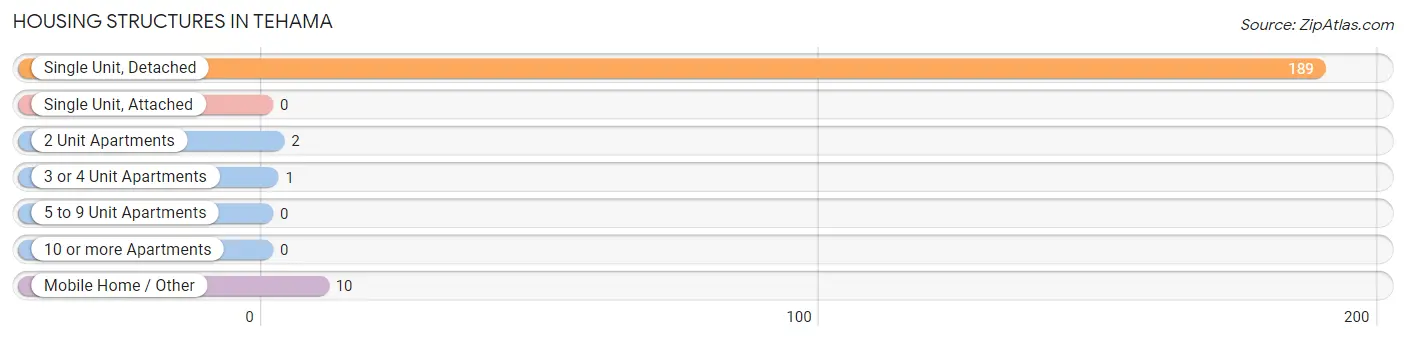
| Structure Type | # Housing Units | % Housing Units |
| Single Unit, Detached | 189 | 93.6% |
| Single Unit, Attached | 0 | 0.0% |
| 2 Unit Apartments | 2 | 1.0% |
| 3 or 4 Unit Apartments | 1 | 0.5% |
| 5 to 9 Unit Apartments | 0 | 0.0% |
| 10 or more Apartments | 0 | 0.0% |
| Mobile Home / Other | 10 | 5.0% |
| Total | 202 | 100.0% |
Housing Structures by Occupancy in Tehama
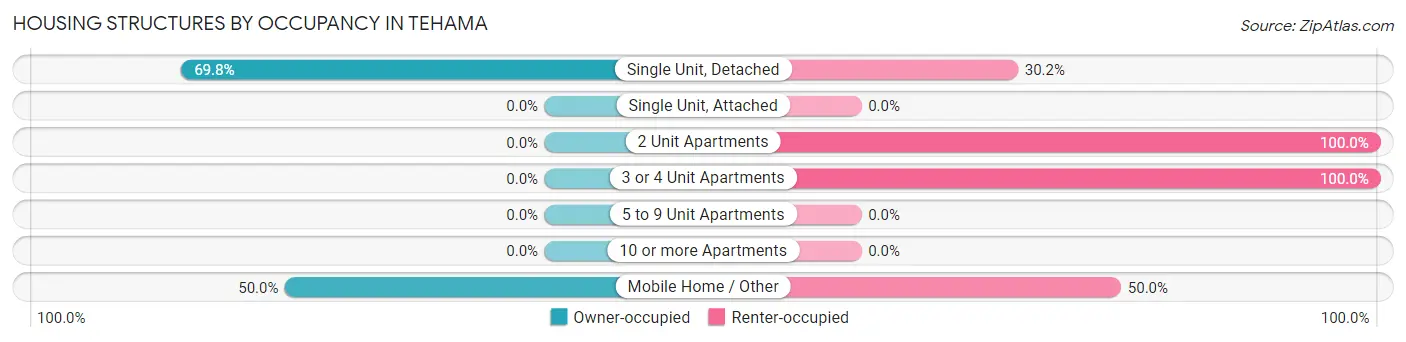
| Structure Type | Owner-occupied | Renter-occupied |
| Single Unit, Detached | 132 (69.8%) | 57 (30.2%) |
| Single Unit, Attached | 0 (0.0%) | 0 (0.0%) |
| 2 Unit Apartments | 0 (0.0%) | 2 (100.0%) |
| 3 or 4 Unit Apartments | 0 (0.0%) | 1 (100.0%) |
| 5 to 9 Unit Apartments | 0 (0.0%) | 0 (0.0%) |
| 10 or more Apartments | 0 (0.0%) | 0 (0.0%) |
| Mobile Home / Other | 5 (50.0%) | 5 (50.0%) |
| Total | 137 (67.8%) | 65 (32.2%) |
Housing Structures by Number of Rooms in Tehama
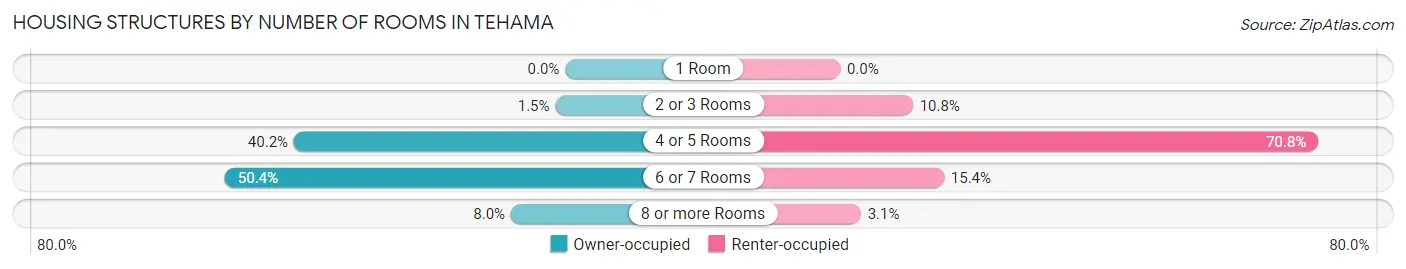
| Number of Rooms | Owner-occupied | Renter-occupied |
| 1 Room | 0 (0.0%) | 0 (0.0%) |
| 2 or 3 Rooms | 2 (1.5%) | 7 (10.8%) |
| 4 or 5 Rooms | 55 (40.2%) | 46 (70.8%) |
| 6 or 7 Rooms | 69 (50.4%) | 10 (15.4%) |
| 8 or more Rooms | 11 (8.0%) | 2 (3.1%) |
| Total | 137 (100.0%) | 65 (100.0%) |
Housing Structure by Heating Type in Tehama
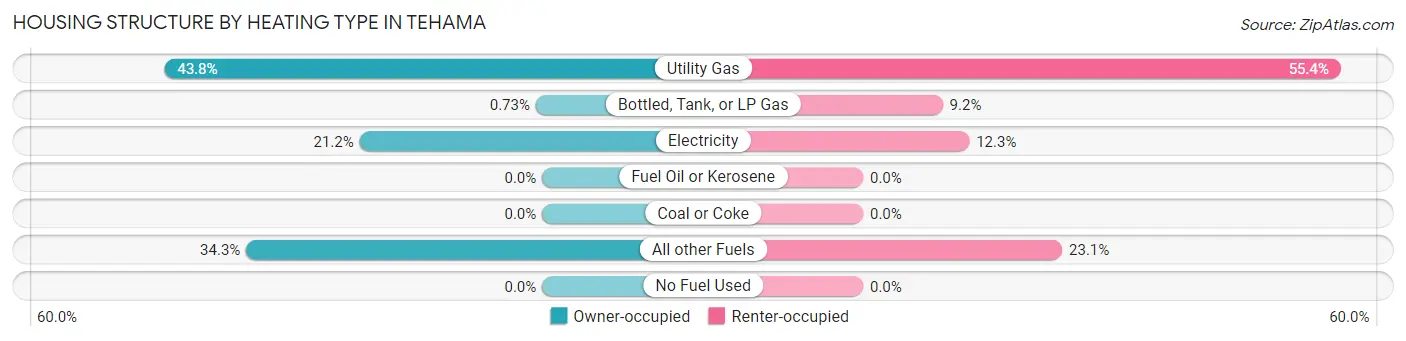
| Heating Type | Owner-occupied | Renter-occupied |
| Utility Gas | 60 (43.8%) | 36 (55.4%) |
| Bottled, Tank, or LP Gas | 1 (0.7%) | 6 (9.2%) |
| Electricity | 29 (21.2%) | 8 (12.3%) |
| Fuel Oil or Kerosene | 0 (0.0%) | 0 (0.0%) |
| Coal or Coke | 0 (0.0%) | 0 (0.0%) |
| All other Fuels | 47 (34.3%) | 15 (23.1%) |
| No Fuel Used | 0 (0.0%) | 0 (0.0%) |
| Total | 137 (100.0%) | 65 (100.0%) |
Household Vehicle Usage in Tehama
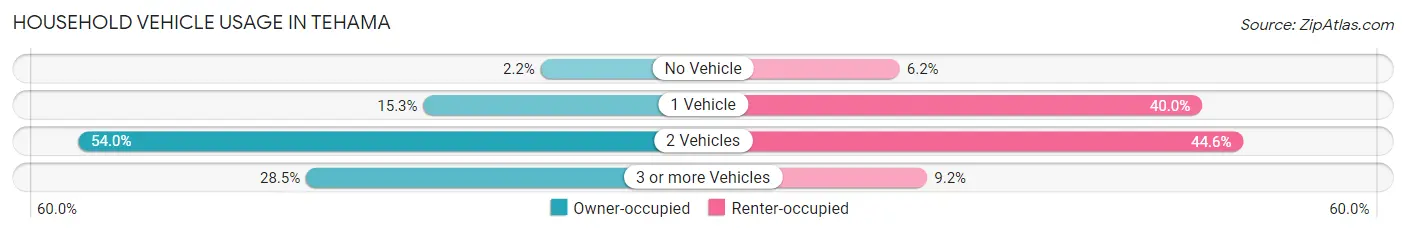
| Vehicles per Household | Owner-occupied | Renter-occupied |
| No Vehicle | 3 (2.2%) | 4 (6.1%) |
| 1 Vehicle | 21 (15.3%) | 26 (40.0%) |
| 2 Vehicles | 74 (54.0%) | 29 (44.6%) |
| 3 or more Vehicles | 39 (28.5%) | 6 (9.2%) |
| Total | 137 (100.0%) | 65 (100.0%) |
Real Estate & Mortgages in Tehama
Real Estate and Mortgage Overview in Tehama
| Characteristic | Without Mortgage | With Mortgage |
| Housing Units | 52 | 85 |
| Median Property Value | $270,000 | $234,200 |
| Median Household Income | $42,500 | $3 |
| Monthly Housing Costs | $386 | $1 |
| Real Estate Taxes | $1,719 | $0 |
Property Value by Mortgage Status in Tehama
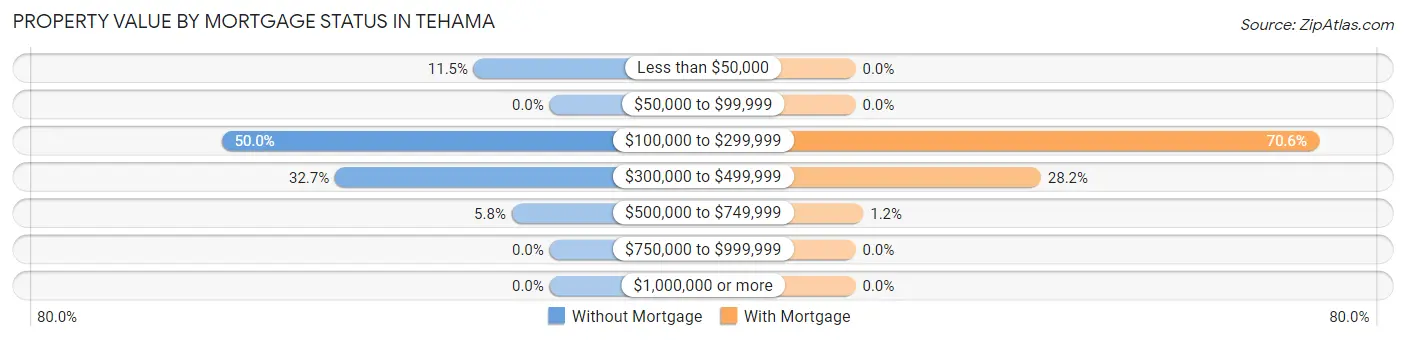
| Property Value | Without Mortgage | With Mortgage |
| Less than $50,000 | 6 (11.5%) | 0 (0.0%) |
| $50,000 to $99,999 | 0 (0.0%) | 0 (0.0%) |
| $100,000 to $299,999 | 26 (50.0%) | 60 (70.6%) |
| $300,000 to $499,999 | 17 (32.7%) | 24 (28.2%) |
| $500,000 to $749,999 | 3 (5.8%) | 1 (1.2%) |
| $750,000 to $999,999 | 0 (0.0%) | 0 (0.0%) |
| $1,000,000 or more | 0 (0.0%) | 0 (0.0%) |
| Total | 52 (100.0%) | 85 (100.0%) |
Household Income by Mortgage Status in Tehama
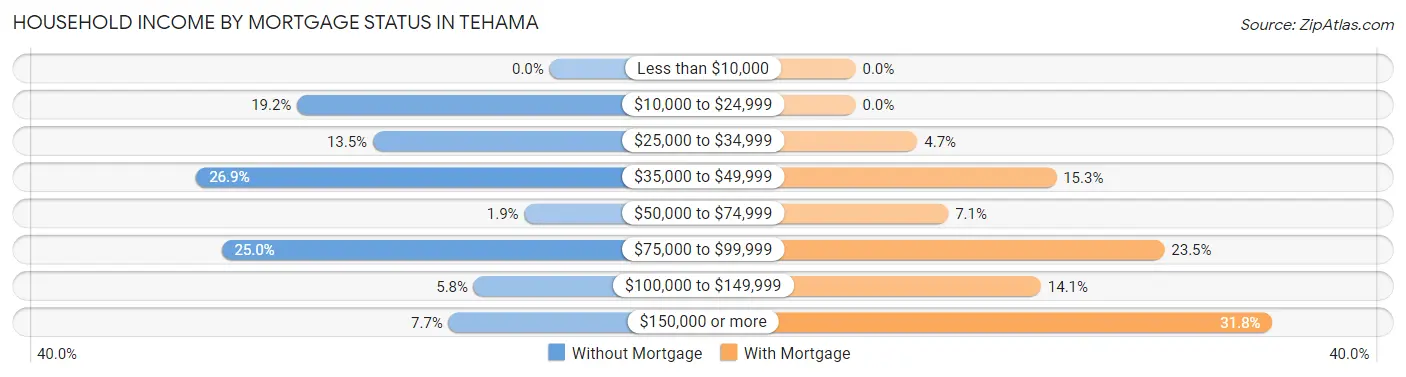
| Household Income | Without Mortgage | With Mortgage |
| Less than $10,000 | 0 (0.0%) | 0 (0.0%) |
| $10,000 to $24,999 | 10 (19.2%) | 0 (0.0%) |
| $25,000 to $34,999 | 7 (13.5%) | 4 (4.7%) |
| $35,000 to $49,999 | 14 (26.9%) | 13 (15.3%) |
| $50,000 to $74,999 | 1 (1.9%) | 6 (7.1%) |
| $75,000 to $99,999 | 13 (25.0%) | 20 (23.5%) |
| $100,000 to $149,999 | 3 (5.8%) | 12 (14.1%) |
| $150,000 or more | 4 (7.7%) | 27 (31.8%) |
| Total | 52 (100.0%) | 85 (100.0%) |
Property Value to Household Income Ratio in Tehama
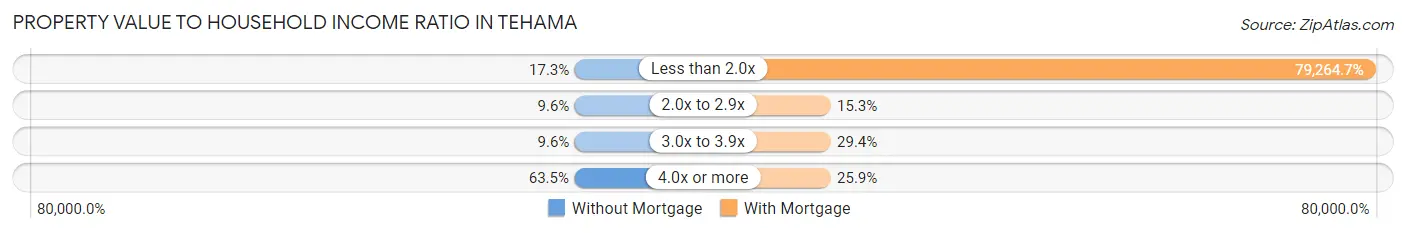
| Value-to-Income Ratio | Without Mortgage | With Mortgage |
| Less than 2.0x | 9 (17.3%) | 67,375 (79,264.7%) |
| 2.0x to 2.9x | 5 (9.6%) | 13 (15.3%) |
| 3.0x to 3.9x | 5 (9.6%) | 25 (29.4%) |
| 4.0x or more | 33 (63.5%) | 22 (25.9%) |
| Total | 52 (100.0%) | 85 (100.0%) |
Real Estate Taxes by Mortgage Status in Tehama
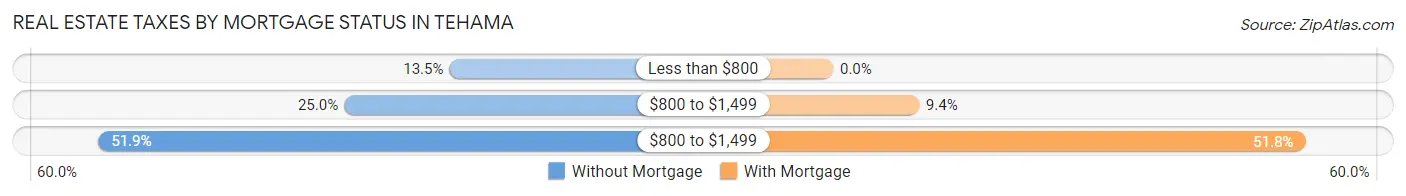
| Property Taxes | Without Mortgage | With Mortgage |
| Less than $800 | 7 (13.5%) | 0 (0.0%) |
| $800 to $1,499 | 13 (25.0%) | 8 (9.4%) |
| $800 to $1,499 | 27 (51.9%) | 44 (51.8%) |
| Total | 52 (100.0%) | 85 (100.0%) |
Health & Disability in Tehama
Health Insurance Coverage by Age in Tehama
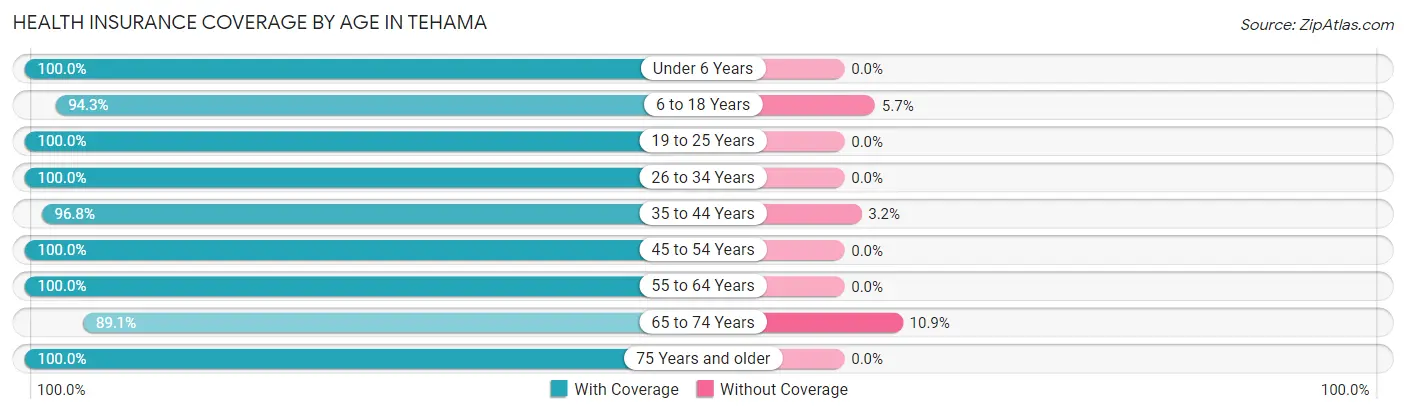
| Age Bracket | With Coverage | Without Coverage |
| Under 6 Years | 13 (100.0%) | 0 (0.0%) |
| 6 to 18 Years | 66 (94.3%) | 4 (5.7%) |
| 19 to 25 Years | 13 (100.0%) | 0 (0.0%) |
| 26 to 34 Years | 23 (100.0%) | 0 (0.0%) |
| 35 to 44 Years | 61 (96.8%) | 2 (3.2%) |
| 45 to 54 Years | 57 (100.0%) | 0 (0.0%) |
| 55 to 64 Years | 83 (100.0%) | 0 (0.0%) |
| 65 to 74 Years | 41 (89.1%) | 5 (10.9%) |
| 75 Years and older | 53 (100.0%) | 0 (0.0%) |
| Total | 410 (97.4%) | 11 (2.6%) |
Health Insurance Coverage by Citizenship Status in Tehama
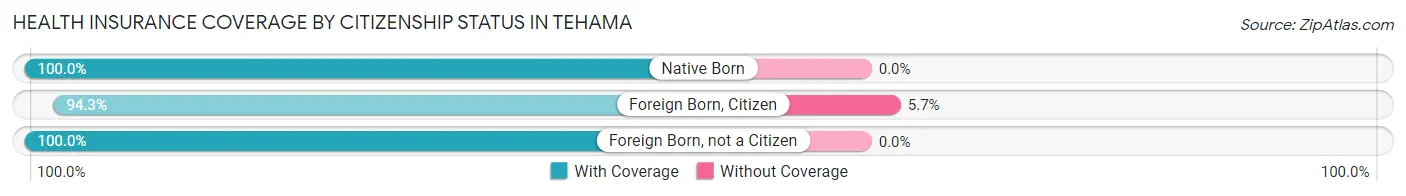
| Citizenship Status | With Coverage | Without Coverage |
| Native Born | 13 (100.0%) | 0 (0.0%) |
| Foreign Born, Citizen | 66 (94.3%) | 4 (5.7%) |
| Foreign Born, not a Citizen | 13 (100.0%) | 0 (0.0%) |
Health Insurance Coverage by Household Income in Tehama
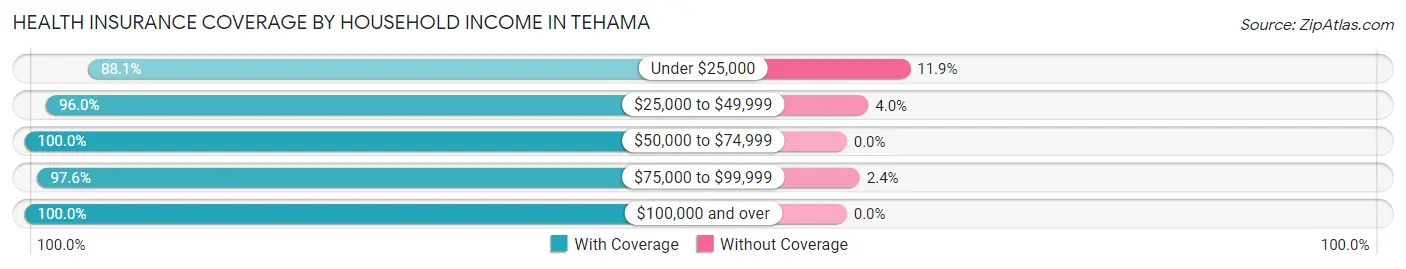
| Household Income | With Coverage | Without Coverage |
| Under $25,000 | 37 (88.1%) | 5 (11.9%) |
| $25,000 to $49,999 | 95 (96.0%) | 4 (4.0%) |
| $50,000 to $74,999 | 58 (100.0%) | 0 (0.0%) |
| $75,000 to $99,999 | 80 (97.6%) | 2 (2.4%) |
| $100,000 and over | 140 (100.0%) | 0 (0.0%) |
Public vs Private Health Insurance Coverage by Age in Tehama
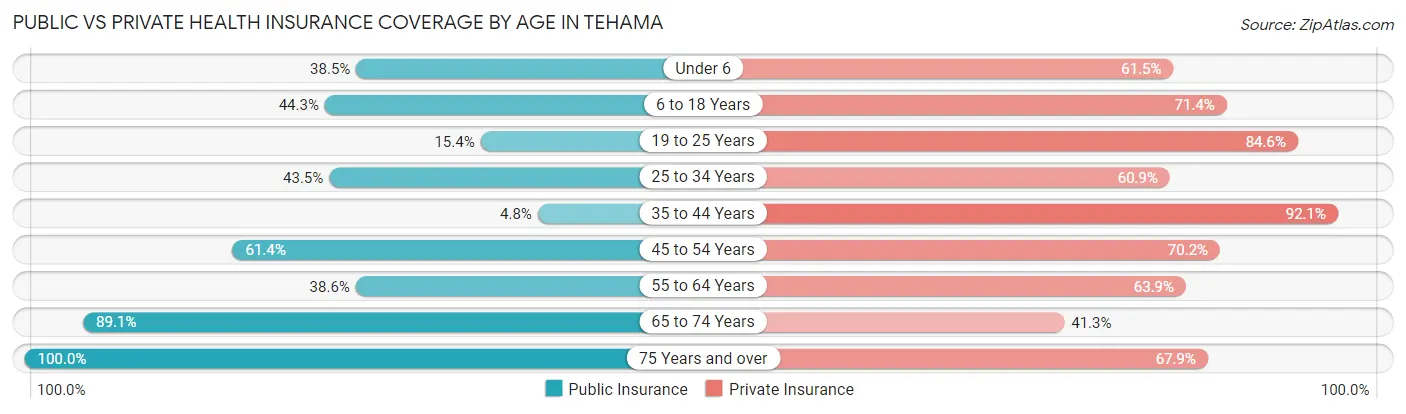
| Age Bracket | Public Insurance | Private Insurance |
| Under 6 | 5 (38.5%) | 8 (61.5%) |
| 6 to 18 Years | 31 (44.3%) | 50 (71.4%) |
| 19 to 25 Years | 2 (15.4%) | 11 (84.6%) |
| 25 to 34 Years | 10 (43.5%) | 14 (60.9%) |
| 35 to 44 Years | 3 (4.8%) | 58 (92.1%) |
| 45 to 54 Years | 35 (61.4%) | 40 (70.2%) |
| 55 to 64 Years | 32 (38.6%) | 53 (63.9%) |
| 65 to 74 Years | 41 (89.1%) | 19 (41.3%) |
| 75 Years and over | 53 (100.0%) | 36 (67.9%) |
| Total | 212 (50.4%) | 289 (68.6%) |
Disability Status by Sex by Age in Tehama
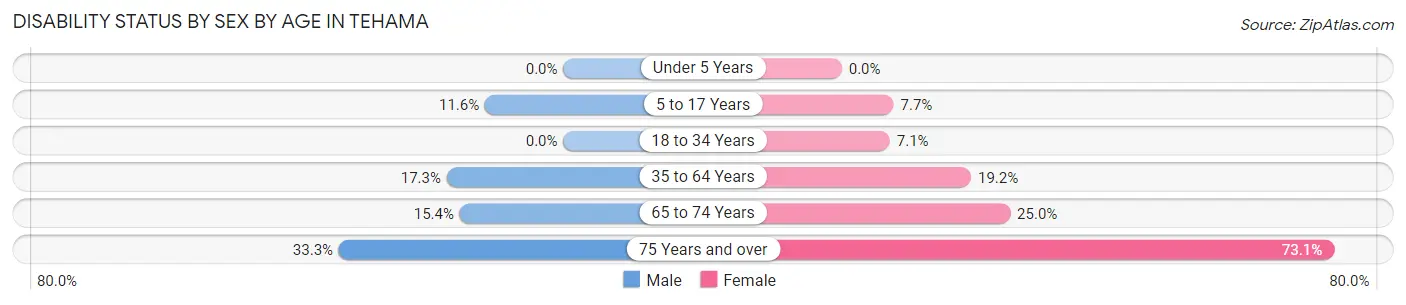
| Age Bracket | Male | Female |
| Under 5 Years | 0 (0.0%) | 0 (0.0%) |
| 5 to 17 Years | 5 (11.6%) | 2 (7.7%) |
| 18 to 34 Years | 0 (0.0%) | 2 (7.1%) |
| 35 to 64 Years | 18 (17.3%) | 19 (19.2%) |
| 65 to 74 Years | 4 (15.4%) | 5 (25.0%) |
| 75 Years and over | 9 (33.3%) | 19 (73.1%) |
Disability Class by Sex by Age in Tehama
Disability Class: Hearing Difficulty
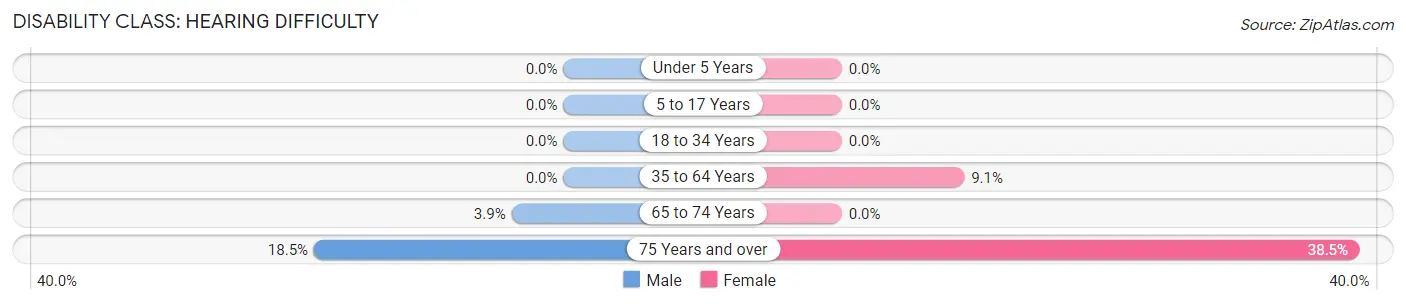
| Age Bracket | Male | Female |
| Under 5 Years | 0 (0.0%) | 0 (0.0%) |
| 5 to 17 Years | 0 (0.0%) | 0 (0.0%) |
| 18 to 34 Years | 0 (0.0%) | 0 (0.0%) |
| 35 to 64 Years | 0 (0.0%) | 9 (9.1%) |
| 65 to 74 Years | 1 (3.8%) | 0 (0.0%) |
| 75 Years and over | 5 (18.5%) | 10 (38.5%) |
Disability Class: Vision Difficulty
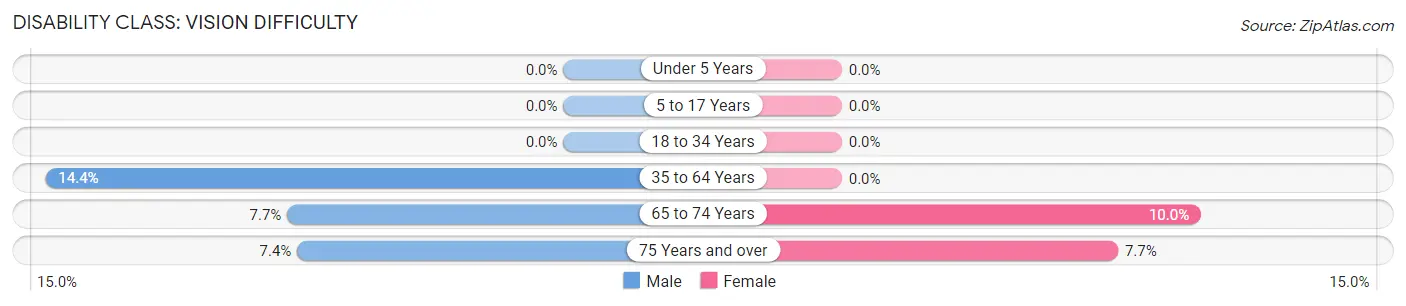
| Age Bracket | Male | Female |
| Under 5 Years | 0 (0.0%) | 0 (0.0%) |
| 5 to 17 Years | 0 (0.0%) | 0 (0.0%) |
| 18 to 34 Years | 0 (0.0%) | 0 (0.0%) |
| 35 to 64 Years | 15 (14.4%) | 0 (0.0%) |
| 65 to 74 Years | 2 (7.7%) | 2 (10.0%) |
| 75 Years and over | 2 (7.4%) | 2 (7.7%) |
Disability Class: Cognitive Difficulty
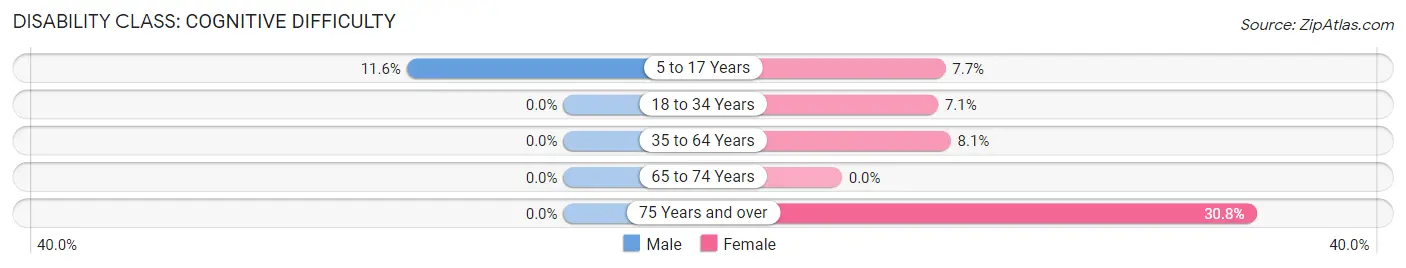
| Age Bracket | Male | Female |
| 5 to 17 Years | 5 (11.6%) | 2 (7.7%) |
| 18 to 34 Years | 0 (0.0%) | 2 (7.1%) |
| 35 to 64 Years | 0 (0.0%) | 8 (8.1%) |
| 65 to 74 Years | 0 (0.0%) | 0 (0.0%) |
| 75 Years and over | 0 (0.0%) | 8 (30.8%) |
Disability Class: Ambulatory Difficulty
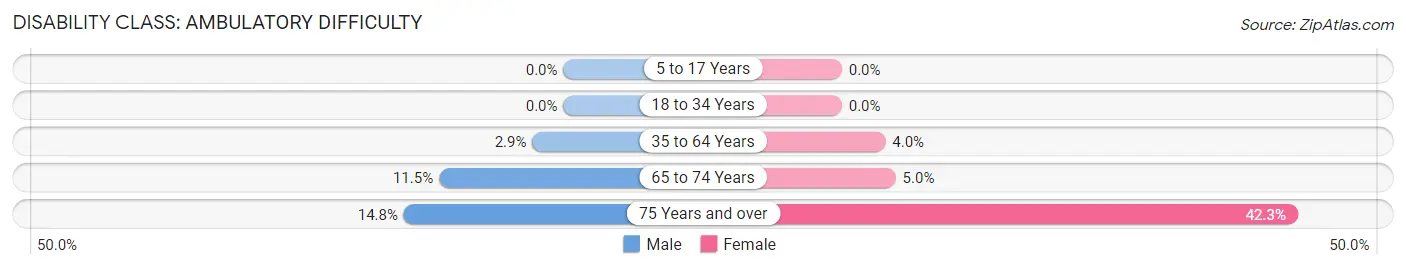
| Age Bracket | Male | Female |
| 5 to 17 Years | 0 (0.0%) | 0 (0.0%) |
| 18 to 34 Years | 0 (0.0%) | 0 (0.0%) |
| 35 to 64 Years | 3 (2.9%) | 4 (4.0%) |
| 65 to 74 Years | 3 (11.5%) | 1 (5.0%) |
| 75 Years and over | 4 (14.8%) | 11 (42.3%) |
Disability Class: Self-Care Difficulty
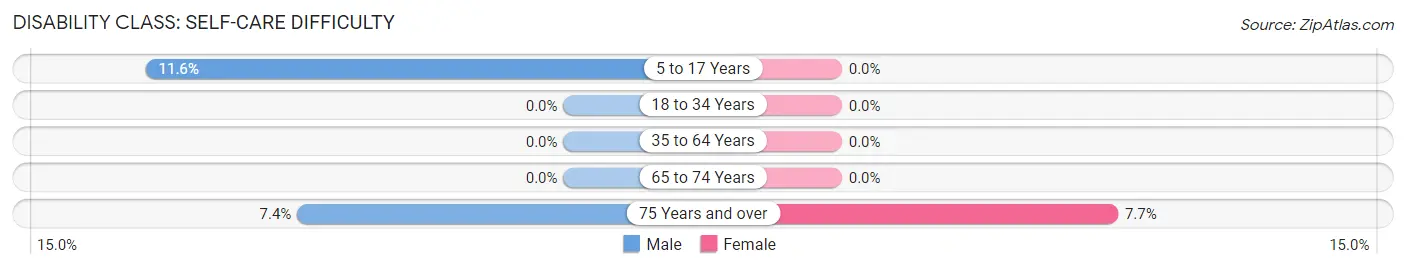
| Age Bracket | Male | Female |
| 5 to 17 Years | 5 (11.6%) | 0 (0.0%) |
| 18 to 34 Years | 0 (0.0%) | 0 (0.0%) |
| 35 to 64 Years | 0 (0.0%) | 0 (0.0%) |
| 65 to 74 Years | 0 (0.0%) | 0 (0.0%) |
| 75 Years and over | 2 (7.4%) | 2 (7.7%) |
Technology Access in Tehama
Computing Device Access in Tehama
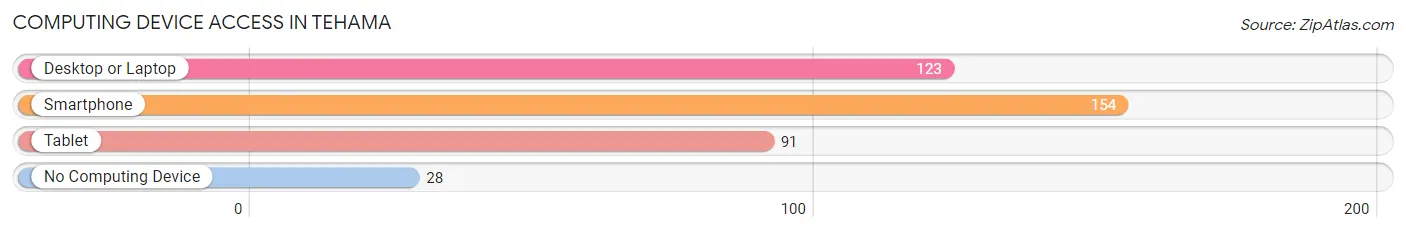
| Device Type | # Households | % Households |
| Desktop or Laptop | 123 | 60.9% |
| Smartphone | 154 | 76.2% |
| Tablet | 91 | 45.1% |
| No Computing Device | 28 | 13.9% |
| Total | 202 | 100.0% |
Internet Access in Tehama
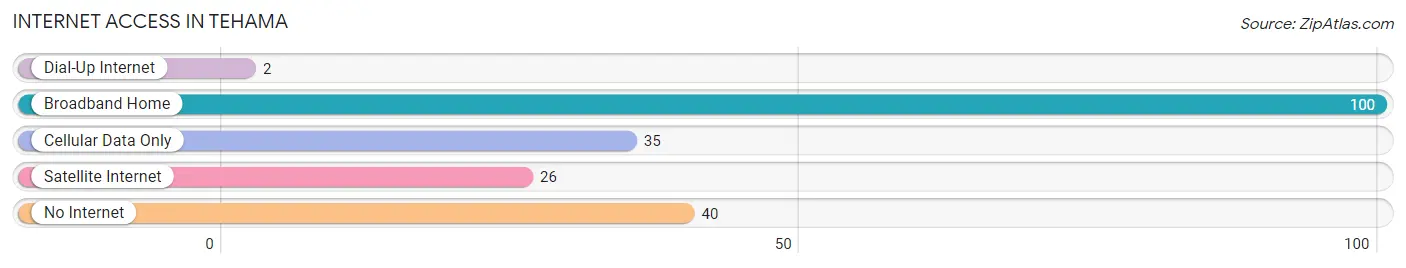
| Internet Type | # Households | % Households |
| Dial-Up Internet | 2 | 1.0% |
| Broadband Home | 100 | 49.5% |
| Cellular Data Only | 35 | 17.3% |
| Satellite Internet | 26 | 12.9% |
| No Internet | 40 | 19.8% |
| Total | 202 | 100.0% |
Tehama Summary
Tehama is a small city located in the northern part of California, in the United States. It is situated in the northern part of the Sacramento Valley, and is the county seat of Tehama County. The city is located about halfway between Red Bluff and Corning, and is about an hour and a half drive from the state capital of Sacramento. Tehama is a rural community with a population of about 4,000 people, and is known for its agricultural production and outdoor recreation.
History
The area that is now Tehama was originally inhabited by the Nomlaki people, who were part of the Wintun tribe. The Nomlaki people lived in the area for thousands of years before the arrival of European settlers. The first Europeans to settle in the area were Spanish missionaries, who established a mission in the area in 1817. The mission was abandoned in 1834, and the area was later settled by American settlers in the 1850s. The town of Tehama was founded in 1856, and was named after the Nomlaki word for “abundance”.
The town grew slowly, and by the early 1900s, it had a population of about 500 people. The town was incorporated in 1912, and the population had grown to about 1,000 people by the 1920s. The population continued to grow slowly, and by the 2000 census, the population had grown to about 4,000 people.
Geography
Tehama is located in the northern part of the Sacramento Valley, in the northern part of California. The city is situated at an elevation of about 500 feet above sea level, and is located about halfway between Red Bluff and Corning. The city is located about an hour and a half drive from the state capital of Sacramento.
The city is located in a rural area, and is surrounded by rolling hills and farmland. The city is located near the Sacramento River, and is also close to the Sacramento-San Joaquin Delta. The climate in Tehama is mild, with hot summers and cool winters.
Economy
The economy of Tehama is largely based on agriculture. The city is located in an area that is known for its production of walnuts, almonds, and other crops. The city is also home to several wineries, and is a popular destination for wine tasting.
The city is also home to several manufacturing companies, including a factory that produces plastic products. The city is also home to several retail stores, restaurants, and other businesses.
Demographics
As of the 2010 census, the population of Tehama was 4,005. The population is largely white, with about 75% of the population being white. The city is also home to a small Hispanic population, with about 10% of the population being Hispanic. The city is also home to a small African American population, with about 2% of the population being African American. The median household income in Tehama is about $45,000, and the median home value is about $200,000.
Common Questions
What is Per Capita Income in Tehama?
Per Capita income in Tehama is $34,469.
What is the Median Family Income in Tehama?
Median Family Income in Tehama is $81,250.
What is the Median Household income in Tehama?
Median Household Income in Tehama is $53,750.
What is Income or Wage Gap in Tehama?
Income or Wage Gap in Tehama is 16.2%.
Women in Tehama earn 83.8 cents for every dollar earned by a man.
What is Inequality or Gini Index in Tehama?
Inequality or Gini Index in Tehama is 0.42.
What is the Total Population of Tehama?
Total Population of Tehama is 421.
What is the Total Male Population of Tehama?
Total Male Population of Tehama is 218.
What is the Total Female Population of Tehama?
Total Female Population of Tehama is 203.
What is the Ratio of Males per 100 Females in Tehama?
There are 107.39 Males per 100 Females in Tehama.
What is the Ratio of Females per 100 Males in Tehama?
There are 93.12 Females per 100 Males in Tehama.
What is the Median Population Age in Tehama?
Median Population Age in Tehama is 49.6 Years.
What is the Average Family Size in Tehama
Average Family Size in Tehama is 2.8 People.
What is the Average Household Size in Tehama
Average Household Size in Tehama is 2.1 People.
How Large is the Labor Force in Tehama?
There are 181 People in the Labor Forcein in Tehama.
What is the Percentage of People in the Labor Force in Tehama?
52.5% of People are in the Labor Force in Tehama.
What is the Unemployment Rate in Tehama?
Unemployment Rate in Tehama is 1.1%.