Tahoma, CA Map & Demographics
Tahoma Map
Tahoma Overview
$52,532
PER CAPITA INCOME
$115,278
AVG FAMILY INCOME
$83,971
AVG HOUSEHOLD INCOME
44.2%
WAGE / INCOME GAP [ % ]
55.8¢/ $1
WAGE / INCOME GAP [ $ ]
0.48
INEQUALITY / GINI INDEX
1,071
TOTAL POPULATION
634
MALE POPULATION
437
FEMALE POPULATION
145.08
MALES / 100 FEMALES
68.93
FEMALES / 100 MALES
39.3
MEDIAN AGE
2.6
AVG FAMILY SIZE
2.2
AVG HOUSEHOLD SIZE
713
LABOR FORCE [ PEOPLE ]
75.3%
PERCENT IN LABOR FORCE
3.9%
UNEMPLOYMENT RATE
Tahoma Zip Codes
Income in Tahoma
Income Overview in Tahoma
Per Capita Income in Tahoma is $52,532, while median incomes of families and households are $115,278 and $83,971 respectively.
| Characteristic | Number | Measure |
| Per Capita Income | 1,071 | $52,532 |
| Median Family Income | 270 | $115,278 |
| Mean Family Income | 270 | $142,036 |
| Median Household Income | 480 | $83,971 |
| Mean Household Income | 480 | $113,912 |
| Income Deficit | 270 | $0 |
| Wage / Income Gap (%) | 1,071 | 44.17% |
| Wage / Income Gap ($) | 1,071 | 55.83¢ per $1 |
| Gini / Inequality Index | 1,071 | 0.48 |
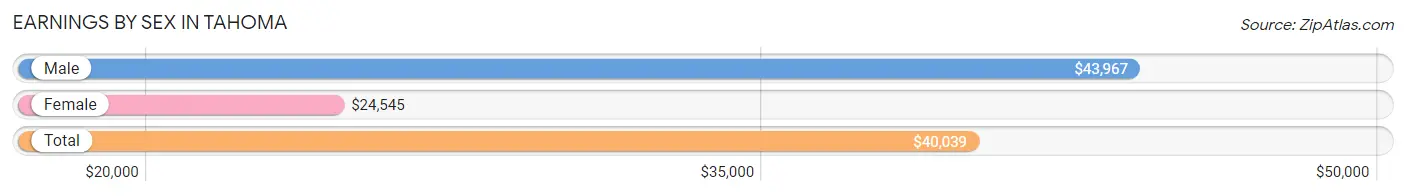
Earnings by Sex in Tahoma
Average Earnings in Tahoma are $40,039, $43,967 for men and $24,545 for women, a difference of 44.2%.
| Sex | Number | Average Earnings |
| Male | 499 (65.1%) | $43,967 |
| Female | 268 (34.9%) | $24,545 |
| Total | 767 (100.0%) | $40,039 |
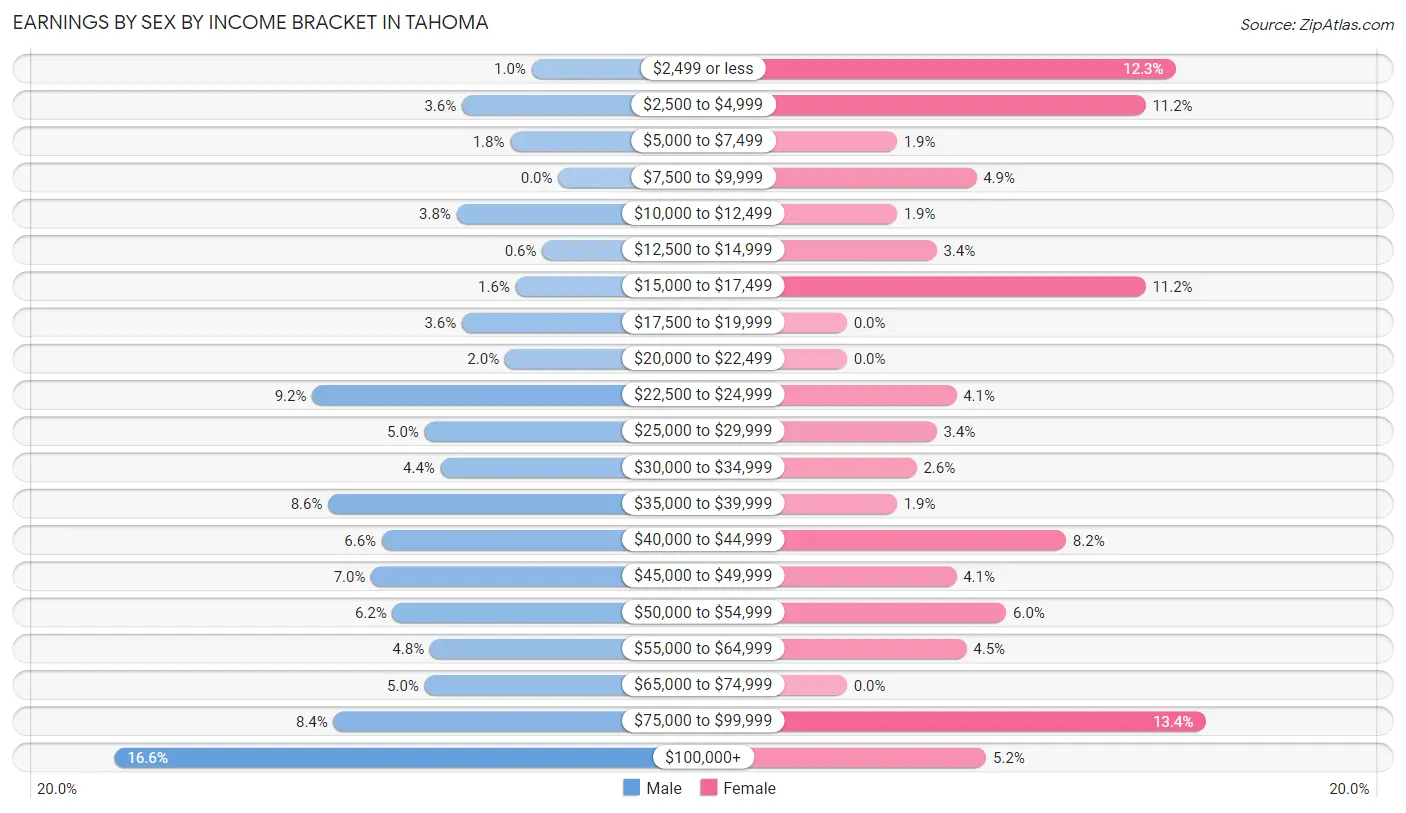
Earnings by Sex by Income Bracket in Tahoma
The most common earnings brackets in Tahoma are $100,000+ for men (83 | 16.6%) and $75,000 to $99,999 for women (36 | 13.4%).
| Income | Male | Female |
| $2,499 or less | 5 (1.0%) | 33 (12.3%) |
| $2,500 to $4,999 | 18 (3.6%) | 30 (11.2%) |
| $5,000 to $7,499 | 9 (1.8%) | 5 (1.9%) |
| $7,500 to $9,999 | 0 (0.0%) | 13 (4.9%) |
| $10,000 to $12,499 | 19 (3.8%) | 5 (1.9%) |
| $12,500 to $14,999 | 3 (0.6%) | 9 (3.4%) |
| $15,000 to $17,499 | 8 (1.6%) | 30 (11.2%) |
| $17,500 to $19,999 | 18 (3.6%) | 0 (0.0%) |
| $20,000 to $22,499 | 10 (2.0%) | 0 (0.0%) |
| $22,500 to $24,999 | 46 (9.2%) | 11 (4.1%) |
| $25,000 to $29,999 | 25 (5.0%) | 9 (3.4%) |
| $30,000 to $34,999 | 22 (4.4%) | 7 (2.6%) |
| $35,000 to $39,999 | 43 (8.6%) | 5 (1.9%) |
| $40,000 to $44,999 | 33 (6.6%) | 22 (8.2%) |
| $45,000 to $49,999 | 35 (7.0%) | 11 (4.1%) |
| $50,000 to $54,999 | 31 (6.2%) | 16 (6.0%) |
| $55,000 to $64,999 | 24 (4.8%) | 12 (4.5%) |
| $65,000 to $74,999 | 25 (5.0%) | 0 (0.0%) |
| $75,000 to $99,999 | 42 (8.4%) | 36 (13.4%) |
| $100,000+ | 83 (16.6%) | 14 (5.2%) |
| Total | 499 (100.0%) | 268 (100.0%) |
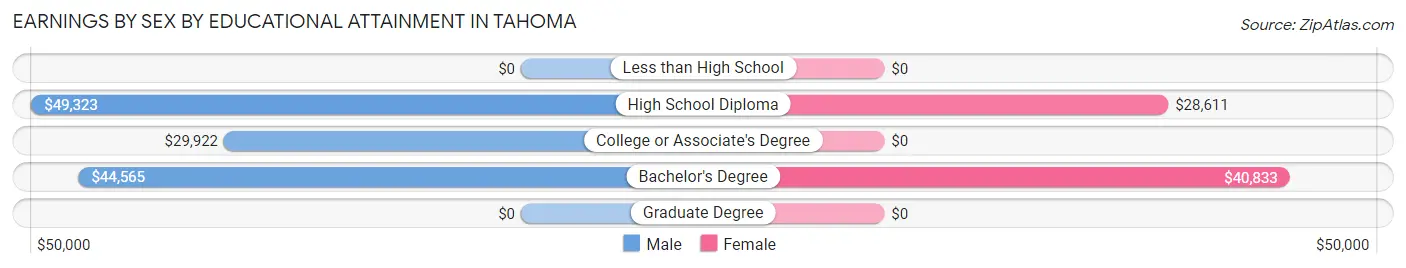
Earnings by Sex by Educational Attainment in Tahoma
Average earnings in Tahoma are $44,076 for men and $32,857 for women, a difference of 25.5%. Men with an educational attainment of high school diploma enjoy the highest average annual earnings of $49,323, while those with college or associate's degree education earn the least with $29,922. Women with an educational attainment of bachelor's degree earn the most with the average annual earnings of $40,833, while those with high school diploma education have the smallest earnings of $28,611.
| Educational Attainment | Male Income | Female Income |
| Less than High School | - | - |
| High School Diploma | $49,323 | $28,611 |
| College or Associate's Degree | $29,922 | $0 |
| Bachelor's Degree | $44,565 | $40,833 |
| Graduate Degree | - | - |
| Total | $44,076 | $32,857 |
Family Income in Tahoma
Family Income Brackets in Tahoma
According to the Tahoma family income data, there are 80 families falling into the $100,000 to $149,999 income range, which is the most common income bracket and makes up 29.6% of all families.
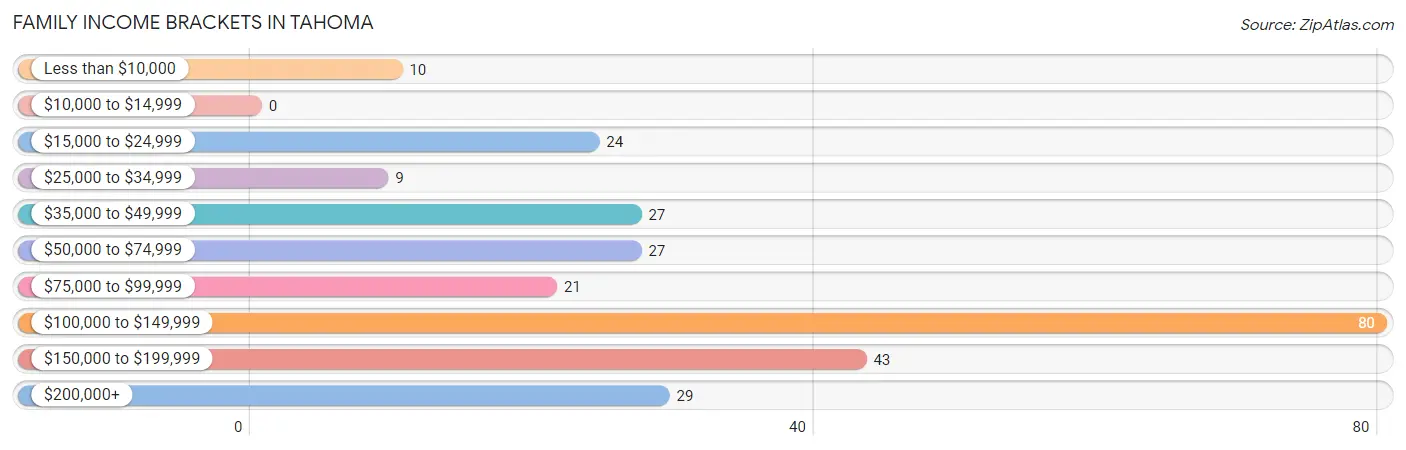
| Income Bracket | # Families | % Families |
| Less than $10,000 | 10 | 3.7% |
| $10,000 to $14,999 | 0 | 0.0% |
| $15,000 to $24,999 | 24 | 8.9% |
| $25,000 to $34,999 | 9 | 3.3% |
| $35,000 to $49,999 | 27 | 10.0% |
| $50,000 to $74,999 | 27 | 10.0% |
| $75,000 to $99,999 | 21 | 7.8% |
| $100,000 to $149,999 | 80 | 29.6% |
| $150,000 to $199,999 | 43 | 15.9% |
| $200,000+ | 29 | 10.7% |
Family Income by Famaliy Size in Tahoma
2-person families (161 | 59.6%) account for the highest median family income in Tahoma with $127,083 per family, while 2-person families (161 | 59.6%) have the highest median income of $63,542 per family member.
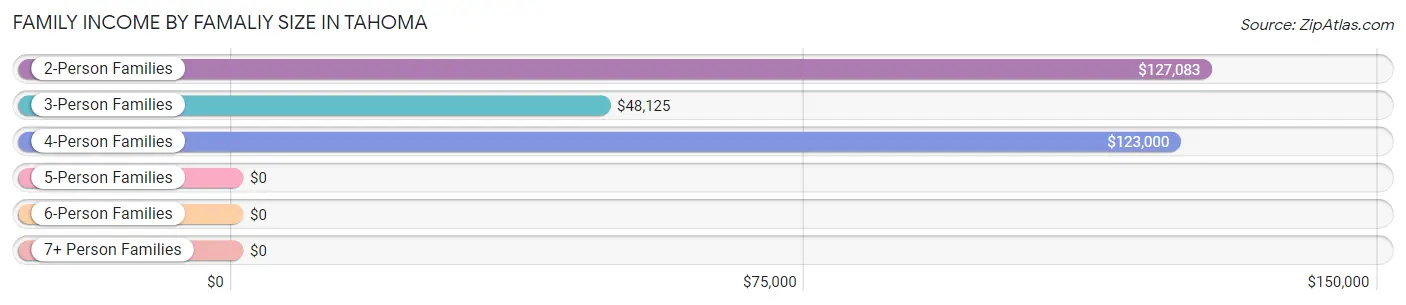
| Income Bracket | # Families | Median Income |
| 2-Person Families | 161 (59.6%) | $127,083 |
| 3-Person Families | 81 (30.0%) | $48,125 |
| 4-Person Families | 28 (10.4%) | $123,000 |
| 5-Person Families | 0 (0.0%) | $0 |
| 6-Person Families | 0 (0.0%) | $0 |
| 7+ Person Families | 0 (0.0%) | $0 |
| Total | 270 (100.0%) | $115,278 |
Family Income by Number of Earners in Tahoma
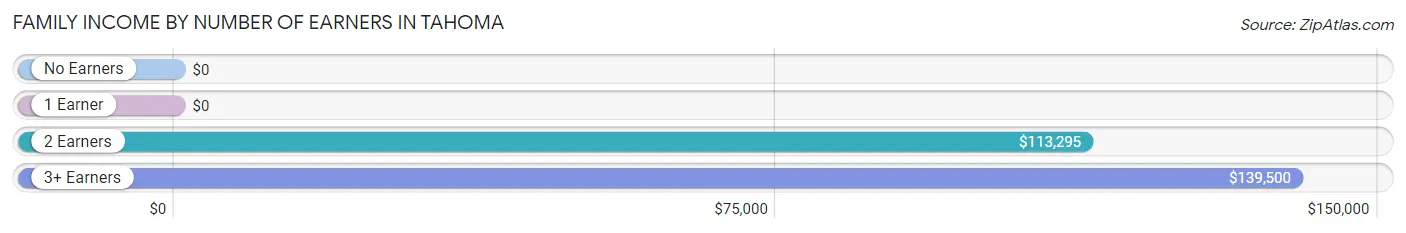
| Number of Earners | # Families | Median Income |
| No Earners | 33 (12.2%) | $0 |
| 1 Earner | 72 (26.7%) | $0 |
| 2 Earners | 139 (51.5%) | $113,295 |
| 3+ Earners | 26 (9.6%) | $139,500 |
| Total | 270 (100.0%) | $115,278 |
Household Income in Tahoma
Household Income Brackets in Tahoma
With 117 households falling in the category, the $100,000 to $149,999 income range is the most frequent in Tahoma, accounting for 24.4% of all households.
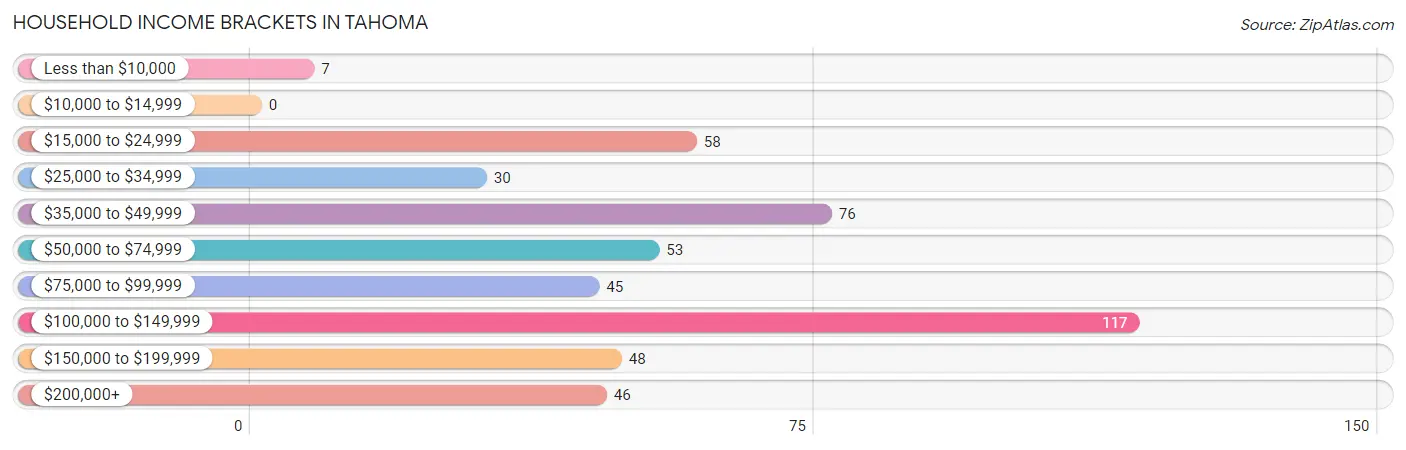
| Income Bracket | # Households | % Households |
| Less than $10,000 | 7 | 1.5% |
| $10,000 to $14,999 | 0 | 0.0% |
| $15,000 to $24,999 | 58 | 12.1% |
| $25,000 to $34,999 | 30 | 6.3% |
| $35,000 to $49,999 | 76 | 15.8% |
| $50,000 to $74,999 | 53 | 11.0% |
| $75,000 to $99,999 | 45 | 9.4% |
| $100,000 to $149,999 | 117 | 24.4% |
| $150,000 to $199,999 | 48 | 10.0% |
| $200,000+ | 46 | 9.6% |
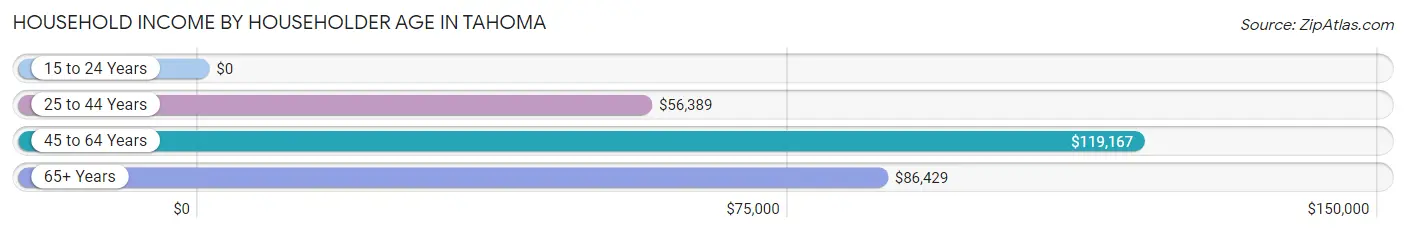
Household Income by Householder Age in Tahoma
The median household income in Tahoma is $83,971, with the highest median household income of $119,167 found in the 45 to 64 years age bracket for the primary householder. A total of 168 households (35.0%) fall into this category. Meanwhile, the 15 to 24 years age bracket for the primary householder has the lowest median household income of $0, with 16 households (3.3%) in this group.
| Income Bracket | # Households | Median Income |
| 15 to 24 Years | 16 (3.3%) | $0 |
| 25 to 44 Years | 176 (36.7%) | $56,389 |
| 45 to 64 Years | 168 (35.0%) | $119,167 |
| 65+ Years | 120 (25.0%) | $86,429 |
| Total | 480 (100.0%) | $83,971 |
Poverty in Tahoma
Income Below Poverty by Sex and Age in Tahoma
With 6.1% poverty level for males and 21.3% for females among the residents of Tahoma, 35 to 44 year old males and under 5 year old females are the most vulnerable to poverty, with 23 males (33.3%) and 34 females (100.0%) in their respective age groups living below the poverty level.
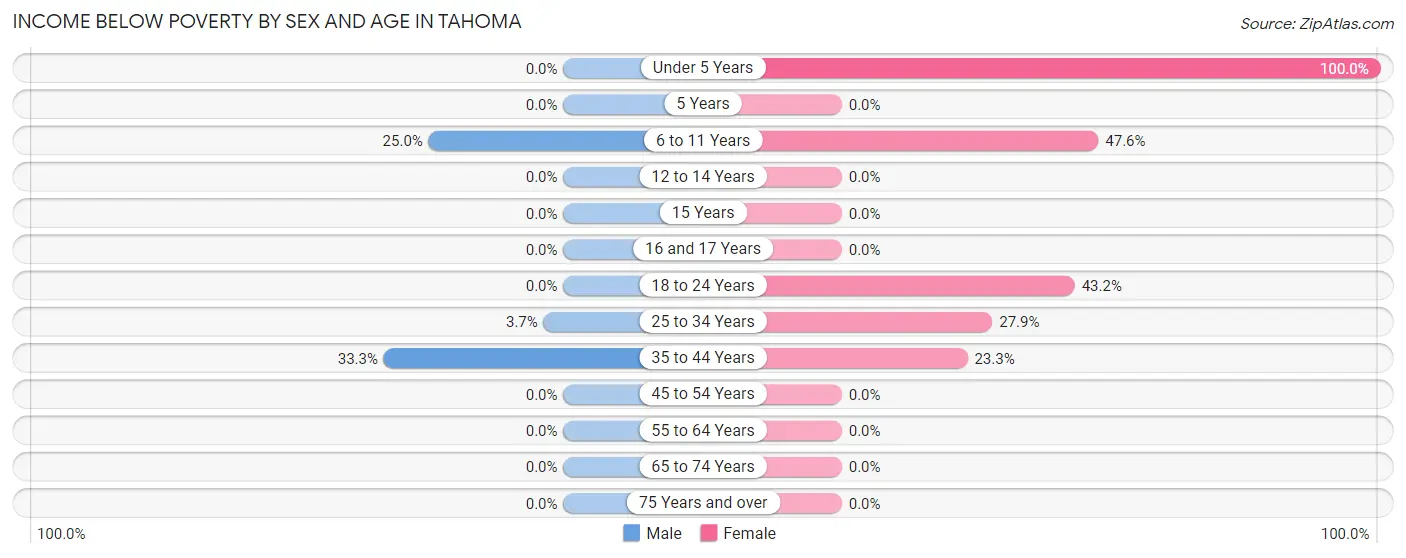
| Age Bracket | Male | Female |
| Under 5 Years | 0 (0.0%) | 34 (100.0%) |
| 5 Years | 0 (0.0%) | 0 (0.0%) |
| 6 to 11 Years | 9 (25.0%) | 10 (47.6%) |
| 12 to 14 Years | 0 (0.0%) | 0 (0.0%) |
| 15 Years | 0 (0.0%) | 0 (0.0%) |
| 16 and 17 Years | 0 (0.0%) | 0 (0.0%) |
| 18 to 24 Years | 0 (0.0%) | 16 (43.2%) |
| 25 to 34 Years | 7 (3.7%) | 19 (27.9%) |
| 35 to 44 Years | 23 (33.3%) | 14 (23.3%) |
| 45 to 54 Years | 0 (0.0%) | 0 (0.0%) |
| 55 to 64 Years | 0 (0.0%) | 0 (0.0%) |
| 65 to 74 Years | 0 (0.0%) | 0 (0.0%) |
| 75 Years and over | 0 (0.0%) | 0 (0.0%) |
| Total | 39 (6.1%) | 93 (21.3%) |
Income Above Poverty by Sex and Age in Tahoma
According to the poverty statistics in Tahoma, males aged under 5 years and females aged 5 years are the age groups that are most secure financially, with 100.0% of males and 100.0% of females in these age groups living above the poverty line.
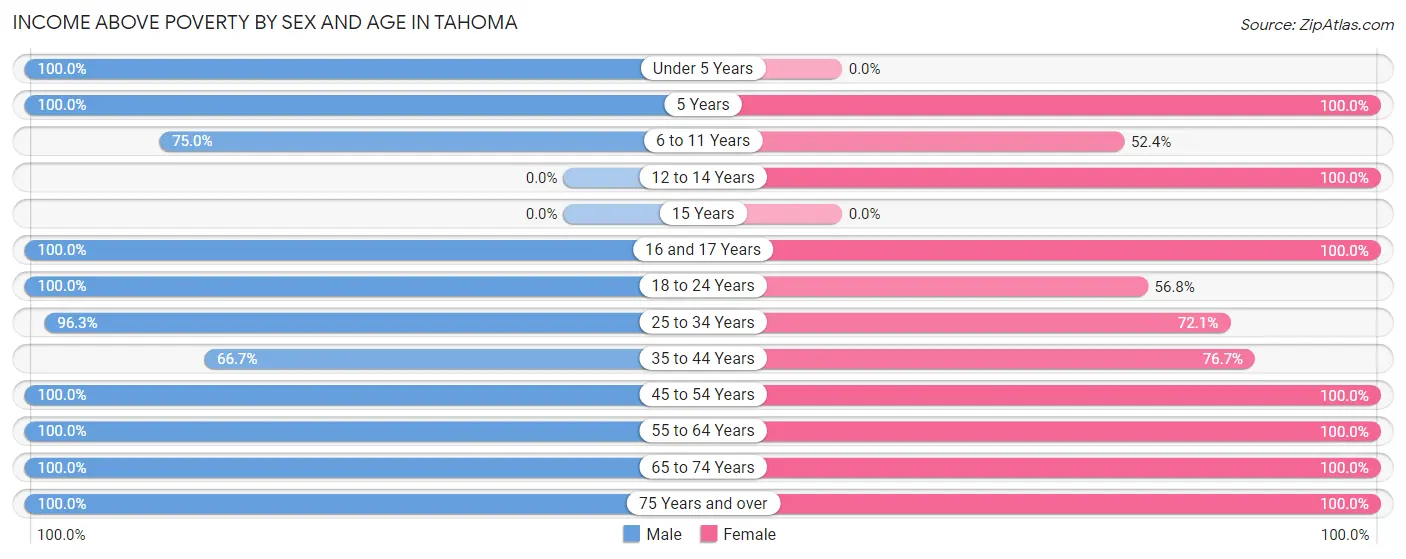
| Age Bracket | Male | Female |
| Under 5 Years | 15 (100.0%) | 0 (0.0%) |
| 5 Years | 6 (100.0%) | 6 (100.0%) |
| 6 to 11 Years | 27 (75.0%) | 11 (52.4%) |
| 12 to 14 Years | 0 (0.0%) | 6 (100.0%) |
| 15 Years | 0 (0.0%) | 0 (0.0%) |
| 16 and 17 Years | 5 (100.0%) | 9 (100.0%) |
| 18 to 24 Years | 50 (100.0%) | 21 (56.8%) |
| 25 to 34 Years | 184 (96.3%) | 49 (72.1%) |
| 35 to 44 Years | 46 (66.7%) | 46 (76.7%) |
| 45 to 54 Years | 126 (100.0%) | 50 (100.0%) |
| 55 to 64 Years | 37 (100.0%) | 73 (100.0%) |
| 65 to 74 Years | 87 (100.0%) | 50 (100.0%) |
| 75 Years and over | 12 (100.0%) | 23 (100.0%) |
| Total | 595 (93.9%) | 344 (78.7%) |
Income Below Poverty Among Married-Couple Families in Tahoma
The poverty statistics for married-couple families in Tahoma show that 6.8% or 14 of the total 206 families live below the poverty line. Families with 1 or 2 children have the highest poverty rate of 27.5%, comprising of 14 families. On the other hand, families with no children have the lowest poverty rate of 0.0%, which includes 0 families.
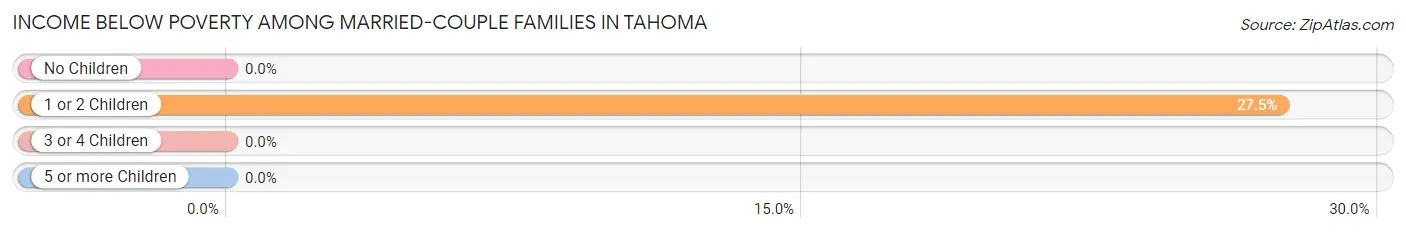
| Children | Above Poverty | Below Poverty |
| No Children | 155 (100.0%) | 0 (0.0%) |
| 1 or 2 Children | 37 (72.6%) | 14 (27.5%) |
| 3 or 4 Children | 0 (0.0%) | 0 (0.0%) |
| 5 or more Children | 0 (0.0%) | 0 (0.0%) |
| Total | 192 (93.2%) | 14 (6.8%) |
Income Below Poverty Among Single-Parent Households in Tahoma
According to the poverty data in Tahoma, 24.4% or 10 single-father households and 43.5% or 10 single-mother households are living below the poverty line. Among single-father households, those with 1 or 2 children have the highest poverty rate, with 10 households (30.3%) experiencing poverty. Likewise, among single-mother households, those with 1 or 2 children have the highest poverty rate, with 10 households (58.8%) falling below the poverty line.
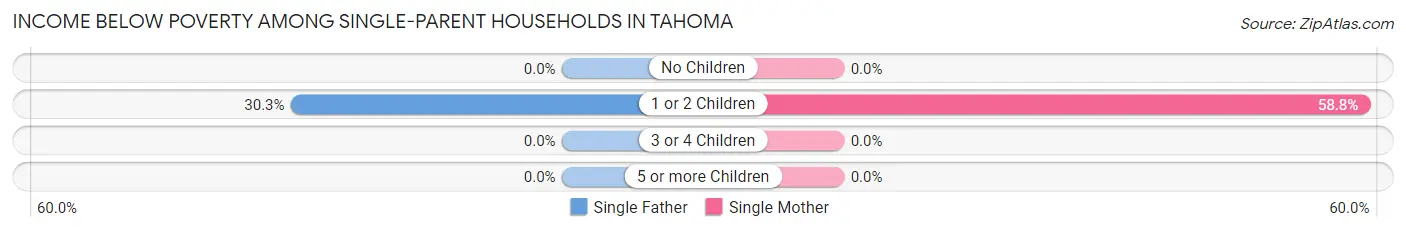
| Children | Single Father | Single Mother |
| No Children | 0 (0.0%) | 0 (0.0%) |
| 1 or 2 Children | 10 (30.3%) | 10 (58.8%) |
| 3 or 4 Children | 0 (0.0%) | 0 (0.0%) |
| 5 or more Children | 0 (0.0%) | 0 (0.0%) |
| Total | 10 (24.4%) | 10 (43.5%) |
Income Below Poverty Among Married-Couple vs Single-Parent Households in Tahoma
The poverty data for Tahoma shows that 14 of the married-couple family households (6.8%) and 20 of the single-parent households (31.2%) are living below the poverty level. Within the married-couple family households, those with 1 or 2 children have the highest poverty rate, with 14 households (27.5%) falling below the poverty line. Among the single-parent households, those with 1 or 2 children have the highest poverty rate, with 20 household (40.0%) living below poverty.
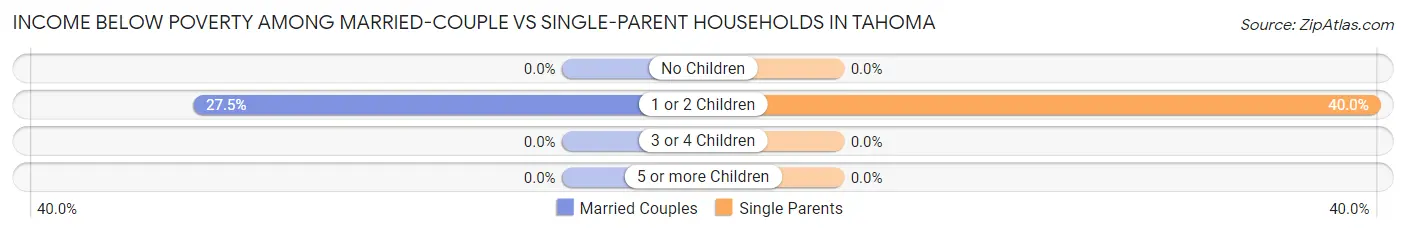
| Children | Married-Couple Families | Single-Parent Households |
| No Children | 0 (0.0%) | 0 (0.0%) |
| 1 or 2 Children | 14 (27.5%) | 20 (40.0%) |
| 3 or 4 Children | 0 (0.0%) | 0 (0.0%) |
| 5 or more Children | 0 (0.0%) | 0 (0.0%) |
| Total | 14 (6.8%) | 20 (31.2%) |
Race in Tahoma
The most populous races in Tahoma are White / Caucasian (1,013 | 94.6%), Hispanic or Latino (31 | 2.9%), and Two or more Races (31 | 2.9%).
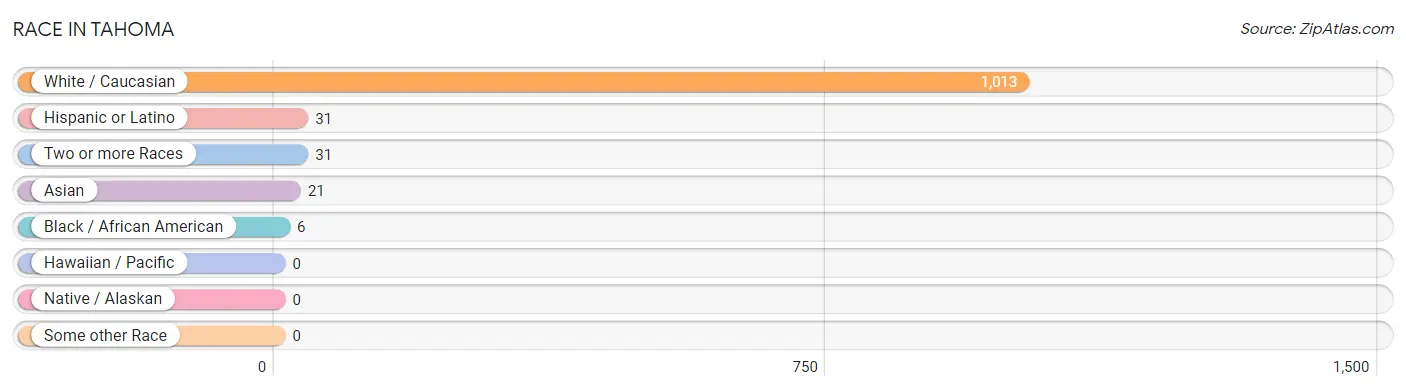
| Race | # Population | % Population |
| Asian | 21 | 2.0% |
| Black / African American | 6 | 0.6% |
| Hawaiian / Pacific | 0 | 0.0% |
| Hispanic or Latino | 31 | 2.9% |
| Native / Alaskan | 0 | 0.0% |
| White / Caucasian | 1,013 | 94.6% |
| Two or more Races | 31 | 2.9% |
| Some other Race | 0 | 0.0% |
| Total | 1,071 | 100.0% |
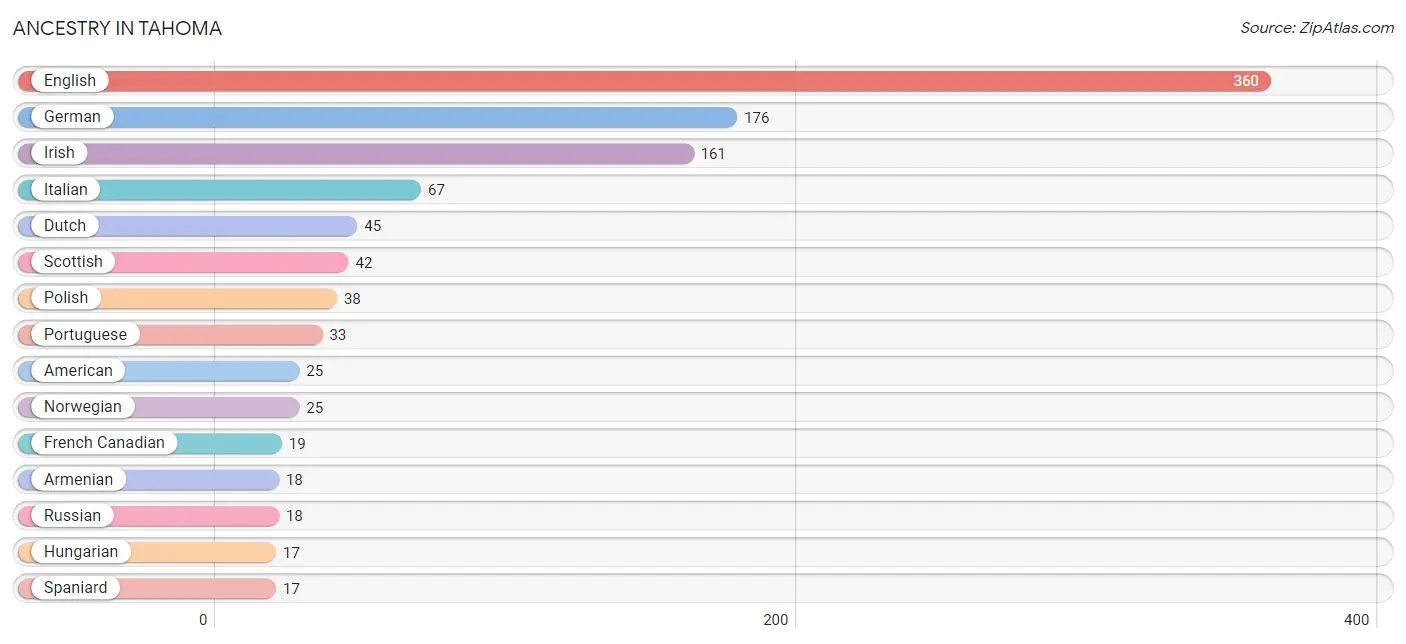
Ancestry in Tahoma
The most populous ancestries reported in Tahoma are English (360 | 33.6%), German (176 | 16.4%), Irish (161 | 15.0%), Italian (67 | 6.3%), and Dutch (45 | 4.2%), together accounting for 75.5% of all Tahoma residents.
| Ancestry | # Population | % Population |
| American | 25 | 2.3% |
| Armenian | 18 | 1.7% |
| Austrian | 13 | 1.2% |
| Bhutanese | 7 | 0.6% |
| Central American | 14 | 1.3% |
| Dutch | 45 | 4.2% |
| English | 360 | 33.6% |
| French | 11 | 1.0% |
| French Canadian | 19 | 1.8% |
| German | 176 | 16.4% |
| Hungarian | 17 | 1.6% |
| Irish | 161 | 15.0% |
| Italian | 67 | 6.3% |
| Northern European | 10 | 0.9% |
| Norwegian | 25 | 2.3% |
| Polish | 38 | 3.5% |
| Portuguese | 33 | 3.1% |
| Russian | 18 | 1.7% |
| Scotch-Irish | 9 | 0.8% |
| Scottish | 42 | 3.9% |
| Slovak | 14 | 1.3% |
| Spaniard | 17 | 1.6% |
| Sri Lankan | 14 | 1.3% |
| Swedish | 17 | 1.6% |
| Swiss | 7 | 0.6% | View All 25 Rows |
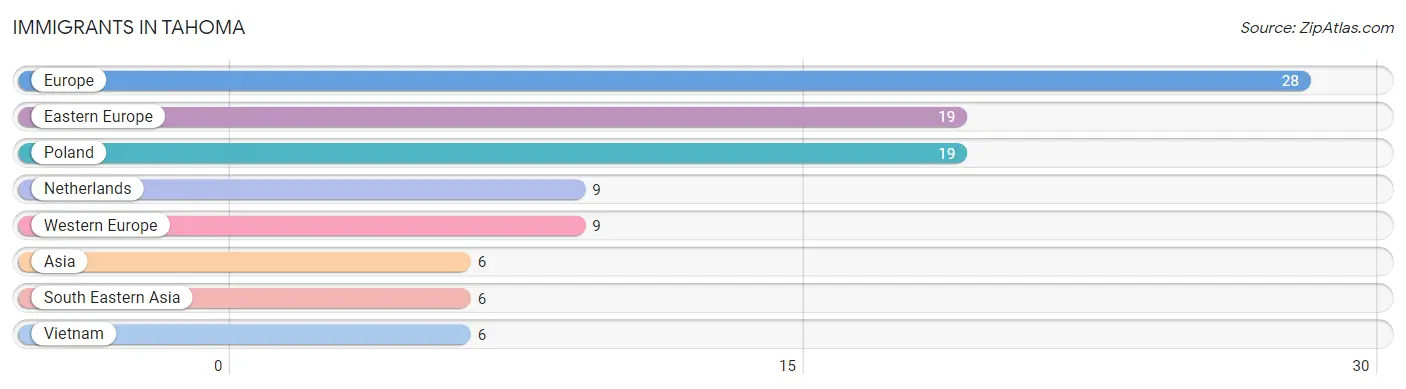
Immigrants in Tahoma
The most numerous immigrant groups reported in Tahoma came from Europe (28 | 2.6%), Eastern Europe (19 | 1.8%), Poland (19 | 1.8%), Netherlands (9 | 0.8%), and Western Europe (9 | 0.8%), together accounting for 7.8% of all Tahoma residents.
| Immigration Origin | # Population | % Population |
| Asia | 6 | 0.6% |
| Eastern Europe | 19 | 1.8% |
| Europe | 28 | 2.6% |
| Netherlands | 9 | 0.8% |
| Poland | 19 | 1.8% |
| South Eastern Asia | 6 | 0.6% |
| Vietnam | 6 | 0.6% |
| Western Europe | 9 | 0.8% | View All 8 Rows |
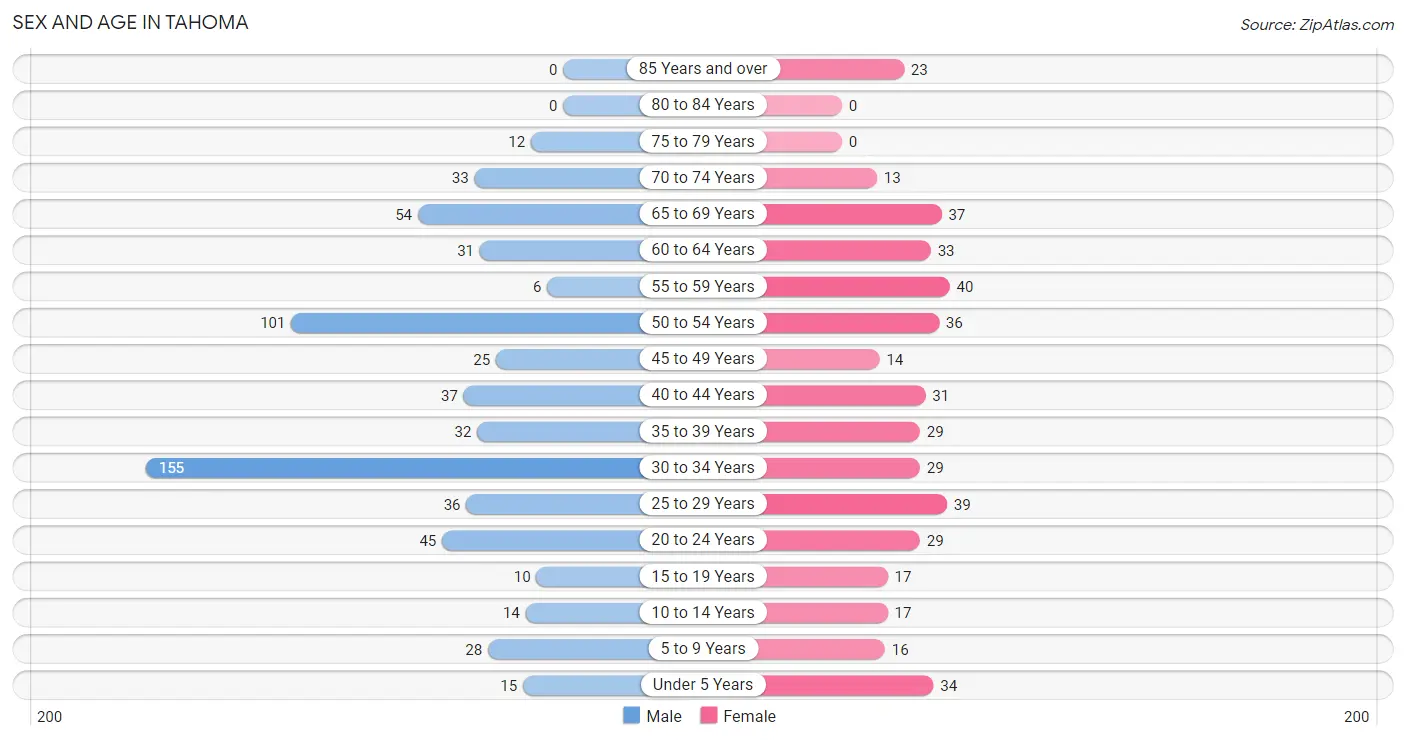
Sex and Age in Tahoma
Sex and Age in Tahoma
The most populous age groups in Tahoma are 30 to 34 Years (155 | 24.4%) for men and 55 to 59 Years (40 | 9.1%) for women.
| Age Bracket | Male | Female |
| Under 5 Years | 15 (2.4%) | 34 (7.8%) |
| 5 to 9 Years | 28 (4.4%) | 16 (3.7%) |
| 10 to 14 Years | 14 (2.2%) | 17 (3.9%) |
| 15 to 19 Years | 10 (1.6%) | 17 (3.9%) |
| 20 to 24 Years | 45 (7.1%) | 29 (6.6%) |
| 25 to 29 Years | 36 (5.7%) | 39 (8.9%) |
| 30 to 34 Years | 155 (24.4%) | 29 (6.6%) |
| 35 to 39 Years | 32 (5.1%) | 29 (6.6%) |
| 40 to 44 Years | 37 (5.8%) | 31 (7.1%) |
| 45 to 49 Years | 25 (3.9%) | 14 (3.2%) |
| 50 to 54 Years | 101 (15.9%) | 36 (8.2%) |
| 55 to 59 Years | 6 (0.9%) | 40 (9.1%) |
| 60 to 64 Years | 31 (4.9%) | 33 (7.5%) |
| 65 to 69 Years | 54 (8.5%) | 37 (8.5%) |
| 70 to 74 Years | 33 (5.2%) | 13 (3.0%) |
| 75 to 79 Years | 12 (1.9%) | 0 (0.0%) |
| 80 to 84 Years | 0 (0.0%) | 0 (0.0%) |
| 85 Years and over | 0 (0.0%) | 23 (5.3%) |
| Total | 634 (100.0%) | 437 (100.0%) |
Families and Households in Tahoma
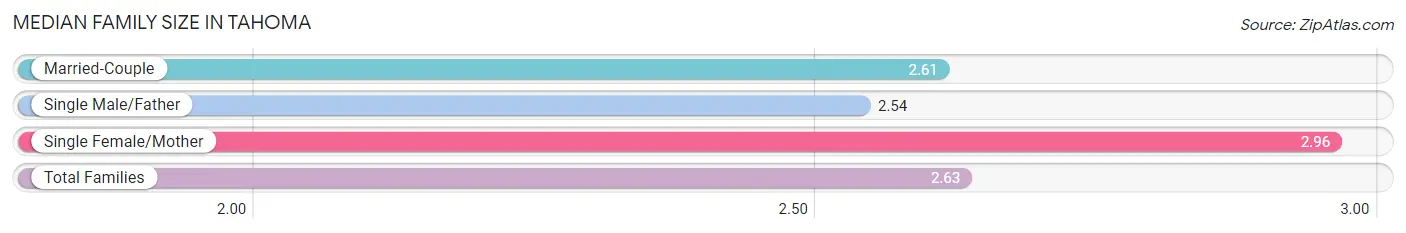
Median Family Size in Tahoma
The median family size in Tahoma is 2.63 persons per family, with single female/mother families (23 | 8.5%) accounting for the largest median family size of 2.96 persons per family. On the other hand, single male/father families (41 | 15.2%) represent the smallest median family size with 2.54 persons per family.
| Family Type | # Families | Family Size |
| Married-Couple | 206 (76.3%) | 2.61 |
| Single Male/Father | 41 (15.2%) | 2.54 |
| Single Female/Mother | 23 (8.5%) | 2.96 |
| Total Families | 270 (100.0%) | 2.63 |
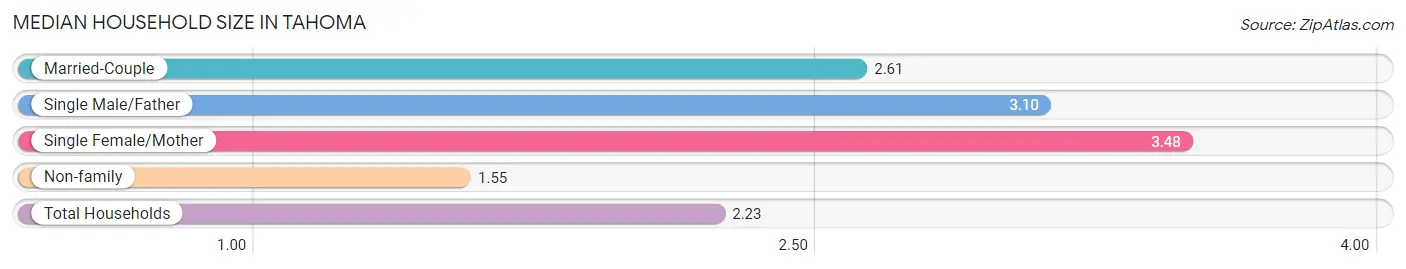
Median Household Size in Tahoma
The median household size in Tahoma is 2.23 persons per household, with single female/mother households (23 | 4.8%) accounting for the largest median household size of 3.48 persons per household. non-family households (210 | 43.8%) represent the smallest median household size with 1.55 persons per household.
| Household Type | # Households | Household Size |
| Married-Couple | 206 (42.9%) | 2.61 |
| Single Male/Father | 41 (8.5%) | 3.10 |
| Single Female/Mother | 23 (4.8%) | 3.48 |
| Non-family | 210 (43.8%) | 1.55 |
| Total Households | 480 (100.0%) | 2.23 |
Household Size by Marriage Status in Tahoma
Out of a total of 480 households in Tahoma, 270 (56.2%) are family households, while 210 (43.8%) are nonfamily households. The most numerous type of family households are 2-person households, comprising 138, and the most common type of nonfamily households are 1-person households, comprising 127.
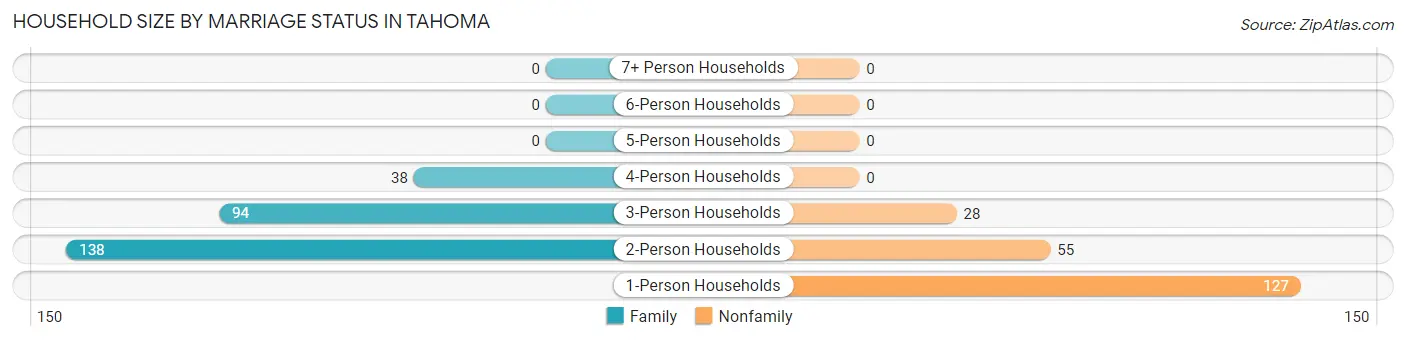
| Household Size | Family Households | Nonfamily Households |
| 1-Person Households | - | 127 (26.5%) |
| 2-Person Households | 138 (28.7%) | 55 (11.5%) |
| 3-Person Households | 94 (19.6%) | 28 (5.8%) |
| 4-Person Households | 38 (7.9%) | 0 (0.0%) |
| 5-Person Households | 0 (0.0%) | 0 (0.0%) |
| 6-Person Households | 0 (0.0%) | 0 (0.0%) |
| 7+ Person Households | 0 (0.0%) | 0 (0.0%) |
| Total | 270 (56.2%) | 210 (43.8%) |
Female Fertility in Tahoma
Fertility by Age in Tahoma
| Age Bracket | Women with Births | Births / 1,000 Women |
| 15 to 19 years | 0 (0.0%) | 0.0 |
| 20 to 34 years | 0 (0.0%) | 0.0 |
| 35 to 50 years | 0 (0.0%) | 0.0 |
| Total | 0 (0.0%) | 0.0 |
Fertility by Age by Marriage Status in Tahoma
| Age Bracket | Married | Unmarried |
| 15 to 19 years | 0 (0.0%) | 0 (0.0%) |
| 20 to 34 years | 0 (0.0%) | 0 (0.0%) |
| 35 to 50 years | 0 (0.0%) | 0 (0.0%) |
| Total | 0 (0.0%) | 0 (0.0%) |
Fertility by Education in Tahoma
| Educational Attainment | Women with Births | Births / 1,000 Women |
| Less than High School | 0 (0.0%) | 0.0 |
| High School Diploma | 0 (0.0%) | 0.0 |
| College or Associate's Degree | 0 (0.0%) | 0.0 |
| Bachelor's Degree | 0 (0.0%) | 0.0 |
| Graduate Degree | 0 (0.0%) | 0.0 |
| Total | 0 (0.0%) | 0.0 |
Fertility by Education by Marriage Status in Tahoma
| Educational Attainment | Married | Unmarried |
| Less than High School | 0 (0.0%) | 0 (0.0%) |
| High School Diploma | 0 (0.0%) | 0 (0.0%) |
| College or Associate's Degree | 0 (0.0%) | 0 (0.0%) |
| Bachelor's Degree | 0 (0.0%) | 0 (0.0%) |
| Graduate Degree | 0 (0.0%) | 0 (0.0%) |
| Total | 0 (0.0%) | 0 (0.0%) |
Employment Characteristics in Tahoma
Employment by Class of Employer in Tahoma
Among the 663 employed individuals in Tahoma, private company employees (436 | 65.8%), self-employed (not incorporated) (100 | 15.1%), and local government employees (50 | 7.5%) make up the most common classes of employment.
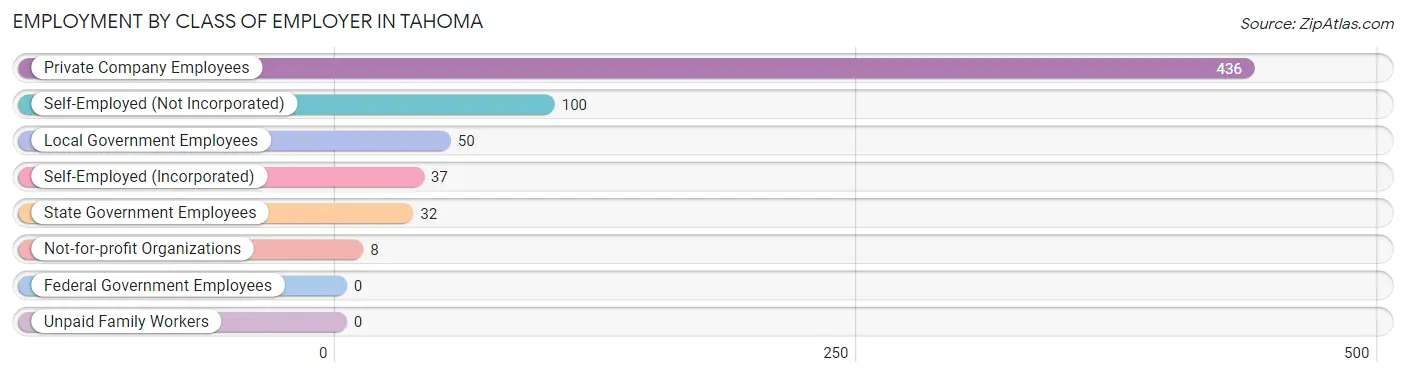
| Employer Class | # Employees | % Employees |
| Private Company Employees | 436 | 65.8% |
| Self-Employed (Incorporated) | 37 | 5.6% |
| Self-Employed (Not Incorporated) | 100 | 15.1% |
| Not-for-profit Organizations | 8 | 1.2% |
| Local Government Employees | 50 | 7.5% |
| State Government Employees | 32 | 4.8% |
| Federal Government Employees | 0 | 0.0% |
| Unpaid Family Workers | 0 | 0.0% |
| Total | 663 | 100.0% |
Employment Status by Age in Tahoma
According to the labor force statistics for Tahoma, out of the total population over 16 years of age (947), 75.3% or 713 individuals are in the labor force, with 3.9% or 28 of them unemployed. The age group with the highest labor force participation rate is 30 to 34 years, with 94.6% or 174 individuals in the labor force. Within the labor force, the 55 to 59 years age range has the highest percentage of unemployed individuals, with 15.0% or 6 of them being unemployed.
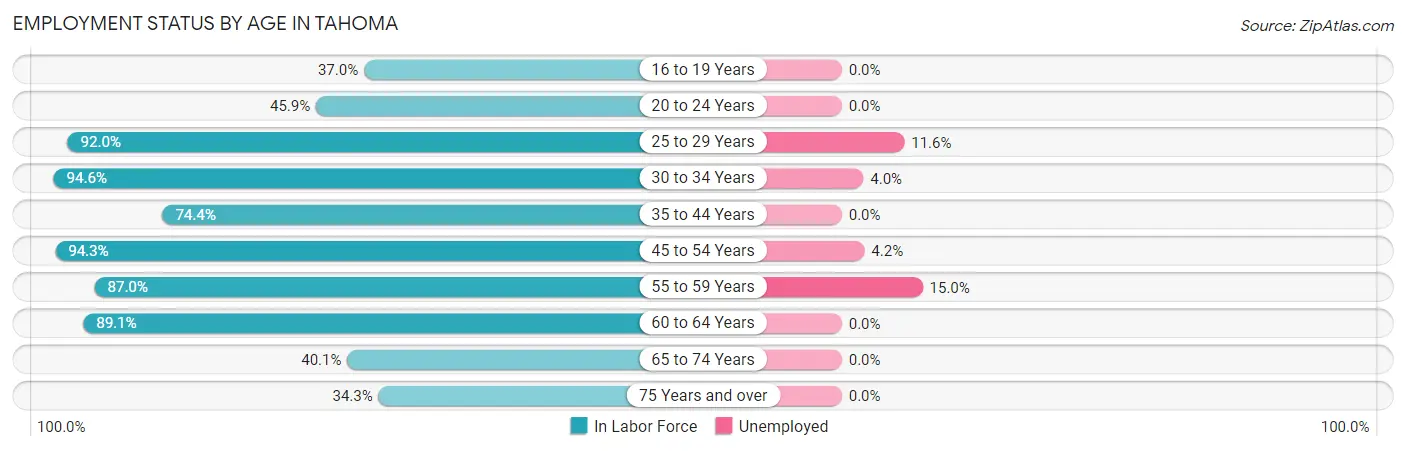
| Age Bracket | In Labor Force | Unemployed |
| 16 to 19 Years | 10 (37.0%) | 0 (0.0%) |
| 20 to 24 Years | 34 (45.9%) | 0 (0.0%) |
| 25 to 29 Years | 69 (92.0%) | 8 (11.6%) |
| 30 to 34 Years | 174 (94.6%) | 7 (4.0%) |
| 35 to 44 Years | 96 (74.4%) | 0 (0.0%) |
| 45 to 54 Years | 166 (94.3%) | 7 (4.2%) |
| 55 to 59 Years | 40 (87.0%) | 6 (15.0%) |
| 60 to 64 Years | 57 (89.1%) | 0 (0.0%) |
| 65 to 74 Years | 55 (40.1%) | 0 (0.0%) |
| 75 Years and over | 12 (34.3%) | 0 (0.0%) |
| Total | 713 (75.3%) | 28 (3.9%) |
Employment Status by Educational Attainment in Tahoma
According to labor force statistics for Tahoma, 89.3% of individuals (602) out of the total population between 25 and 64 years of age (674) are in the labor force, with 4.7% or 28 of them being unemployed. The group with the highest labor force participation rate are those with the educational attainment of less than high school, with 100.0% or 7 individuals in the labor force. Within the labor force, individuals with high school diploma education have the highest percentage of unemployment, with 9.4% or 15 of them being unemployed.
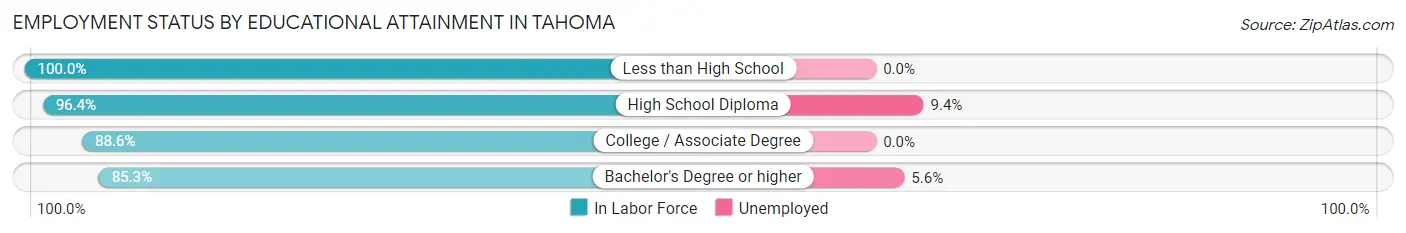
| Educational Attainment | In Labor Force | Unemployed |
| Less than High School | 7 (100.0%) | 0 (0.0%) |
| High School Diploma | 160 (96.4%) | 16 (9.4%) |
| College / Associate Degree | 203 (88.6%) | 0 (0.0%) |
| Bachelor's Degree or higher | 232 (85.3%) | 15 (5.6%) |
| Total | 602 (89.3%) | 32 (4.7%) |
Employment Occupations by Sex in Tahoma
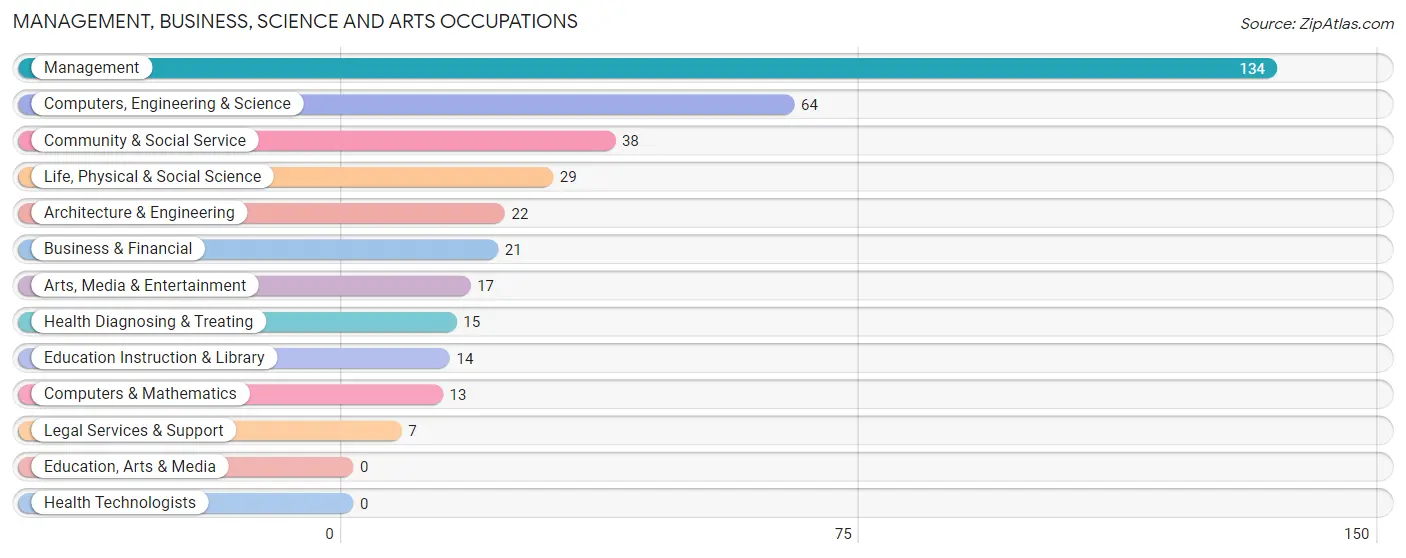
Management, Business, Science and Arts Occupations
The most common Management, Business, Science and Arts occupations in Tahoma are Management (134 | 19.6%), Computers, Engineering & Science (64 | 9.3%), Community & Social Service (38 | 5.6%), Life, Physical & Social Science (29 | 4.2%), and Architecture & Engineering (22 | 3.2%).
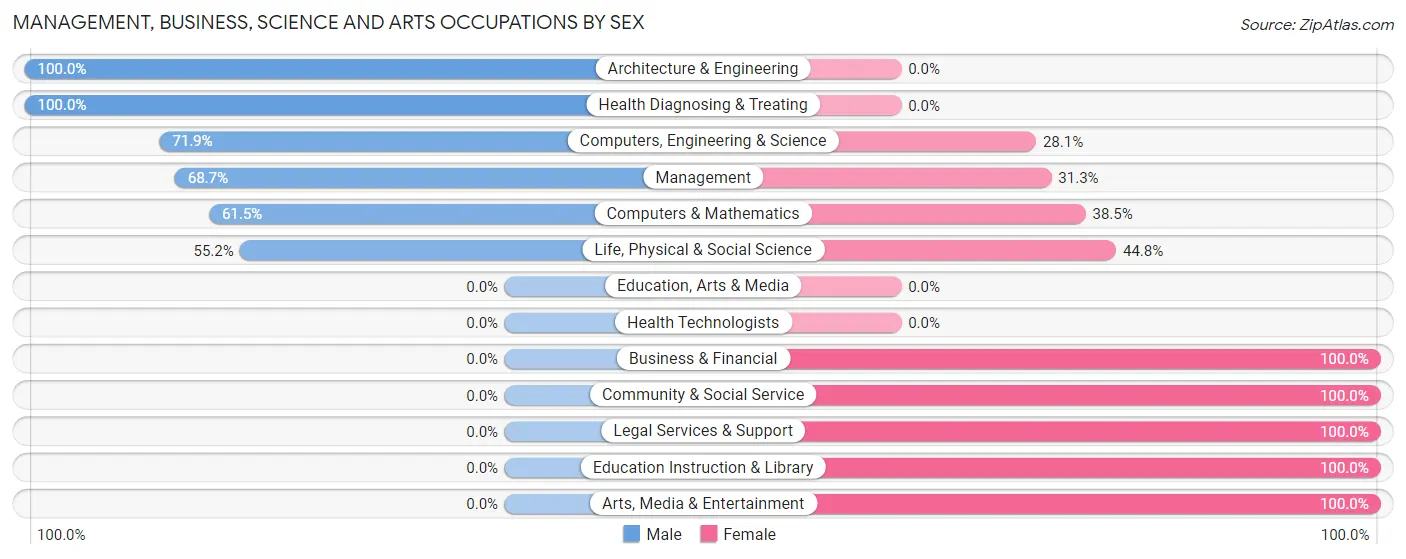
Management, Business, Science and Arts Occupations by Sex
Within the Management, Business, Science and Arts occupations in Tahoma, the most male-oriented occupations are Architecture & Engineering (100.0%), Health Diagnosing & Treating (100.0%), and Computers, Engineering & Science (71.9%), while the most female-oriented occupations are Business & Financial (100.0%), Community & Social Service (100.0%), and Legal Services & Support (100.0%).
| Occupation | Male | Female |
| Management | 92 (68.7%) | 42 (31.3%) |
| Business & Financial | 0 (0.0%) | 21 (100.0%) |
| Computers, Engineering & Science | 46 (71.9%) | 18 (28.1%) |
| Computers & Mathematics | 8 (61.5%) | 5 (38.5%) |
| Architecture & Engineering | 22 (100.0%) | 0 (0.0%) |
| Life, Physical & Social Science | 16 (55.2%) | 13 (44.8%) |
| Community & Social Service | 0 (0.0%) | 38 (100.0%) |
| Education, Arts & Media | 0 (0.0%) | 0 (0.0%) |
| Legal Services & Support | 0 (0.0%) | 7 (100.0%) |
| Education Instruction & Library | 0 (0.0%) | 14 (100.0%) |
| Arts, Media & Entertainment | 0 (0.0%) | 17 (100.0%) |
| Health Diagnosing & Treating | 15 (100.0%) | 0 (0.0%) |
| Health Technologists | 0 (0.0%) | 0 (0.0%) |
| Total (Category) | 153 (56.2%) | 119 (43.8%) |
| Total (Overall) | 468 (68.3%) | 217 (31.7%) |
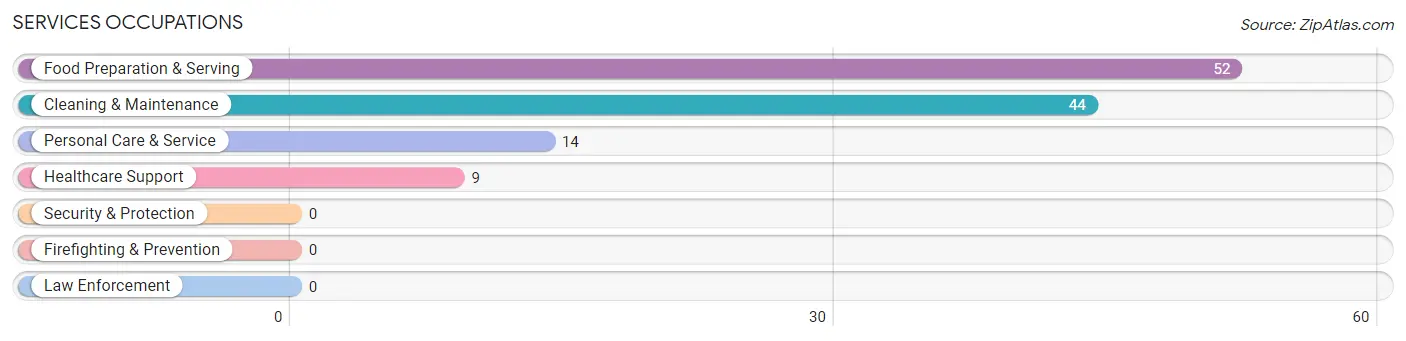
Services Occupations
The most common Services occupations in Tahoma are Food Preparation & Serving (52 | 7.6%), Cleaning & Maintenance (44 | 6.4%), Personal Care & Service (14 | 2.0%), and Healthcare Support (9 | 1.3%).
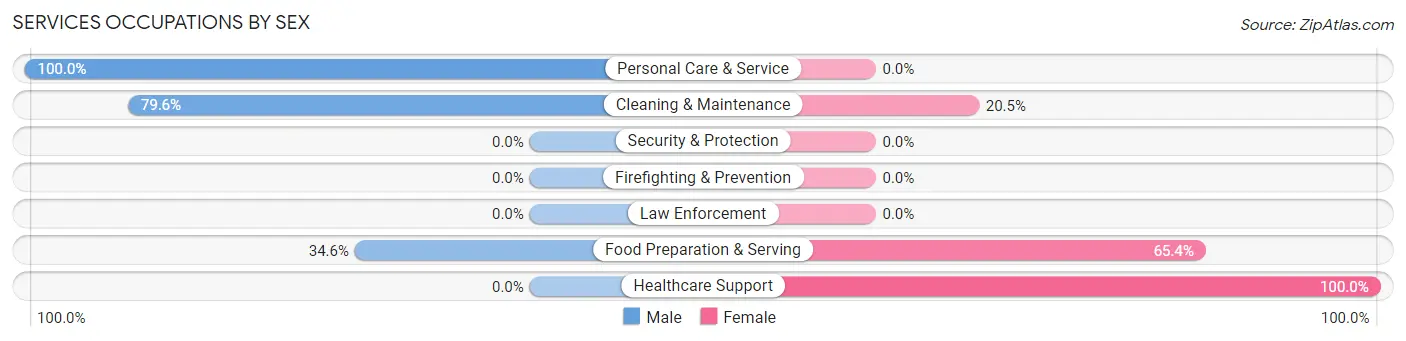
Services Occupations by Sex
Within the Services occupations in Tahoma, the most male-oriented occupations are Personal Care & Service (100.0%), Cleaning & Maintenance (79.5%), and Food Preparation & Serving (34.6%), while the most female-oriented occupations are Healthcare Support (100.0%), Food Preparation & Serving (65.4%), and Cleaning & Maintenance (20.4%).
| Occupation | Male | Female |
| Healthcare Support | 0 (0.0%) | 9 (100.0%) |
| Security & Protection | 0 (0.0%) | 0 (0.0%) |
| Firefighting & Prevention | 0 (0.0%) | 0 (0.0%) |
| Law Enforcement | 0 (0.0%) | 0 (0.0%) |
| Food Preparation & Serving | 18 (34.6%) | 34 (65.4%) |
| Cleaning & Maintenance | 35 (79.5%) | 9 (20.4%) |
| Personal Care & Service | 14 (100.0%) | 0 (0.0%) |
| Total (Category) | 67 (56.3%) | 52 (43.7%) |
| Total (Overall) | 468 (68.3%) | 217 (31.7%) |
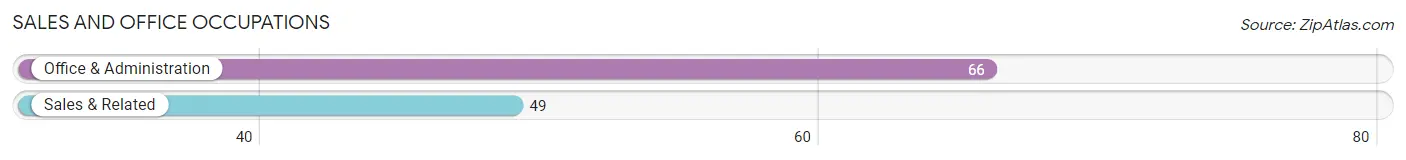
Sales and Office Occupations
The most common Sales and Office occupations in Tahoma are Office & Administration (66 | 9.6%), and Sales & Related (49 | 7.1%).
Sales and Office Occupations by Sex
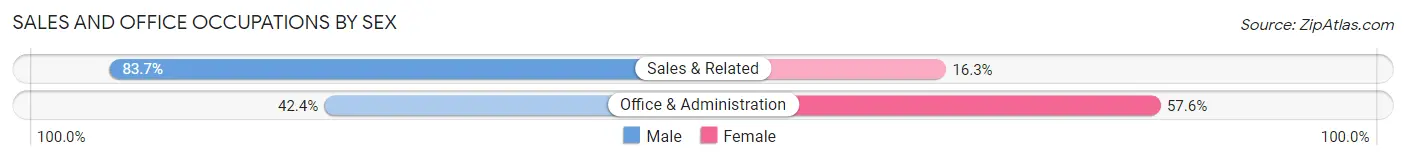
| Occupation | Male | Female |
| Sales & Related | 41 (83.7%) | 8 (16.3%) |
| Office & Administration | 28 (42.4%) | 38 (57.6%) |
| Total (Category) | 69 (60.0%) | 46 (40.0%) |
| Total (Overall) | 468 (68.3%) | 217 (31.7%) |
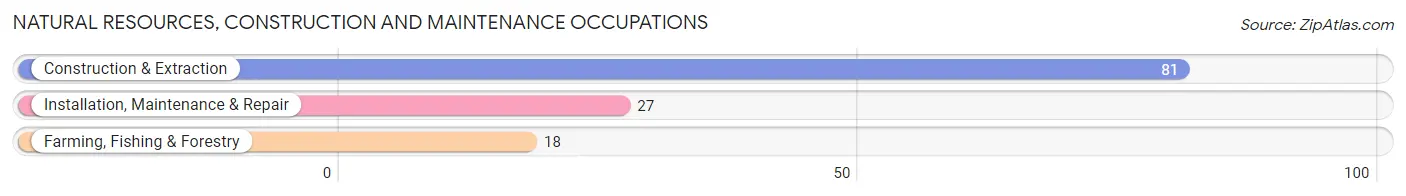
Natural Resources, Construction and Maintenance Occupations
The most common Natural Resources, Construction and Maintenance occupations in Tahoma are Construction & Extraction (81 | 11.8%), Installation, Maintenance & Repair (27 | 3.9%), and Farming, Fishing & Forestry (18 | 2.6%).
Natural Resources, Construction and Maintenance Occupations by Sex
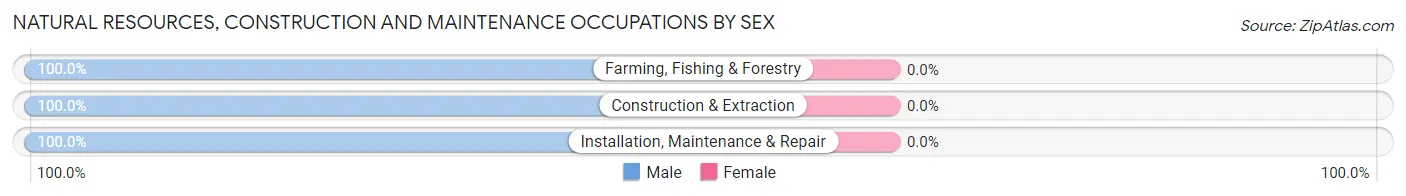
| Occupation | Male | Female |
| Farming, Fishing & Forestry | 18 (100.0%) | 0 (0.0%) |
| Construction & Extraction | 81 (100.0%) | 0 (0.0%) |
| Installation, Maintenance & Repair | 27 (100.0%) | 0 (0.0%) |
| Total (Category) | 126 (100.0%) | 0 (0.0%) |
| Total (Overall) | 468 (68.3%) | 217 (31.7%) |
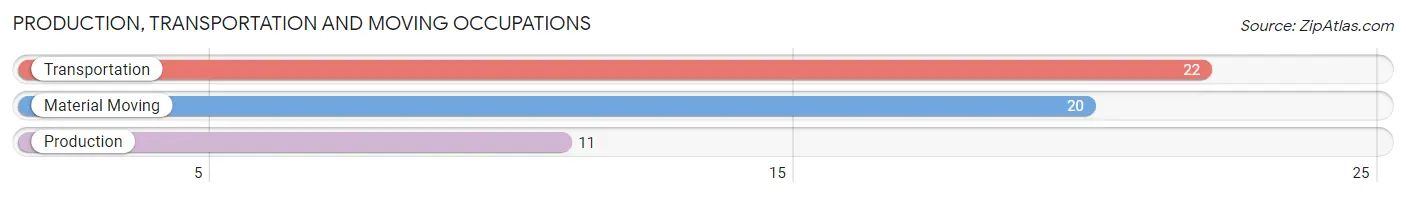
Production, Transportation and Moving Occupations
The most common Production, Transportation and Moving occupations in Tahoma are Transportation (22 | 3.2%), Material Moving (20 | 2.9%), and Production (11 | 1.6%).
Production, Transportation and Moving Occupations by Sex
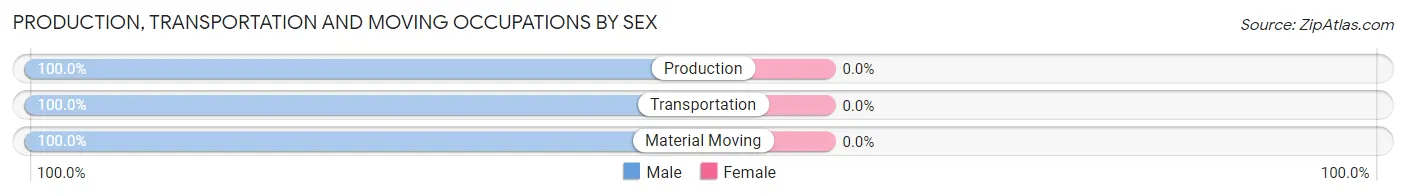
| Occupation | Male | Female |
| Production | 11 (100.0%) | 0 (0.0%) |
| Transportation | 22 (100.0%) | 0 (0.0%) |
| Material Moving | 20 (100.0%) | 0 (0.0%) |
| Total (Category) | 53 (100.0%) | 0 (0.0%) |
| Total (Overall) | 468 (68.3%) | 217 (31.7%) |
Employment Industries by Sex in Tahoma
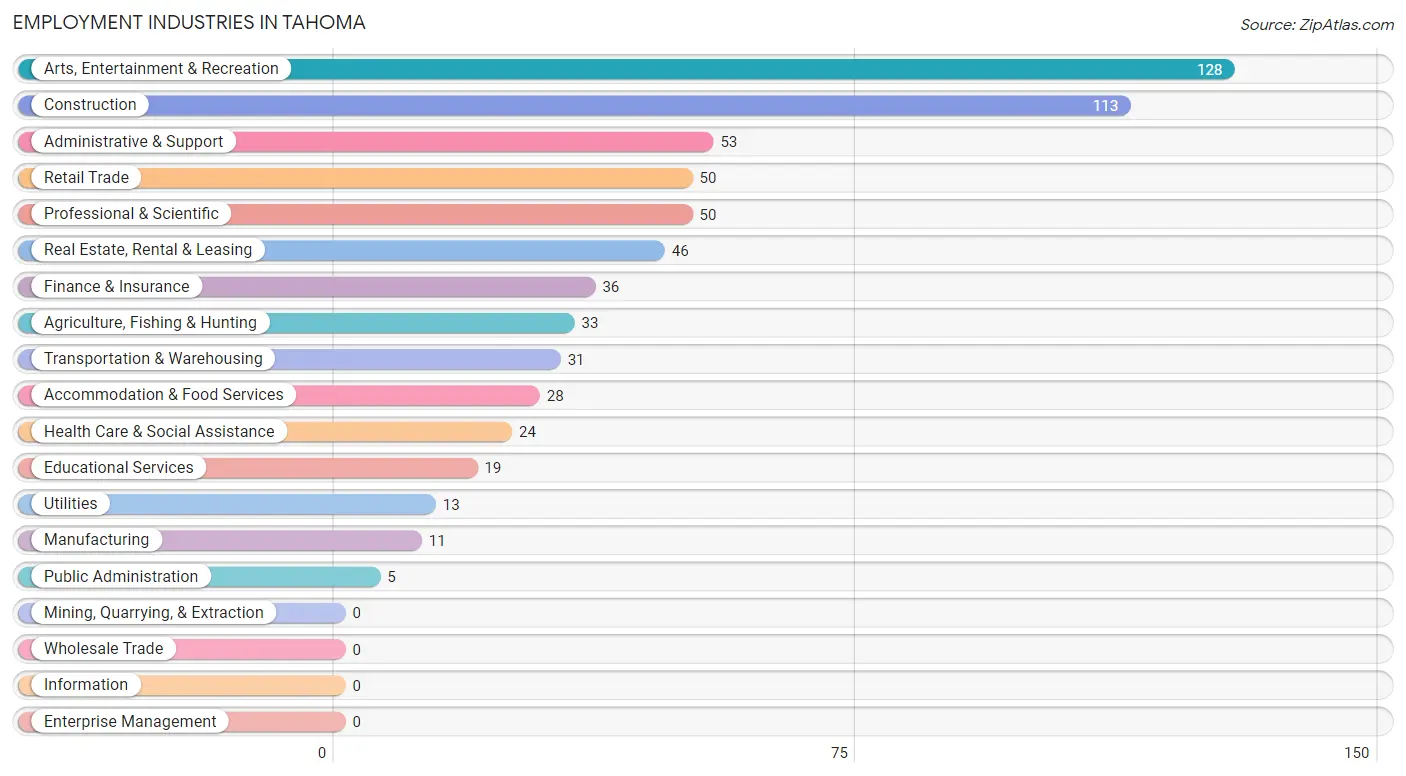
Employment Industries in Tahoma
The major employment industries in Tahoma include Arts, Entertainment & Recreation (128 | 18.7%), Construction (113 | 16.5%), Administrative & Support (53 | 7.7%), Retail Trade (50 | 7.3%), and Professional & Scientific (50 | 7.3%).
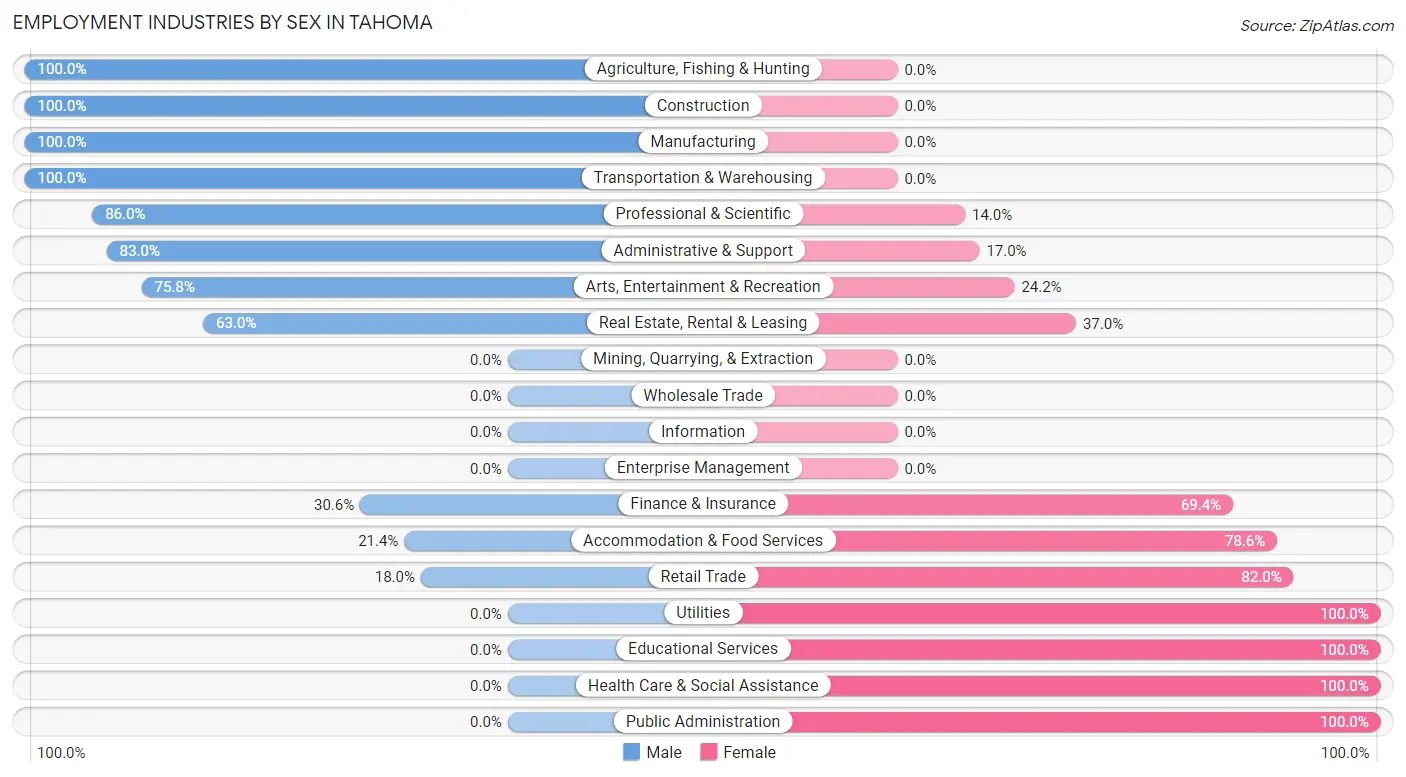
Employment Industries by Sex in Tahoma
The Tahoma industries that see more men than women are Agriculture, Fishing & Hunting (100.0%), Construction (100.0%), and Manufacturing (100.0%), whereas the industries that tend to have a higher number of women are Utilities (100.0%), Educational Services (100.0%), and Health Care & Social Assistance (100.0%).
| Industry | Male | Female |
| Agriculture, Fishing & Hunting | 33 (100.0%) | 0 (0.0%) |
| Mining, Quarrying, & Extraction | 0 (0.0%) | 0 (0.0%) |
| Construction | 113 (100.0%) | 0 (0.0%) |
| Manufacturing | 11 (100.0%) | 0 (0.0%) |
| Wholesale Trade | 0 (0.0%) | 0 (0.0%) |
| Retail Trade | 9 (18.0%) | 41 (82.0%) |
| Transportation & Warehousing | 31 (100.0%) | 0 (0.0%) |
| Utilities | 0 (0.0%) | 13 (100.0%) |
| Information | 0 (0.0%) | 0 (0.0%) |
| Finance & Insurance | 11 (30.6%) | 25 (69.4%) |
| Real Estate, Rental & Leasing | 29 (63.0%) | 17 (37.0%) |
| Professional & Scientific | 43 (86.0%) | 7 (14.0%) |
| Enterprise Management | 0 (0.0%) | 0 (0.0%) |
| Administrative & Support | 44 (83.0%) | 9 (17.0%) |
| Educational Services | 0 (0.0%) | 19 (100.0%) |
| Health Care & Social Assistance | 0 (0.0%) | 24 (100.0%) |
| Arts, Entertainment & Recreation | 97 (75.8%) | 31 (24.2%) |
| Accommodation & Food Services | 6 (21.4%) | 22 (78.6%) |
| Public Administration | 0 (0.0%) | 5 (100.0%) |
| Total | 468 (68.3%) | 217 (31.7%) |
Education in Tahoma
School Enrollment in Tahoma
The most common levels of schooling among the 151 students in Tahoma are college / undergraduate (45 | 29.8%), elementary school (38 | 25.2%), and middle school (19 | 12.6%).
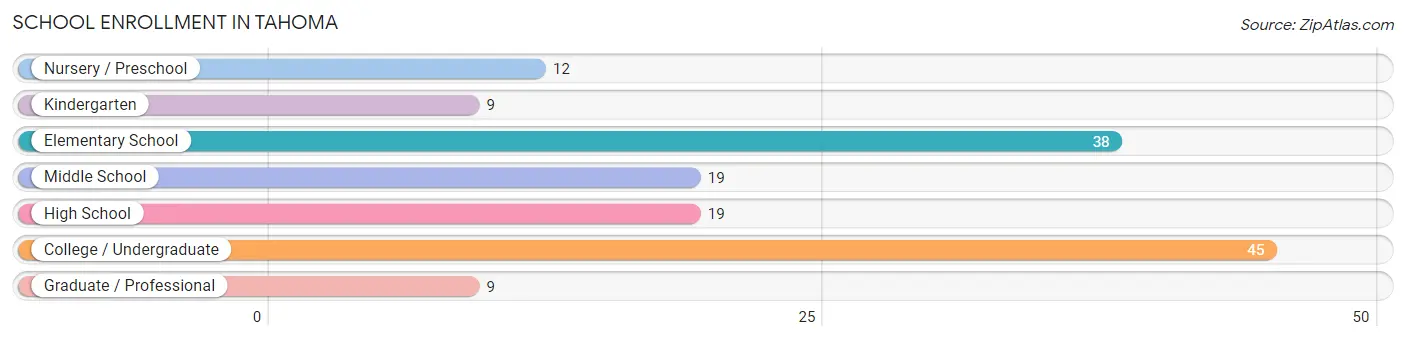
| School Level | # Students | % Students |
| Nursery / Preschool | 12 | 8.0% |
| Kindergarten | 9 | 6.0% |
| Elementary School | 38 | 25.2% |
| Middle School | 19 | 12.6% |
| High School | 19 | 12.6% |
| College / Undergraduate | 45 | 29.8% |
| Graduate / Professional | 9 | 6.0% |
| Total | 151 | 100.0% |
School Enrollment by Age by Funding Source in Tahoma
Out of a total of 151 students who are enrolled in schools in Tahoma, 17 (11.3%) attend a private institution, while the remaining 134 (88.7%) are enrolled in public schools. The age group of 18 to 19 year olds has the highest likelihood of being enrolled in private schools, with 5 (38.5% in the age bracket) enrolled. Conversely, the age group of 3 to 4 year olds has the lowest likelihood of being enrolled in a private school, with 9 (100.0% in the age bracket) attending a public institution.
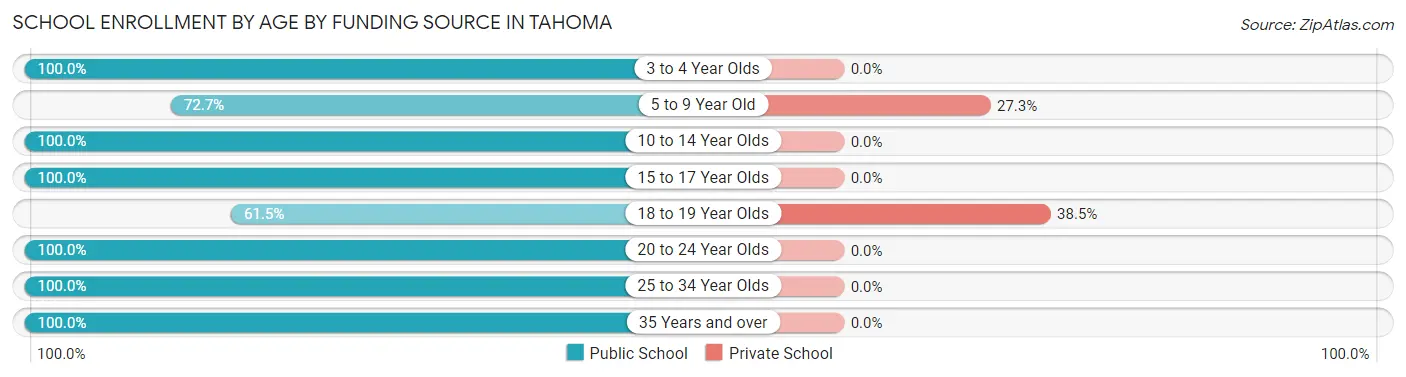
| Age Bracket | Public School | Private School |
| 3 to 4 Year Olds | 9 (100.0%) | 0 (0.0%) |
| 5 to 9 Year Old | 32 (72.7%) | 12 (27.3%) |
| 10 to 14 Year Olds | 31 (100.0%) | 0 (0.0%) |
| 15 to 17 Year Olds | 5 (100.0%) | 0 (0.0%) |
| 18 to 19 Year Olds | 8 (61.5%) | 5 (38.5%) |
| 20 to 24 Year Olds | 24 (100.0%) | 0 (0.0%) |
| 25 to 34 Year Olds | 16 (100.0%) | 0 (0.0%) |
| 35 Years and over | 9 (100.0%) | 0 (0.0%) |
| Total | 134 (88.7%) | 17 (11.3%) |
Educational Attainment by Field of Study in Tahoma
Business (66 | 18.4%), social sciences (46 | 12.9%), liberal arts & history (40 | 11.2%), engineering (39 | 10.9%), and bio, nature & agricultural (38 | 10.6%) are the most common fields of study among 358 individuals in Tahoma who have obtained a bachelor's degree or higher.
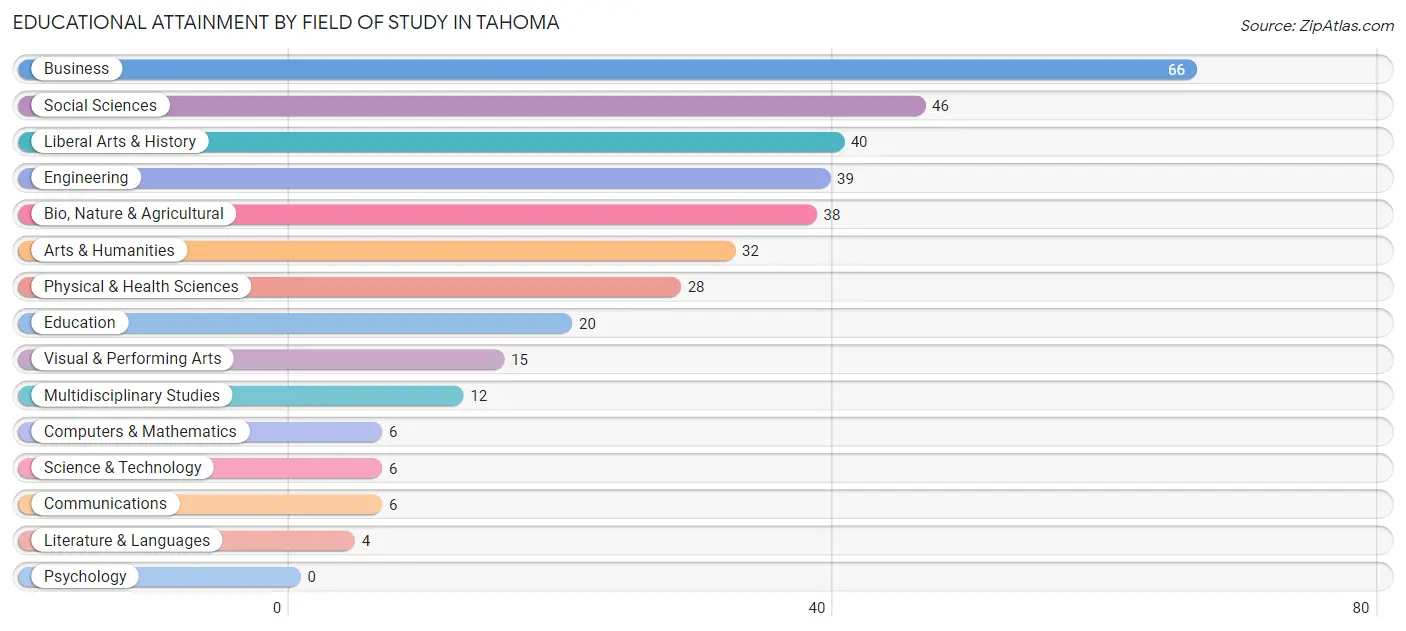
| Field of Study | # Graduates | % Graduates |
| Computers & Mathematics | 6 | 1.7% |
| Bio, Nature & Agricultural | 38 | 10.6% |
| Physical & Health Sciences | 28 | 7.8% |
| Psychology | 0 | 0.0% |
| Social Sciences | 46 | 12.9% |
| Engineering | 39 | 10.9% |
| Multidisciplinary Studies | 12 | 3.4% |
| Science & Technology | 6 | 1.7% |
| Business | 66 | 18.4% |
| Education | 20 | 5.6% |
| Literature & Languages | 4 | 1.1% |
| Liberal Arts & History | 40 | 11.2% |
| Visual & Performing Arts | 15 | 4.2% |
| Communications | 6 | 1.7% |
| Arts & Humanities | 32 | 8.9% |
| Total | 358 | 100.0% |
Transportation & Commute in Tahoma
Vehicle Availability by Sex in Tahoma
The most prevalent vehicle ownership categories in Tahoma are males with 2 vehicles (189, accounting for 41.1%) and females with 2 vehicles (88, making up 93.1%).
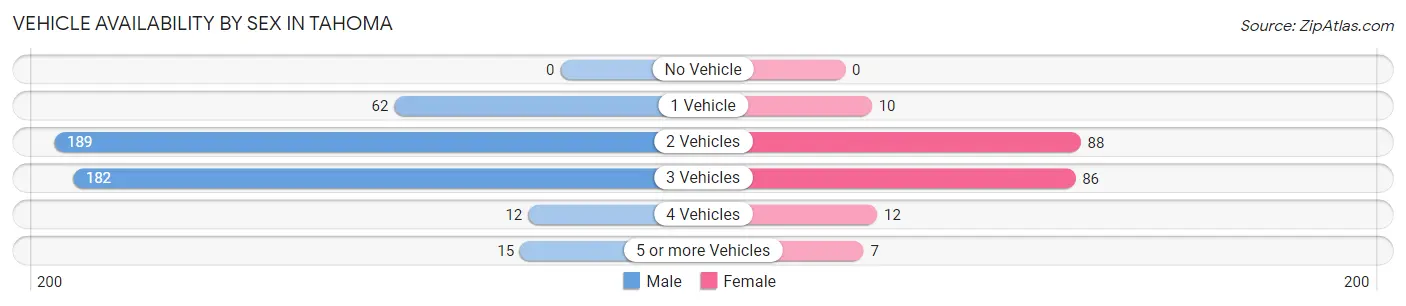
| Vehicles Available | Male | Female |
| No Vehicle | 0 (0.0%) | 0 (0.0%) |
| 1 Vehicle | 62 (13.5%) | 10 (4.9%) |
| 2 Vehicles | 189 (41.1%) | 88 (43.3%) |
| 3 Vehicles | 182 (39.6%) | 86 (42.4%) |
| 4 Vehicles | 12 (2.6%) | 12 (5.9%) |
| 5 or more Vehicles | 15 (3.3%) | 7 (3.5%) |
| Total | 460 (100.0%) | 203 (100.0%) |
Commute Time in Tahoma
The most frequently occuring commute durations in Tahoma are 30 to 34 minutes (96 commuters, 16.0%), 5 to 9 minutes (89 commuters, 14.8%), and 10 to 14 minutes (77 commuters, 12.8%).
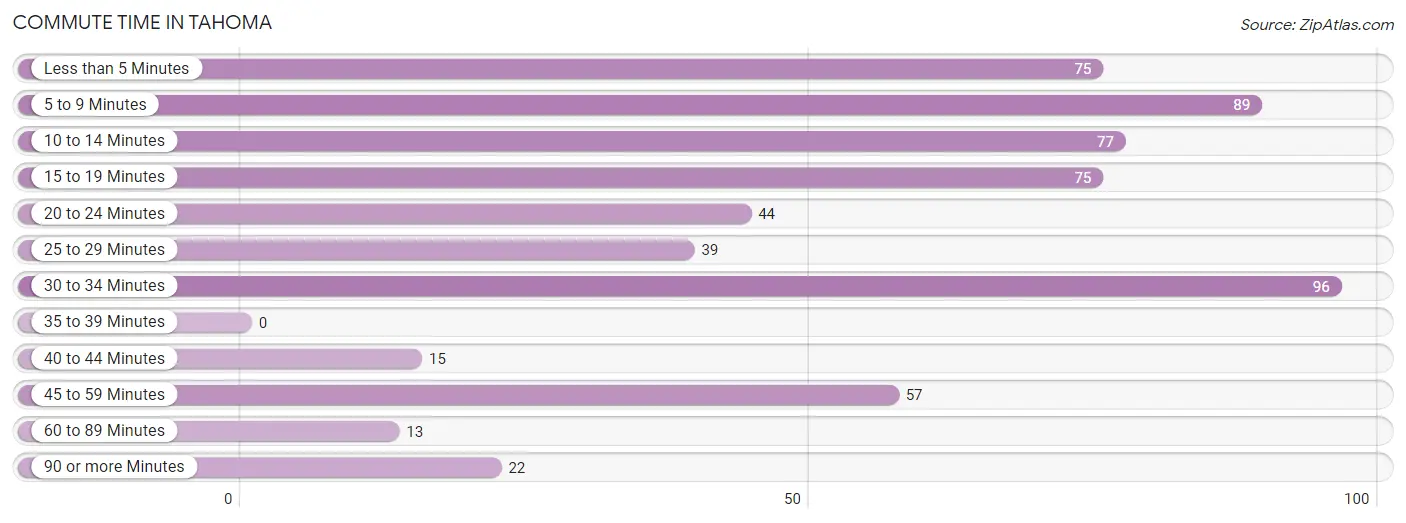
| Commute Time | # Commuters | % Commuters |
| Less than 5 Minutes | 75 | 12.5% |
| 5 to 9 Minutes | 89 | 14.8% |
| 10 to 14 Minutes | 77 | 12.8% |
| 15 to 19 Minutes | 75 | 12.5% |
| 20 to 24 Minutes | 44 | 7.3% |
| 25 to 29 Minutes | 39 | 6.5% |
| 30 to 34 Minutes | 96 | 16.0% |
| 35 to 39 Minutes | 0 | 0.0% |
| 40 to 44 Minutes | 15 | 2.5% |
| 45 to 59 Minutes | 57 | 9.5% |
| 60 to 89 Minutes | 13 | 2.2% |
| 90 or more Minutes | 22 | 3.6% |
Commute Time by Sex in Tahoma
The most common commute times in Tahoma are 5 to 9 minutes (72 commuters, 16.8%) for males and 45 to 59 minutes (35 commuters, 20.2%) for females.
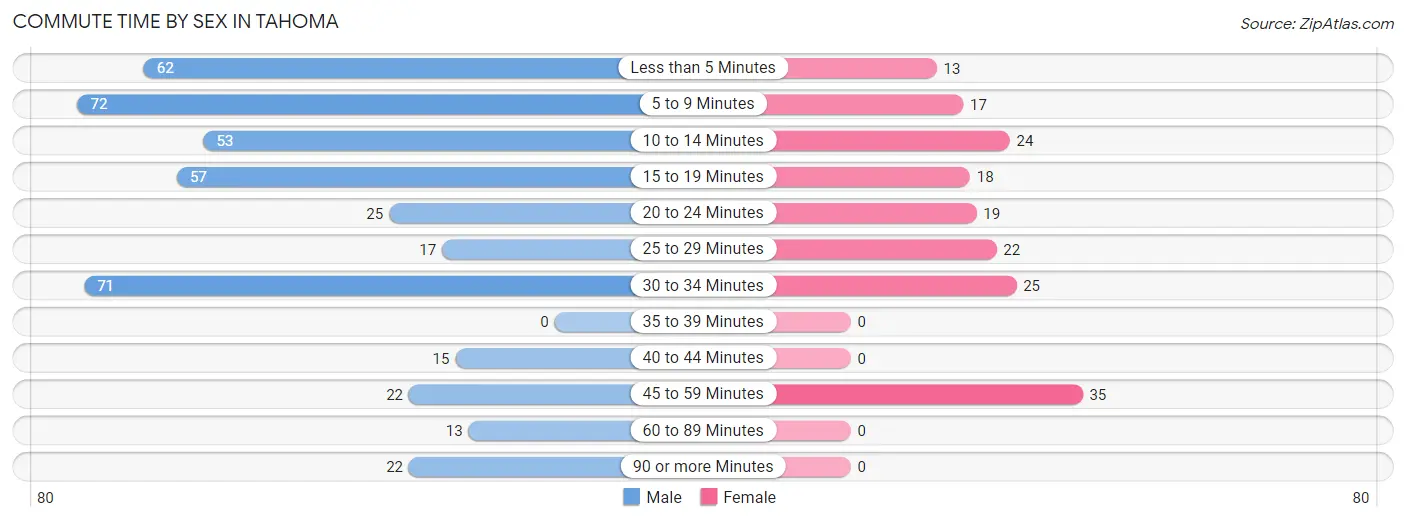
| Commute Time | Male | Female |
| Less than 5 Minutes | 62 (14.4%) | 13 (7.5%) |
| 5 to 9 Minutes | 72 (16.8%) | 17 (9.8%) |
| 10 to 14 Minutes | 53 (12.3%) | 24 (13.9%) |
| 15 to 19 Minutes | 57 (13.3%) | 18 (10.4%) |
| 20 to 24 Minutes | 25 (5.8%) | 19 (11.0%) |
| 25 to 29 Minutes | 17 (4.0%) | 22 (12.7%) |
| 30 to 34 Minutes | 71 (16.6%) | 25 (14.4%) |
| 35 to 39 Minutes | 0 (0.0%) | 0 (0.0%) |
| 40 to 44 Minutes | 15 (3.5%) | 0 (0.0%) |
| 45 to 59 Minutes | 22 (5.1%) | 35 (20.2%) |
| 60 to 89 Minutes | 13 (3.0%) | 0 (0.0%) |
| 90 or more Minutes | 22 (5.1%) | 0 (0.0%) |
Time of Departure to Work by Sex in Tahoma
The most frequent times of departure to work in Tahoma are 8:00 AM to 8:29 AM (125, 29.1%) for males and 9:00 AM to 9:59 AM (49, 28.3%) for females.
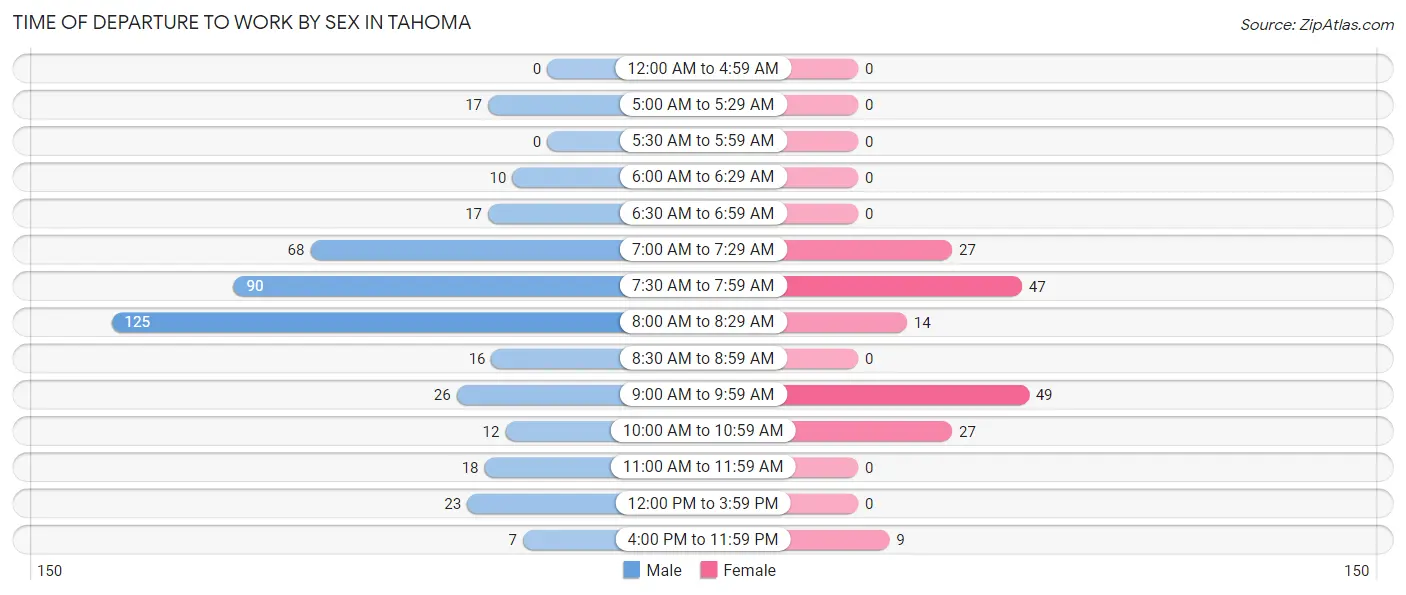
| Time of Departure | Male | Female |
| 12:00 AM to 4:59 AM | 0 (0.0%) | 0 (0.0%) |
| 5:00 AM to 5:29 AM | 17 (4.0%) | 0 (0.0%) |
| 5:30 AM to 5:59 AM | 0 (0.0%) | 0 (0.0%) |
| 6:00 AM to 6:29 AM | 10 (2.3%) | 0 (0.0%) |
| 6:30 AM to 6:59 AM | 17 (4.0%) | 0 (0.0%) |
| 7:00 AM to 7:29 AM | 68 (15.9%) | 27 (15.6%) |
| 7:30 AM to 7:59 AM | 90 (21.0%) | 47 (27.2%) |
| 8:00 AM to 8:29 AM | 125 (29.1%) | 14 (8.1%) |
| 8:30 AM to 8:59 AM | 16 (3.7%) | 0 (0.0%) |
| 9:00 AM to 9:59 AM | 26 (6.1%) | 49 (28.3%) |
| 10:00 AM to 10:59 AM | 12 (2.8%) | 27 (15.6%) |
| 11:00 AM to 11:59 AM | 18 (4.2%) | 0 (0.0%) |
| 12:00 PM to 3:59 PM | 23 (5.4%) | 0 (0.0%) |
| 4:00 PM to 11:59 PM | 7 (1.6%) | 9 (5.2%) |
| Total | 429 (100.0%) | 173 (100.0%) |
Housing Occupancy in Tahoma
Occupancy by Ownership in Tahoma
Of the total 480 dwellings in Tahoma, owner-occupied units account for 303 (63.1%), while renter-occupied units make up 177 (36.9%).
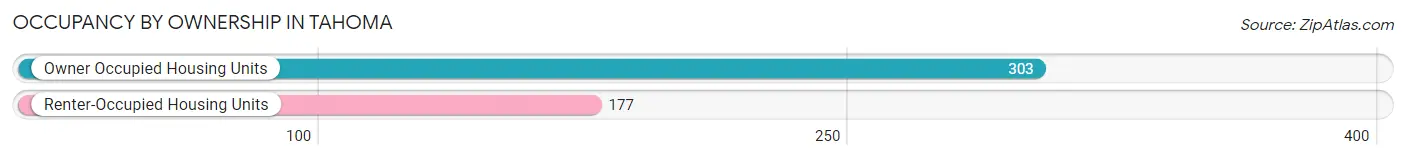
| Occupancy | # Housing Units | % Housing Units |
| Owner Occupied Housing Units | 303 | 63.1% |
| Renter-Occupied Housing Units | 177 | 36.9% |
| Total Occupied Housing Units | 480 | 100.0% |
Occupancy by Household Size in Tahoma
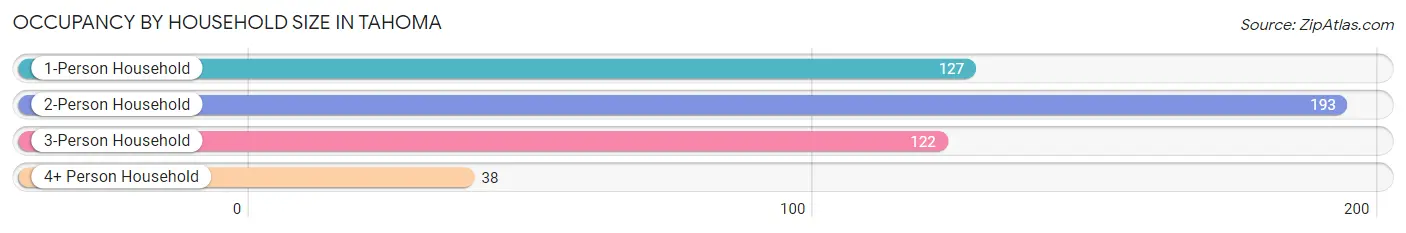
| Household Size | # Housing Units | % Housing Units |
| 1-Person Household | 127 | 26.5% |
| 2-Person Household | 193 | 40.2% |
| 3-Person Household | 122 | 25.4% |
| 4+ Person Household | 38 | 7.9% |
| Total Housing Units | 480 | 100.0% |
Occupancy by Ownership by Household Size in Tahoma
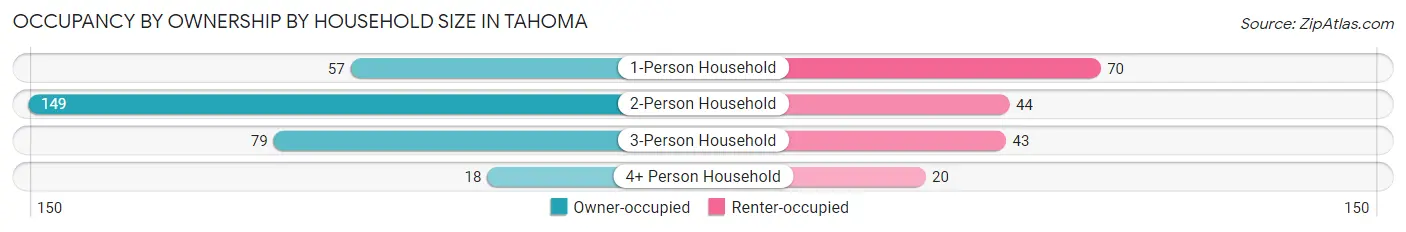
| Household Size | Owner-occupied | Renter-occupied |
| 1-Person Household | 57 (44.9%) | 70 (55.1%) |
| 2-Person Household | 149 (77.2%) | 44 (22.8%) |
| 3-Person Household | 79 (64.7%) | 43 (35.2%) |
| 4+ Person Household | 18 (47.4%) | 20 (52.6%) |
| Total Housing Units | 303 (63.1%) | 177 (36.9%) |
Occupancy by Educational Attainment in Tahoma
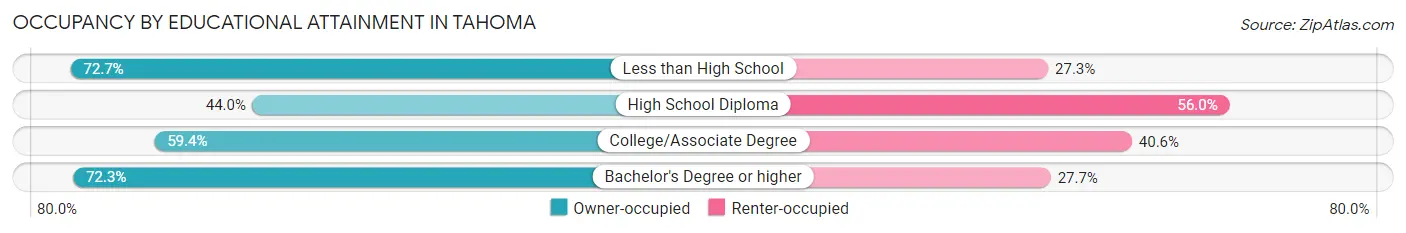
| Household Size | Owner-occupied | Renter-occupied |
| Less than High School | 16 (72.7%) | 6 (27.3%) |
| High School Diploma | 40 (44.0%) | 51 (56.0%) |
| College/Associate Degree | 85 (59.4%) | 58 (40.6%) |
| Bachelor's Degree or higher | 162 (72.3%) | 62 (27.7%) |
Occupancy by Age of Householder in Tahoma
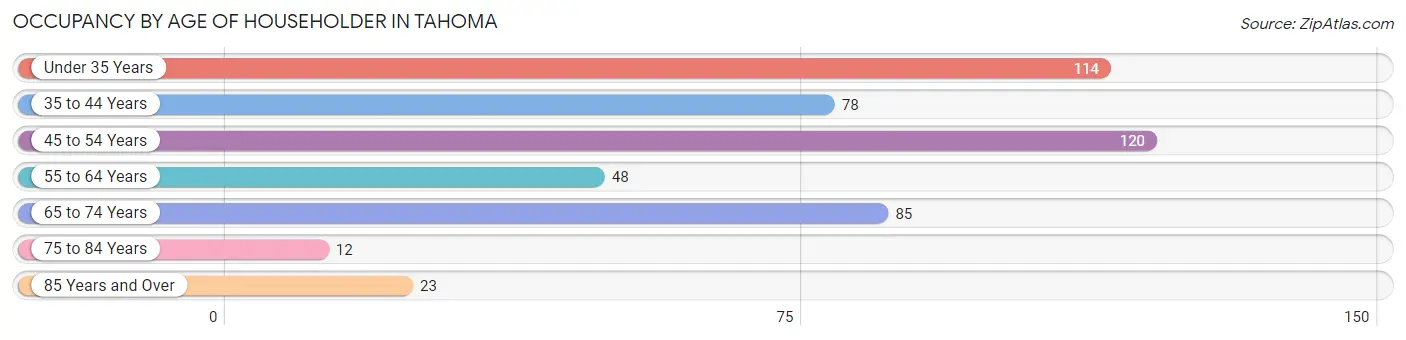
| Age Bracket | # Households | % Households |
| Under 35 Years | 114 | 23.7% |
| 35 to 44 Years | 78 | 16.3% |
| 45 to 54 Years | 120 | 25.0% |
| 55 to 64 Years | 48 | 10.0% |
| 65 to 74 Years | 85 | 17.7% |
| 75 to 84 Years | 12 | 2.5% |
| 85 Years and Over | 23 | 4.8% |
| Total | 480 | 100.0% |
Housing Finances in Tahoma
Median Income by Occupancy in Tahoma
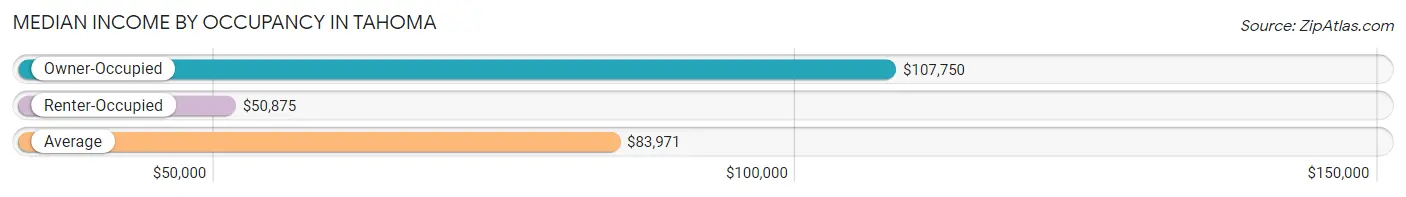
| Occupancy Type | # Households | Median Income |
| Owner-Occupied | 303 (63.1%) | $107,750 |
| Renter-Occupied | 177 (36.9%) | $50,875 |
| Average | 480 (100.0%) | $83,971 |
Occupancy by Householder Income Bracket in Tahoma
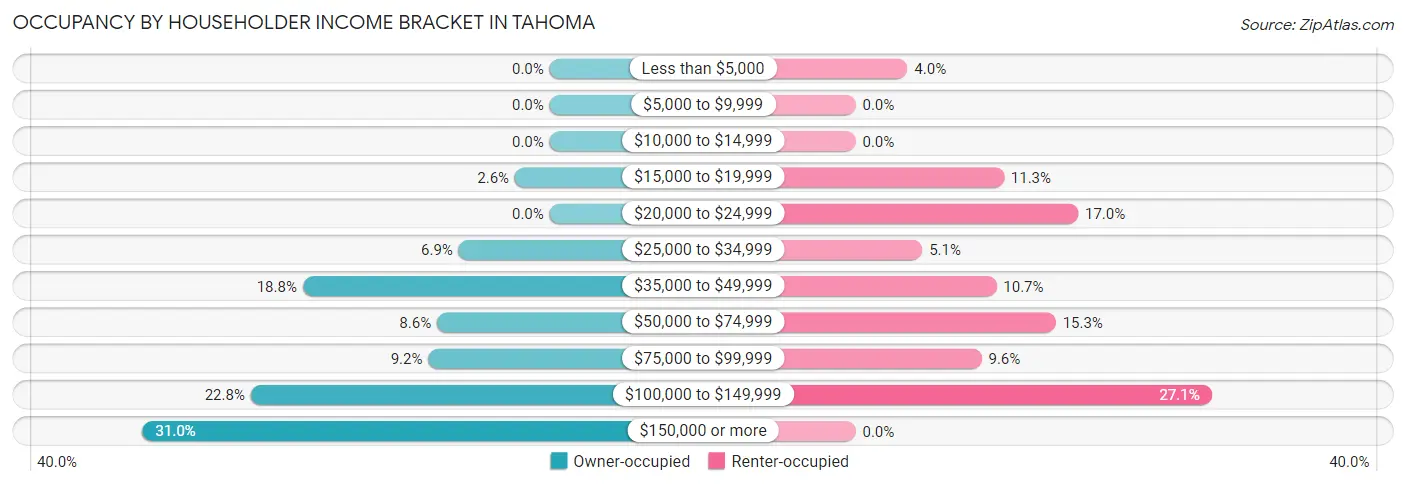
| Income Bracket | Owner-occupied | Renter-occupied |
| Less than $5,000 | 0 (0.0%) | 7 (4.0%) |
| $5,000 to $9,999 | 0 (0.0%) | 0 (0.0%) |
| $10,000 to $14,999 | 0 (0.0%) | 0 (0.0%) |
| $15,000 to $19,999 | 8 (2.6%) | 20 (11.3%) |
| $20,000 to $24,999 | 0 (0.0%) | 30 (17.0%) |
| $25,000 to $34,999 | 21 (6.9%) | 9 (5.1%) |
| $35,000 to $49,999 | 57 (18.8%) | 19 (10.7%) |
| $50,000 to $74,999 | 26 (8.6%) | 27 (15.2%) |
| $75,000 to $99,999 | 28 (9.2%) | 17 (9.6%) |
| $100,000 to $149,999 | 69 (22.8%) | 48 (27.1%) |
| $150,000 or more | 94 (31.0%) | 0 (0.0%) |
| Total | 303 (100.0%) | 177 (100.0%) |
Monthly Housing Cost Tiers in Tahoma
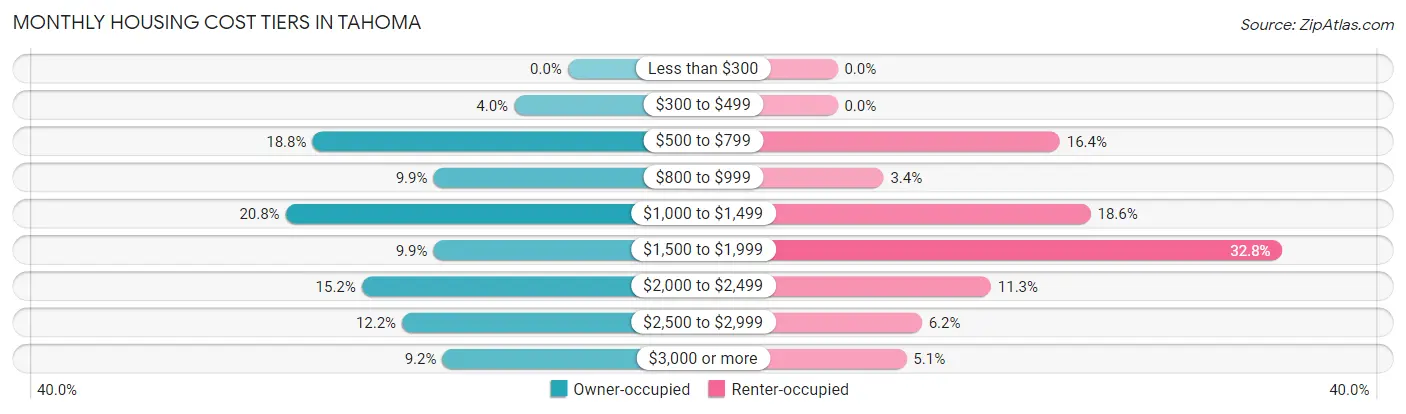
| Monthly Cost | Owner-occupied | Renter-occupied |
| Less than $300 | 0 (0.0%) | 0 (0.0%) |
| $300 to $499 | 12 (4.0%) | 0 (0.0%) |
| $500 to $799 | 57 (18.8%) | 29 (16.4%) |
| $800 to $999 | 30 (9.9%) | 6 (3.4%) |
| $1,000 to $1,499 | 63 (20.8%) | 33 (18.6%) |
| $1,500 to $1,999 | 30 (9.9%) | 58 (32.8%) |
| $2,000 to $2,499 | 46 (15.2%) | 20 (11.3%) |
| $2,500 to $2,999 | 37 (12.2%) | 11 (6.2%) |
| $3,000 or more | 28 (9.2%) | 9 (5.1%) |
| Total | 303 (100.0%) | 177 (100.0%) |
Physical Housing Characteristics in Tahoma
Housing Structures in Tahoma
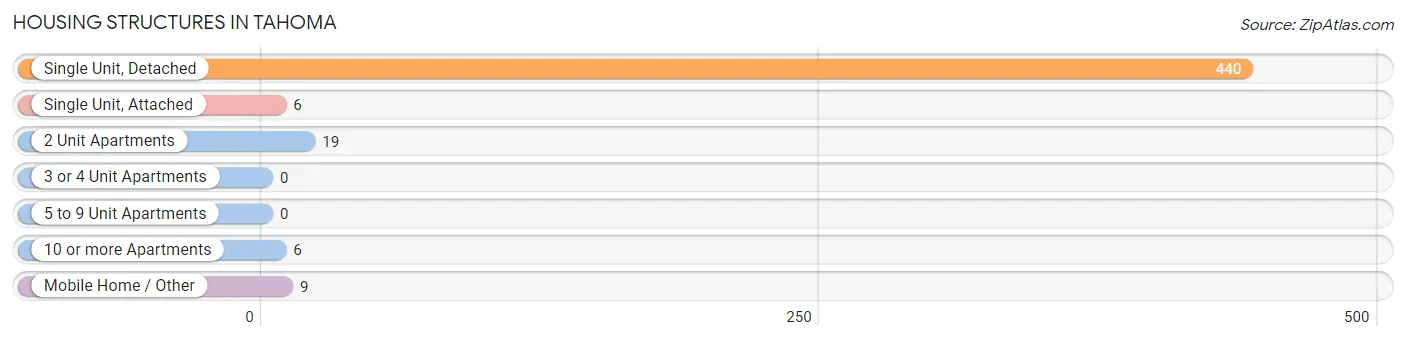
| Structure Type | # Housing Units | % Housing Units |
| Single Unit, Detached | 440 | 91.7% |
| Single Unit, Attached | 6 | 1.3% |
| 2 Unit Apartments | 19 | 4.0% |
| 3 or 4 Unit Apartments | 0 | 0.0% |
| 5 to 9 Unit Apartments | 0 | 0.0% |
| 10 or more Apartments | 6 | 1.3% |
| Mobile Home / Other | 9 | 1.9% |
| Total | 480 | 100.0% |
Housing Structures by Occupancy in Tahoma
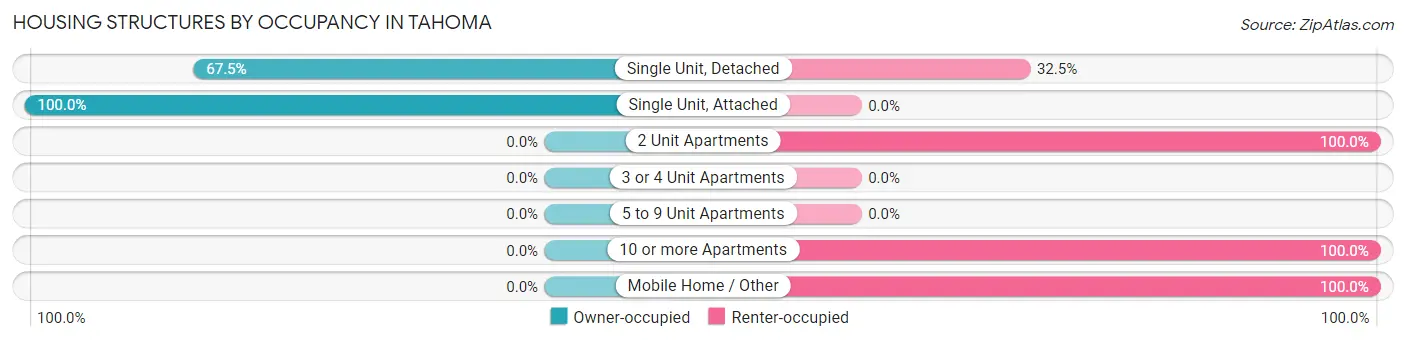
| Structure Type | Owner-occupied | Renter-occupied |
| Single Unit, Detached | 297 (67.5%) | 143 (32.5%) |
| Single Unit, Attached | 6 (100.0%) | 0 (0.0%) |
| 2 Unit Apartments | 0 (0.0%) | 19 (100.0%) |
| 3 or 4 Unit Apartments | 0 (0.0%) | 0 (0.0%) |
| 5 to 9 Unit Apartments | 0 (0.0%) | 0 (0.0%) |
| 10 or more Apartments | 0 (0.0%) | 6 (100.0%) |
| Mobile Home / Other | 0 (0.0%) | 9 (100.0%) |
| Total | 303 (63.1%) | 177 (36.9%) |
Housing Structures by Number of Rooms in Tahoma
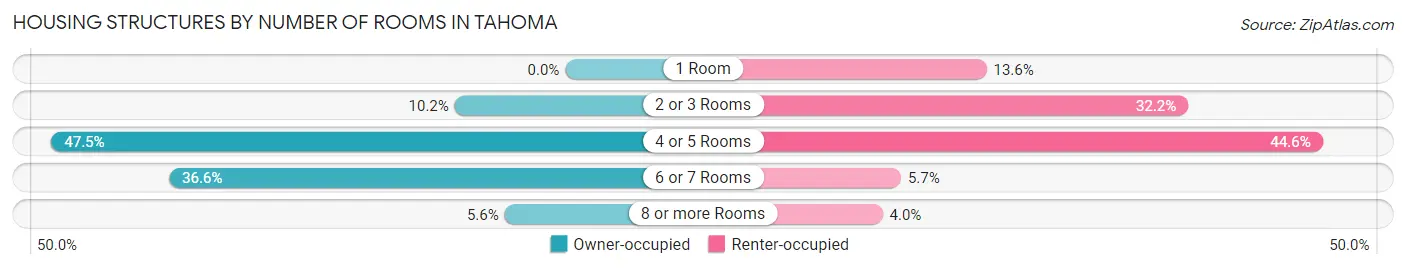
| Number of Rooms | Owner-occupied | Renter-occupied |
| 1 Room | 0 (0.0%) | 24 (13.6%) |
| 2 or 3 Rooms | 31 (10.2%) | 57 (32.2%) |
| 4 or 5 Rooms | 144 (47.5%) | 79 (44.6%) |
| 6 or 7 Rooms | 111 (36.6%) | 10 (5.7%) |
| 8 or more Rooms | 17 (5.6%) | 7 (4.0%) |
| Total | 303 (100.0%) | 177 (100.0%) |
Housing Structure by Heating Type in Tahoma
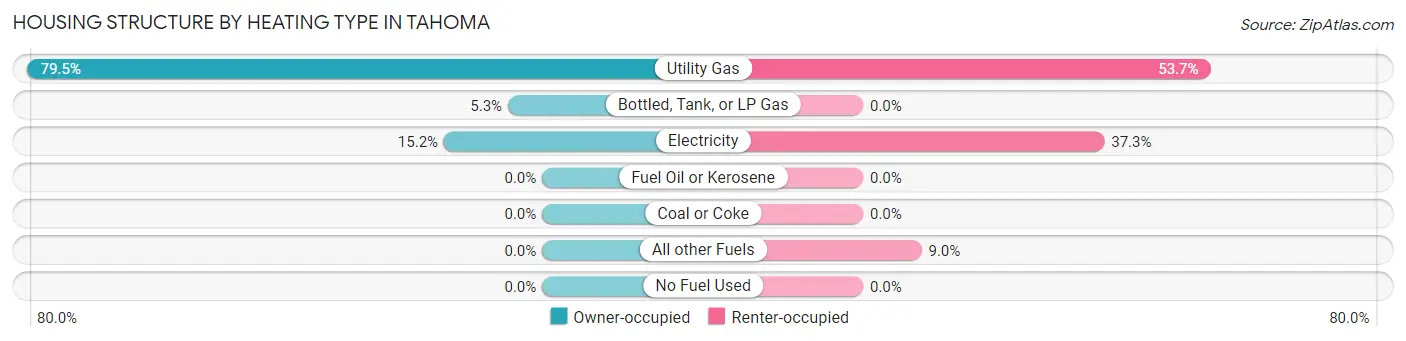
| Heating Type | Owner-occupied | Renter-occupied |
| Utility Gas | 241 (79.5%) | 95 (53.7%) |
| Bottled, Tank, or LP Gas | 16 (5.3%) | 0 (0.0%) |
| Electricity | 46 (15.2%) | 66 (37.3%) |
| Fuel Oil or Kerosene | 0 (0.0%) | 0 (0.0%) |
| Coal or Coke | 0 (0.0%) | 0 (0.0%) |
| All other Fuels | 0 (0.0%) | 16 (9.0%) |
| No Fuel Used | 0 (0.0%) | 0 (0.0%) |
| Total | 303 (100.0%) | 177 (100.0%) |
Household Vehicle Usage in Tahoma

| Vehicles per Household | Owner-occupied | Renter-occupied |
| No Vehicle | 15 (5.0%) | 0 (0.0%) |
| 1 Vehicle | 65 (21.4%) | 35 (19.8%) |
| 2 Vehicles | 119 (39.3%) | 106 (59.9%) |
| 3 or more Vehicles | 104 (34.3%) | 36 (20.3%) |
| Total | 303 (100.0%) | 177 (100.0%) |
Real Estate & Mortgages in Tahoma
Real Estate and Mortgage Overview in Tahoma
| Characteristic | Without Mortgage | With Mortgage |
| Housing Units | 143 | 160 |
| Median Property Value | $887,800 | $703,100 |
| Median Household Income | - | - |
| Monthly Housing Costs | $882 | $28 |
| Real Estate Taxes | $4,227 | $0 |
Property Value by Mortgage Status in Tahoma
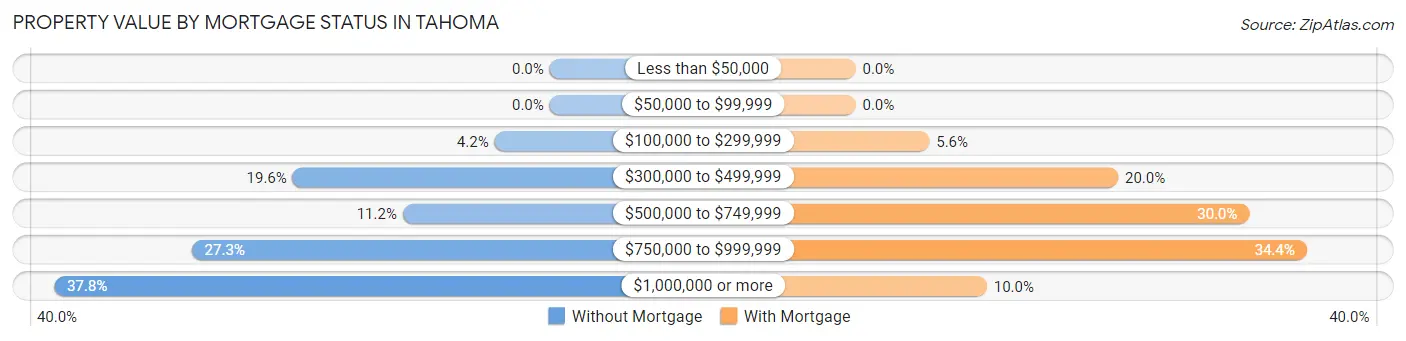
| Property Value | Without Mortgage | With Mortgage |
| Less than $50,000 | 0 (0.0%) | 0 (0.0%) |
| $50,000 to $99,999 | 0 (0.0%) | 0 (0.0%) |
| $100,000 to $299,999 | 6 (4.2%) | 9 (5.6%) |
| $300,000 to $499,999 | 28 (19.6%) | 32 (20.0%) |
| $500,000 to $749,999 | 16 (11.2%) | 48 (30.0%) |
| $750,000 to $999,999 | 39 (27.3%) | 55 (34.4%) |
| $1,000,000 or more | 54 (37.8%) | 16 (10.0%) |
| Total | 143 (100.0%) | 160 (100.0%) |
Household Income by Mortgage Status in Tahoma
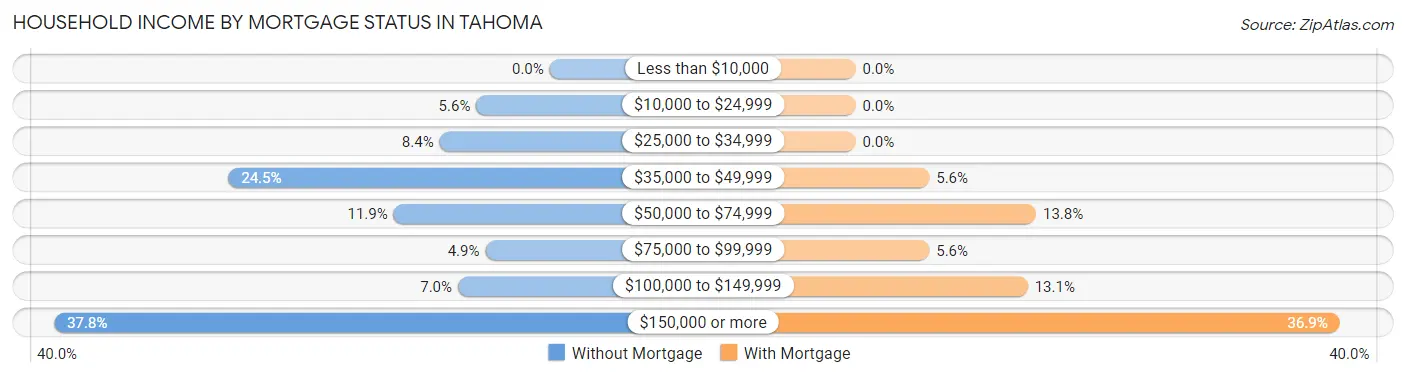
| Household Income | Without Mortgage | With Mortgage |
| Less than $10,000 | 0 (0.0%) | 0 (0.0%) |
| $10,000 to $24,999 | 8 (5.6%) | 0 (0.0%) |
| $25,000 to $34,999 | 12 (8.4%) | 0 (0.0%) |
| $35,000 to $49,999 | 35 (24.5%) | 9 (5.6%) |
| $50,000 to $74,999 | 17 (11.9%) | 22 (13.8%) |
| $75,000 to $99,999 | 7 (4.9%) | 9 (5.6%) |
| $100,000 to $149,999 | 10 (7.0%) | 21 (13.1%) |
| $150,000 or more | 54 (37.8%) | 59 (36.9%) |
| Total | 143 (100.0%) | 160 (100.0%) |
Property Value to Household Income Ratio in Tahoma
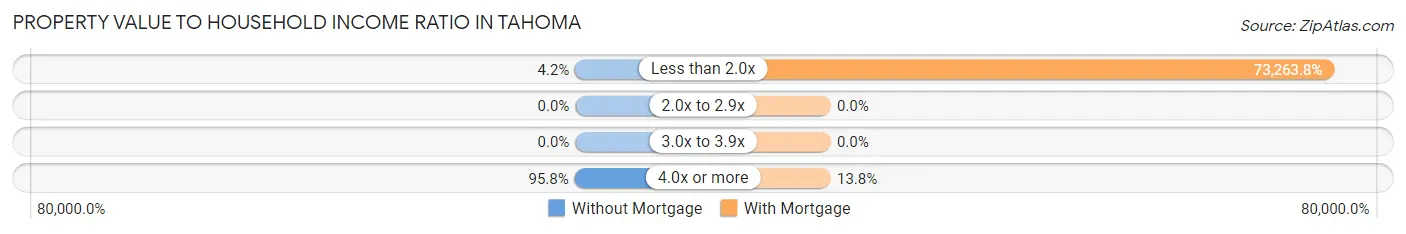
| Value-to-Income Ratio | Without Mortgage | With Mortgage |
| Less than 2.0x | 6 (4.2%) | 117,222 (73,263.8%) |
| 2.0x to 2.9x | 0 (0.0%) | 0 (0.0%) |
| 3.0x to 3.9x | 0 (0.0%) | 0 (0.0%) |
| 4.0x or more | 137 (95.8%) | 22 (13.8%) |
| Total | 143 (100.0%) | 160 (100.0%) |
Real Estate Taxes by Mortgage Status in Tahoma
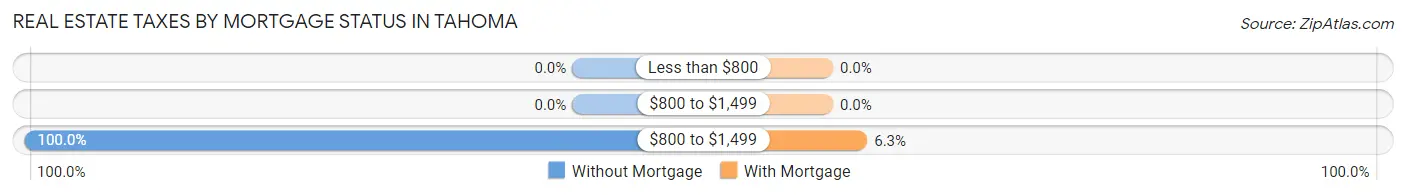
| Property Taxes | Without Mortgage | With Mortgage |
| Less than $800 | 0 (0.0%) | 0 (0.0%) |
| $800 to $1,499 | 0 (0.0%) | 0 (0.0%) |
| $800 to $1,499 | 143 (100.0%) | 10 (6.2%) |
| Total | 143 (100.0%) | 160 (100.0%) |
Health & Disability in Tahoma
Health Insurance Coverage by Age in Tahoma
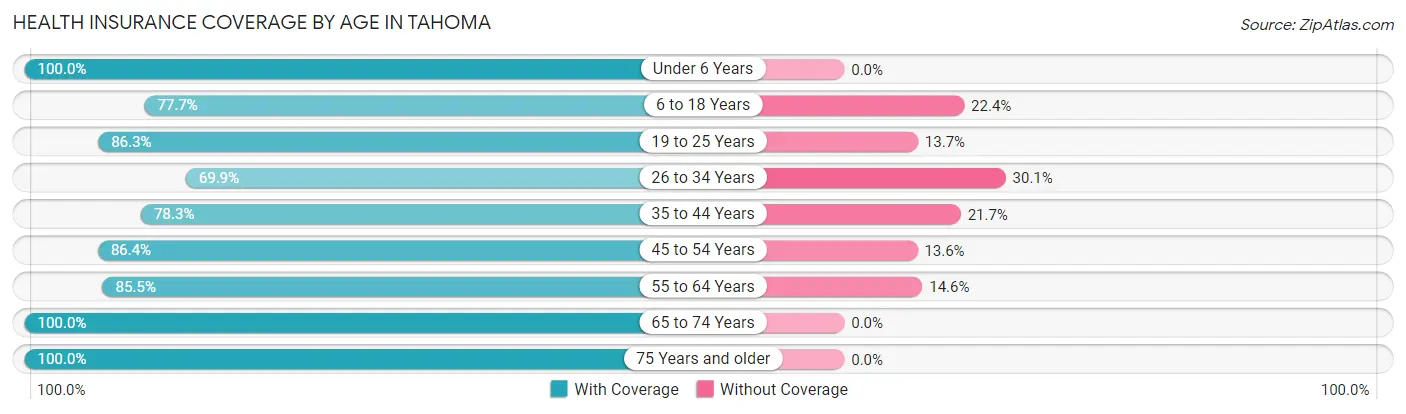
| Age Bracket | With Coverage | Without Coverage |
| Under 6 Years | 61 (100.0%) | 0 (0.0%) |
| 6 to 18 Years | 66 (77.6%) | 19 (22.4%) |
| 19 to 25 Years | 88 (86.3%) | 14 (13.7%) |
| 26 to 34 Years | 165 (69.9%) | 71 (30.1%) |
| 35 to 44 Years | 101 (78.3%) | 28 (21.7%) |
| 45 to 54 Years | 152 (86.4%) | 24 (13.6%) |
| 55 to 64 Years | 94 (85.5%) | 16 (14.5%) |
| 65 to 74 Years | 137 (100.0%) | 0 (0.0%) |
| 75 Years and older | 35 (100.0%) | 0 (0.0%) |
| Total | 899 (83.9%) | 172 (16.1%) |
Health Insurance Coverage by Citizenship Status in Tahoma
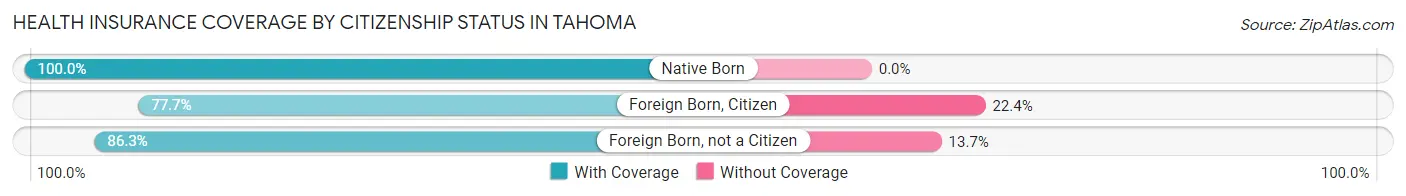
| Citizenship Status | With Coverage | Without Coverage |
| Native Born | 61 (100.0%) | 0 (0.0%) |
| Foreign Born, Citizen | 66 (77.6%) | 19 (22.4%) |
| Foreign Born, not a Citizen | 88 (86.3%) | 14 (13.7%) |
Health Insurance Coverage by Household Income in Tahoma
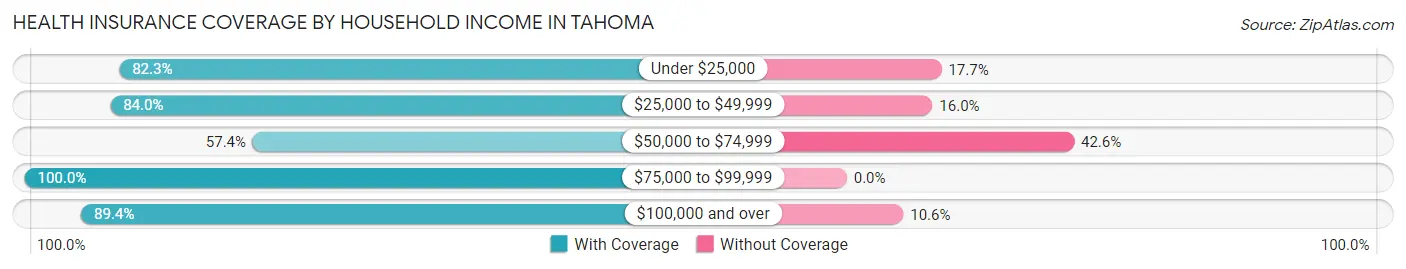
| Household Income | With Coverage | Without Coverage |
| Under $25,000 | 102 (82.3%) | 22 (17.7%) |
| $25,000 to $49,999 | 157 (84.0%) | 30 (16.0%) |
| $50,000 to $74,999 | 89 (57.4%) | 66 (42.6%) |
| $75,000 to $99,999 | 95 (100.0%) | 0 (0.0%) |
| $100,000 and over | 456 (89.4%) | 54 (10.6%) |
Public vs Private Health Insurance Coverage by Age in Tahoma
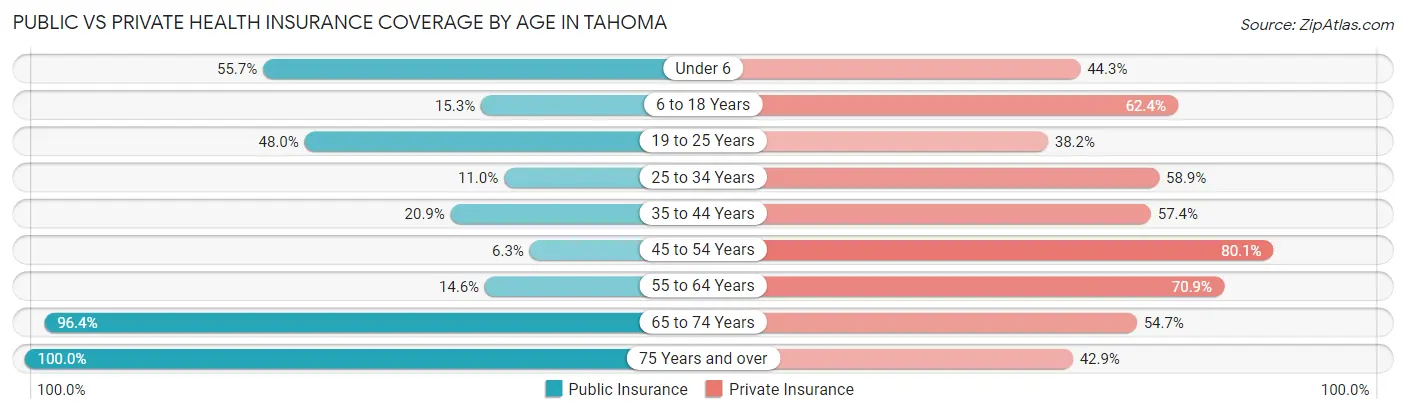
| Age Bracket | Public Insurance | Private Insurance |
| Under 6 | 34 (55.7%) | 27 (44.3%) |
| 6 to 18 Years | 13 (15.3%) | 53 (62.4%) |
| 19 to 25 Years | 49 (48.0%) | 39 (38.2%) |
| 25 to 34 Years | 26 (11.0%) | 139 (58.9%) |
| 35 to 44 Years | 27 (20.9%) | 74 (57.4%) |
| 45 to 54 Years | 11 (6.2%) | 141 (80.1%) |
| 55 to 64 Years | 16 (14.5%) | 78 (70.9%) |
| 65 to 74 Years | 132 (96.4%) | 75 (54.7%) |
| 75 Years and over | 35 (100.0%) | 15 (42.9%) |
| Total | 343 (32.0%) | 641 (59.9%) |
Disability Status by Sex by Age in Tahoma
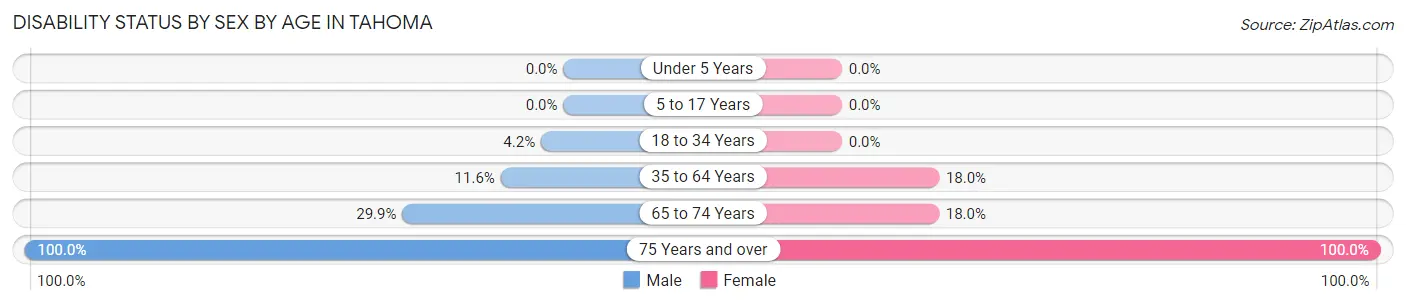
| Age Bracket | Male | Female |
| Under 5 Years | 0 (0.0%) | 0 (0.0%) |
| 5 to 17 Years | 0 (0.0%) | 0 (0.0%) |
| 18 to 34 Years | 10 (4.2%) | 0 (0.0%) |
| 35 to 64 Years | 27 (11.6%) | 33 (18.0%) |
| 65 to 74 Years | 26 (29.9%) | 9 (18.0%) |
| 75 Years and over | 12 (100.0%) | 23 (100.0%) |
Disability Class by Sex by Age in Tahoma
Disability Class: Hearing Difficulty
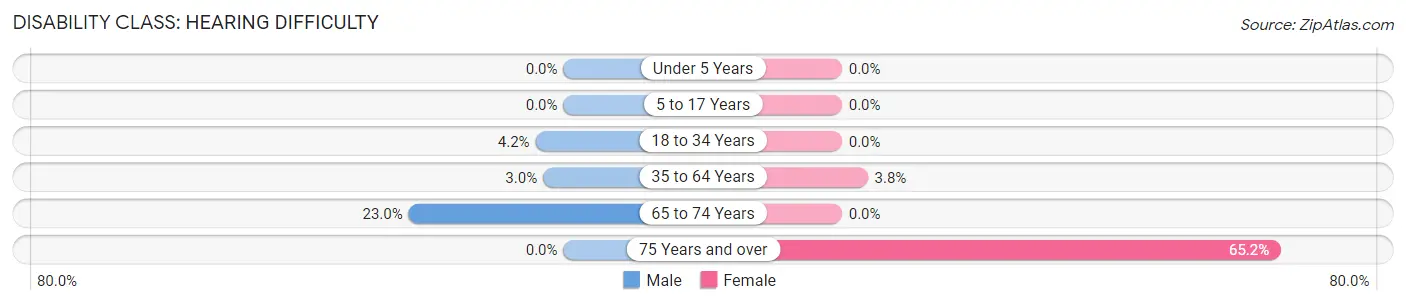
| Age Bracket | Male | Female |
| Under 5 Years | 0 (0.0%) | 0 (0.0%) |
| 5 to 17 Years | 0 (0.0%) | 0 (0.0%) |
| 18 to 34 Years | 10 (4.2%) | 0 (0.0%) |
| 35 to 64 Years | 7 (3.0%) | 7 (3.8%) |
| 65 to 74 Years | 20 (23.0%) | 0 (0.0%) |
| 75 Years and over | 0 (0.0%) | 15 (65.2%) |
Disability Class: Vision Difficulty
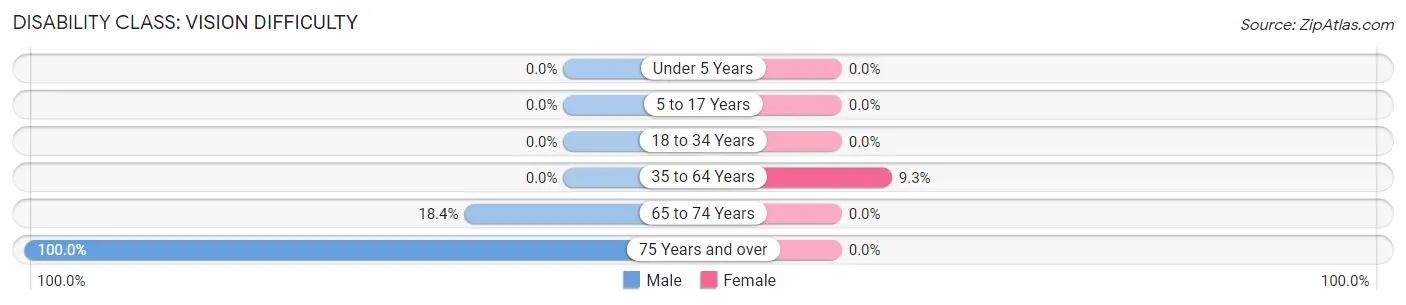
| Age Bracket | Male | Female |
| Under 5 Years | 0 (0.0%) | 0 (0.0%) |
| 5 to 17 Years | 0 (0.0%) | 0 (0.0%) |
| 18 to 34 Years | 0 (0.0%) | 0 (0.0%) |
| 35 to 64 Years | 0 (0.0%) | 17 (9.3%) |
| 65 to 74 Years | 16 (18.4%) | 0 (0.0%) |
| 75 Years and over | 12 (100.0%) | 0 (0.0%) |
Disability Class: Cognitive Difficulty
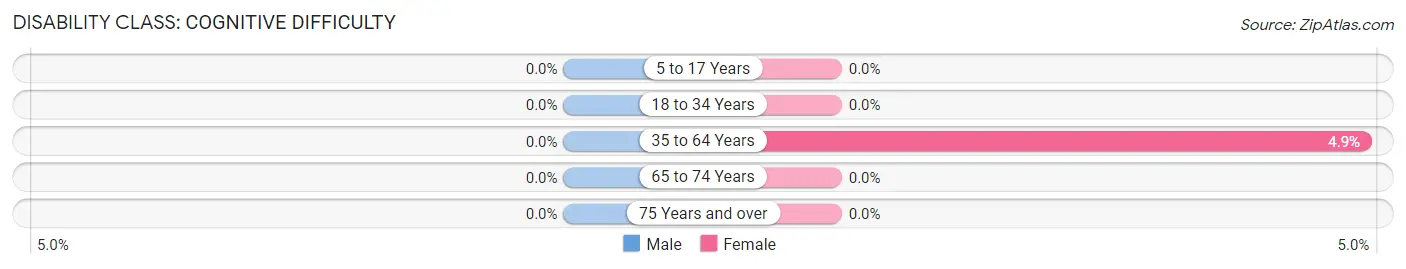
| Age Bracket | Male | Female |
| 5 to 17 Years | 0 (0.0%) | 0 (0.0%) |
| 18 to 34 Years | 0 (0.0%) | 0 (0.0%) |
| 35 to 64 Years | 0 (0.0%) | 9 (4.9%) |
| 65 to 74 Years | 0 (0.0%) | 0 (0.0%) |
| 75 Years and over | 0 (0.0%) | 0 (0.0%) |
Disability Class: Ambulatory Difficulty
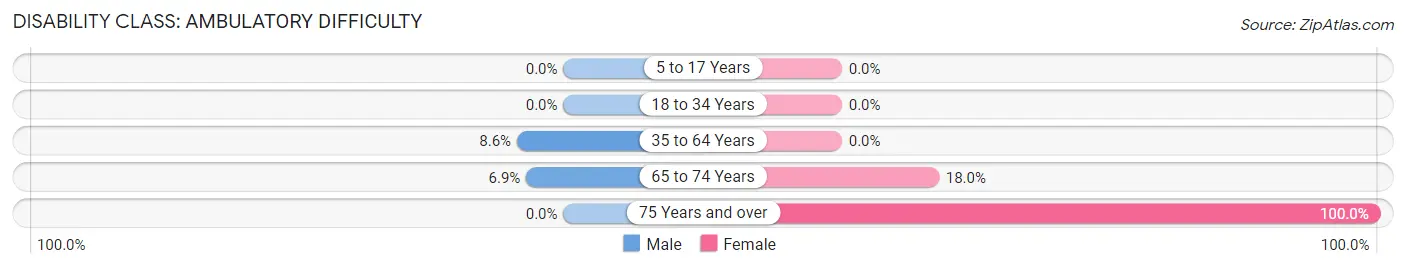
| Age Bracket | Male | Female |
| 5 to 17 Years | 0 (0.0%) | 0 (0.0%) |
| 18 to 34 Years | 0 (0.0%) | 0 (0.0%) |
| 35 to 64 Years | 20 (8.6%) | 0 (0.0%) |
| 65 to 74 Years | 6 (6.9%) | 9 (18.0%) |
| 75 Years and over | 0 (0.0%) | 23 (100.0%) |
Disability Class: Self-Care Difficulty
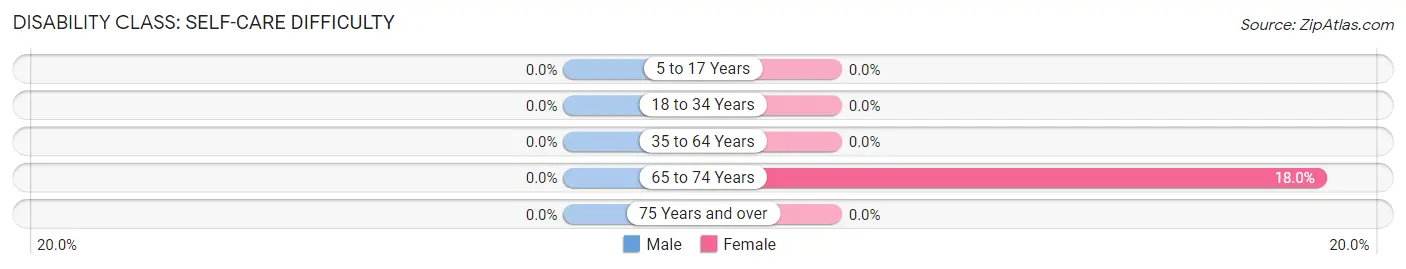
| Age Bracket | Male | Female |
| 5 to 17 Years | 0 (0.0%) | 0 (0.0%) |
| 18 to 34 Years | 0 (0.0%) | 0 (0.0%) |
| 35 to 64 Years | 0 (0.0%) | 0 (0.0%) |
| 65 to 74 Years | 0 (0.0%) | 9 (18.0%) |
| 75 Years and over | 0 (0.0%) | 0 (0.0%) |
Technology Access in Tahoma
Computing Device Access in Tahoma
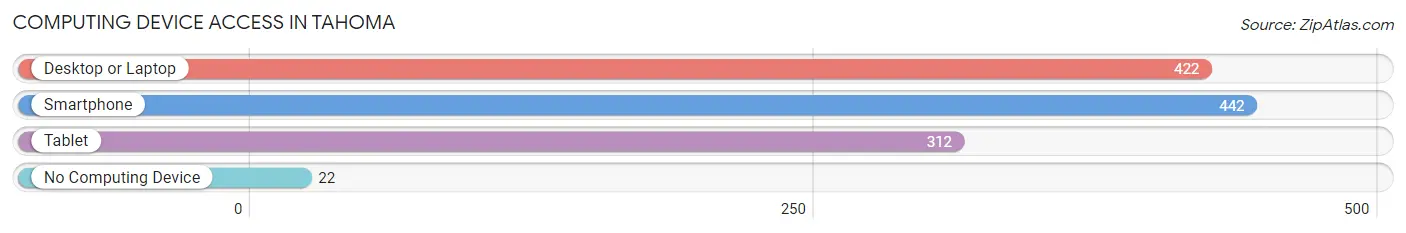
| Device Type | # Households | % Households |
| Desktop or Laptop | 422 | 87.9% |
| Smartphone | 442 | 92.1% |
| Tablet | 312 | 65.0% |
| No Computing Device | 22 | 4.6% |
| Total | 480 | 100.0% |
Internet Access in Tahoma
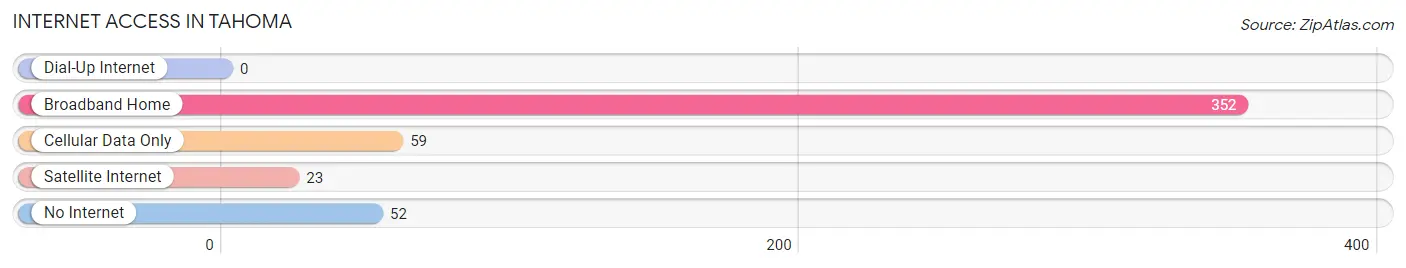
| Internet Type | # Households | % Households |
| Dial-Up Internet | 0 | 0.0% |
| Broadband Home | 352 | 73.3% |
| Cellular Data Only | 59 | 12.3% |
| Satellite Internet | 23 | 4.8% |
| No Internet | 52 | 10.8% |
| Total | 480 | 100.0% |
Tahoma Summary
Tahoma is a small unincorporated community located in El Dorado County, California. It is situated in the Sierra Nevada mountain range, approximately 8 miles south of Lake Tahoe. The community is located in the Tahoe National Forest and is surrounded by the Eldorado National Forest. The population of Tahoma was estimated to be 1,093 in the 2010 census.
History
Tahoma was originally inhabited by the Washoe people, who were the original inhabitants of the Lake Tahoe area. The Washoe people were hunter-gatherers who lived in the area for thousands of years before the arrival of European settlers.
The first European settlers arrived in the area in the late 1800s. The area was originally known as “Tahoe Valley” and was home to a number of small farms and ranches. In the early 1900s, the area was renamed “Tahoma” after the Washoe word for “big water”.
In the 1920s, the area began to attract tourists and vacationers from the Bay Area and beyond. The area was home to a number of resorts, including the Tahoma Lodge, which was built in 1924. The lodge was a popular destination for fishing, hunting, and skiing.
In the 1950s, the area began to attract more permanent residents. The population of Tahoma grew steadily throughout the 1950s and 1960s, reaching a peak of 1,093 in the 2010 census.
Geography
Tahoma is located in the Sierra Nevada mountain range, approximately 8 miles south of Lake Tahoe. The community is situated in the Tahoe National Forest and is surrounded by the Eldorado National Forest. The area is characterized by steep terrain, with elevations ranging from 6,000 to 8,000 feet.
The climate in Tahoma is typical of the Sierra Nevada mountain range, with cold winters and mild summers. The average annual temperature is approximately 45 degrees Fahrenheit. The area receives an average of 60 inches of precipitation per year, with most of the precipitation falling in the form of snow.
Economy
The economy of Tahoma is largely based on tourism and recreation. The area is home to a number of resorts, including the Tahoma Lodge, which is a popular destination for fishing, hunting, and skiing. The area is also home to a number of small businesses, including restaurants, shops, and lodging.
The area is also home to a number of outdoor recreation activities, including hiking, camping, and mountain biking. The area is also popular for its scenic beauty, with a number of lakes, rivers, and streams in the area.
Demographics
The population of Tahoma was estimated to be 1,093 in the 2010 census. The population is largely white, with approximately 90% of the population identifying as white. The median age of the population is 44.5 years, with approximately 25% of the population under the age of 18.
The median household income in Tahoma is $50,000, which is slightly lower than the median household income for El Dorado County. The median home value in Tahoma is $400,000, which is significantly higher than the median home value for El Dorado County.
Conclusion
Tahoma is a small unincorporated community located in El Dorado County, California. It is situated in the Sierra Nevada mountain range, approximately 8 miles south of Lake Tahoe. The community is located in the Tahoe National Forest and is surrounded by the Eldorado National Forest. The population of Tahoma was estimated to be 1,093 in the 2010 census. The economy of Tahoma is largely based on tourism and recreation, with a number of resorts, restaurants, and shops in the area. The population of Tahoma is largely white, with a median age of 44.5 years and a median household income of $50,000.
Common Questions
What is Per Capita Income in Tahoma?
Per Capita income in Tahoma is $52,532.
What is the Median Family Income in Tahoma?
Median Family Income in Tahoma is $115,278.
What is the Median Household income in Tahoma?
Median Household Income in Tahoma is $83,971.
What is Income or Wage Gap in Tahoma?
Income or Wage Gap in Tahoma is 44.2%.
Women in Tahoma earn 55.8 cents for every dollar earned by a man.
What is Inequality or Gini Index in Tahoma?
Inequality or Gini Index in Tahoma is 0.48.
What is the Total Population of Tahoma?
Total Population of Tahoma is 1,071.
What is the Total Male Population of Tahoma?
Total Male Population of Tahoma is 634.
What is the Total Female Population of Tahoma?
Total Female Population of Tahoma is 437.
What is the Ratio of Males per 100 Females in Tahoma?
There are 145.08 Males per 100 Females in Tahoma.
What is the Ratio of Females per 100 Males in Tahoma?
There are 68.93 Females per 100 Males in Tahoma.
What is the Median Population Age in Tahoma?
Median Population Age in Tahoma is 39.3 Years.
What is the Average Family Size in Tahoma
Average Family Size in Tahoma is 2.6 People.
What is the Average Household Size in Tahoma
Average Household Size in Tahoma is 2.2 People.
How Large is the Labor Force in Tahoma?
There are 713 People in the Labor Forcein in Tahoma.
What is the Percentage of People in the Labor Force in Tahoma?
75.3% of People are in the Labor Force in Tahoma.
What is the Unemployment Rate in Tahoma?
Unemployment Rate in Tahoma is 3.9%.