Tahoe Vista, CA Map & Demographics
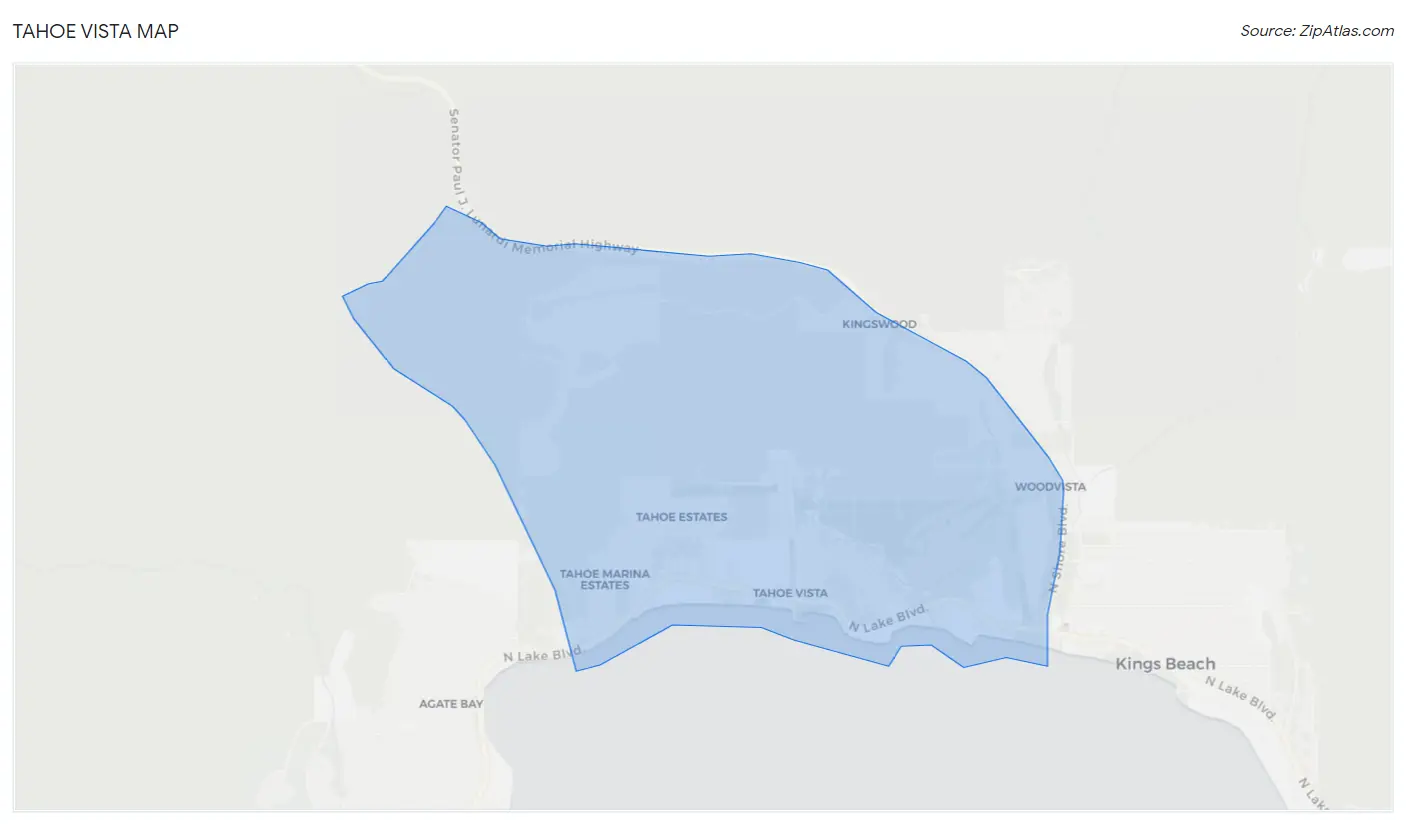
Tahoe Vista Map
Tahoe Vista Overview
$51,560
PER CAPITA INCOME
$106,542
AVG FAMILY INCOME
$91,944
AVG HOUSEHOLD INCOME
0.44
INEQUALITY / GINI INDEX
1,171
TOTAL POPULATION
475
MALE POPULATION
696
FEMALE POPULATION
68.25
MALES / 100 FEMALES
146.53
FEMALES / 100 MALES
50.3
MEDIAN AGE
2.9
AVG FAMILY SIZE
2.4
AVG HOUSEHOLD SIZE
674
LABOR FORCE [ PEOPLE ]
67.9%
PERCENT IN LABOR FORCE
Tahoe Vista Zip Codes
Income in Tahoe Vista
Income Overview in Tahoe Vista
Per Capita Income in Tahoe Vista is $51,560, while median incomes of families and households are $106,542 and $91,944 respectively.
| Characteristic | Number | Measure |
| Per Capita Income | 1,171 | $51,560 |
| Median Family Income | 345 | $106,542 |
| Mean Family Income | 345 | $150,583 |
| Median Household Income | 488 | $91,944 |
| Mean Household Income | 488 | $124,683 |
| Income Deficit | 345 | $0 |
| Wage / Income Gap (%) | 1,171 | 0.00% |
| Wage / Income Gap ($) | 1,171 | 100.00¢ per $1 |
| Gini / Inequality Index | 1,171 | 0.44 |
Earnings by Sex in Tahoe Vista
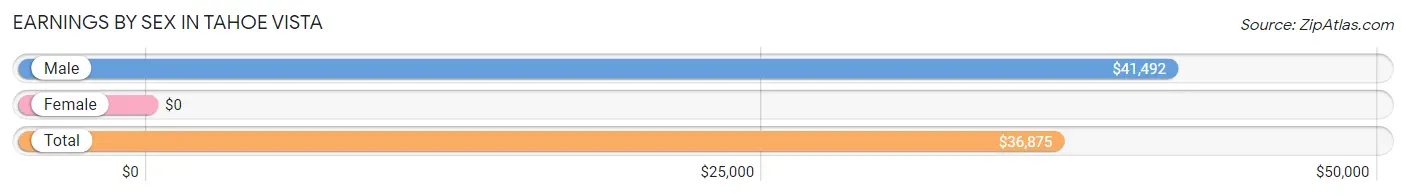
| Sex | Number | Average Earnings |
| Male | 361 (51.0%) | $41,492 |
| Female | 347 (49.0%) | $0 |
| Total | 708 (100.0%) | $36,875 |
Earnings by Sex by Income Bracket in Tahoe Vista
The most common earnings brackets in Tahoe Vista are $100,000+ for men (81 | 22.4%) and $5,000 to $7,499 for women (46 | 13.3%).
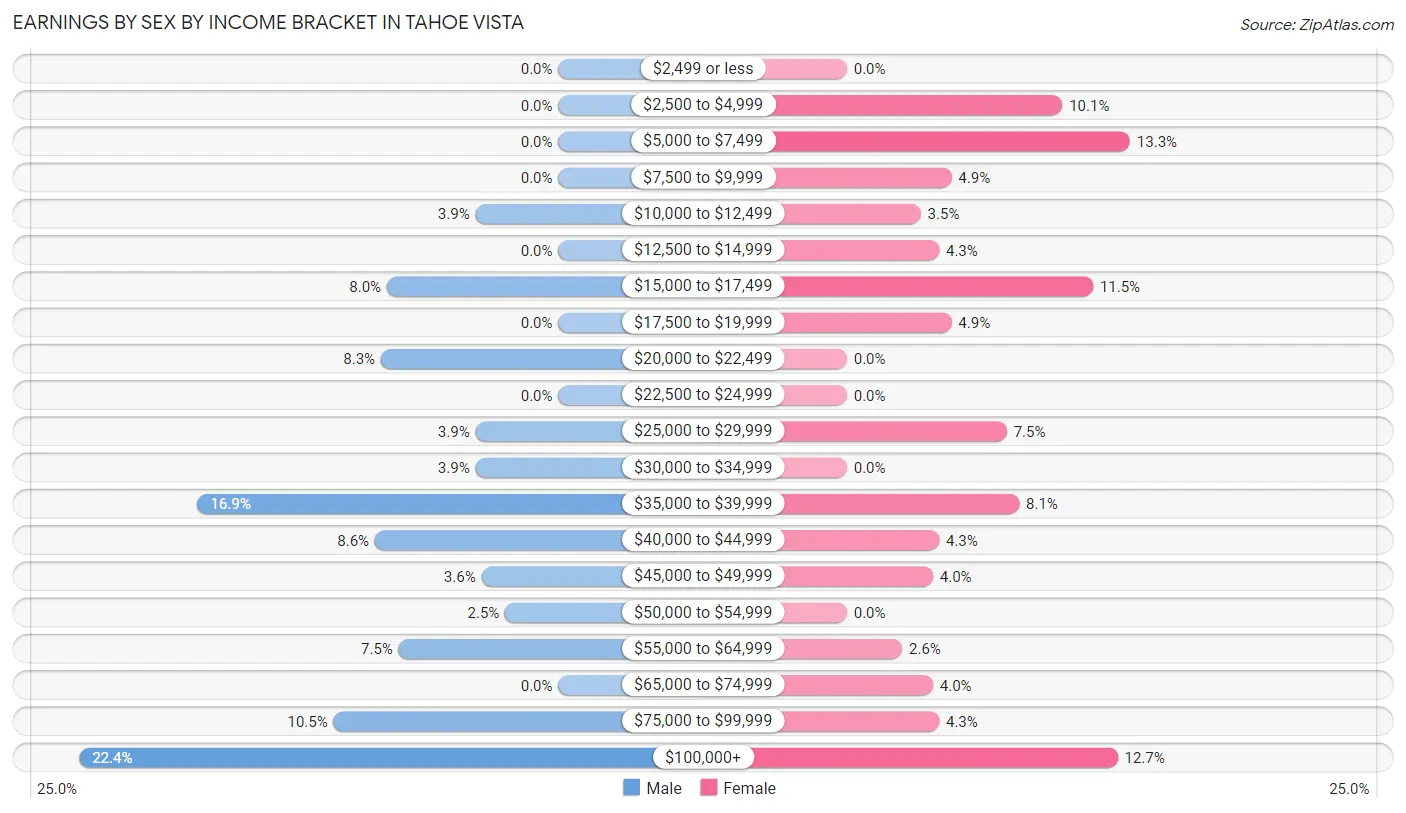
| Income | Male | Female |
| $2,499 or less | 0 (0.0%) | 0 (0.0%) |
| $2,500 to $4,999 | 0 (0.0%) | 35 (10.1%) |
| $5,000 to $7,499 | 0 (0.0%) | 46 (13.3%) |
| $7,500 to $9,999 | 0 (0.0%) | 17 (4.9%) |
| $10,000 to $12,499 | 14 (3.9%) | 12 (3.5%) |
| $12,500 to $14,999 | 0 (0.0%) | 15 (4.3%) |
| $15,000 to $17,499 | 29 (8.0%) | 40 (11.5%) |
| $17,500 to $19,999 | 0 (0.0%) | 17 (4.9%) |
| $20,000 to $22,499 | 30 (8.3%) | 0 (0.0%) |
| $22,500 to $24,999 | 0 (0.0%) | 0 (0.0%) |
| $25,000 to $29,999 | 14 (3.9%) | 26 (7.5%) |
| $30,000 to $34,999 | 14 (3.9%) | 0 (0.0%) |
| $35,000 to $39,999 | 61 (16.9%) | 28 (8.1%) |
| $40,000 to $44,999 | 31 (8.6%) | 15 (4.3%) |
| $45,000 to $49,999 | 13 (3.6%) | 14 (4.0%) |
| $50,000 to $54,999 | 9 (2.5%) | 0 (0.0%) |
| $55,000 to $64,999 | 27 (7.5%) | 9 (2.6%) |
| $65,000 to $74,999 | 0 (0.0%) | 14 (4.0%) |
| $75,000 to $99,999 | 38 (10.5%) | 15 (4.3%) |
| $100,000+ | 81 (22.4%) | 44 (12.7%) |
| Total | 361 (100.0%) | 347 (100.0%) |
Earnings by Sex by Educational Attainment in Tahoe Vista
Average earnings in Tahoe Vista are $41,492 for men and $32,500 for women, a difference of 21.7%. Men with an educational attainment of bachelor's degree enjoy the highest average annual earnings of $158,398, while those with college or associate's degree education earn the least with $34,464. Women with an educational attainment of college or associate's degree earn the most with the average annual earnings of $42,250, while those with bachelor's degree education have the smallest earnings of $29,167.
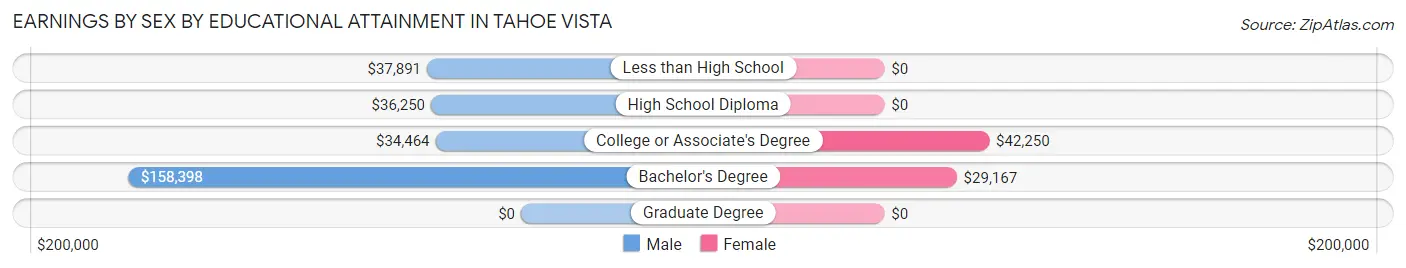
| Educational Attainment | Male Income | Female Income |
| Less than High School | $37,891 | $0 |
| High School Diploma | $36,250 | $0 |
| College or Associate's Degree | $34,464 | $42,250 |
| Bachelor's Degree | $158,398 | $29,167 |
| Graduate Degree | - | - |
| Total | $41,492 | $32,500 |
Family Income in Tahoe Vista
Family Income Brackets in Tahoe Vista
According to the Tahoe Vista family income data, there are 102 families falling into the $200,000+ income range, which is the most common income bracket and makes up 29.6% of all families.
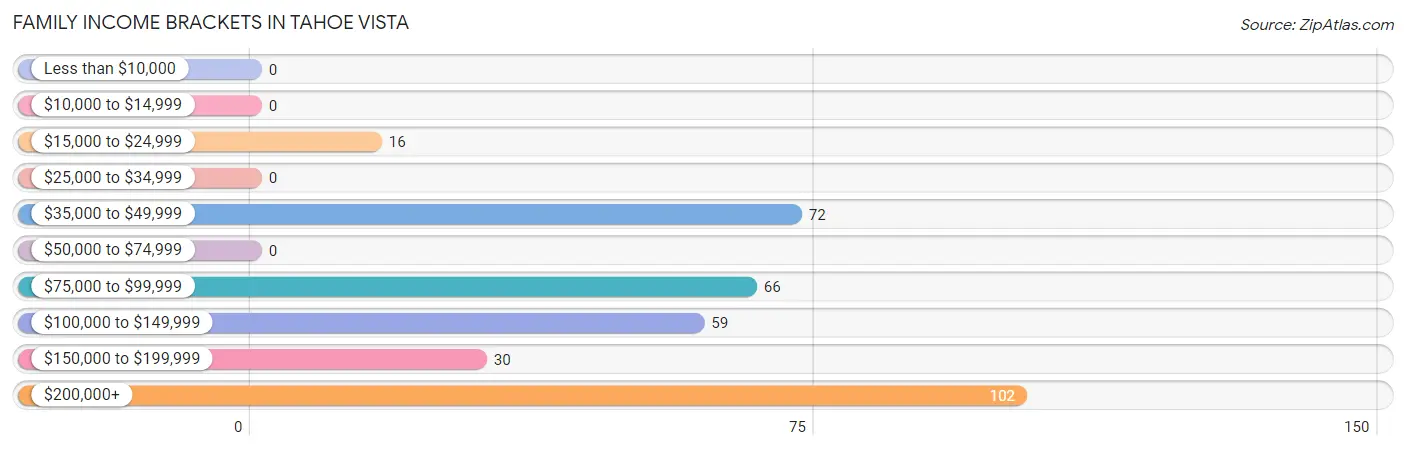
| Income Bracket | # Families | % Families |
| Less than $10,000 | 0 | 0.0% |
| $10,000 to $14,999 | 0 | 0.0% |
| $15,000 to $24,999 | 16 | 4.6% |
| $25,000 to $34,999 | 0 | 0.0% |
| $35,000 to $49,999 | 72 | 20.9% |
| $50,000 to $74,999 | 0 | 0.0% |
| $75,000 to $99,999 | 66 | 19.1% |
| $100,000 to $149,999 | 59 | 17.1% |
| $150,000 to $199,999 | 30 | 8.7% |
| $200,000+ | 102 | 29.6% |
Family Income by Famaliy Size in Tahoe Vista
| Income Bracket | # Families | Median Income |
| 2-Person Families | 186 (53.9%) | $0 |
| 3-Person Families | 89 (25.8%) | $0 |
| 4-Person Families | 13 (3.8%) | $0 |
| 5-Person Families | 28 (8.1%) | $0 |
| 6-Person Families | 29 (8.4%) | $0 |
| 7+ Person Families | 0 (0.0%) | $0 |
| Total | 345 (100.0%) | $106,542 |
Family Income by Number of Earners in Tahoe Vista
| Number of Earners | # Families | Median Income |
| No Earners | 50 (14.5%) | $0 |
| 1 Earner | 89 (25.8%) | $0 |
| 2 Earners | 164 (47.5%) | $0 |
| 3+ Earners | 42 (12.2%) | $0 |
| Total | 345 (100.0%) | $106,542 |
Household Income in Tahoe Vista
Household Income Brackets in Tahoe Vista
With 116 households falling in the category, the $35,000 to $49,999 income range is the most frequent in Tahoe Vista, accounting for 23.8% of all households.
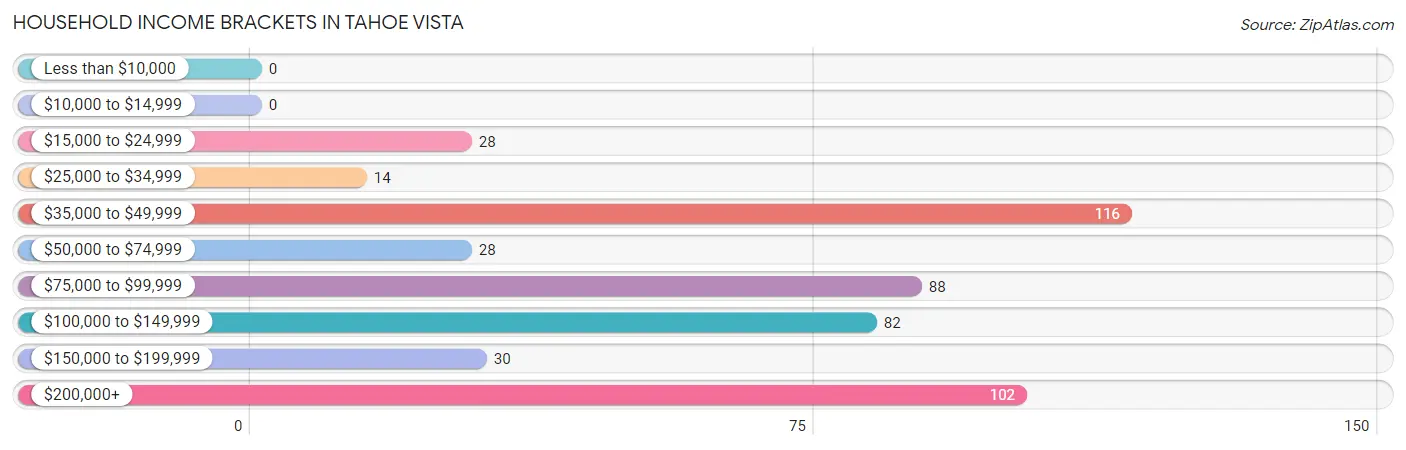
| Income Bracket | # Households | % Households |
| Less than $10,000 | 0 | 0.0% |
| $10,000 to $14,999 | 0 | 0.0% |
| $15,000 to $24,999 | 28 | 5.7% |
| $25,000 to $34,999 | 14 | 2.9% |
| $35,000 to $49,999 | 116 | 23.8% |
| $50,000 to $74,999 | 28 | 5.7% |
| $75,000 to $99,999 | 88 | 18.0% |
| $100,000 to $149,999 | 82 | 16.8% |
| $150,000 to $199,999 | 30 | 6.1% |
| $200,000+ | 102 | 20.9% |
Household Income by Householder Age in Tahoe Vista
The median household income in Tahoe Vista is $91,944, with the highest median household income of $105,375 found in the 65+ years age bracket for the primary householder. A total of 195 households (40.0%) fall into this category.
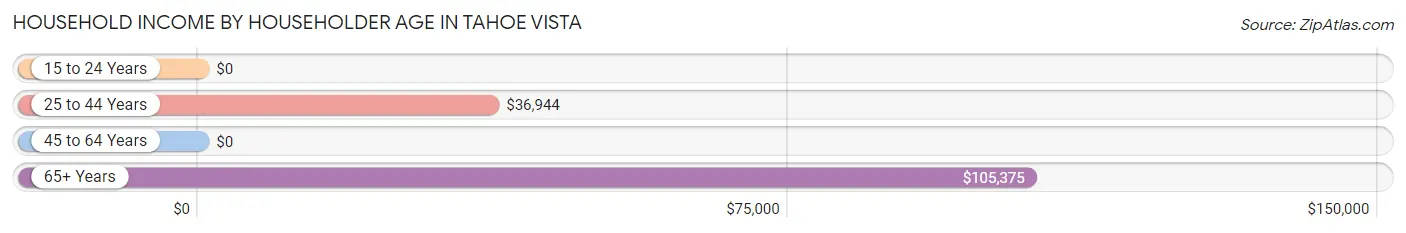
| Income Bracket | # Households | Median Income |
| 15 to 24 Years | 0 (0.0%) | $0 |
| 25 to 44 Years | 94 (19.3%) | $36,944 |
| 45 to 64 Years | 199 (40.8%) | $0 |
| 65+ Years | 195 (40.0%) | $105,375 |
| Total | 488 (100.0%) | $91,944 |
Poverty in Tahoe Vista
Income Below Poverty by Sex and Age in Tahoe Vista
With 9.3% poverty level for males and 7.3% for females among the residents of Tahoe Vista, 25 to 34 year old males and 45 to 54 year old females are the most vulnerable to poverty, with 14 males (60.9%) and 16 females (53.3%) in their respective age groups living below the poverty level.
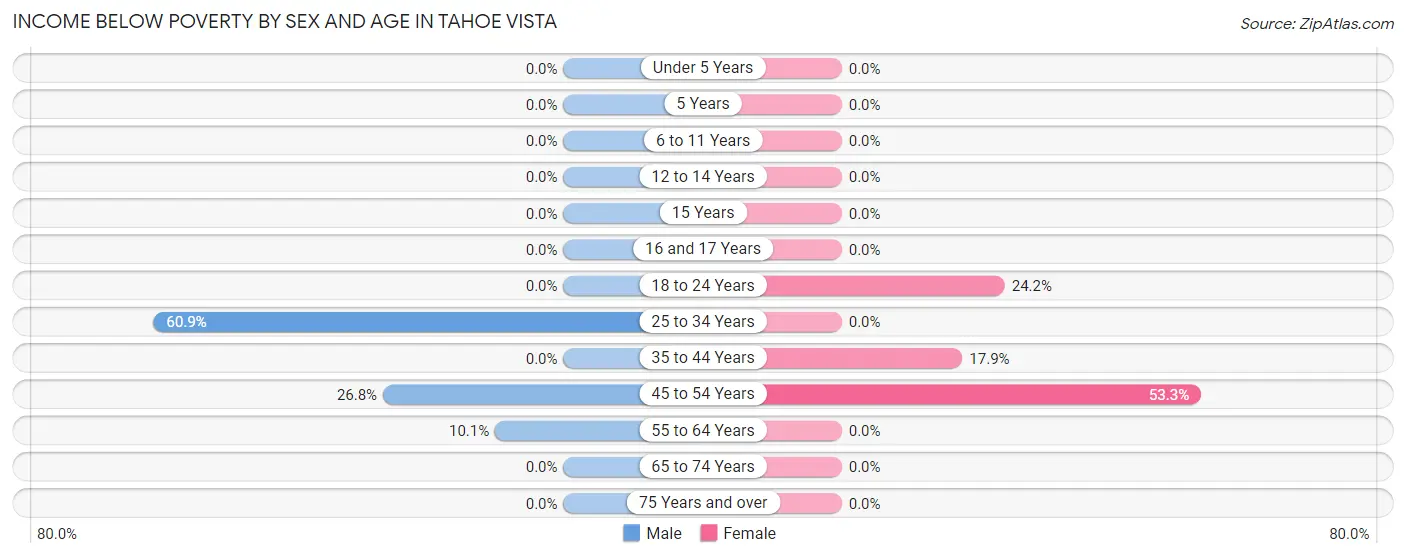
| Age Bracket | Male | Female |
| Under 5 Years | 0 (0.0%) | 0 (0.0%) |
| 5 Years | 0 (0.0%) | 0 (0.0%) |
| 6 to 11 Years | 0 (0.0%) | 0 (0.0%) |
| 12 to 14 Years | 0 (0.0%) | 0 (0.0%) |
| 15 Years | 0 (0.0%) | 0 (0.0%) |
| 16 and 17 Years | 0 (0.0%) | 0 (0.0%) |
| 18 to 24 Years | 0 (0.0%) | 23 (24.2%) |
| 25 to 34 Years | 14 (60.9%) | 0 (0.0%) |
| 35 to 44 Years | 0 (0.0%) | 12 (17.9%) |
| 45 to 54 Years | 15 (26.8%) | 16 (53.3%) |
| 55 to 64 Years | 15 (10.1%) | 0 (0.0%) |
| 65 to 74 Years | 0 (0.0%) | 0 (0.0%) |
| 75 Years and over | 0 (0.0%) | 0 (0.0%) |
| Total | 44 (9.3%) | 51 (7.3%) |
Income Above Poverty by Sex and Age in Tahoe Vista
According to the poverty statistics in Tahoe Vista, males aged under 5 years and females aged under 5 years are the age groups that are most secure financially, with 100.0% of males and 100.0% of females in these age groups living above the poverty line.
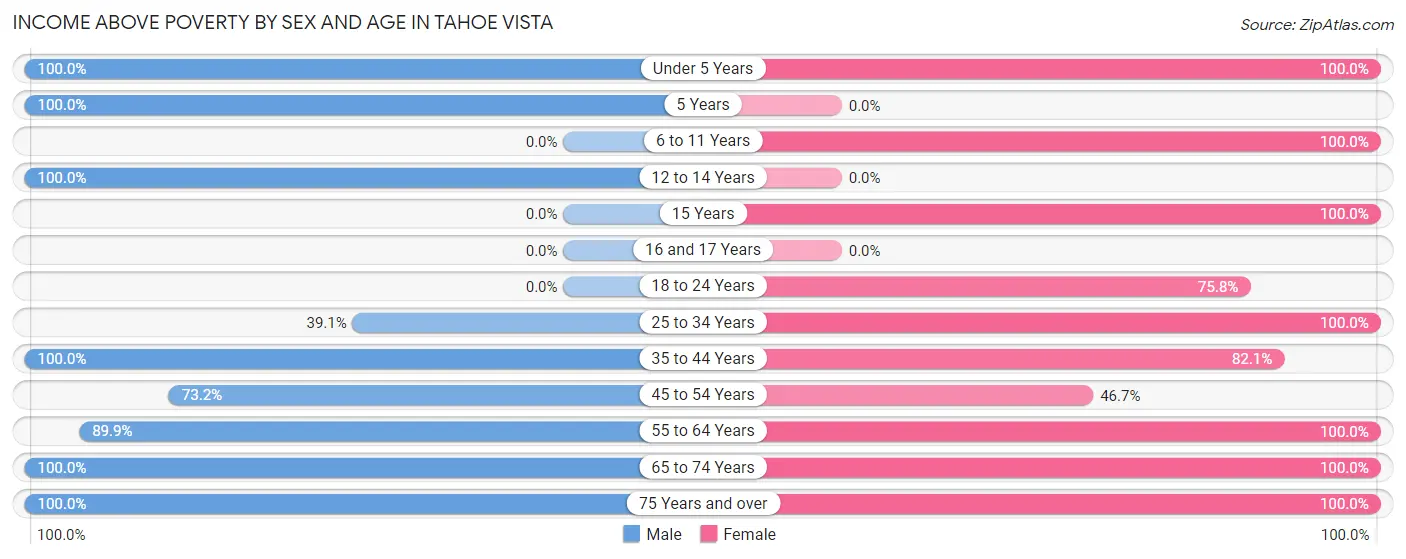
| Age Bracket | Male | Female |
| Under 5 Years | 19 (100.0%) | 14 (100.0%) |
| 5 Years | 12 (100.0%) | 0 (0.0%) |
| 6 to 11 Years | 0 (0.0%) | 108 (100.0%) |
| 12 to 14 Years | 12 (100.0%) | 0 (0.0%) |
| 15 Years | 0 (0.0%) | 14 (100.0%) |
| 16 and 17 Years | 0 (0.0%) | 0 (0.0%) |
| 18 to 24 Years | 0 (0.0%) | 72 (75.8%) |
| 25 to 34 Years | 9 (39.1%) | 54 (100.0%) |
| 35 to 44 Years | 92 (100.0%) | 55 (82.1%) |
| 45 to 54 Years | 41 (73.2%) | 14 (46.7%) |
| 55 to 64 Years | 133 (89.9%) | 156 (100.0%) |
| 65 to 74 Years | 100 (100.0%) | 121 (100.0%) |
| 75 Years and over | 13 (100.0%) | 37 (100.0%) |
| Total | 431 (90.7%) | 645 (92.7%) |
Income Below Poverty Among Married-Couple Families in Tahoe Vista
The poverty statistics for married-couple families in Tahoe Vista show that 5.8% or 16 of the total 277 families live below the poverty line. Families with no children have the highest poverty rate of 8.3%, comprising of 16 families. On the other hand, families with 1 or 2 children have the lowest poverty rate of 0.0%, which includes 0 families.
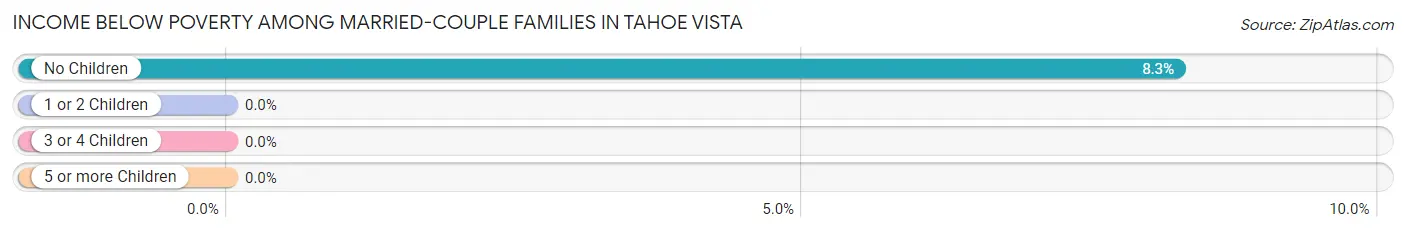
| Children | Above Poverty | Below Poverty |
| No Children | 178 (91.7%) | 16 (8.3%) |
| 1 or 2 Children | 55 (100.0%) | 0 (0.0%) |
| 3 or 4 Children | 28 (100.0%) | 0 (0.0%) |
| 5 or more Children | 0 (0.0%) | 0 (0.0%) |
| Total | 261 (94.2%) | 16 (5.8%) |
Income Below Poverty Among Single-Parent Households in Tahoe Vista
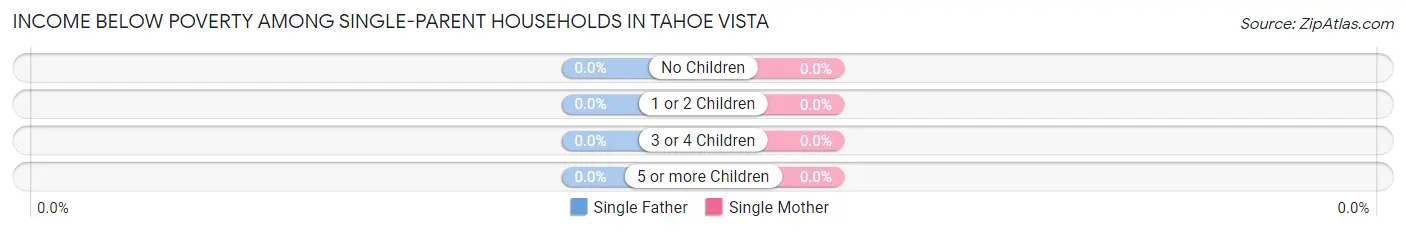
| Children | Single Father | Single Mother |
| No Children | 0 (0.0%) | 0 (0.0%) |
| 1 or 2 Children | 0 (0.0%) | 0 (0.0%) |
| 3 or 4 Children | 0 (0.0%) | 0 (0.0%) |
| 5 or more Children | 0 (0.0%) | 0 (0.0%) |
| Total | 0 (0.0%) | 0 (0.0%) |
Income Below Poverty Among Married-Couple vs Single-Parent Households in Tahoe Vista
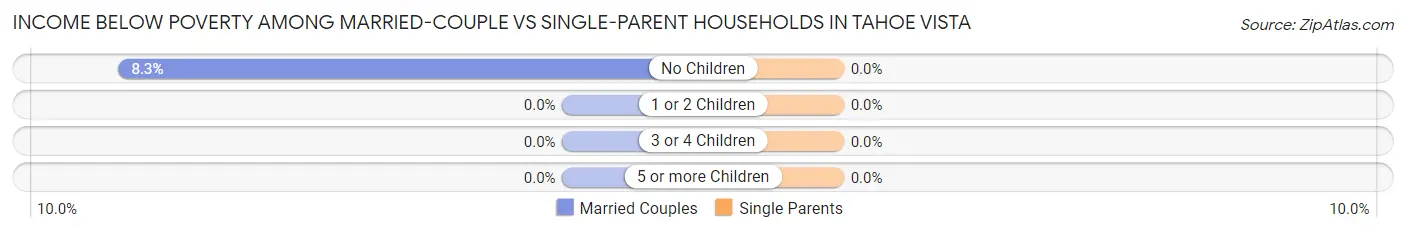
| Children | Married-Couple Families | Single-Parent Households |
| No Children | 16 (8.3%) | 0 (0.0%) |
| 1 or 2 Children | 0 (0.0%) | 0 (0.0%) |
| 3 or 4 Children | 0 (0.0%) | 0 (0.0%) |
| 5 or more Children | 0 (0.0%) | 0 (0.0%) |
| Total | 16 (5.8%) | 0 (0.0%) |
Race in Tahoe Vista
The most populous races in Tahoe Vista are White / Caucasian (994 | 84.9%), Hispanic or Latino (245 | 20.9%), and Some other Race (112 | 9.6%).
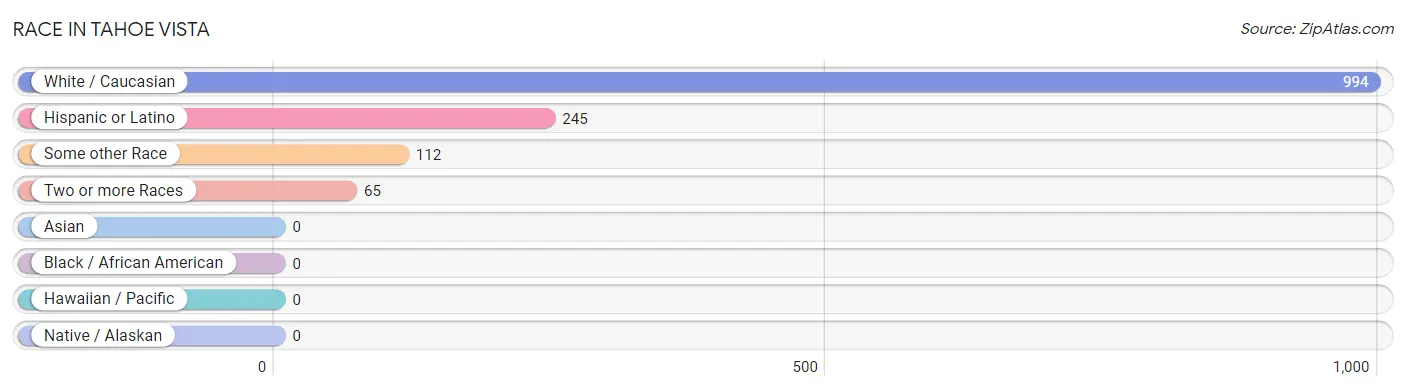
| Race | # Population | % Population |
| Asian | 0 | 0.0% |
| Black / African American | 0 | 0.0% |
| Hawaiian / Pacific | 0 | 0.0% |
| Hispanic or Latino | 245 | 20.9% |
| Native / Alaskan | 0 | 0.0% |
| White / Caucasian | 994 | 84.9% |
| Two or more Races | 65 | 5.6% |
| Some other Race | 112 | 9.6% |
| Total | 1,171 | 100.0% |
Ancestry in Tahoe Vista
The most populous ancestries reported in Tahoe Vista are English (258 | 22.0%), Mexican (245 | 20.9%), Irish (216 | 18.4%), German (134 | 11.4%), and Italian (116 | 9.9%), together accounting for 82.7% of all Tahoe Vista residents.
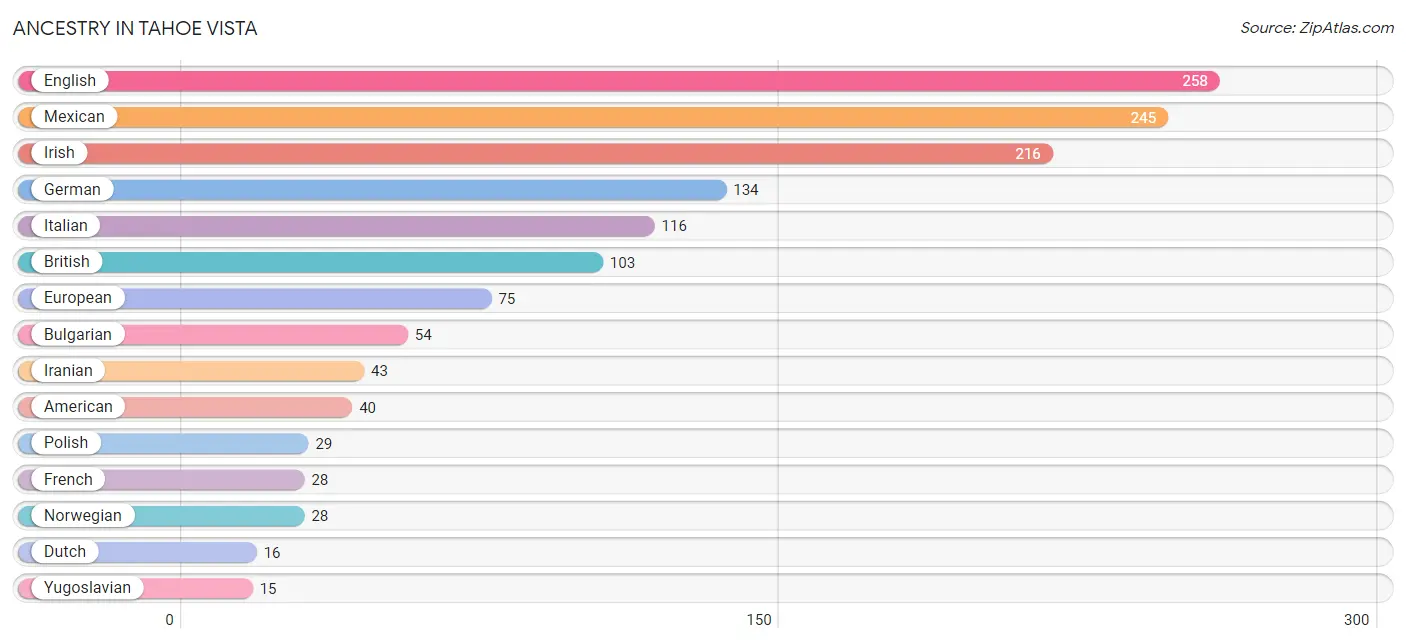
| Ancestry | # Population | % Population |
| Alaska Native | 13 | 1.1% |
| American | 40 | 3.4% |
| British | 103 | 8.8% |
| Bulgarian | 54 | 4.6% |
| Dutch | 16 | 1.4% |
| English | 258 | 22.0% |
| European | 75 | 6.4% |
| French | 28 | 2.4% |
| German | 134 | 11.4% |
| Iranian | 43 | 3.7% |
| Irish | 216 | 18.4% |
| Italian | 116 | 9.9% |
| Mexican | 245 | 20.9% |
| Norwegian | 28 | 2.4% |
| Polish | 29 | 2.5% |
| Portuguese | 14 | 1.2% |
| Russian | 13 | 1.1% |
| Scandinavian | 14 | 1.2% |
| Scotch-Irish | 14 | 1.2% |
| Scottish | 14 | 1.2% |
| Swedish | 14 | 1.2% |
| Welsh | 14 | 1.2% |
| Yugoslavian | 15 | 1.3% | View All 23 Rows |
Immigrants in Tahoe Vista
The most numerous immigrant groups reported in Tahoe Vista came from Central America (128 | 10.9%), Latin America (128 | 10.9%), Mexico (128 | 10.9%), Europe (72 | 6.1%), and Eastern Europe (42 | 3.6%), together accounting for 42.5% of all Tahoe Vista residents.
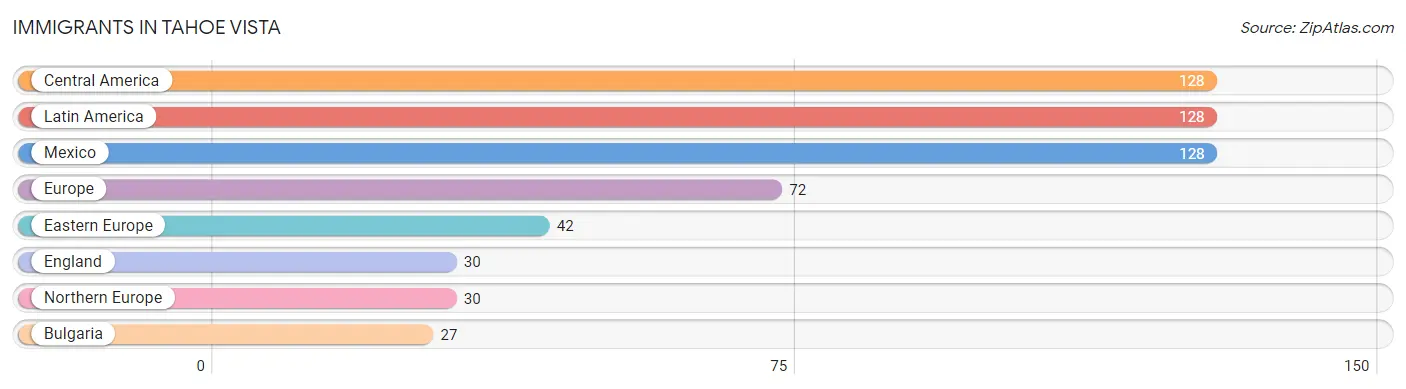
| Immigration Origin | # Population | % Population |
| Bulgaria | 27 | 2.3% |
| Central America | 128 | 10.9% |
| Eastern Europe | 42 | 3.6% |
| England | 30 | 2.6% |
| Europe | 72 | 6.1% |
| Latin America | 128 | 10.9% |
| Mexico | 128 | 10.9% |
| Northern Europe | 30 | 2.6% | View All 8 Rows |
Sex and Age in Tahoe Vista
Sex and Age in Tahoe Vista
The most populous age groups in Tahoe Vista are 60 to 64 Years (119 | 25.1%) for men and 20 to 24 Years (95 | 13.7%) for women.
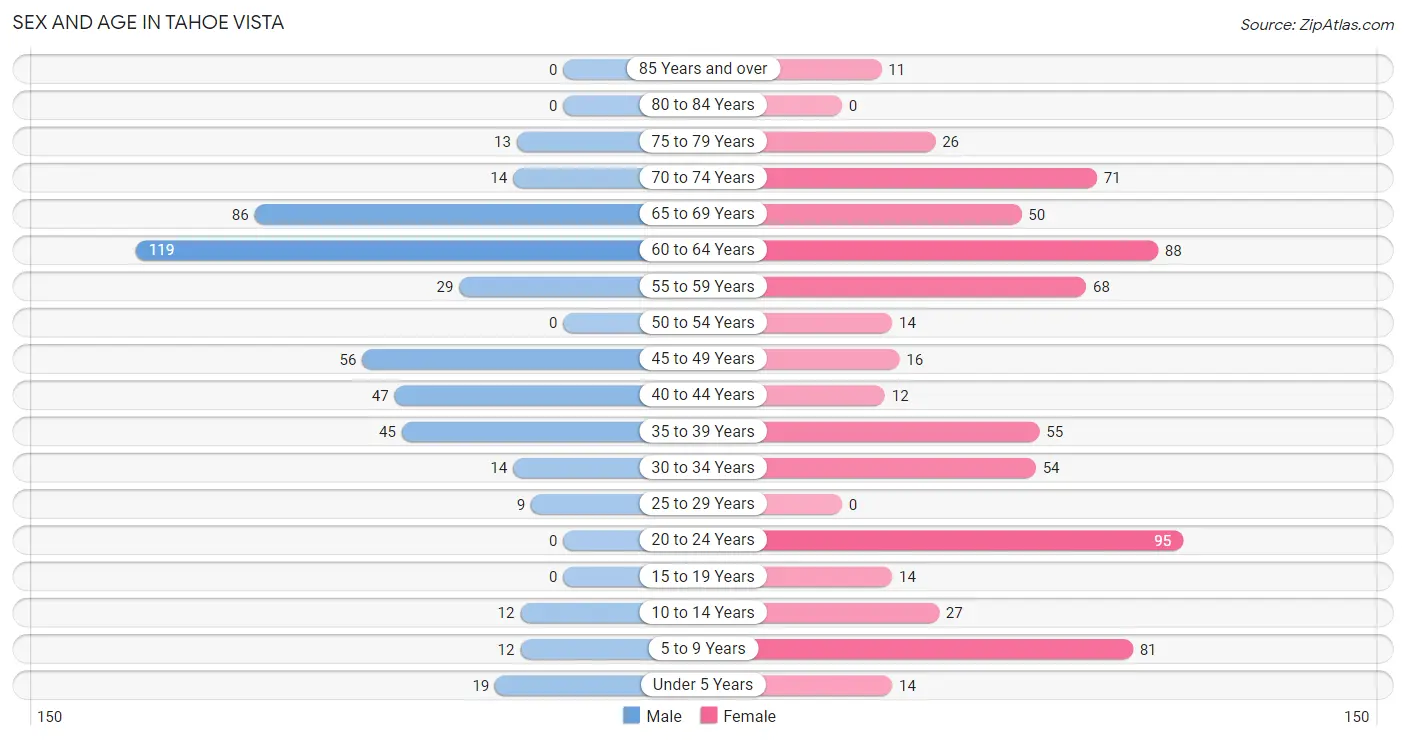
| Age Bracket | Male | Female |
| Under 5 Years | 19 (4.0%) | 14 (2.0%) |
| 5 to 9 Years | 12 (2.5%) | 81 (11.6%) |
| 10 to 14 Years | 12 (2.5%) | 27 (3.9%) |
| 15 to 19 Years | 0 (0.0%) | 14 (2.0%) |
| 20 to 24 Years | 0 (0.0%) | 95 (13.7%) |
| 25 to 29 Years | 9 (1.9%) | 0 (0.0%) |
| 30 to 34 Years | 14 (2.9%) | 54 (7.8%) |
| 35 to 39 Years | 45 (9.5%) | 55 (7.9%) |
| 40 to 44 Years | 47 (9.9%) | 12 (1.7%) |
| 45 to 49 Years | 56 (11.8%) | 16 (2.3%) |
| 50 to 54 Years | 0 (0.0%) | 14 (2.0%) |
| 55 to 59 Years | 29 (6.1%) | 68 (9.8%) |
| 60 to 64 Years | 119 (25.1%) | 88 (12.6%) |
| 65 to 69 Years | 86 (18.1%) | 50 (7.2%) |
| 70 to 74 Years | 14 (2.9%) | 71 (10.2%) |
| 75 to 79 Years | 13 (2.7%) | 26 (3.7%) |
| 80 to 84 Years | 0 (0.0%) | 0 (0.0%) |
| 85 Years and over | 0 (0.0%) | 11 (1.6%) |
| Total | 475 (100.0%) | 696 (100.0%) |
Families and Households in Tahoe Vista
Median Family Size in Tahoe Vista
The median family size in Tahoe Vista is 2.86 persons per family, with married-couple families (277 | 80.3%) accounting for the largest median family size of 3.02 persons per family. On the other hand, single male/father families (45 | 13.0%) represent the smallest median family size with 1.96 persons per family.
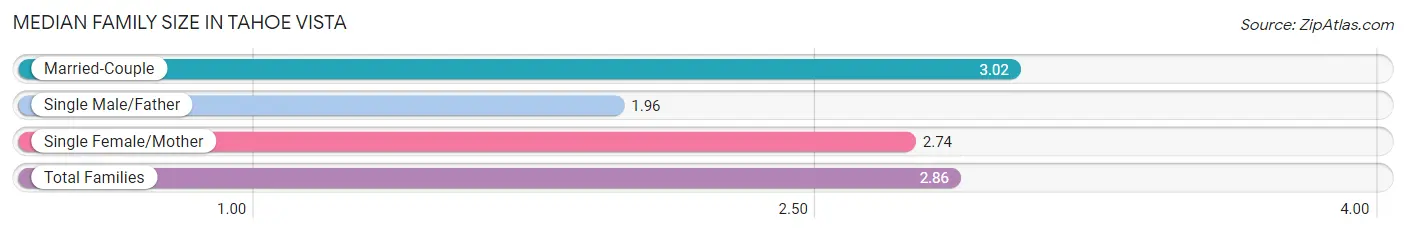
| Family Type | # Families | Family Size |
| Married-Couple | 277 (80.3%) | 3.02 |
| Single Male/Father | 45 (13.0%) | 1.96 |
| Single Female/Mother | 23 (6.7%) | 2.74 |
| Total Families | 345 (100.0%) | 2.86 |
Median Household Size in Tahoe Vista
The median household size in Tahoe Vista is 2.40 persons per household, with married-couple households (277 | 56.8%) accounting for the largest median household size of 3.02 persons per household. non-family households (143 | 29.3%) represent the smallest median household size with 1.29 persons per household.
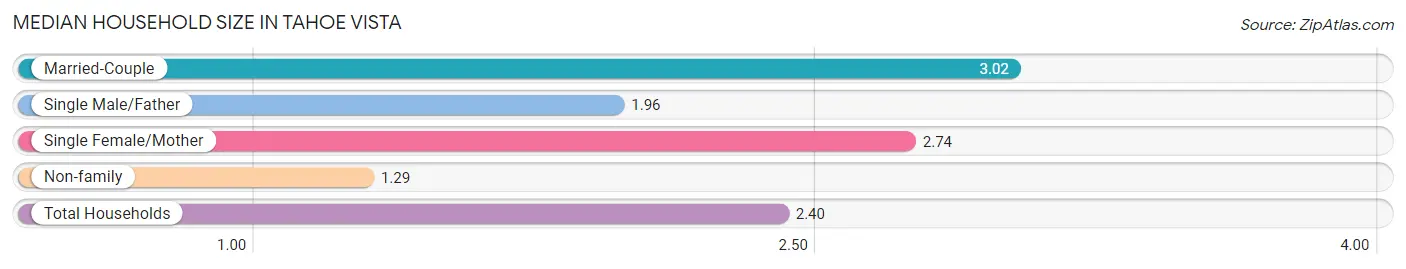
| Household Type | # Households | Household Size |
| Married-Couple | 277 (56.8%) | 3.02 |
| Single Male/Father | 45 (9.2%) | 1.96 |
| Single Female/Mother | 23 (4.7%) | 2.74 |
| Non-family | 143 (29.3%) | 1.29 |
| Total Households | 488 (100.0%) | 2.40 |
Household Size by Marriage Status in Tahoe Vista
Out of a total of 488 households in Tahoe Vista, 345 (70.7%) are family households, while 143 (29.3%) are nonfamily households. The most numerous type of family households are 2-person households, comprising 186, and the most common type of nonfamily households are 1-person households, comprising 107.
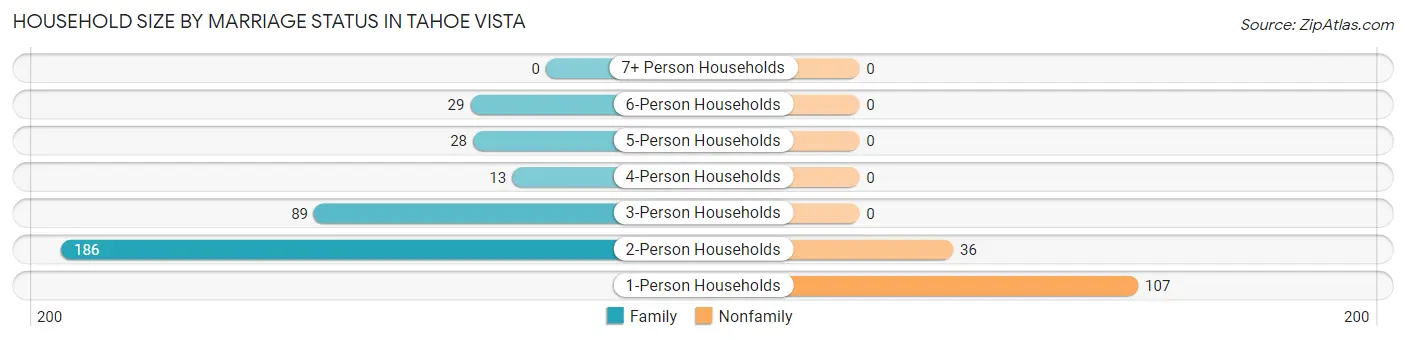
| Household Size | Family Households | Nonfamily Households |
| 1-Person Households | - | 107 (21.9%) |
| 2-Person Households | 186 (38.1%) | 36 (7.4%) |
| 3-Person Households | 89 (18.2%) | 0 (0.0%) |
| 4-Person Households | 13 (2.7%) | 0 (0.0%) |
| 5-Person Households | 28 (5.7%) | 0 (0.0%) |
| 6-Person Households | 29 (5.9%) | 0 (0.0%) |
| 7+ Person Households | 0 (0.0%) | 0 (0.0%) |
| Total | 345 (70.7%) | 143 (29.3%) |
Female Fertility in Tahoe Vista
Fertility by Age in Tahoe Vista
| Age Bracket | Women with Births | Births / 1,000 Women |
| 15 to 19 years | 0 (0.0%) | 0.0 |
| 20 to 34 years | 0 (0.0%) | 0.0 |
| 35 to 50 years | 0 (0.0%) | 0.0 |
| Total | 0 (0.0%) | 0.0 |
Fertility by Age by Marriage Status in Tahoe Vista
| Age Bracket | Married | Unmarried |
| 15 to 19 years | 0 (0.0%) | 0 (0.0%) |
| 20 to 34 years | 0 (0.0%) | 0 (0.0%) |
| 35 to 50 years | 0 (0.0%) | 0 (0.0%) |
| Total | 0 (0.0%) | 0 (0.0%) |
Fertility by Education in Tahoe Vista
| Educational Attainment | Women with Births | Births / 1,000 Women |
| Less than High School | 0 (0.0%) | 0.0 |
| High School Diploma | 0 (0.0%) | 0.0 |
| College or Associate's Degree | 0 (0.0%) | 0.0 |
| Bachelor's Degree | 0 (0.0%) | 0.0 |
| Graduate Degree | 0 (0.0%) | 0.0 |
| Total | 0 (0.0%) | 0.0 |
Fertility by Education by Marriage Status in Tahoe Vista
| Educational Attainment | Married | Unmarried |
| Less than High School | 0 (0.0%) | 0 (0.0%) |
| High School Diploma | 0 (0.0%) | 0 (0.0%) |
| College or Associate's Degree | 0 (0.0%) | 0 (0.0%) |
| Bachelor's Degree | 0 (0.0%) | 0 (0.0%) |
| Graduate Degree | 0 (0.0%) | 0 (0.0%) |
| Total | 0 (0.0%) | 0 (0.0%) |
Employment Characteristics in Tahoe Vista
Employment by Class of Employer in Tahoe Vista
Among the 660 employed individuals in Tahoe Vista, private company employees (382 | 57.9%), local government employees (87 | 13.2%), and self-employed (not incorporated) (82 | 12.4%) make up the most common classes of employment.
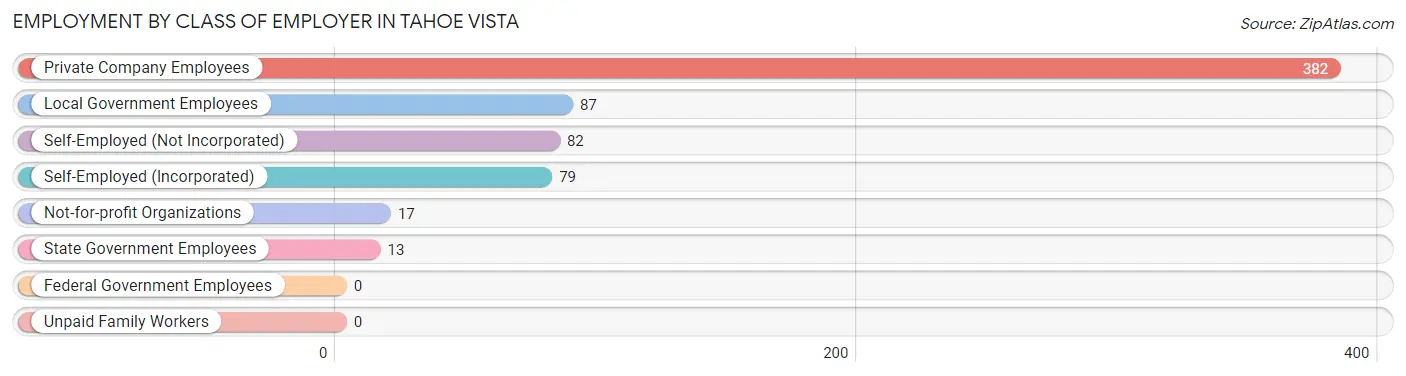
| Employer Class | # Employees | % Employees |
| Private Company Employees | 382 | 57.9% |
| Self-Employed (Incorporated) | 79 | 12.0% |
| Self-Employed (Not Incorporated) | 82 | 12.4% |
| Not-for-profit Organizations | 17 | 2.6% |
| Local Government Employees | 87 | 13.2% |
| State Government Employees | 13 | 2.0% |
| Federal Government Employees | 0 | 0.0% |
| Unpaid Family Workers | 0 | 0.0% |
| Total | 660 | 100.0% |
Employment Status by Age in Tahoe Vista
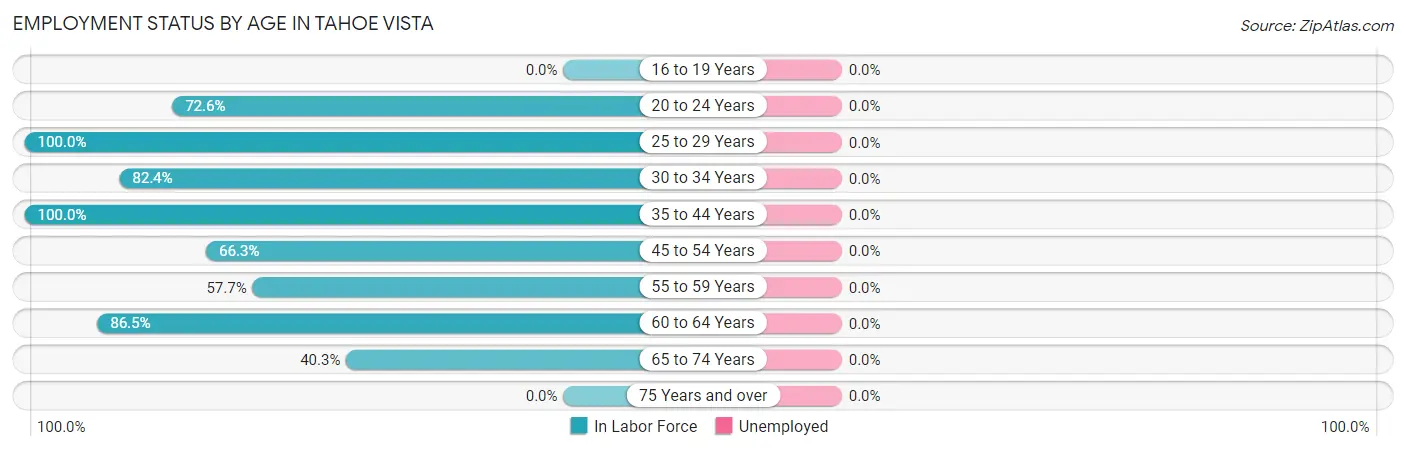
| Age Bracket | In Labor Force | Unemployed |
| 16 to 19 Years | 0 (0.0%) | 0 (0.0%) |
| 20 to 24 Years | 69 (72.6%) | 0 (0.0%) |
| 25 to 29 Years | 9 (100.0%) | 0 (0.0%) |
| 30 to 34 Years | 56 (82.4%) | 0 (0.0%) |
| 35 to 44 Years | 159 (100.0%) | 0 (0.0%) |
| 45 to 54 Years | 57 (66.3%) | 0 (0.0%) |
| 55 to 59 Years | 56 (57.7%) | 0 (0.0%) |
| 60 to 64 Years | 179 (86.5%) | 0 (0.0%) |
| 65 to 74 Years | 89 (40.3%) | 0 (0.0%) |
| 75 Years and over | 0 (0.0%) | 0 (0.0%) |
| Total | 674 (67.9%) | 0 (0.0%) |
Employment Status by Educational Attainment in Tahoe Vista
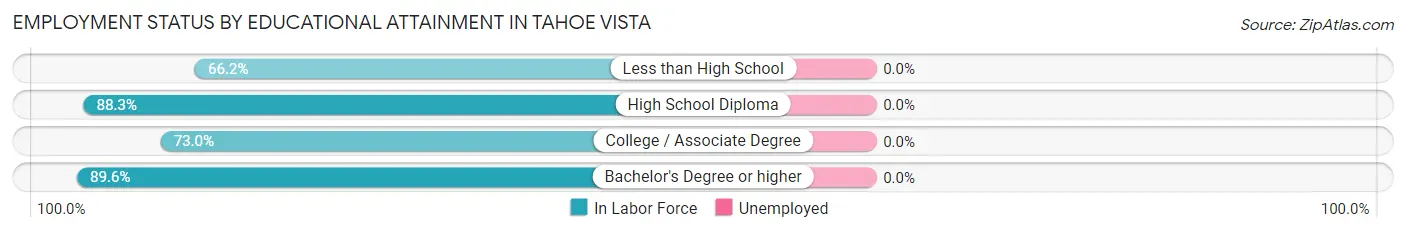
| Educational Attainment | In Labor Force | Unemployed |
| Less than High School | 51 (66.2%) | 0 (0.0%) |
| High School Diploma | 113 (88.3%) | 0 (0.0%) |
| College / Associate Degree | 111 (73.0%) | 0 (0.0%) |
| Bachelor's Degree or higher | 241 (89.6%) | 0 (0.0%) |
| Total | 516 (82.4%) | 0 (0.0%) |
Employment Occupations by Sex in Tahoe Vista
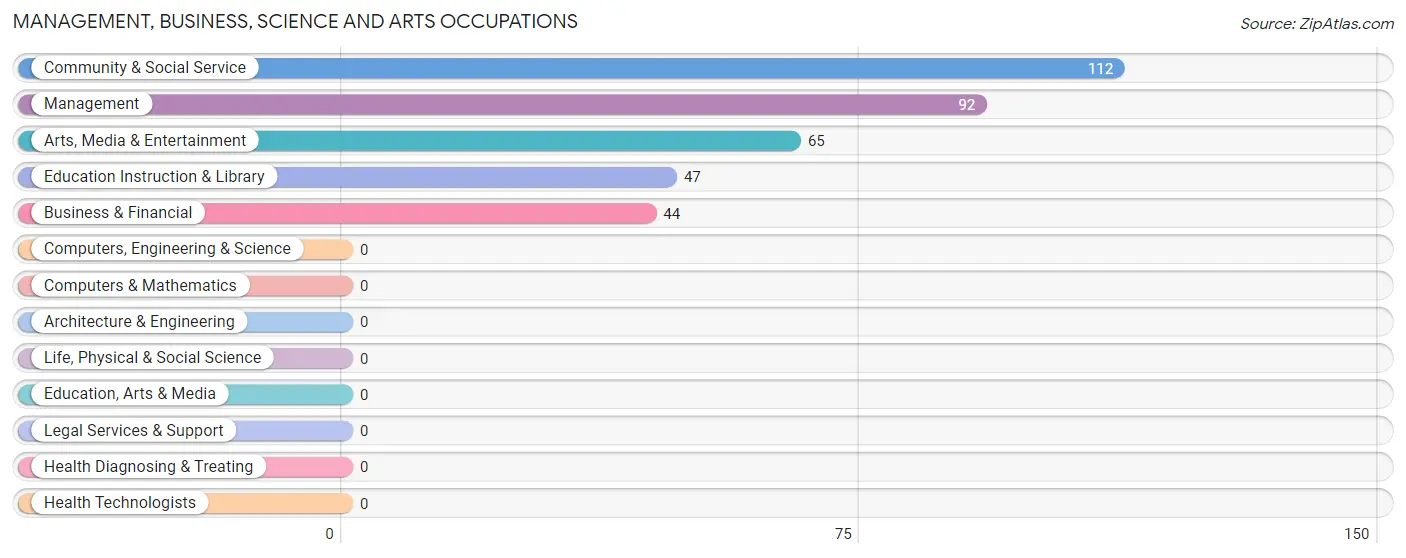
Management, Business, Science and Arts Occupations
The most common Management, Business, Science and Arts occupations in Tahoe Vista are Community & Social Service (112 | 16.6%), Management (92 | 13.7%), Arts, Media & Entertainment (65 | 9.6%), Education Instruction & Library (47 | 7.0%), and Business & Financial (44 | 6.5%).
Management, Business, Science and Arts Occupations by Sex
Within the Management, Business, Science and Arts occupations in Tahoe Vista, the most male-oriented occupations are Arts, Media & Entertainment (100.0%), Community & Social Service (69.6%), and Management (56.5%), while the most female-oriented occupations are Education Instruction & Library (72.3%), Business & Financial (63.6%), and Management (43.5%).
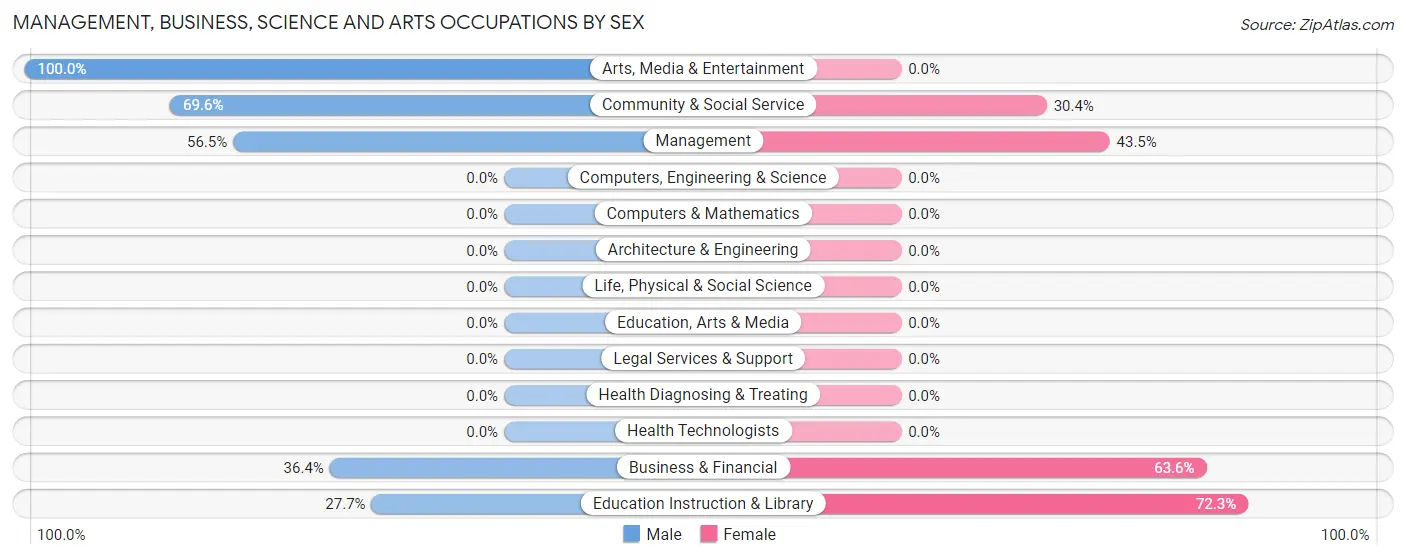
| Occupation | Male | Female |
| Management | 52 (56.5%) | 40 (43.5%) |
| Business & Financial | 16 (36.4%) | 28 (63.6%) |
| Computers, Engineering & Science | 0 (0.0%) | 0 (0.0%) |
| Computers & Mathematics | 0 (0.0%) | 0 (0.0%) |
| Architecture & Engineering | 0 (0.0%) | 0 (0.0%) |
| Life, Physical & Social Science | 0 (0.0%) | 0 (0.0%) |
| Community & Social Service | 78 (69.6%) | 34 (30.4%) |
| Education, Arts & Media | 0 (0.0%) | 0 (0.0%) |
| Legal Services & Support | 0 (0.0%) | 0 (0.0%) |
| Education Instruction & Library | 13 (27.7%) | 34 (72.3%) |
| Arts, Media & Entertainment | 65 (100.0%) | 0 (0.0%) |
| Health Diagnosing & Treating | 0 (0.0%) | 0 (0.0%) |
| Health Technologists | 0 (0.0%) | 0 (0.0%) |
| Total (Category) | 146 (58.9%) | 102 (41.1%) |
| Total (Overall) | 361 (53.6%) | 313 (46.4%) |
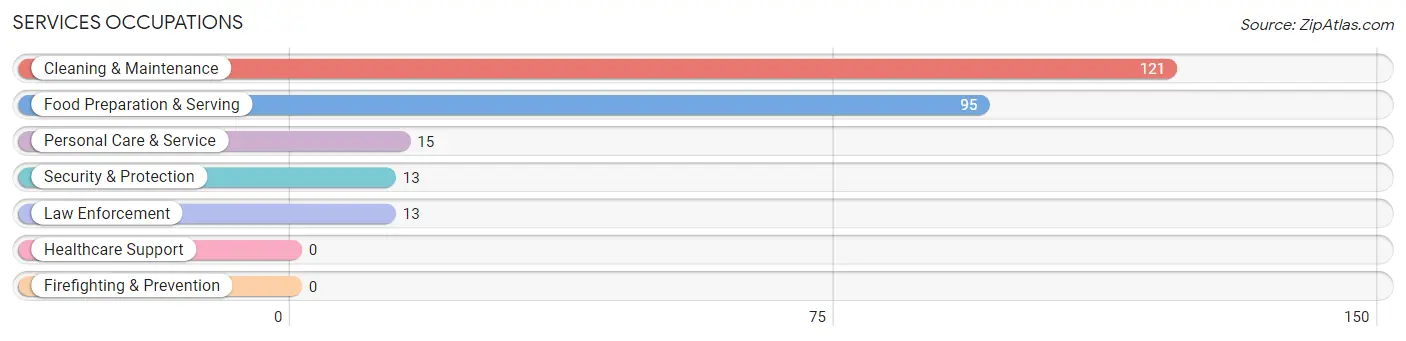
Services Occupations
The most common Services occupations in Tahoe Vista are Cleaning & Maintenance (121 | 17.9%), Food Preparation & Serving (95 | 14.1%), Personal Care & Service (15 | 2.2%), Security & Protection (13 | 1.9%), and Law Enforcement (13 | 1.9%).
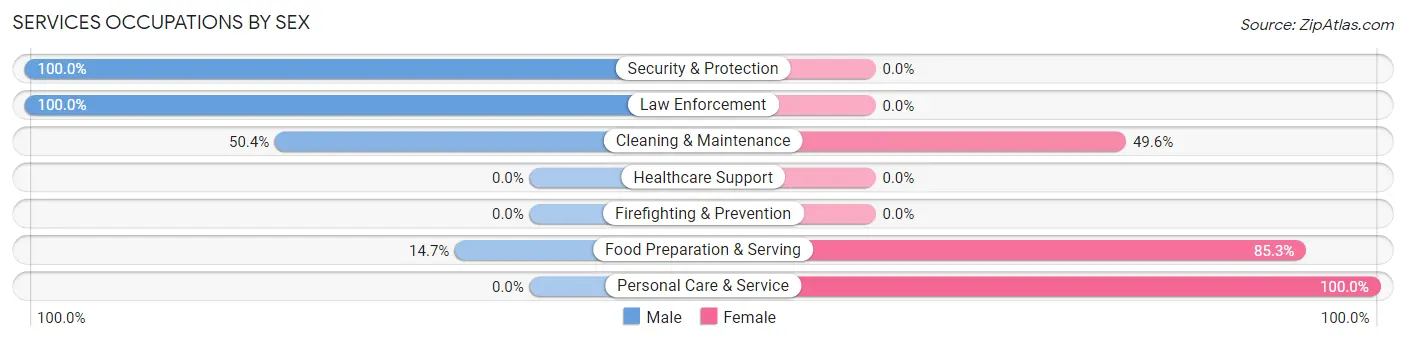
Services Occupations by Sex
Within the Services occupations in Tahoe Vista, the most male-oriented occupations are Security & Protection (100.0%), Law Enforcement (100.0%), and Cleaning & Maintenance (50.4%), while the most female-oriented occupations are Personal Care & Service (100.0%), Food Preparation & Serving (85.3%), and Cleaning & Maintenance (49.6%).
| Occupation | Male | Female |
| Healthcare Support | 0 (0.0%) | 0 (0.0%) |
| Security & Protection | 13 (100.0%) | 0 (0.0%) |
| Firefighting & Prevention | 0 (0.0%) | 0 (0.0%) |
| Law Enforcement | 13 (100.0%) | 0 (0.0%) |
| Food Preparation & Serving | 14 (14.7%) | 81 (85.3%) |
| Cleaning & Maintenance | 61 (50.4%) | 60 (49.6%) |
| Personal Care & Service | 0 (0.0%) | 15 (100.0%) |
| Total (Category) | 88 (36.1%) | 156 (63.9%) |
| Total (Overall) | 361 (53.6%) | 313 (46.4%) |
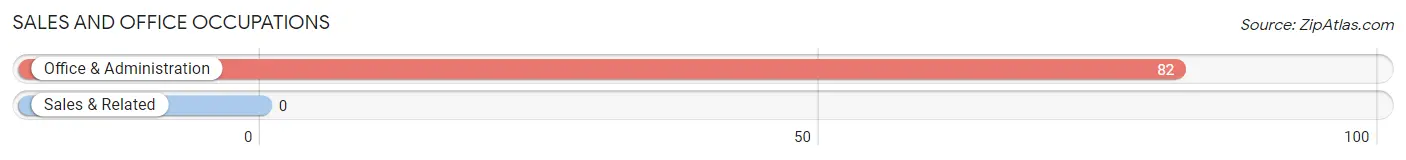
Sales and Office Occupations
The most common Sales and Office occupations in Tahoe Vista are , and Office & Administration (82 | 12.2%).
Sales and Office Occupations by Sex
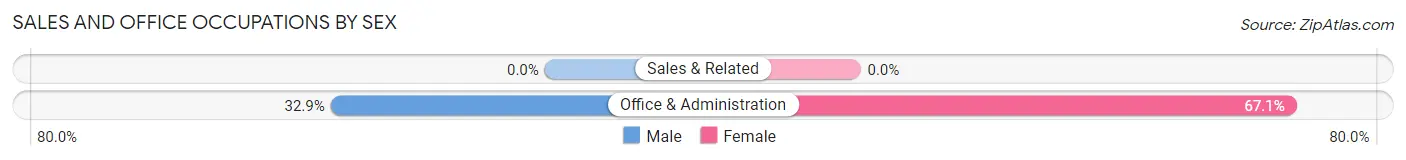
| Occupation | Male | Female |
| Sales & Related | 0 (0.0%) | 0 (0.0%) |
| Office & Administration | 27 (32.9%) | 55 (67.1%) |
| Total (Category) | 27 (32.9%) | 55 (67.1%) |
| Total (Overall) | 361 (53.6%) | 313 (46.4%) |
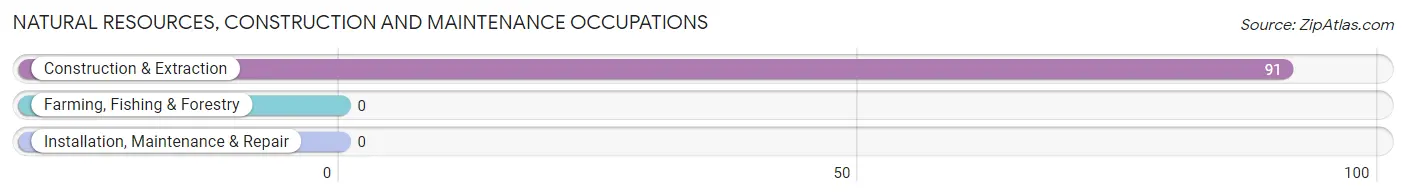
Natural Resources, Construction and Maintenance Occupations
The most common Natural Resources, Construction and Maintenance occupations in Tahoe Vista are , and Construction & Extraction (91 | 13.5%).
Natural Resources, Construction and Maintenance Occupations by Sex
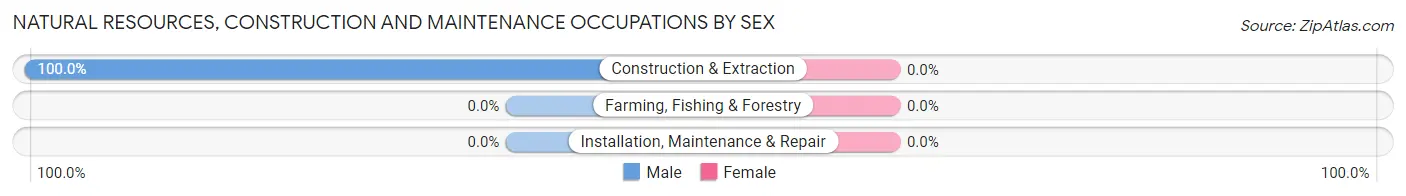
| Occupation | Male | Female |
| Farming, Fishing & Forestry | 0 (0.0%) | 0 (0.0%) |
| Construction & Extraction | 91 (100.0%) | 0 (0.0%) |
| Installation, Maintenance & Repair | 0 (0.0%) | 0 (0.0%) |
| Total (Category) | 91 (100.0%) | 0 (0.0%) |
| Total (Overall) | 361 (53.6%) | 313 (46.4%) |
Production, Transportation and Moving Occupations
The most common Production, Transportation and Moving occupations in Tahoe Vista are , and Transportation (9 | 1.3%).
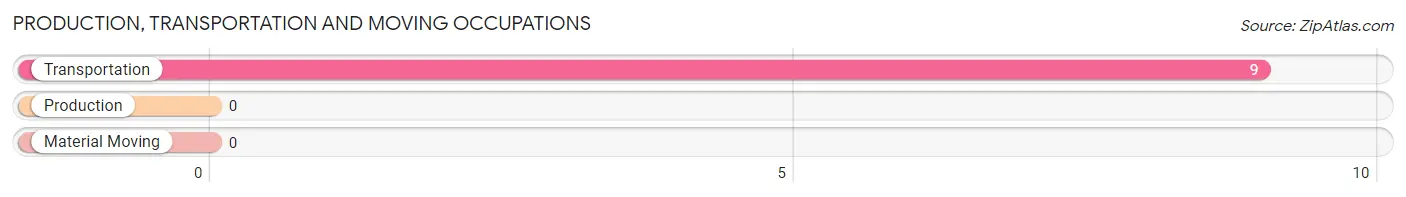
Production, Transportation and Moving Occupations by Sex
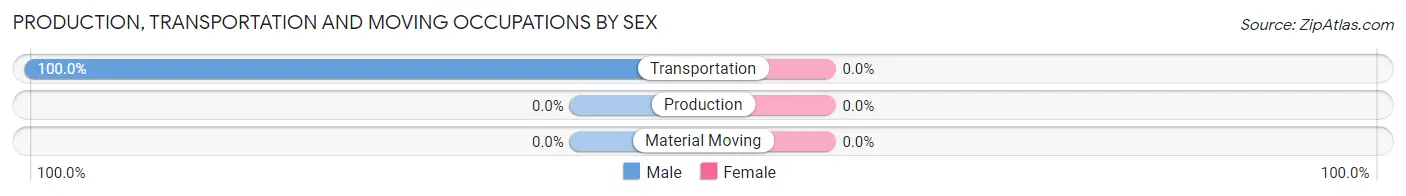
| Occupation | Male | Female |
| Production | 0 (0.0%) | 0 (0.0%) |
| Transportation | 9 (100.0%) | 0 (0.0%) |
| Material Moving | 0 (0.0%) | 0 (0.0%) |
| Total (Category) | 9 (100.0%) | 0 (0.0%) |
| Total (Overall) | 361 (53.6%) | 313 (46.4%) |
Employment Industries by Sex in Tahoe Vista
Employment Industries in Tahoe Vista
The major employment industries in Tahoe Vista include Accommodation & Food Services (124 | 18.4%), Construction (119 | 17.7%), Educational Services (113 | 16.8%), Administrative & Support (83 | 12.3%), and Information (45 | 6.7%).
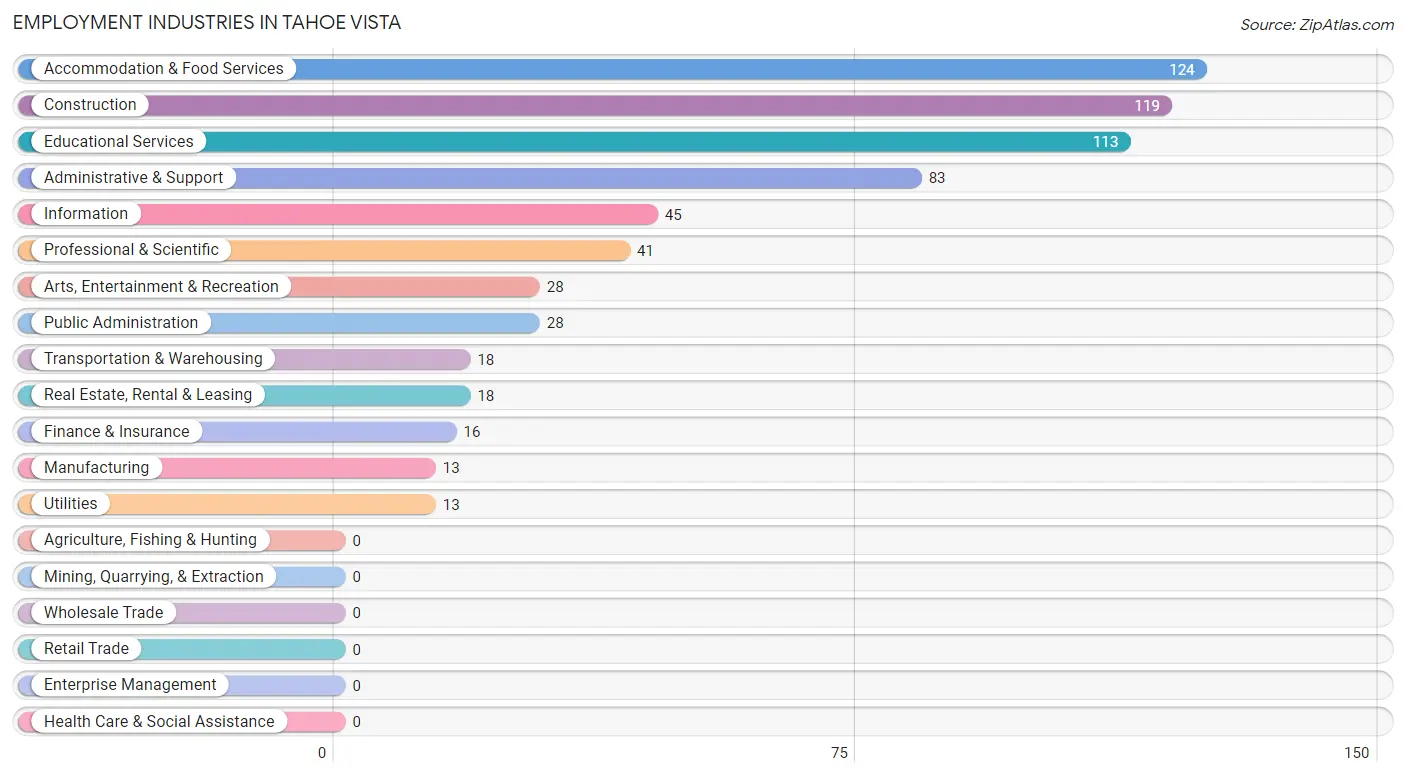
Employment Industries by Sex in Tahoe Vista
The Tahoe Vista industries that see more men than women are Manufacturing (100.0%), Transportation & Warehousing (100.0%), and Information (100.0%), whereas the industries that tend to have a higher number of women are Utilities (100.0%), Accommodation & Food Services (100.0%), and Educational Services (70.8%).
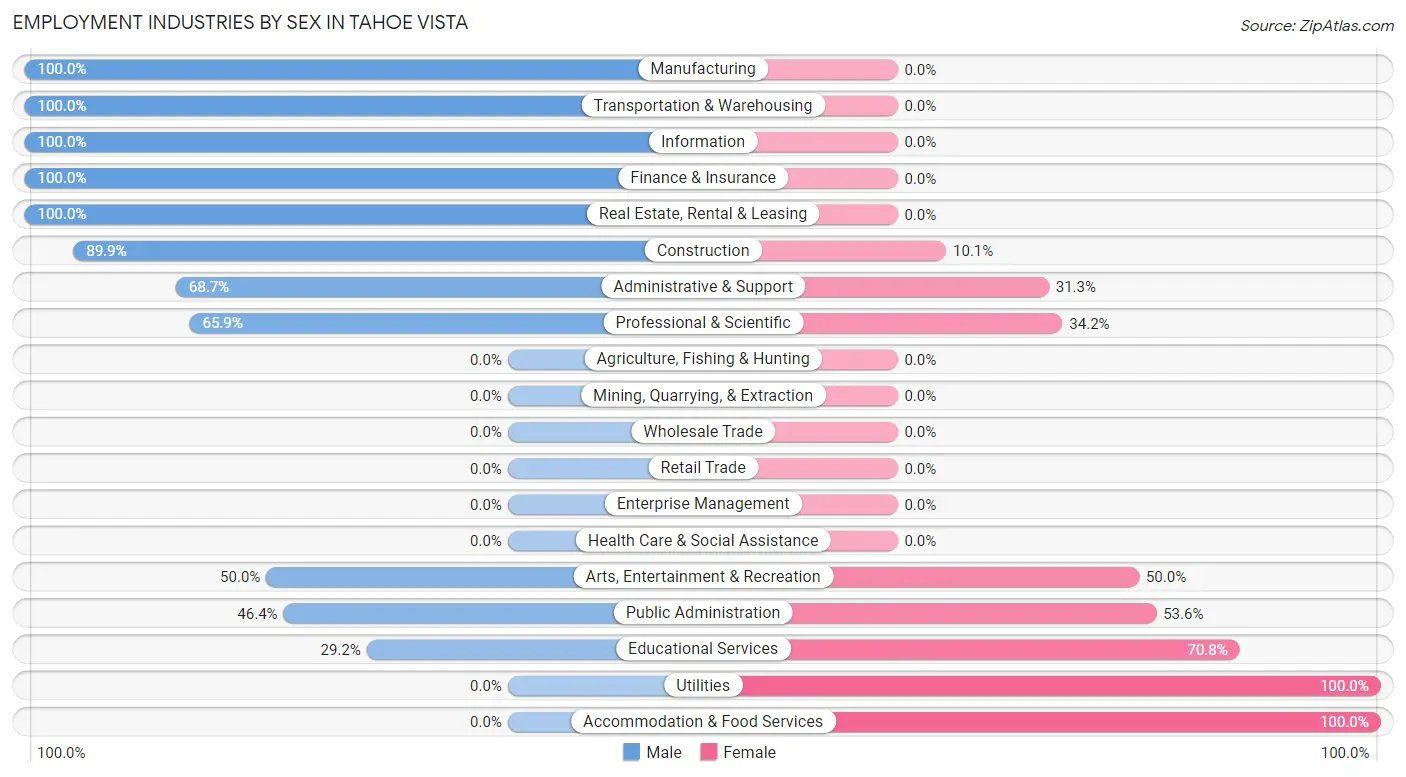
| Industry | Male | Female |
| Agriculture, Fishing & Hunting | 0 (0.0%) | 0 (0.0%) |
| Mining, Quarrying, & Extraction | 0 (0.0%) | 0 (0.0%) |
| Construction | 107 (89.9%) | 12 (10.1%) |
| Manufacturing | 13 (100.0%) | 0 (0.0%) |
| Wholesale Trade | 0 (0.0%) | 0 (0.0%) |
| Retail Trade | 0 (0.0%) | 0 (0.0%) |
| Transportation & Warehousing | 18 (100.0%) | 0 (0.0%) |
| Utilities | 0 (0.0%) | 13 (100.0%) |
| Information | 45 (100.0%) | 0 (0.0%) |
| Finance & Insurance | 16 (100.0%) | 0 (0.0%) |
| Real Estate, Rental & Leasing | 18 (100.0%) | 0 (0.0%) |
| Professional & Scientific | 27 (65.8%) | 14 (34.2%) |
| Enterprise Management | 0 (0.0%) | 0 (0.0%) |
| Administrative & Support | 57 (68.7%) | 26 (31.3%) |
| Educational Services | 33 (29.2%) | 80 (70.8%) |
| Health Care & Social Assistance | 0 (0.0%) | 0 (0.0%) |
| Arts, Entertainment & Recreation | 14 (50.0%) | 14 (50.0%) |
| Accommodation & Food Services | 0 (0.0%) | 124 (100.0%) |
| Public Administration | 13 (46.4%) | 15 (53.6%) |
| Total | 361 (53.6%) | 313 (46.4%) |
Education in Tahoe Vista
School Enrollment in Tahoe Vista
The most common levels of schooling among the 206 students in Tahoe Vista are elementary school (81 | 39.3%), college / undergraduate (46 | 22.3%), and middle school (39 | 18.9%).
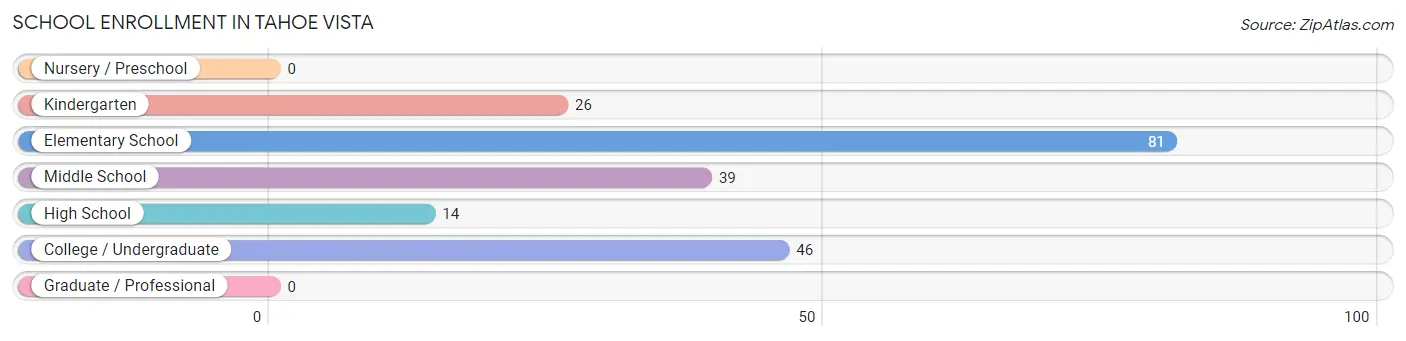
| School Level | # Students | % Students |
| Nursery / Preschool | 0 | 0.0% |
| Kindergarten | 26 | 12.6% |
| Elementary School | 81 | 39.3% |
| Middle School | 39 | 18.9% |
| High School | 14 | 6.8% |
| College / Undergraduate | 46 | 22.3% |
| Graduate / Professional | 0 | 0.0% |
| Total | 206 | 100.0% |
School Enrollment by Age by Funding Source in Tahoe Vista
Out of a total of 206 students who are enrolled in schools in Tahoe Vista, 14 (6.8%) attend a private institution, while the remaining 192 (93.2%) are enrolled in public schools. The age group of 15 to 17 year olds has the highest likelihood of being enrolled in private schools, with 14 (100.0% in the age bracket) enrolled. Conversely, the age group of 3 to 4 year olds has the lowest likelihood of being enrolled in a private school, with 14 (100.0% in the age bracket) attending a public institution.
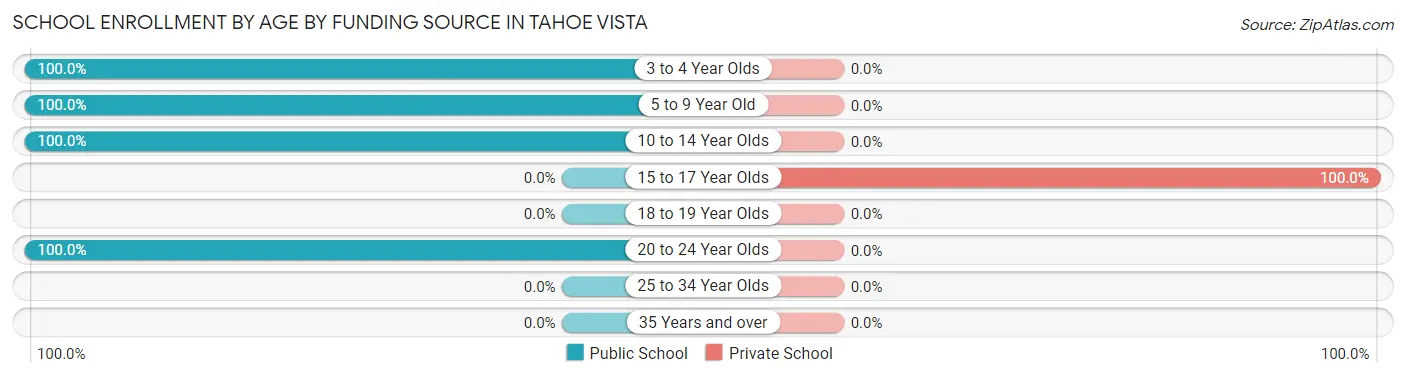
| Age Bracket | Public School | Private School |
| 3 to 4 Year Olds | 14 (100.0%) | 0 (0.0%) |
| 5 to 9 Year Old | 93 (100.0%) | 0 (0.0%) |
| 10 to 14 Year Olds | 39 (100.0%) | 0 (0.0%) |
| 15 to 17 Year Olds | 0 (0.0%) | 14 (100.0%) |
| 18 to 19 Year Olds | 0 (0.0%) | 0 (0.0%) |
| 20 to 24 Year Olds | 46 (100.0%) | 0 (0.0%) |
| 25 to 34 Year Olds | 0 (0.0%) | 0 (0.0%) |
| 35 Years and over | 0 (0.0%) | 0 (0.0%) |
| Total | 192 (93.2%) | 14 (6.8%) |
Educational Attainment by Field of Study in Tahoe Vista
Education (89 | 17.8%), bio, nature & agricultural (65 | 13.0%), business (55 | 11.0%), social sciences (41 | 8.2%), and computers & mathematics (40 | 8.0%) are the most common fields of study among 501 individuals in Tahoe Vista who have obtained a bachelor's degree or higher.
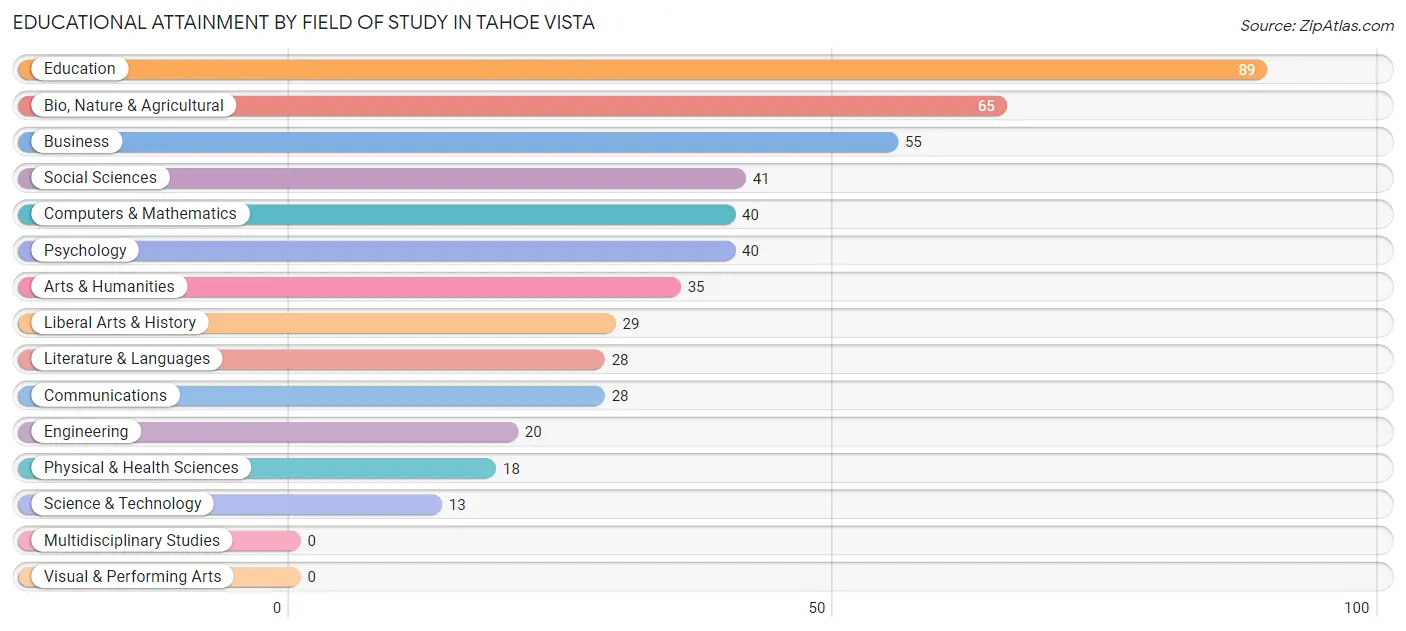
| Field of Study | # Graduates | % Graduates |
| Computers & Mathematics | 40 | 8.0% |
| Bio, Nature & Agricultural | 65 | 13.0% |
| Physical & Health Sciences | 18 | 3.6% |
| Psychology | 40 | 8.0% |
| Social Sciences | 41 | 8.2% |
| Engineering | 20 | 4.0% |
| Multidisciplinary Studies | 0 | 0.0% |
| Science & Technology | 13 | 2.6% |
| Business | 55 | 11.0% |
| Education | 89 | 17.8% |
| Literature & Languages | 28 | 5.6% |
| Liberal Arts & History | 29 | 5.8% |
| Visual & Performing Arts | 0 | 0.0% |
| Communications | 28 | 5.6% |
| Arts & Humanities | 35 | 7.0% |
| Total | 501 | 100.0% |
Transportation & Commute in Tahoe Vista
Vehicle Availability by Sex in Tahoe Vista
The most prevalent vehicle ownership categories in Tahoe Vista are males with 2 vehicles (116, accounting for 33.4%) and females with 2 vehicles (94, making up 37.1%).
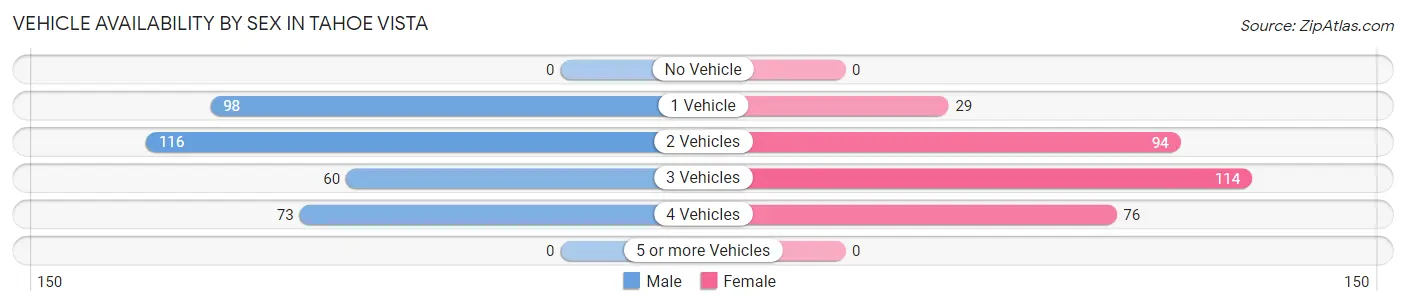
| Vehicles Available | Male | Female |
| No Vehicle | 0 (0.0%) | 0 (0.0%) |
| 1 Vehicle | 98 (28.2%) | 29 (9.3%) |
| 2 Vehicles | 116 (33.4%) | 94 (30.0%) |
| 3 Vehicles | 60 (17.3%) | 114 (36.4%) |
| 4 Vehicles | 73 (21.0%) | 76 (24.3%) |
| 5 or more Vehicles | 0 (0.0%) | 0 (0.0%) |
| Total | 347 (100.0%) | 313 (100.0%) |
Commute Time in Tahoe Vista
The most frequently occuring commute durations in Tahoe Vista are 15 to 19 minutes (147 commuters, 25.0%), 20 to 24 minutes (125 commuters, 21.2%), and 30 to 34 minutes (119 commuters, 20.2%).
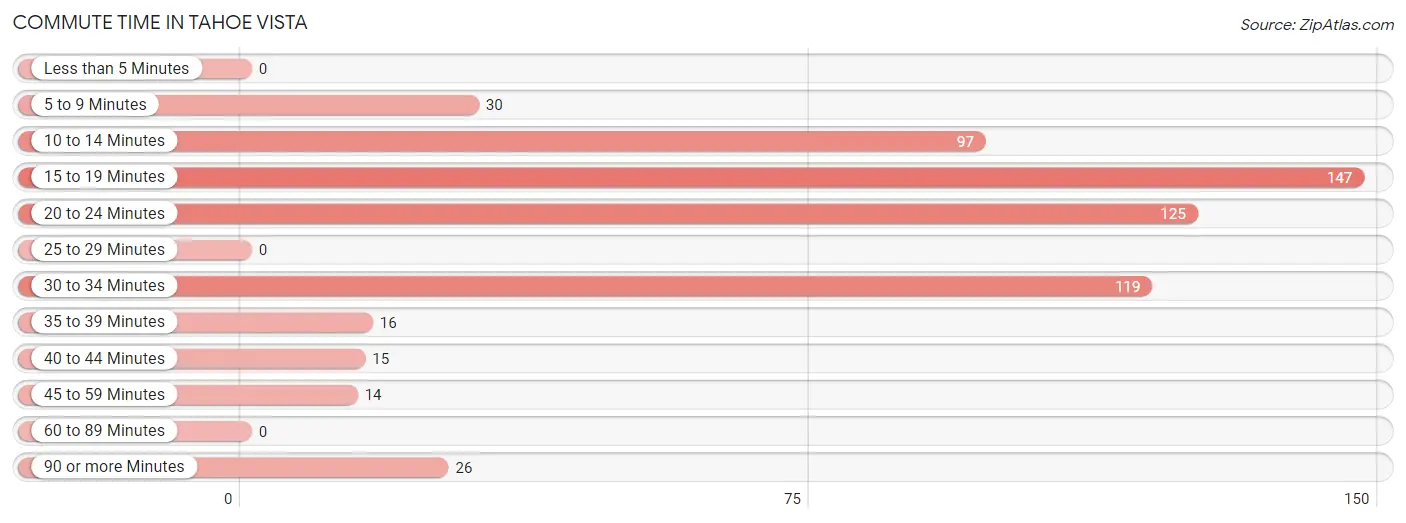
| Commute Time | # Commuters | % Commuters |
| Less than 5 Minutes | 0 | 0.0% |
| 5 to 9 Minutes | 30 | 5.1% |
| 10 to 14 Minutes | 97 | 16.5% |
| 15 to 19 Minutes | 147 | 25.0% |
| 20 to 24 Minutes | 125 | 21.2% |
| 25 to 29 Minutes | 0 | 0.0% |
| 30 to 34 Minutes | 119 | 20.2% |
| 35 to 39 Minutes | 16 | 2.7% |
| 40 to 44 Minutes | 15 | 2.5% |
| 45 to 59 Minutes | 14 | 2.4% |
| 60 to 89 Minutes | 0 | 0.0% |
| 90 or more Minutes | 26 | 4.4% |
Commute Time by Sex in Tahoe Vista
The most common commute times in Tahoe Vista are 15 to 19 minutes (92 commuters, 30.2%) for males and 10 to 14 minutes (97 commuters, 34.2%) for females.
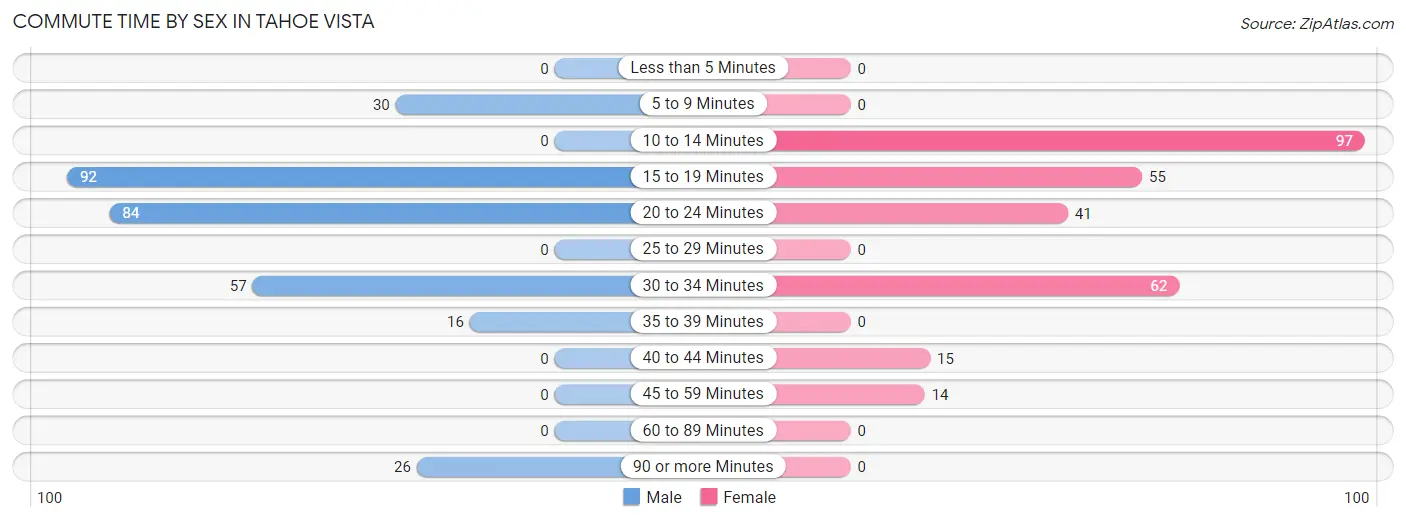
| Commute Time | Male | Female |
| Less than 5 Minutes | 0 (0.0%) | 0 (0.0%) |
| 5 to 9 Minutes | 30 (9.8%) | 0 (0.0%) |
| 10 to 14 Minutes | 0 (0.0%) | 97 (34.2%) |
| 15 to 19 Minutes | 92 (30.2%) | 55 (19.4%) |
| 20 to 24 Minutes | 84 (27.5%) | 41 (14.4%) |
| 25 to 29 Minutes | 0 (0.0%) | 0 (0.0%) |
| 30 to 34 Minutes | 57 (18.7%) | 62 (21.8%) |
| 35 to 39 Minutes | 16 (5.2%) | 0 (0.0%) |
| 40 to 44 Minutes | 0 (0.0%) | 15 (5.3%) |
| 45 to 59 Minutes | 0 (0.0%) | 14 (4.9%) |
| 60 to 89 Minutes | 0 (0.0%) | 0 (0.0%) |
| 90 or more Minutes | 26 (8.5%) | 0 (0.0%) |
Time of Departure to Work by Sex in Tahoe Vista
The most frequent times of departure to work in Tahoe Vista are 7:30 AM to 7:59 AM (115, 37.7%) for males and 10:00 AM to 10:59 AM (59, 20.8%) for females.
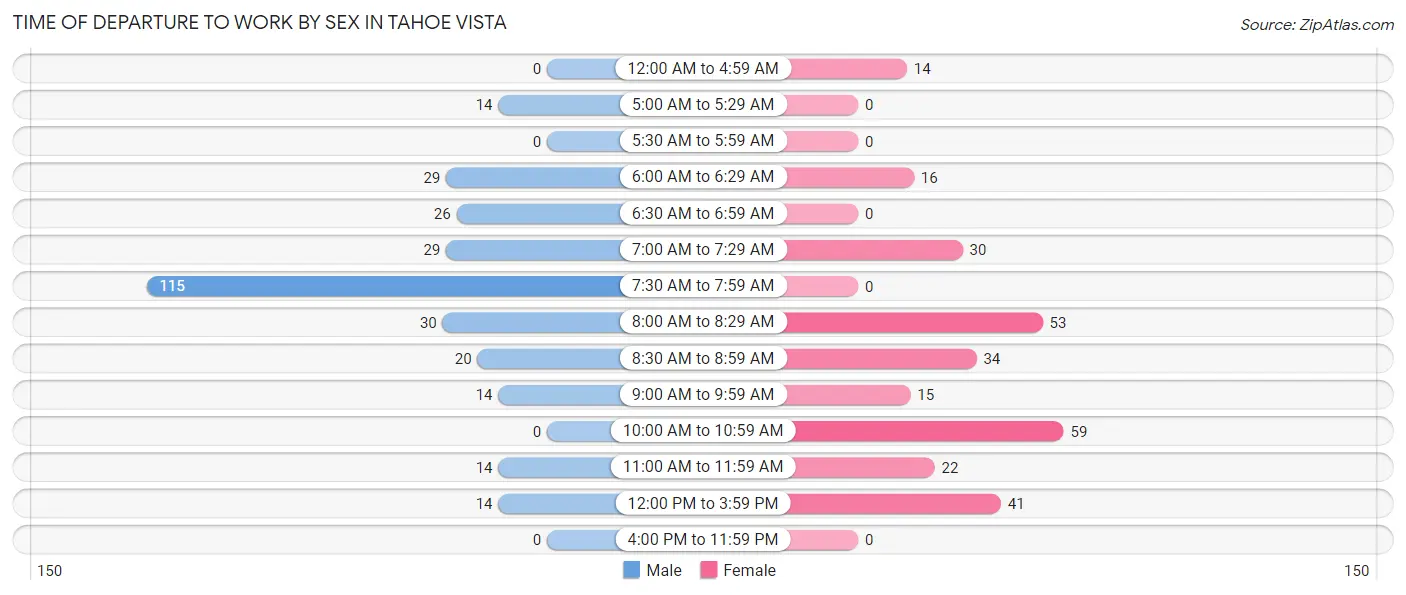
| Time of Departure | Male | Female |
| 12:00 AM to 4:59 AM | 0 (0.0%) | 14 (4.9%) |
| 5:00 AM to 5:29 AM | 14 (4.6%) | 0 (0.0%) |
| 5:30 AM to 5:59 AM | 0 (0.0%) | 0 (0.0%) |
| 6:00 AM to 6:29 AM | 29 (9.5%) | 16 (5.6%) |
| 6:30 AM to 6:59 AM | 26 (8.5%) | 0 (0.0%) |
| 7:00 AM to 7:29 AM | 29 (9.5%) | 30 (10.6%) |
| 7:30 AM to 7:59 AM | 115 (37.7%) | 0 (0.0%) |
| 8:00 AM to 8:29 AM | 30 (9.8%) | 53 (18.7%) |
| 8:30 AM to 8:59 AM | 20 (6.6%) | 34 (12.0%) |
| 9:00 AM to 9:59 AM | 14 (4.6%) | 15 (5.3%) |
| 10:00 AM to 10:59 AM | 0 (0.0%) | 59 (20.8%) |
| 11:00 AM to 11:59 AM | 14 (4.6%) | 22 (7.7%) |
| 12:00 PM to 3:59 PM | 14 (4.6%) | 41 (14.4%) |
| 4:00 PM to 11:59 PM | 0 (0.0%) | 0 (0.0%) |
| Total | 305 (100.0%) | 284 (100.0%) |
Housing Occupancy in Tahoe Vista
Occupancy by Ownership in Tahoe Vista
Of the total 488 dwellings in Tahoe Vista, owner-occupied units account for 382 (78.3%), while renter-occupied units make up 106 (21.7%).
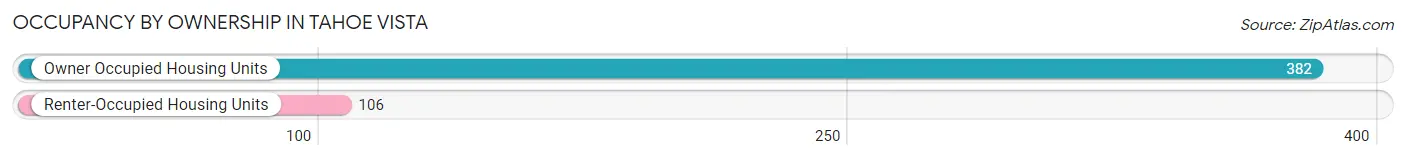
| Occupancy | # Housing Units | % Housing Units |
| Owner Occupied Housing Units | 382 | 78.3% |
| Renter-Occupied Housing Units | 106 | 21.7% |
| Total Occupied Housing Units | 488 | 100.0% |
Occupancy by Household Size in Tahoe Vista
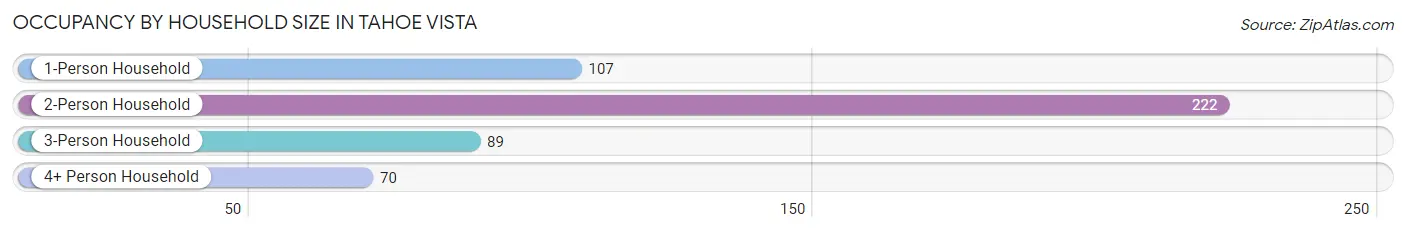
| Household Size | # Housing Units | % Housing Units |
| 1-Person Household | 107 | 21.9% |
| 2-Person Household | 222 | 45.5% |
| 3-Person Household | 89 | 18.2% |
| 4+ Person Household | 70 | 14.3% |
| Total Housing Units | 488 | 100.0% |
Occupancy by Ownership by Household Size in Tahoe Vista
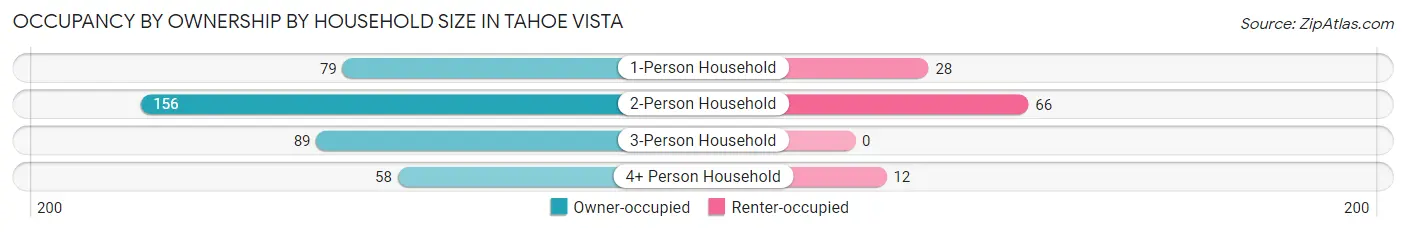
| Household Size | Owner-occupied | Renter-occupied |
| 1-Person Household | 79 (73.8%) | 28 (26.2%) |
| 2-Person Household | 156 (70.3%) | 66 (29.7%) |
| 3-Person Household | 89 (100.0%) | 0 (0.0%) |
| 4+ Person Household | 58 (82.9%) | 12 (17.1%) |
| Total Housing Units | 382 (78.3%) | 106 (21.7%) |
Occupancy by Educational Attainment in Tahoe Vista
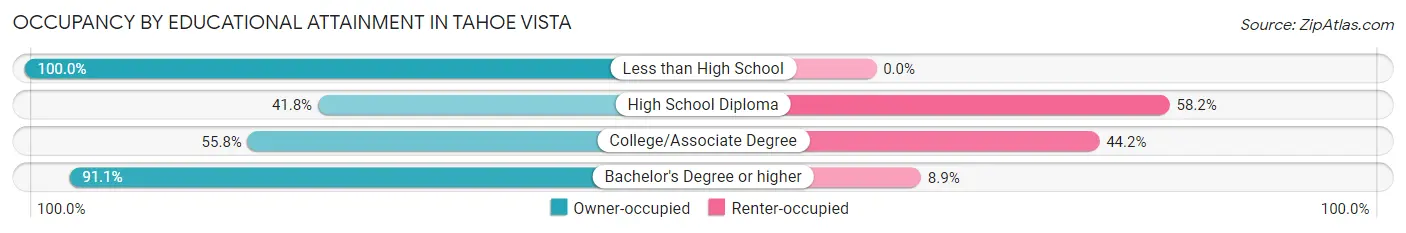
| Household Size | Owner-occupied | Renter-occupied |
| Less than High School | 45 (100.0%) | 0 (0.0%) |
| High School Diploma | 41 (41.8%) | 57 (58.2%) |
| College/Associate Degree | 29 (55.8%) | 23 (44.2%) |
| Bachelor's Degree or higher | 267 (91.1%) | 26 (8.9%) |
Occupancy by Age of Householder in Tahoe Vista
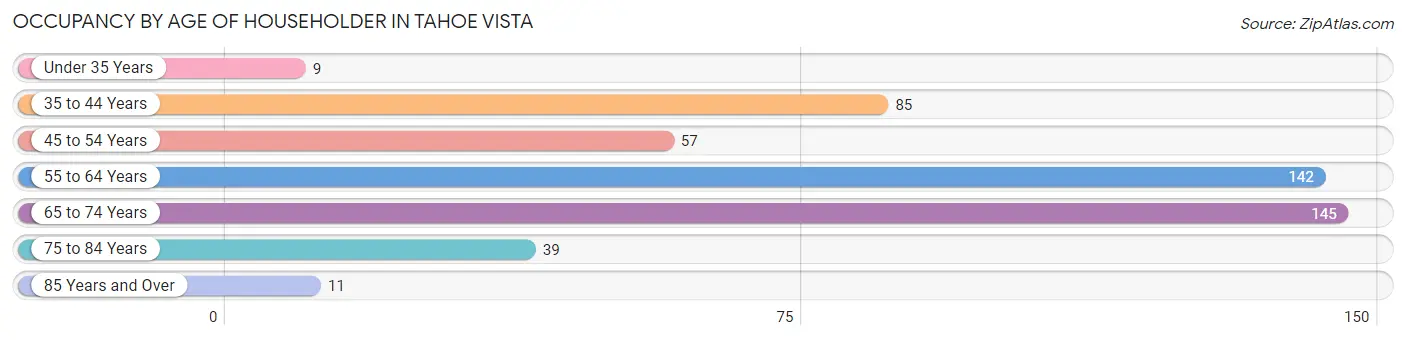
| Age Bracket | # Households | % Households |
| Under 35 Years | 9 | 1.8% |
| 35 to 44 Years | 85 | 17.4% |
| 45 to 54 Years | 57 | 11.7% |
| 55 to 64 Years | 142 | 29.1% |
| 65 to 74 Years | 145 | 29.7% |
| 75 to 84 Years | 39 | 8.0% |
| 85 Years and Over | 11 | 2.2% |
| Total | 488 | 100.0% |
Housing Finances in Tahoe Vista
Median Income by Occupancy in Tahoe Vista
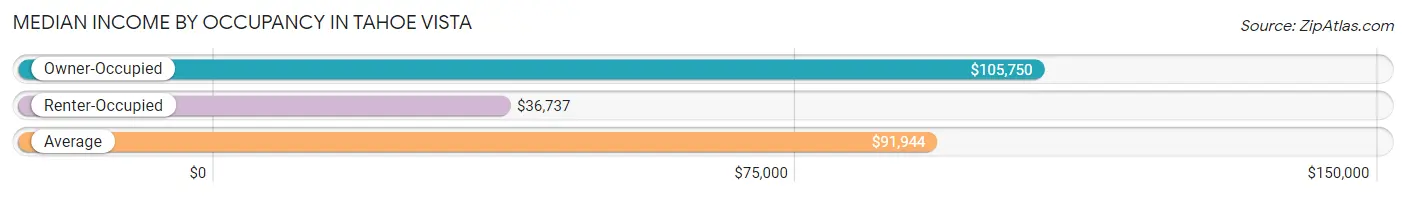
| Occupancy Type | # Households | Median Income |
| Owner-Occupied | 382 (78.3%) | $105,750 |
| Renter-Occupied | 106 (21.7%) | $36,737 |
| Average | 488 (100.0%) | $91,944 |
Occupancy by Householder Income Bracket in Tahoe Vista
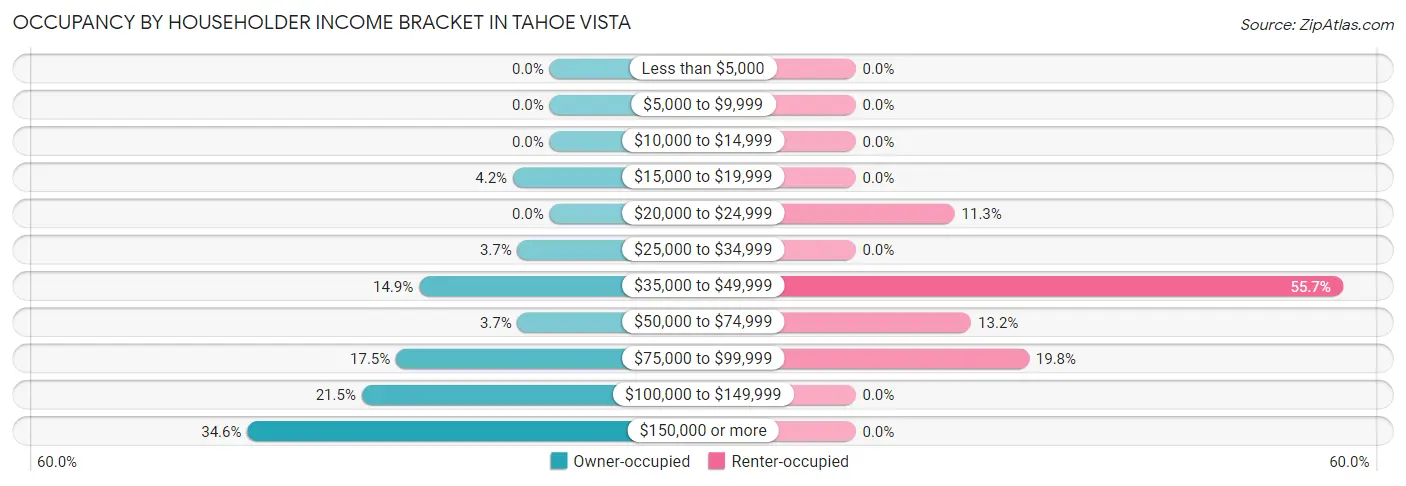
| Income Bracket | Owner-occupied | Renter-occupied |
| Less than $5,000 | 0 (0.0%) | 0 (0.0%) |
| $5,000 to $9,999 | 0 (0.0%) | 0 (0.0%) |
| $10,000 to $14,999 | 0 (0.0%) | 0 (0.0%) |
| $15,000 to $19,999 | 16 (4.2%) | 0 (0.0%) |
| $20,000 to $24,999 | 0 (0.0%) | 12 (11.3%) |
| $25,000 to $34,999 | 14 (3.7%) | 0 (0.0%) |
| $35,000 to $49,999 | 57 (14.9%) | 59 (55.7%) |
| $50,000 to $74,999 | 14 (3.7%) | 14 (13.2%) |
| $75,000 to $99,999 | 67 (17.5%) | 21 (19.8%) |
| $100,000 to $149,999 | 82 (21.5%) | 0 (0.0%) |
| $150,000 or more | 132 (34.5%) | 0 (0.0%) |
| Total | 382 (100.0%) | 106 (100.0%) |
Monthly Housing Cost Tiers in Tahoe Vista
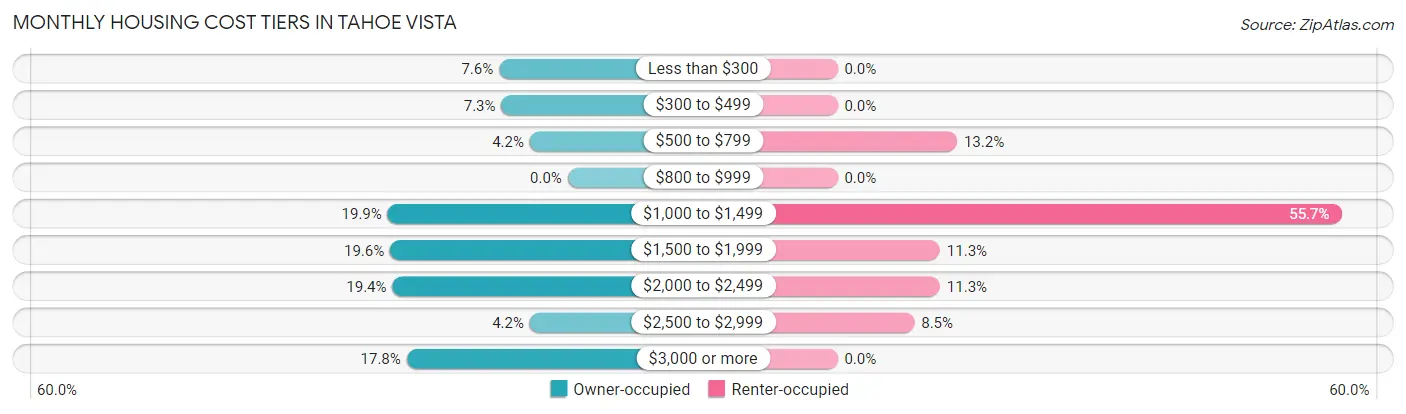
| Monthly Cost | Owner-occupied | Renter-occupied |
| Less than $300 | 29 (7.6%) | 0 (0.0%) |
| $300 to $499 | 28 (7.3%) | 0 (0.0%) |
| $500 to $799 | 16 (4.2%) | 14 (13.2%) |
| $800 to $999 | 0 (0.0%) | 0 (0.0%) |
| $1,000 to $1,499 | 76 (19.9%) | 59 (55.7%) |
| $1,500 to $1,999 | 75 (19.6%) | 12 (11.3%) |
| $2,000 to $2,499 | 74 (19.4%) | 12 (11.3%) |
| $2,500 to $2,999 | 16 (4.2%) | 9 (8.5%) |
| $3,000 or more | 68 (17.8%) | 0 (0.0%) |
| Total | 382 (100.0%) | 106 (100.0%) |
Physical Housing Characteristics in Tahoe Vista
Housing Structures in Tahoe Vista
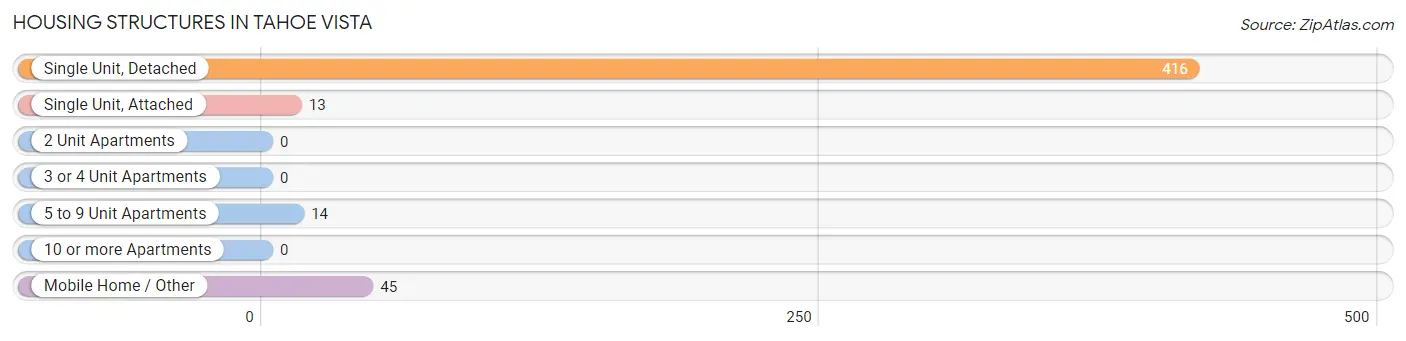
| Structure Type | # Housing Units | % Housing Units |
| Single Unit, Detached | 416 | 85.3% |
| Single Unit, Attached | 13 | 2.7% |
| 2 Unit Apartments | 0 | 0.0% |
| 3 or 4 Unit Apartments | 0 | 0.0% |
| 5 to 9 Unit Apartments | 14 | 2.9% |
| 10 or more Apartments | 0 | 0.0% |
| Mobile Home / Other | 45 | 9.2% |
| Total | 488 | 100.0% |
Housing Structures by Occupancy in Tahoe Vista
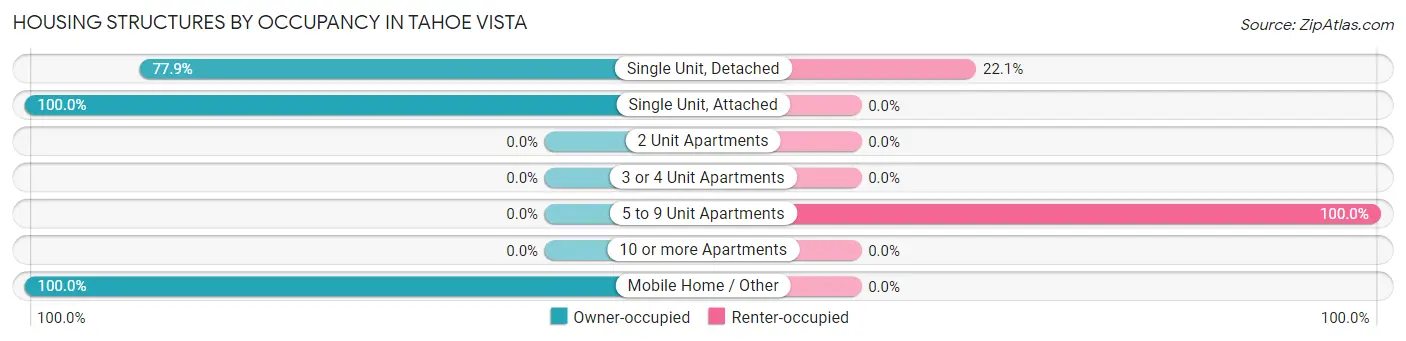
| Structure Type | Owner-occupied | Renter-occupied |
| Single Unit, Detached | 324 (77.9%) | 92 (22.1%) |
| Single Unit, Attached | 13 (100.0%) | 0 (0.0%) |
| 2 Unit Apartments | 0 (0.0%) | 0 (0.0%) |
| 3 or 4 Unit Apartments | 0 (0.0%) | 0 (0.0%) |
| 5 to 9 Unit Apartments | 0 (0.0%) | 14 (100.0%) |
| 10 or more Apartments | 0 (0.0%) | 0 (0.0%) |
| Mobile Home / Other | 45 (100.0%) | 0 (0.0%) |
| Total | 382 (78.3%) | 106 (21.7%) |
Housing Structures by Number of Rooms in Tahoe Vista
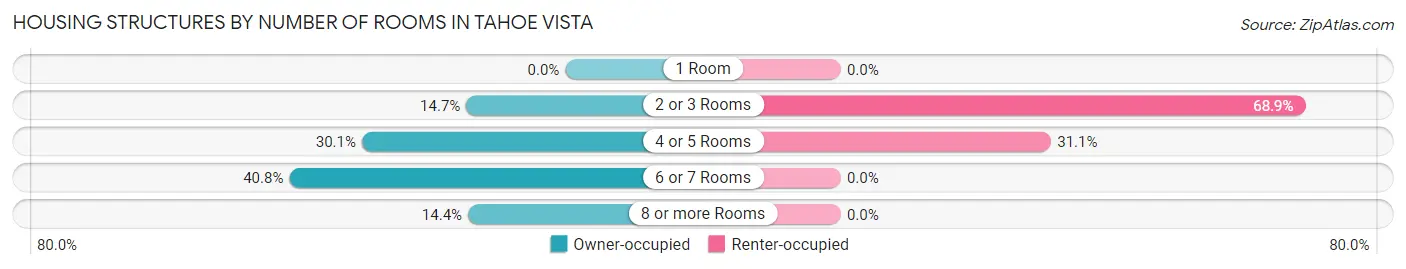
| Number of Rooms | Owner-occupied | Renter-occupied |
| 1 Room | 0 (0.0%) | 0 (0.0%) |
| 2 or 3 Rooms | 56 (14.7%) | 73 (68.9%) |
| 4 or 5 Rooms | 115 (30.1%) | 33 (31.1%) |
| 6 or 7 Rooms | 156 (40.8%) | 0 (0.0%) |
| 8 or more Rooms | 55 (14.4%) | 0 (0.0%) |
| Total | 382 (100.0%) | 106 (100.0%) |
Housing Structure by Heating Type in Tahoe Vista
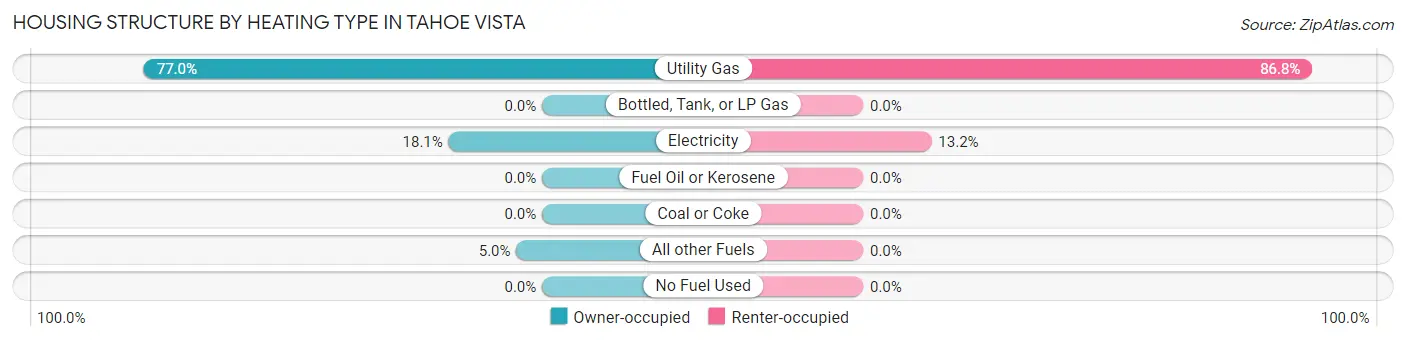
| Heating Type | Owner-occupied | Renter-occupied |
| Utility Gas | 294 (77.0%) | 92 (86.8%) |
| Bottled, Tank, or LP Gas | 0 (0.0%) | 0 (0.0%) |
| Electricity | 69 (18.1%) | 14 (13.2%) |
| Fuel Oil or Kerosene | 0 (0.0%) | 0 (0.0%) |
| Coal or Coke | 0 (0.0%) | 0 (0.0%) |
| All other Fuels | 19 (5.0%) | 0 (0.0%) |
| No Fuel Used | 0 (0.0%) | 0 (0.0%) |
| Total | 382 (100.0%) | 106 (100.0%) |
Household Vehicle Usage in Tahoe Vista
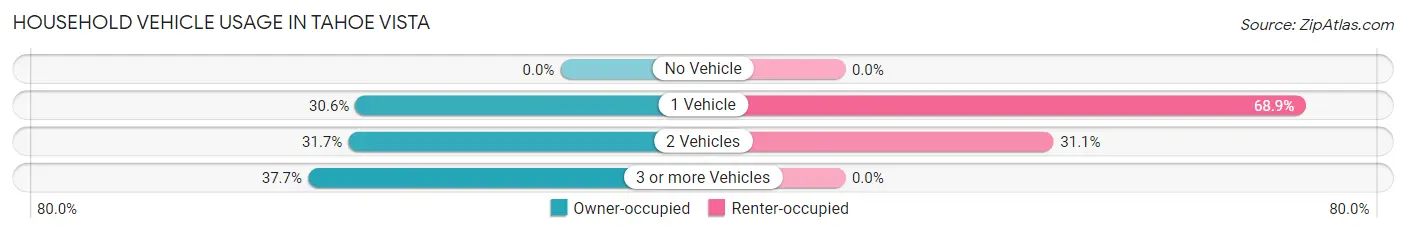
| Vehicles per Household | Owner-occupied | Renter-occupied |
| No Vehicle | 0 (0.0%) | 0 (0.0%) |
| 1 Vehicle | 117 (30.6%) | 73 (68.9%) |
| 2 Vehicles | 121 (31.7%) | 33 (31.1%) |
| 3 or more Vehicles | 144 (37.7%) | 0 (0.0%) |
| Total | 382 (100.0%) | 106 (100.0%) |
Real Estate & Mortgages in Tahoe Vista
Real Estate and Mortgage Overview in Tahoe Vista
| Characteristic | Without Mortgage | With Mortgage |
| Housing Units | 210 | 172 |
| Median Property Value | $782,600 | $685,300 |
| Median Household Income | $105,667 | $87 |
| Monthly Housing Costs | $1,213 | $55 |
| Real Estate Taxes | $5,259 | $0 |
Property Value by Mortgage Status in Tahoe Vista
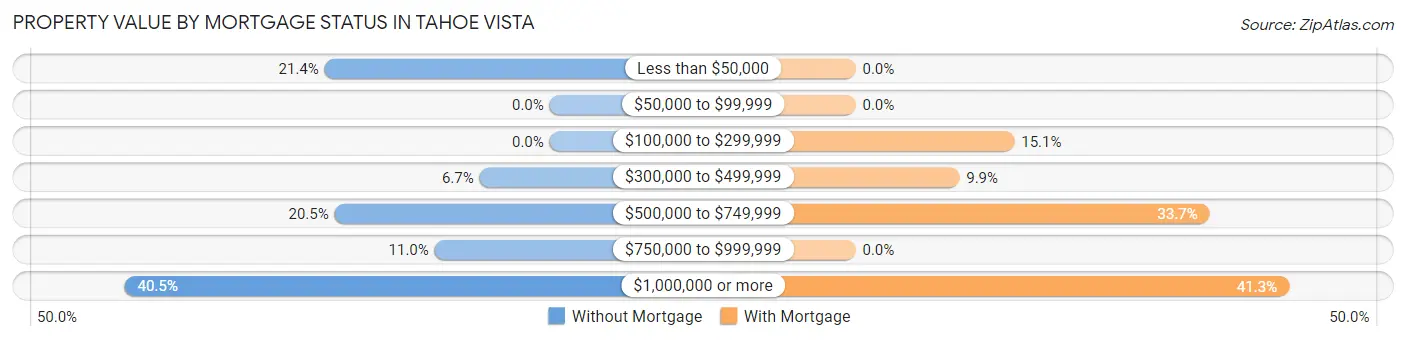
| Property Value | Without Mortgage | With Mortgage |
| Less than $50,000 | 45 (21.4%) | 0 (0.0%) |
| $50,000 to $99,999 | 0 (0.0%) | 0 (0.0%) |
| $100,000 to $299,999 | 0 (0.0%) | 26 (15.1%) |
| $300,000 to $499,999 | 14 (6.7%) | 17 (9.9%) |
| $500,000 to $749,999 | 43 (20.5%) | 58 (33.7%) |
| $750,000 to $999,999 | 23 (11.0%) | 0 (0.0%) |
| $1,000,000 or more | 85 (40.5%) | 71 (41.3%) |
| Total | 210 (100.0%) | 172 (100.0%) |
Household Income by Mortgage Status in Tahoe Vista
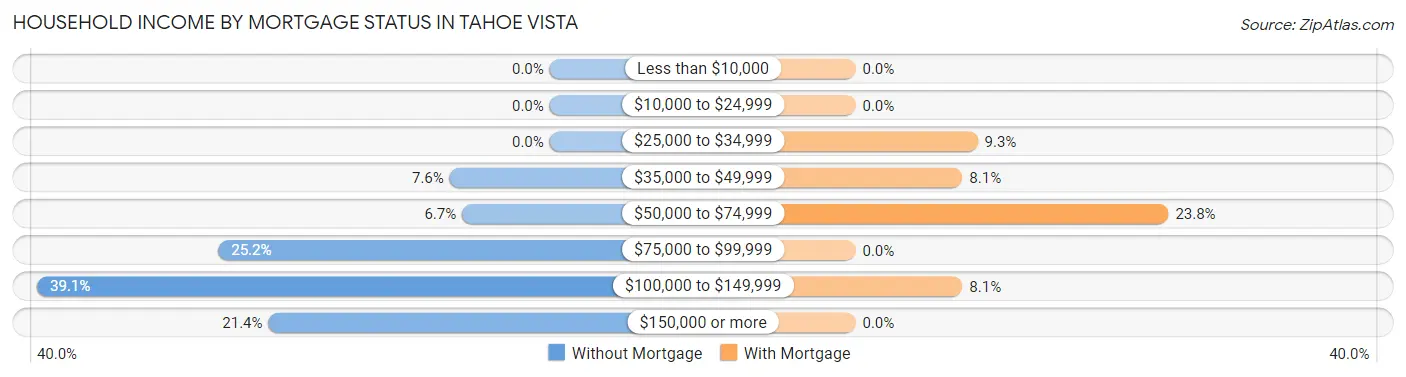
| Household Income | Without Mortgage | With Mortgage |
| Less than $10,000 | 0 (0.0%) | 0 (0.0%) |
| $10,000 to $24,999 | 0 (0.0%) | 0 (0.0%) |
| $25,000 to $34,999 | 0 (0.0%) | 16 (9.3%) |
| $35,000 to $49,999 | 16 (7.6%) | 14 (8.1%) |
| $50,000 to $74,999 | 14 (6.7%) | 41 (23.8%) |
| $75,000 to $99,999 | 53 (25.2%) | 0 (0.0%) |
| $100,000 to $149,999 | 82 (39.1%) | 14 (8.1%) |
| $150,000 or more | 45 (21.4%) | 0 (0.0%) |
| Total | 210 (100.0%) | 172 (100.0%) |
Property Value to Household Income Ratio in Tahoe Vista
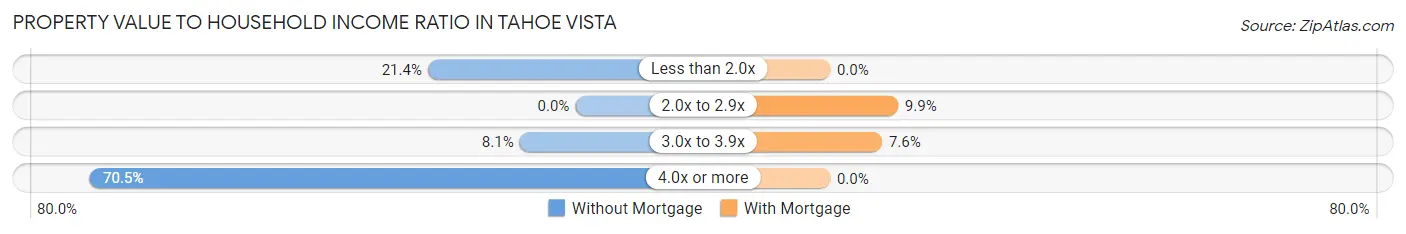
| Value-to-Income Ratio | Without Mortgage | With Mortgage |
| Less than 2.0x | 45 (21.4%) | 0 (0.0%) |
| 2.0x to 2.9x | 0 (0.0%) | 17 (9.9%) |
| 3.0x to 3.9x | 17 (8.1%) | 13 (7.6%) |
| 4.0x or more | 148 (70.5%) | 0 (0.0%) |
| Total | 210 (100.0%) | 172 (100.0%) |
Real Estate Taxes by Mortgage Status in Tahoe Vista
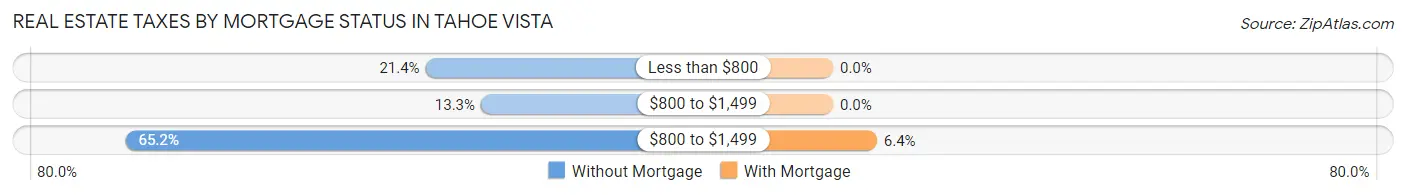
| Property Taxes | Without Mortgage | With Mortgage |
| Less than $800 | 45 (21.4%) | 0 (0.0%) |
| $800 to $1,499 | 28 (13.3%) | 0 (0.0%) |
| $800 to $1,499 | 137 (65.2%) | 11 (6.4%) |
| Total | 210 (100.0%) | 172 (100.0%) |
Health & Disability in Tahoe Vista
Health Insurance Coverage by Age in Tahoe Vista
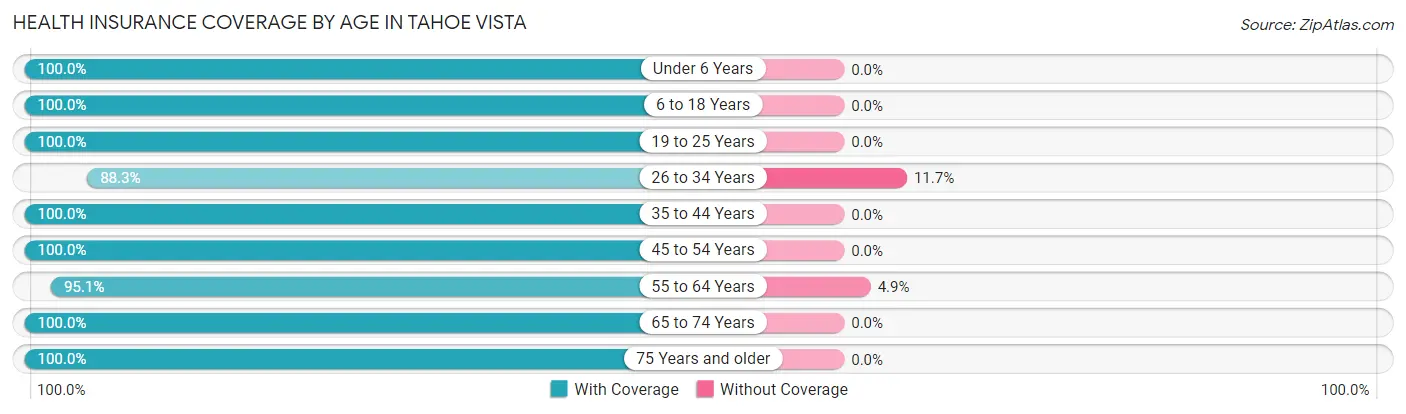
| Age Bracket | With Coverage | Without Coverage |
| Under 6 Years | 45 (100.0%) | 0 (0.0%) |
| 6 to 18 Years | 134 (100.0%) | 0 (0.0%) |
| 19 to 25 Years | 95 (100.0%) | 0 (0.0%) |
| 26 to 34 Years | 68 (88.3%) | 9 (11.7%) |
| 35 to 44 Years | 159 (100.0%) | 0 (0.0%) |
| 45 to 54 Years | 86 (100.0%) | 0 (0.0%) |
| 55 to 64 Years | 289 (95.1%) | 15 (4.9%) |
| 65 to 74 Years | 221 (100.0%) | 0 (0.0%) |
| 75 Years and older | 50 (100.0%) | 0 (0.0%) |
| Total | 1,147 (98.0%) | 24 (2.1%) |
Health Insurance Coverage by Citizenship Status in Tahoe Vista
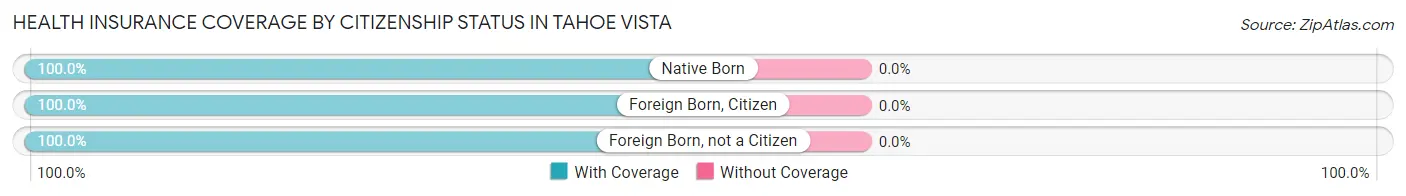
| Citizenship Status | With Coverage | Without Coverage |
| Native Born | 45 (100.0%) | 0 (0.0%) |
| Foreign Born, Citizen | 134 (100.0%) | 0 (0.0%) |
| Foreign Born, not a Citizen | 95 (100.0%) | 0 (0.0%) |
Health Insurance Coverage by Household Income in Tahoe Vista
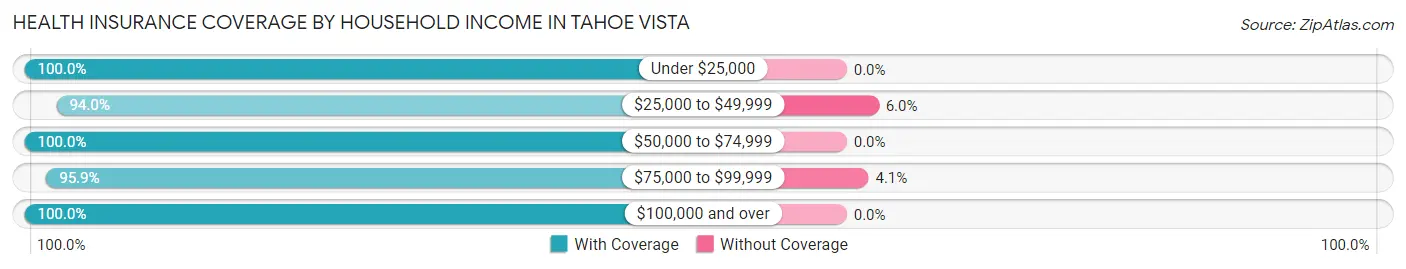
| Household Income | With Coverage | Without Coverage |
| Under $25,000 | 80 (100.0%) | 0 (0.0%) |
| $25,000 to $49,999 | 236 (94.0%) | 15 (6.0%) |
| $50,000 to $74,999 | 28 (100.0%) | 0 (0.0%) |
| $75,000 to $99,999 | 212 (95.9%) | 9 (4.1%) |
| $100,000 and over | 591 (100.0%) | 0 (0.0%) |
Public vs Private Health Insurance Coverage by Age in Tahoe Vista
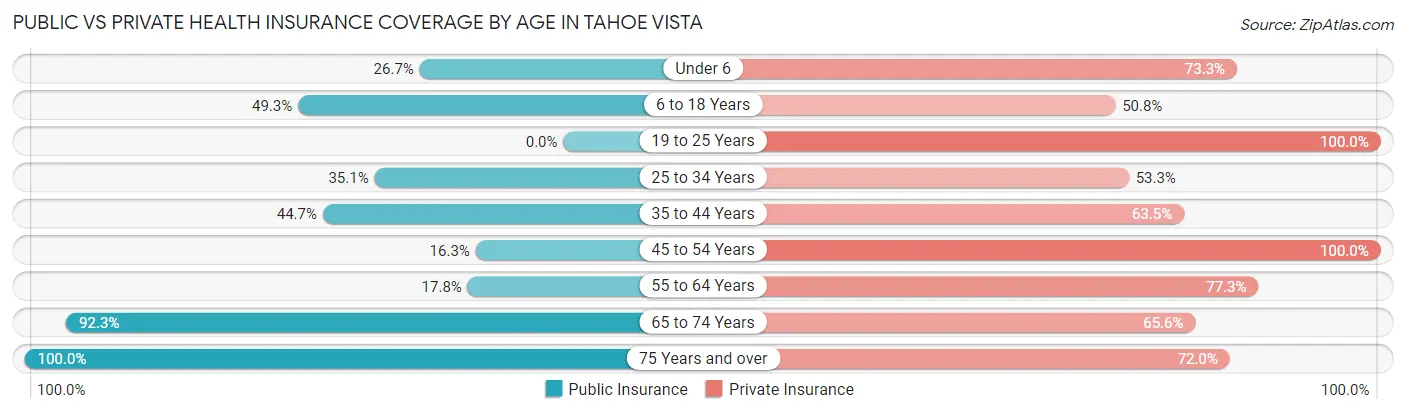
| Age Bracket | Public Insurance | Private Insurance |
| Under 6 | 12 (26.7%) | 33 (73.3%) |
| 6 to 18 Years | 66 (49.2%) | 68 (50.7%) |
| 19 to 25 Years | 0 (0.0%) | 95 (100.0%) |
| 25 to 34 Years | 27 (35.1%) | 41 (53.2%) |
| 35 to 44 Years | 71 (44.7%) | 101 (63.5%) |
| 45 to 54 Years | 14 (16.3%) | 86 (100.0%) |
| 55 to 64 Years | 54 (17.8%) | 235 (77.3%) |
| 65 to 74 Years | 204 (92.3%) | 145 (65.6%) |
| 75 Years and over | 50 (100.0%) | 36 (72.0%) |
| Total | 498 (42.5%) | 840 (71.7%) |
Disability Status by Sex by Age in Tahoe Vista
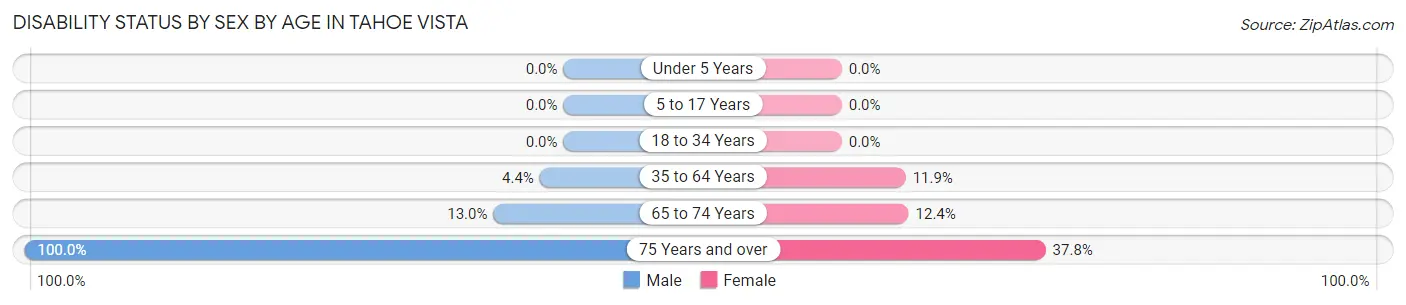
| Age Bracket | Male | Female |
| Under 5 Years | 0 (0.0%) | 0 (0.0%) |
| 5 to 17 Years | 0 (0.0%) | 0 (0.0%) |
| 18 to 34 Years | 0 (0.0%) | 0 (0.0%) |
| 35 to 64 Years | 13 (4.4%) | 30 (11.9%) |
| 65 to 74 Years | 13 (13.0%) | 15 (12.4%) |
| 75 Years and over | 13 (100.0%) | 14 (37.8%) |
Disability Class by Sex by Age in Tahoe Vista
Disability Class: Hearing Difficulty
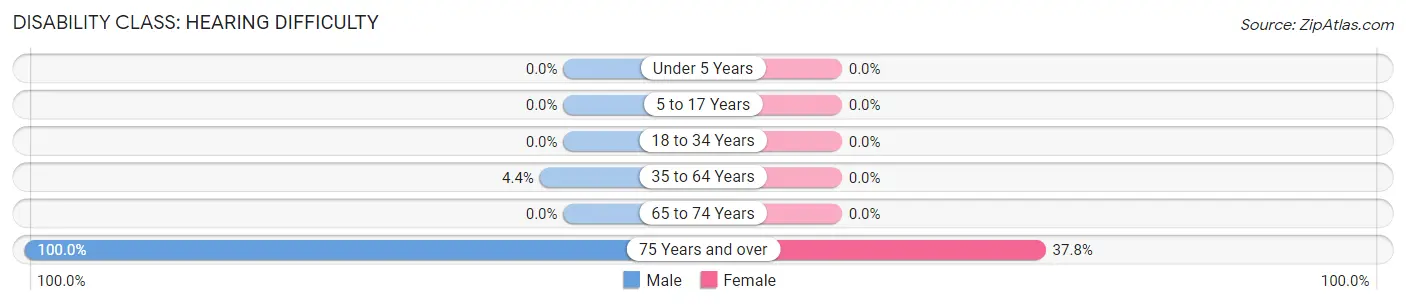
| Age Bracket | Male | Female |
| Under 5 Years | 0 (0.0%) | 0 (0.0%) |
| 5 to 17 Years | 0 (0.0%) | 0 (0.0%) |
| 18 to 34 Years | 0 (0.0%) | 0 (0.0%) |
| 35 to 64 Years | 13 (4.4%) | 0 (0.0%) |
| 65 to 74 Years | 0 (0.0%) | 0 (0.0%) |
| 75 Years and over | 13 (100.0%) | 14 (37.8%) |
Disability Class: Vision Difficulty
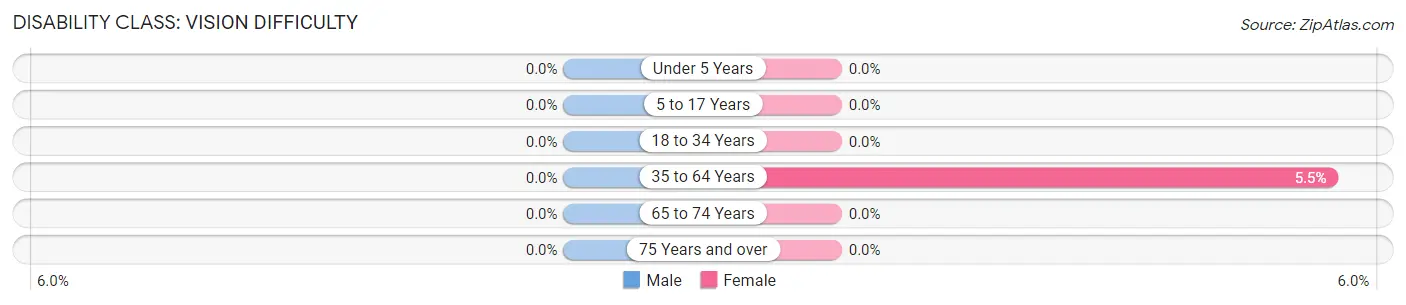
| Age Bracket | Male | Female |
| Under 5 Years | 0 (0.0%) | 0 (0.0%) |
| 5 to 17 Years | 0 (0.0%) | 0 (0.0%) |
| 18 to 34 Years | 0 (0.0%) | 0 (0.0%) |
| 35 to 64 Years | 0 (0.0%) | 14 (5.5%) |
| 65 to 74 Years | 0 (0.0%) | 0 (0.0%) |
| 75 Years and over | 0 (0.0%) | 0 (0.0%) |
Disability Class: Cognitive Difficulty

| Age Bracket | Male | Female |
| 5 to 17 Years | 0 (0.0%) | 0 (0.0%) |
| 18 to 34 Years | 0 (0.0%) | 0 (0.0%) |
| 35 to 64 Years | 0 (0.0%) | 0 (0.0%) |
| 65 to 74 Years | 0 (0.0%) | 15 (12.4%) |
| 75 Years and over | 0 (0.0%) | 0 (0.0%) |
Disability Class: Ambulatory Difficulty
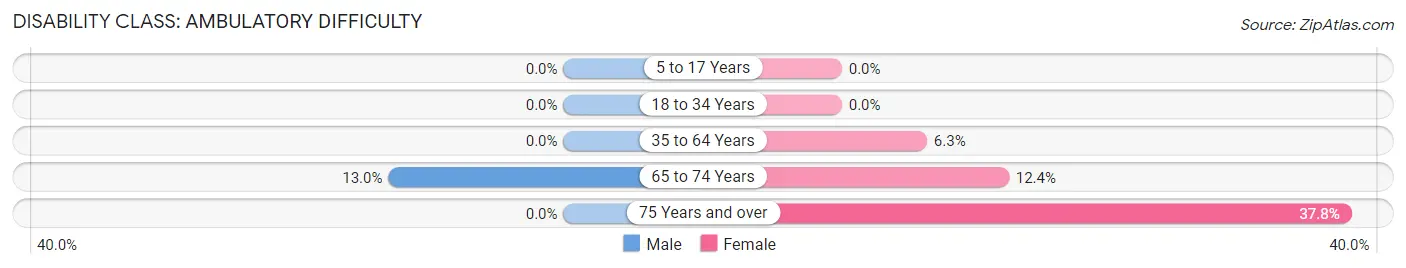
| Age Bracket | Male | Female |
| 5 to 17 Years | 0 (0.0%) | 0 (0.0%) |
| 18 to 34 Years | 0 (0.0%) | 0 (0.0%) |
| 35 to 64 Years | 0 (0.0%) | 16 (6.3%) |
| 65 to 74 Years | 13 (13.0%) | 15 (12.4%) |
| 75 Years and over | 0 (0.0%) | 14 (37.8%) |
Disability Class: Self-Care Difficulty
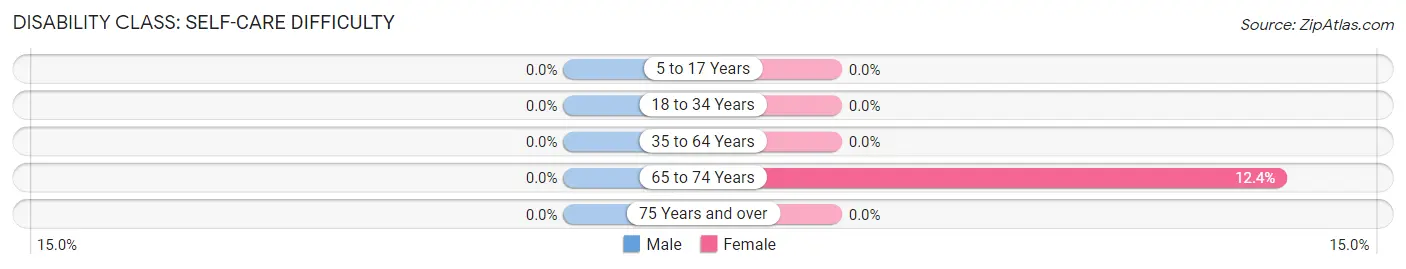
| Age Bracket | Male | Female |
| 5 to 17 Years | 0 (0.0%) | 0 (0.0%) |
| 18 to 34 Years | 0 (0.0%) | 0 (0.0%) |
| 35 to 64 Years | 0 (0.0%) | 0 (0.0%) |
| 65 to 74 Years | 0 (0.0%) | 15 (12.4%) |
| 75 Years and over | 0 (0.0%) | 0 (0.0%) |
Technology Access in Tahoe Vista
Computing Device Access in Tahoe Vista
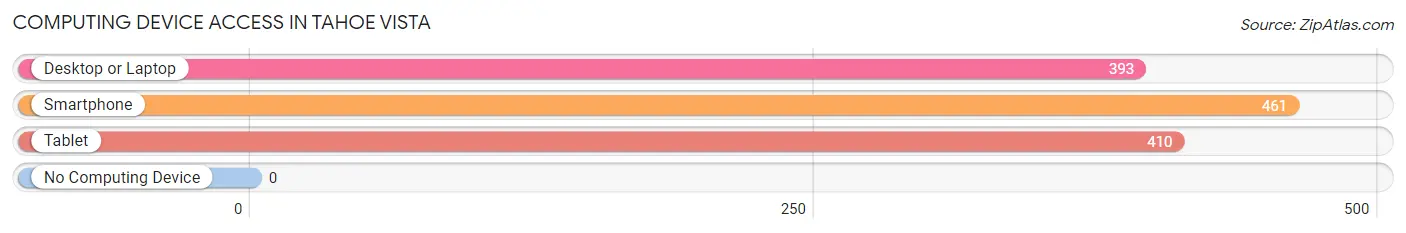
| Device Type | # Households | % Households |
| Desktop or Laptop | 393 | 80.5% |
| Smartphone | 461 | 94.5% |
| Tablet | 410 | 84.0% |
| No Computing Device | 0 | 0.0% |
| Total | 488 | 100.0% |
Internet Access in Tahoe Vista
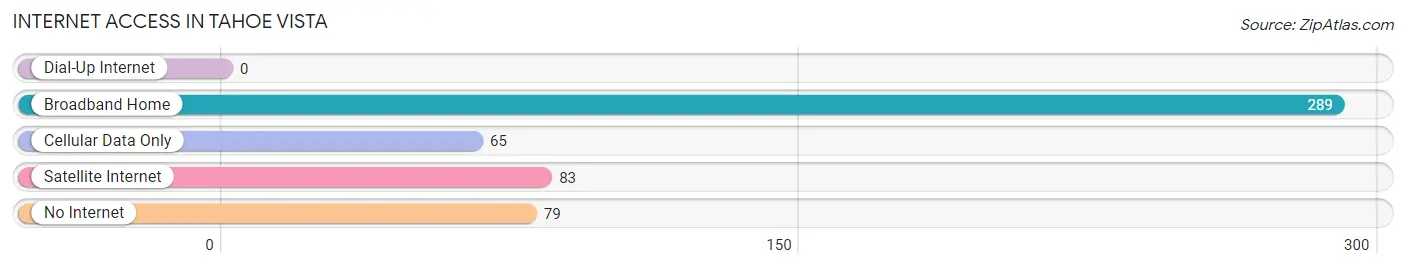
| Internet Type | # Households | % Households |
| Dial-Up Internet | 0 | 0.0% |
| Broadband Home | 289 | 59.2% |
| Cellular Data Only | 65 | 13.3% |
| Satellite Internet | 83 | 17.0% |
| No Internet | 79 | 16.2% |
| Total | 488 | 100.0% |
Tahoe Vista Summary
Tahoe Vista is a small town located in Placer County, California, United States. It is situated on the north shore of Lake Tahoe, and is part of the North Lake Tahoe region. The town has a population of approximately 1,500 people, and is a popular tourist destination due to its proximity to the lake and its many recreational activities.
History
Tahoe Vista was originally inhabited by the Washoe people, who lived in the area for thousands of years before the arrival of European settlers. The first Europeans to settle in the area were miners, who arrived in the late 19th century in search of gold. The town was officially founded in 1906, and was originally known as “Tahoe Vista Beach”. The name was changed to “Tahoe Vista” in 1925.
The town grew slowly over the years, and by the 1950s it had become a popular tourist destination. The town was incorporated in 1965, and has since become a popular destination for vacationers and outdoor enthusiasts.
Geography
Tahoe Vista is located on the north shore of Lake Tahoe, in Placer County, California. The town is situated at an elevation of 6,200 feet, and is surrounded by the Sierra Nevada mountain range. The town is located approximately 25 miles from the Nevada state line, and is approximately 40 miles from the California state capital of Sacramento.
The town is situated on the western shore of Lake Tahoe, and is bordered by the communities of Kings Beach, Carnelian Bay, and Tahoe City. The town is also close to the popular ski resorts of Squaw Valley and Alpine Meadows.
Economy
Tahoe Vista’s economy is largely based on tourism. The town is a popular destination for vacationers and outdoor enthusiasts, and is home to a variety of hotels, restaurants, and other businesses catering to tourists. The town is also home to a number of marinas, which provide access to the lake for boaters and other water sports enthusiasts.
The town is also home to a number of small businesses, including retail stores, restaurants, and other services. The town is also home to a number of real estate offices, which cater to the needs of vacationers and second-home owners.
Demographics
As of the 2010 census, the population of Tahoe Vista was 1,521. The racial makeup of the town was 94.3% White, 0.7% African American, 0.7% Native American, 0.7% Asian, 0.2% Pacific Islander, 1.2% from other races, and 2.1% from two or more races. Hispanic or Latino of any race were 4.2% of the population.
The median household income in Tahoe Vista was $50,938, and the median family income was $60,000. The per capita income for the town was $30,938. About 8.3% of families and 11.2% of the population were below the poverty line, including 16.7% of those under age 18 and 4.2% of those age 65 or over.
Tahoe Vista is a small town with a unique history and culture. The town is a popular destination for vacationers and outdoor enthusiasts, and is home to a variety of businesses catering to tourists. The town is also home to a number of small businesses, and is a popular destination for second-home owners. The town has a diverse population, and is a great place to live and visit.
Common Questions
What is Per Capita Income in Tahoe Vista?
Per Capita income in Tahoe Vista is $51,560.
What is the Median Family Income in Tahoe Vista?
Median Family Income in Tahoe Vista is $106,542.
What is the Median Household income in Tahoe Vista?
Median Household Income in Tahoe Vista is $91,944.
What is Inequality or Gini Index in Tahoe Vista?
Inequality or Gini Index in Tahoe Vista is 0.44.
What is the Total Population of Tahoe Vista?
Total Population of Tahoe Vista is 1,171.
What is the Total Male Population of Tahoe Vista?
Total Male Population of Tahoe Vista is 475.
What is the Total Female Population of Tahoe Vista?
Total Female Population of Tahoe Vista is 696.
What is the Ratio of Males per 100 Females in Tahoe Vista?
There are 68.25 Males per 100 Females in Tahoe Vista.
What is the Ratio of Females per 100 Males in Tahoe Vista?
There are 146.53 Females per 100 Males in Tahoe Vista.
What is the Median Population Age in Tahoe Vista?
Median Population Age in Tahoe Vista is 50.3 Years.
What is the Average Family Size in Tahoe Vista
Average Family Size in Tahoe Vista is 2.9 People.
What is the Average Household Size in Tahoe Vista
Average Household Size in Tahoe Vista is 2.4 People.
How Large is the Labor Force in Tahoe Vista?
There are 674 People in the Labor Forcein in Tahoe Vista.
What is the Percentage of People in the Labor Force in Tahoe Vista?
67.9% of People are in the Labor Force in Tahoe Vista.