Taft Heights, CA Map & Demographics
Taft Heights Map
Taft Heights Overview
$26,700
PER CAPITA INCOME
$47,917
AVG FAMILY INCOME
$60,675
AVG HOUSEHOLD INCOME
62.8%
WAGE / INCOME GAP [ % ]
37.2¢/ $1
WAGE / INCOME GAP [ $ ]
0.35
INEQUALITY / GINI INDEX
1,638
TOTAL POPULATION
945
MALE POPULATION
693
FEMALE POPULATION
136.36
MALES / 100 FEMALES
73.33
FEMALES / 100 MALES
31.5
MEDIAN AGE
3.5
AVG FAMILY SIZE
2.7
AVG HOUSEHOLD SIZE
848
LABOR FORCE [ PEOPLE ]
68.8%
PERCENT IN LABOR FORCE
8.7%
UNEMPLOYMENT RATE
Income in Taft Heights
Income Overview in Taft Heights
Per Capita Income in Taft Heights is $26,700, while median incomes of families and households are $47,917 and $60,675 respectively.
| Characteristic | Number | Measure |
| Per Capita Income | 1,638 | $26,700 |
| Median Family Income | 376 | $47,917 |
| Mean Family Income | 376 | $69,206 |
| Median Household Income | 611 | $60,675 |
| Mean Household Income | 611 | $67,830 |
| Income Deficit | 376 | $0 |
| Wage / Income Gap (%) | 1,638 | 62.83% |
| Wage / Income Gap ($) | 1,638 | 37.17¢ per $1 |
| Gini / Inequality Index | 1,638 | 0.35 |
Earnings by Sex in Taft Heights
Average Earnings in Taft Heights are $33,917, $51,142 for men and $19,007 for women, a difference of 62.8%.
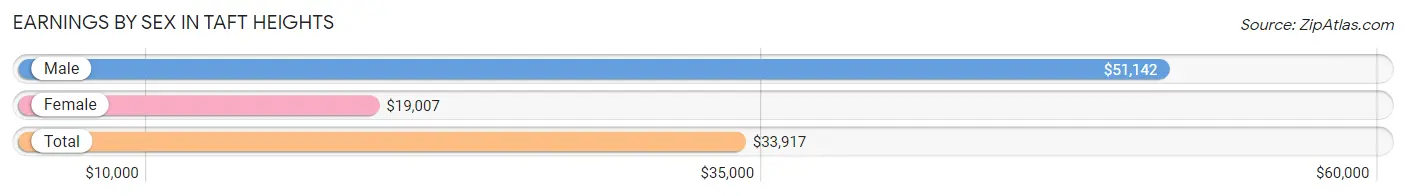
| Sex | Number | Average Earnings |
| Male | 542 (64.3%) | $51,142 |
| Female | 301 (35.7%) | $19,007 |
| Total | 843 (100.0%) | $33,917 |
Earnings by Sex by Income Bracket in Taft Heights
The most common earnings brackets in Taft Heights are $50,000 to $54,999 for men (92 | 17.0%) and $20,000 to $22,499 for women (83 | 27.6%).
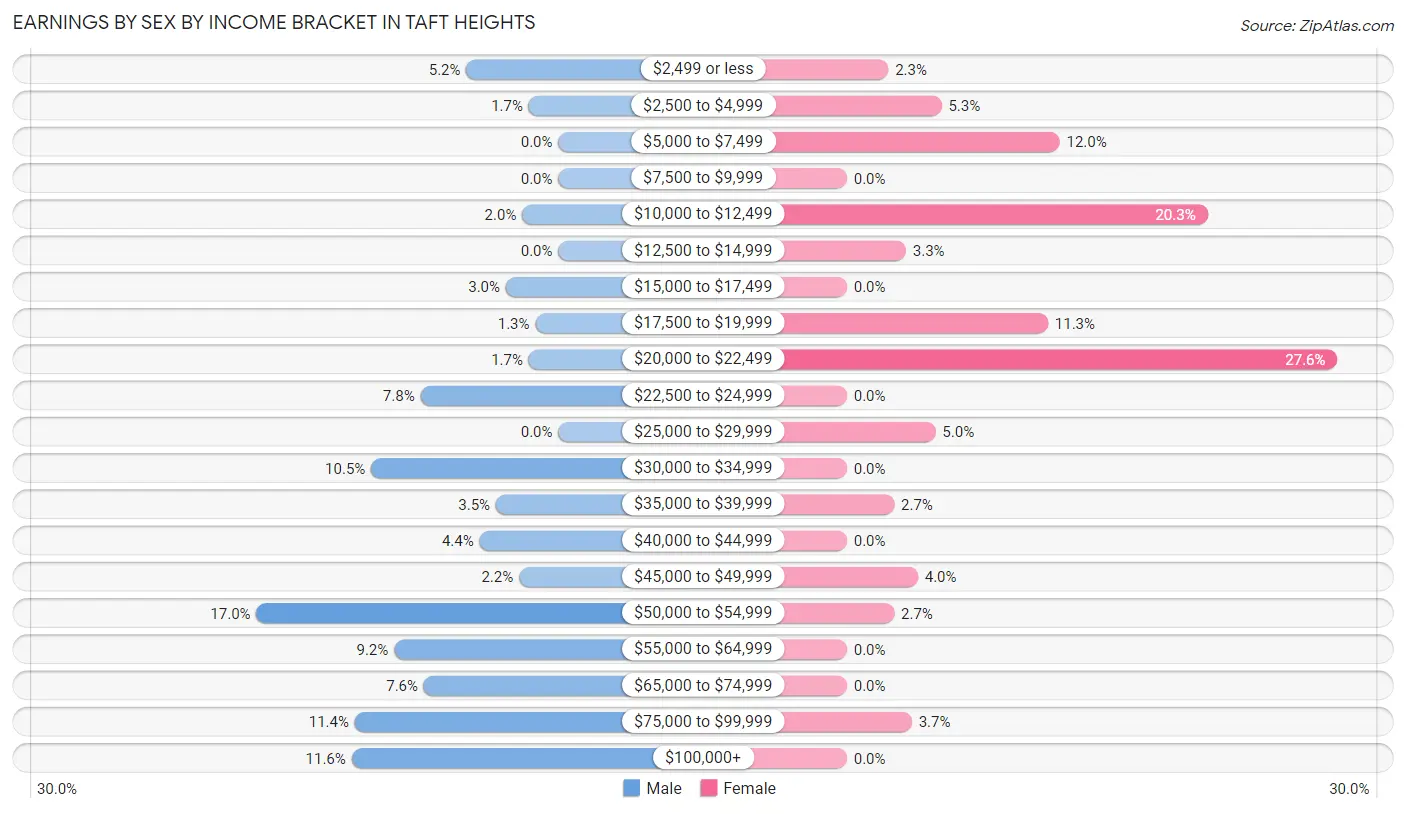
| Income | Male | Female |
| $2,499 or less | 28 (5.2%) | 7 (2.3%) |
| $2,500 to $4,999 | 9 (1.7%) | 16 (5.3%) |
| $5,000 to $7,499 | 0 (0.0%) | 36 (12.0%) |
| $7,500 to $9,999 | 0 (0.0%) | 0 (0.0%) |
| $10,000 to $12,499 | 11 (2.0%) | 61 (20.3%) |
| $12,500 to $14,999 | 0 (0.0%) | 10 (3.3%) |
| $15,000 to $17,499 | 16 (2.9%) | 0 (0.0%) |
| $17,500 to $19,999 | 7 (1.3%) | 34 (11.3%) |
| $20,000 to $22,499 | 9 (1.7%) | 83 (27.6%) |
| $22,500 to $24,999 | 42 (7.7%) | 0 (0.0%) |
| $25,000 to $29,999 | 0 (0.0%) | 15 (5.0%) |
| $30,000 to $34,999 | 57 (10.5%) | 0 (0.0%) |
| $35,000 to $39,999 | 19 (3.5%) | 8 (2.7%) |
| $40,000 to $44,999 | 24 (4.4%) | 0 (0.0%) |
| $45,000 to $49,999 | 12 (2.2%) | 12 (4.0%) |
| $50,000 to $54,999 | 92 (17.0%) | 8 (2.7%) |
| $55,000 to $64,999 | 50 (9.2%) | 0 (0.0%) |
| $65,000 to $74,999 | 41 (7.6%) | 0 (0.0%) |
| $75,000 to $99,999 | 62 (11.4%) | 11 (3.6%) |
| $100,000+ | 63 (11.6%) | 0 (0.0%) |
| Total | 542 (100.0%) | 301 (100.0%) |
Earnings by Sex by Educational Attainment in Taft Heights
Average earnings in Taft Heights are $51,451 for men and $19,853 for women, a difference of 61.4%. Men with an educational attainment of college or associate's degree enjoy the highest average annual earnings of $94,038, while those with high school diploma education earn the least with $50,707. Women with an educational attainment of college or associate's degree earn the most with the average annual earnings of $21,181, while those with less than high school education have the smallest earnings of $18,050.
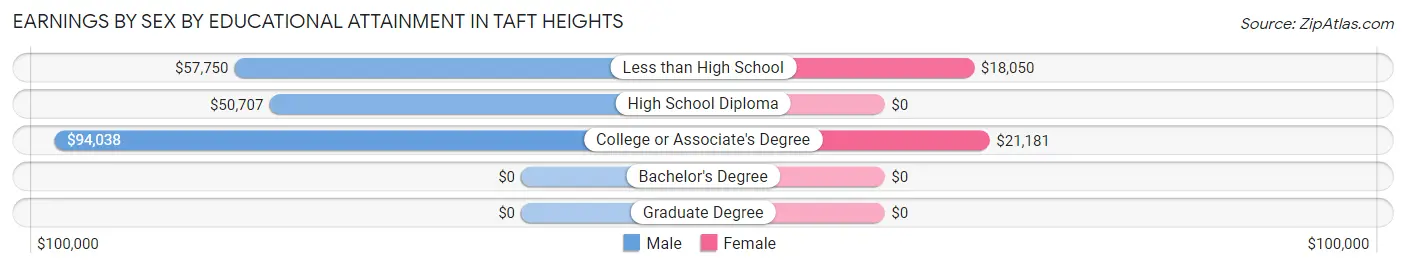
| Educational Attainment | Male Income | Female Income |
| Less than High School | $57,750 | $18,050 |
| High School Diploma | $50,707 | $0 |
| College or Associate's Degree | $94,038 | $21,181 |
| Bachelor's Degree | - | - |
| Graduate Degree | - | - |
| Total | $51,451 | $19,853 |
Family Income in Taft Heights
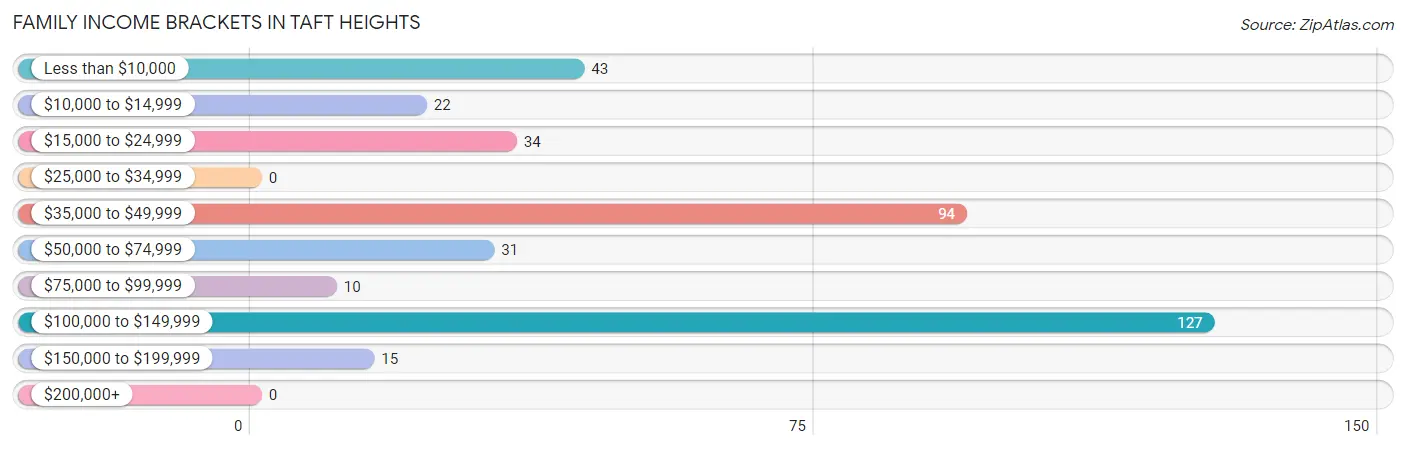
Family Income Brackets in Taft Heights
According to the Taft Heights family income data, there are 127 families falling into the $100,000 to $149,999 income range, which is the most common income bracket and makes up 33.8% of all families.
| Income Bracket | # Families | % Families |
| Less than $10,000 | 43 | 11.4% |
| $10,000 to $14,999 | 22 | 5.9% |
| $15,000 to $24,999 | 34 | 9.0% |
| $25,000 to $34,999 | 0 | 0.0% |
| $35,000 to $49,999 | 94 | 25.0% |
| $50,000 to $74,999 | 31 | 8.2% |
| $75,000 to $99,999 | 10 | 2.7% |
| $100,000 to $149,999 | 127 | 33.8% |
| $150,000 to $199,999 | 15 | 4.0% |
| $200,000+ | 0 | 0.0% |
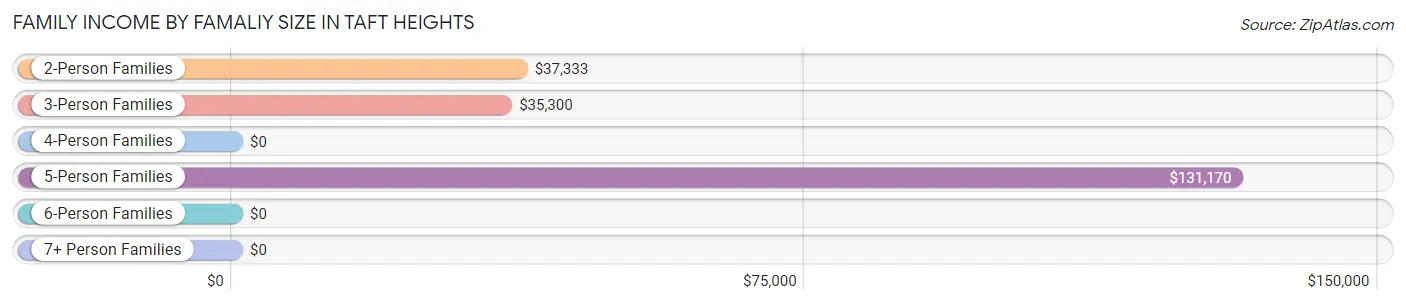
Family Income by Famaliy Size in Taft Heights
5-person families (80 | 21.3%) account for the highest median family income in Taft Heights with $131,170 per family, while 5-person families (80 | 21.3%) have the highest median income of $26,234 per family member.
| Income Bracket | # Families | Median Income |
| 2-Person Families | 138 (36.7%) | $37,333 |
| 3-Person Families | 80 (21.3%) | $35,300 |
| 4-Person Families | 78 (20.7%) | $0 |
| 5-Person Families | 80 (21.3%) | $131,170 |
| 6-Person Families | 0 (0.0%) | $0 |
| 7+ Person Families | 0 (0.0%) | $0 |
| Total | 376 (100.0%) | $47,917 |
Family Income by Number of Earners in Taft Heights
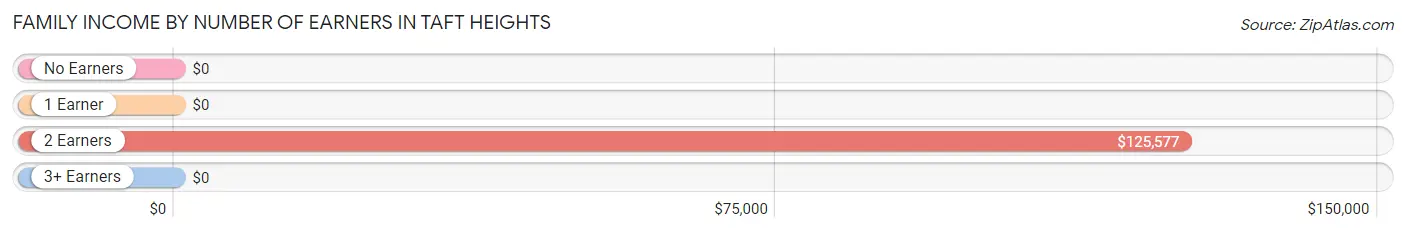
| Number of Earners | # Families | Median Income |
| No Earners | 77 (20.5%) | $0 |
| 1 Earner | 80 (21.3%) | $0 |
| 2 Earners | 184 (48.9%) | $125,577 |
| 3+ Earners | 35 (9.3%) | $0 |
| Total | 376 (100.0%) | $47,917 |
Household Income in Taft Heights
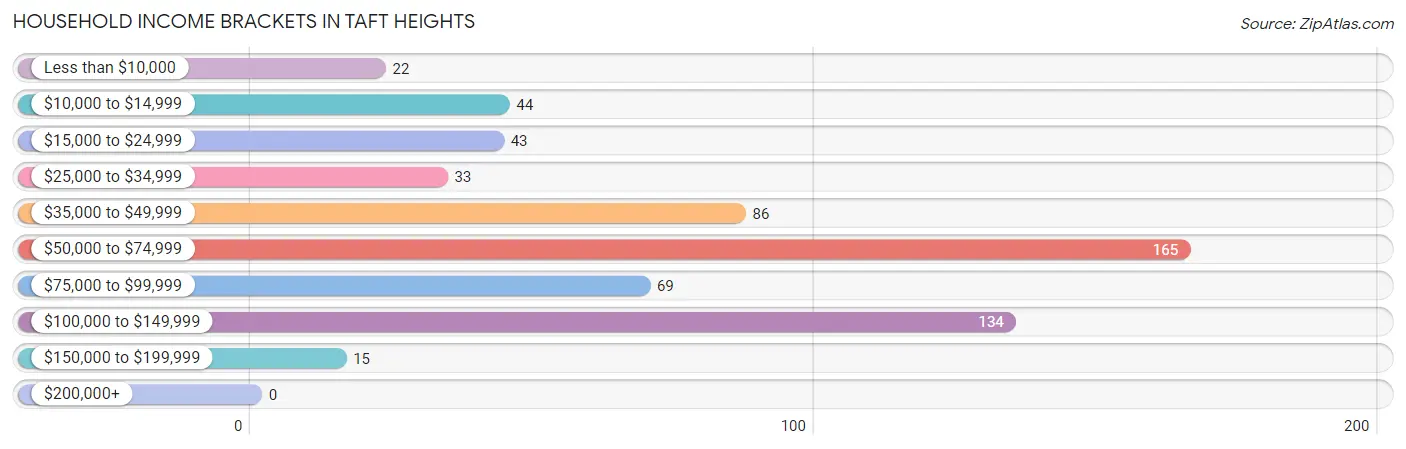
Household Income Brackets in Taft Heights
With 165 households falling in the category, the $50,000 to $74,999 income range is the most frequent in Taft Heights, accounting for 27.0% of all households.
| Income Bracket | # Households | % Households |
| Less than $10,000 | 22 | 3.6% |
| $10,000 to $14,999 | 44 | 7.2% |
| $15,000 to $24,999 | 43 | 7.0% |
| $25,000 to $34,999 | 33 | 5.4% |
| $35,000 to $49,999 | 86 | 14.1% |
| $50,000 to $74,999 | 165 | 27.0% |
| $75,000 to $99,999 | 69 | 11.3% |
| $100,000 to $149,999 | 134 | 21.9% |
| $150,000 to $199,999 | 15 | 2.5% |
| $200,000+ | 0 | 0.0% |
Household Income by Householder Age in Taft Heights
The median household income in Taft Heights is $60,675, with the highest median household income of $60,875 found in the 15 to 24 years age bracket for the primary householder. A total of 72 households (11.8%) fall into this category. Meanwhile, the 65+ years age bracket for the primary householder has the lowest median household income of $0, with 117 households (19.2%) in this group.
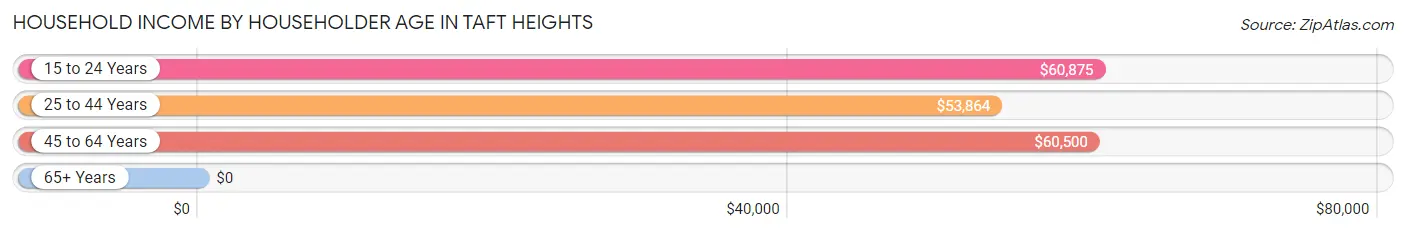
| Income Bracket | # Households | Median Income |
| 15 to 24 Years | 72 (11.8%) | $60,875 |
| 25 to 44 Years | 266 (43.5%) | $53,864 |
| 45 to 64 Years | 156 (25.5%) | $60,500 |
| 65+ Years | 117 (19.2%) | $0 |
| Total | 611 (100.0%) | $60,675 |
Poverty in Taft Heights
Income Below Poverty by Sex and Age in Taft Heights
With 15.6% poverty level for males and 18.8% for females among the residents of Taft Heights, 15 year old males and 18 to 24 year old females are the most vulnerable to poverty, with 25 males (100.0%) and 15 females (100.0%) in their respective age groups living below the poverty level.
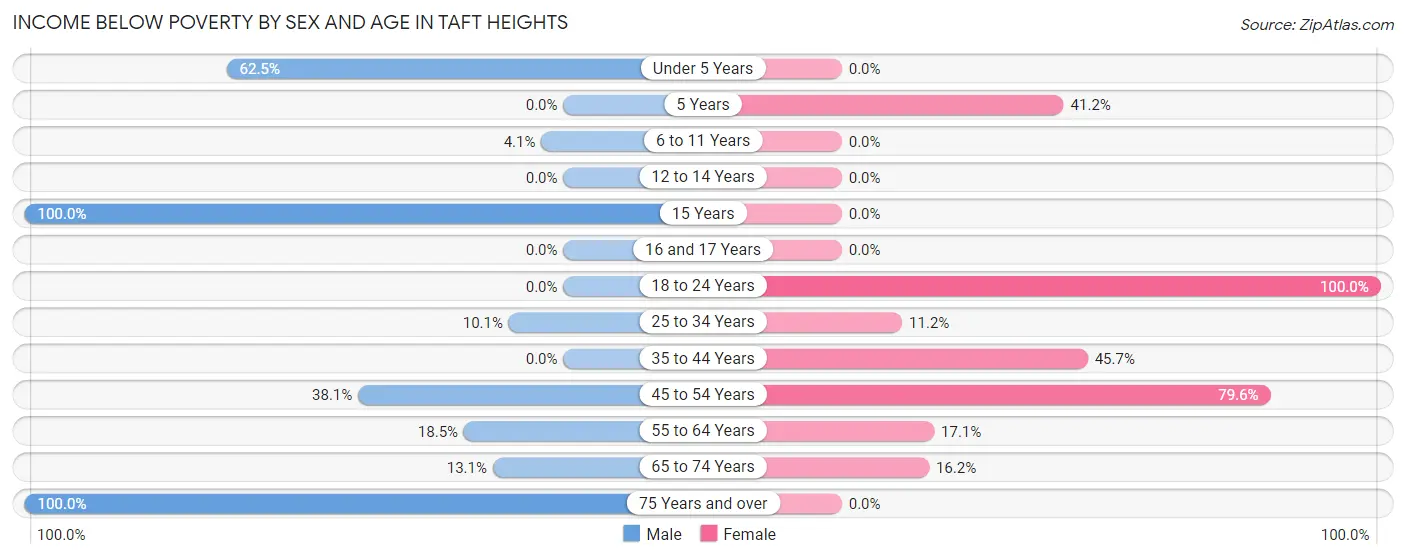
| Age Bracket | Male | Female |
| Under 5 Years | 45 (62.5%) | 0 (0.0%) |
| 5 Years | 0 (0.0%) | 7 (41.2%) |
| 6 to 11 Years | 7 (4.1%) | 0 (0.0%) |
| 12 to 14 Years | 0 (0.0%) | 0 (0.0%) |
| 15 Years | 25 (100.0%) | 0 (0.0%) |
| 16 and 17 Years | 0 (0.0%) | 0 (0.0%) |
| 18 to 24 Years | 0 (0.0%) | 15 (100.0%) |
| 25 to 34 Years | 16 (10.1%) | 29 (11.2%) |
| 35 to 44 Years | 0 (0.0%) | 21 (45.7%) |
| 45 to 54 Years | 8 (38.1%) | 35 (79.5%) |
| 55 to 64 Years | 24 (18.5%) | 12 (17.1%) |
| 65 to 74 Years | 11 (13.1%) | 11 (16.2%) |
| 75 Years and over | 11 (100.0%) | 0 (0.0%) |
| Total | 147 (15.6%) | 130 (18.8%) |
Income Above Poverty by Sex and Age in Taft Heights
According to the poverty statistics in Taft Heights, males aged 18 to 24 years and females aged under 5 years are the age groups that are most secure financially, with 100.0% of males and 100.0% of females in these age groups living above the poverty line.
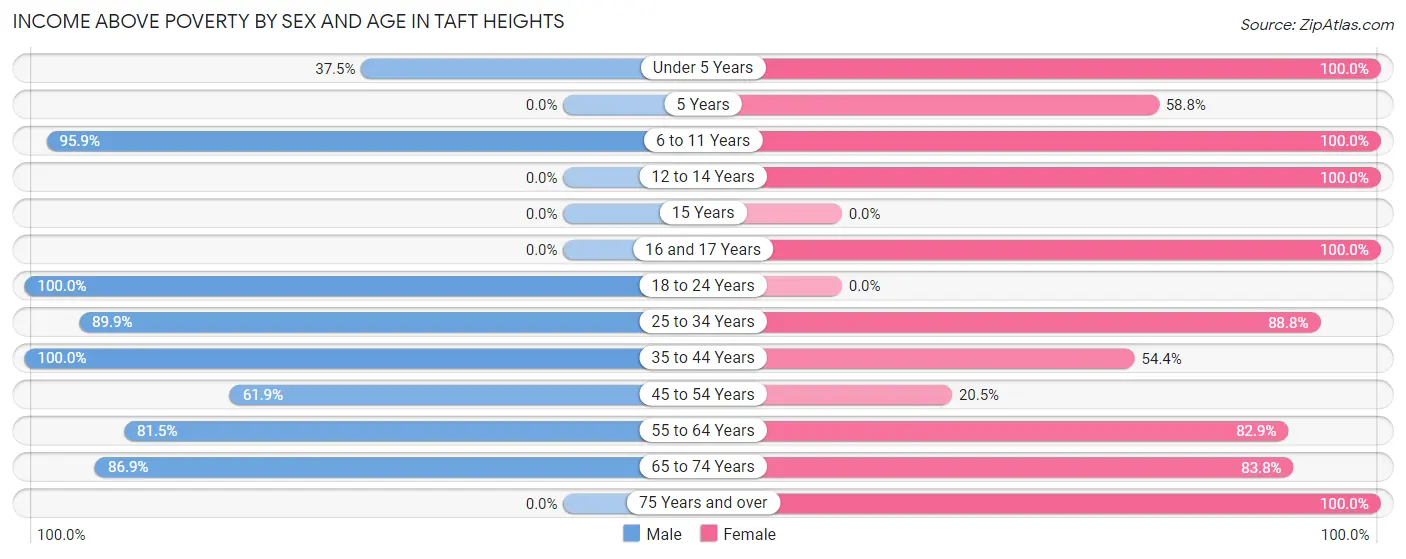
| Age Bracket | Male | Female |
| Under 5 Years | 27 (37.5%) | 79 (100.0%) |
| 5 Years | 0 (0.0%) | 10 (58.8%) |
| 6 to 11 Years | 164 (95.9%) | 24 (100.0%) |
| 12 to 14 Years | 0 (0.0%) | 17 (100.0%) |
| 15 Years | 0 (0.0%) | 0 (0.0%) |
| 16 and 17 Years | 0 (0.0%) | 23 (100.0%) |
| 18 to 24 Years | 100 (100.0%) | 0 (0.0%) |
| 25 to 34 Years | 142 (89.9%) | 230 (88.8%) |
| 35 to 44 Years | 173 (100.0%) | 25 (54.3%) |
| 45 to 54 Years | 13 (61.9%) | 9 (20.4%) |
| 55 to 64 Years | 106 (81.5%) | 58 (82.9%) |
| 65 to 74 Years | 73 (86.9%) | 57 (83.8%) |
| 75 Years and over | 0 (0.0%) | 31 (100.0%) |
| Total | 798 (84.4%) | 563 (81.2%) |
Income Below Poverty Among Married-Couple Families in Taft Heights
The poverty statistics for married-couple families in Taft Heights show that 6.9% or 16 of the total 232 families live below the poverty line. Families with 1 or 2 children have the highest poverty rate of 11.6%, comprising of 16 families. On the other hand, families with no children have the lowest poverty rate of 0.0%, which includes 0 families.
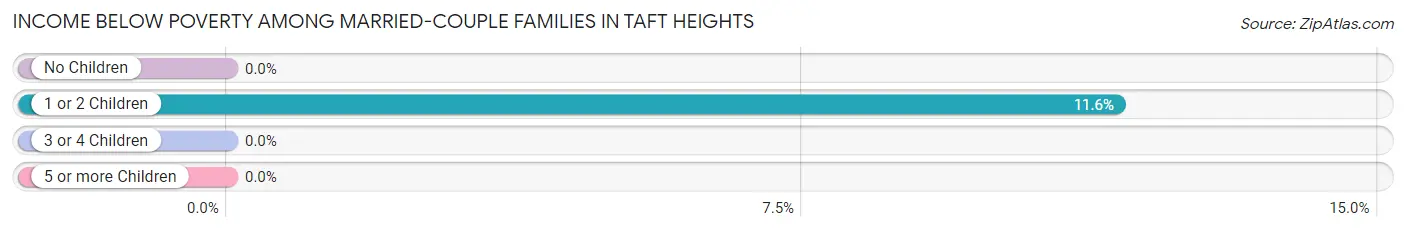
| Children | Above Poverty | Below Poverty |
| No Children | 71 (100.0%) | 0 (0.0%) |
| 1 or 2 Children | 122 (88.4%) | 16 (11.6%) |
| 3 or 4 Children | 23 (100.0%) | 0 (0.0%) |
| 5 or more Children | 0 (0.0%) | 0 (0.0%) |
| Total | 216 (93.1%) | 16 (6.9%) |
Income Below Poverty Among Single-Parent Households in Taft Heights
According to the poverty data in Taft Heights, 26.2% or 11 single-father households and 52.9% or 54 single-mother households are living below the poverty line. Among single-father households, those with no children have the highest poverty rate, with 11 households (34.4%) experiencing poverty. Likewise, among single-mother households, those with no children have the highest poverty rate, with 26 households (63.4%) falling below the poverty line.
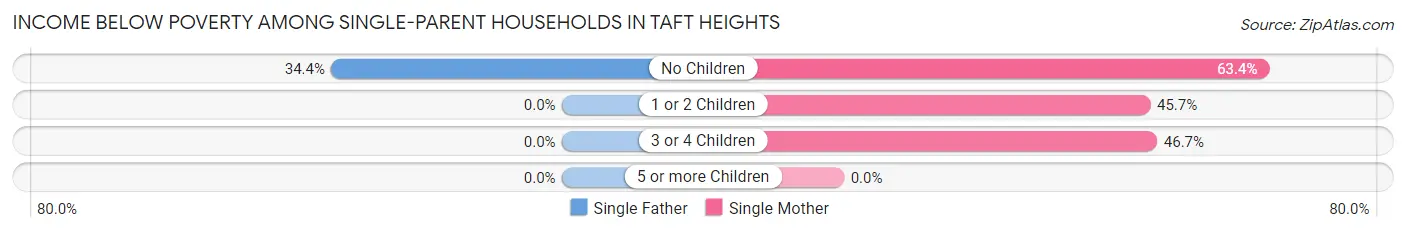
| Children | Single Father | Single Mother |
| No Children | 11 (34.4%) | 26 (63.4%) |
| 1 or 2 Children | 0 (0.0%) | 21 (45.7%) |
| 3 or 4 Children | 0 (0.0%) | 7 (46.7%) |
| 5 or more Children | 0 (0.0%) | 0 (0.0%) |
| Total | 11 (26.2%) | 54 (52.9%) |
Income Below Poverty Among Married-Couple vs Single-Parent Households in Taft Heights
The poverty data for Taft Heights shows that 16 of the married-couple family households (6.9%) and 65 of the single-parent households (45.1%) are living below the poverty level. Within the married-couple family households, those with 1 or 2 children have the highest poverty rate, with 16 households (11.6%) falling below the poverty line. Among the single-parent households, those with no children have the highest poverty rate, with 37 household (50.7%) living below poverty.
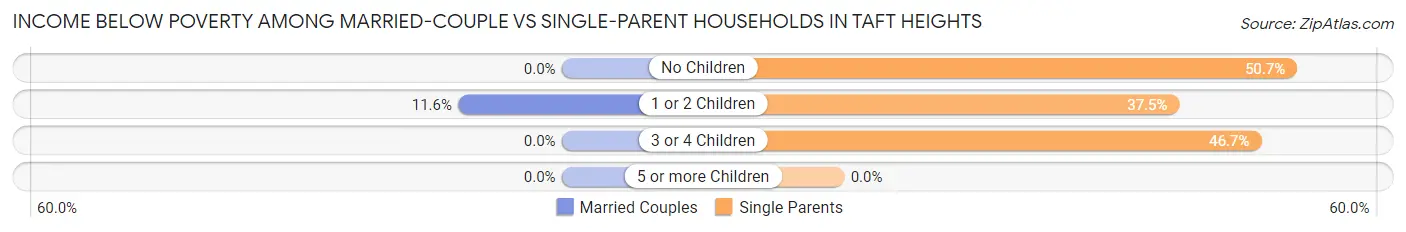
| Children | Married-Couple Families | Single-Parent Households |
| No Children | 0 (0.0%) | 37 (50.7%) |
| 1 or 2 Children | 16 (11.6%) | 21 (37.5%) |
| 3 or 4 Children | 0 (0.0%) | 7 (46.7%) |
| 5 or more Children | 0 (0.0%) | 0 (0.0%) |
| Total | 16 (6.9%) | 65 (45.1%) |
Race in Taft Heights
The most populous races in Taft Heights are White / Caucasian (1,417 | 86.5%), Hispanic or Latino (652 | 39.8%), and Some other Race (119 | 7.3%).
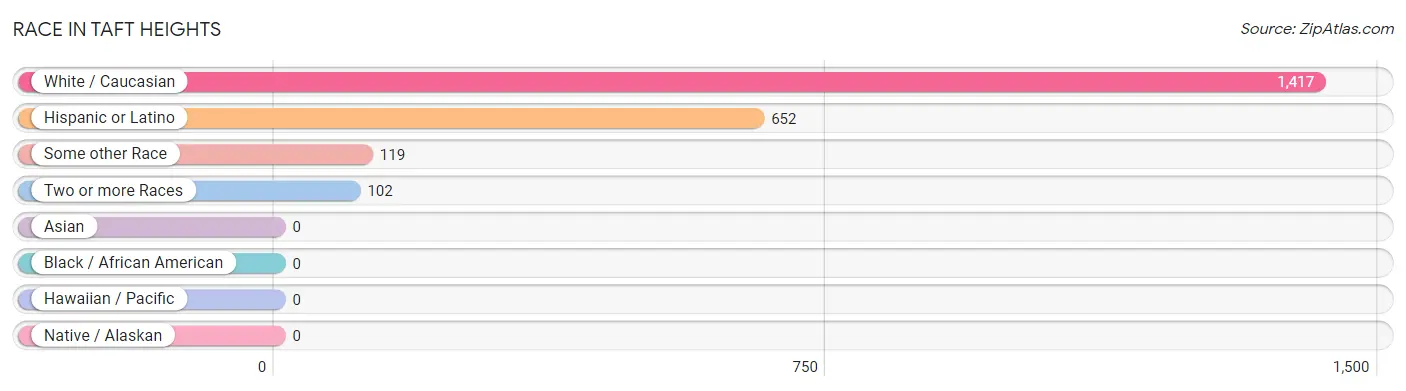
| Race | # Population | % Population |
| Asian | 0 | 0.0% |
| Black / African American | 0 | 0.0% |
| Hawaiian / Pacific | 0 | 0.0% |
| Hispanic or Latino | 652 | 39.8% |
| Native / Alaskan | 0 | 0.0% |
| White / Caucasian | 1,417 | 86.5% |
| Two or more Races | 102 | 6.2% |
| Some other Race | 119 | 7.3% |
| Total | 1,638 | 100.0% |
Ancestry in Taft Heights
The most populous ancestries reported in Taft Heights are Mexican (652 | 39.8%), English (253 | 15.4%), American (129 | 7.9%), Irish (95 | 5.8%), and Scottish (81 | 5.0%), together accounting for 73.9% of all Taft Heights residents.
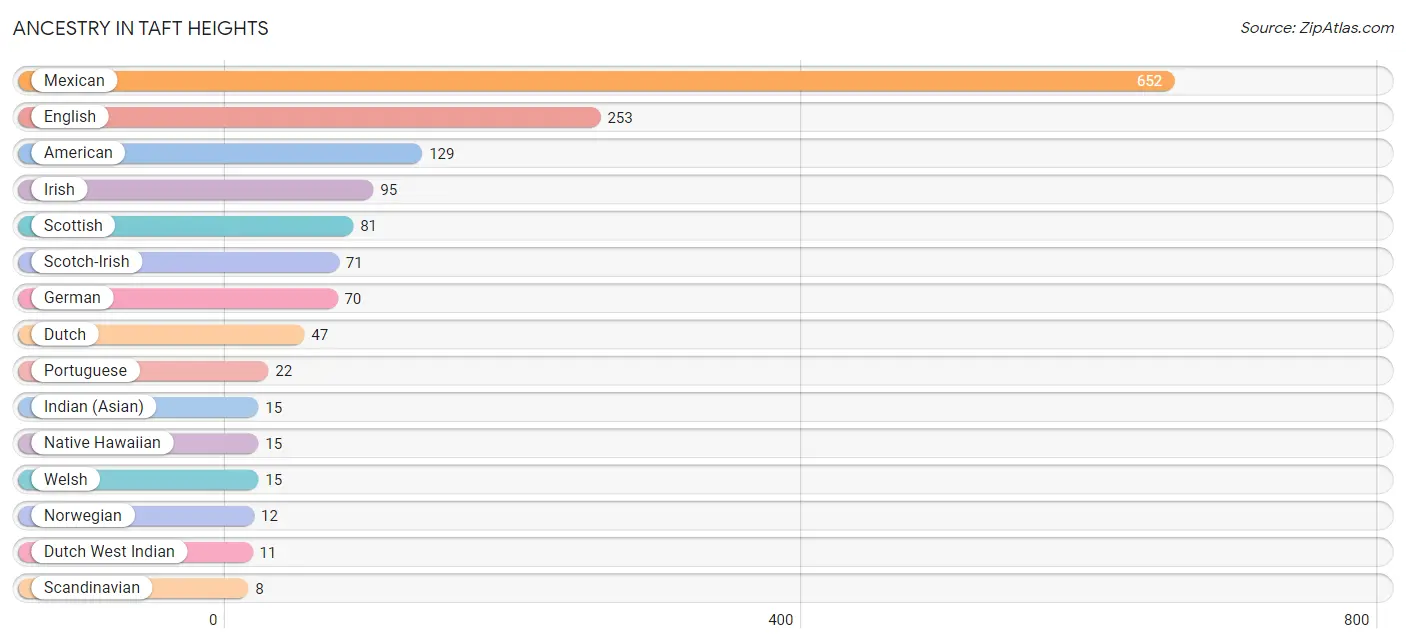
| Ancestry | # Population | % Population |
| American | 129 | 7.9% |
| Dutch | 47 | 2.9% |
| Dutch West Indian | 11 | 0.7% |
| English | 253 | 15.4% |
| German | 70 | 4.3% |
| Indian (Asian) | 15 | 0.9% |
| Irish | 95 | 5.8% |
| Mexican | 652 | 39.8% |
| Native Hawaiian | 15 | 0.9% |
| Norwegian | 12 | 0.7% |
| Portuguese | 22 | 1.3% |
| Scandinavian | 8 | 0.5% |
| Scotch-Irish | 71 | 4.3% |
| Scottish | 81 | 5.0% |
| Welsh | 15 | 0.9% | View All 15 Rows |
Immigrants in Taft Heights
The most numerous immigrant groups reported in Taft Heights came from Central America (172 | 10.5%), Latin America (172 | 10.5%), Mexico (172 | 10.5%), Asia (15 | 0.9%), and Philippines (15 | 0.9%), together accounting for 33.3% of all Taft Heights residents.
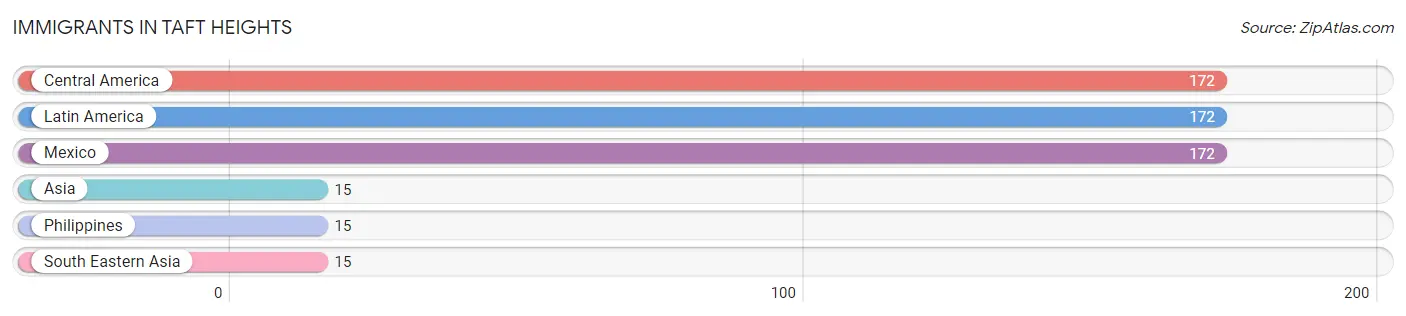
| Immigration Origin | # Population | % Population |
| Asia | 15 | 0.9% |
| Central America | 172 | 10.5% |
| Latin America | 172 | 10.5% |
| Mexico | 172 | 10.5% |
| Philippines | 15 | 0.9% |
| South Eastern Asia | 15 | 0.9% | View All 6 Rows |
Sex and Age in Taft Heights
Sex and Age in Taft Heights
The most populous age groups in Taft Heights are 35 to 39 Years (141 | 14.9%) for men and 30 to 34 Years (175 | 25.3%) for women.
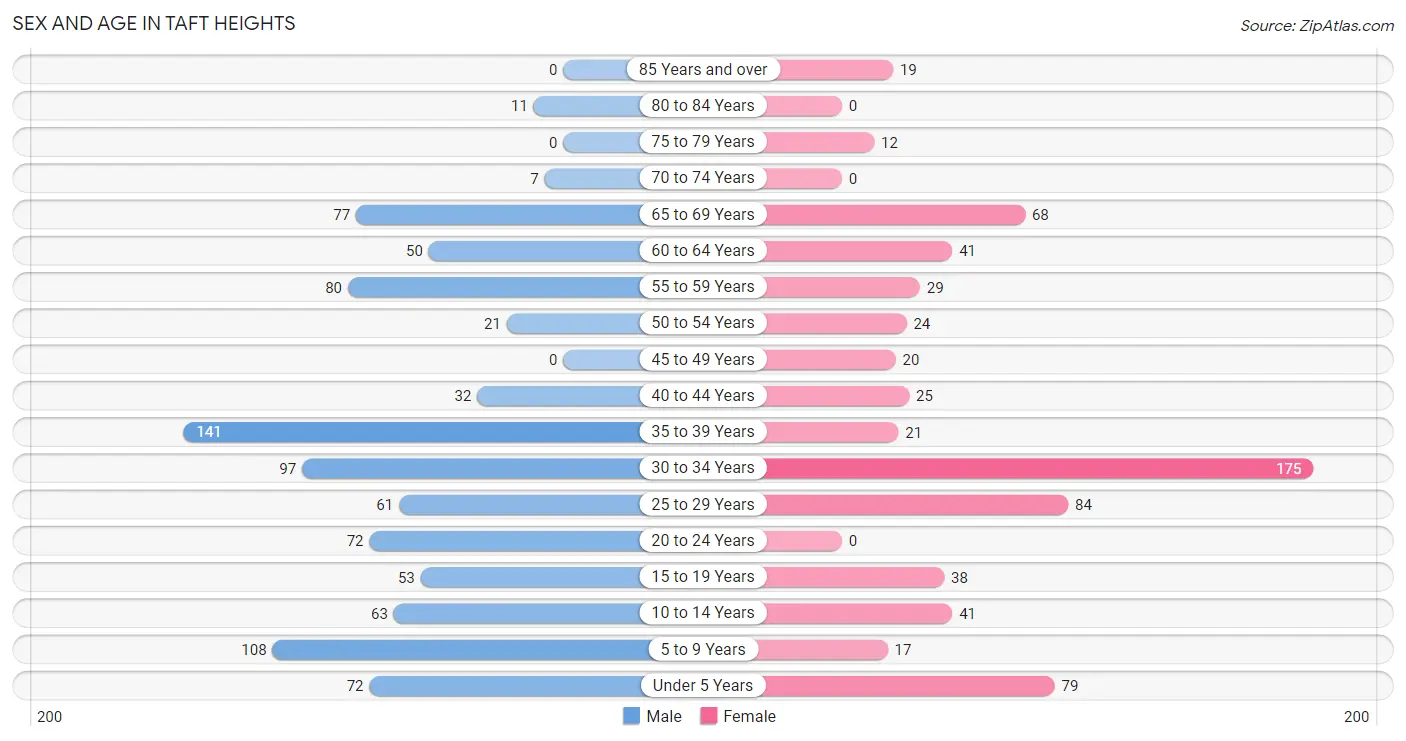
| Age Bracket | Male | Female |
| Under 5 Years | 72 (7.6%) | 79 (11.4%) |
| 5 to 9 Years | 108 (11.4%) | 17 (2.5%) |
| 10 to 14 Years | 63 (6.7%) | 41 (5.9%) |
| 15 to 19 Years | 53 (5.6%) | 38 (5.5%) |
| 20 to 24 Years | 72 (7.6%) | 0 (0.0%) |
| 25 to 29 Years | 61 (6.5%) | 84 (12.1%) |
| 30 to 34 Years | 97 (10.3%) | 175 (25.3%) |
| 35 to 39 Years | 141 (14.9%) | 21 (3.0%) |
| 40 to 44 Years | 32 (3.4%) | 25 (3.6%) |
| 45 to 49 Years | 0 (0.0%) | 20 (2.9%) |
| 50 to 54 Years | 21 (2.2%) | 24 (3.5%) |
| 55 to 59 Years | 80 (8.5%) | 29 (4.2%) |
| 60 to 64 Years | 50 (5.3%) | 41 (5.9%) |
| 65 to 69 Years | 77 (8.2%) | 68 (9.8%) |
| 70 to 74 Years | 7 (0.7%) | 0 (0.0%) |
| 75 to 79 Years | 0 (0.0%) | 12 (1.7%) |
| 80 to 84 Years | 11 (1.2%) | 0 (0.0%) |
| 85 Years and over | 0 (0.0%) | 19 (2.7%) |
| Total | 945 (100.0%) | 693 (100.0%) |
Families and Households in Taft Heights
Median Family Size in Taft Heights
The median family size in Taft Heights is 3.54 persons per family, with married-couple families (232 | 61.7%) accounting for the largest median family size of 3.88 persons per family. On the other hand, single male/father families (42 | 11.2%) represent the smallest median family size with 2.90 persons per family.
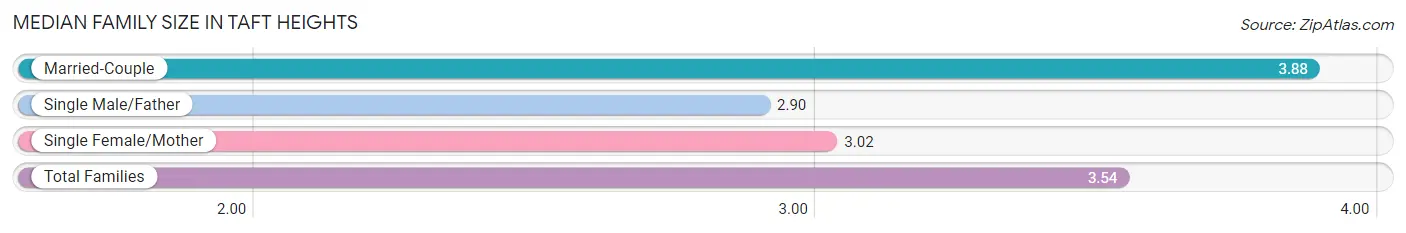
| Family Type | # Families | Family Size |
| Married-Couple | 232 (61.7%) | 3.88 |
| Single Male/Father | 42 (11.2%) | 2.90 |
| Single Female/Mother | 102 (27.1%) | 3.02 |
| Total Families | 376 (100.0%) | 3.54 |
Median Household Size in Taft Heights
The median household size in Taft Heights is 2.68 persons per household, with married-couple households (232 | 38.0%) accounting for the largest median household size of 3.88 persons per household. non-family households (235 | 38.5%) represent the smallest median household size with 1.14 persons per household.
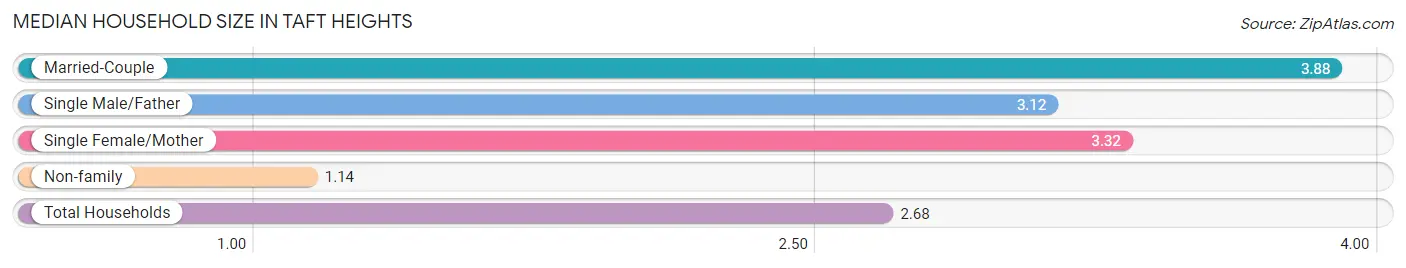
| Household Type | # Households | Household Size |
| Married-Couple | 232 (38.0%) | 3.88 |
| Single Male/Father | 42 (6.9%) | 3.12 |
| Single Female/Mother | 102 (16.7%) | 3.32 |
| Non-family | 235 (38.5%) | 1.14 |
| Total Households | 611 (100.0%) | 2.68 |
Household Size by Marriage Status in Taft Heights
Out of a total of 611 households in Taft Heights, 376 (61.5%) are family households, while 235 (38.5%) are nonfamily households. The most numerous type of family households are 2-person households, comprising 138, and the most common type of nonfamily households are 1-person households, comprising 193.
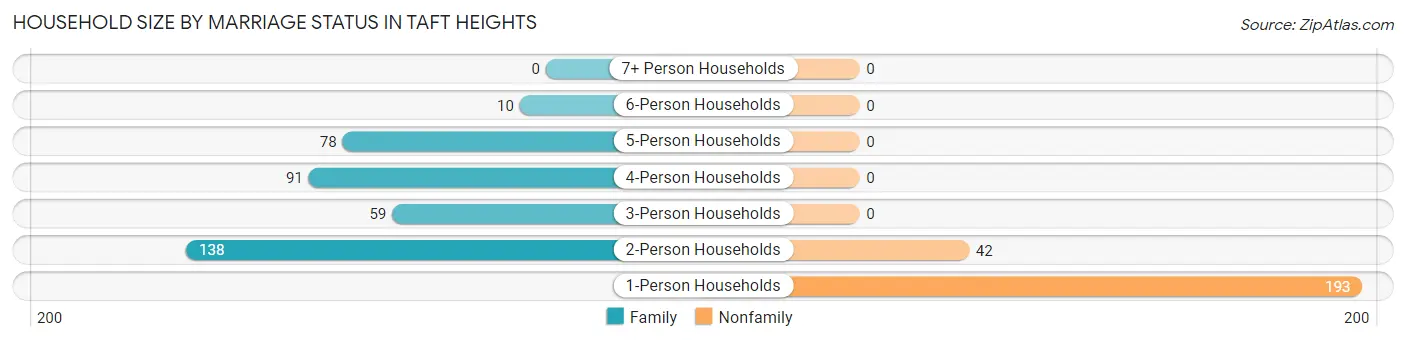
| Household Size | Family Households | Nonfamily Households |
| 1-Person Households | - | 193 (31.6%) |
| 2-Person Households | 138 (22.6%) | 42 (6.9%) |
| 3-Person Households | 59 (9.7%) | 0 (0.0%) |
| 4-Person Households | 91 (14.9%) | 0 (0.0%) |
| 5-Person Households | 78 (12.8%) | 0 (0.0%) |
| 6-Person Households | 10 (1.6%) | 0 (0.0%) |
| 7+ Person Households | 0 (0.0%) | 0 (0.0%) |
| Total | 376 (61.5%) | 235 (38.5%) |
Female Fertility in Taft Heights
Fertility by Age in Taft Heights
| Age Bracket | Women with Births | Births / 1,000 Women |
| 15 to 19 years | 0 (0.0%) | 0.0 |
| 20 to 34 years | 0 (0.0%) | 0.0 |
| 35 to 50 years | 0 (0.0%) | 0.0 |
| Total | 0 (0.0%) | 0.0 |
Fertility by Age by Marriage Status in Taft Heights
| Age Bracket | Married | Unmarried |
| 15 to 19 years | 0 (0.0%) | 0 (0.0%) |
| 20 to 34 years | 0 (0.0%) | 0 (0.0%) |
| 35 to 50 years | 0 (0.0%) | 0 (0.0%) |
| Total | 0 (0.0%) | 0 (0.0%) |
Fertility by Education in Taft Heights
| Educational Attainment | Women with Births | Births / 1,000 Women |
| Less than High School | 0 (0.0%) | 0.0 |
| High School Diploma | 0 (0.0%) | 0.0 |
| College or Associate's Degree | 0 (0.0%) | 0.0 |
| Bachelor's Degree | 0 (0.0%) | 0.0 |
| Graduate Degree | 0 (0.0%) | 0.0 |
| Total | 0 (0.0%) | 0.0 |
Fertility by Education by Marriage Status in Taft Heights
| Educational Attainment | Married | Unmarried |
| Less than High School | 0 (0.0%) | 0 (0.0%) |
| High School Diploma | 0 (0.0%) | 0 (0.0%) |
| College or Associate's Degree | 0 (0.0%) | 0 (0.0%) |
| Bachelor's Degree | 0 (0.0%) | 0 (0.0%) |
| Graduate Degree | 0 (0.0%) | 0 (0.0%) |
| Total | 0 (0.0%) | 0 (0.0%) |
Employment Characteristics in Taft Heights
Employment by Class of Employer in Taft Heights
Among the 767 employed individuals in Taft Heights, private company employees (464 | 60.5%), local government employees (145 | 18.9%), and not-for-profit organizations (61 | 8.0%) make up the most common classes of employment.
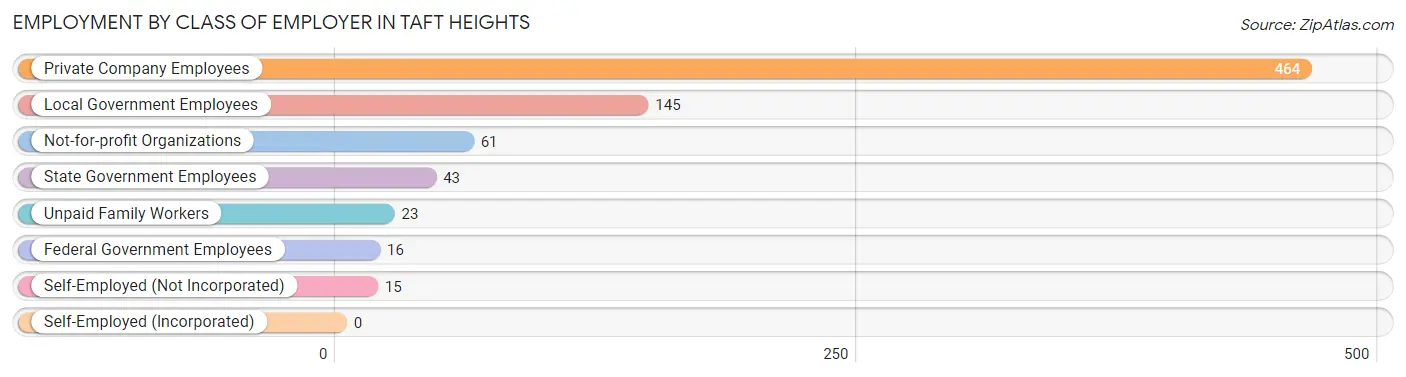
| Employer Class | # Employees | % Employees |
| Private Company Employees | 464 | 60.5% |
| Self-Employed (Incorporated) | 0 | 0.0% |
| Self-Employed (Not Incorporated) | 15 | 2.0% |
| Not-for-profit Organizations | 61 | 8.0% |
| Local Government Employees | 145 | 18.9% |
| State Government Employees | 43 | 5.6% |
| Federal Government Employees | 16 | 2.1% |
| Unpaid Family Workers | 23 | 3.0% |
| Total | 767 | 100.0% |
Employment Status by Age in Taft Heights
According to the labor force statistics for Taft Heights, out of the total population over 16 years of age (1,233), 68.8% or 848 individuals are in the labor force, with 8.7% or 74 of them unemployed. The age group with the highest labor force participation rate is 20 to 24 years, with 100.0% or 72 individuals in the labor force. Within the labor force, the 75 years and over age range has the highest percentage of unemployed individuals, with 100.0% or 11 of them being unemployed.
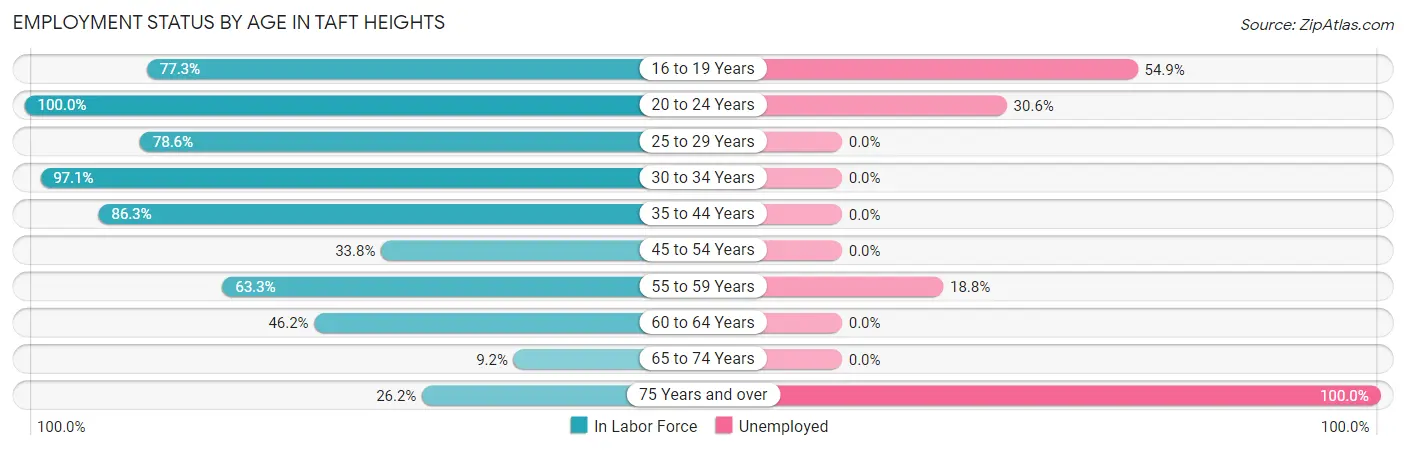
| Age Bracket | In Labor Force | Unemployed |
| 16 to 19 Years | 51 (77.3%) | 28 (54.9%) |
| 20 to 24 Years | 72 (100.0%) | 22 (30.6%) |
| 25 to 29 Years | 114 (78.6%) | 0 (0.0%) |
| 30 to 34 Years | 264 (97.1%) | 0 (0.0%) |
| 35 to 44 Years | 189 (86.3%) | 0 (0.0%) |
| 45 to 54 Years | 22 (33.8%) | 0 (0.0%) |
| 55 to 59 Years | 69 (63.3%) | 13 (18.8%) |
| 60 to 64 Years | 42 (46.2%) | 0 (0.0%) |
| 65 to 74 Years | 14 (9.2%) | 0 (0.0%) |
| 75 Years and over | 11 (26.2%) | 11 (100.0%) |
| Total | 848 (68.8%) | 74 (8.7%) |
Employment Status by Educational Attainment in Taft Heights
According to labor force statistics for Taft Heights, 77.7% of individuals (700) out of the total population between 25 and 64 years of age (901) are in the labor force, with 1.9% or 13 of them being unemployed. The group with the highest labor force participation rate are those with the educational attainment of bachelor's degree or higher, with 100.0% or 87 individuals in the labor force. Within the labor force, individuals with less than high school education have the highest percentage of unemployment, with 10.0% or 13 of them being unemployed.
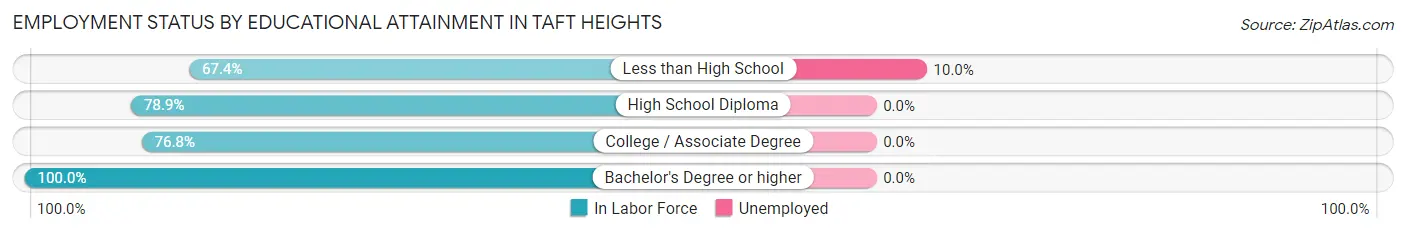
| Educational Attainment | In Labor Force | Unemployed |
| Less than High School | 130 (67.4%) | 19 (10.0%) |
| High School Diploma | 225 (78.9%) | 0 (0.0%) |
| College / Associate Degree | 258 (76.8%) | 0 (0.0%) |
| Bachelor's Degree or higher | 87 (100.0%) | 0 (0.0%) |
| Total | 700 (77.7%) | 17 (1.9%) |
Employment Occupations by Sex in Taft Heights
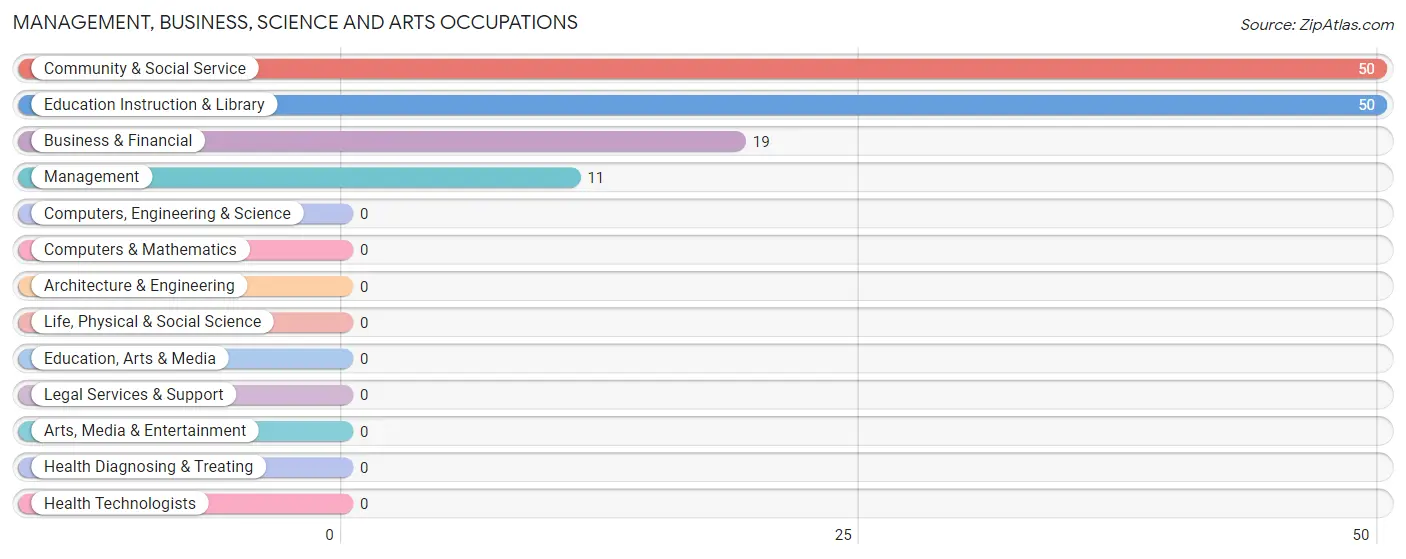
Management, Business, Science and Arts Occupations
The most common Management, Business, Science and Arts occupations in Taft Heights are Community & Social Service (50 | 6.5%), Education Instruction & Library (50 | 6.5%), Business & Financial (19 | 2.5%), and Management (11 | 1.4%).
Management, Business, Science and Arts Occupations by Sex
Within the Management, Business, Science and Arts occupations in Taft Heights, the most male-oriented occupations are Management (100.0%), and Business & Financial (100.0%), while the most female-oriented occupations are Community & Social Service (100.0%), and Education Instruction & Library (100.0%).
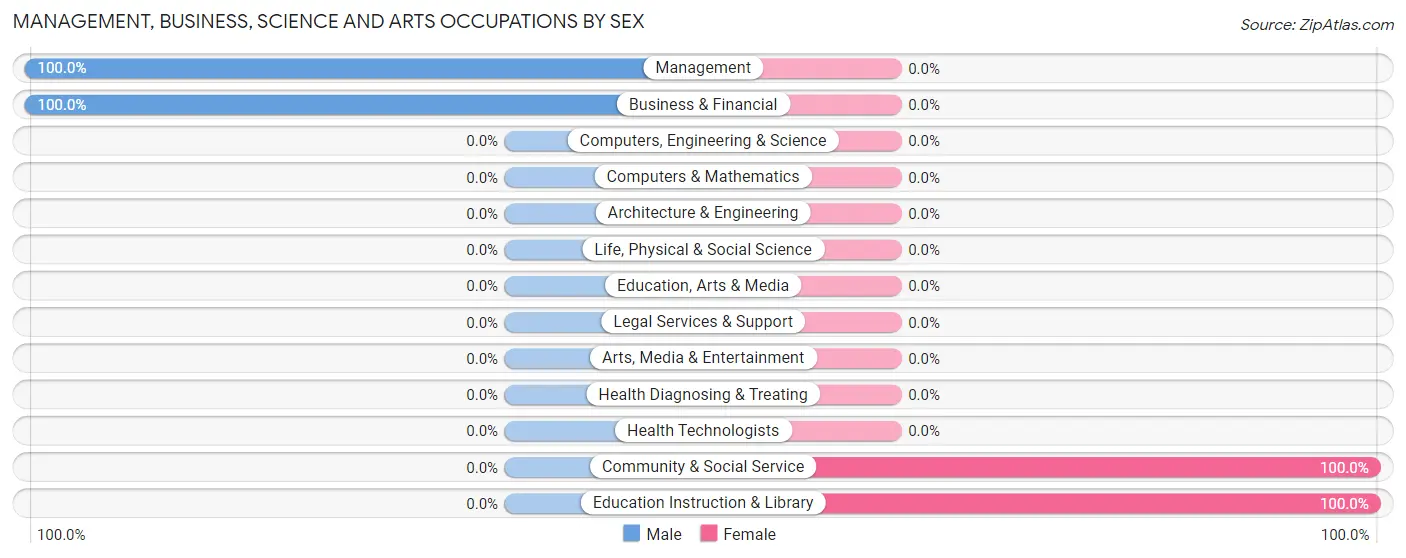
| Occupation | Male | Female |
| Management | 11 (100.0%) | 0 (0.0%) |
| Business & Financial | 19 (100.0%) | 0 (0.0%) |
| Computers, Engineering & Science | 0 (0.0%) | 0 (0.0%) |
| Computers & Mathematics | 0 (0.0%) | 0 (0.0%) |
| Architecture & Engineering | 0 (0.0%) | 0 (0.0%) |
| Life, Physical & Social Science | 0 (0.0%) | 0 (0.0%) |
| Community & Social Service | 0 (0.0%) | 50 (100.0%) |
| Education, Arts & Media | 0 (0.0%) | 0 (0.0%) |
| Legal Services & Support | 0 (0.0%) | 0 (0.0%) |
| Education Instruction & Library | 0 (0.0%) | 50 (100.0%) |
| Arts, Media & Entertainment | 0 (0.0%) | 0 (0.0%) |
| Health Diagnosing & Treating | 0 (0.0%) | 0 (0.0%) |
| Health Technologists | 0 (0.0%) | 0 (0.0%) |
| Total (Category) | 30 (37.5%) | 50 (62.5%) |
| Total (Overall) | 483 (62.4%) | 291 (37.6%) |
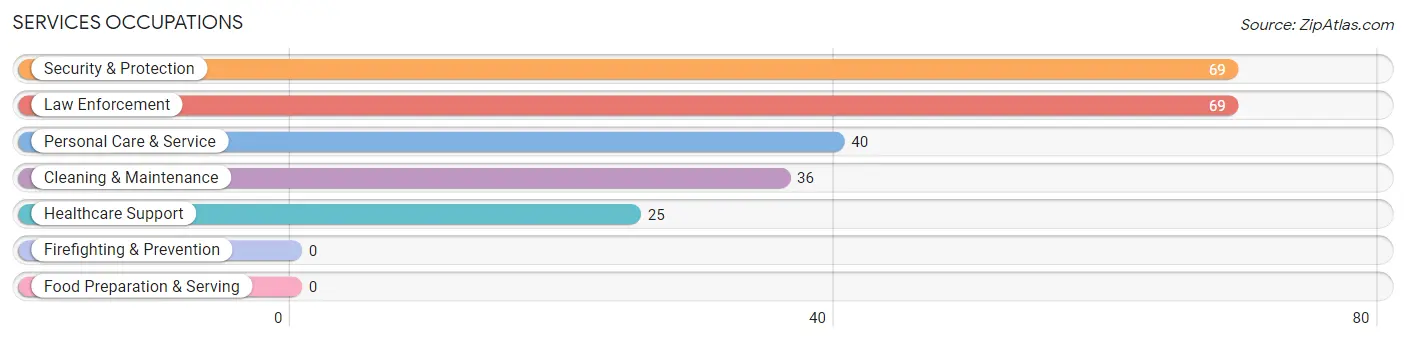
Services Occupations
The most common Services occupations in Taft Heights are Security & Protection (69 | 8.9%), Law Enforcement (69 | 8.9%), Personal Care & Service (40 | 5.2%), Cleaning & Maintenance (36 | 4.6%), and Healthcare Support (25 | 3.2%).
Services Occupations by Sex
Within the Services occupations in Taft Heights, the most male-oriented occupations are Security & Protection (100.0%), Law Enforcement (100.0%), and Cleaning & Maintenance (83.3%), while the most female-oriented occupations are Healthcare Support (100.0%), Personal Care & Service (100.0%), and Cleaning & Maintenance (16.7%).
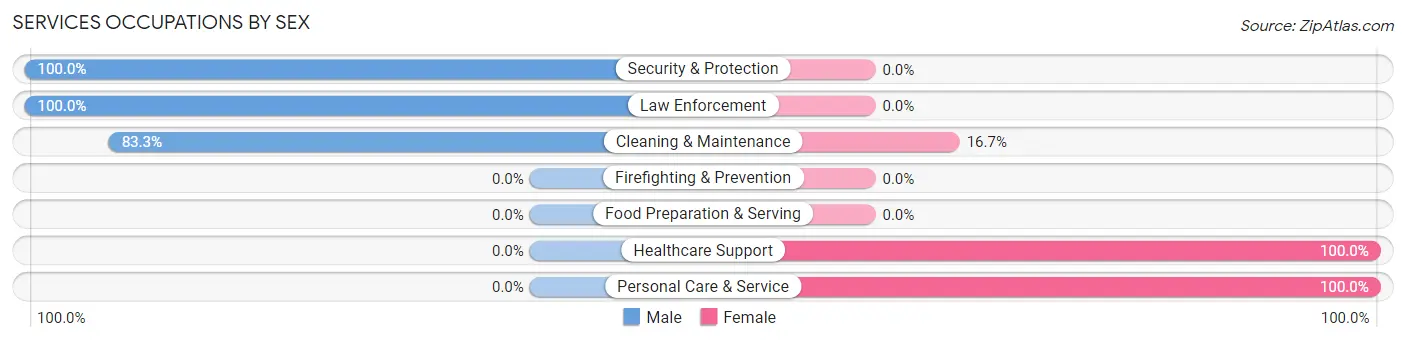
| Occupation | Male | Female |
| Healthcare Support | 0 (0.0%) | 25 (100.0%) |
| Security & Protection | 69 (100.0%) | 0 (0.0%) |
| Firefighting & Prevention | 0 (0.0%) | 0 (0.0%) |
| Law Enforcement | 69 (100.0%) | 0 (0.0%) |
| Food Preparation & Serving | 0 (0.0%) | 0 (0.0%) |
| Cleaning & Maintenance | 30 (83.3%) | 6 (16.7%) |
| Personal Care & Service | 0 (0.0%) | 40 (100.0%) |
| Total (Category) | 99 (58.2%) | 71 (41.8%) |
| Total (Overall) | 483 (62.4%) | 291 (37.6%) |
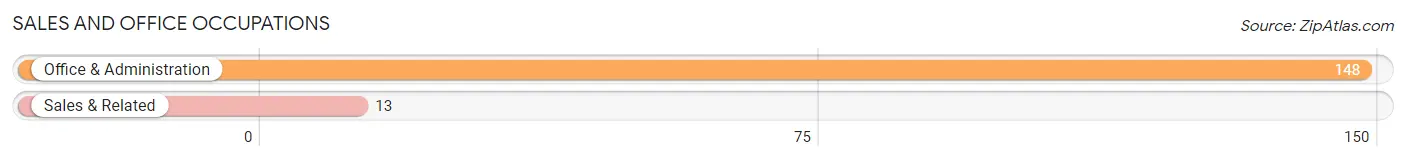
Sales and Office Occupations
The most common Sales and Office occupations in Taft Heights are Office & Administration (148 | 19.1%), and Sales & Related (13 | 1.7%).
Sales and Office Occupations by Sex
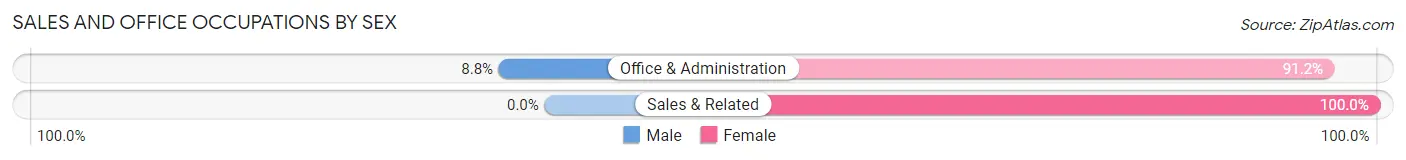
| Occupation | Male | Female |
| Sales & Related | 0 (0.0%) | 13 (100.0%) |
| Office & Administration | 13 (8.8%) | 135 (91.2%) |
| Total (Category) | 13 (8.1%) | 148 (91.9%) |
| Total (Overall) | 483 (62.4%) | 291 (37.6%) |
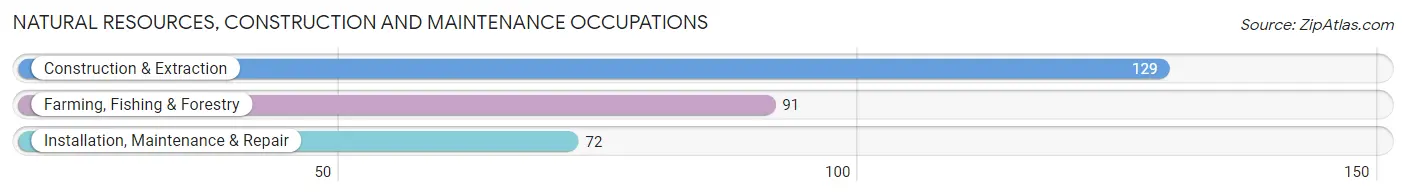
Natural Resources, Construction and Maintenance Occupations
The most common Natural Resources, Construction and Maintenance occupations in Taft Heights are Construction & Extraction (129 | 16.7%), Farming, Fishing & Forestry (91 | 11.8%), and Installation, Maintenance & Repair (72 | 9.3%).
Natural Resources, Construction and Maintenance Occupations by Sex
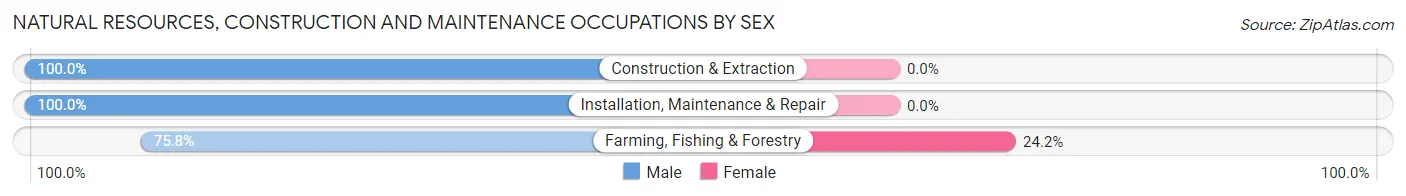
| Occupation | Male | Female |
| Farming, Fishing & Forestry | 69 (75.8%) | 22 (24.2%) |
| Construction & Extraction | 129 (100.0%) | 0 (0.0%) |
| Installation, Maintenance & Repair | 72 (100.0%) | 0 (0.0%) |
| Total (Category) | 270 (92.5%) | 22 (7.5%) |
| Total (Overall) | 483 (62.4%) | 291 (37.6%) |
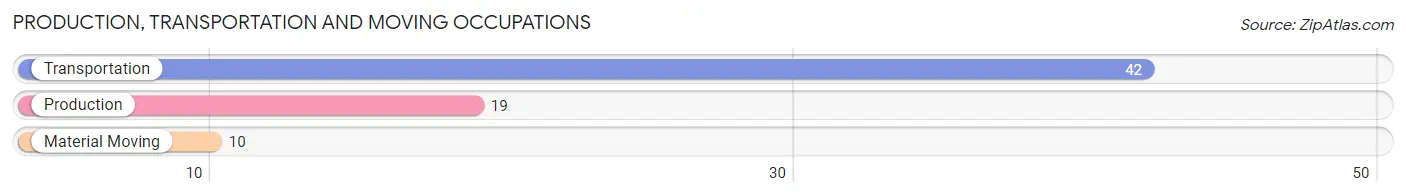
Production, Transportation and Moving Occupations
The most common Production, Transportation and Moving occupations in Taft Heights are Transportation (42 | 5.4%), Production (19 | 2.5%), and Material Moving (10 | 1.3%).
Production, Transportation and Moving Occupations by Sex
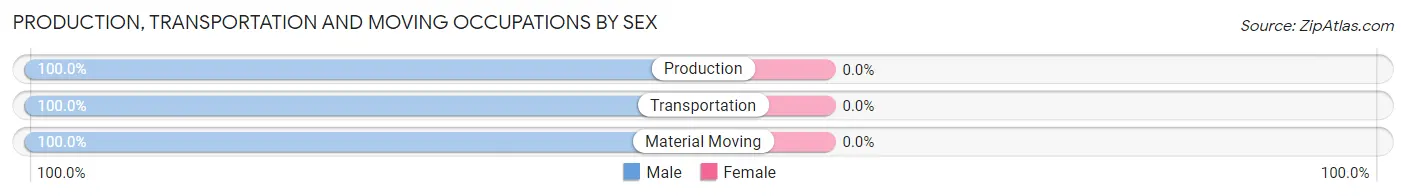
| Occupation | Male | Female |
| Production | 19 (100.0%) | 0 (0.0%) |
| Transportation | 42 (100.0%) | 0 (0.0%) |
| Material Moving | 10 (100.0%) | 0 (0.0%) |
| Total (Category) | 71 (100.0%) | 0 (0.0%) |
| Total (Overall) | 483 (62.4%) | 291 (37.6%) |
Employment Industries by Sex in Taft Heights
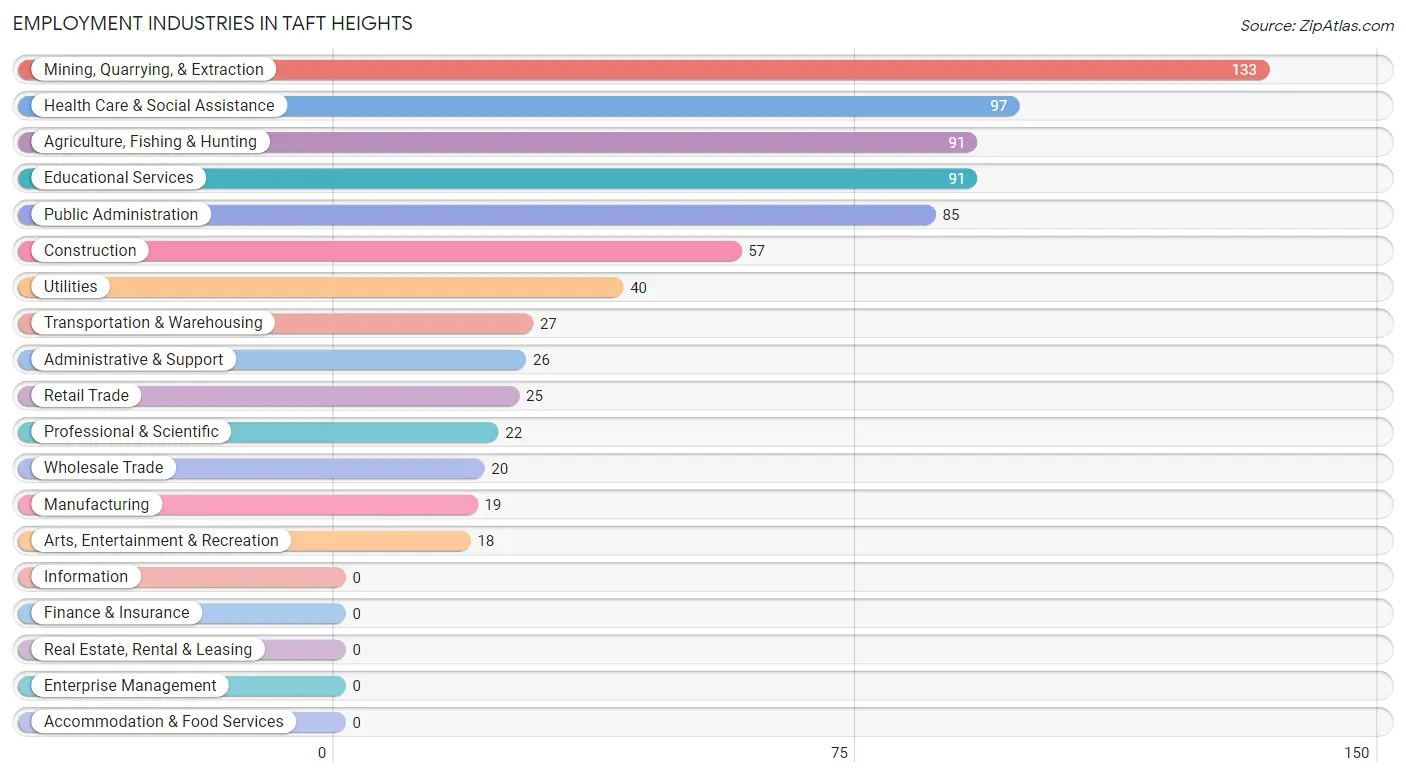
Employment Industries in Taft Heights
The major employment industries in Taft Heights include Mining, Quarrying, & Extraction (133 | 17.2%), Health Care & Social Assistance (97 | 12.5%), Agriculture, Fishing & Hunting (91 | 11.8%), Educational Services (91 | 11.8%), and Public Administration (85 | 11.0%).
Employment Industries by Sex in Taft Heights
The Taft Heights industries that see more men than women are Construction (100.0%), Manufacturing (100.0%), and Utilities (100.0%), whereas the industries that tend to have a higher number of women are Wholesale Trade (100.0%), Health Care & Social Assistance (100.0%), and Educational Services (86.8%).
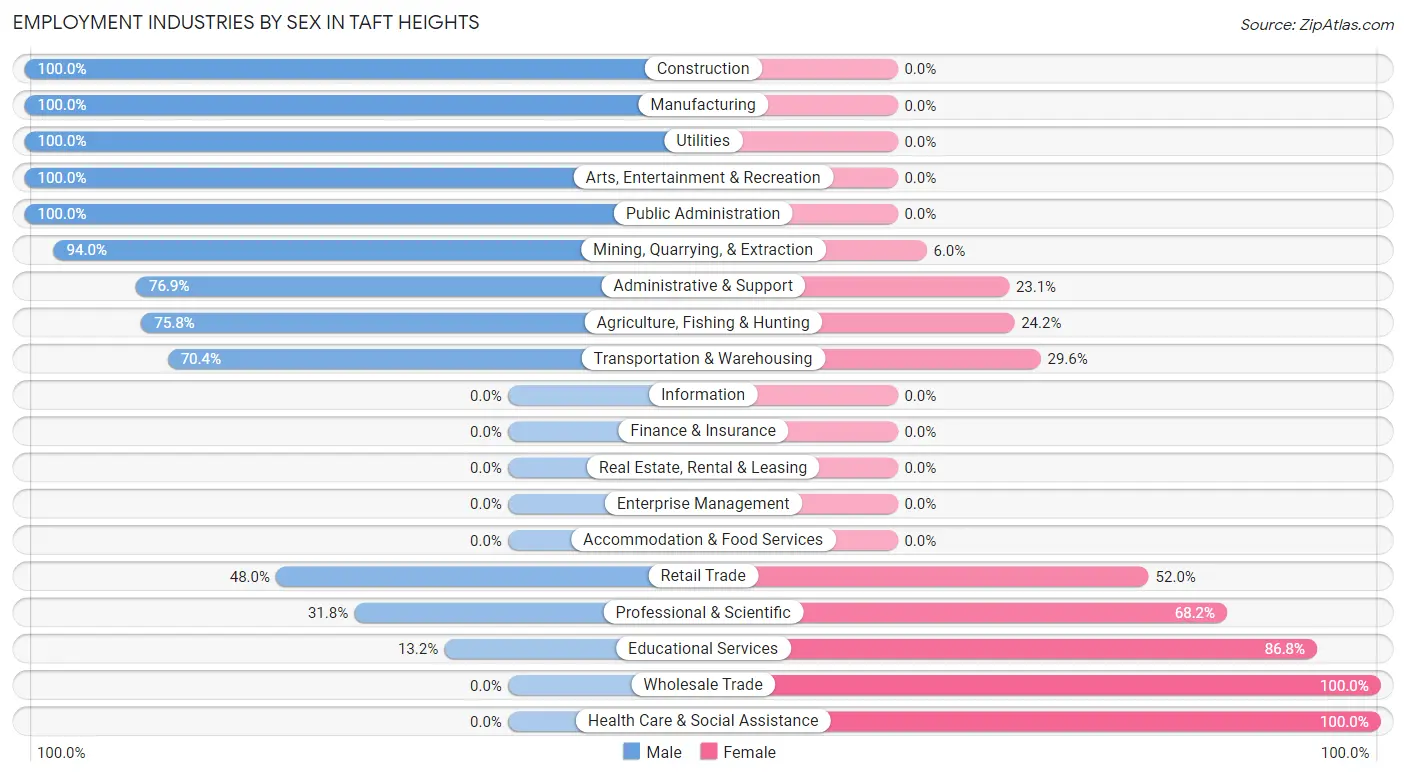
| Industry | Male | Female |
| Agriculture, Fishing & Hunting | 69 (75.8%) | 22 (24.2%) |
| Mining, Quarrying, & Extraction | 125 (94.0%) | 8 (6.0%) |
| Construction | 57 (100.0%) | 0 (0.0%) |
| Manufacturing | 19 (100.0%) | 0 (0.0%) |
| Wholesale Trade | 0 (0.0%) | 20 (100.0%) |
| Retail Trade | 12 (48.0%) | 13 (52.0%) |
| Transportation & Warehousing | 19 (70.4%) | 8 (29.6%) |
| Utilities | 40 (100.0%) | 0 (0.0%) |
| Information | 0 (0.0%) | 0 (0.0%) |
| Finance & Insurance | 0 (0.0%) | 0 (0.0%) |
| Real Estate, Rental & Leasing | 0 (0.0%) | 0 (0.0%) |
| Professional & Scientific | 7 (31.8%) | 15 (68.2%) |
| Enterprise Management | 0 (0.0%) | 0 (0.0%) |
| Administrative & Support | 20 (76.9%) | 6 (23.1%) |
| Educational Services | 12 (13.2%) | 79 (86.8%) |
| Health Care & Social Assistance | 0 (0.0%) | 97 (100.0%) |
| Arts, Entertainment & Recreation | 18 (100.0%) | 0 (0.0%) |
| Accommodation & Food Services | 0 (0.0%) | 0 (0.0%) |
| Public Administration | 85 (100.0%) | 0 (0.0%) |
| Total | 483 (62.4%) | 291 (37.6%) |
Education in Taft Heights
School Enrollment in Taft Heights
The most common levels of schooling among the 355 students in Taft Heights are elementary school (151 | 42.5%), college / undergraduate (60 | 16.9%), and high school (56 | 15.8%).
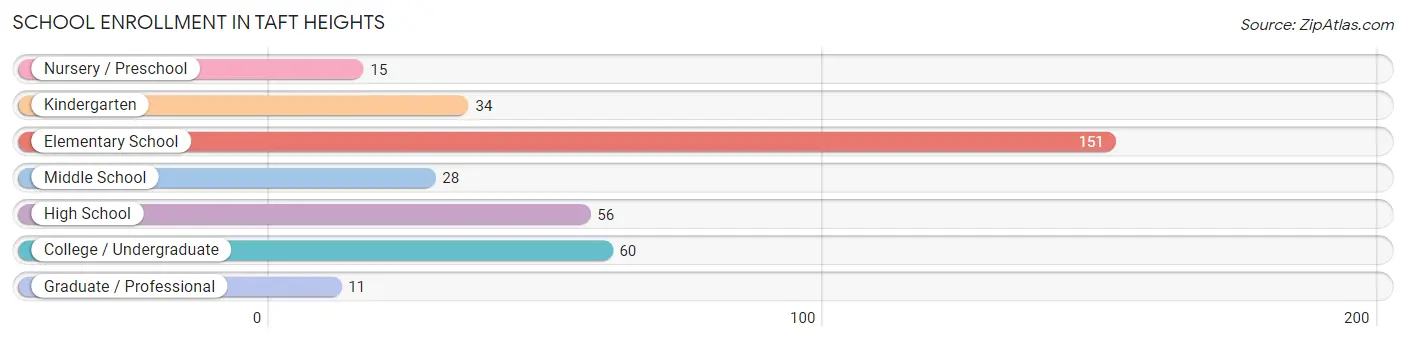
| School Level | # Students | % Students |
| Nursery / Preschool | 15 | 4.2% |
| Kindergarten | 34 | 9.6% |
| Elementary School | 151 | 42.5% |
| Middle School | 28 | 7.9% |
| High School | 56 | 15.8% |
| College / Undergraduate | 60 | 16.9% |
| Graduate / Professional | 11 | 3.1% |
| Total | 355 | 100.0% |
School Enrollment by Age by Funding Source in Taft Heights
Out of a total of 355 students who are enrolled in schools in Taft Heights, 26 (7.3%) attend a private institution, while the remaining 329 (92.7%) are enrolled in public schools. The age group of 18 to 19 year olds has the highest likelihood of being enrolled in private schools, with 15 (100.0% in the age bracket) enrolled. Conversely, the age group of 3 to 4 year olds has the lowest likelihood of being enrolled in a private school, with 15 (100.0% in the age bracket) attending a public institution.
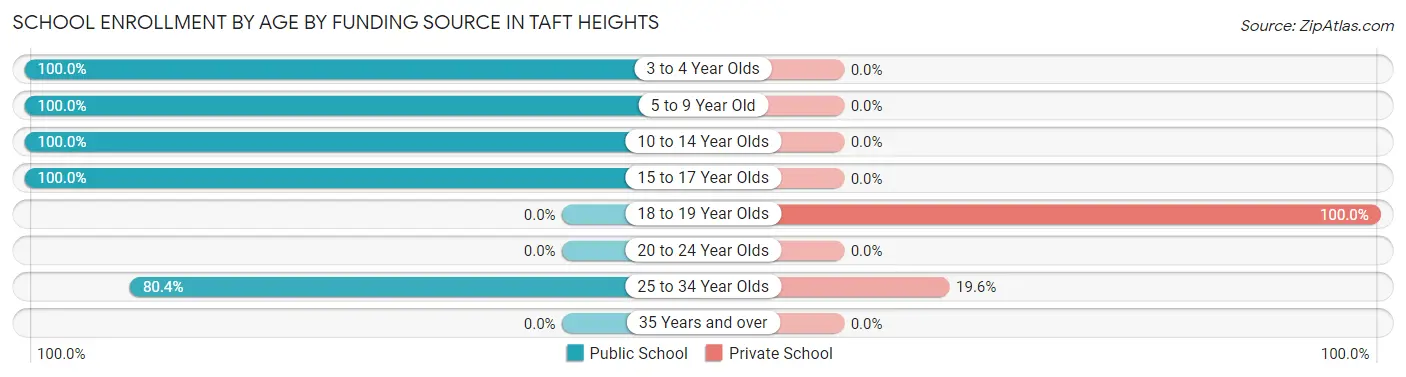
| Age Bracket | Public School | Private School |
| 3 to 4 Year Olds | 15 (100.0%) | 0 (0.0%) |
| 5 to 9 Year Old | 117 (100.0%) | 0 (0.0%) |
| 10 to 14 Year Olds | 104 (100.0%) | 0 (0.0%) |
| 15 to 17 Year Olds | 48 (100.0%) | 0 (0.0%) |
| 18 to 19 Year Olds | 0 (0.0%) | 15 (100.0%) |
| 20 to 24 Year Olds | 0 (0.0%) | 0 (0.0%) |
| 25 to 34 Year Olds | 45 (80.4%) | 11 (19.6%) |
| 35 Years and over | 0 (0.0%) | 0 (0.0%) |
| Total | 329 (92.7%) | 26 (7.3%) |
Educational Attainment by Field of Study in Taft Heights
Communications (39 | 37.1%), engineering (16 | 15.2%), bio, nature & agricultural (11 | 10.5%), education (11 | 10.5%), and liberal arts & history (11 | 10.5%) are the most common fields of study among 105 individuals in Taft Heights who have obtained a bachelor's degree or higher.
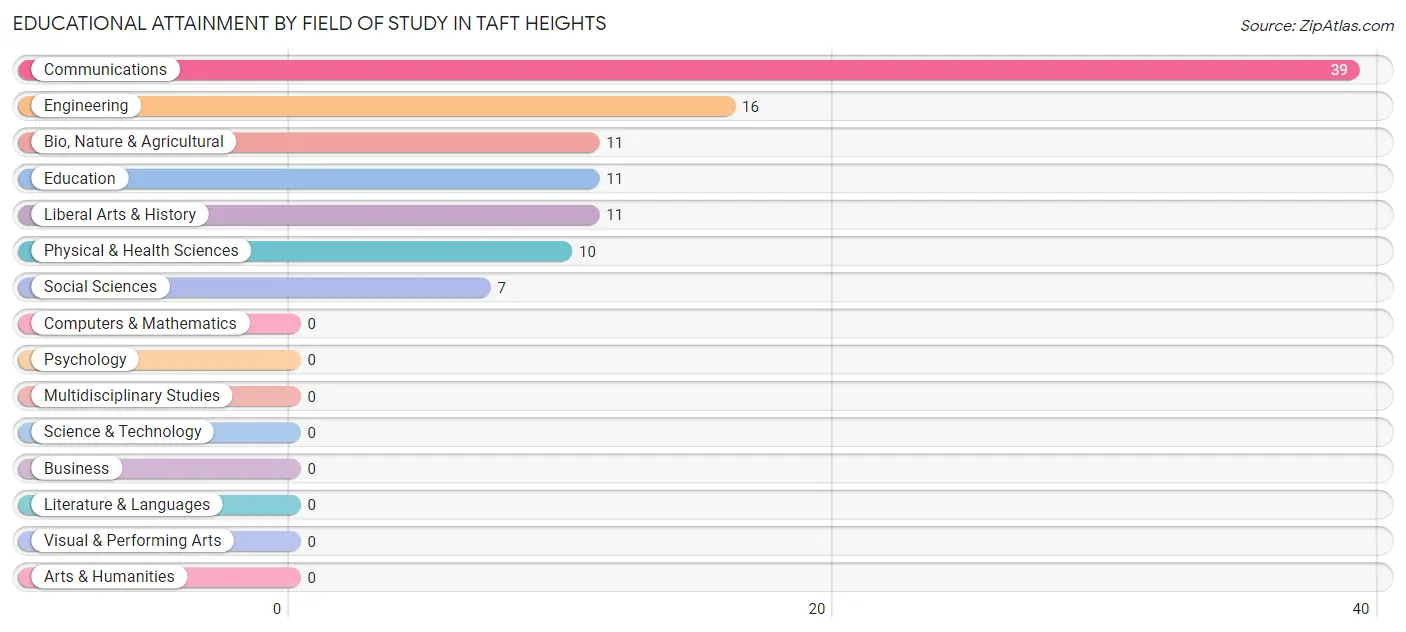
| Field of Study | # Graduates | % Graduates |
| Computers & Mathematics | 0 | 0.0% |
| Bio, Nature & Agricultural | 11 | 10.5% |
| Physical & Health Sciences | 10 | 9.5% |
| Psychology | 0 | 0.0% |
| Social Sciences | 7 | 6.7% |
| Engineering | 16 | 15.2% |
| Multidisciplinary Studies | 0 | 0.0% |
| Science & Technology | 0 | 0.0% |
| Business | 0 | 0.0% |
| Education | 11 | 10.5% |
| Literature & Languages | 0 | 0.0% |
| Liberal Arts & History | 11 | 10.5% |
| Visual & Performing Arts | 0 | 0.0% |
| Communications | 39 | 37.1% |
| Arts & Humanities | 0 | 0.0% |
| Total | 105 | 100.0% |
Transportation & Commute in Taft Heights
Vehicle Availability by Sex in Taft Heights
The most prevalent vehicle ownership categories in Taft Heights are males with 1 vehicle (139, accounting for 29.2%) and females with 1 vehicle (46, making up 47.8%).
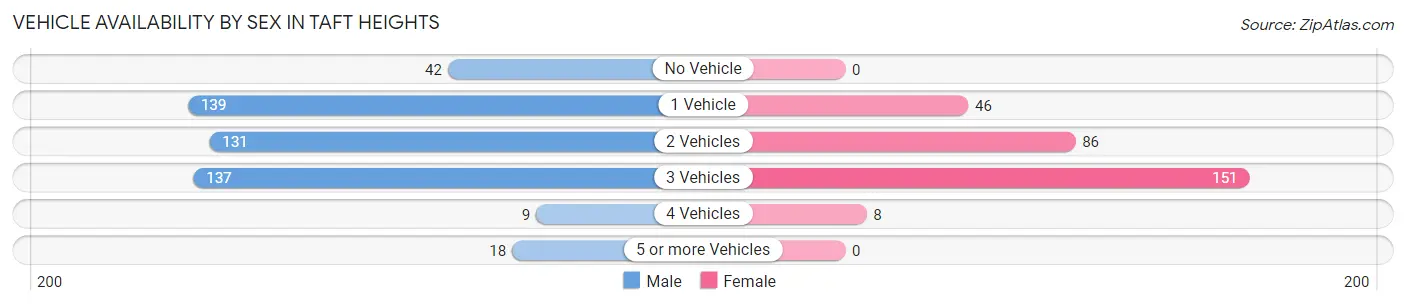
| Vehicles Available | Male | Female |
| No Vehicle | 42 (8.8%) | 0 (0.0%) |
| 1 Vehicle | 139 (29.2%) | 46 (15.8%) |
| 2 Vehicles | 131 (27.5%) | 86 (29.5%) |
| 3 Vehicles | 137 (28.8%) | 151 (51.9%) |
| 4 Vehicles | 9 (1.9%) | 8 (2.8%) |
| 5 or more Vehicles | 18 (3.8%) | 0 (0.0%) |
| Total | 476 (100.0%) | 291 (100.0%) |
Commute Time in Taft Heights
The most frequently occuring commute durations in Taft Heights are 5 to 9 minutes (266 commuters, 34.7%), 10 to 14 minutes (119 commuters, 15.5%), and 15 to 19 minutes (88 commuters, 11.5%).
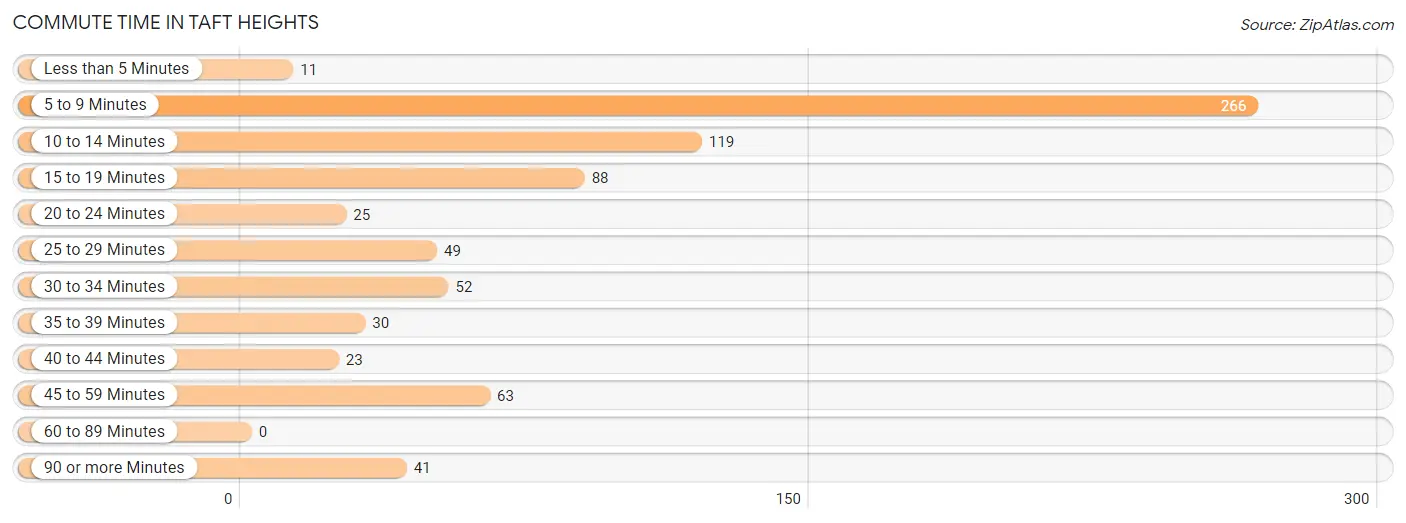
| Commute Time | # Commuters | % Commuters |
| Less than 5 Minutes | 11 | 1.4% |
| 5 to 9 Minutes | 266 | 34.7% |
| 10 to 14 Minutes | 119 | 15.5% |
| 15 to 19 Minutes | 88 | 11.5% |
| 20 to 24 Minutes | 25 | 3.3% |
| 25 to 29 Minutes | 49 | 6.4% |
| 30 to 34 Minutes | 52 | 6.8% |
| 35 to 39 Minutes | 30 | 3.9% |
| 40 to 44 Minutes | 23 | 3.0% |
| 45 to 59 Minutes | 63 | 8.2% |
| 60 to 89 Minutes | 0 | 0.0% |
| 90 or more Minutes | 41 | 5.3% |
Commute Time by Sex in Taft Heights
The most common commute times in Taft Heights are 5 to 9 minutes (155 commuters, 32.6%) for males and 5 to 9 minutes (111 commuters, 38.1%) for females.
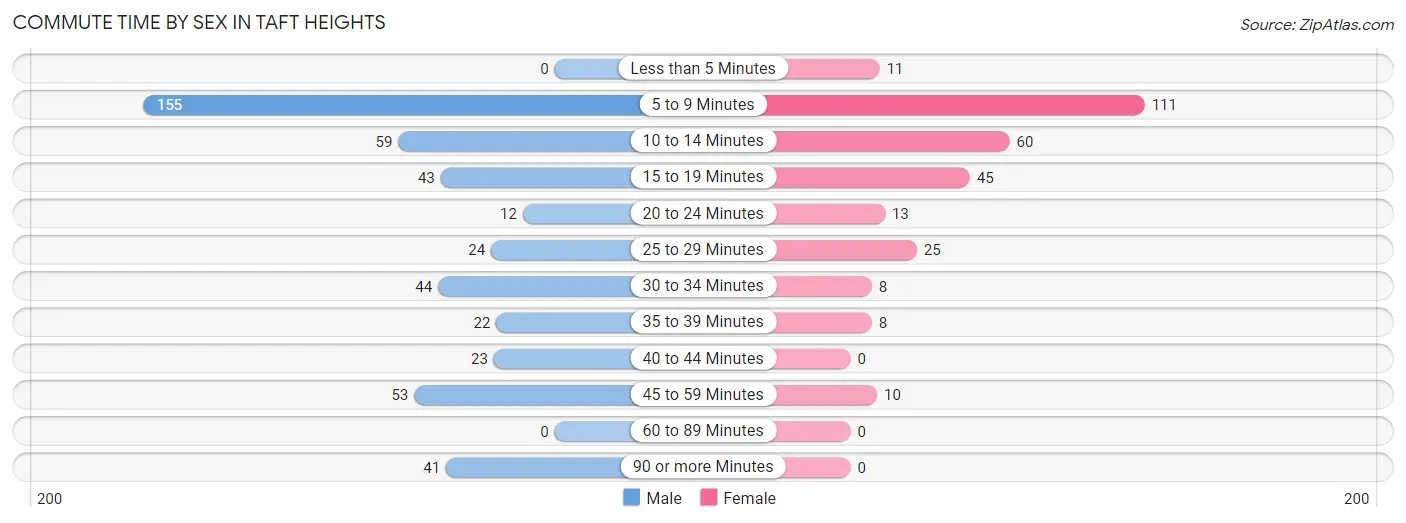
| Commute Time | Male | Female |
| Less than 5 Minutes | 0 (0.0%) | 11 (3.8%) |
| 5 to 9 Minutes | 155 (32.6%) | 111 (38.1%) |
| 10 to 14 Minutes | 59 (12.4%) | 60 (20.6%) |
| 15 to 19 Minutes | 43 (9.0%) | 45 (15.5%) |
| 20 to 24 Minutes | 12 (2.5%) | 13 (4.5%) |
| 25 to 29 Minutes | 24 (5.0%) | 25 (8.6%) |
| 30 to 34 Minutes | 44 (9.2%) | 8 (2.8%) |
| 35 to 39 Minutes | 22 (4.6%) | 8 (2.8%) |
| 40 to 44 Minutes | 23 (4.8%) | 0 (0.0%) |
| 45 to 59 Minutes | 53 (11.1%) | 10 (3.4%) |
| 60 to 89 Minutes | 0 (0.0%) | 0 (0.0%) |
| 90 or more Minutes | 41 (8.6%) | 0 (0.0%) |
Time of Departure to Work by Sex in Taft Heights
The most frequent times of departure to work in Taft Heights are 6:00 AM to 6:29 AM (157, 33.0%) for males and 8:00 AM to 8:29 AM (111, 38.1%) for females.
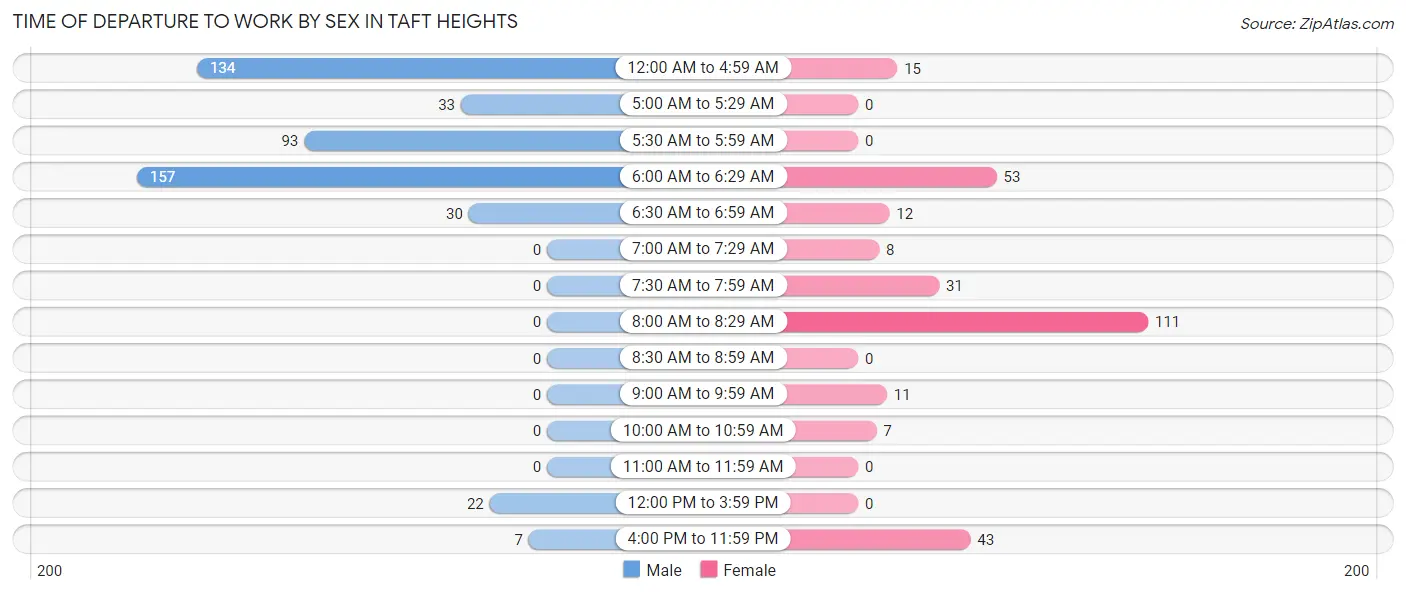
| Time of Departure | Male | Female |
| 12:00 AM to 4:59 AM | 134 (28.1%) | 15 (5.1%) |
| 5:00 AM to 5:29 AM | 33 (6.9%) | 0 (0.0%) |
| 5:30 AM to 5:59 AM | 93 (19.5%) | 0 (0.0%) |
| 6:00 AM to 6:29 AM | 157 (33.0%) | 53 (18.2%) |
| 6:30 AM to 6:59 AM | 30 (6.3%) | 12 (4.1%) |
| 7:00 AM to 7:29 AM | 0 (0.0%) | 8 (2.8%) |
| 7:30 AM to 7:59 AM | 0 (0.0%) | 31 (10.6%) |
| 8:00 AM to 8:29 AM | 0 (0.0%) | 111 (38.1%) |
| 8:30 AM to 8:59 AM | 0 (0.0%) | 0 (0.0%) |
| 9:00 AM to 9:59 AM | 0 (0.0%) | 11 (3.8%) |
| 10:00 AM to 10:59 AM | 0 (0.0%) | 7 (2.4%) |
| 11:00 AM to 11:59 AM | 0 (0.0%) | 0 (0.0%) |
| 12:00 PM to 3:59 PM | 22 (4.6%) | 0 (0.0%) |
| 4:00 PM to 11:59 PM | 7 (1.5%) | 43 (14.8%) |
| Total | 476 (100.0%) | 291 (100.0%) |
Housing Occupancy in Taft Heights
Occupancy by Ownership in Taft Heights
Of the total 611 dwellings in Taft Heights, owner-occupied units account for 328 (53.7%), while renter-occupied units make up 283 (46.3%).
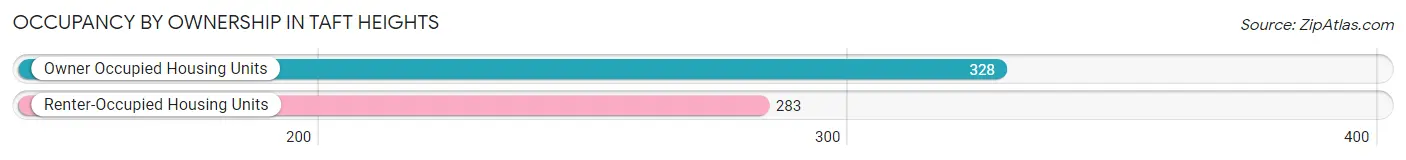
| Occupancy | # Housing Units | % Housing Units |
| Owner Occupied Housing Units | 328 | 53.7% |
| Renter-Occupied Housing Units | 283 | 46.3% |
| Total Occupied Housing Units | 611 | 100.0% |
Occupancy by Household Size in Taft Heights
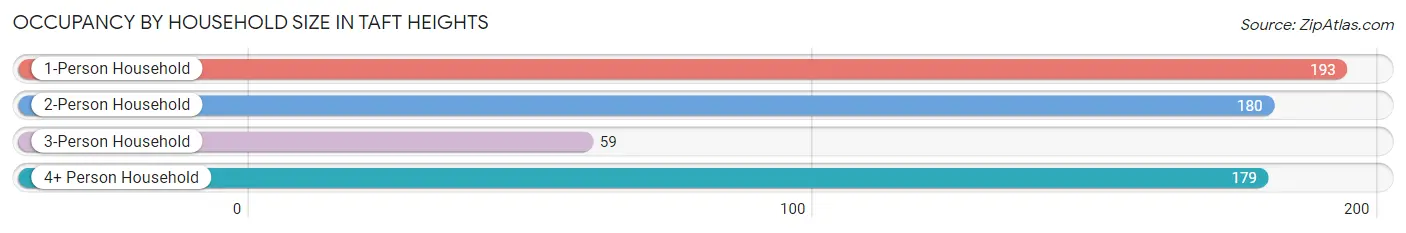
| Household Size | # Housing Units | % Housing Units |
| 1-Person Household | 193 | 31.6% |
| 2-Person Household | 180 | 29.5% |
| 3-Person Household | 59 | 9.7% |
| 4+ Person Household | 179 | 29.3% |
| Total Housing Units | 611 | 100.0% |
Occupancy by Ownership by Household Size in Taft Heights
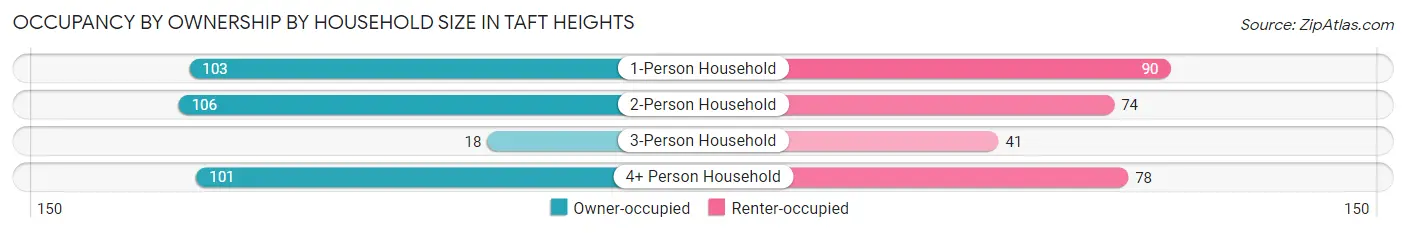
| Household Size | Owner-occupied | Renter-occupied |
| 1-Person Household | 103 (53.4%) | 90 (46.6%) |
| 2-Person Household | 106 (58.9%) | 74 (41.1%) |
| 3-Person Household | 18 (30.5%) | 41 (69.5%) |
| 4+ Person Household | 101 (56.4%) | 78 (43.6%) |
| Total Housing Units | 328 (53.7%) | 283 (46.3%) |
Occupancy by Educational Attainment in Taft Heights
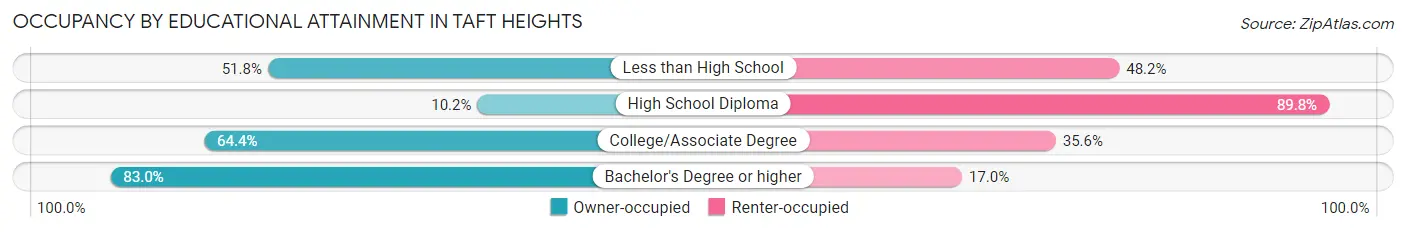
| Household Size | Owner-occupied | Renter-occupied |
| Less than High School | 58 (51.8%) | 54 (48.2%) |
| High School Diploma | 13 (10.2%) | 114 (89.8%) |
| College/Associate Degree | 179 (64.4%) | 99 (35.6%) |
| Bachelor's Degree or higher | 78 (83.0%) | 16 (17.0%) |
Occupancy by Age of Householder in Taft Heights
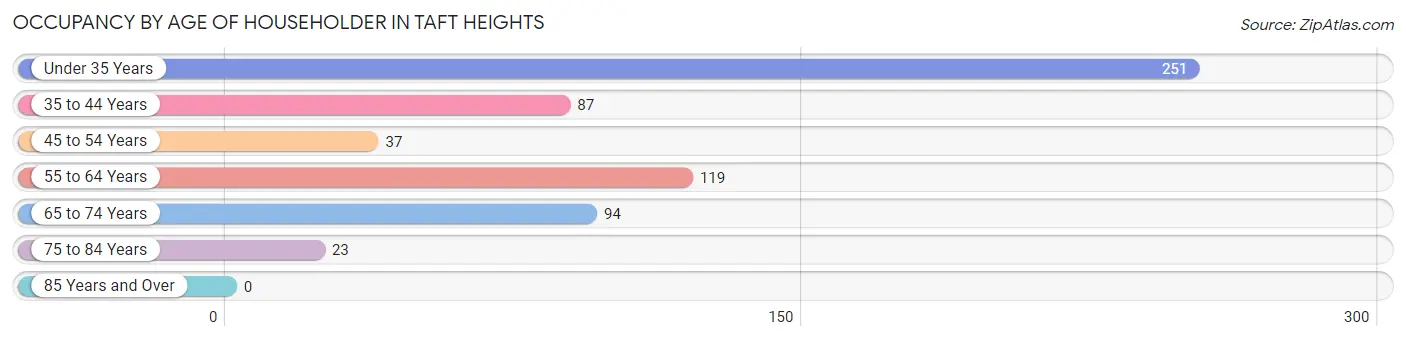
| Age Bracket | # Households | % Households |
| Under 35 Years | 251 | 41.1% |
| 35 to 44 Years | 87 | 14.2% |
| 45 to 54 Years | 37 | 6.1% |
| 55 to 64 Years | 119 | 19.5% |
| 65 to 74 Years | 94 | 15.4% |
| 75 to 84 Years | 23 | 3.8% |
| 85 Years and Over | 0 | 0.0% |
| Total | 611 | 100.0% |
Housing Finances in Taft Heights
Median Income by Occupancy in Taft Heights
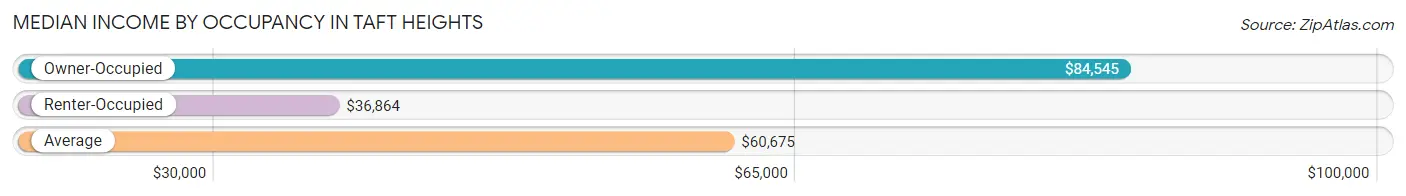
| Occupancy Type | # Households | Median Income |
| Owner-Occupied | 328 (53.7%) | $84,545 |
| Renter-Occupied | 283 (46.3%) | $36,864 |
| Average | 611 (100.0%) | $60,675 |
Occupancy by Householder Income Bracket in Taft Heights
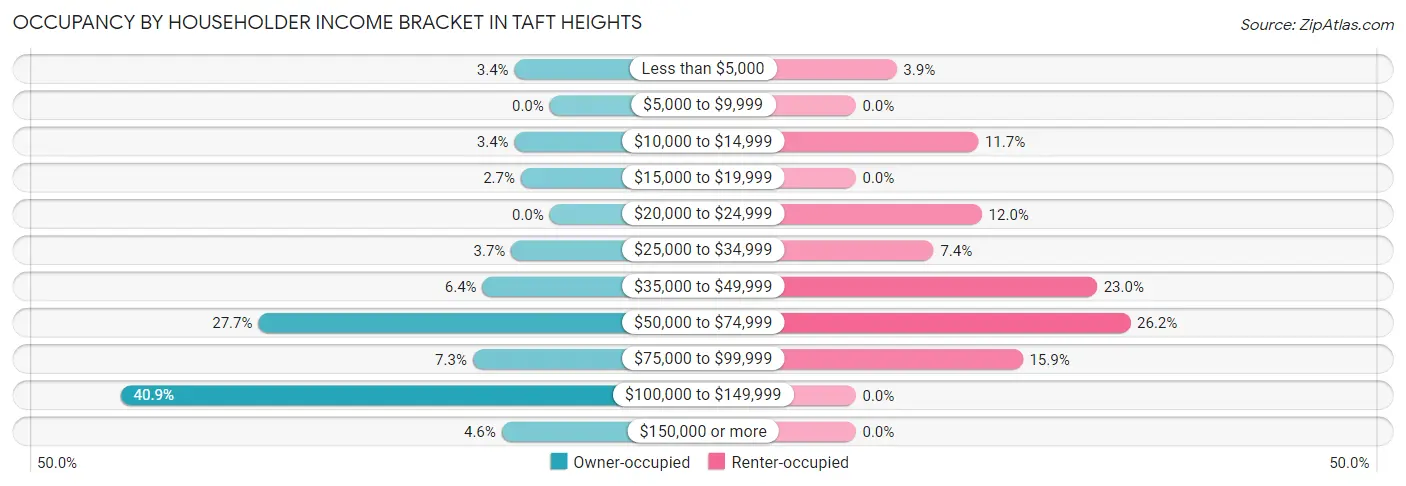
| Income Bracket | Owner-occupied | Renter-occupied |
| Less than $5,000 | 11 (3.4%) | 11 (3.9%) |
| $5,000 to $9,999 | 0 (0.0%) | 0 (0.0%) |
| $10,000 to $14,999 | 11 (3.4%) | 33 (11.7%) |
| $15,000 to $19,999 | 9 (2.7%) | 0 (0.0%) |
| $20,000 to $24,999 | 0 (0.0%) | 34 (12.0%) |
| $25,000 to $34,999 | 12 (3.7%) | 21 (7.4%) |
| $35,000 to $49,999 | 21 (6.4%) | 65 (23.0%) |
| $50,000 to $74,999 | 91 (27.7%) | 74 (26.2%) |
| $75,000 to $99,999 | 24 (7.3%) | 45 (15.9%) |
| $100,000 to $149,999 | 134 (40.8%) | 0 (0.0%) |
| $150,000 or more | 15 (4.6%) | 0 (0.0%) |
| Total | 328 (100.0%) | 283 (100.0%) |
Monthly Housing Cost Tiers in Taft Heights
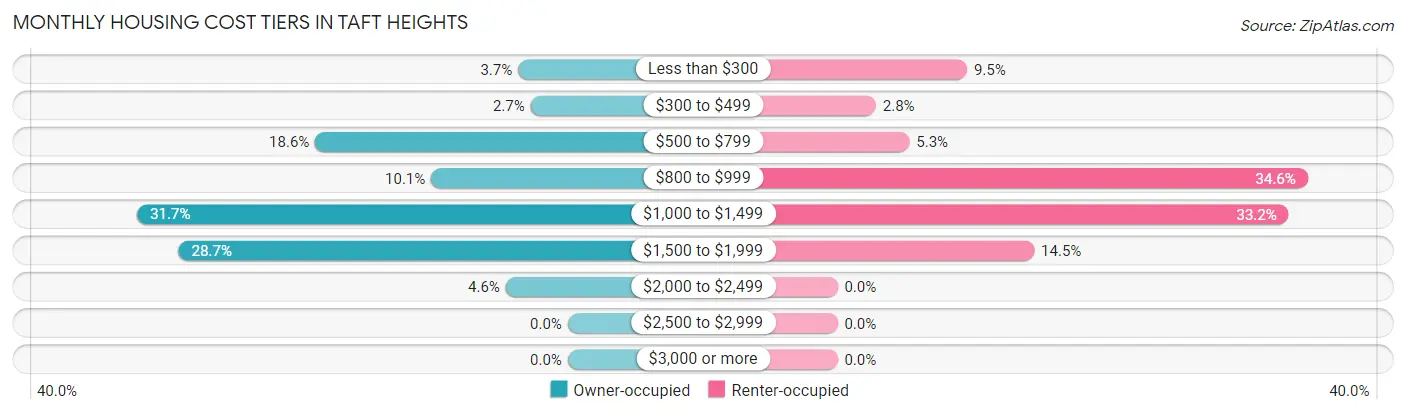
| Monthly Cost | Owner-occupied | Renter-occupied |
| Less than $300 | 12 (3.7%) | 27 (9.5%) |
| $300 to $499 | 9 (2.7%) | 8 (2.8%) |
| $500 to $799 | 61 (18.6%) | 15 (5.3%) |
| $800 to $999 | 33 (10.1%) | 98 (34.6%) |
| $1,000 to $1,499 | 104 (31.7%) | 94 (33.2%) |
| $1,500 to $1,999 | 94 (28.7%) | 41 (14.5%) |
| $2,000 to $2,499 | 15 (4.6%) | 0 (0.0%) |
| $2,500 to $2,999 | 0 (0.0%) | 0 (0.0%) |
| $3,000 or more | 0 (0.0%) | 0 (0.0%) |
| Total | 328 (100.0%) | 283 (100.0%) |
Physical Housing Characteristics in Taft Heights
Housing Structures in Taft Heights
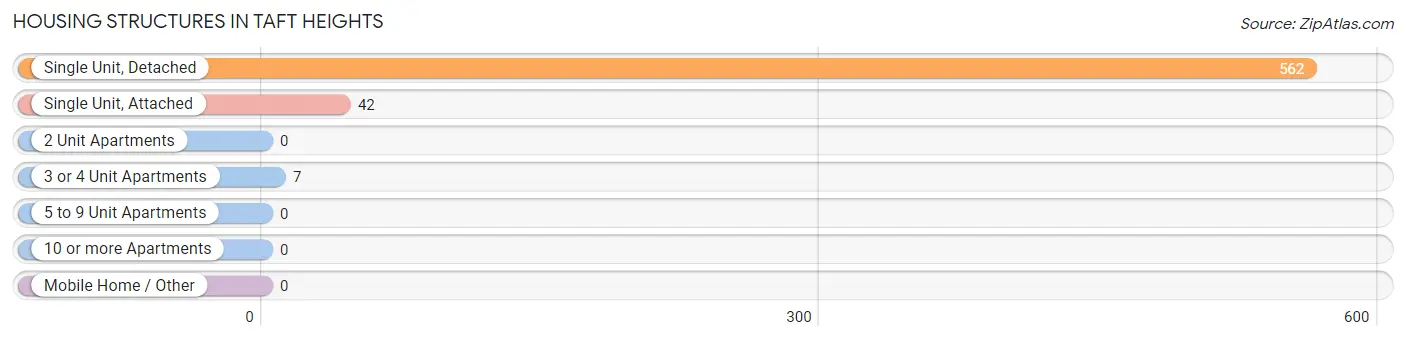
| Structure Type | # Housing Units | % Housing Units |
| Single Unit, Detached | 562 | 92.0% |
| Single Unit, Attached | 42 | 6.9% |
| 2 Unit Apartments | 0 | 0.0% |
| 3 or 4 Unit Apartments | 7 | 1.1% |
| 5 to 9 Unit Apartments | 0 | 0.0% |
| 10 or more Apartments | 0 | 0.0% |
| Mobile Home / Other | 0 | 0.0% |
| Total | 611 | 100.0% |
Housing Structures by Occupancy in Taft Heights
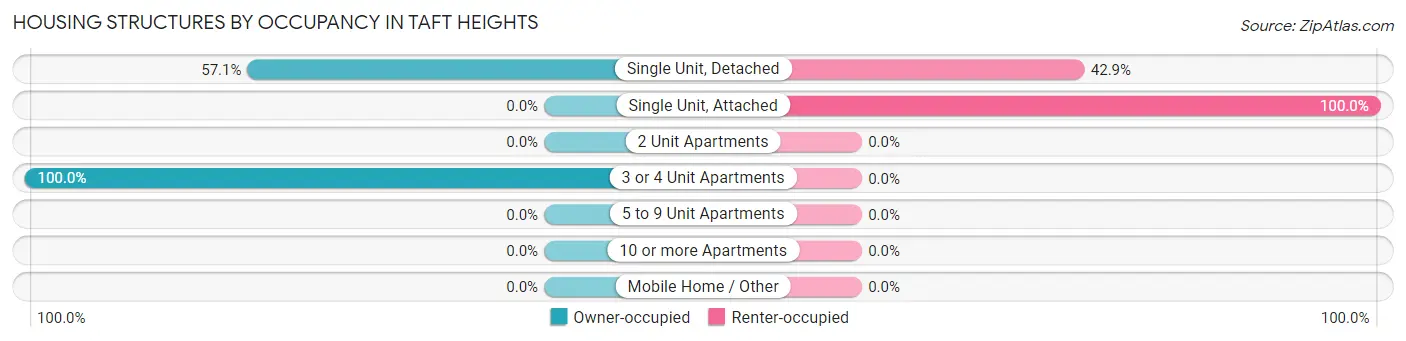
| Structure Type | Owner-occupied | Renter-occupied |
| Single Unit, Detached | 321 (57.1%) | 241 (42.9%) |
| Single Unit, Attached | 0 (0.0%) | 42 (100.0%) |
| 2 Unit Apartments | 0 (0.0%) | 0 (0.0%) |
| 3 or 4 Unit Apartments | 7 (100.0%) | 0 (0.0%) |
| 5 to 9 Unit Apartments | 0 (0.0%) | 0 (0.0%) |
| 10 or more Apartments | 0 (0.0%) | 0 (0.0%) |
| Mobile Home / Other | 0 (0.0%) | 0 (0.0%) |
| Total | 328 (53.7%) | 283 (46.3%) |
Housing Structures by Number of Rooms in Taft Heights
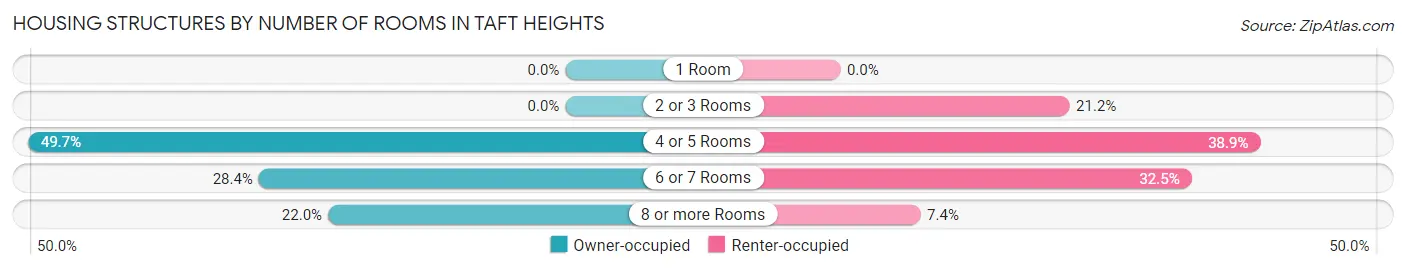
| Number of Rooms | Owner-occupied | Renter-occupied |
| 1 Room | 0 (0.0%) | 0 (0.0%) |
| 2 or 3 Rooms | 0 (0.0%) | 60 (21.2%) |
| 4 or 5 Rooms | 163 (49.7%) | 110 (38.9%) |
| 6 or 7 Rooms | 93 (28.3%) | 92 (32.5%) |
| 8 or more Rooms | 72 (22.0%) | 21 (7.4%) |
| Total | 328 (100.0%) | 283 (100.0%) |
Housing Structure by Heating Type in Taft Heights
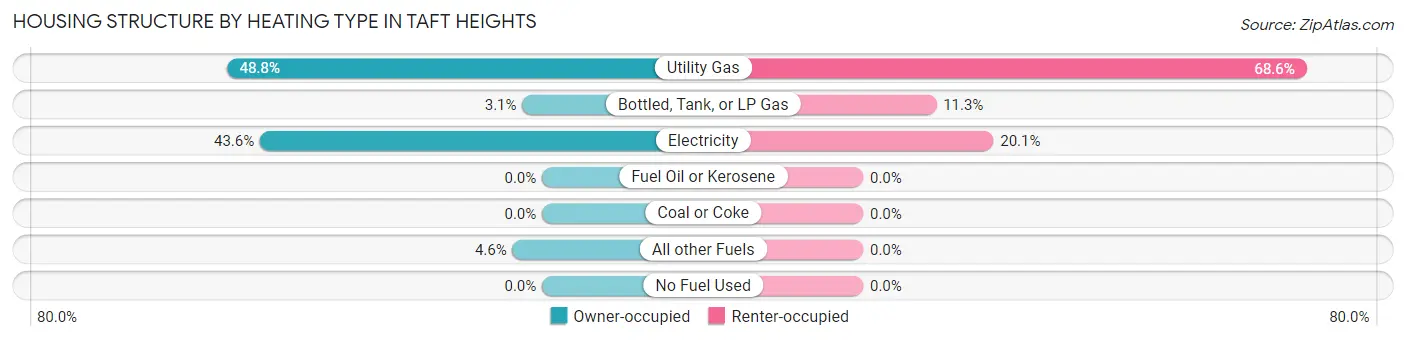
| Heating Type | Owner-occupied | Renter-occupied |
| Utility Gas | 160 (48.8%) | 194 (68.5%) |
| Bottled, Tank, or LP Gas | 10 (3.0%) | 32 (11.3%) |
| Electricity | 143 (43.6%) | 57 (20.1%) |
| Fuel Oil or Kerosene | 0 (0.0%) | 0 (0.0%) |
| Coal or Coke | 0 (0.0%) | 0 (0.0%) |
| All other Fuels | 15 (4.6%) | 0 (0.0%) |
| No Fuel Used | 0 (0.0%) | 0 (0.0%) |
| Total | 328 (100.0%) | 283 (100.0%) |
Household Vehicle Usage in Taft Heights
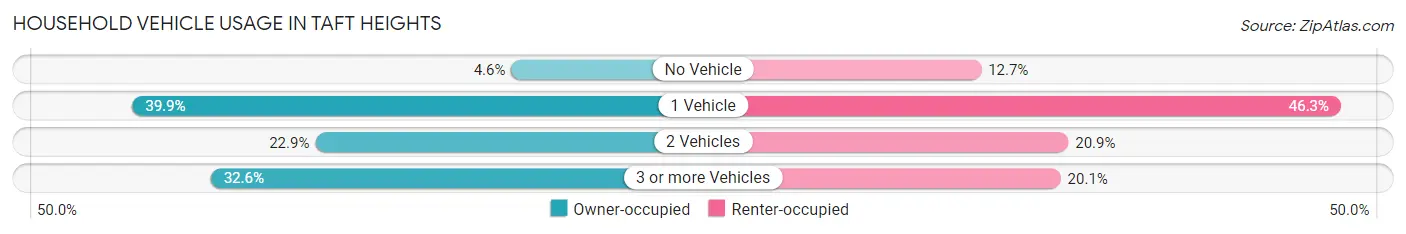
| Vehicles per Household | Owner-occupied | Renter-occupied |
| No Vehicle | 15 (4.6%) | 36 (12.7%) |
| 1 Vehicle | 131 (39.9%) | 131 (46.3%) |
| 2 Vehicles | 75 (22.9%) | 59 (20.8%) |
| 3 or more Vehicles | 107 (32.6%) | 57 (20.1%) |
| Total | 328 (100.0%) | 283 (100.0%) |
Real Estate & Mortgages in Taft Heights
Real Estate and Mortgage Overview in Taft Heights
| Characteristic | Without Mortgage | With Mortgage |
| Housing Units | 75 | 253 |
| Median Property Value | $157,500 | $182,200 |
| Median Household Income | $49,792 | $15 |
| Monthly Housing Costs | $552 | $0 |
| Real Estate Taxes | $1,836 | $15 |
Property Value by Mortgage Status in Taft Heights
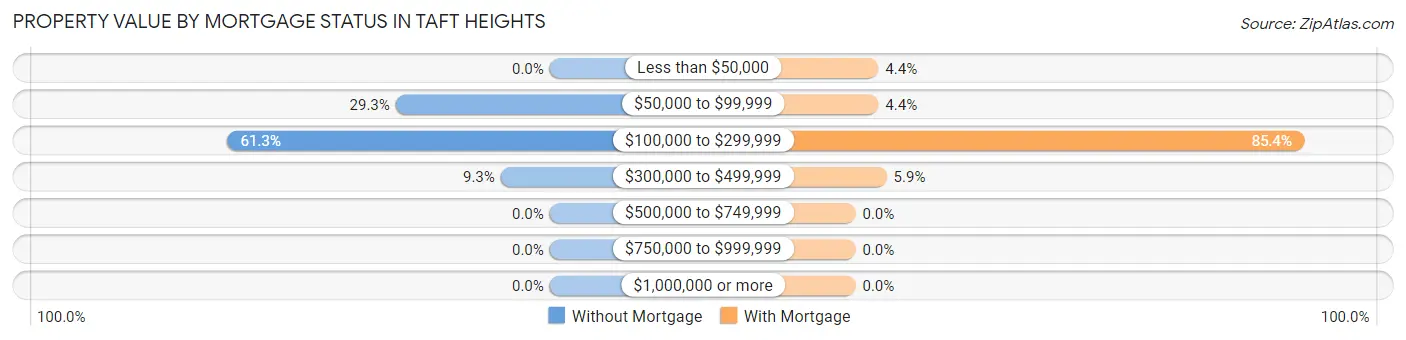
| Property Value | Without Mortgage | With Mortgage |
| Less than $50,000 | 0 (0.0%) | 11 (4.3%) |
| $50,000 to $99,999 | 22 (29.3%) | 11 (4.3%) |
| $100,000 to $299,999 | 46 (61.3%) | 216 (85.4%) |
| $300,000 to $499,999 | 7 (9.3%) | 15 (5.9%) |
| $500,000 to $749,999 | 0 (0.0%) | 0 (0.0%) |
| $750,000 to $999,999 | 0 (0.0%) | 0 (0.0%) |
| $1,000,000 or more | 0 (0.0%) | 0 (0.0%) |
| Total | 75 (100.0%) | 253 (100.0%) |
Household Income by Mortgage Status in Taft Heights
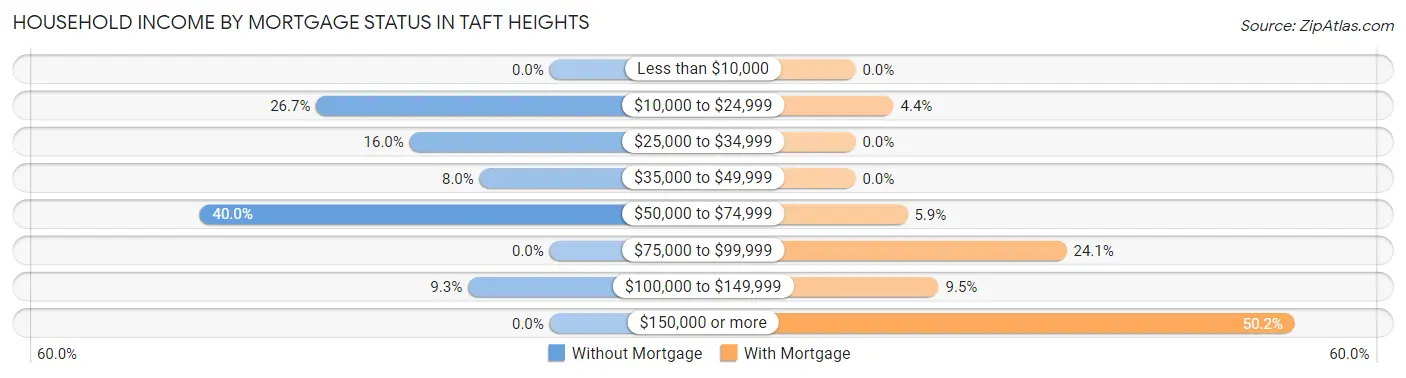
| Household Income | Without Mortgage | With Mortgage |
| Less than $10,000 | 0 (0.0%) | 0 (0.0%) |
| $10,000 to $24,999 | 20 (26.7%) | 11 (4.3%) |
| $25,000 to $34,999 | 12 (16.0%) | 0 (0.0%) |
| $35,000 to $49,999 | 6 (8.0%) | 0 (0.0%) |
| $50,000 to $74,999 | 30 (40.0%) | 15 (5.9%) |
| $75,000 to $99,999 | 0 (0.0%) | 61 (24.1%) |
| $100,000 to $149,999 | 7 (9.3%) | 24 (9.5%) |
| $150,000 or more | 0 (0.0%) | 127 (50.2%) |
| Total | 75 (100.0%) | 253 (100.0%) |
Property Value to Household Income Ratio in Taft Heights
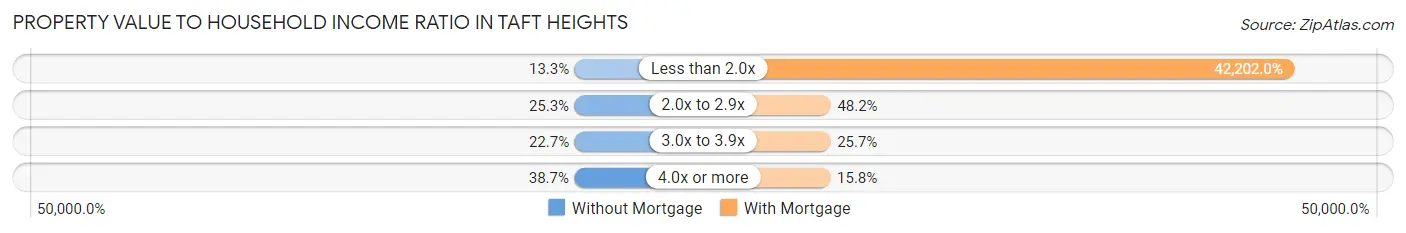
| Value-to-Income Ratio | Without Mortgage | With Mortgage |
| Less than 2.0x | 10 (13.3%) | 106,771 (42,202.0%) |
| 2.0x to 2.9x | 19 (25.3%) | 122 (48.2%) |
| 3.0x to 3.9x | 17 (22.7%) | 65 (25.7%) |
| 4.0x or more | 29 (38.7%) | 40 (15.8%) |
| Total | 75 (100.0%) | 253 (100.0%) |
Real Estate Taxes by Mortgage Status in Taft Heights
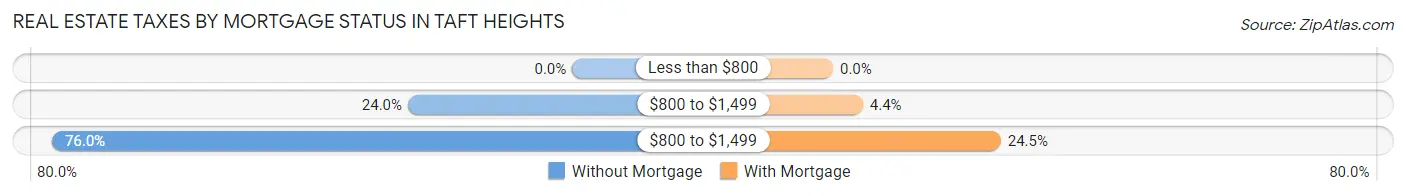
| Property Taxes | Without Mortgage | With Mortgage |
| Less than $800 | 0 (0.0%) | 0 (0.0%) |
| $800 to $1,499 | 18 (24.0%) | 11 (4.3%) |
| $800 to $1,499 | 57 (76.0%) | 62 (24.5%) |
| Total | 75 (100.0%) | 253 (100.0%) |
Health & Disability in Taft Heights
Health Insurance Coverage by Age in Taft Heights
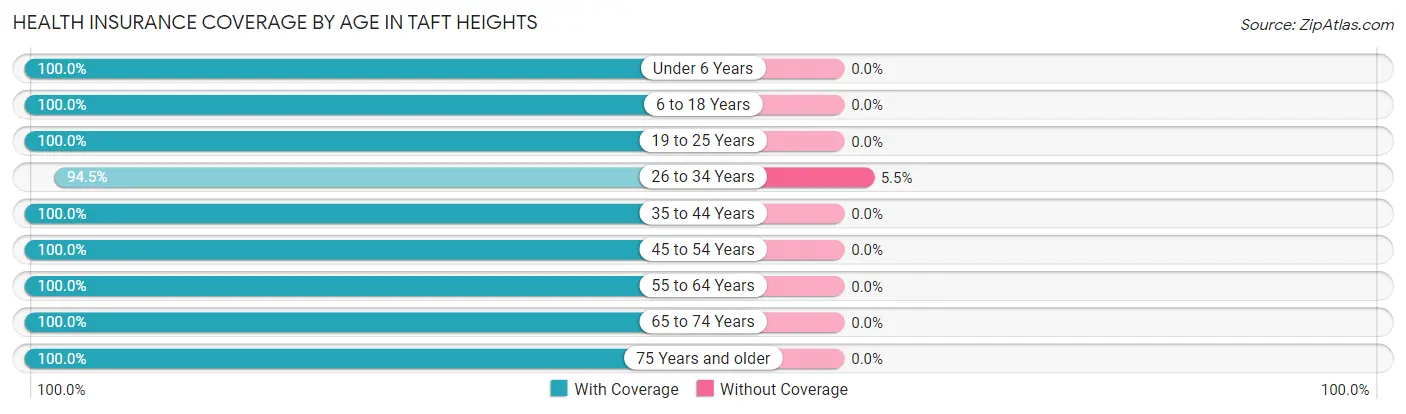
| Age Bracket | With Coverage | Without Coverage |
| Under 6 Years | 168 (100.0%) | 0 (0.0%) |
| 6 to 18 Years | 288 (100.0%) | 0 (0.0%) |
| 19 to 25 Years | 176 (100.0%) | 0 (0.0%) |
| 26 to 34 Years | 310 (94.5%) | 18 (5.5%) |
| 35 to 44 Years | 219 (100.0%) | 0 (0.0%) |
| 45 to 54 Years | 65 (100.0%) | 0 (0.0%) |
| 55 to 64 Years | 200 (100.0%) | 0 (0.0%) |
| 65 to 74 Years | 152 (100.0%) | 0 (0.0%) |
| 75 Years and older | 42 (100.0%) | 0 (0.0%) |
| Total | 1,620 (98.9%) | 18 (1.1%) |
Health Insurance Coverage by Citizenship Status in Taft Heights

| Citizenship Status | With Coverage | Without Coverage |
| Native Born | 168 (100.0%) | 0 (0.0%) |
| Foreign Born, Citizen | 288 (100.0%) | 0 (0.0%) |
| Foreign Born, not a Citizen | 176 (100.0%) | 0 (0.0%) |
Health Insurance Coverage by Household Income in Taft Heights
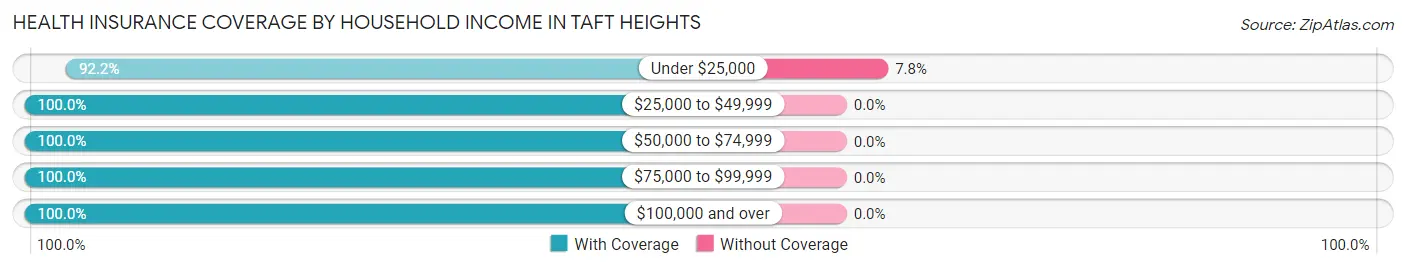
| Household Income | With Coverage | Without Coverage |
| Under $25,000 | 214 (92.2%) | 18 (7.8%) |
| $25,000 to $49,999 | 385 (100.0%) | 0 (0.0%) |
| $50,000 to $74,999 | 227 (100.0%) | 0 (0.0%) |
| $75,000 to $99,999 | 162 (100.0%) | 0 (0.0%) |
| $100,000 and over | 632 (100.0%) | 0 (0.0%) |
Public vs Private Health Insurance Coverage by Age in Taft Heights
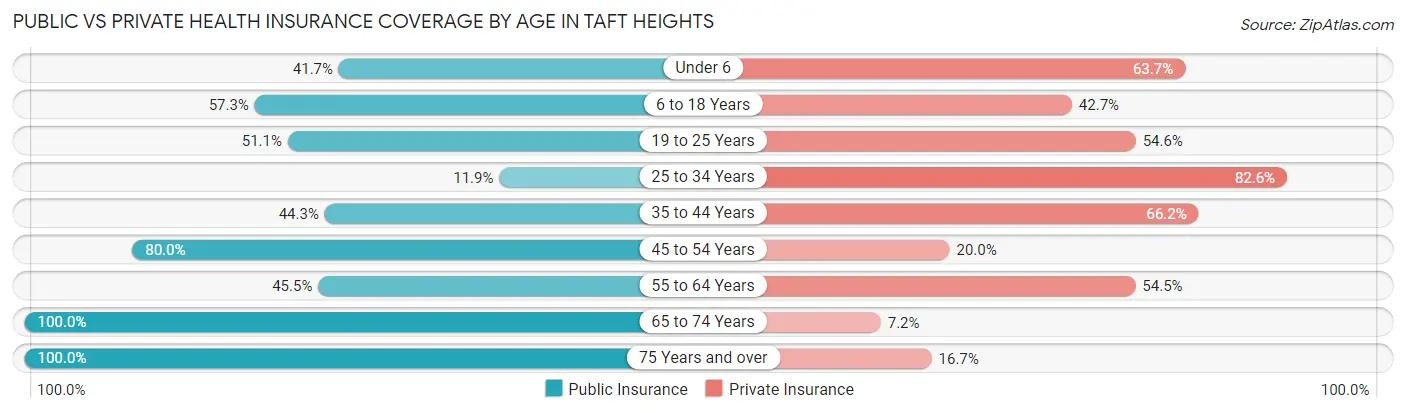
| Age Bracket | Public Insurance | Private Insurance |
| Under 6 | 70 (41.7%) | 107 (63.7%) |
| 6 to 18 Years | 165 (57.3%) | 123 (42.7%) |
| 19 to 25 Years | 90 (51.1%) | 96 (54.5%) |
| 25 to 34 Years | 39 (11.9%) | 271 (82.6%) |
| 35 to 44 Years | 97 (44.3%) | 145 (66.2%) |
| 45 to 54 Years | 52 (80.0%) | 13 (20.0%) |
| 55 to 64 Years | 91 (45.5%) | 109 (54.5%) |
| 65 to 74 Years | 152 (100.0%) | 11 (7.2%) |
| 75 Years and over | 42 (100.0%) | 7 (16.7%) |
| Total | 798 (48.7%) | 882 (53.8%) |
Disability Status by Sex by Age in Taft Heights
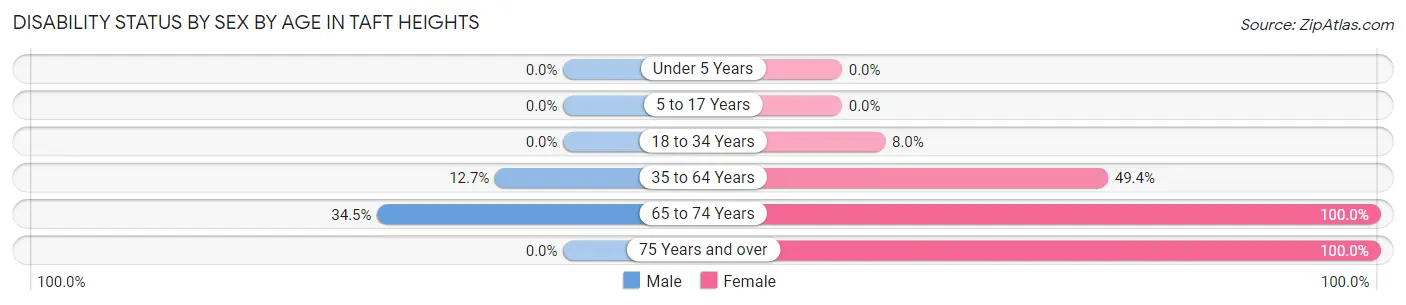
| Age Bracket | Male | Female |
| Under 5 Years | 0 (0.0%) | 0 (0.0%) |
| 5 to 17 Years | 0 (0.0%) | 0 (0.0%) |
| 18 to 34 Years | 0 (0.0%) | 22 (8.0%) |
| 35 to 64 Years | 41 (12.7%) | 79 (49.4%) |
| 65 to 74 Years | 29 (34.5%) | 68 (100.0%) |
| 75 Years and over | 0 (0.0%) | 31 (100.0%) |
Disability Class by Sex by Age in Taft Heights
Disability Class: Hearing Difficulty
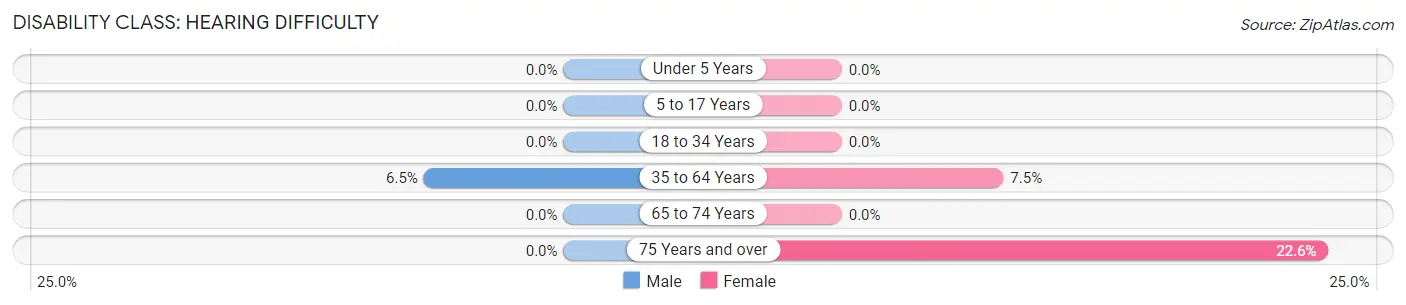
| Age Bracket | Male | Female |
| Under 5 Years | 0 (0.0%) | 0 (0.0%) |
| 5 to 17 Years | 0 (0.0%) | 0 (0.0%) |
| 18 to 34 Years | 0 (0.0%) | 0 (0.0%) |
| 35 to 64 Years | 21 (6.5%) | 12 (7.5%) |
| 65 to 74 Years | 0 (0.0%) | 0 (0.0%) |
| 75 Years and over | 0 (0.0%) | 7 (22.6%) |
Disability Class: Vision Difficulty
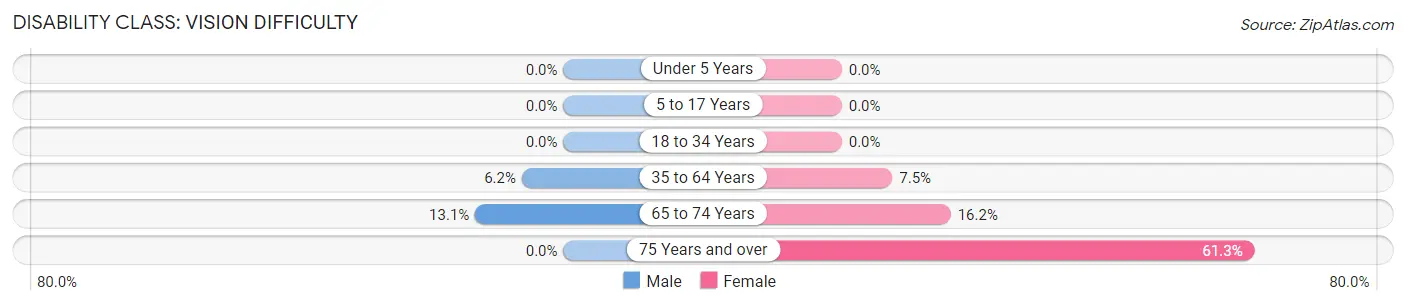
| Age Bracket | Male | Female |
| Under 5 Years | 0 (0.0%) | 0 (0.0%) |
| 5 to 17 Years | 0 (0.0%) | 0 (0.0%) |
| 18 to 34 Years | 0 (0.0%) | 0 (0.0%) |
| 35 to 64 Years | 20 (6.2%) | 12 (7.5%) |
| 65 to 74 Years | 11 (13.1%) | 11 (16.2%) |
| 75 Years and over | 0 (0.0%) | 19 (61.3%) |
Disability Class: Cognitive Difficulty
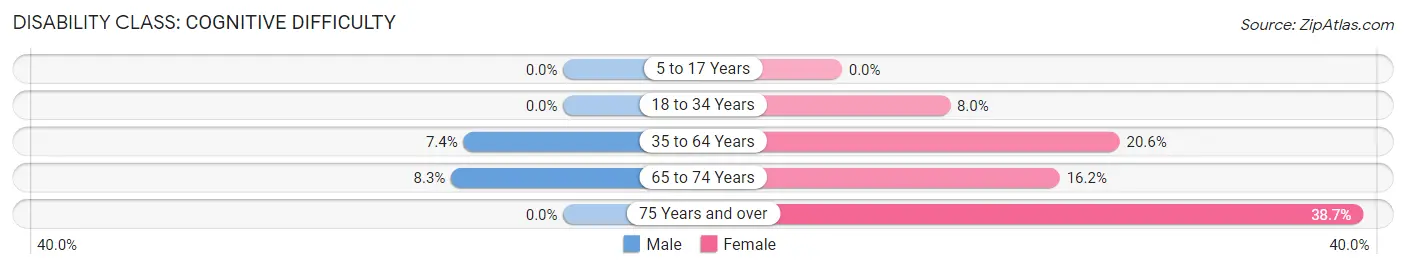
| Age Bracket | Male | Female |
| 5 to 17 Years | 0 (0.0%) | 0 (0.0%) |
| 18 to 34 Years | 0 (0.0%) | 22 (8.0%) |
| 35 to 64 Years | 24 (7.4%) | 33 (20.6%) |
| 65 to 74 Years | 7 (8.3%) | 11 (16.2%) |
| 75 Years and over | 0 (0.0%) | 12 (38.7%) |
Disability Class: Ambulatory Difficulty
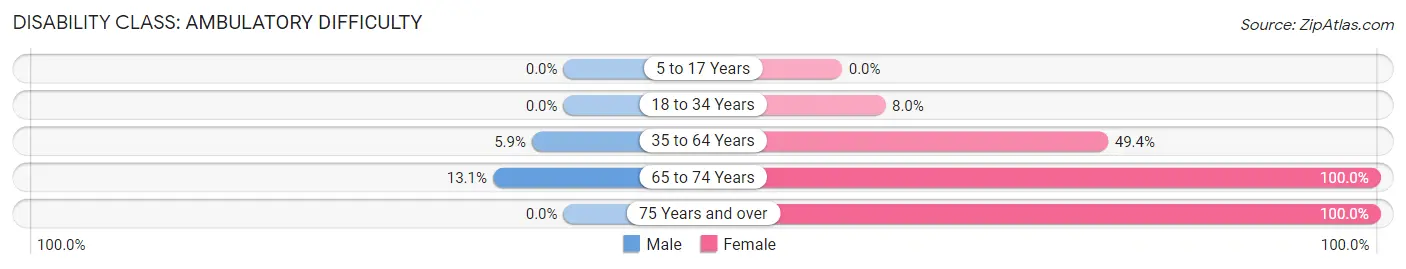
| Age Bracket | Male | Female |
| 5 to 17 Years | 0 (0.0%) | 0 (0.0%) |
| 18 to 34 Years | 0 (0.0%) | 22 (8.0%) |
| 35 to 64 Years | 19 (5.9%) | 79 (49.4%) |
| 65 to 74 Years | 11 (13.1%) | 68 (100.0%) |
| 75 Years and over | 0 (0.0%) | 31 (100.0%) |
Disability Class: Self-Care Difficulty
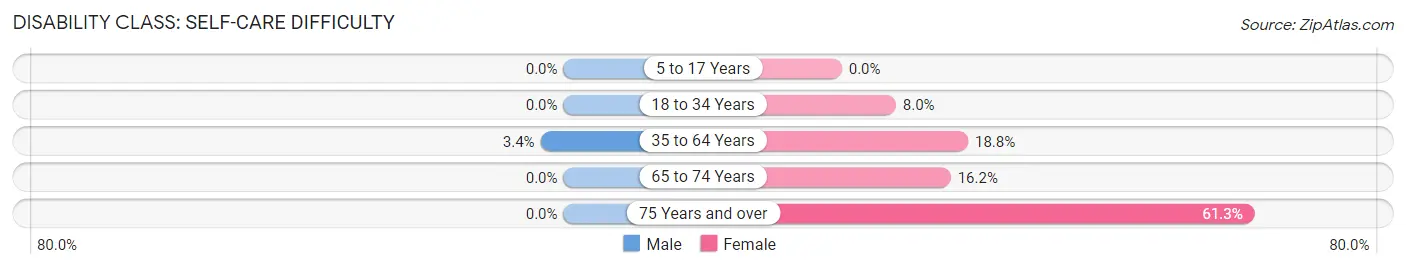
| Age Bracket | Male | Female |
| 5 to 17 Years | 0 (0.0%) | 0 (0.0%) |
| 18 to 34 Years | 0 (0.0%) | 22 (8.0%) |
| 35 to 64 Years | 11 (3.4%) | 30 (18.8%) |
| 65 to 74 Years | 0 (0.0%) | 11 (16.2%) |
| 75 Years and over | 0 (0.0%) | 19 (61.3%) |
Technology Access in Taft Heights
Computing Device Access in Taft Heights
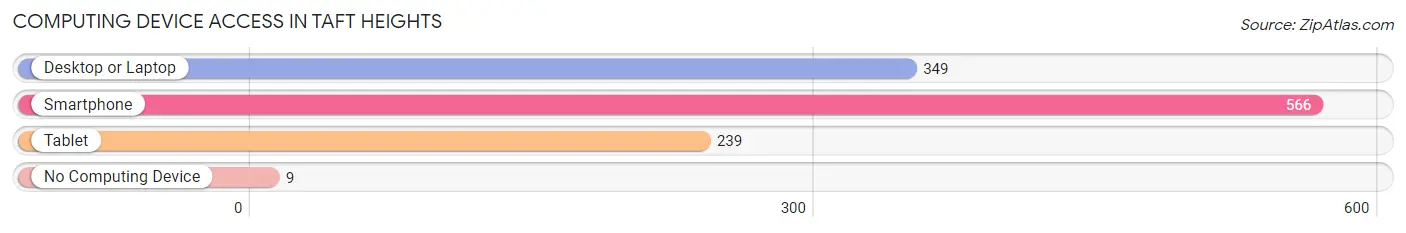
| Device Type | # Households | % Households |
| Desktop or Laptop | 349 | 57.1% |
| Smartphone | 566 | 92.6% |
| Tablet | 239 | 39.1% |
| No Computing Device | 9 | 1.5% |
| Total | 611 | 100.0% |
Internet Access in Taft Heights
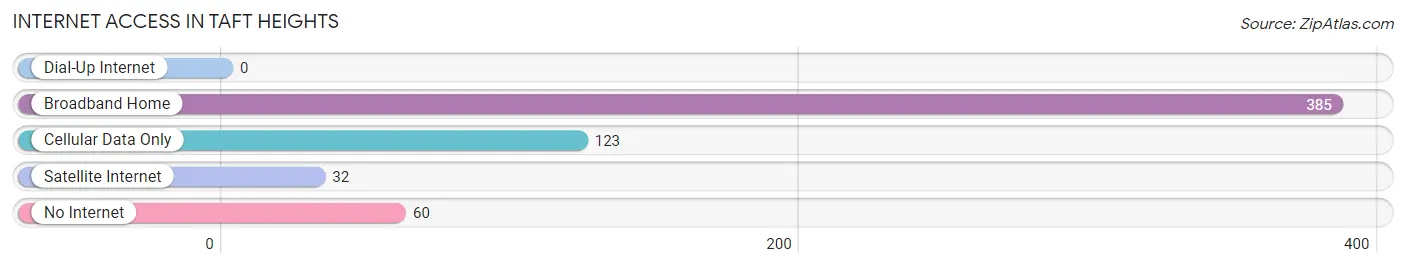
| Internet Type | # Households | % Households |
| Dial-Up Internet | 0 | 0.0% |
| Broadband Home | 385 | 63.0% |
| Cellular Data Only | 123 | 20.1% |
| Satellite Internet | 32 | 5.2% |
| No Internet | 60 | 9.8% |
| Total | 611 | 100.0% |
Taft Heights Summary
Taft Heights is a census-designated place (CDP) located in Kern County, California, United States. The population was 2,845 at the 2010 census, up from 2,717 at the 2000 census. It is located in the western part of the county, near the city of Taft.
Geography
Taft Heights is located at 35 10 25 North 119 30 17 West 35 173611 119 504722
According to the United States Census Bureau, the CDP has a total area of 2.3 square miles (6.0 km2), all of it land.
Demographics
As of the census of 2000, there were 2,717 people, 890 households, and 717 families residing in the CDP. The population density was 1,179.2 people per square mile (456.2/km2). There were 945 housing units at an average density of 409.3 per square mile (158.1/km2). The racial makeup of the CDP was 73.45% White, 0.81% African American, 1.48% Native American, 0.33% Asian, 0.07% Pacific Islander, 20.45% from other races, and 3.41% from two or more races. Hispanic or Latino of any race were 33.90% of the population.
There were 890 households, out of which 41.2% had children under the age of 18 living with them, 58.9% were married couples living together, 14.3% had a female householder with no husband present, and 20.7% were non-families. 17.1% of all households were made up of individuals, and 8.3% had someone living alone who was 65 years of age or older. The average household size was 3.05 and the average family size was 3.45.
In the CDP, the population was spread out, with 32.2% under the age of 18, 10.2% from 18 to 24, 27.2% from 25 to 44, 19.7% from 45 to 64, and 10.7% who were 65 years of age or older. The median age was 32 years. For every 100 females, there were 103.2 males. For every 100 females age 18 and over, there were 101.2 males.
The median income for a household in the CDP was $30,938, and the median income for a family was $32,917. Males had a median income of $30,000 versus $20,000 for females. The per capita income for the CDP was $12,845. About 17.2% of families and 20.2% of the population were below the poverty line, including 28.2% of those under age 18 and 8.3% of those age 65 or over.
Economy
Taft Heights is a small, rural community with a population of just over 2,800 people. The economy of the area is largely based on agriculture, with the majority of the population employed in the farming and ranching industries. The area is also home to several oil and gas production facilities, as well as a few small businesses.
The area is served by the Taft Union High School District, which provides educational services to the local community. The district also operates a vocational school, which provides students with the opportunity to learn a trade or gain additional skills.
Conclusion
Taft Heights is a small, rural community located in Kern County, California. The population was 2,845 at the 2010 census, up from 2,717 at the 2000 census. The economy of the area is largely based on agriculture, with the majority of the population employed in the farming and ranching industries. The area is also home to several oil and gas production facilities, as well as a few small businesses. The area is served by the Taft Union High School District, which provides educational services to the local community.
Common Questions
What is Per Capita Income in Taft Heights?
Per Capita income in Taft Heights is $26,700.
What is the Median Family Income in Taft Heights?
Median Family Income in Taft Heights is $47,917.
What is the Median Household income in Taft Heights?
Median Household Income in Taft Heights is $60,675.
What is Income or Wage Gap in Taft Heights?
Income or Wage Gap in Taft Heights is 62.8%.
Women in Taft Heights earn 37.2 cents for every dollar earned by a man.
What is Inequality or Gini Index in Taft Heights?
Inequality or Gini Index in Taft Heights is 0.35.
What is the Total Population of Taft Heights?
Total Population of Taft Heights is 1,638.
What is the Total Male Population of Taft Heights?
Total Male Population of Taft Heights is 945.
What is the Total Female Population of Taft Heights?
Total Female Population of Taft Heights is 693.
What is the Ratio of Males per 100 Females in Taft Heights?
There are 136.36 Males per 100 Females in Taft Heights.
What is the Ratio of Females per 100 Males in Taft Heights?
There are 73.33 Females per 100 Males in Taft Heights.
What is the Median Population Age in Taft Heights?
Median Population Age in Taft Heights is 31.5 Years.
What is the Average Family Size in Taft Heights
Average Family Size in Taft Heights is 3.5 People.
What is the Average Household Size in Taft Heights
Average Household Size in Taft Heights is 2.7 People.
How Large is the Labor Force in Taft Heights?
There are 848 People in the Labor Forcein in Taft Heights.
What is the Percentage of People in the Labor Force in Taft Heights?
68.8% of People are in the Labor Force in Taft Heights.
What is the Unemployment Rate in Taft Heights?
Unemployment Rate in Taft Heights is 8.7%.