Sutter Creek, CA Map & Demographics
Sutter Creek Map
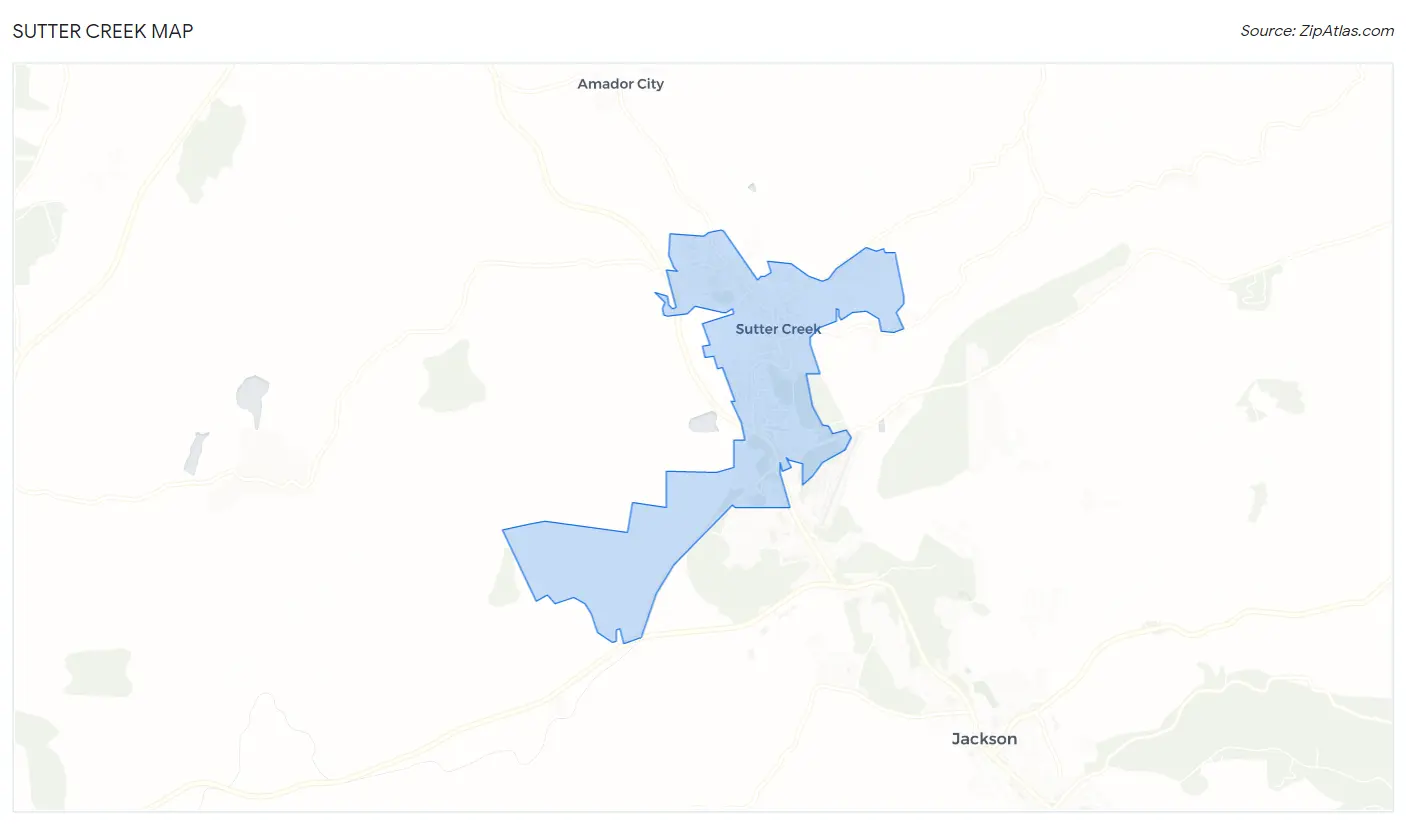
Sutter Creek Overview
$40,585
PER CAPITA INCOME
$63,994
AVG FAMILY INCOME
$59,028
AVG HOUSEHOLD INCOME
45.6%
WAGE / INCOME GAP [ % ]
54.4¢/ $1
WAGE / INCOME GAP [ $ ]
0.42
INEQUALITY / GINI INDEX
2,659
TOTAL POPULATION
1,076
MALE POPULATION
1,583
FEMALE POPULATION
67.97
MALES / 100 FEMALES
147.12
FEMALES / 100 MALES
46.6
MEDIAN AGE
3.0
AVG FAMILY SIZE
2.0
AVG HOUSEHOLD SIZE
1,242
LABOR FORCE [ PEOPLE ]
53.6%
PERCENT IN LABOR FORCE
7.6%
UNEMPLOYMENT RATE
Sutter Creek Zip Codes
Sutter Creek Area Codes
Income in Sutter Creek
Income Overview in Sutter Creek
Per Capita Income in Sutter Creek is $40,585, while median incomes of families and households are $63,994 and $59,028 respectively.
| Characteristic | Number | Measure |
| Per Capita Income | 2,659 | $40,585 |
| Median Family Income | 651 | $63,994 |
| Mean Family Income | 651 | $102,726 |
| Median Household Income | 1,295 | $59,028 |
| Mean Household Income | 1,295 | $77,124 |
| Income Deficit | 651 | $0 |
| Wage / Income Gap (%) | 2,659 | 45.64% |
| Wage / Income Gap ($) | 2,659 | 54.36¢ per $1 |
| Gini / Inequality Index | 2,659 | 0.42 |
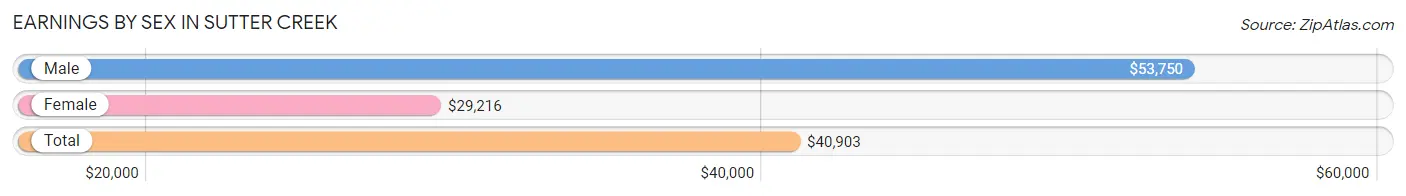
Earnings by Sex in Sutter Creek
Average Earnings in Sutter Creek are $40,903, $53,750 for men and $29,216 for women, a difference of 45.6%.
| Sex | Number | Average Earnings |
| Male | 645 (52.7%) | $53,750 |
| Female | 578 (47.3%) | $29,216 |
| Total | 1,223 (100.0%) | $40,903 |
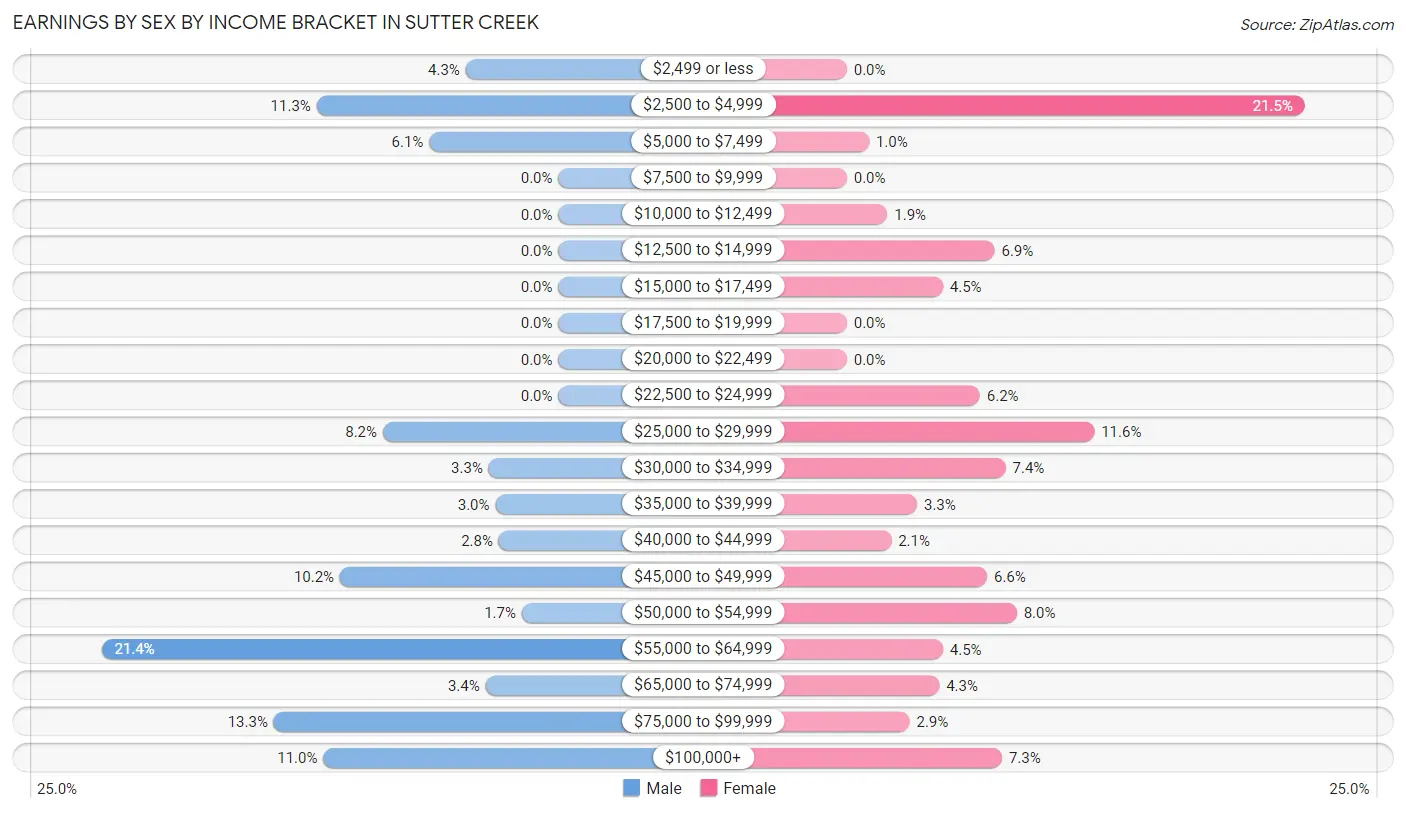
Earnings by Sex by Income Bracket in Sutter Creek
The most common earnings brackets in Sutter Creek are $55,000 to $64,999 for men (138 | 21.4%) and $2,500 to $4,999 for women (124 | 21.4%).
| Income | Male | Female |
| $2,499 or less | 28 (4.3%) | 0 (0.0%) |
| $2,500 to $4,999 | 73 (11.3%) | 124 (21.4%) |
| $5,000 to $7,499 | 39 (6.0%) | 6 (1.0%) |
| $7,500 to $9,999 | 0 (0.0%) | 0 (0.0%) |
| $10,000 to $12,499 | 0 (0.0%) | 11 (1.9%) |
| $12,500 to $14,999 | 0 (0.0%) | 40 (6.9%) |
| $15,000 to $17,499 | 0 (0.0%) | 26 (4.5%) |
| $17,500 to $19,999 | 0 (0.0%) | 0 (0.0%) |
| $20,000 to $22,499 | 0 (0.0%) | 0 (0.0%) |
| $22,500 to $24,999 | 0 (0.0%) | 36 (6.2%) |
| $25,000 to $29,999 | 53 (8.2%) | 67 (11.6%) |
| $30,000 to $34,999 | 21 (3.3%) | 43 (7.4%) |
| $35,000 to $39,999 | 19 (2.9%) | 19 (3.3%) |
| $40,000 to $44,999 | 18 (2.8%) | 12 (2.1%) |
| $45,000 to $49,999 | 66 (10.2%) | 38 (6.6%) |
| $50,000 to $54,999 | 11 (1.7%) | 46 (8.0%) |
| $55,000 to $64,999 | 138 (21.4%) | 26 (4.5%) |
| $65,000 to $74,999 | 22 (3.4%) | 25 (4.3%) |
| $75,000 to $99,999 | 86 (13.3%) | 17 (2.9%) |
| $100,000+ | 71 (11.0%) | 42 (7.3%) |
| Total | 645 (100.0%) | 578 (100.0%) |
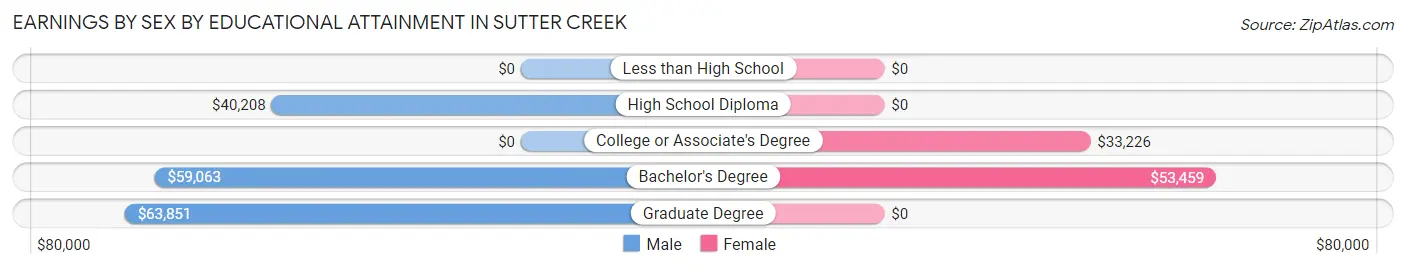
Earnings by Sex by Educational Attainment in Sutter Creek
Average earnings in Sutter Creek are $58,152 for men and $38,421 for women, a difference of 33.9%. Men with an educational attainment of graduate degree enjoy the highest average annual earnings of $63,851, while those with high school diploma education earn the least with $40,208. Women with an educational attainment of bachelor's degree earn the most with the average annual earnings of $53,459, while those with college or associate's degree education have the smallest earnings of $33,226.
| Educational Attainment | Male Income | Female Income |
| Less than High School | - | - |
| High School Diploma | $40,208 | $0 |
| College or Associate's Degree | - | - |
| Bachelor's Degree | $59,063 | $53,459 |
| Graduate Degree | $63,851 | $0 |
| Total | $58,152 | $38,421 |
Family Income in Sutter Creek
Family Income Brackets in Sutter Creek
According to the Sutter Creek family income data, there are 228 families falling into the $50,000 to $74,999 income range, which is the most common income bracket and makes up 35.0% of all families.
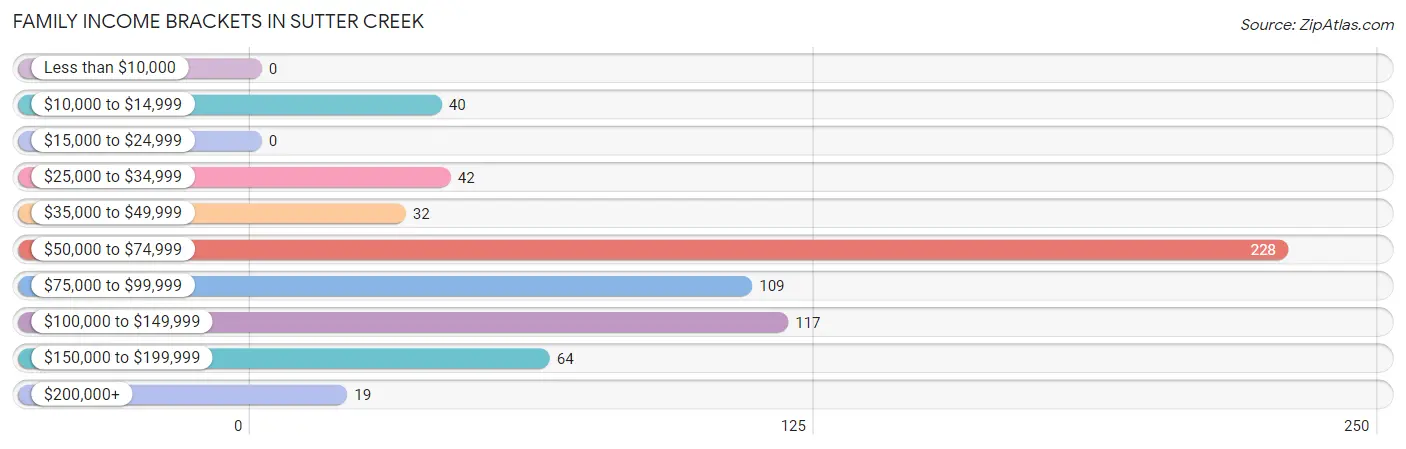
| Income Bracket | # Families | % Families |
| Less than $10,000 | 0 | 0.0% |
| $10,000 to $14,999 | 40 | 6.1% |
| $15,000 to $24,999 | 0 | 0.0% |
| $25,000 to $34,999 | 42 | 6.5% |
| $35,000 to $49,999 | 32 | 4.9% |
| $50,000 to $74,999 | 228 | 35.0% |
| $75,000 to $99,999 | 109 | 16.7% |
| $100,000 to $149,999 | 117 | 18.0% |
| $150,000 to $199,999 | 64 | 9.8% |
| $200,000+ | 19 | 2.9% |
Family Income by Famaliy Size in Sutter Creek
4-person families (60 | 9.2%) account for the highest median family income in Sutter Creek with $82,143 per family, while 2-person families (402 | 61.8%) have the highest median income of $31,174 per family member.
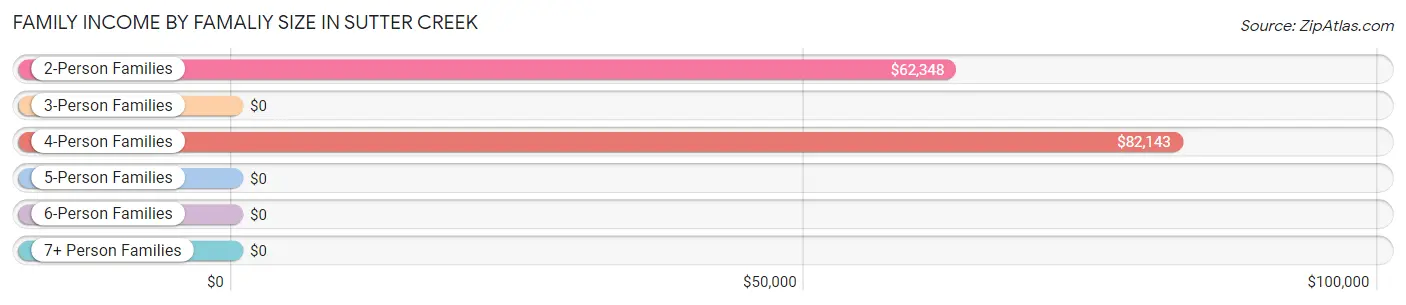
| Income Bracket | # Families | Median Income |
| 2-Person Families | 402 (61.8%) | $62,348 |
| 3-Person Families | 152 (23.4%) | $0 |
| 4-Person Families | 60 (9.2%) | $82,143 |
| 5-Person Families | 32 (4.9%) | $0 |
| 6-Person Families | 0 (0.0%) | $0 |
| 7+ Person Families | 5 (0.8%) | $0 |
| Total | 651 (100.0%) | $63,994 |
Family Income by Number of Earners in Sutter Creek
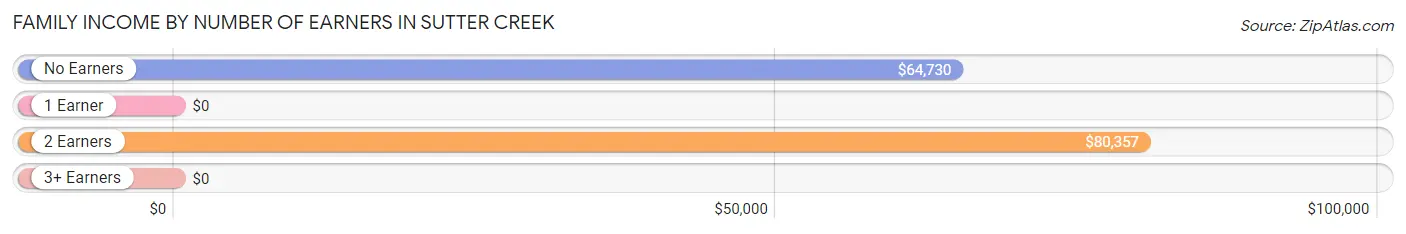
| Number of Earners | # Families | Median Income |
| No Earners | 272 (41.8%) | $64,730 |
| 1 Earner | 135 (20.7%) | $0 |
| 2 Earners | 216 (33.2%) | $80,357 |
| 3+ Earners | 28 (4.3%) | $0 |
| Total | 651 (100.0%) | $63,994 |
Household Income in Sutter Creek
Household Income Brackets in Sutter Creek
With 370 households falling in the category, the $50,000 to $74,999 income range is the most frequent in Sutter Creek, accounting for 28.6% of all households. In contrast, only 6 households (0.5%) fall into the less than $10,000 income bracket, making it the least populous group.
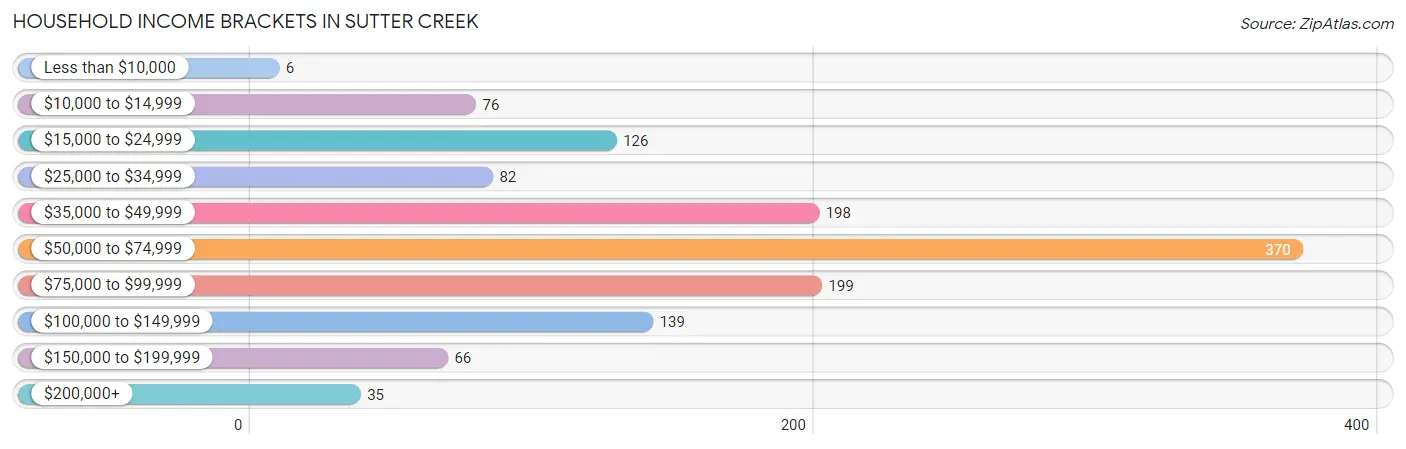
| Income Bracket | # Households | % Households |
| Less than $10,000 | 6 | 0.5% |
| $10,000 to $14,999 | 76 | 5.9% |
| $15,000 to $24,999 | 126 | 9.7% |
| $25,000 to $34,999 | 82 | 6.3% |
| $35,000 to $49,999 | 198 | 15.3% |
| $50,000 to $74,999 | 370 | 28.6% |
| $75,000 to $99,999 | 199 | 15.4% |
| $100,000 to $149,999 | 139 | 10.7% |
| $150,000 to $199,999 | 66 | 5.1% |
| $200,000+ | 35 | 2.7% |
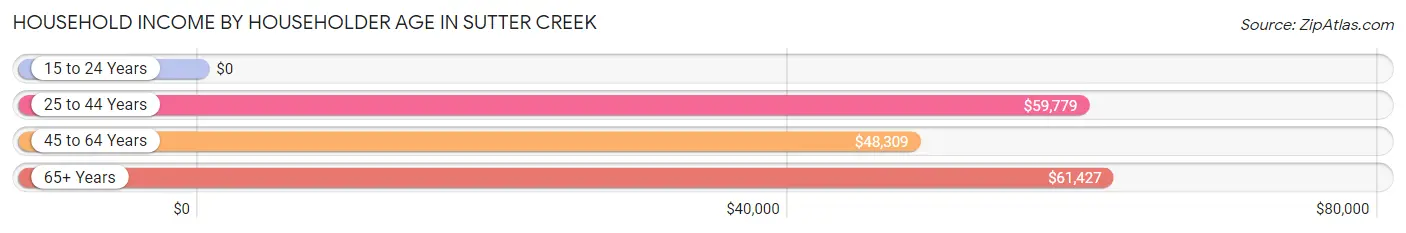
Household Income by Householder Age in Sutter Creek
The median household income in Sutter Creek is $59,028, with the highest median household income of $61,427 found in the 65+ years age bracket for the primary householder. A total of 525 households (40.5%) fall into this category. Meanwhile, the 15 to 24 years age bracket for the primary householder has the lowest median household income of $0, with 30 households (2.3%) in this group.
| Income Bracket | # Households | Median Income |
| 15 to 24 Years | 30 (2.3%) | $0 |
| 25 to 44 Years | 325 (25.1%) | $59,779 |
| 45 to 64 Years | 415 (32.1%) | $48,309 |
| 65+ Years | 525 (40.5%) | $61,427 |
| Total | 1,295 (100.0%) | $59,028 |
Poverty in Sutter Creek
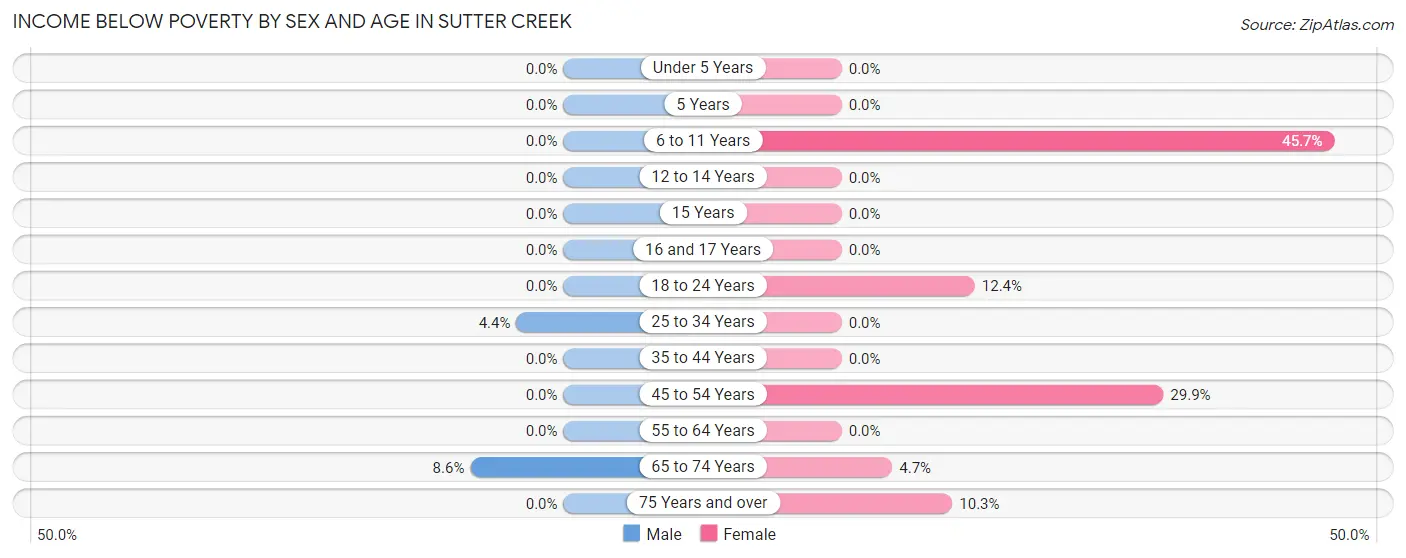
Income Below Poverty by Sex and Age in Sutter Creek
With 1.5% poverty level for males and 10.1% for females among the residents of Sutter Creek, 65 to 74 year old males and 6 to 11 year old females are the most vulnerable to poverty, with 7 males (8.6%) and 64 females (45.7%) in their respective age groups living below the poverty level.
| Age Bracket | Male | Female |
| Under 5 Years | 0 (0.0%) | 0 (0.0%) |
| 5 Years | 0 (0.0%) | 0 (0.0%) |
| 6 to 11 Years | 0 (0.0%) | 64 (45.7%) |
| 12 to 14 Years | 0 (0.0%) | 0 (0.0%) |
| 15 Years | 0 (0.0%) | 0 (0.0%) |
| 16 and 17 Years | 0 (0.0%) | 0 (0.0%) |
| 18 to 24 Years | 0 (0.0%) | 20 (12.3%) |
| 25 to 34 Years | 9 (4.4%) | 0 (0.0%) |
| 35 to 44 Years | 0 (0.0%) | 0 (0.0%) |
| 45 to 54 Years | 0 (0.0%) | 40 (29.8%) |
| 55 to 64 Years | 0 (0.0%) | 0 (0.0%) |
| 65 to 74 Years | 7 (8.6%) | 12 (4.7%) |
| 75 Years and over | 0 (0.0%) | 24 (10.3%) |
| Total | 16 (1.5%) | 160 (10.1%) |
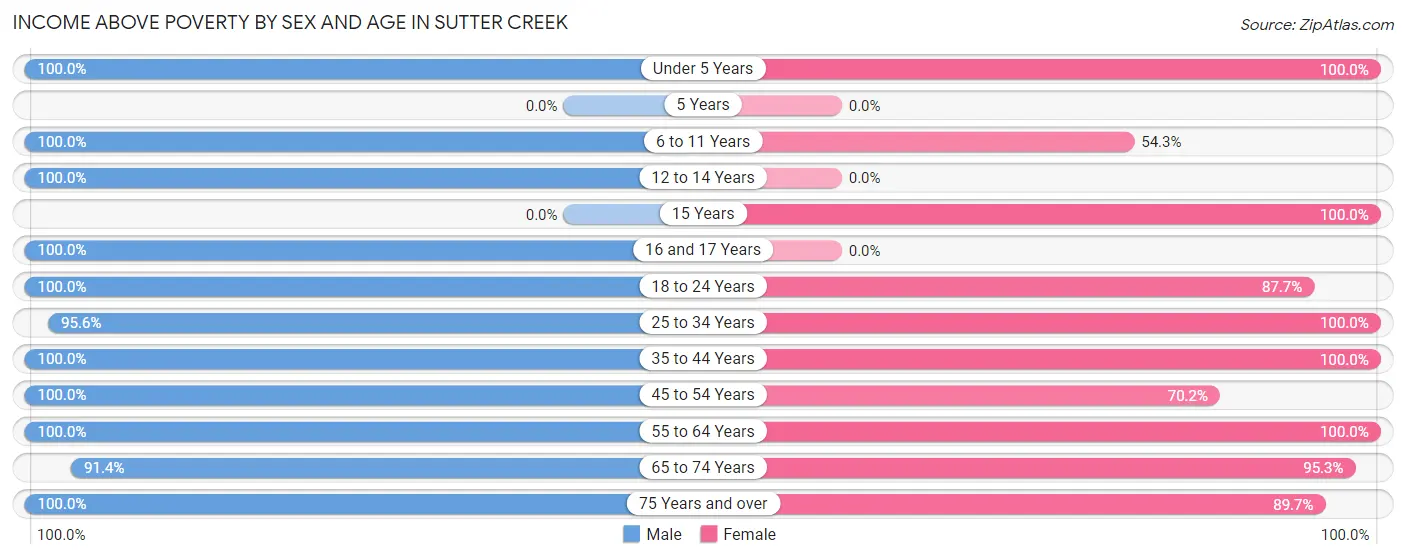
Income Above Poverty by Sex and Age in Sutter Creek
According to the poverty statistics in Sutter Creek, males aged under 5 years and females aged under 5 years are the age groups that are most secure financially, with 100.0% of males and 100.0% of females in these age groups living above the poverty line.
| Age Bracket | Male | Female |
| Under 5 Years | 24 (100.0%) | 42 (100.0%) |
| 5 Years | 0 (0.0%) | 0 (0.0%) |
| 6 to 11 Years | 72 (100.0%) | 76 (54.3%) |
| 12 to 14 Years | 27 (100.0%) | 0 (0.0%) |
| 15 Years | 0 (0.0%) | 36 (100.0%) |
| 16 and 17 Years | 46 (100.0%) | 0 (0.0%) |
| 18 to 24 Years | 52 (100.0%) | 142 (87.6%) |
| 25 to 34 Years | 197 (95.6%) | 224 (100.0%) |
| 35 to 44 Years | 134 (100.0%) | 113 (100.0%) |
| 45 to 54 Years | 68 (100.0%) | 94 (70.2%) |
| 55 to 64 Years | 168 (100.0%) | 242 (100.0%) |
| 65 to 74 Years | 74 (91.4%) | 244 (95.3%) |
| 75 Years and over | 198 (100.0%) | 210 (89.7%) |
| Total | 1,060 (98.5%) | 1,423 (89.9%) |
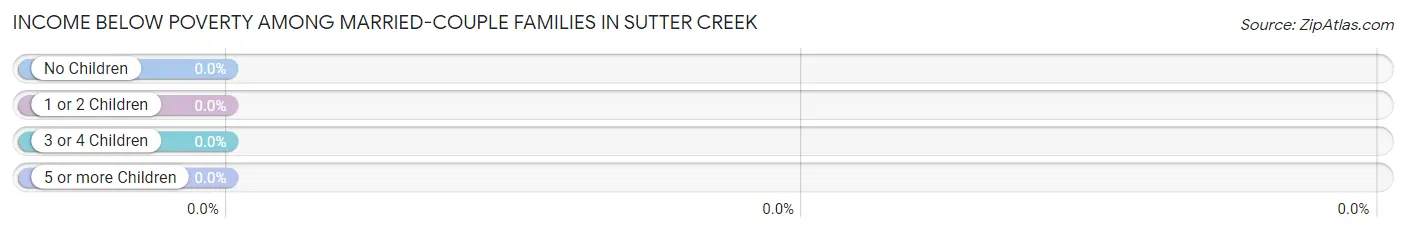
Income Below Poverty Among Married-Couple Families in Sutter Creek
| Children | Above Poverty | Below Poverty |
| No Children | 307 (100.0%) | 0 (0.0%) |
| 1 or 2 Children | 117 (100.0%) | 0 (0.0%) |
| 3 or 4 Children | 16 (100.0%) | 0 (0.0%) |
| 5 or more Children | 0 (0.0%) | 0 (0.0%) |
| Total | 440 (100.0%) | 0 (0.0%) |
Income Below Poverty Among Single-Parent Households in Sutter Creek
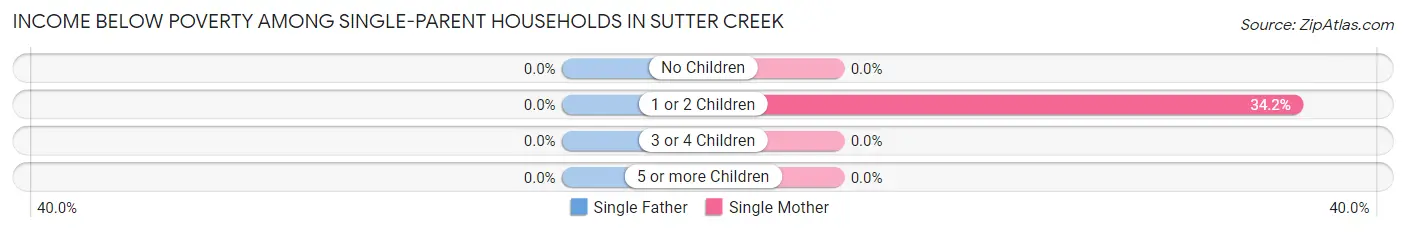
| Children | Single Father | Single Mother |
| No Children | 0 (0.0%) | 0 (0.0%) |
| 1 or 2 Children | 0 (0.0%) | 40 (34.2%) |
| 3 or 4 Children | 0 (0.0%) | 0 (0.0%) |
| 5 or more Children | 0 (0.0%) | 0 (0.0%) |
| Total | 0 (0.0%) | 40 (23.5%) |
Income Below Poverty Among Married-Couple vs Single-Parent Households in Sutter Creek
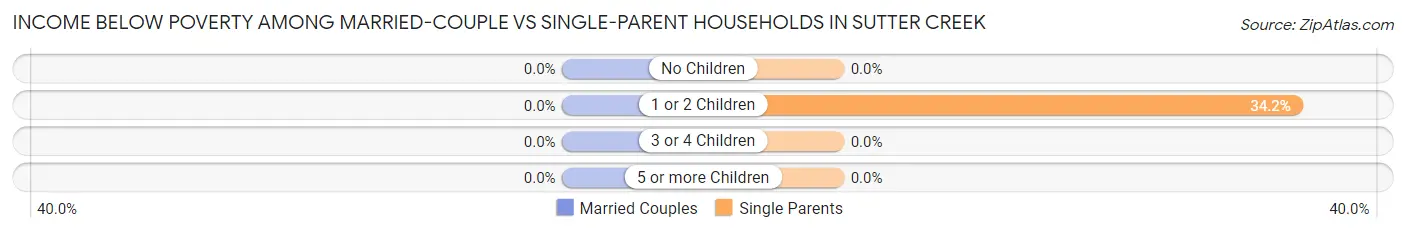
| Children | Married-Couple Families | Single-Parent Households |
| No Children | 0 (0.0%) | 0 (0.0%) |
| 1 or 2 Children | 0 (0.0%) | 40 (34.2%) |
| 3 or 4 Children | 0 (0.0%) | 0 (0.0%) |
| 5 or more Children | 0 (0.0%) | 0 (0.0%) |
| Total | 0 (0.0%) | 40 (19.0%) |
Race in Sutter Creek
The most populous races in Sutter Creek are White / Caucasian (2,263 | 85.1%), Two or more Races (338 | 12.7%), and Hispanic or Latino (211 | 7.9%).
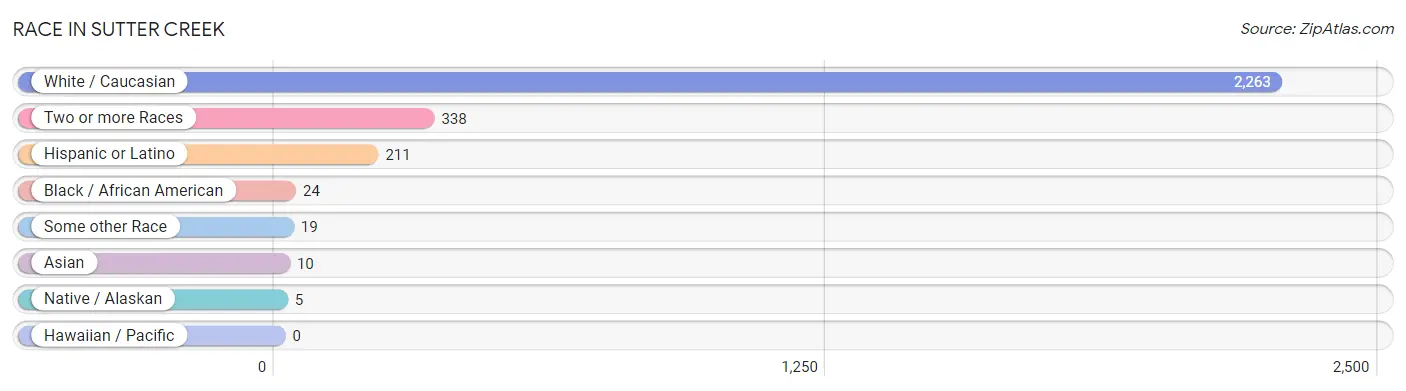
| Race | # Population | % Population |
| Asian | 10 | 0.4% |
| Black / African American | 24 | 0.9% |
| Hawaiian / Pacific | 0 | 0.0% |
| Hispanic or Latino | 211 | 7.9% |
| Native / Alaskan | 5 | 0.2% |
| White / Caucasian | 2,263 | 85.1% |
| Two or more Races | 338 | 12.7% |
| Some other Race | 19 | 0.7% |
| Total | 2,659 | 100.0% |
Ancestry in Sutter Creek
The most populous ancestries reported in Sutter Creek are English (622 | 23.4%), German (462 | 17.4%), Italian (262 | 9.9%), European (236 | 8.9%), and Irish (196 | 7.4%), together accounting for 66.9% of all Sutter Creek residents.
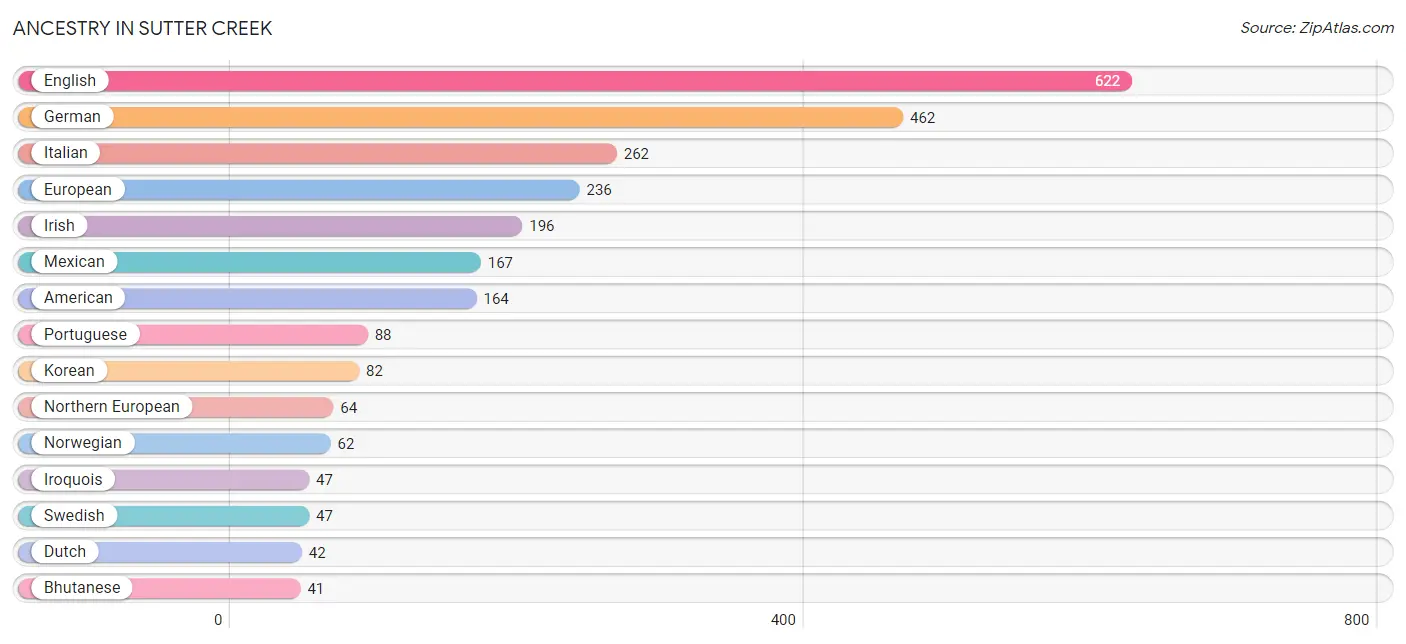
| Ancestry | # Population | % Population |
| American | 164 | 6.2% |
| Australian | 16 | 0.6% |
| Bhutanese | 41 | 1.5% |
| British | 5 | 0.2% |
| Danish | 13 | 0.5% |
| Dutch | 42 | 1.6% |
| English | 622 | 23.4% |
| European | 236 | 8.9% |
| Finnish | 12 | 0.4% |
| French | 6 | 0.2% |
| French Canadian | 16 | 0.6% |
| German | 462 | 17.4% |
| Indian (Asian) | 31 | 1.2% |
| Irish | 196 | 7.4% |
| Iroquois | 47 | 1.8% |
| Italian | 262 | 9.9% |
| Korean | 82 | 3.1% |
| Mexican | 167 | 6.3% |
| Native Hawaiian | 10 | 0.4% |
| Northern European | 64 | 2.4% |
| Norwegian | 62 | 2.3% |
| Portuguese | 88 | 3.3% |
| Samoan | 10 | 0.4% |
| Scotch-Irish | 4 | 0.2% |
| Scottish | 29 | 1.1% |
| Serbian | 5 | 0.2% |
| Spaniard | 37 | 1.4% |
| Swedish | 47 | 1.8% | View All 28 Rows |
Immigrants in Sutter Creek
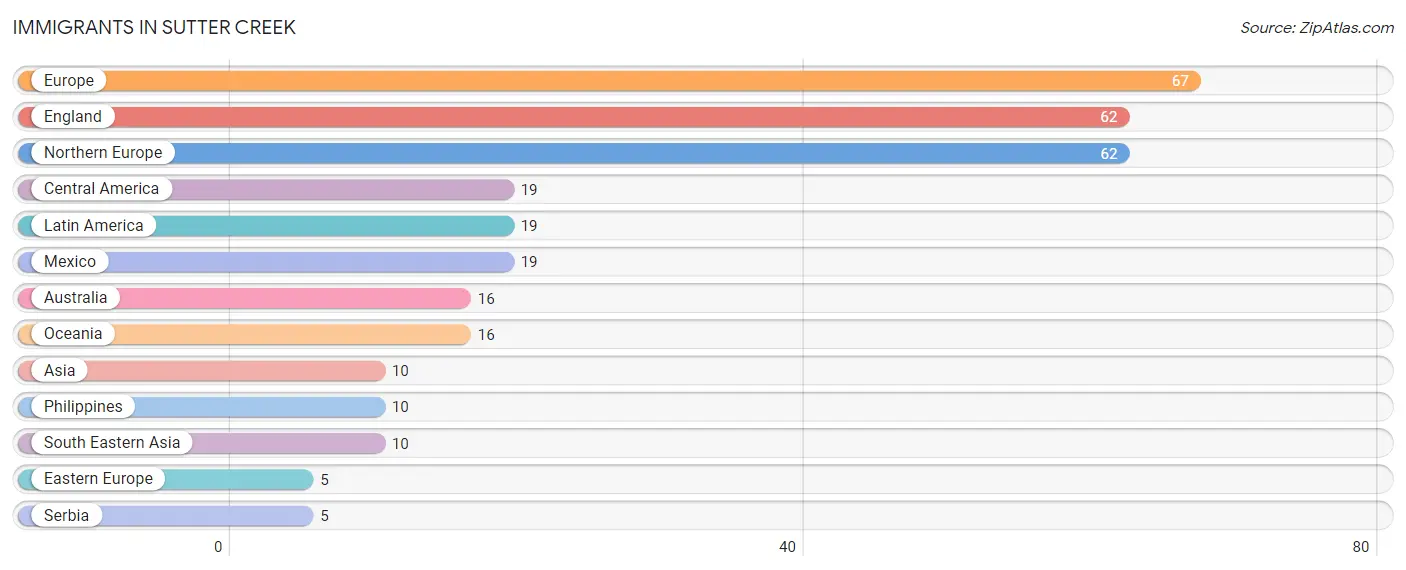
The most numerous immigrant groups reported in Sutter Creek came from Europe (67 | 2.5%), England (62 | 2.3%), Northern Europe (62 | 2.3%), Central America (19 | 0.7%), and Latin America (19 | 0.7%), together accounting for 8.6% of all Sutter Creek residents.
| Immigration Origin | # Population | % Population |
| Asia | 10 | 0.4% |
| Australia | 16 | 0.6% |
| Central America | 19 | 0.7% |
| Eastern Europe | 5 | 0.2% |
| England | 62 | 2.3% |
| Europe | 67 | 2.5% |
| Latin America | 19 | 0.7% |
| Mexico | 19 | 0.7% |
| Northern Europe | 62 | 2.3% |
| Oceania | 16 | 0.6% |
| Philippines | 10 | 0.4% |
| Serbia | 5 | 0.2% |
| South Eastern Asia | 10 | 0.4% | View All 13 Rows |
Sex and Age in Sutter Creek
Sex and Age in Sutter Creek
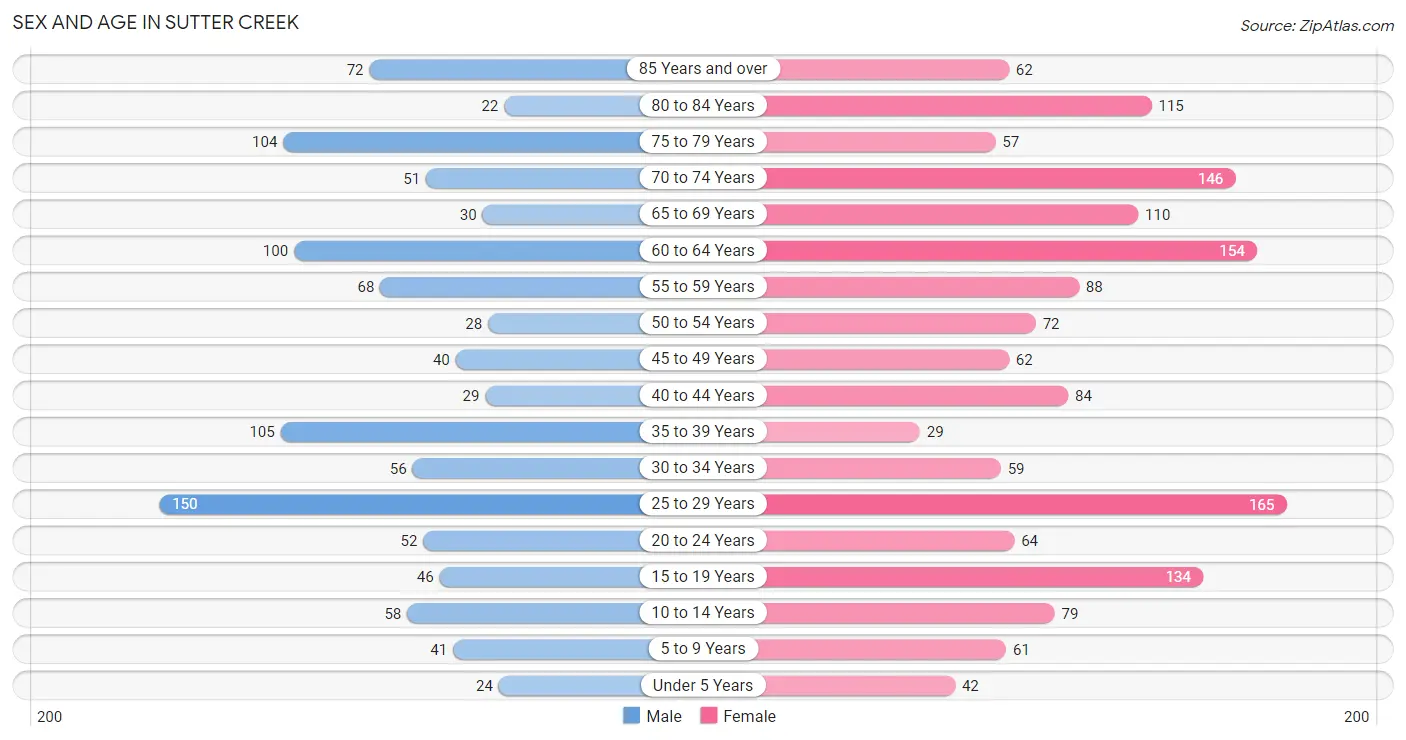
The most populous age groups in Sutter Creek are 25 to 29 Years (150 | 13.9%) for men and 25 to 29 Years (165 | 10.4%) for women.
| Age Bracket | Male | Female |
| Under 5 Years | 24 (2.2%) | 42 (2.6%) |
| 5 to 9 Years | 41 (3.8%) | 61 (3.8%) |
| 10 to 14 Years | 58 (5.4%) | 79 (5.0%) |
| 15 to 19 Years | 46 (4.3%) | 134 (8.5%) |
| 20 to 24 Years | 52 (4.8%) | 64 (4.0%) |
| 25 to 29 Years | 150 (13.9%) | 165 (10.4%) |
| 30 to 34 Years | 56 (5.2%) | 59 (3.7%) |
| 35 to 39 Years | 105 (9.8%) | 29 (1.8%) |
| 40 to 44 Years | 29 (2.7%) | 84 (5.3%) |
| 45 to 49 Years | 40 (3.7%) | 62 (3.9%) |
| 50 to 54 Years | 28 (2.6%) | 72 (4.5%) |
| 55 to 59 Years | 68 (6.3%) | 88 (5.6%) |
| 60 to 64 Years | 100 (9.3%) | 154 (9.7%) |
| 65 to 69 Years | 30 (2.8%) | 110 (7.0%) |
| 70 to 74 Years | 51 (4.7%) | 146 (9.2%) |
| 75 to 79 Years | 104 (9.7%) | 57 (3.6%) |
| 80 to 84 Years | 22 (2.0%) | 115 (7.3%) |
| 85 Years and over | 72 (6.7%) | 62 (3.9%) |
| Total | 1,076 (100.0%) | 1,583 (100.0%) |
Families and Households in Sutter Creek
Median Family Size in Sutter Creek
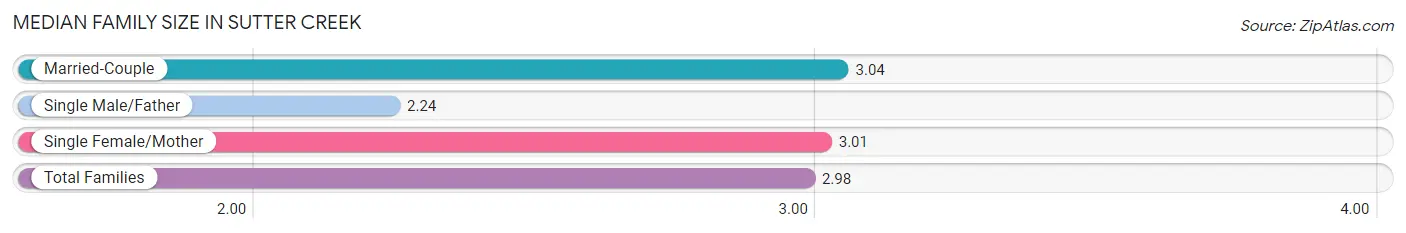
The median family size in Sutter Creek is 2.98 persons per family, with married-couple families (440 | 67.6%) accounting for the largest median family size of 3.04 persons per family. On the other hand, single male/father families (41 | 6.3%) represent the smallest median family size with 2.24 persons per family.
| Family Type | # Families | Family Size |
| Married-Couple | 440 (67.6%) | 3.04 |
| Single Male/Father | 41 (6.3%) | 2.24 |
| Single Female/Mother | 170 (26.1%) | 3.01 |
| Total Families | 651 (100.0%) | 2.98 |
Median Household Size in Sutter Creek
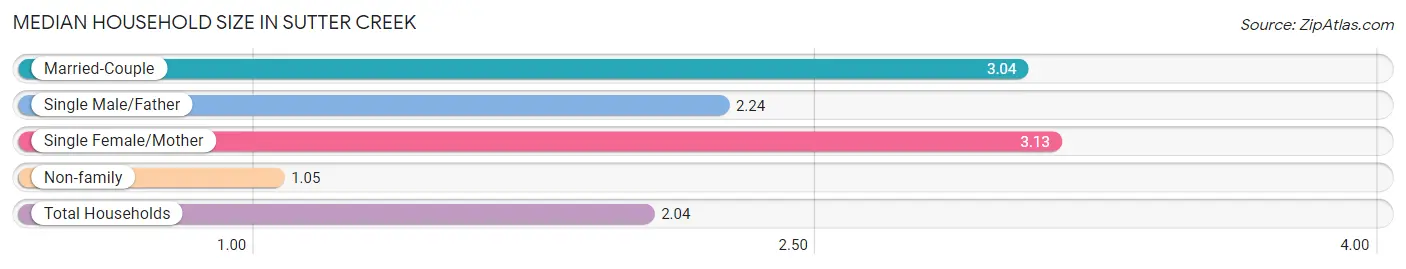
The median household size in Sutter Creek is 2.04 persons per household, with single female/mother households (170 | 13.1%) accounting for the largest median household size of 3.13 persons per household. non-family households (644 | 49.7%) represent the smallest median household size with 1.05 persons per household.
| Household Type | # Households | Household Size |
| Married-Couple | 440 (34.0%) | 3.04 |
| Single Male/Father | 41 (3.2%) | 2.24 |
| Single Female/Mother | 170 (13.1%) | 3.13 |
| Non-family | 644 (49.7%) | 1.05 |
| Total Households | 1,295 (100.0%) | 2.04 |
Household Size by Marriage Status in Sutter Creek
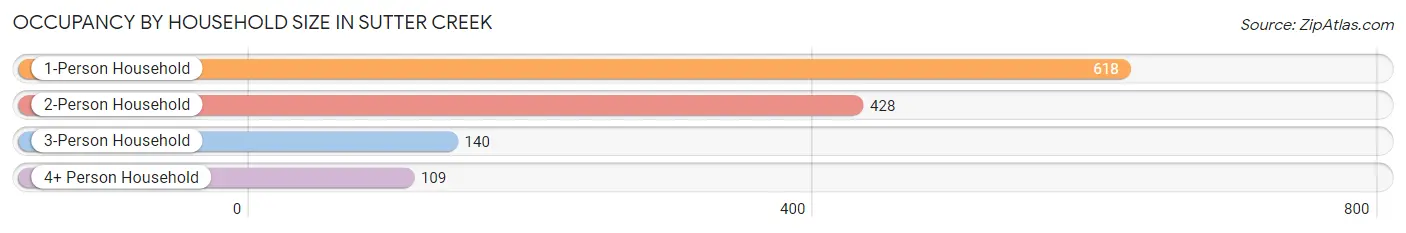
Out of a total of 1,295 households in Sutter Creek, 651 (50.3%) are family households, while 644 (49.7%) are nonfamily households. The most numerous type of family households are 2-person households, comprising 402, and the most common type of nonfamily households are 1-person households, comprising 618.
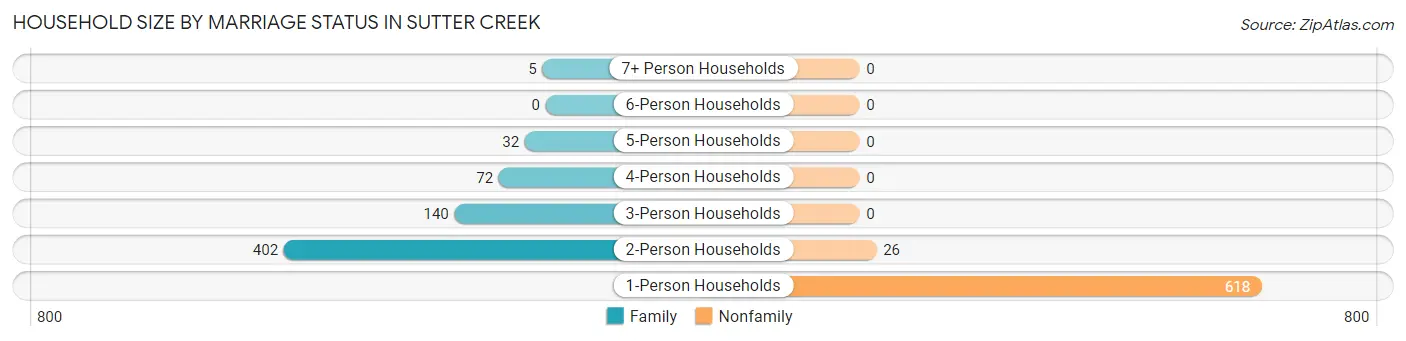
| Household Size | Family Households | Nonfamily Households |
| 1-Person Households | - | 618 (47.7%) |
| 2-Person Households | 402 (31.0%) | 26 (2.0%) |
| 3-Person Households | 140 (10.8%) | 0 (0.0%) |
| 4-Person Households | 72 (5.6%) | 0 (0.0%) |
| 5-Person Households | 32 (2.5%) | 0 (0.0%) |
| 6-Person Households | 0 (0.0%) | 0 (0.0%) |
| 7+ Person Households | 5 (0.4%) | 0 (0.0%) |
| Total | 651 (50.3%) | 644 (49.7%) |
Female Fertility in Sutter Creek
Fertility by Age in Sutter Creek
Average fertility rate in Sutter Creek is 31.0 births per 1,000 women. Women in the age bracket of 20 to 34 years have the highest fertility rate with 66.0 births per 1,000 women. Women in the age bracket of 20 to 34 years acount for 100.0% of all women with births.
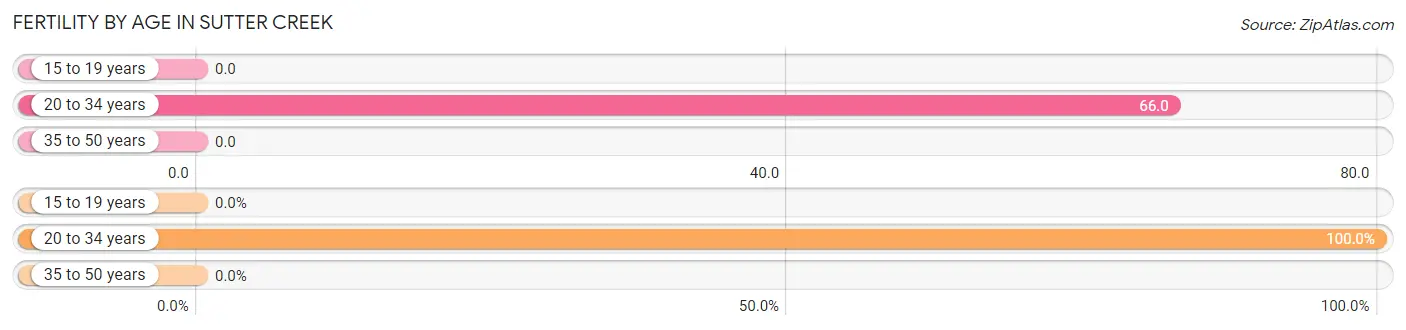
| Age Bracket | Women with Births | Births / 1,000 Women |
| 15 to 19 years | 0 (0.0%) | 0.0 |
| 20 to 34 years | 19 (100.0%) | 66.0 |
| 35 to 50 years | 0 (0.0%) | 0.0 |
| Total | 19 (100.0%) | 31.0 |
Fertility by Age by Marriage Status in Sutter Creek
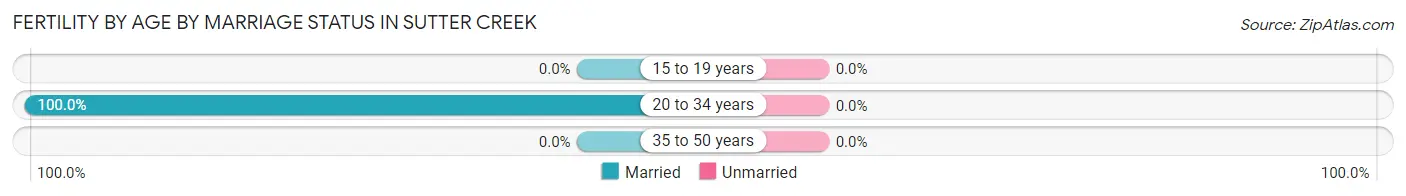
| Age Bracket | Married | Unmarried |
| 15 to 19 years | 0 (0.0%) | 0 (0.0%) |
| 20 to 34 years | 19 (100.0%) | 0 (0.0%) |
| 35 to 50 years | 0 (0.0%) | 0 (0.0%) |
| Total | 19 (100.0%) | 0 (0.0%) |
Fertility by Education in Sutter Creek
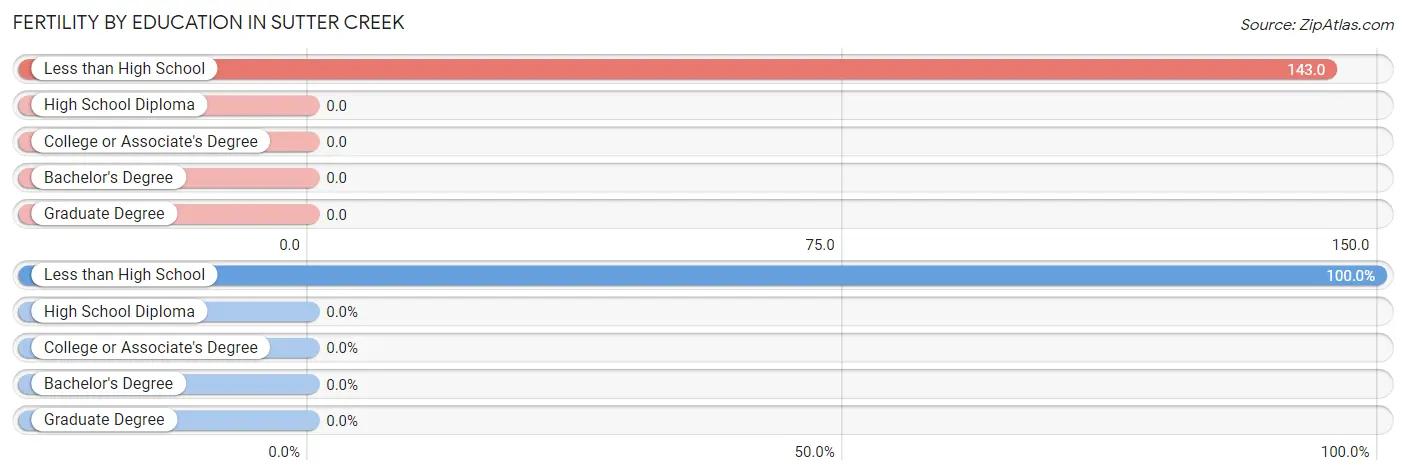
| Educational Attainment | Women with Births | Births / 1,000 Women |
| Less than High School | 19 (100.0%) | 143.0 |
| High School Diploma | 0 (0.0%) | 0.0 |
| College or Associate's Degree | 0 (0.0%) | 0.0 |
| Bachelor's Degree | 0 (0.0%) | 0.0 |
| Graduate Degree | 0 (0.0%) | 0.0 |
| Total | 19 (100.0%) | 31.0 |
Fertility by Education by Marriage Status in Sutter Creek
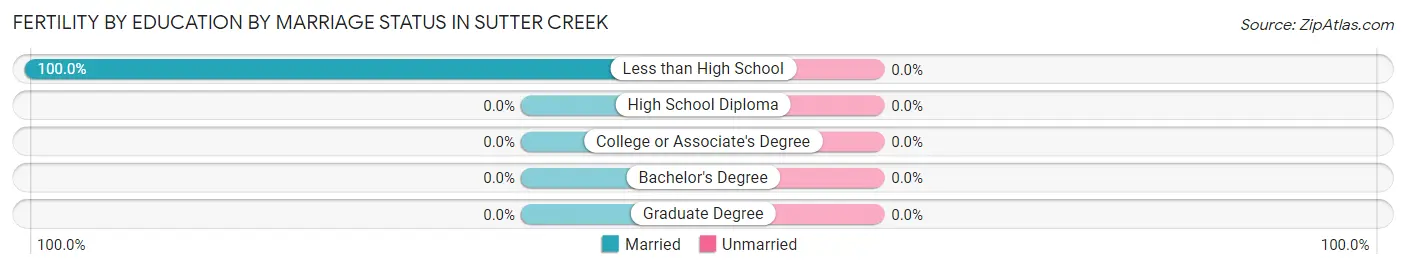
| Educational Attainment | Married | Unmarried |
| Less than High School | 19 (100.0%) | 0 (0.0%) |
| High School Diploma | 0 (0.0%) | 0 (0.0%) |
| College or Associate's Degree | 0 (0.0%) | 0 (0.0%) |
| Bachelor's Degree | 0 (0.0%) | 0 (0.0%) |
| Graduate Degree | 0 (0.0%) | 0 (0.0%) |
| Total | 19 (100.0%) | 0 (0.0%) |
Employment Characteristics in Sutter Creek
Employment by Class of Employer in Sutter Creek
Among the 1,132 employed individuals in Sutter Creek, private company employees (682 | 60.3%), local government employees (123 | 10.9%), and self-employed (not incorporated) (104 | 9.2%) make up the most common classes of employment.
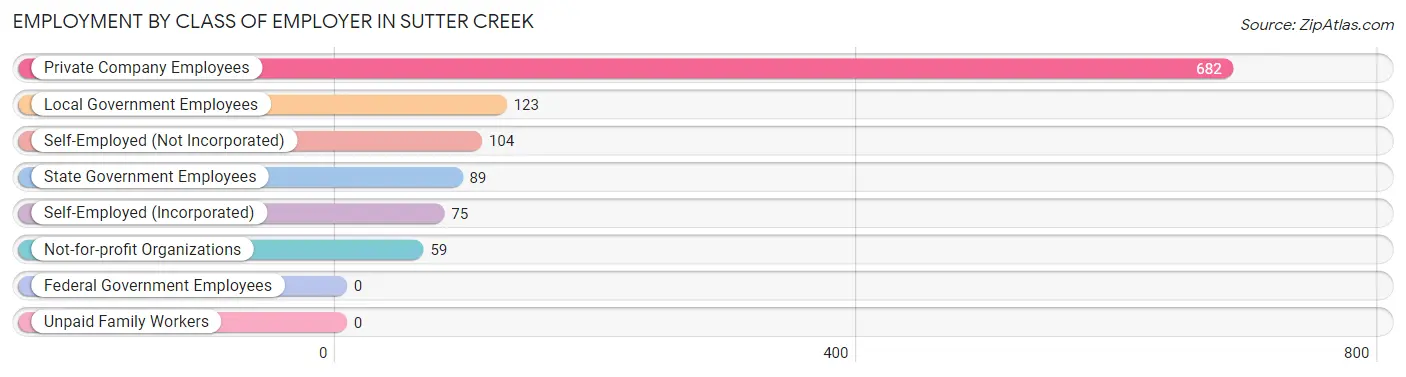
| Employer Class | # Employees | % Employees |
| Private Company Employees | 682 | 60.3% |
| Self-Employed (Incorporated) | 75 | 6.6% |
| Self-Employed (Not Incorporated) | 104 | 9.2% |
| Not-for-profit Organizations | 59 | 5.2% |
| Local Government Employees | 123 | 10.9% |
| State Government Employees | 89 | 7.9% |
| Federal Government Employees | 0 | 0.0% |
| Unpaid Family Workers | 0 | 0.0% |
| Total | 1,132 | 100.0% |
Employment Status by Age in Sutter Creek
According to the labor force statistics for Sutter Creek, out of the total population over 16 years of age (2,318), 53.6% or 1,242 individuals are in the labor force, with 7.6% or 94 of them unemployed. The age group with the highest labor force participation rate is 20 to 24 years, with 100.0% or 116 individuals in the labor force. Within the labor force, the 25 to 29 years age range has the highest percentage of unemployed individuals, with 27.4% or 83 of them being unemployed.
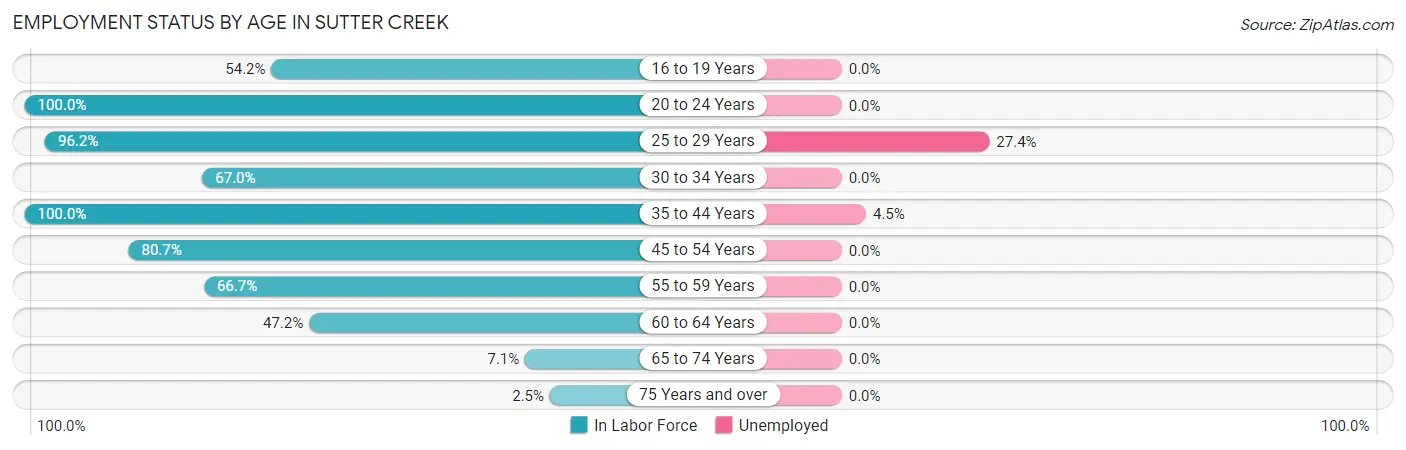
| Age Bracket | In Labor Force | Unemployed |
| 16 to 19 Years | 78 (54.2%) | 0 (0.0%) |
| 20 to 24 Years | 116 (100.0%) | 0 (0.0%) |
| 25 to 29 Years | 303 (96.2%) | 83 (27.4%) |
| 30 to 34 Years | 77 (67.0%) | 0 (0.0%) |
| 35 to 44 Years | 247 (100.0%) | 11 (4.5%) |
| 45 to 54 Years | 163 (80.7%) | 0 (0.0%) |
| 55 to 59 Years | 104 (66.7%) | 0 (0.0%) |
| 60 to 64 Years | 120 (47.2%) | 0 (0.0%) |
| 65 to 74 Years | 24 (7.1%) | 0 (0.0%) |
| 75 Years and over | 11 (2.5%) | 0 (0.0%) |
| Total | 1,242 (53.6%) | 94 (7.6%) |
Employment Status by Educational Attainment in Sutter Creek
According to labor force statistics for Sutter Creek, 78.7% of individuals (1,014) out of the total population between 25 and 64 years of age (1,289) are in the labor force, with 9.3% or 94 of them being unemployed. The group with the highest labor force participation rate are those with the educational attainment of bachelor's degree or higher, with 91.0% or 488 individuals in the labor force. Within the labor force, individuals with bachelor's degree or higher education have the highest percentage of unemployment, with 17.0% or 83 of them being unemployed.
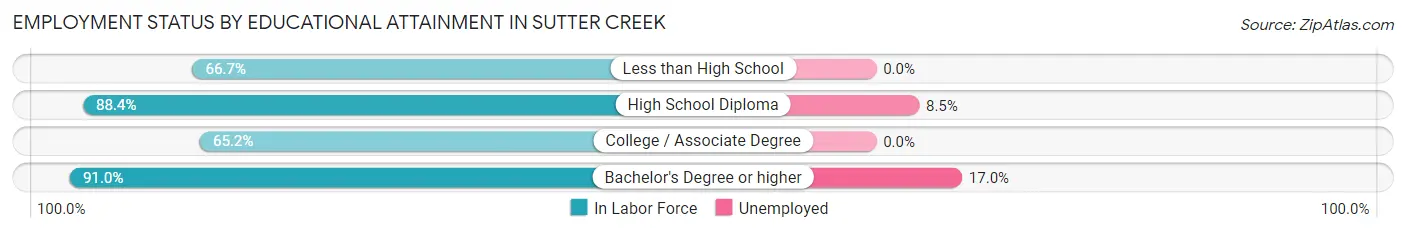
| Educational Attainment | In Labor Force | Unemployed |
| Less than High School | 30 (66.7%) | 0 (0.0%) |
| High School Diploma | 130 (88.4%) | 12 (8.5%) |
| College / Associate Degree | 366 (65.2%) | 0 (0.0%) |
| Bachelor's Degree or higher | 488 (91.0%) | 91 (17.0%) |
| Total | 1,014 (78.7%) | 120 (9.3%) |
Employment Occupations by Sex in Sutter Creek
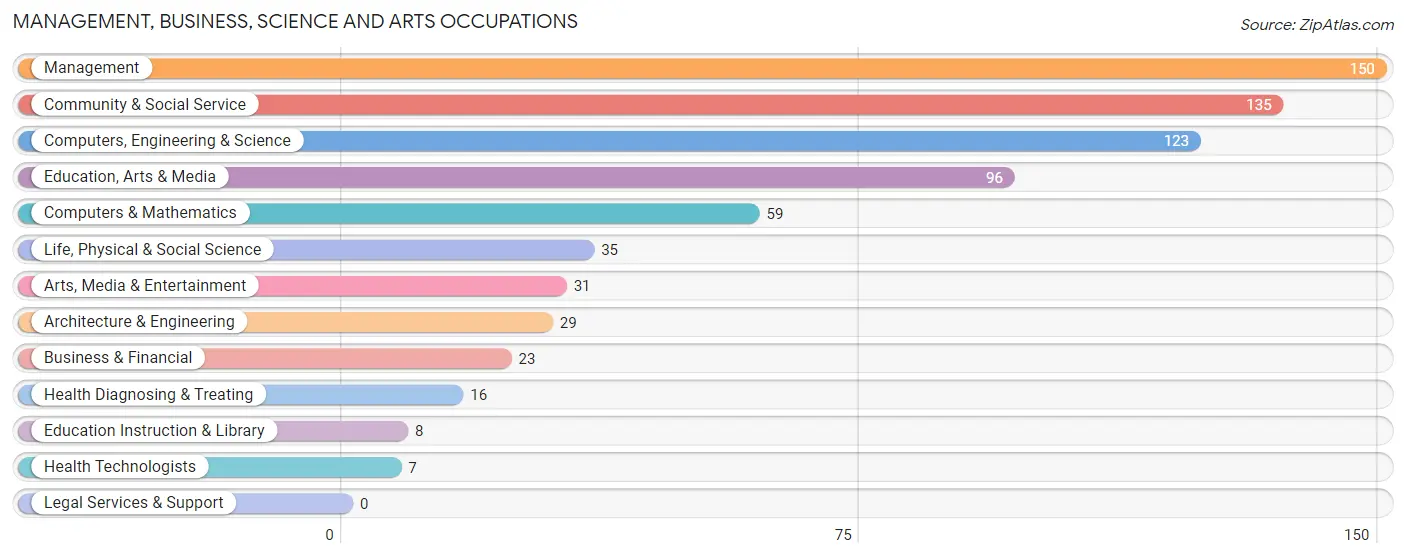
Management, Business, Science and Arts Occupations
The most common Management, Business, Science and Arts occupations in Sutter Creek are Management (150 | 13.1%), Community & Social Service (135 | 11.7%), Computers, Engineering & Science (123 | 10.7%), Education, Arts & Media (96 | 8.4%), and Computers & Mathematics (59 | 5.1%).
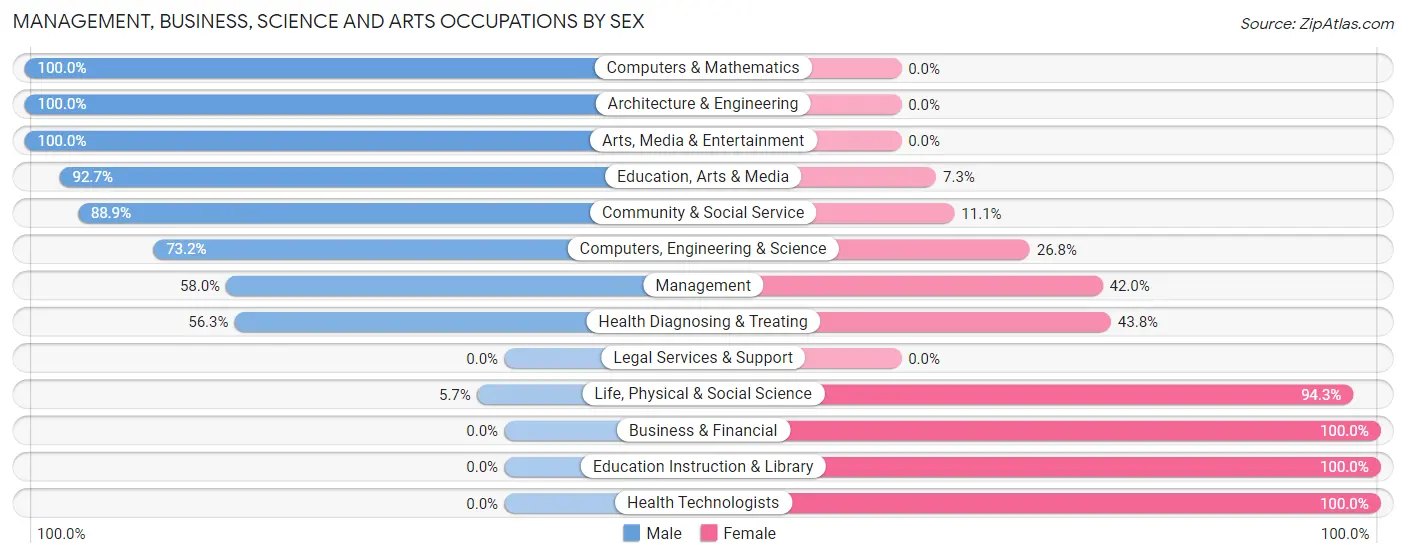
Management, Business, Science and Arts Occupations by Sex
Within the Management, Business, Science and Arts occupations in Sutter Creek, the most male-oriented occupations are Computers & Mathematics (100.0%), Architecture & Engineering (100.0%), and Arts, Media & Entertainment (100.0%), while the most female-oriented occupations are Business & Financial (100.0%), Education Instruction & Library (100.0%), and Health Technologists (100.0%).
| Occupation | Male | Female |
| Management | 87 (58.0%) | 63 (42.0%) |
| Business & Financial | 0 (0.0%) | 23 (100.0%) |
| Computers, Engineering & Science | 90 (73.2%) | 33 (26.8%) |
| Computers & Mathematics | 59 (100.0%) | 0 (0.0%) |
| Architecture & Engineering | 29 (100.0%) | 0 (0.0%) |
| Life, Physical & Social Science | 2 (5.7%) | 33 (94.3%) |
| Community & Social Service | 120 (88.9%) | 15 (11.1%) |
| Education, Arts & Media | 89 (92.7%) | 7 (7.3%) |
| Legal Services & Support | 0 (0.0%) | 0 (0.0%) |
| Education Instruction & Library | 0 (0.0%) | 8 (100.0%) |
| Arts, Media & Entertainment | 31 (100.0%) | 0 (0.0%) |
| Health Diagnosing & Treating | 9 (56.2%) | 7 (43.8%) |
| Health Technologists | 0 (0.0%) | 7 (100.0%) |
| Total (Category) | 306 (68.5%) | 141 (31.5%) |
| Total (Overall) | 571 (49.7%) | 578 (50.3%) |
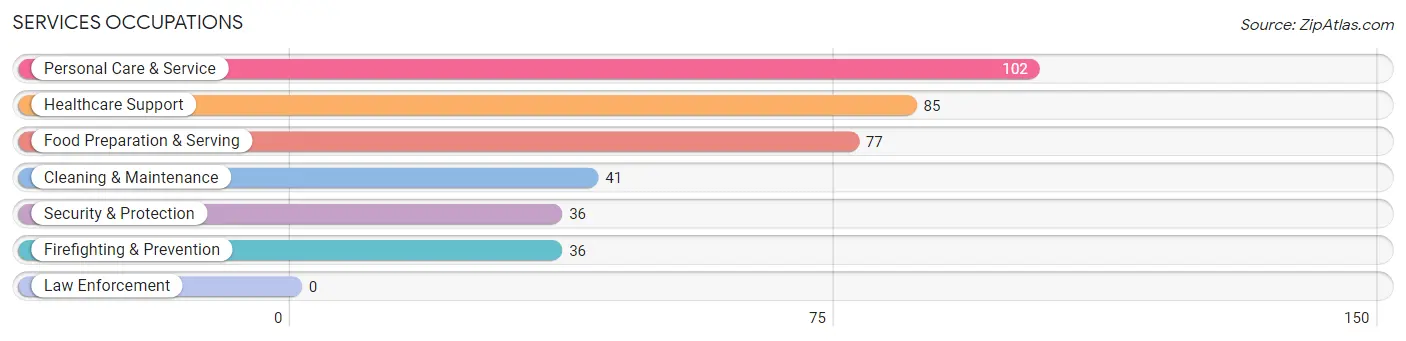
Services Occupations
The most common Services occupations in Sutter Creek are Personal Care & Service (102 | 8.9%), Healthcare Support (85 | 7.4%), Food Preparation & Serving (77 | 6.7%), Cleaning & Maintenance (41 | 3.6%), and Security & Protection (36 | 3.1%).
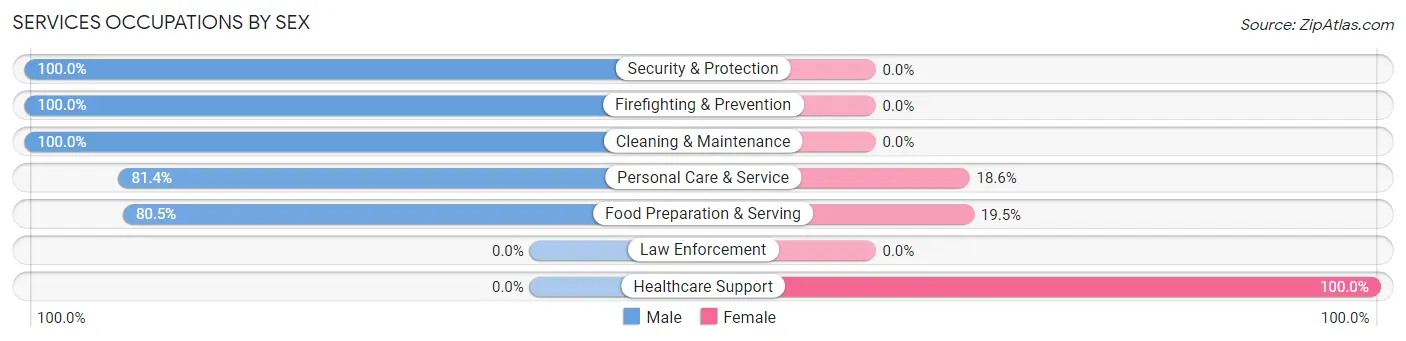
Services Occupations by Sex
Within the Services occupations in Sutter Creek, the most male-oriented occupations are Security & Protection (100.0%), Firefighting & Prevention (100.0%), and Cleaning & Maintenance (100.0%), while the most female-oriented occupations are Healthcare Support (100.0%), Food Preparation & Serving (19.5%), and Personal Care & Service (18.6%).
| Occupation | Male | Female |
| Healthcare Support | 0 (0.0%) | 85 (100.0%) |
| Security & Protection | 36 (100.0%) | 0 (0.0%) |
| Firefighting & Prevention | 36 (100.0%) | 0 (0.0%) |
| Law Enforcement | 0 (0.0%) | 0 (0.0%) |
| Food Preparation & Serving | 62 (80.5%) | 15 (19.5%) |
| Cleaning & Maintenance | 41 (100.0%) | 0 (0.0%) |
| Personal Care & Service | 83 (81.4%) | 19 (18.6%) |
| Total (Category) | 222 (65.1%) | 119 (34.9%) |
| Total (Overall) | 571 (49.7%) | 578 (50.3%) |
Sales and Office Occupations
The most common Sales and Office occupations in Sutter Creek are Sales & Related (263 | 22.9%), and Office & Administration (62 | 5.4%).
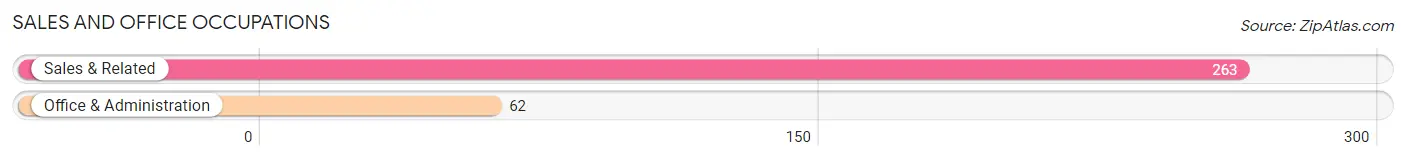
Sales and Office Occupations by Sex
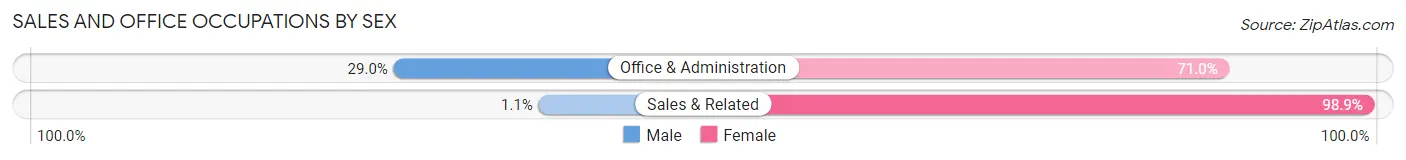
| Occupation | Male | Female |
| Sales & Related | 3 (1.1%) | 260 (98.9%) |
| Office & Administration | 18 (29.0%) | 44 (71.0%) |
| Total (Category) | 21 (6.5%) | 304 (93.5%) |
| Total (Overall) | 571 (49.7%) | 578 (50.3%) |
Natural Resources, Construction and Maintenance Occupations
The most common Natural Resources, Construction and Maintenance occupations in Sutter Creek are Installation, Maintenance & Repair (25 | 2.2%), and Construction & Extraction (3 | 0.3%).
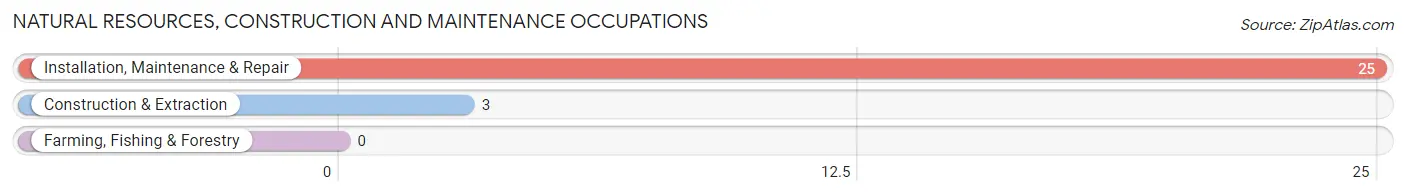
Natural Resources, Construction and Maintenance Occupations by Sex
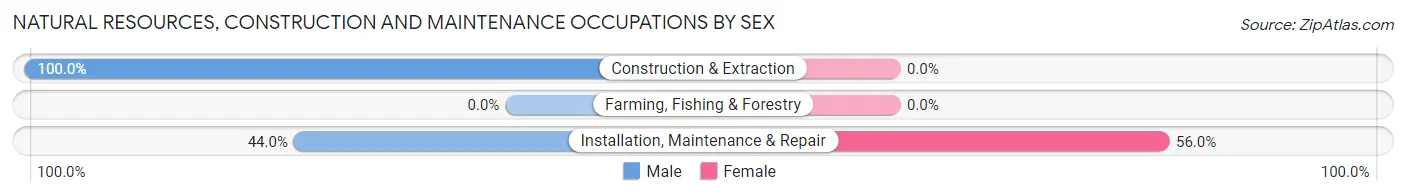
| Occupation | Male | Female |
| Farming, Fishing & Forestry | 0 (0.0%) | 0 (0.0%) |
| Construction & Extraction | 3 (100.0%) | 0 (0.0%) |
| Installation, Maintenance & Repair | 11 (44.0%) | 14 (56.0%) |
| Total (Category) | 14 (50.0%) | 14 (50.0%) |
| Total (Overall) | 571 (49.7%) | 578 (50.3%) |
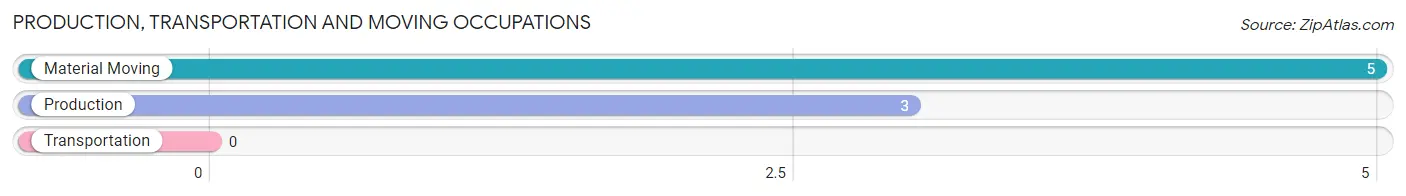
Production, Transportation and Moving Occupations
The most common Production, Transportation and Moving occupations in Sutter Creek are Material Moving (5 | 0.4%), and Production (3 | 0.3%).
Production, Transportation and Moving Occupations by Sex
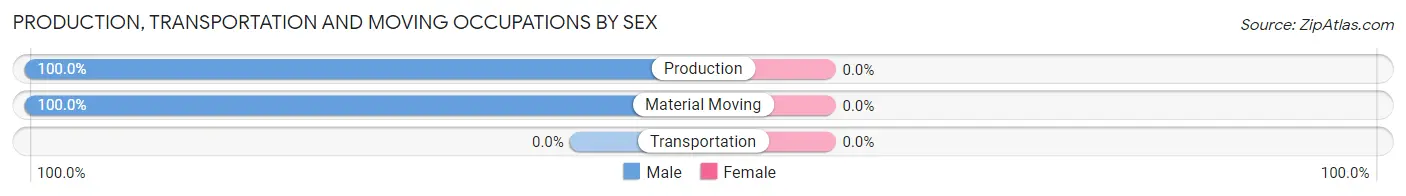
| Occupation | Male | Female |
| Production | 3 (100.0%) | 0 (0.0%) |
| Transportation | 0 (0.0%) | 0 (0.0%) |
| Material Moving | 5 (100.0%) | 0 (0.0%) |
| Total (Category) | 8 (100.0%) | 0 (0.0%) |
| Total (Overall) | 571 (49.7%) | 578 (50.3%) |
Employment Industries by Sex in Sutter Creek
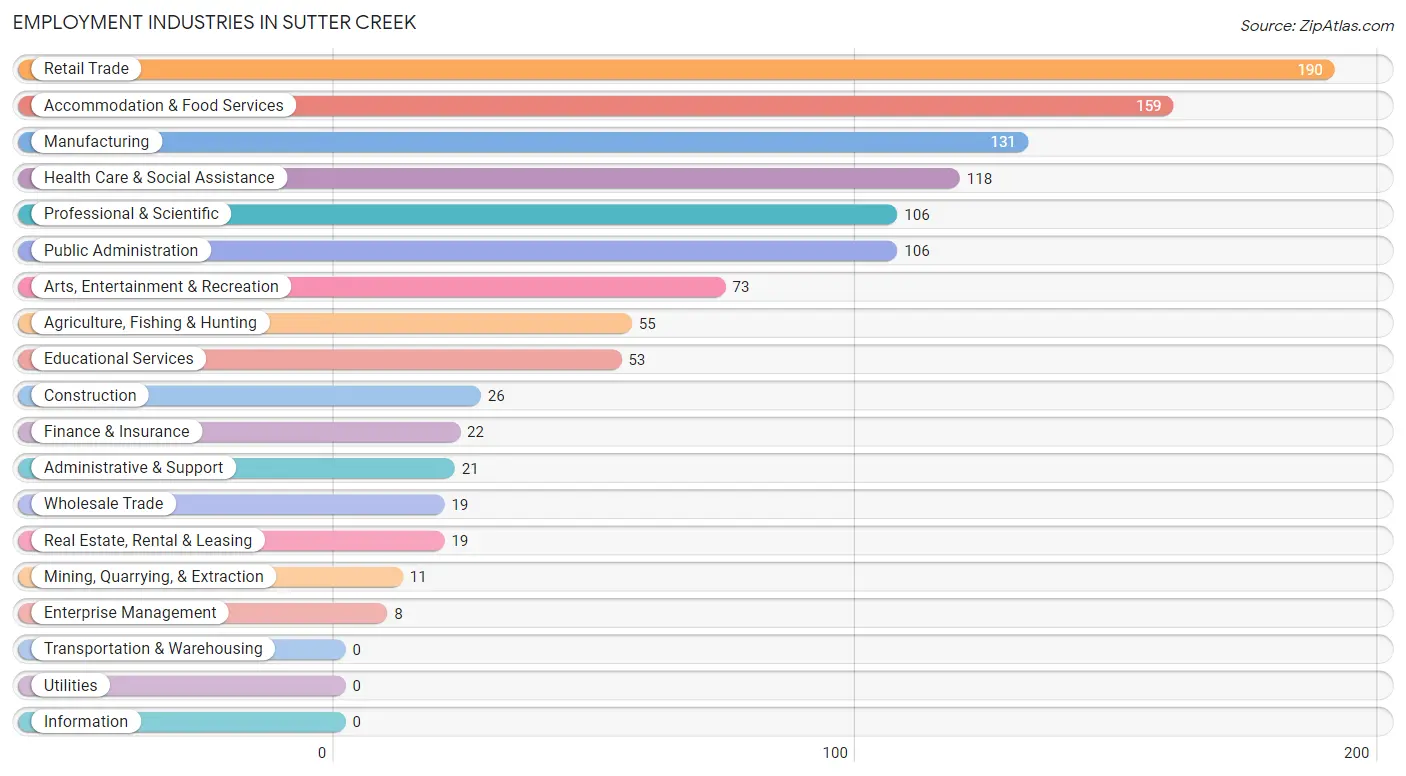
Employment Industries in Sutter Creek
The major employment industries in Sutter Creek include Retail Trade (190 | 16.5%), Accommodation & Food Services (159 | 13.8%), Manufacturing (131 | 11.4%), Health Care & Social Assistance (118 | 10.3%), and Professional & Scientific (106 | 9.2%).
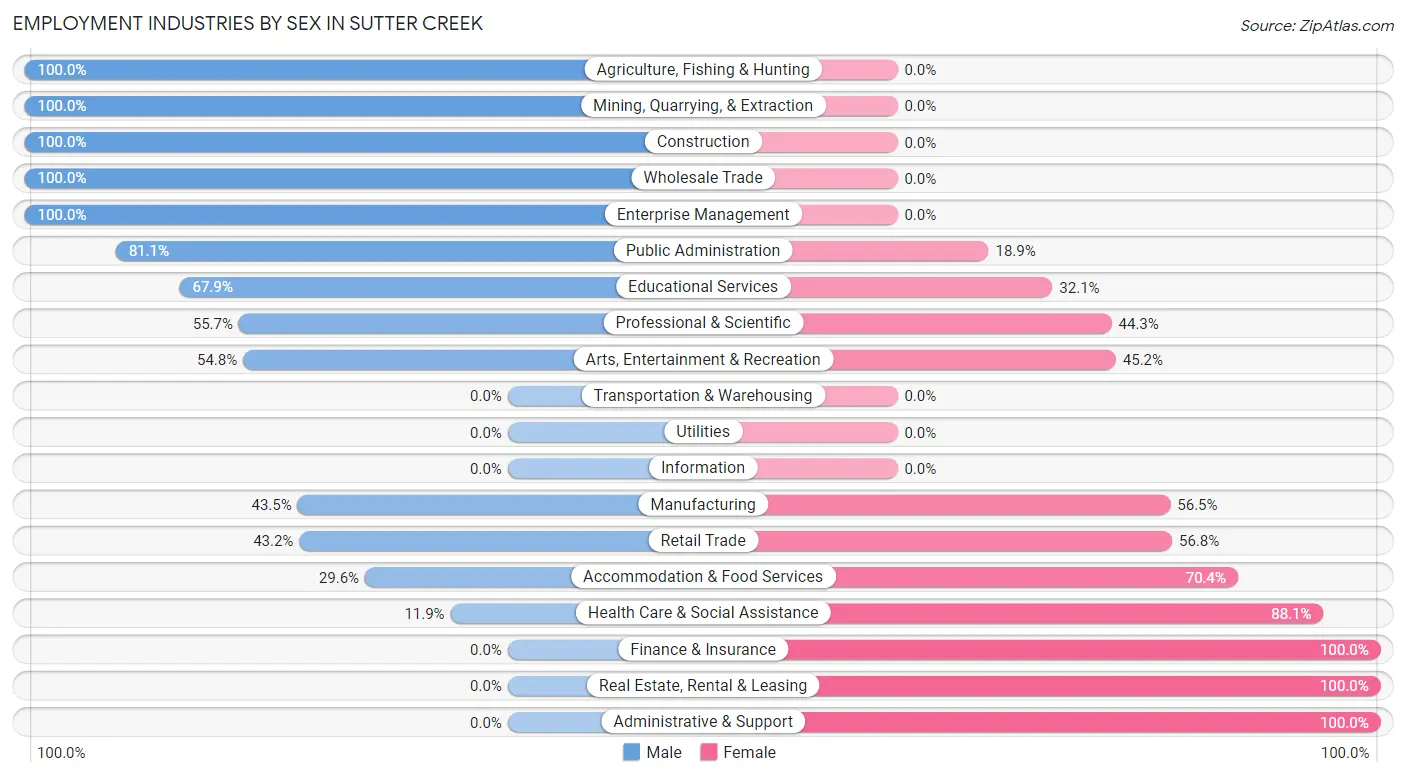
Employment Industries by Sex in Sutter Creek
The Sutter Creek industries that see more men than women are Agriculture, Fishing & Hunting (100.0%), Mining, Quarrying, & Extraction (100.0%), and Construction (100.0%), whereas the industries that tend to have a higher number of women are Finance & Insurance (100.0%), Real Estate, Rental & Leasing (100.0%), and Administrative & Support (100.0%).
| Industry | Male | Female |
| Agriculture, Fishing & Hunting | 55 (100.0%) | 0 (0.0%) |
| Mining, Quarrying, & Extraction | 11 (100.0%) | 0 (0.0%) |
| Construction | 26 (100.0%) | 0 (0.0%) |
| Manufacturing | 57 (43.5%) | 74 (56.5%) |
| Wholesale Trade | 19 (100.0%) | 0 (0.0%) |
| Retail Trade | 82 (43.2%) | 108 (56.8%) |
| Transportation & Warehousing | 0 (0.0%) | 0 (0.0%) |
| Utilities | 0 (0.0%) | 0 (0.0%) |
| Information | 0 (0.0%) | 0 (0.0%) |
| Finance & Insurance | 0 (0.0%) | 22 (100.0%) |
| Real Estate, Rental & Leasing | 0 (0.0%) | 19 (100.0%) |
| Professional & Scientific | 59 (55.7%) | 47 (44.3%) |
| Enterprise Management | 8 (100.0%) | 0 (0.0%) |
| Administrative & Support | 0 (0.0%) | 21 (100.0%) |
| Educational Services | 36 (67.9%) | 17 (32.1%) |
| Health Care & Social Assistance | 14 (11.9%) | 104 (88.1%) |
| Arts, Entertainment & Recreation | 40 (54.8%) | 33 (45.2%) |
| Accommodation & Food Services | 47 (29.6%) | 112 (70.4%) |
| Public Administration | 86 (81.1%) | 20 (18.9%) |
| Total | 571 (49.7%) | 578 (50.3%) |
Education in Sutter Creek
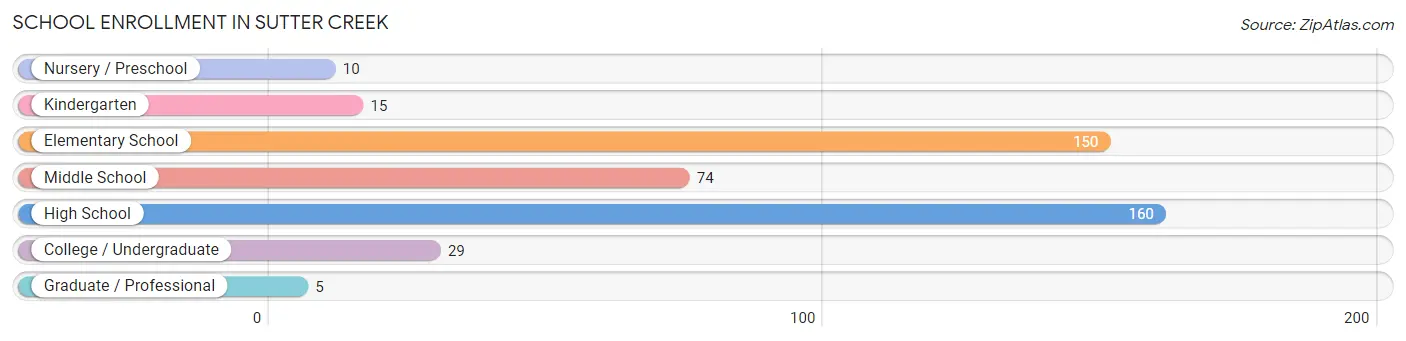
School Enrollment in Sutter Creek
The most common levels of schooling among the 443 students in Sutter Creek are high school (160 | 36.1%), elementary school (150 | 33.9%), and middle school (74 | 16.7%).
| School Level | # Students | % Students |
| Nursery / Preschool | 10 | 2.3% |
| Kindergarten | 15 | 3.4% |
| Elementary School | 150 | 33.9% |
| Middle School | 74 | 16.7% |
| High School | 160 | 36.1% |
| College / Undergraduate | 29 | 6.6% |
| Graduate / Professional | 5 | 1.1% |
| Total | 443 | 100.0% |
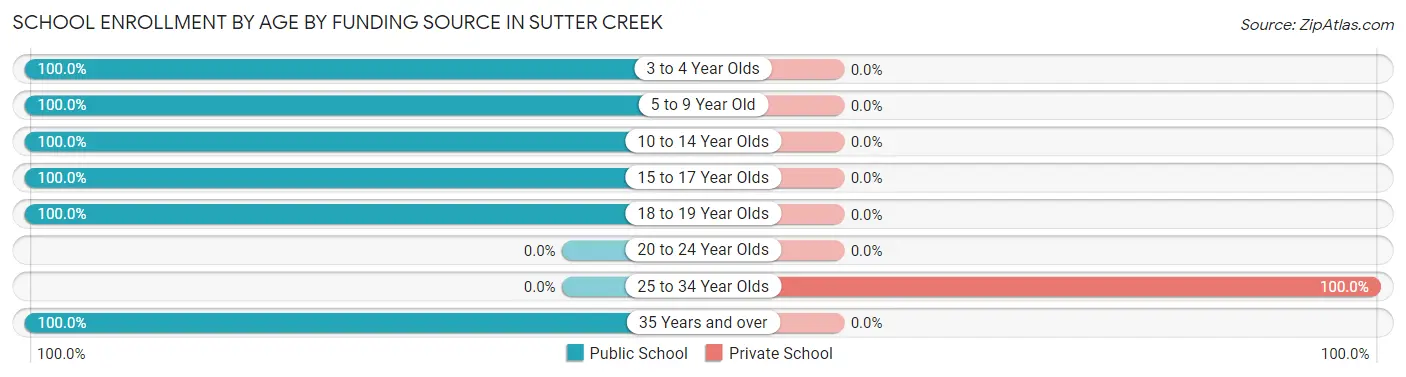
School Enrollment by Age by Funding Source in Sutter Creek
Out of a total of 443 students who are enrolled in schools in Sutter Creek, 29 (6.5%) attend a private institution, while the remaining 414 (93.5%) are enrolled in public schools. The age group of 25 to 34 year olds has the highest likelihood of being enrolled in private schools, with 29 (100.0% in the age bracket) enrolled. Conversely, the age group of 3 to 4 year olds has the lowest likelihood of being enrolled in a private school, with 10 (100.0% in the age bracket) attending a public institution.
| Age Bracket | Public School | Private School |
| 3 to 4 Year Olds | 10 (100.0%) | 0 (0.0%) |
| 5 to 9 Year Old | 102 (100.0%) | 0 (0.0%) |
| 10 to 14 Year Olds | 137 (100.0%) | 0 (0.0%) |
| 15 to 17 Year Olds | 82 (100.0%) | 0 (0.0%) |
| 18 to 19 Year Olds | 78 (100.0%) | 0 (0.0%) |
| 20 to 24 Year Olds | 0 (0.0%) | 0 (0.0%) |
| 25 to 34 Year Olds | 0 (0.0%) | 29 (100.0%) |
| 35 Years and over | 5 (100.0%) | 0 (0.0%) |
| Total | 414 (93.5%) | 29 (6.5%) |
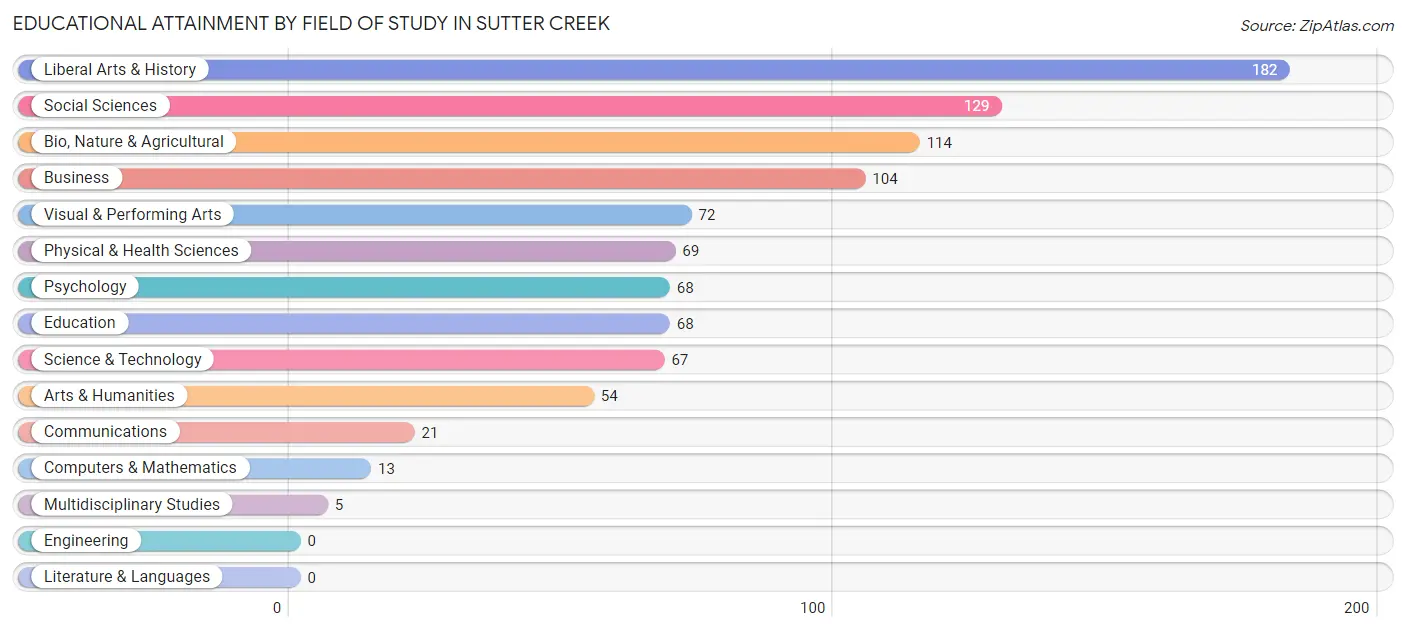
Educational Attainment by Field of Study in Sutter Creek
Liberal arts & history (182 | 18.8%), social sciences (129 | 13.4%), bio, nature & agricultural (114 | 11.8%), business (104 | 10.8%), and visual & performing arts (72 | 7.4%) are the most common fields of study among 966 individuals in Sutter Creek who have obtained a bachelor's degree or higher.
| Field of Study | # Graduates | % Graduates |
| Computers & Mathematics | 13 | 1.3% |
| Bio, Nature & Agricultural | 114 | 11.8% |
| Physical & Health Sciences | 69 | 7.1% |
| Psychology | 68 | 7.0% |
| Social Sciences | 129 | 13.4% |
| Engineering | 0 | 0.0% |
| Multidisciplinary Studies | 5 | 0.5% |
| Science & Technology | 67 | 6.9% |
| Business | 104 | 10.8% |
| Education | 68 | 7.0% |
| Literature & Languages | 0 | 0.0% |
| Liberal Arts & History | 182 | 18.8% |
| Visual & Performing Arts | 72 | 7.4% |
| Communications | 21 | 2.2% |
| Arts & Humanities | 54 | 5.6% |
| Total | 966 | 100.0% |
Transportation & Commute in Sutter Creek
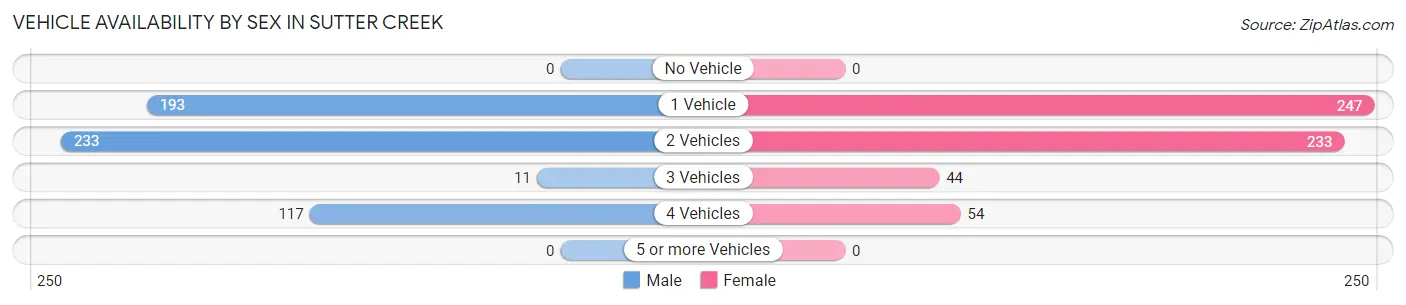
Vehicle Availability by Sex in Sutter Creek
The most prevalent vehicle ownership categories in Sutter Creek are males with 2 vehicles (233, accounting for 42.1%) and females with 2 vehicles (233, making up 40.3%).
| Vehicles Available | Male | Female |
| No Vehicle | 0 (0.0%) | 0 (0.0%) |
| 1 Vehicle | 193 (34.8%) | 247 (42.7%) |
| 2 Vehicles | 233 (42.1%) | 233 (40.3%) |
| 3 Vehicles | 11 (2.0%) | 44 (7.6%) |
| 4 Vehicles | 117 (21.1%) | 54 (9.3%) |
| 5 or more Vehicles | 0 (0.0%) | 0 (0.0%) |
| Total | 554 (100.0%) | 578 (100.0%) |
Commute Time in Sutter Creek
The most frequently occuring commute durations in Sutter Creek are 5 to 9 minutes (310 commuters, 35.1%), 45 to 59 minutes (189 commuters, 21.4%), and 10 to 14 minutes (157 commuters, 17.8%).
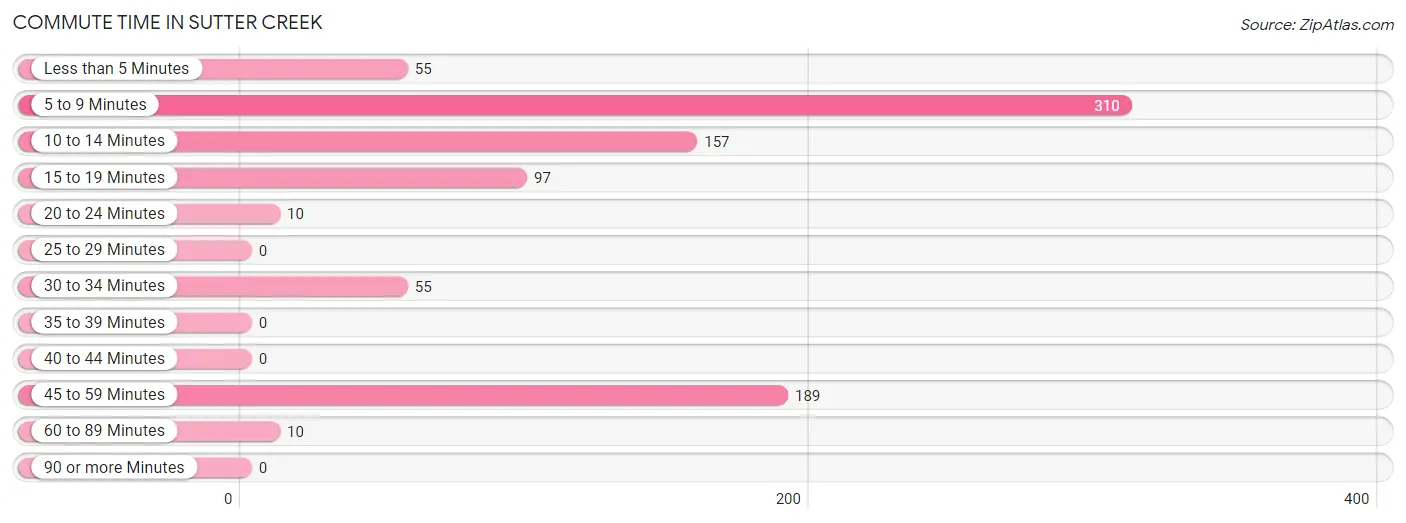
| Commute Time | # Commuters | % Commuters |
| Less than 5 Minutes | 55 | 6.2% |
| 5 to 9 Minutes | 310 | 35.1% |
| 10 to 14 Minutes | 157 | 17.8% |
| 15 to 19 Minutes | 97 | 11.0% |
| 20 to 24 Minutes | 10 | 1.1% |
| 25 to 29 Minutes | 0 | 0.0% |
| 30 to 34 Minutes | 55 | 6.2% |
| 35 to 39 Minutes | 0 | 0.0% |
| 40 to 44 Minutes | 0 | 0.0% |
| 45 to 59 Minutes | 189 | 21.4% |
| 60 to 89 Minutes | 10 | 1.1% |
| 90 or more Minutes | 0 | 0.0% |
Commute Time by Sex in Sutter Creek
The most common commute times in Sutter Creek are 45 to 59 minutes (181 commuters, 44.9%) for males and 5 to 9 minutes (205 commuters, 42.7%) for females.
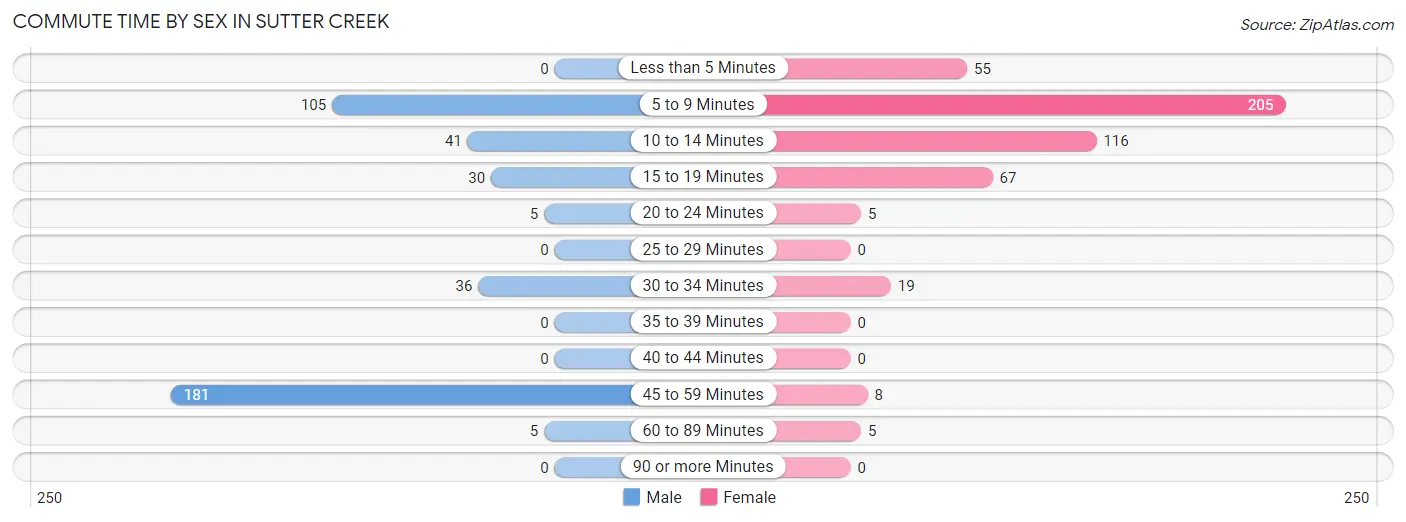
| Commute Time | Male | Female |
| Less than 5 Minutes | 0 (0.0%) | 55 (11.5%) |
| 5 to 9 Minutes | 105 (26.1%) | 205 (42.7%) |
| 10 to 14 Minutes | 41 (10.2%) | 116 (24.2%) |
| 15 to 19 Minutes | 30 (7.4%) | 67 (14.0%) |
| 20 to 24 Minutes | 5 (1.2%) | 5 (1.0%) |
| 25 to 29 Minutes | 0 (0.0%) | 0 (0.0%) |
| 30 to 34 Minutes | 36 (8.9%) | 19 (4.0%) |
| 35 to 39 Minutes | 0 (0.0%) | 0 (0.0%) |
| 40 to 44 Minutes | 0 (0.0%) | 0 (0.0%) |
| 45 to 59 Minutes | 181 (44.9%) | 8 (1.7%) |
| 60 to 89 Minutes | 5 (1.2%) | 5 (1.0%) |
| 90 or more Minutes | 0 (0.0%) | 0 (0.0%) |
Time of Departure to Work by Sex in Sutter Creek
The most frequent times of departure to work in Sutter Creek are 12:00 AM to 4:59 AM (195, 48.4%) for males and 8:30 AM to 8:59 AM (149, 31.0%) for females.
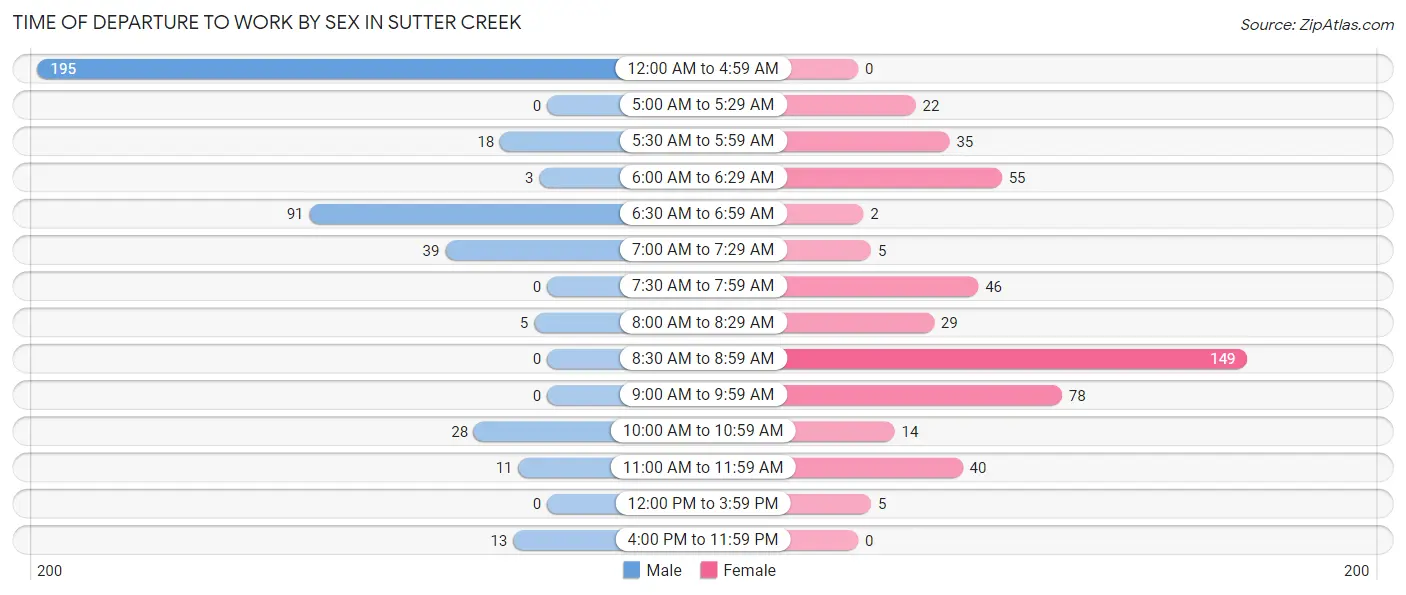
| Time of Departure | Male | Female |
| 12:00 AM to 4:59 AM | 195 (48.4%) | 0 (0.0%) |
| 5:00 AM to 5:29 AM | 0 (0.0%) | 22 (4.6%) |
| 5:30 AM to 5:59 AM | 18 (4.5%) | 35 (7.3%) |
| 6:00 AM to 6:29 AM | 3 (0.7%) | 55 (11.5%) |
| 6:30 AM to 6:59 AM | 91 (22.6%) | 2 (0.4%) |
| 7:00 AM to 7:29 AM | 39 (9.7%) | 5 (1.0%) |
| 7:30 AM to 7:59 AM | 0 (0.0%) | 46 (9.6%) |
| 8:00 AM to 8:29 AM | 5 (1.2%) | 29 (6.0%) |
| 8:30 AM to 8:59 AM | 0 (0.0%) | 149 (31.0%) |
| 9:00 AM to 9:59 AM | 0 (0.0%) | 78 (16.3%) |
| 10:00 AM to 10:59 AM | 28 (7.0%) | 14 (2.9%) |
| 11:00 AM to 11:59 AM | 11 (2.7%) | 40 (8.3%) |
| 12:00 PM to 3:59 PM | 0 (0.0%) | 5 (1.0%) |
| 4:00 PM to 11:59 PM | 13 (3.2%) | 0 (0.0%) |
| Total | 403 (100.0%) | 480 (100.0%) |
Housing Occupancy in Sutter Creek
Occupancy by Ownership in Sutter Creek
Of the total 1,295 dwellings in Sutter Creek, owner-occupied units account for 760 (58.7%), while renter-occupied units make up 535 (41.3%).
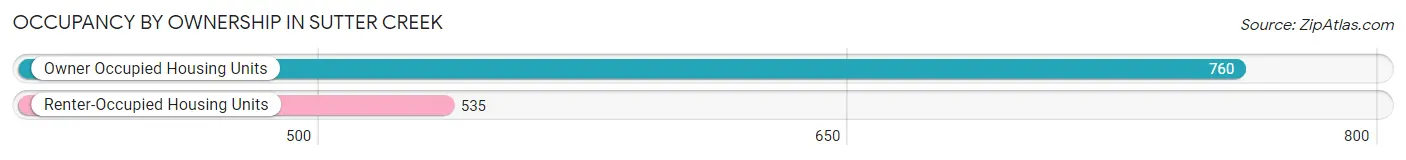
| Occupancy | # Housing Units | % Housing Units |
| Owner Occupied Housing Units | 760 | 58.7% |
| Renter-Occupied Housing Units | 535 | 41.3% |
| Total Occupied Housing Units | 1,295 | 100.0% |
Occupancy by Household Size in Sutter Creek
| Household Size | # Housing Units | % Housing Units |
| 1-Person Household | 618 | 47.7% |
| 2-Person Household | 428 | 33.1% |
| 3-Person Household | 140 | 10.8% |
| 4+ Person Household | 109 | 8.4% |
| Total Housing Units | 1,295 | 100.0% |
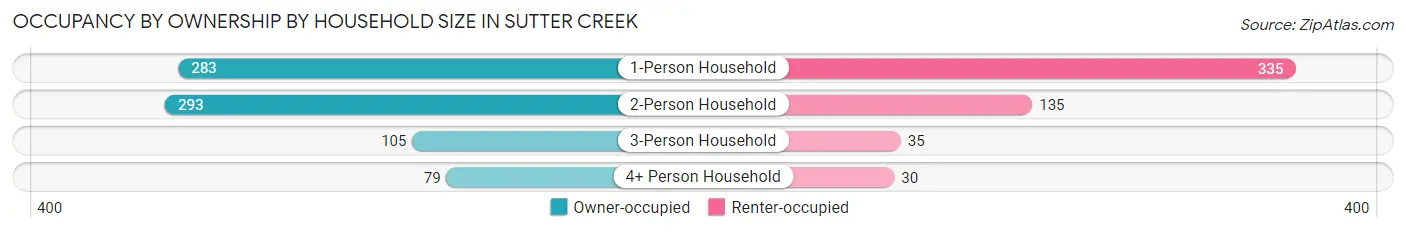
Occupancy by Ownership by Household Size in Sutter Creek
| Household Size | Owner-occupied | Renter-occupied |
| 1-Person Household | 283 (45.8%) | 335 (54.2%) |
| 2-Person Household | 293 (68.5%) | 135 (31.5%) |
| 3-Person Household | 105 (75.0%) | 35 (25.0%) |
| 4+ Person Household | 79 (72.5%) | 30 (27.5%) |
| Total Housing Units | 760 (58.7%) | 535 (41.3%) |
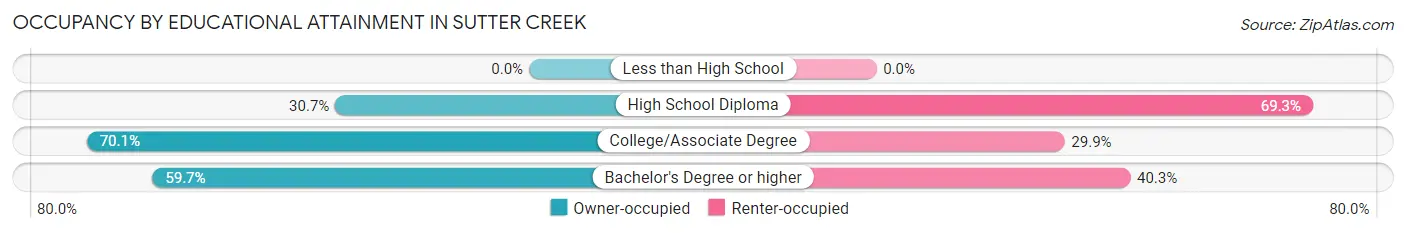
Occupancy by Educational Attainment in Sutter Creek
| Household Size | Owner-occupied | Renter-occupied |
| Less than High School | 0 (0.0%) | 0 (0.0%) |
| High School Diploma | 79 (30.7%) | 178 (69.3%) |
| College/Associate Degree | 411 (70.1%) | 175 (29.9%) |
| Bachelor's Degree or higher | 270 (59.7%) | 182 (40.3%) |
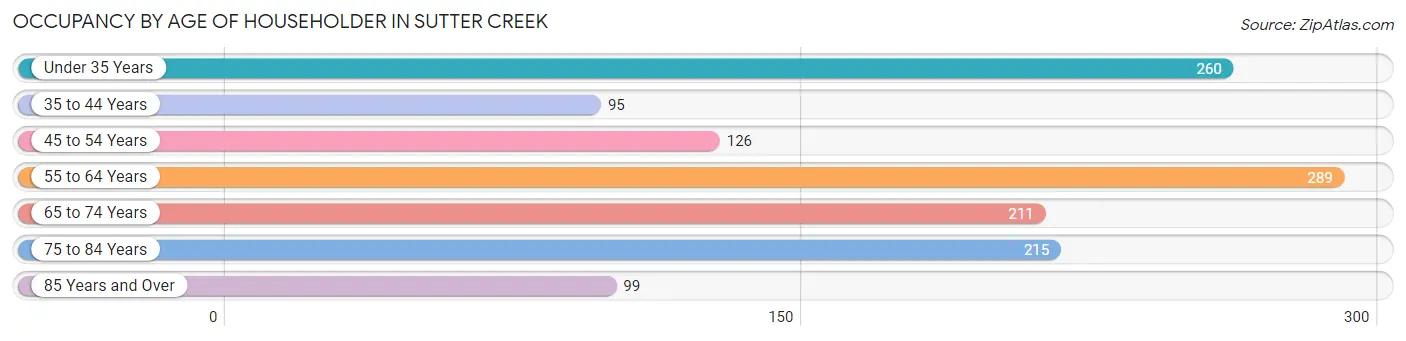
Occupancy by Age of Householder in Sutter Creek
| Age Bracket | # Households | % Households |
| Under 35 Years | 260 | 20.1% |
| 35 to 44 Years | 95 | 7.3% |
| 45 to 54 Years | 126 | 9.7% |
| 55 to 64 Years | 289 | 22.3% |
| 65 to 74 Years | 211 | 16.3% |
| 75 to 84 Years | 215 | 16.6% |
| 85 Years and Over | 99 | 7.6% |
| Total | 1,295 | 100.0% |
Housing Finances in Sutter Creek
Median Income by Occupancy in Sutter Creek
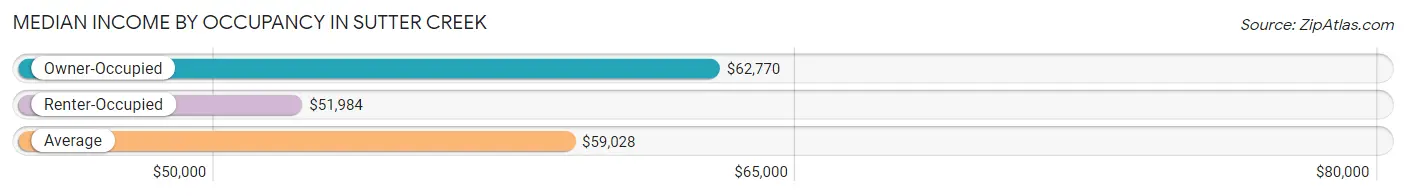
| Occupancy Type | # Households | Median Income |
| Owner-Occupied | 760 (58.7%) | $62,770 |
| Renter-Occupied | 535 (41.3%) | $51,984 |
| Average | 1,295 (100.0%) | $59,028 |
Occupancy by Householder Income Bracket in Sutter Creek
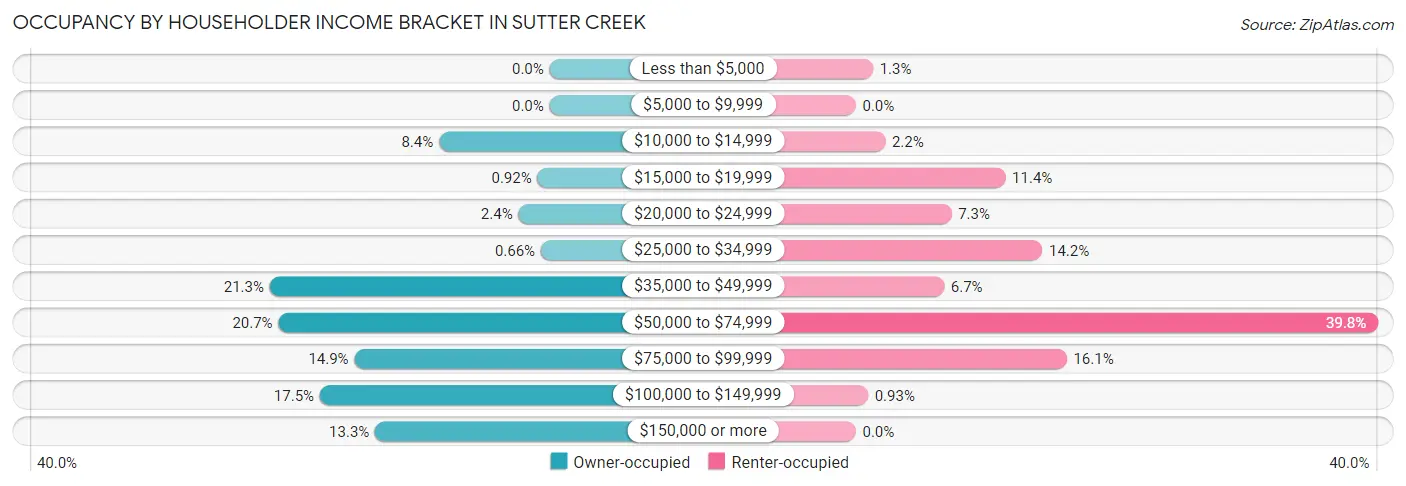
| Income Bracket | Owner-occupied | Renter-occupied |
| Less than $5,000 | 0 (0.0%) | 7 (1.3%) |
| $5,000 to $9,999 | 0 (0.0%) | 0 (0.0%) |
| $10,000 to $14,999 | 64 (8.4%) | 12 (2.2%) |
| $15,000 to $19,999 | 7 (0.9%) | 61 (11.4%) |
| $20,000 to $24,999 | 18 (2.4%) | 39 (7.3%) |
| $25,000 to $34,999 | 5 (0.7%) | 76 (14.2%) |
| $35,000 to $49,999 | 162 (21.3%) | 36 (6.7%) |
| $50,000 to $74,999 | 157 (20.7%) | 213 (39.8%) |
| $75,000 to $99,999 | 113 (14.9%) | 86 (16.1%) |
| $100,000 to $149,999 | 133 (17.5%) | 5 (0.9%) |
| $150,000 or more | 101 (13.3%) | 0 (0.0%) |
| Total | 760 (100.0%) | 535 (100.0%) |
Monthly Housing Cost Tiers in Sutter Creek
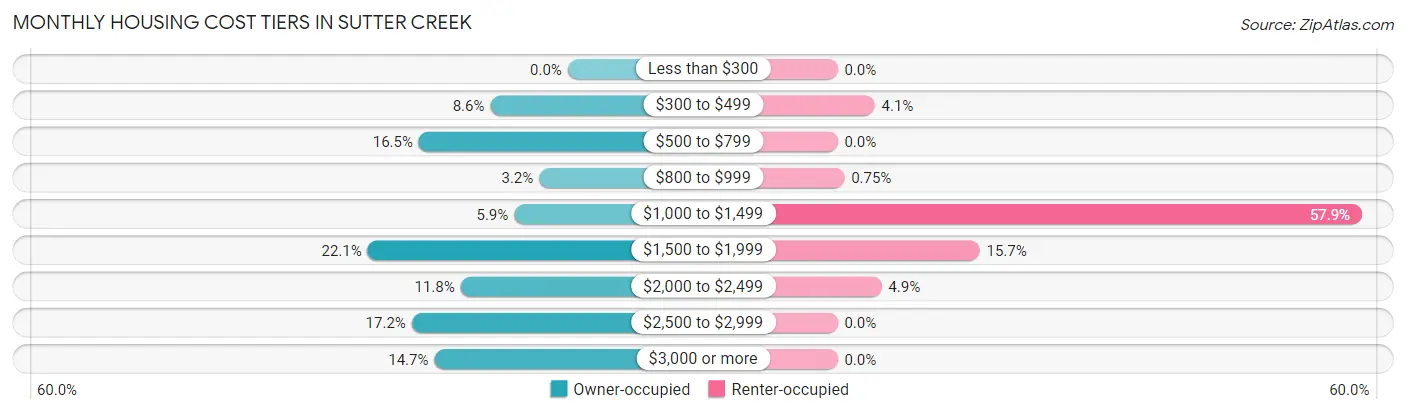
| Monthly Cost | Owner-occupied | Renter-occupied |
| Less than $300 | 0 (0.0%) | 0 (0.0%) |
| $300 to $499 | 65 (8.6%) | 22 (4.1%) |
| $500 to $799 | 125 (16.5%) | 0 (0.0%) |
| $800 to $999 | 24 (3.2%) | 4 (0.7%) |
| $1,000 to $1,499 | 45 (5.9%) | 310 (57.9%) |
| $1,500 to $1,999 | 168 (22.1%) | 84 (15.7%) |
| $2,000 to $2,499 | 90 (11.8%) | 26 (4.9%) |
| $2,500 to $2,999 | 131 (17.2%) | 0 (0.0%) |
| $3,000 or more | 112 (14.7%) | 0 (0.0%) |
| Total | 760 (100.0%) | 535 (100.0%) |
Physical Housing Characteristics in Sutter Creek
Housing Structures in Sutter Creek
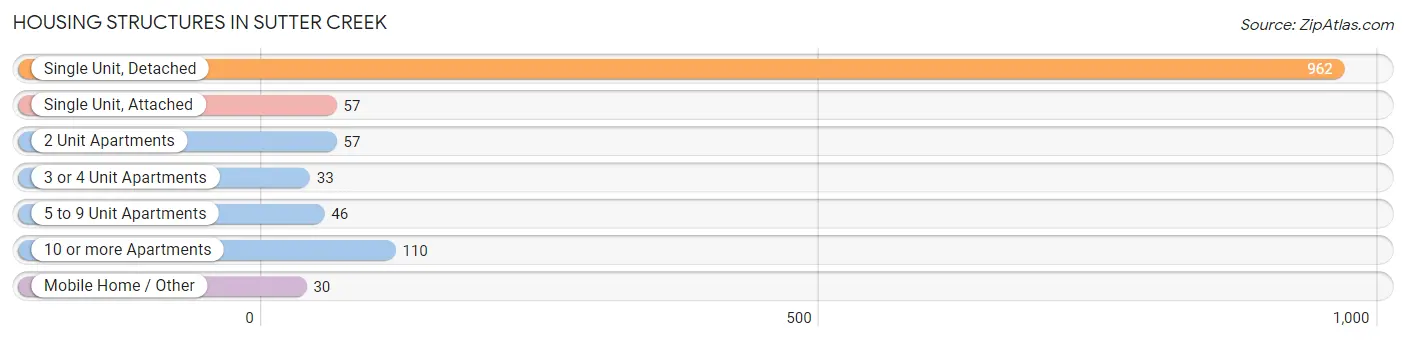
| Structure Type | # Housing Units | % Housing Units |
| Single Unit, Detached | 962 | 74.3% |
| Single Unit, Attached | 57 | 4.4% |
| 2 Unit Apartments | 57 | 4.4% |
| 3 or 4 Unit Apartments | 33 | 2.5% |
| 5 to 9 Unit Apartments | 46 | 3.5% |
| 10 or more Apartments | 110 | 8.5% |
| Mobile Home / Other | 30 | 2.3% |
| Total | 1,295 | 100.0% |
Housing Structures by Occupancy in Sutter Creek
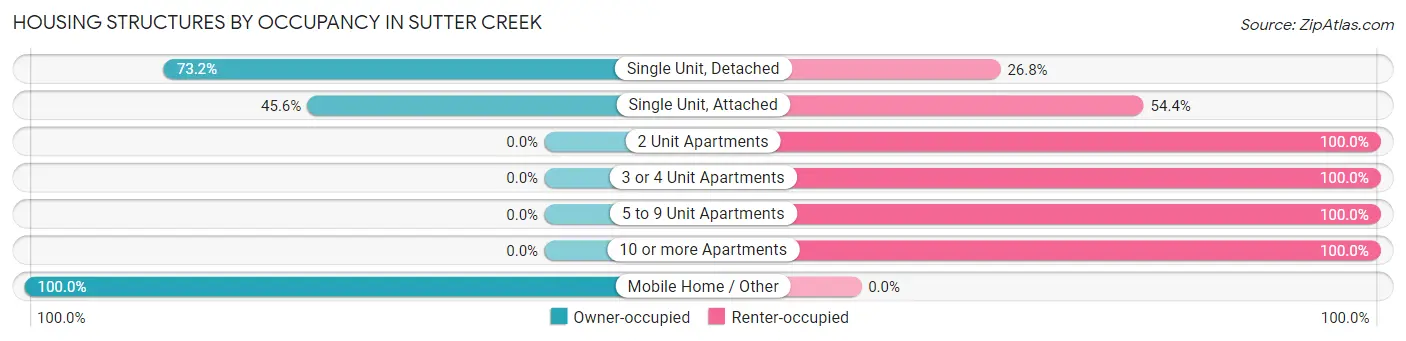
| Structure Type | Owner-occupied | Renter-occupied |
| Single Unit, Detached | 704 (73.2%) | 258 (26.8%) |
| Single Unit, Attached | 26 (45.6%) | 31 (54.4%) |
| 2 Unit Apartments | 0 (0.0%) | 57 (100.0%) |
| 3 or 4 Unit Apartments | 0 (0.0%) | 33 (100.0%) |
| 5 to 9 Unit Apartments | 0 (0.0%) | 46 (100.0%) |
| 10 or more Apartments | 0 (0.0%) | 110 (100.0%) |
| Mobile Home / Other | 30 (100.0%) | 0 (0.0%) |
| Total | 760 (58.7%) | 535 (41.3%) |
Housing Structures by Number of Rooms in Sutter Creek
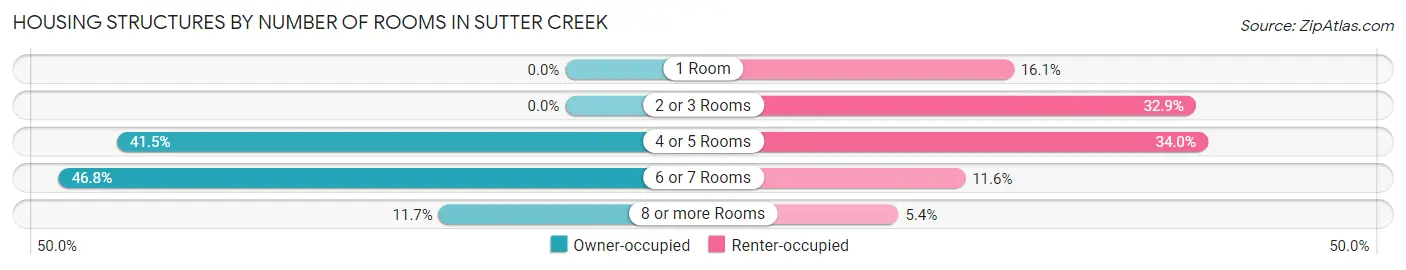
| Number of Rooms | Owner-occupied | Renter-occupied |
| 1 Room | 0 (0.0%) | 86 (16.1%) |
| 2 or 3 Rooms | 0 (0.0%) | 176 (32.9%) |
| 4 or 5 Rooms | 315 (41.4%) | 182 (34.0%) |
| 6 or 7 Rooms | 356 (46.8%) | 62 (11.6%) |
| 8 or more Rooms | 89 (11.7%) | 29 (5.4%) |
| Total | 760 (100.0%) | 535 (100.0%) |
Housing Structure by Heating Type in Sutter Creek
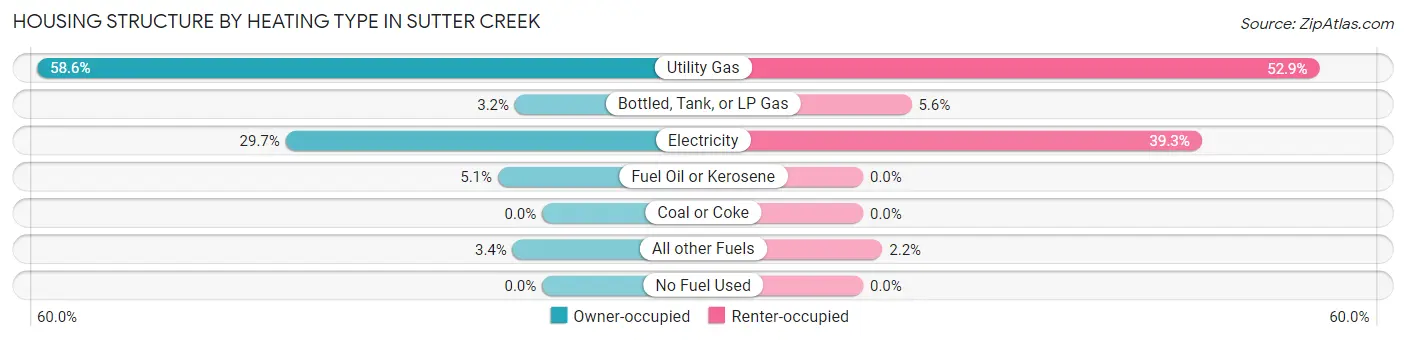
| Heating Type | Owner-occupied | Renter-occupied |
| Utility Gas | 445 (58.6%) | 283 (52.9%) |
| Bottled, Tank, or LP Gas | 24 (3.2%) | 30 (5.6%) |
| Electricity | 226 (29.7%) | 210 (39.3%) |
| Fuel Oil or Kerosene | 39 (5.1%) | 0 (0.0%) |
| Coal or Coke | 0 (0.0%) | 0 (0.0%) |
| All other Fuels | 26 (3.4%) | 12 (2.2%) |
| No Fuel Used | 0 (0.0%) | 0 (0.0%) |
| Total | 760 (100.0%) | 535 (100.0%) |
Household Vehicle Usage in Sutter Creek
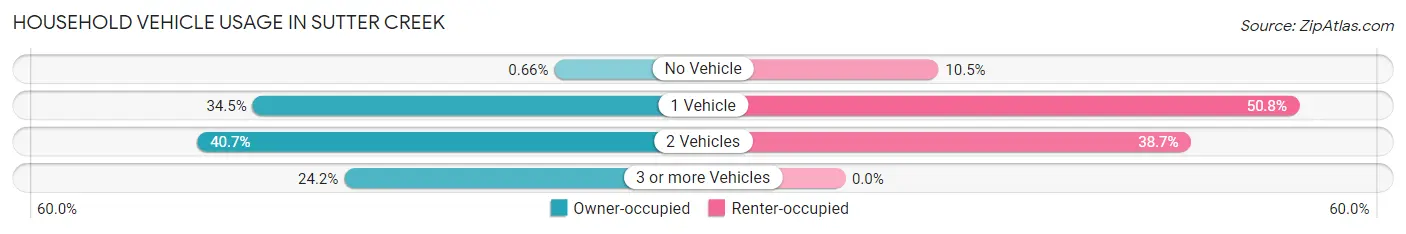
| Vehicles per Household | Owner-occupied | Renter-occupied |
| No Vehicle | 5 (0.7%) | 56 (10.5%) |
| 1 Vehicle | 262 (34.5%) | 272 (50.8%) |
| 2 Vehicles | 309 (40.7%) | 207 (38.7%) |
| 3 or more Vehicles | 184 (24.2%) | 0 (0.0%) |
| Total | 760 (100.0%) | 535 (100.0%) |
Real Estate & Mortgages in Sutter Creek
Real Estate and Mortgage Overview in Sutter Creek
| Characteristic | Without Mortgage | With Mortgage |
| Housing Units | 214 | 546 |
| Median Property Value | $401,400 | $500,000 |
| Median Household Income | $90,326 | $80 |
| Monthly Housing Costs | $562 | $112 |
| Real Estate Taxes | $2,018 | $0 |
Property Value by Mortgage Status in Sutter Creek
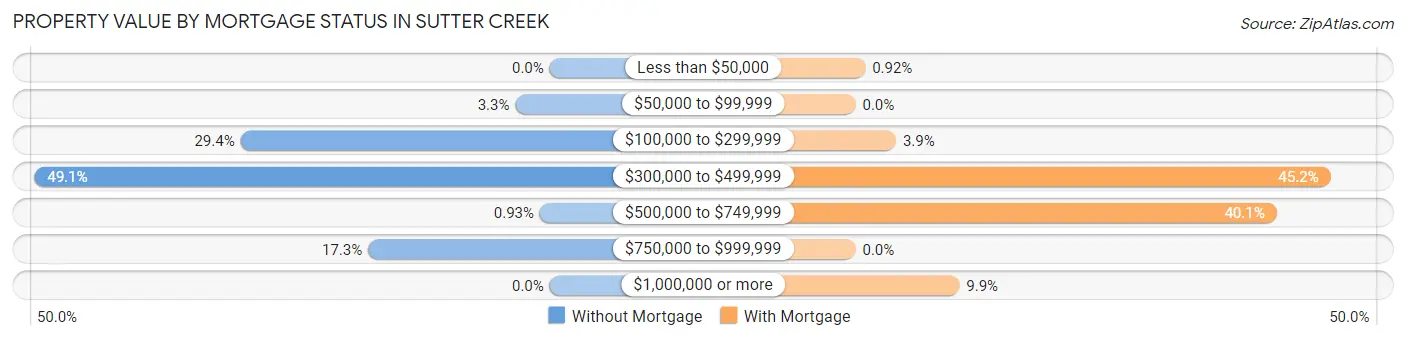
| Property Value | Without Mortgage | With Mortgage |
| Less than $50,000 | 0 (0.0%) | 5 (0.9%) |
| $50,000 to $99,999 | 7 (3.3%) | 0 (0.0%) |
| $100,000 to $299,999 | 63 (29.4%) | 21 (3.8%) |
| $300,000 to $499,999 | 105 (49.1%) | 247 (45.2%) |
| $500,000 to $749,999 | 2 (0.9%) | 219 (40.1%) |
| $750,000 to $999,999 | 37 (17.3%) | 0 (0.0%) |
| $1,000,000 or more | 0 (0.0%) | 54 (9.9%) |
| Total | 214 (100.0%) | 546 (100.0%) |
Household Income by Mortgage Status in Sutter Creek
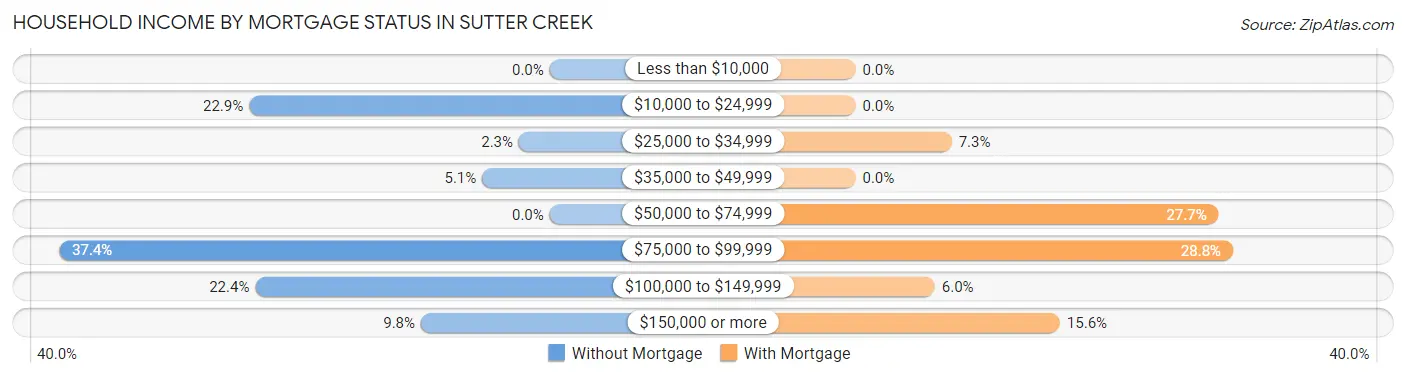
| Household Income | Without Mortgage | With Mortgage |
| Less than $10,000 | 0 (0.0%) | 0 (0.0%) |
| $10,000 to $24,999 | 49 (22.9%) | 0 (0.0%) |
| $25,000 to $34,999 | 5 (2.3%) | 40 (7.3%) |
| $35,000 to $49,999 | 11 (5.1%) | 0 (0.0%) |
| $50,000 to $74,999 | 0 (0.0%) | 151 (27.7%) |
| $75,000 to $99,999 | 80 (37.4%) | 157 (28.7%) |
| $100,000 to $149,999 | 48 (22.4%) | 33 (6.0%) |
| $150,000 or more | 21 (9.8%) | 85 (15.6%) |
| Total | 214 (100.0%) | 546 (100.0%) |
Property Value to Household Income Ratio in Sutter Creek
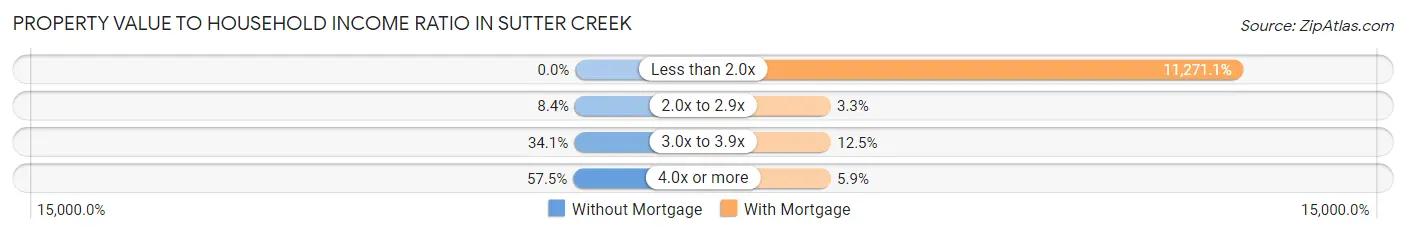
| Value-to-Income Ratio | Without Mortgage | With Mortgage |
| Less than 2.0x | 0 (0.0%) | 61,540 (11,271.1%) |
| 2.0x to 2.9x | 18 (8.4%) | 18 (3.3%) |
| 3.0x to 3.9x | 73 (34.1%) | 68 (12.4%) |
| 4.0x or more | 123 (57.5%) | 32 (5.9%) |
| Total | 214 (100.0%) | 546 (100.0%) |
Real Estate Taxes by Mortgage Status in Sutter Creek
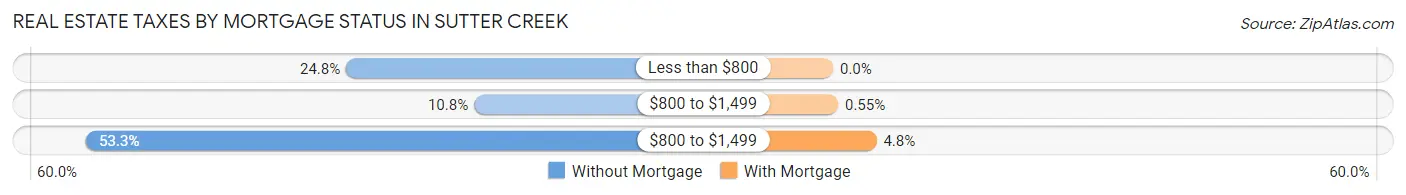
| Property Taxes | Without Mortgage | With Mortgage |
| Less than $800 | 53 (24.8%) | 0 (0.0%) |
| $800 to $1,499 | 23 (10.7%) | 3 (0.5%) |
| $800 to $1,499 | 114 (53.3%) | 26 (4.8%) |
| Total | 214 (100.0%) | 546 (100.0%) |
Health & Disability in Sutter Creek
Health Insurance Coverage by Age in Sutter Creek
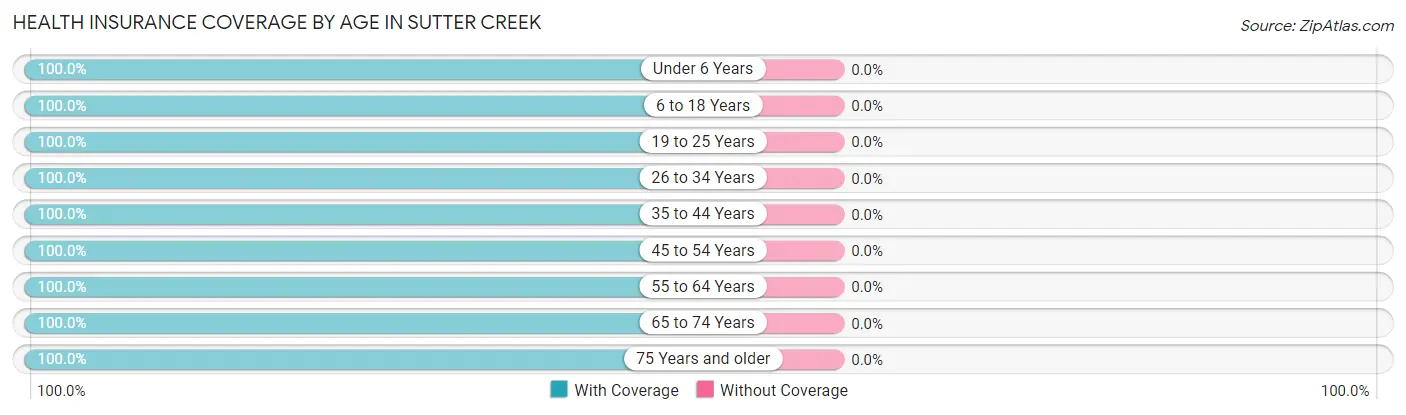
| Age Bracket | With Coverage | Without Coverage |
| Under 6 Years | 66 (100.0%) | 0 (0.0%) |
| 6 to 18 Years | 399 (100.0%) | 0 (0.0%) |
| 19 to 25 Years | 161 (100.0%) | 0 (0.0%) |
| 26 to 34 Years | 405 (100.0%) | 0 (0.0%) |
| 35 to 44 Years | 247 (100.0%) | 0 (0.0%) |
| 45 to 54 Years | 202 (100.0%) | 0 (0.0%) |
| 55 to 64 Years | 410 (100.0%) | 0 (0.0%) |
| 65 to 74 Years | 337 (100.0%) | 0 (0.0%) |
| 75 Years and older | 432 (100.0%) | 0 (0.0%) |
| Total | 2,659 (100.0%) | 0 (0.0%) |
Health Insurance Coverage by Citizenship Status in Sutter Creek
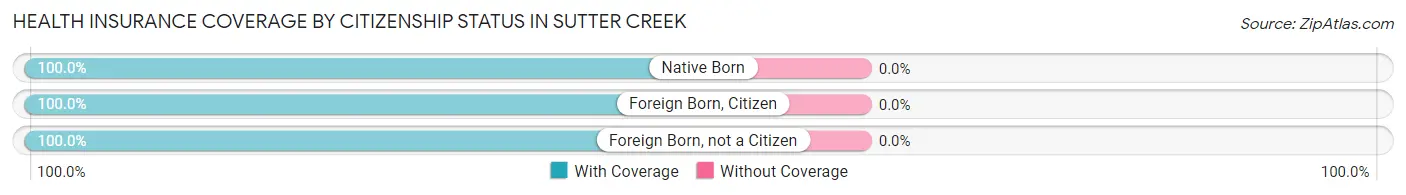
| Citizenship Status | With Coverage | Without Coverage |
| Native Born | 66 (100.0%) | 0 (0.0%) |
| Foreign Born, Citizen | 399 (100.0%) | 0 (0.0%) |
| Foreign Born, not a Citizen | 161 (100.0%) | 0 (0.0%) |
Health Insurance Coverage by Household Income in Sutter Creek
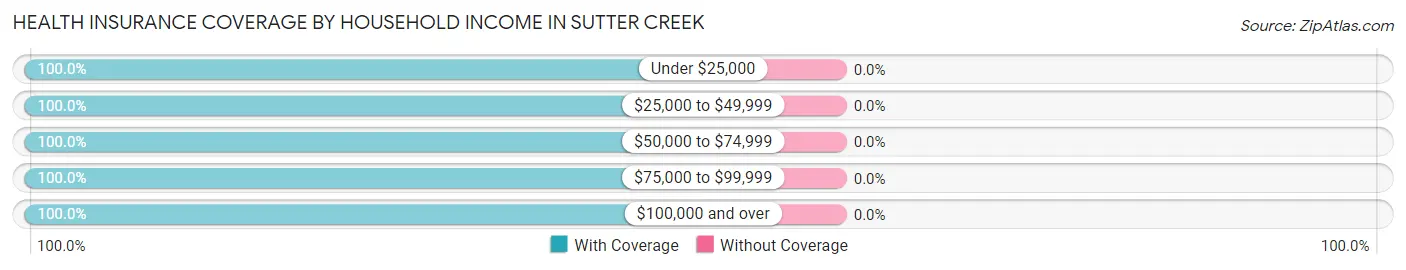
| Household Income | With Coverage | Without Coverage |
| Under $25,000 | 272 (100.0%) | 0 (0.0%) |
| $25,000 to $49,999 | 337 (100.0%) | 0 (0.0%) |
| $50,000 to $74,999 | 898 (100.0%) | 0 (0.0%) |
| $75,000 to $99,999 | 415 (100.0%) | 0 (0.0%) |
| $100,000 and over | 717 (100.0%) | 0 (0.0%) |
Public vs Private Health Insurance Coverage by Age in Sutter Creek
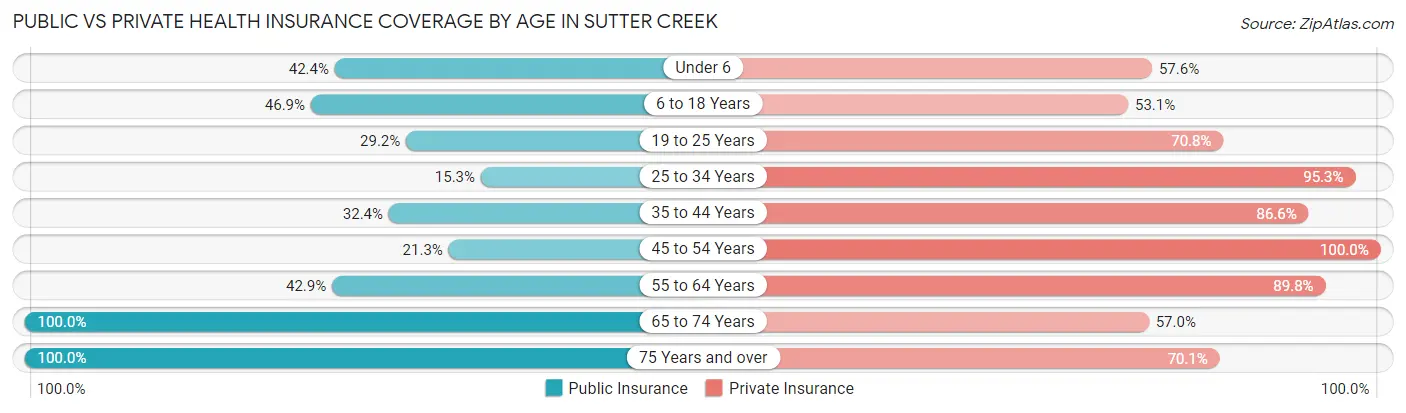
| Age Bracket | Public Insurance | Private Insurance |
| Under 6 | 28 (42.4%) | 38 (57.6%) |
| 6 to 18 Years | 187 (46.9%) | 212 (53.1%) |
| 19 to 25 Years | 47 (29.2%) | 114 (70.8%) |
| 25 to 34 Years | 62 (15.3%) | 386 (95.3%) |
| 35 to 44 Years | 80 (32.4%) | 214 (86.6%) |
| 45 to 54 Years | 43 (21.3%) | 202 (100.0%) |
| 55 to 64 Years | 176 (42.9%) | 368 (89.8%) |
| 65 to 74 Years | 337 (100.0%) | 192 (57.0%) |
| 75 Years and over | 432 (100.0%) | 303 (70.1%) |
| Total | 1,392 (52.3%) | 2,029 (76.3%) |
Disability Status by Sex by Age in Sutter Creek

| Age Bracket | Male | Female |
| Under 5 Years | 0 (0.0%) | 0 (0.0%) |
| 5 to 17 Years | 0 (0.0%) | 0 (0.0%) |
| 18 to 34 Years | 0 (0.0%) | 6 (1.5%) |
| 35 to 64 Years | 69 (18.6%) | 15 (3.1%) |
| 65 to 74 Years | 19 (23.5%) | 83 (32.4%) |
| 75 Years and over | 70 (35.3%) | 97 (41.4%) |
Disability Class by Sex by Age in Sutter Creek
Disability Class: Hearing Difficulty
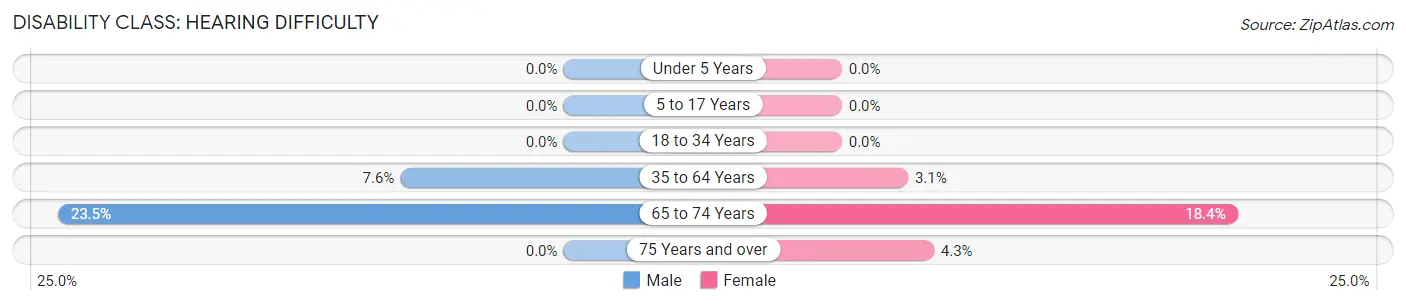
| Age Bracket | Male | Female |
| Under 5 Years | 0 (0.0%) | 0 (0.0%) |
| 5 to 17 Years | 0 (0.0%) | 0 (0.0%) |
| 18 to 34 Years | 0 (0.0%) | 0 (0.0%) |
| 35 to 64 Years | 28 (7.6%) | 15 (3.1%) |
| 65 to 74 Years | 19 (23.5%) | 47 (18.4%) |
| 75 Years and over | 0 (0.0%) | 10 (4.3%) |
Disability Class: Vision Difficulty
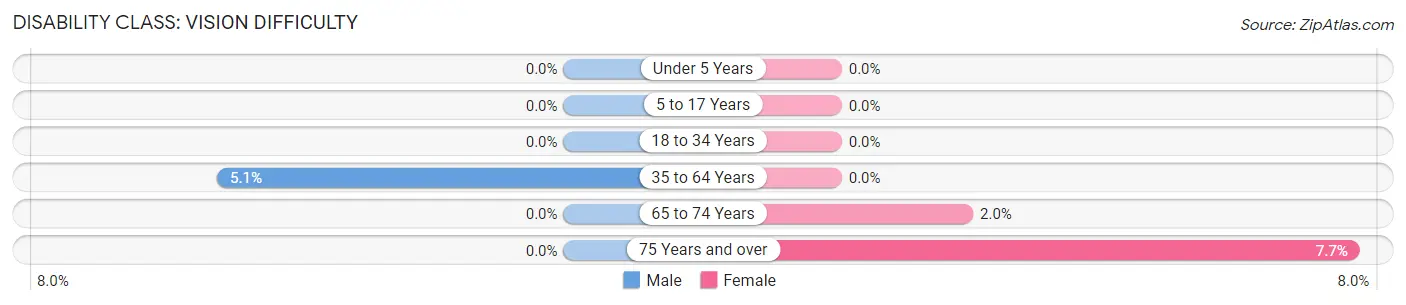
| Age Bracket | Male | Female |
| Under 5 Years | 0 (0.0%) | 0 (0.0%) |
| 5 to 17 Years | 0 (0.0%) | 0 (0.0%) |
| 18 to 34 Years | 0 (0.0%) | 0 (0.0%) |
| 35 to 64 Years | 19 (5.1%) | 0 (0.0%) |
| 65 to 74 Years | 0 (0.0%) | 5 (1.9%) |
| 75 Years and over | 0 (0.0%) | 18 (7.7%) |
Disability Class: Cognitive Difficulty

| Age Bracket | Male | Female |
| 5 to 17 Years | 0 (0.0%) | 0 (0.0%) |
| 18 to 34 Years | 0 (0.0%) | 6 (1.5%) |
| 35 to 64 Years | 45 (12.2%) | 0 (0.0%) |
| 65 to 74 Years | 5 (6.2%) | 10 (3.9%) |
| 75 Years and over | 37 (18.7%) | 46 (19.7%) |
Disability Class: Ambulatory Difficulty
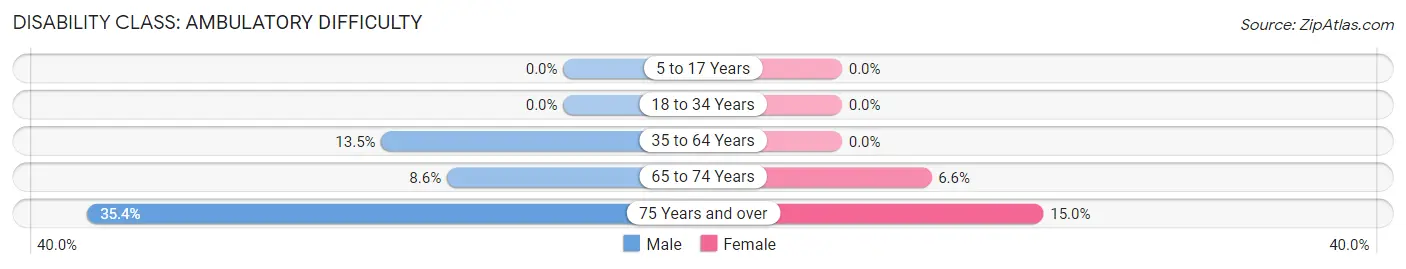
| Age Bracket | Male | Female |
| 5 to 17 Years | 0 (0.0%) | 0 (0.0%) |
| 18 to 34 Years | 0 (0.0%) | 0 (0.0%) |
| 35 to 64 Years | 50 (13.5%) | 0 (0.0%) |
| 65 to 74 Years | 7 (8.6%) | 17 (6.6%) |
| 75 Years and over | 70 (35.3%) | 35 (15.0%) |
Disability Class: Self-Care Difficulty
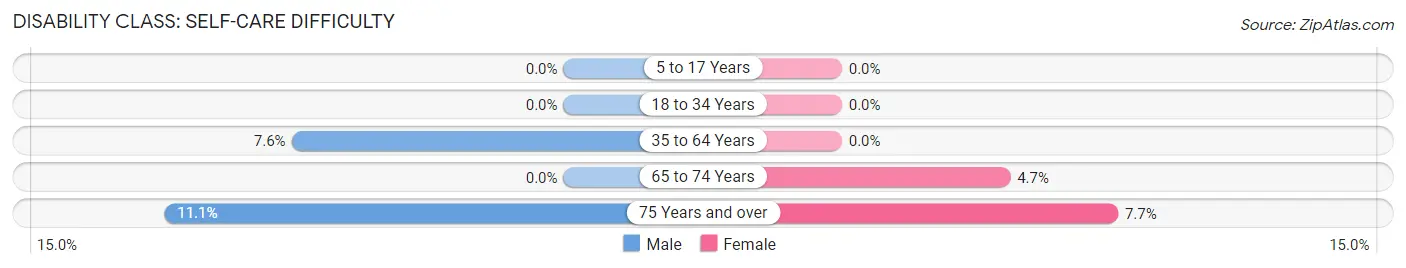
| Age Bracket | Male | Female |
| 5 to 17 Years | 0 (0.0%) | 0 (0.0%) |
| 18 to 34 Years | 0 (0.0%) | 0 (0.0%) |
| 35 to 64 Years | 28 (7.6%) | 0 (0.0%) |
| 65 to 74 Years | 0 (0.0%) | 12 (4.7%) |
| 75 Years and over | 22 (11.1%) | 18 (7.7%) |
Technology Access in Sutter Creek
Computing Device Access in Sutter Creek
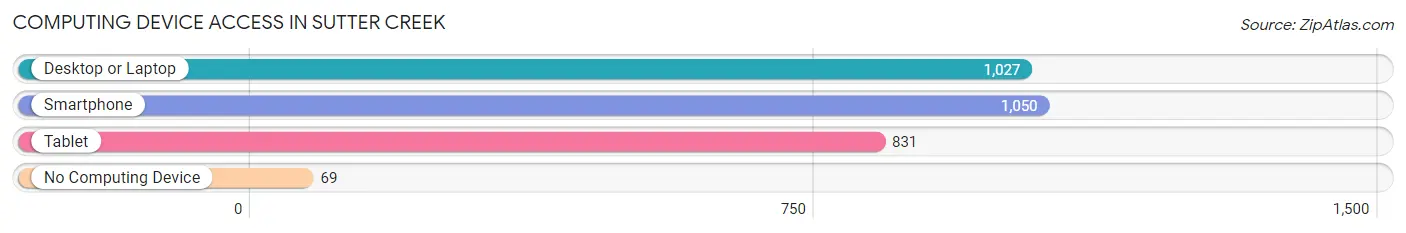
| Device Type | # Households | % Households |
| Desktop or Laptop | 1,027 | 79.3% |
| Smartphone | 1,050 | 81.1% |
| Tablet | 831 | 64.2% |
| No Computing Device | 69 | 5.3% |
| Total | 1,295 | 100.0% |
Internet Access in Sutter Creek
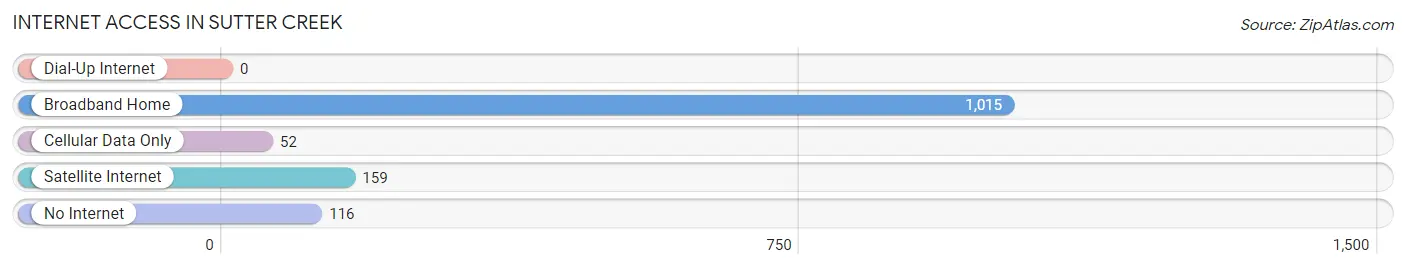
| Internet Type | # Households | % Households |
| Dial-Up Internet | 0 | 0.0% |
| Broadband Home | 1,015 | 78.4% |
| Cellular Data Only | 52 | 4.0% |
| Satellite Internet | 159 | 12.3% |
| No Internet | 116 | 9.0% |
| Total | 1,295 | 100.0% |
Sutter Creek Summary
Sutter Creek is a small city located in Amador County, California, United States. It is situated in the Sierra Nevada foothills, about 40 miles east of Sacramento. The city is named after John Sutter, who established a trading post in the area in 1848. As of the 2010 census, the population of Sutter Creek was 2,501.
History
The area that is now Sutter Creek was originally inhabited by the Miwok and Maidu Native American tribes. In 1848, John Sutter established a trading post in the area, which was the first non-native settlement in the region. The post was located near the junction of two creeks, which were later named Sutter Creek and Dry Creek.
In 1849, gold was discovered in the area, and the town quickly grew as prospectors flocked to the region. By 1851, the population of Sutter Creek had grown to over 1,000 people. The town was incorporated in 1854, and the first mayor was elected in 1855.
In the late 19th century, Sutter Creek became a popular destination for wealthy San Franciscans, who built large summer homes in the area. The town also became known for its wineries, which produced some of the finest wines in the state.
Geography
Sutter Creek is located in the Sierra Nevada foothills, about 40 miles east of Sacramento. The city is situated at an elevation of 1,845 feet (562 m). The city covers an area of 2.2 square miles (5.7 km2), all of which is land.
The city is located in the Sutter Creek Valley, which is surrounded by the Sierra Nevada Mountains to the east and the Coast Range to the west. The city is located near the junction of two creeks, Sutter Creek and Dry Creek.
Economy
The economy of Sutter Creek is largely based on tourism. The city is a popular destination for wine tasting, as it is home to several wineries. The city is also known for its historic downtown, which features several shops and restaurants.
The city is also home to several manufacturing companies, including a furniture factory and a metal fabrication plant.
Demographics
As of the 2010 census, the population of Sutter Creek was 2,501. The racial makeup of the city was 81.2% White, 0.8% African American, 1.2% Native American, 0.7% Asian, 0.1% Pacific Islander, 11.7% from other races, and 4.3% from two or more races. Hispanic or Latino of any race were 22.2% of the population.
The median income for a household in the city was $45,938, and the median income for a family was $51,938. The per capita income for the city was $22,938. About 11.7% of families and 14.2% of the population were below the poverty line, including 19.2% of those under age 18 and 8.2% of those age 65 or over.
Common Questions
What is Per Capita Income in Sutter Creek?
Per Capita income in Sutter Creek is $40,585.
What is the Median Family Income in Sutter Creek?
Median Family Income in Sutter Creek is $63,994.
What is the Median Household income in Sutter Creek?
Median Household Income in Sutter Creek is $59,028.
What is Income or Wage Gap in Sutter Creek?
Income or Wage Gap in Sutter Creek is 45.6%.
Women in Sutter Creek earn 54.4 cents for every dollar earned by a man.
What is Inequality or Gini Index in Sutter Creek?
Inequality or Gini Index in Sutter Creek is 0.42.
What is the Total Population of Sutter Creek?
Total Population of Sutter Creek is 2,659.
What is the Total Male Population of Sutter Creek?
Total Male Population of Sutter Creek is 1,076.
What is the Total Female Population of Sutter Creek?
Total Female Population of Sutter Creek is 1,583.
What is the Ratio of Males per 100 Females in Sutter Creek?
There are 67.97 Males per 100 Females in Sutter Creek.
What is the Ratio of Females per 100 Males in Sutter Creek?
There are 147.12 Females per 100 Males in Sutter Creek.
What is the Median Population Age in Sutter Creek?
Median Population Age in Sutter Creek is 46.6 Years.
What is the Average Family Size in Sutter Creek
Average Family Size in Sutter Creek is 3.0 People.
What is the Average Household Size in Sutter Creek
Average Household Size in Sutter Creek is 2.0 People.
How Large is the Labor Force in Sutter Creek?
There are 1,242 People in the Labor Forcein in Sutter Creek.
What is the Percentage of People in the Labor Force in Sutter Creek?
53.6% of People are in the Labor Force in Sutter Creek.
What is the Unemployment Rate in Sutter Creek?
Unemployment Rate in Sutter Creek is 7.6%.