Susanville, CA Map & Demographics
Susanville Map
Susanville Overview
$17,912
PER CAPITA INCOME
$65,774
AVG FAMILY INCOME
$52,997
AVG HOUSEHOLD INCOME
19.6%
WAGE / INCOME GAP [ % ]
80.4¢/ $1
WAGE / INCOME GAP [ $ ]
$9,796
FAMILY INCOME DEFICIT
0.43
INEQUALITY / GINI INDEX
15,737
TOTAL POPULATION
11,146
MALE POPULATION
4,591
FEMALE POPULATION
242.78
MALES / 100 FEMALES
41.19
FEMALES / 100 MALES
33.7
MEDIAN AGE
3.3
AVG FAMILY SIZE
2.6
AVG HOUSEHOLD SIZE
4,246
LABOR FORCE [ PEOPLE ]
31.1%
PERCENT IN LABOR FORCE
7.3%
UNEMPLOYMENT RATE
Susanville Zip Codes
Susanville Area Codes
Income in Susanville
Income Overview in Susanville
Per Capita Income in Susanville is $17,912, while median incomes of families and households are $65,774 and $52,997 respectively.
| Characteristic | Number | Measure |
| Per Capita Income | 15,737 | $17,912 |
| Median Family Income | 2,062 | $65,774 |
| Mean Family Income | 2,062 | $86,607 |
| Median Household Income | 3,447 | $52,997 |
| Mean Household Income | 3,447 | $72,884 |
| Income Deficit | 2,062 | $9,796 |
| Wage / Income Gap (%) | 15,737 | 19.56% |
| Wage / Income Gap ($) | 15,737 | 80.44¢ per $1 |
| Gini / Inequality Index | 15,737 | 0.43 |
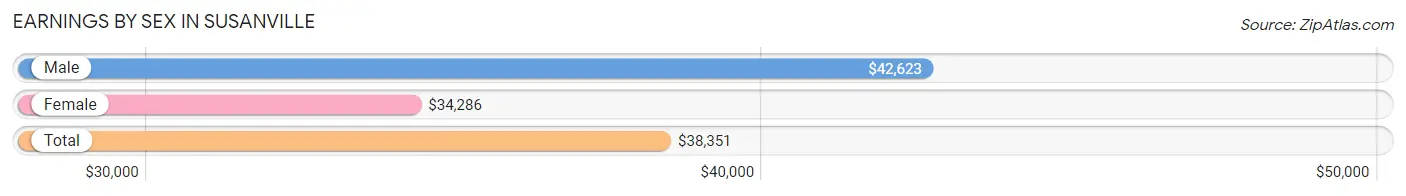
Earnings by Sex in Susanville
Average Earnings in Susanville are $38,351, $42,623 for men and $34,286 for women, a difference of 19.6%.
| Sex | Number | Average Earnings |
| Male | 2,720 (58.0%) | $42,623 |
| Female | 1,972 (42.0%) | $34,286 |
| Total | 4,692 (100.0%) | $38,351 |
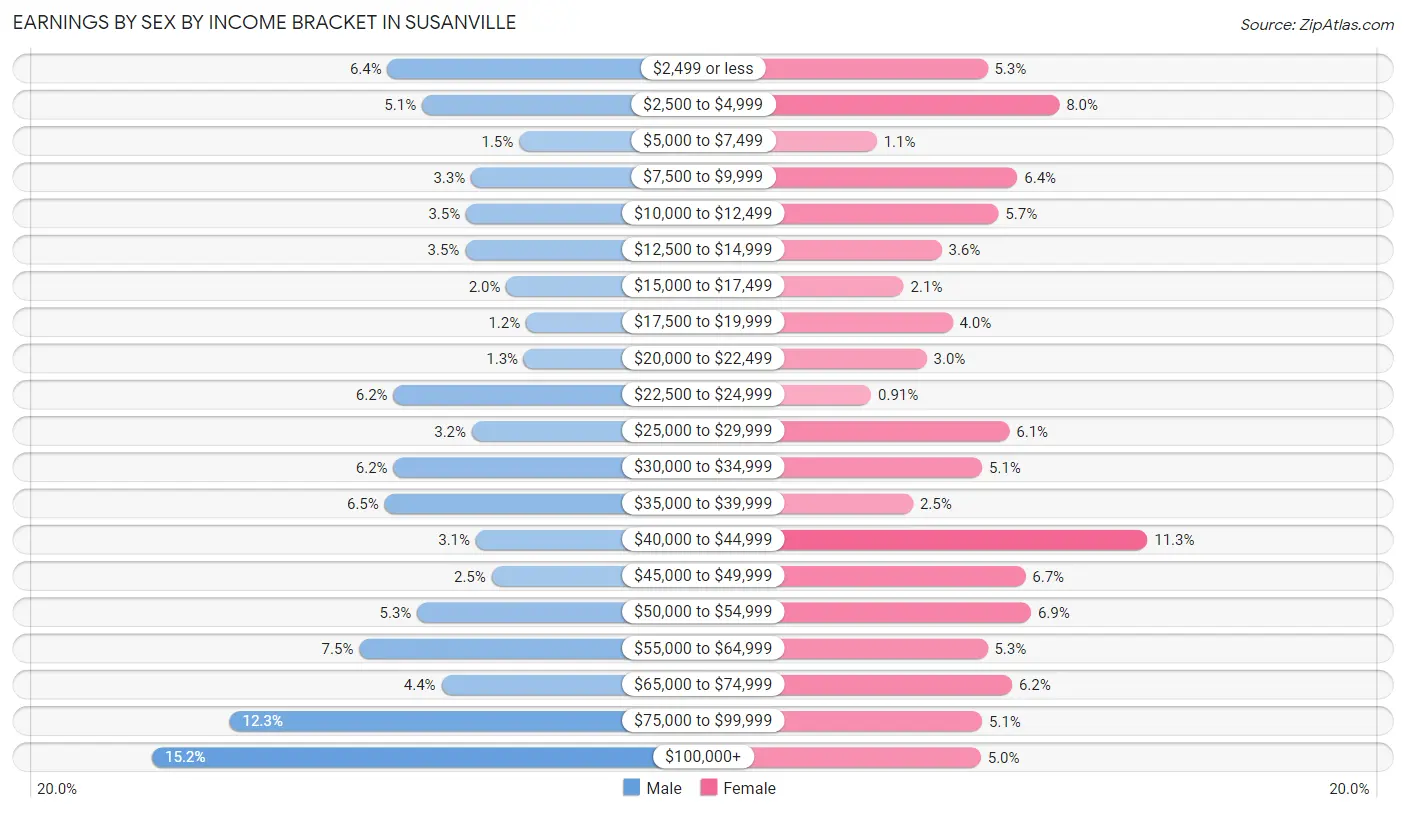
Earnings by Sex by Income Bracket in Susanville
The most common earnings brackets in Susanville are $100,000+ for men (414 | 15.2%) and $40,000 to $44,999 for women (222 | 11.3%).
| Income | Male | Female |
| $2,499 or less | 174 (6.4%) | 104 (5.3%) |
| $2,500 to $4,999 | 139 (5.1%) | 157 (8.0%) |
| $5,000 to $7,499 | 40 (1.5%) | 22 (1.1%) |
| $7,500 to $9,999 | 89 (3.3%) | 126 (6.4%) |
| $10,000 to $12,499 | 94 (3.5%) | 112 (5.7%) |
| $12,500 to $14,999 | 95 (3.5%) | 70 (3.5%) |
| $15,000 to $17,499 | 53 (1.9%) | 42 (2.1%) |
| $17,500 to $19,999 | 33 (1.2%) | 78 (4.0%) |
| $20,000 to $22,499 | 35 (1.3%) | 59 (3.0%) |
| $22,500 to $24,999 | 168 (6.2%) | 18 (0.9%) |
| $25,000 to $29,999 | 88 (3.2%) | 120 (6.1%) |
| $30,000 to $34,999 | 168 (6.2%) | 100 (5.1%) |
| $35,000 to $39,999 | 177 (6.5%) | 49 (2.5%) |
| $40,000 to $44,999 | 84 (3.1%) | 222 (11.3%) |
| $45,000 to $49,999 | 68 (2.5%) | 132 (6.7%) |
| $50,000 to $54,999 | 144 (5.3%) | 136 (6.9%) |
| $55,000 to $64,999 | 203 (7.5%) | 104 (5.3%) |
| $65,000 to $74,999 | 119 (4.4%) | 122 (6.2%) |
| $75,000 to $99,999 | 335 (12.3%) | 100 (5.1%) |
| $100,000+ | 414 (15.2%) | 99 (5.0%) |
| Total | 2,720 (100.0%) | 1,972 (100.0%) |
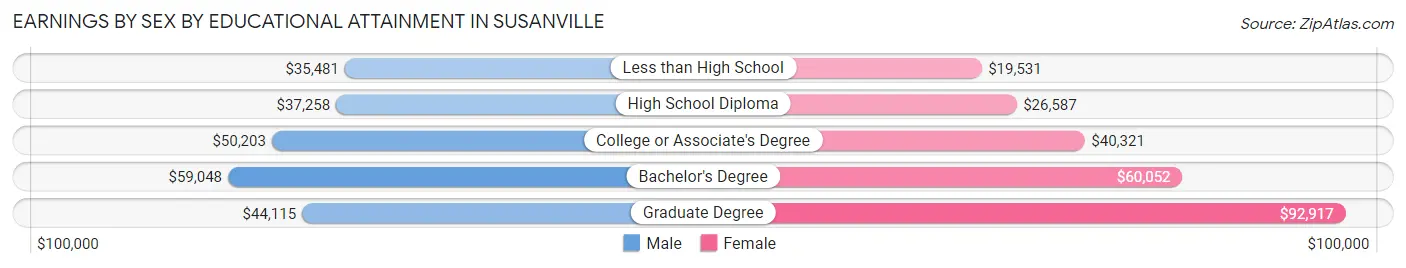
Earnings by Sex by Educational Attainment in Susanville
Average earnings in Susanville are $50,585 for men and $40,473 for women, a difference of 20.0%. Men with an educational attainment of bachelor's degree enjoy the highest average annual earnings of $59,048, while those with less than high school education earn the least with $35,481. Women with an educational attainment of graduate degree earn the most with the average annual earnings of $92,917, while those with less than high school education have the smallest earnings of $19,531.
| Educational Attainment | Male Income | Female Income |
| Less than High School | $35,481 | $19,531 |
| High School Diploma | $37,258 | $26,587 |
| College or Associate's Degree | $50,203 | $40,321 |
| Bachelor's Degree | $59,048 | $60,052 |
| Graduate Degree | $44,115 | $92,917 |
| Total | $50,585 | $40,473 |
Family Income in Susanville
Family Income Brackets in Susanville
According to the Susanville family income data, there are 410 families falling into the $100,000 to $149,999 income range, which is the most common income bracket and makes up 19.9% of all families. Conversely, the $10,000 to $14,999 income bracket is the least frequent group with only 6 families (0.3%) belonging to this category.
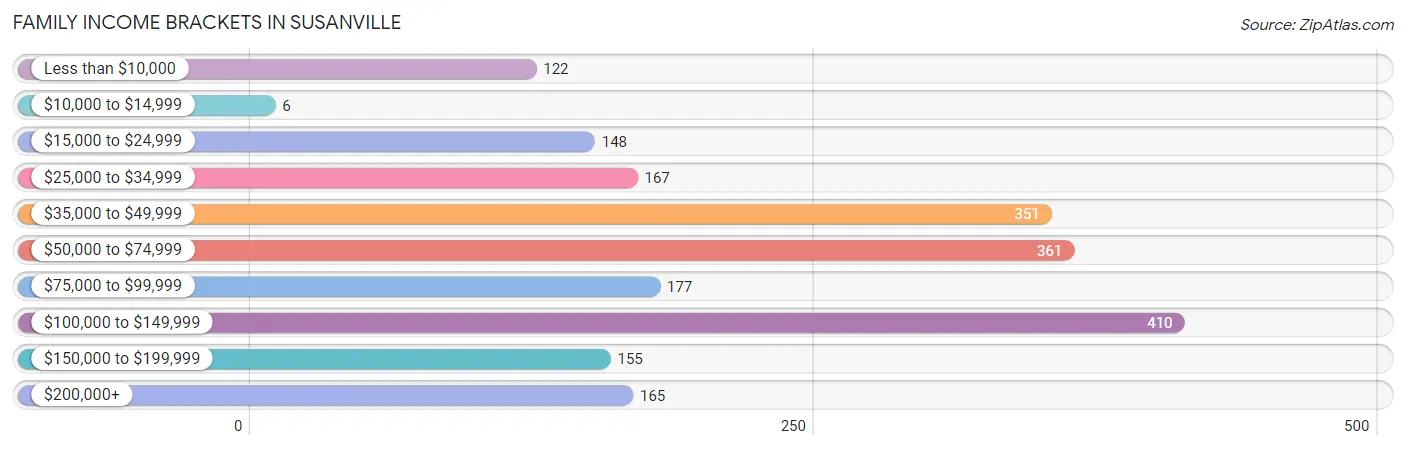
| Income Bracket | # Families | % Families |
| Less than $10,000 | 122 | 5.9% |
| $10,000 to $14,999 | 6 | 0.3% |
| $15,000 to $24,999 | 148 | 7.2% |
| $25,000 to $34,999 | 167 | 8.1% |
| $35,000 to $49,999 | 351 | 17.0% |
| $50,000 to $74,999 | 361 | 17.5% |
| $75,000 to $99,999 | 177 | 8.6% |
| $100,000 to $149,999 | 410 | 19.9% |
| $150,000 to $199,999 | 155 | 7.5% |
| $200,000+ | 165 | 8.0% |
Family Income by Famaliy Size in Susanville
7+ person families (58 | 2.8%) account for the highest median family income in Susanville with $175,741 per family, while 4-person families (243 | 11.8%) have the highest median income of $31,887 per family member.
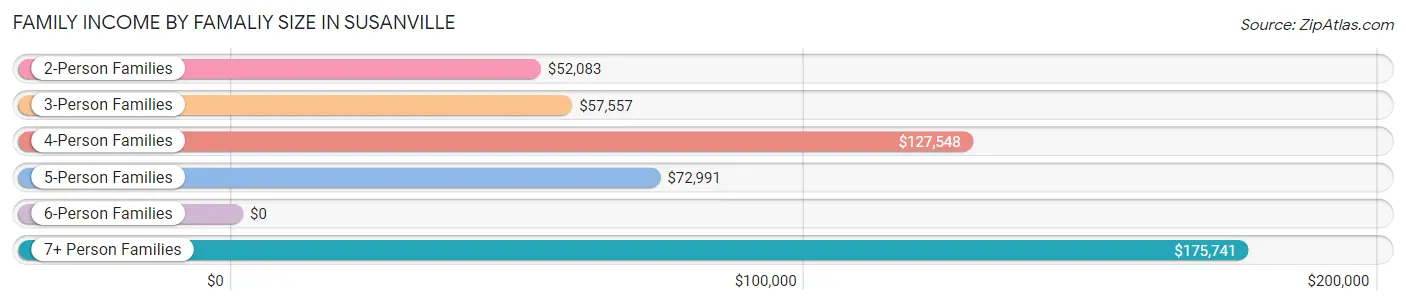
| Income Bracket | # Families | Median Income |
| 2-Person Families | 1,098 (53.2%) | $52,083 |
| 3-Person Families | 433 (21.0%) | $57,557 |
| 4-Person Families | 243 (11.8%) | $127,548 |
| 5-Person Families | 163 (7.9%) | $72,991 |
| 6-Person Families | 67 (3.3%) | $0 |
| 7+ Person Families | 58 (2.8%) | $175,741 |
| Total | 2,062 (100.0%) | $65,774 |
Family Income by Number of Earners in Susanville
The median family income in Susanville is $65,774, with families comprising 3+ earners (160) having the highest median family income of $176,944, while families with no earners (368) have the lowest median family income of $33,222, accounting for 7.8% and 17.8% of families, respectively.
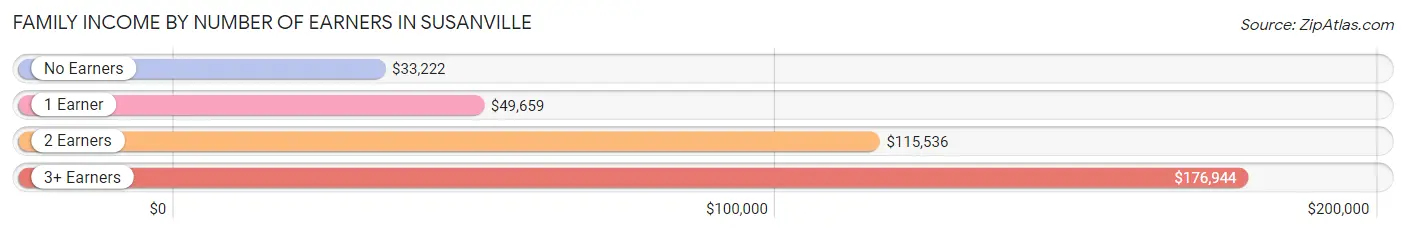
| Number of Earners | # Families | Median Income |
| No Earners | 368 (17.8%) | $33,222 |
| 1 Earner | 869 (42.1%) | $49,659 |
| 2 Earners | 665 (32.3%) | $115,536 |
| 3+ Earners | 160 (7.8%) | $176,944 |
| Total | 2,062 (100.0%) | $65,774 |
Household Income in Susanville
Household Income Brackets in Susanville
With 576 households falling in the category, the $100,000 to $149,999 income range is the most frequent in Susanville, accounting for 16.7% of all households. In contrast, only 65 households (1.9%) fall into the $10,000 to $14,999 income bracket, making it the least populous group.
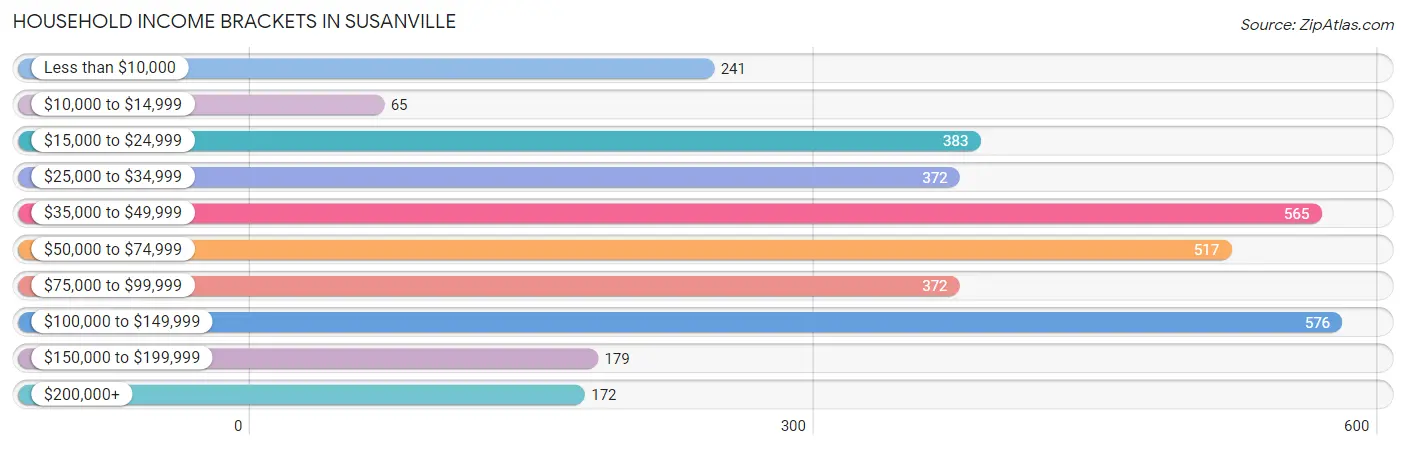
| Income Bracket | # Households | % Households |
| Less than $10,000 | 241 | 7.0% |
| $10,000 to $14,999 | 65 | 1.9% |
| $15,000 to $24,999 | 383 | 11.1% |
| $25,000 to $34,999 | 372 | 10.8% |
| $35,000 to $49,999 | 565 | 16.4% |
| $50,000 to $74,999 | 517 | 15.0% |
| $75,000 to $99,999 | 372 | 10.8% |
| $100,000 to $149,999 | 576 | 16.7% |
| $150,000 to $199,999 | 179 | 5.2% |
| $200,000+ | 172 | 5.0% |
Household Income by Householder Age in Susanville
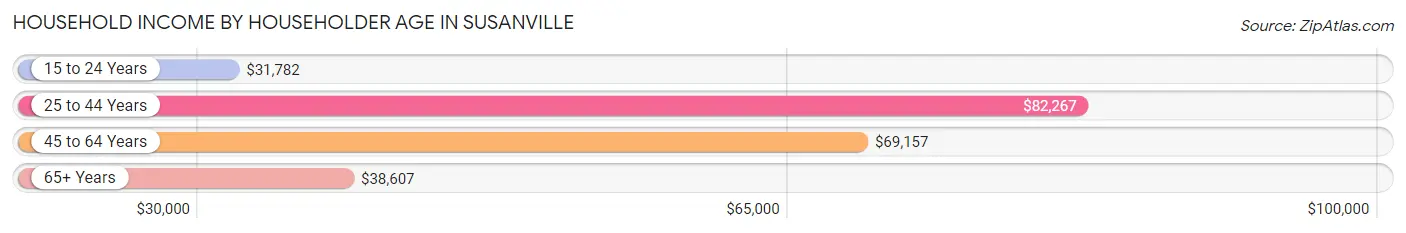
The median household income in Susanville is $52,997, with the highest median household income of $82,267 found in the 25 to 44 years age bracket for the primary householder. A total of 1,120 households (32.5%) fall into this category. Meanwhile, the 15 to 24 years age bracket for the primary householder has the lowest median household income of $31,782, with 163 households (4.7%) in this group.
| Income Bracket | # Households | Median Income |
| 15 to 24 Years | 163 (4.7%) | $31,782 |
| 25 to 44 Years | 1,120 (32.5%) | $82,267 |
| 45 to 64 Years | 1,113 (32.3%) | $69,157 |
| 65+ Years | 1,051 (30.5%) | $38,607 |
| Total | 3,447 (100.0%) | $52,997 |
Poverty in Susanville
Income Below Poverty by Sex and Age in Susanville
With 15.5% poverty level for males and 19.5% for females among the residents of Susanville, 18 to 24 year old males and 5 year old females are the most vulnerable to poverty, with 156 males (30.9%) and 8 females (72.7%) in their respective age groups living below the poverty level.
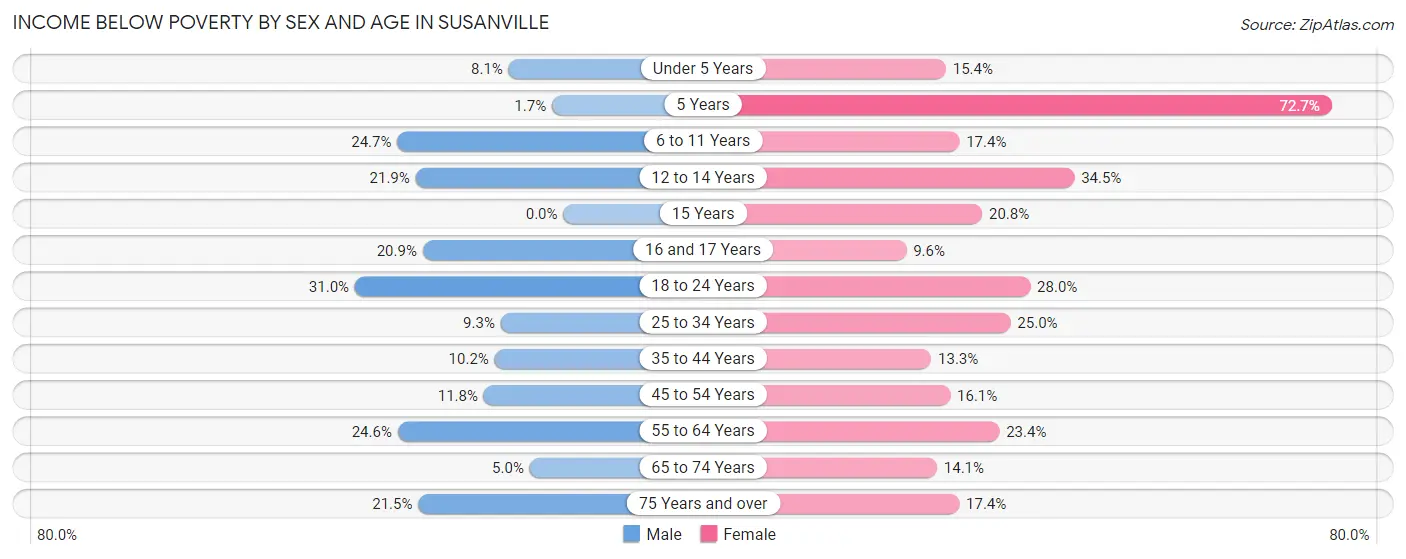
| Age Bracket | Male | Female |
| Under 5 Years | 22 (8.1%) | 44 (15.4%) |
| 5 Years | 1 (1.7%) | 8 (72.7%) |
| 6 to 11 Years | 91 (24.7%) | 64 (17.4%) |
| 12 to 14 Years | 43 (21.9%) | 98 (34.5%) |
| 15 Years | 0 (0.0%) | 5 (20.8%) |
| 16 and 17 Years | 19 (20.9%) | 18 (9.6%) |
| 18 to 24 Years | 156 (30.9%) | 87 (28.0%) |
| 25 to 34 Years | 72 (9.3%) | 147 (25.0%) |
| 35 to 44 Years | 55 (10.2%) | 85 (13.3%) |
| 45 to 54 Years | 68 (11.8%) | 82 (16.1%) |
| 55 to 64 Years | 105 (24.6%) | 112 (23.4%) |
| 65 to 74 Years | 18 (5.0%) | 62 (14.1%) |
| 75 Years and over | 53 (21.5%) | 62 (17.4%) |
| Total | 703 (15.5%) | 874 (19.5%) |
Income Above Poverty by Sex and Age in Susanville
According to the poverty statistics in Susanville, males aged 15 years and females aged 16 and 17 years are the age groups that are most secure financially, with 100.0% of males and 90.4% of females in these age groups living above the poverty line.
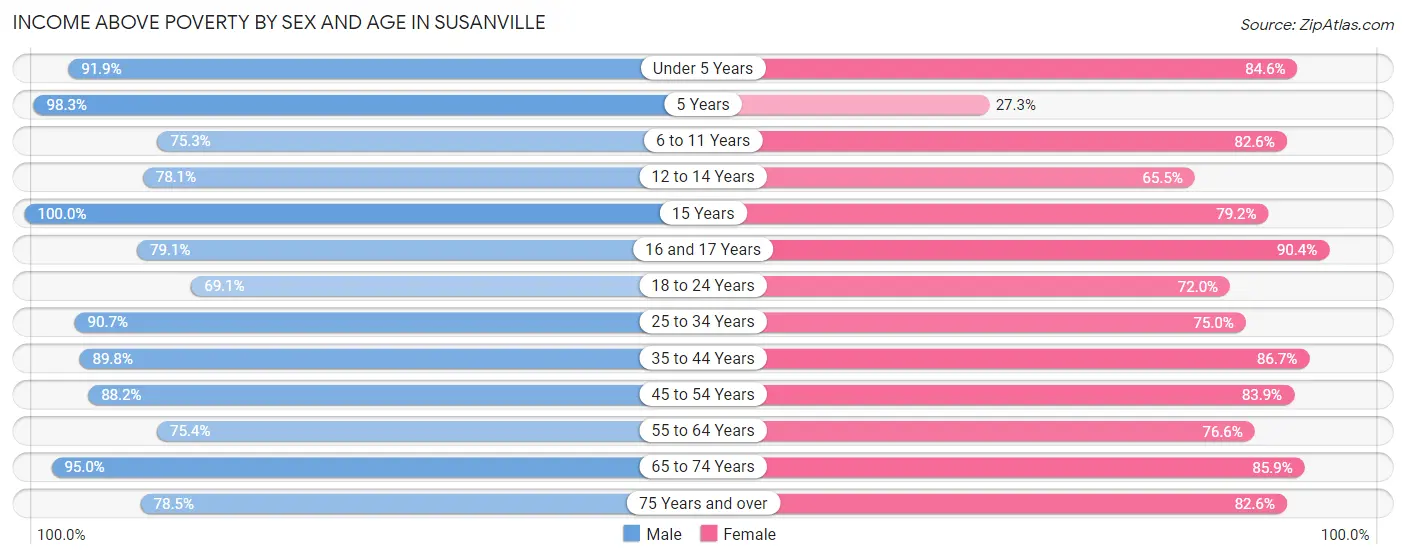
| Age Bracket | Male | Female |
| Under 5 Years | 249 (91.9%) | 241 (84.6%) |
| 5 Years | 58 (98.3%) | 3 (27.3%) |
| 6 to 11 Years | 278 (75.3%) | 303 (82.6%) |
| 12 to 14 Years | 153 (78.1%) | 186 (65.5%) |
| 15 Years | 127 (100.0%) | 19 (79.2%) |
| 16 and 17 Years | 72 (79.1%) | 170 (90.4%) |
| 18 to 24 Years | 348 (69.1%) | 224 (72.0%) |
| 25 to 34 Years | 702 (90.7%) | 440 (75.0%) |
| 35 to 44 Years | 484 (89.8%) | 556 (86.7%) |
| 45 to 54 Years | 508 (88.2%) | 428 (83.9%) |
| 55 to 64 Years | 322 (75.4%) | 367 (76.6%) |
| 65 to 74 Years | 343 (95.0%) | 377 (85.9%) |
| 75 Years and over | 193 (78.5%) | 294 (82.6%) |
| Total | 3,837 (84.5%) | 3,608 (80.5%) |
Income Below Poverty Among Married-Couple Families in Susanville
The poverty statistics for married-couple families in Susanville show that 9.2% or 147 of the total 1,593 families live below the poverty line. Families with 3 or 4 children have the highest poverty rate of 13.0%, comprising of 28 families. On the other hand, families with 5 or more children have the lowest poverty rate of 0.0%, which includes 0 families.
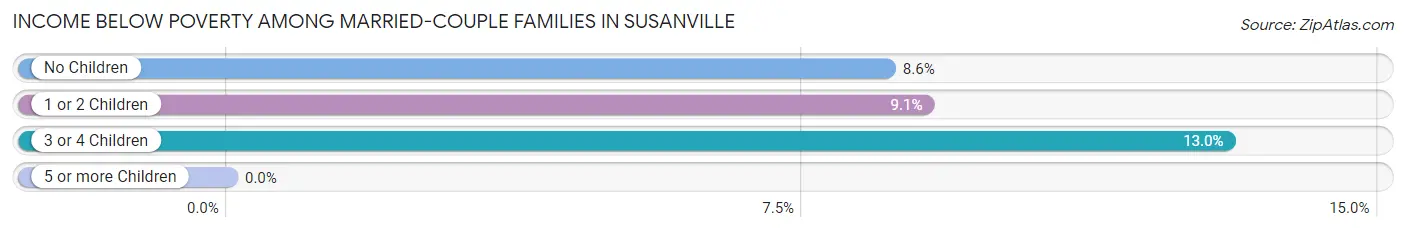
| Children | Above Poverty | Below Poverty |
| No Children | 819 (91.4%) | 77 (8.6%) |
| 1 or 2 Children | 420 (90.9%) | 42 (9.1%) |
| 3 or 4 Children | 187 (87.0%) | 28 (13.0%) |
| 5 or more Children | 20 (100.0%) | 0 (0.0%) |
| Total | 1,446 (90.8%) | 147 (9.2%) |
Income Below Poverty Among Single-Parent Households in Susanville
According to the poverty data in Susanville, 35.3% or 54 single-father households and 26.9% or 85 single-mother households are living below the poverty line. Among single-father households, those with 1 or 2 children have the highest poverty rate, with 54 households (49.1%) experiencing poverty. Likewise, among single-mother households, those with 5 or more children have the highest poverty rate, with 7 households (100.0%) falling below the poverty line.
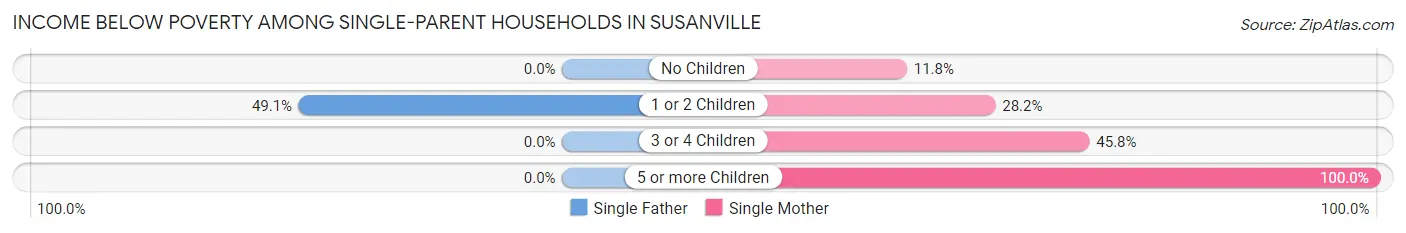
| Children | Single Father | Single Mother |
| No Children | 0 (0.0%) | 14 (11.8%) |
| 1 or 2 Children | 54 (49.1%) | 37 (28.2%) |
| 3 or 4 Children | 0 (0.0%) | 27 (45.8%) |
| 5 or more Children | 0 (0.0%) | 7 (100.0%) |
| Total | 54 (35.3%) | 85 (26.9%) |
Income Below Poverty Among Married-Couple vs Single-Parent Households in Susanville
The poverty data for Susanville shows that 147 of the married-couple family households (9.2%) and 139 of the single-parent households (29.6%) are living below the poverty level. Within the married-couple family households, those with 3 or 4 children have the highest poverty rate, with 28 households (13.0%) falling below the poverty line. Among the single-parent households, those with 5 or more children have the highest poverty rate, with 7 household (100.0%) living below poverty.
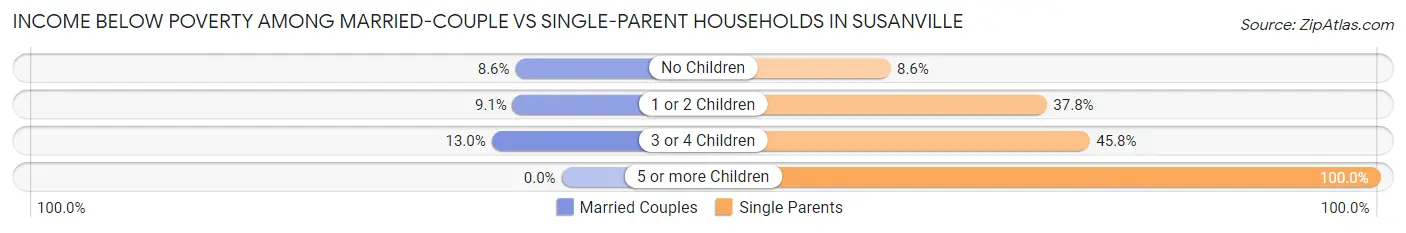
| Children | Married-Couple Families | Single-Parent Households |
| No Children | 77 (8.6%) | 14 (8.6%) |
| 1 or 2 Children | 42 (9.1%) | 91 (37.8%) |
| 3 or 4 Children | 28 (13.0%) | 27 (45.8%) |
| 5 or more Children | 0 (0.0%) | 7 (100.0%) |
| Total | 147 (9.2%) | 139 (29.6%) |
Race in Susanville
The most populous races in Susanville are White / Caucasian (9,873 | 62.7%), Hispanic or Latino (4,516 | 28.7%), and Two or more Races (2,372 | 15.1%).
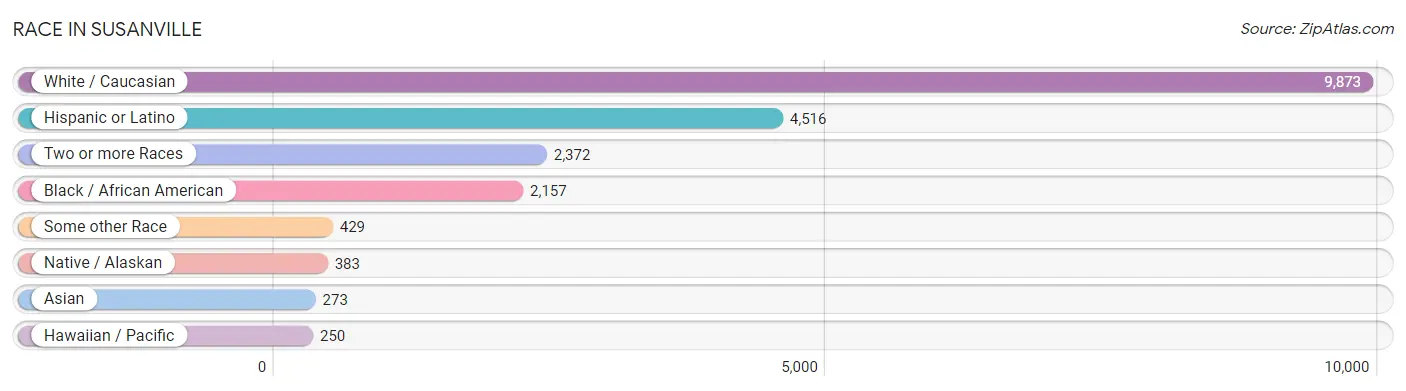
| Race | # Population | % Population |
| Asian | 273 | 1.7% |
| Black / African American | 2,157 | 13.7% |
| Hawaiian / Pacific | 250 | 1.6% |
| Hispanic or Latino | 4,516 | 28.7% |
| Native / Alaskan | 383 | 2.4% |
| White / Caucasian | 9,873 | 62.7% |
| Two or more Races | 2,372 | 15.1% |
| Some other Race | 429 | 2.7% |
| Total | 15,737 | 100.0% |
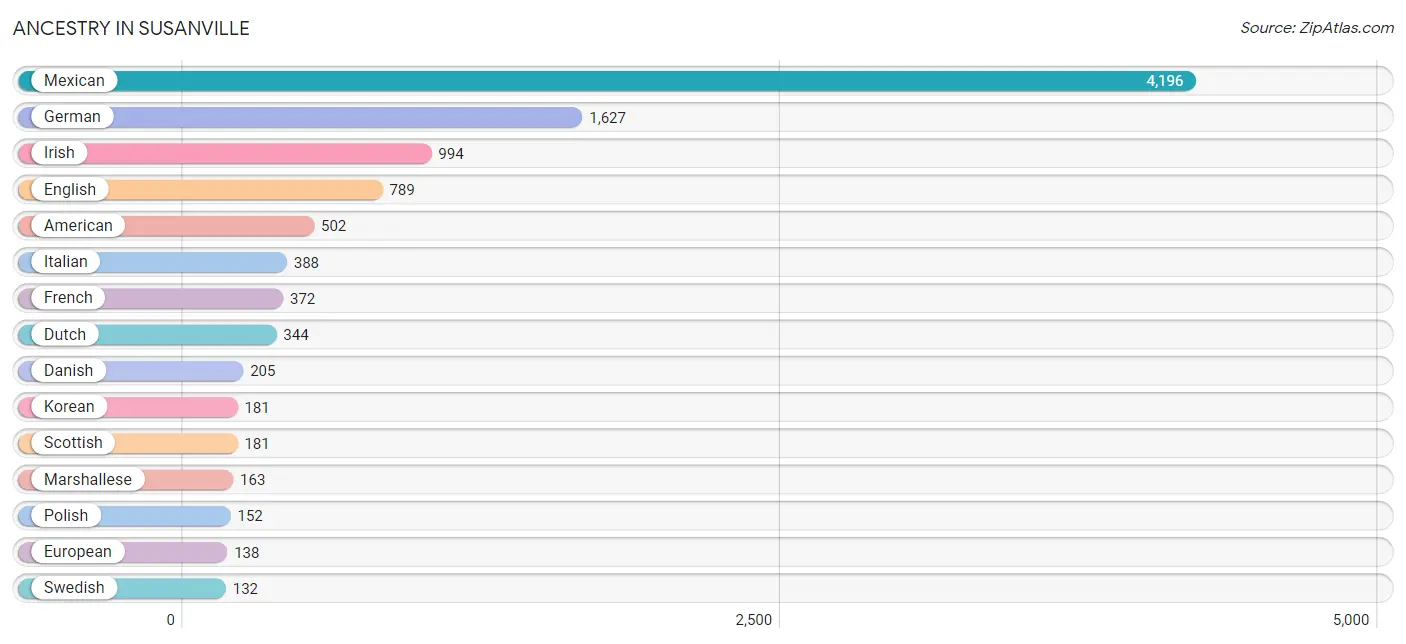
Ancestry in Susanville
The most populous ancestries reported in Susanville are Mexican (4,196 | 26.7%), German (1,627 | 10.3%), Irish (994 | 6.3%), English (789 | 5.0%), and American (502 | 3.2%), together accounting for 51.5% of all Susanville residents.
| Ancestry | # Population | % Population |
| African | 29 | 0.2% |
| Alaska Native | 82 | 0.5% |
| American | 502 | 3.2% |
| Apache | 7 | 0.0% |
| Arab | 47 | 0.3% |
| Armenian | 10 | 0.1% |
| Australian | 14 | 0.1% |
| Austrian | 35 | 0.2% |
| Bangladeshi | 33 | 0.2% |
| Basque | 96 | 0.6% |
| Belgian | 9 | 0.1% |
| Bhutanese | 38 | 0.2% |
| British | 49 | 0.3% |
| Burmese | 22 | 0.1% |
| Canadian | 32 | 0.2% |
| Central American | 55 | 0.4% |
| Cherokee | 76 | 0.5% |
| Chickasaw | 43 | 0.3% |
| Chippewa | 5 | 0.0% |
| Choctaw | 54 | 0.3% |
| Danish | 205 | 1.3% |
| Dutch | 344 | 2.2% |
| Eastern European | 45 | 0.3% |
| English | 789 | 5.0% |
| European | 138 | 0.9% |
| Finnish | 25 | 0.2% |
| French | 372 | 2.4% |
| French Canadian | 7 | 0.0% |
| German | 1,627 | 10.3% |
| Guamanian / Chamorro | 22 | 0.1% |
| Guatemalan | 7 | 0.0% |
| Honduran | 3 | 0.0% |
| Hopi | 18 | 0.1% |
| Hungarian | 27 | 0.2% |
| Icelander | 29 | 0.2% |
| Irish | 994 | 6.3% |
| Italian | 388 | 2.5% |
| Japanese | 29 | 0.2% |
| Korean | 181 | 1.1% |
| Laotian | 18 | 0.1% |
| Lebanese | 28 | 0.2% |
| Lithuanian | 4 | 0.0% |
| Marshallese | 163 | 1.0% |
| Mexican | 4,196 | 26.7% |
| Navajo | 8 | 0.1% |
| Nicaraguan | 7 | 0.0% |
| Northern European | 29 | 0.2% |
| Norwegian | 113 | 0.7% |
| Paiute | 96 | 0.6% |
| Peruvian | 2 | 0.0% |
| Polish | 152 | 1.0% |
| Portuguese | 87 | 0.5% |
| Puerto Rican | 69 | 0.4% |
| Romanian | 11 | 0.1% |
| Russian | 33 | 0.2% |
| Salvadoran | 38 | 0.2% |
| Samoan | 8 | 0.1% |
| Scandinavian | 65 | 0.4% |
| Scotch-Irish | 47 | 0.3% |
| Scottish | 181 | 1.1% |
| Serbian | 11 | 0.1% |
| South American | 2 | 0.0% |
| Spaniard | 101 | 0.6% |
| Spanish | 25 | 0.2% |
| Sri Lankan | 32 | 0.2% |
| Subsaharan African | 41 | 0.3% |
| Swedish | 132 | 0.8% |
| Swiss | 21 | 0.1% |
| Syrian | 19 | 0.1% |
| Thai | 8 | 0.1% |
| Ukrainian | 4 | 0.0% |
| Welsh | 54 | 0.3% | View All 72 Rows |
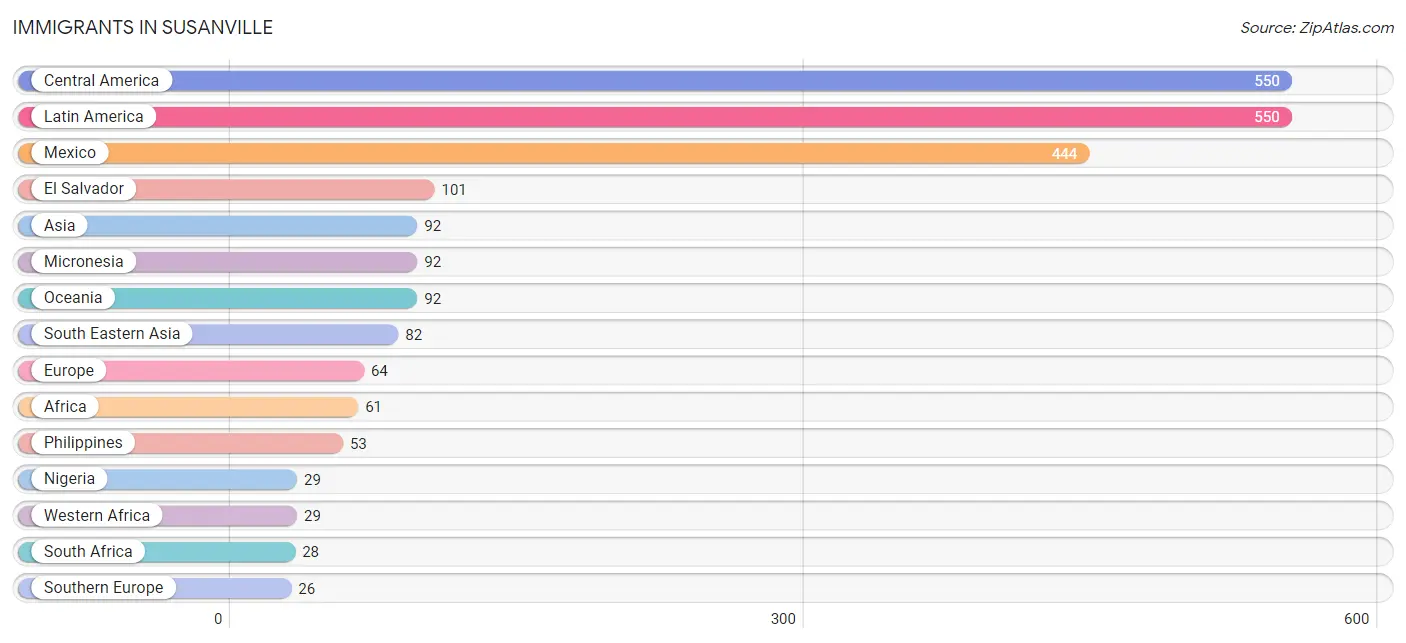
Immigrants in Susanville
The most numerous immigrant groups reported in Susanville came from Central America (550 | 3.5%), Latin America (550 | 3.5%), Mexico (444 | 2.8%), El Salvador (101 | 0.6%), and Asia (92 | 0.6%), together accounting for 11.0% of all Susanville residents.
| Immigration Origin | # Population | % Population |
| Africa | 61 | 0.4% |
| Armenia | 10 | 0.1% |
| Asia | 92 | 0.6% |
| Cameroon | 4 | 0.0% |
| Canada | 7 | 0.0% |
| Central America | 550 | 3.5% |
| El Salvador | 101 | 0.6% |
| England | 12 | 0.1% |
| Europe | 64 | 0.4% |
| Guatemala | 2 | 0.0% |
| Honduras | 3 | 0.0% |
| Indonesia | 6 | 0.0% |
| Ireland | 3 | 0.0% |
| Italy | 17 | 0.1% |
| Latin America | 550 | 3.5% |
| Mexico | 444 | 2.8% |
| Micronesia | 92 | 0.6% |
| Middle Africa | 4 | 0.0% |
| Nigeria | 29 | 0.2% |
| Northern Europe | 25 | 0.2% |
| Oceania | 92 | 0.6% |
| Philippines | 53 | 0.3% |
| South Africa | 28 | 0.2% |
| South Eastern Asia | 82 | 0.5% |
| Southern Europe | 26 | 0.2% |
| Spain | 9 | 0.1% |
| Switzerland | 13 | 0.1% |
| Vietnam | 23 | 0.2% |
| Western Africa | 29 | 0.2% |
| Western Asia | 10 | 0.1% |
| Western Europe | 13 | 0.1% | View All 31 Rows |
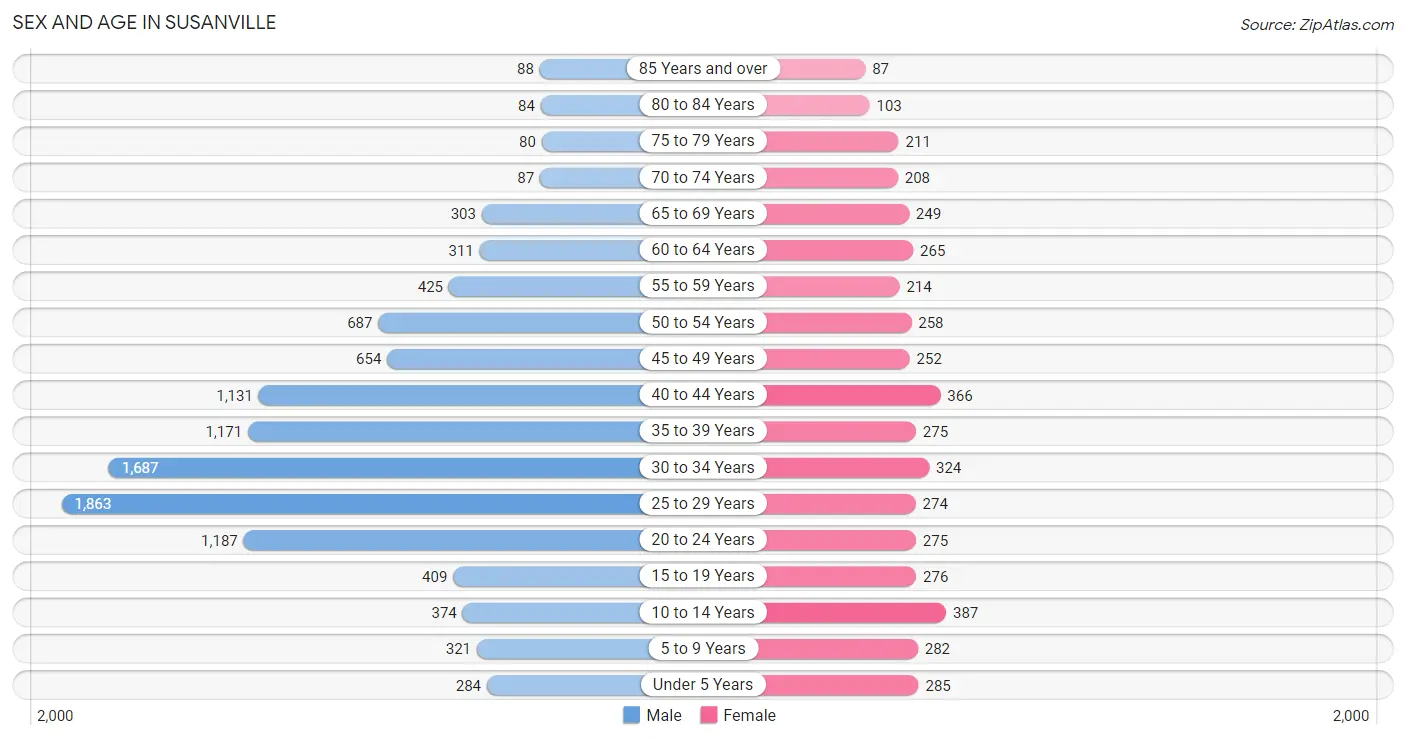
Sex and Age in Susanville
Sex and Age in Susanville
The most populous age groups in Susanville are 25 to 29 Years (1,863 | 16.7%) for men and 10 to 14 Years (387 | 8.4%) for women.
| Age Bracket | Male | Female |
| Under 5 Years | 284 (2.5%) | 285 (6.2%) |
| 5 to 9 Years | 321 (2.9%) | 282 (6.1%) |
| 10 to 14 Years | 374 (3.4%) | 387 (8.4%) |
| 15 to 19 Years | 409 (3.7%) | 276 (6.0%) |
| 20 to 24 Years | 1,187 (10.6%) | 275 (6.0%) |
| 25 to 29 Years | 1,863 (16.7%) | 274 (6.0%) |
| 30 to 34 Years | 1,687 (15.1%) | 324 (7.1%) |
| 35 to 39 Years | 1,171 (10.5%) | 275 (6.0%) |
| 40 to 44 Years | 1,131 (10.2%) | 366 (8.0%) |
| 45 to 49 Years | 654 (5.9%) | 252 (5.5%) |
| 50 to 54 Years | 687 (6.2%) | 258 (5.6%) |
| 55 to 59 Years | 425 (3.8%) | 214 (4.7%) |
| 60 to 64 Years | 311 (2.8%) | 265 (5.8%) |
| 65 to 69 Years | 303 (2.7%) | 249 (5.4%) |
| 70 to 74 Years | 87 (0.8%) | 208 (4.5%) |
| 75 to 79 Years | 80 (0.7%) | 211 (4.6%) |
| 80 to 84 Years | 84 (0.7%) | 103 (2.2%) |
| 85 Years and over | 88 (0.8%) | 87 (1.9%) |
| Total | 11,146 (100.0%) | 4,591 (100.0%) |
Families and Households in Susanville
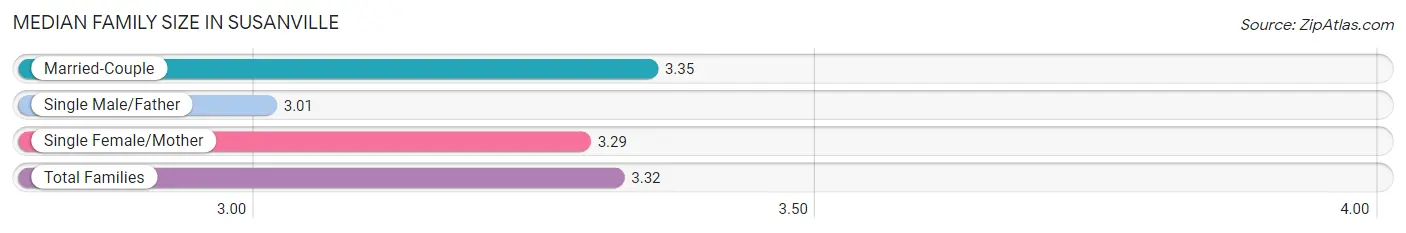
Median Family Size in Susanville
The median family size in Susanville is 3.32 persons per family, with married-couple families (1,593 | 77.3%) accounting for the largest median family size of 3.35 persons per family. On the other hand, single male/father families (153 | 7.4%) represent the smallest median family size with 3.01 persons per family.
| Family Type | # Families | Family Size |
| Married-Couple | 1,593 (77.3%) | 3.35 |
| Single Male/Father | 153 (7.4%) | 3.01 |
| Single Female/Mother | 316 (15.3%) | 3.29 |
| Total Families | 2,062 (100.0%) | 3.32 |
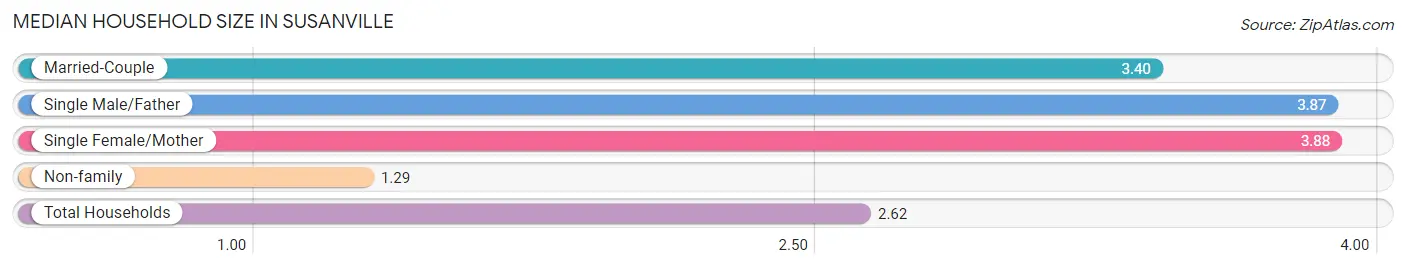
Median Household Size in Susanville
The median household size in Susanville is 2.62 persons per household, with single female/mother households (316 | 9.2%) accounting for the largest median household size of 3.88 persons per household. non-family households (1,385 | 40.2%) represent the smallest median household size with 1.29 persons per household.
| Household Type | # Households | Household Size |
| Married-Couple | 1,593 (46.2%) | 3.40 |
| Single Male/Father | 153 (4.4%) | 3.87 |
| Single Female/Mother | 316 (9.2%) | 3.88 |
| Non-family | 1,385 (40.2%) | 1.29 |
| Total Households | 3,447 (100.0%) | 2.62 |
Household Size by Marriage Status in Susanville
Out of a total of 3,447 households in Susanville, 2,062 (59.8%) are family households, while 1,385 (40.2%) are nonfamily households. The most numerous type of family households are 2-person households, comprising 954, and the most common type of nonfamily households are 1-person households, comprising 1,154.
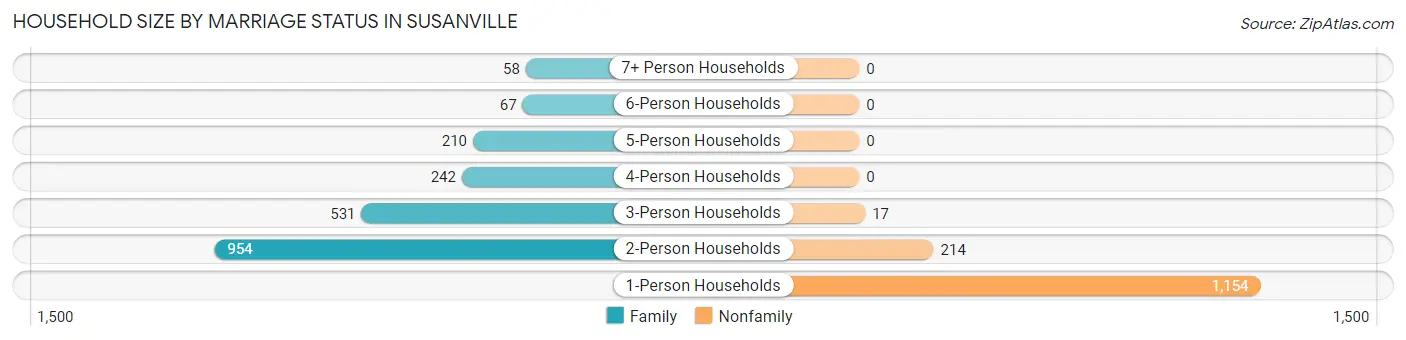
| Household Size | Family Households | Nonfamily Households |
| 1-Person Households | - | 1,154 (33.5%) |
| 2-Person Households | 954 (27.7%) | 214 (6.2%) |
| 3-Person Households | 531 (15.4%) | 17 (0.5%) |
| 4-Person Households | 242 (7.0%) | 0 (0.0%) |
| 5-Person Households | 210 (6.1%) | 0 (0.0%) |
| 6-Person Households | 67 (1.9%) | 0 (0.0%) |
| 7+ Person Households | 58 (1.7%) | 0 (0.0%) |
| Total | 2,062 (59.8%) | 1,385 (40.2%) |
Female Fertility in Susanville
Fertility by Age in Susanville
Average fertility rate in Susanville is 42.0 births per 1,000 women. Women in the age bracket of 20 to 34 years have the highest fertility rate with 66.0 births per 1,000 women. Women in the age bracket of 20 to 34 years acount for 65.9% of all women with births.
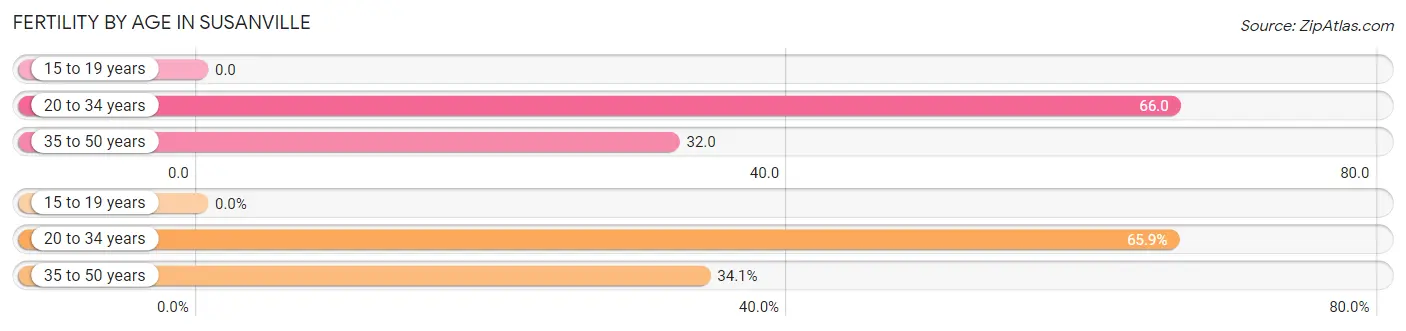
| Age Bracket | Women with Births | Births / 1,000 Women |
| 15 to 19 years | 0 (0.0%) | 0.0 |
| 20 to 34 years | 58 (65.9%) | 66.0 |
| 35 to 50 years | 30 (34.1%) | 32.0 |
| Total | 88 (100.0%) | 42.0 |
Fertility by Age by Marriage Status in Susanville
44.3% of women with births (88) in Susanville are married. The highest percentage of unmarried women with births falls into 20 to 34 years age bracket with 63.8% of them unmarried at the time of birth, while the lowest percentage of unmarried women with births belong to 35 to 50 years age bracket with 40.0% of them unmarried.
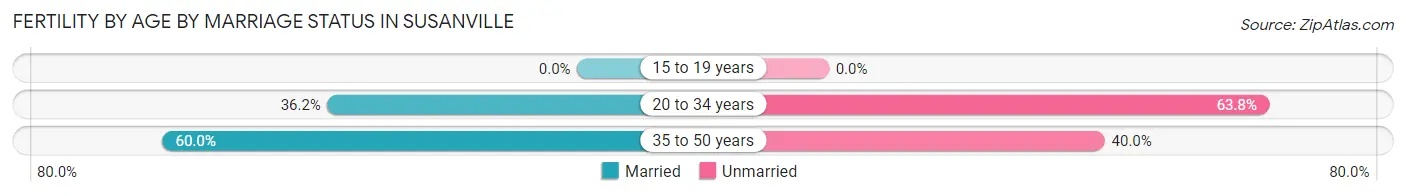
| Age Bracket | Married | Unmarried |
| 15 to 19 years | 0 (0.0%) | 0 (0.0%) |
| 20 to 34 years | 21 (36.2%) | 37 (63.8%) |
| 35 to 50 years | 18 (60.0%) | 12 (40.0%) |
| Total | 39 (44.3%) | 49 (55.7%) |
Fertility by Education in Susanville
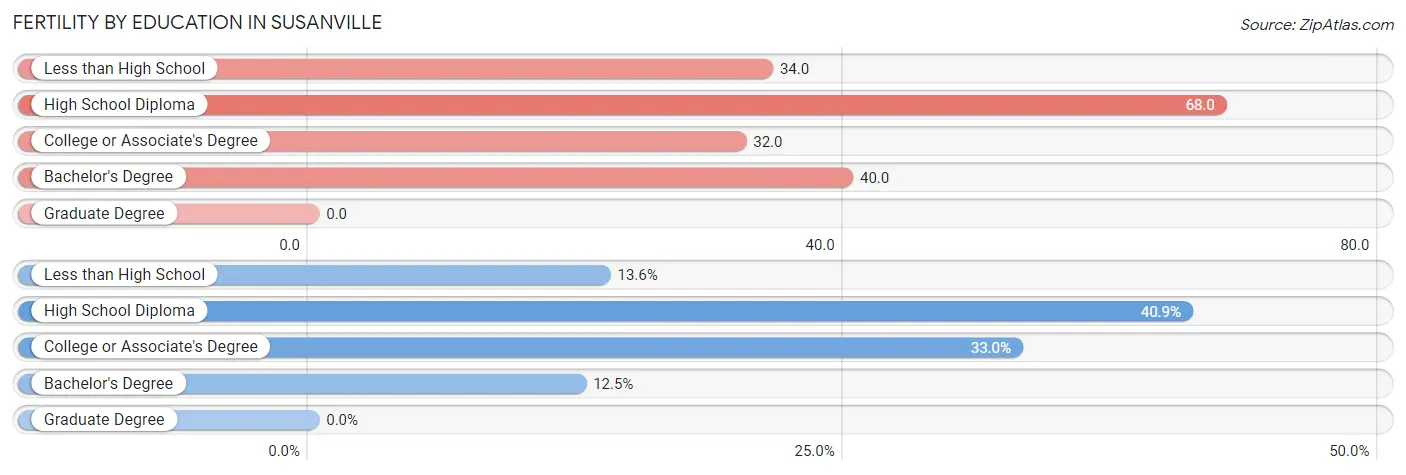
| Educational Attainment | Women with Births | Births / 1,000 Women |
| Less than High School | 12 (13.6%) | 34.0 |
| High School Diploma | 36 (40.9%) | 68.0 |
| College or Associate's Degree | 29 (33.0%) | 32.0 |
| Bachelor's Degree | 11 (12.5%) | 40.0 |
| Graduate Degree | 0 (0.0%) | 0.0 |
| Total | 88 (100.0%) | 42.0 |
Fertility by Education by Marriage Status in Susanville
55.7% of women with births in Susanville are unmarried. Women with the educational attainment of bachelor's degree are most likely to be married with 100.0% of them married at childbirth, while women with the educational attainment of less than high school are least likely to be married with 100.0% of them unmarried at childbirth.
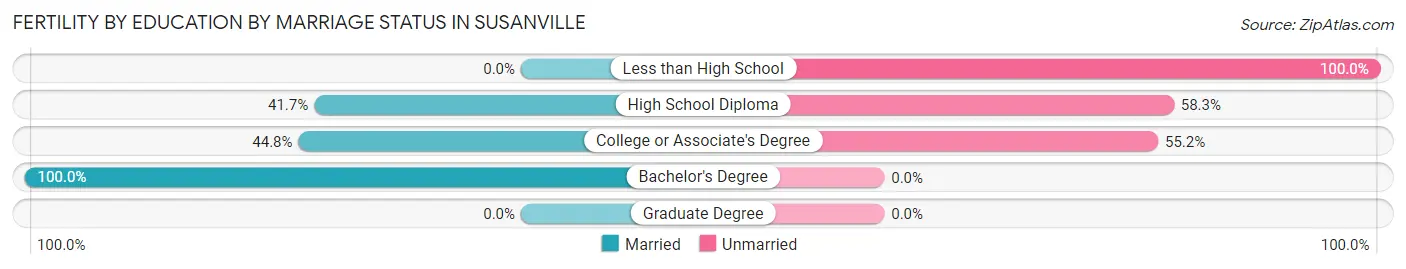
| Educational Attainment | Married | Unmarried |
| Less than High School | 0 (0.0%) | 12 (100.0%) |
| High School Diploma | 15 (41.7%) | 21 (58.3%) |
| College or Associate's Degree | 13 (44.8%) | 16 (55.2%) |
| Bachelor's Degree | 11 (100.0%) | 0 (0.0%) |
| Graduate Degree | 0 (0.0%) | 0 (0.0%) |
| Total | 39 (44.3%) | 49 (55.7%) |
Employment Characteristics in Susanville
Employment by Class of Employer in Susanville
Among the 3,895 employed individuals in Susanville, private company employees (1,593 | 40.9%), state government employees (1,040 | 26.7%), and federal government employees (435 | 11.2%) make up the most common classes of employment.
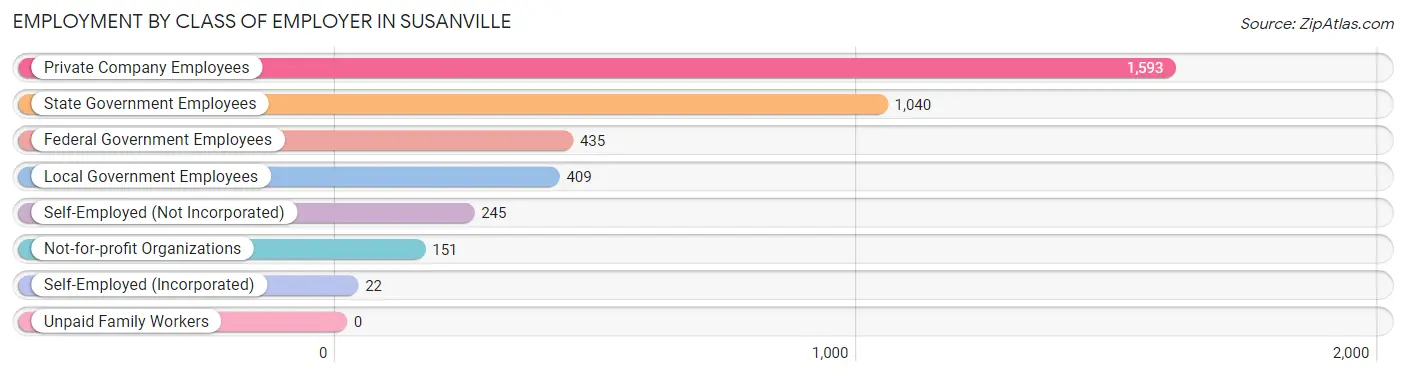
| Employer Class | # Employees | % Employees |
| Private Company Employees | 1,593 | 40.9% |
| Self-Employed (Incorporated) | 22 | 0.6% |
| Self-Employed (Not Incorporated) | 245 | 6.3% |
| Not-for-profit Organizations | 151 | 3.9% |
| Local Government Employees | 409 | 10.5% |
| State Government Employees | 1,040 | 26.7% |
| Federal Government Employees | 435 | 11.2% |
| Unpaid Family Workers | 0 | 0.0% |
| Total | 3,895 | 100.0% |
Employment Status by Age in Susanville
According to the labor force statistics for Susanville, out of the total population over 16 years of age (13,653), 31.1% or 4,246 individuals are in the labor force, with 7.3% or 310 of them unemployed. The age group with the highest labor force participation rate is 45 to 54 years, with 44.1% or 816 individuals in the labor force. Within the labor force, the 60 to 64 years age range has the highest percentage of unemployed individuals, with 15.9% or 36 of them being unemployed.
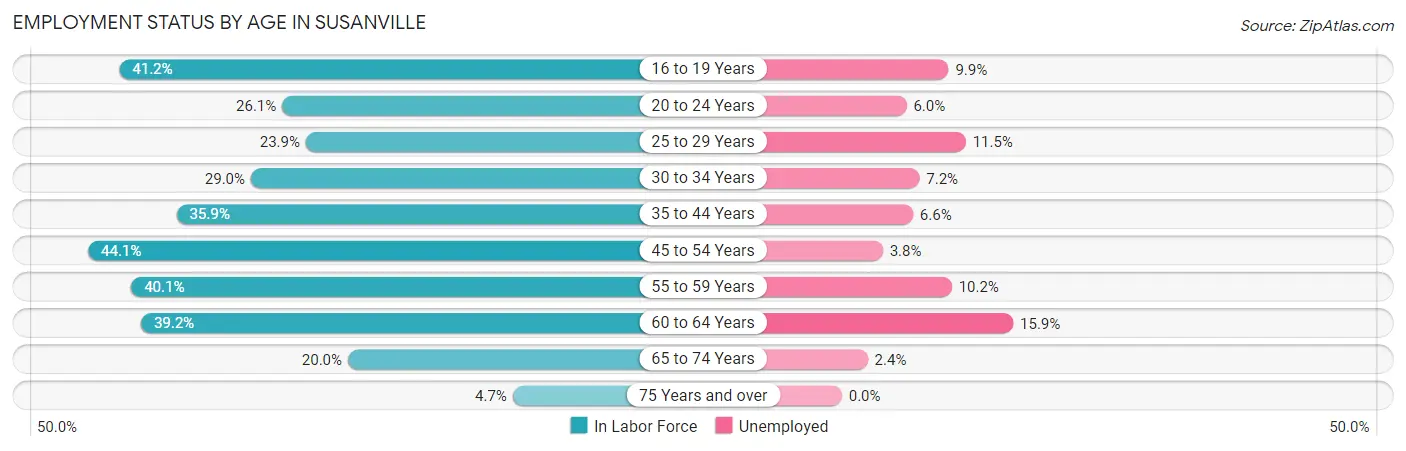
| Age Bracket | In Labor Force | Unemployed |
| 16 to 19 Years | 220 (41.2%) | 22 (9.9%) |
| 20 to 24 Years | 382 (26.1%) | 23 (6.0%) |
| 25 to 29 Years | 511 (23.9%) | 59 (11.5%) |
| 30 to 34 Years | 583 (29.0%) | 42 (7.2%) |
| 35 to 44 Years | 1,057 (35.9%) | 70 (6.6%) |
| 45 to 54 Years | 816 (44.1%) | 31 (3.8%) |
| 55 to 59 Years | 256 (40.1%) | 26 (10.2%) |
| 60 to 64 Years | 226 (39.2%) | 36 (15.9%) |
| 65 to 74 Years | 169 (20.0%) | 4 (2.4%) |
| 75 Years and over | 31 (4.7%) | 0 (0.0%) |
| Total | 4,246 (31.1%) | 310 (7.3%) |
Employment Status by Educational Attainment in Susanville
According to labor force statistics for Susanville, 34.0% of individuals (3,453) out of the total population between 25 and 64 years of age (10,157) are in the labor force, with 7.6% or 262 of them being unemployed. The group with the highest labor force participation rate are those with the educational attainment of bachelor's degree or higher, with 79.9% or 575 individuals in the labor force. Within the labor force, individuals with less than high school education have the highest percentage of unemployment, with 17.3% or 41 of them being unemployed.
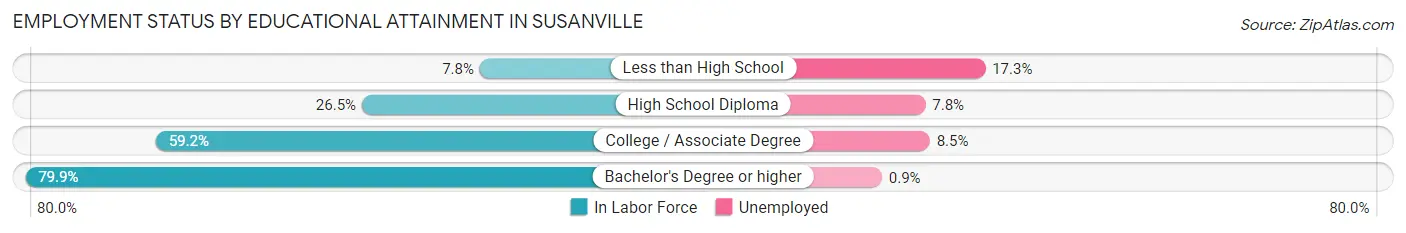
| Educational Attainment | In Labor Force | Unemployed |
| Less than High School | 238 (7.8%) | 527 (17.3%) |
| High School Diploma | 929 (26.5%) | 274 (7.8%) |
| College / Associate Degree | 1,706 (59.2%) | 245 (8.5%) |
| Bachelor's Degree or higher | 575 (79.9%) | 6 (0.9%) |
| Total | 3,453 (34.0%) | 772 (7.6%) |
Employment Occupations by Sex in Susanville
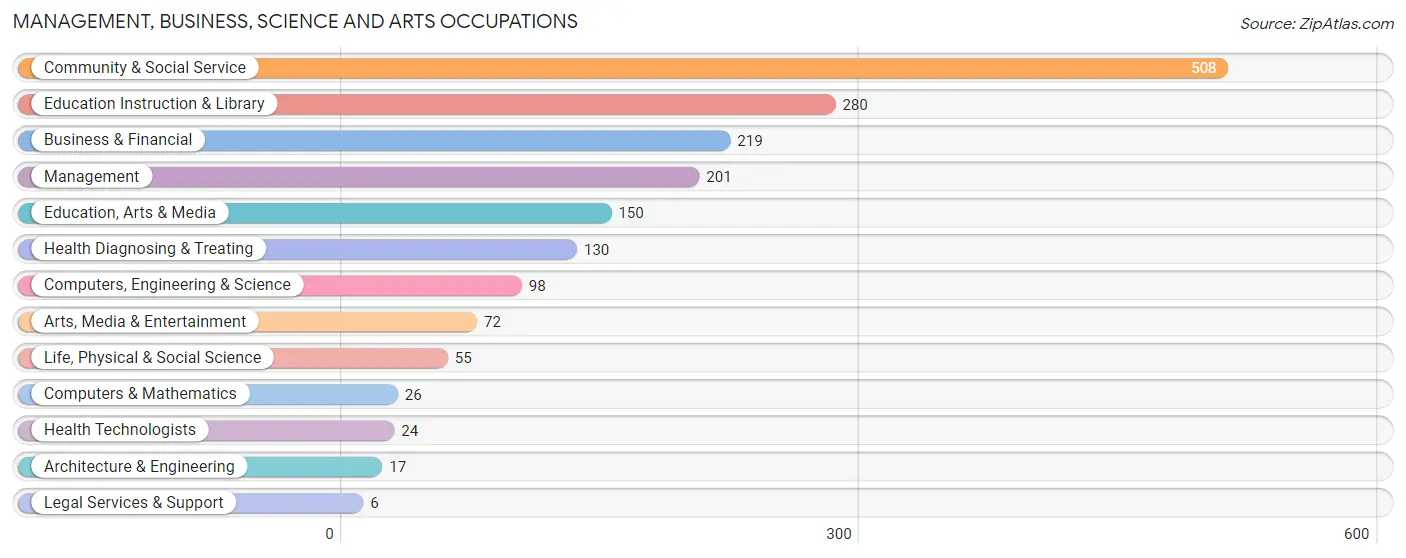
Management, Business, Science and Arts Occupations
The most common Management, Business, Science and Arts occupations in Susanville are Community & Social Service (508 | 12.9%), Education Instruction & Library (280 | 7.1%), Business & Financial (219 | 5.6%), Management (201 | 5.1%), and Education, Arts & Media (150 | 3.8%).
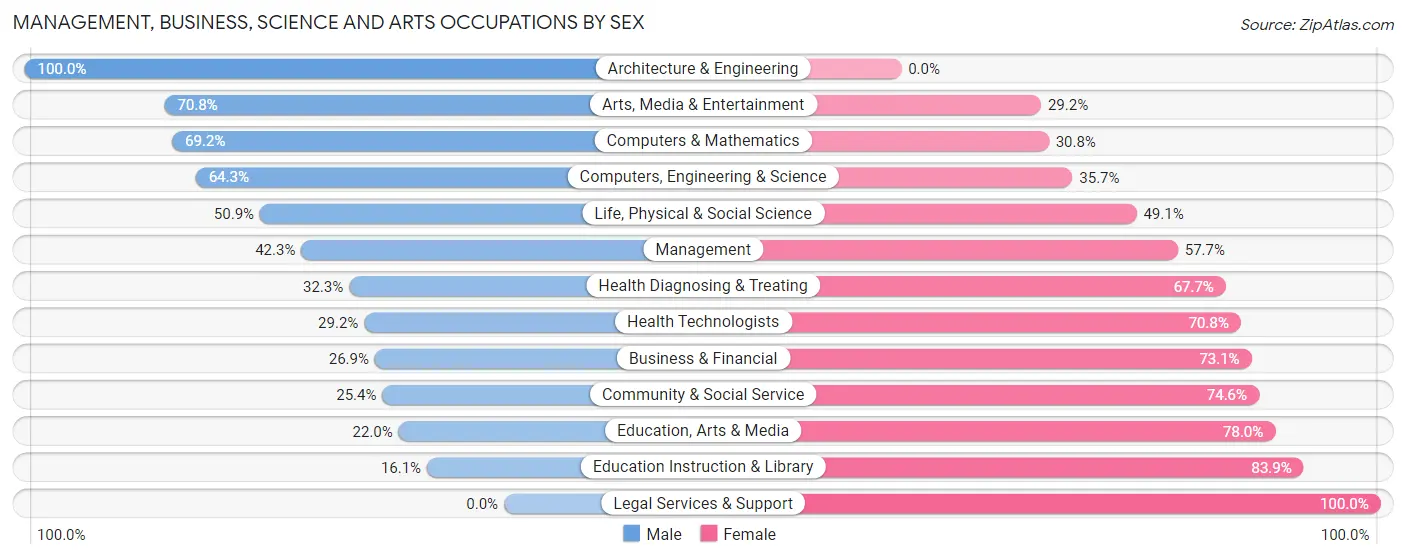
Management, Business, Science and Arts Occupations by Sex
Within the Management, Business, Science and Arts occupations in Susanville, the most male-oriented occupations are Architecture & Engineering (100.0%), Arts, Media & Entertainment (70.8%), and Computers & Mathematics (69.2%), while the most female-oriented occupations are Legal Services & Support (100.0%), Education Instruction & Library (83.9%), and Education, Arts & Media (78.0%).
| Occupation | Male | Female |
| Management | 85 (42.3%) | 116 (57.7%) |
| Business & Financial | 59 (26.9%) | 160 (73.1%) |
| Computers, Engineering & Science | 63 (64.3%) | 35 (35.7%) |
| Computers & Mathematics | 18 (69.2%) | 8 (30.8%) |
| Architecture & Engineering | 17 (100.0%) | 0 (0.0%) |
| Life, Physical & Social Science | 28 (50.9%) | 27 (49.1%) |
| Community & Social Service | 129 (25.4%) | 379 (74.6%) |
| Education, Arts & Media | 33 (22.0%) | 117 (78.0%) |
| Legal Services & Support | 0 (0.0%) | 6 (100.0%) |
| Education Instruction & Library | 45 (16.1%) | 235 (83.9%) |
| Arts, Media & Entertainment | 51 (70.8%) | 21 (29.2%) |
| Health Diagnosing & Treating | 42 (32.3%) | 88 (67.7%) |
| Health Technologists | 7 (29.2%) | 17 (70.8%) |
| Total (Category) | 378 (32.7%) | 778 (67.3%) |
| Total (Overall) | 2,141 (54.5%) | 1,786 (45.5%) |
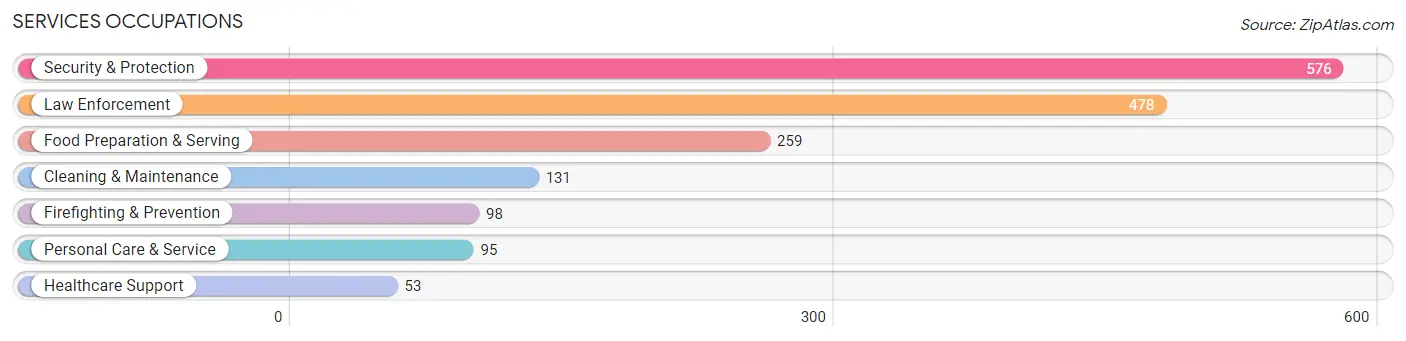
Services Occupations
The most common Services occupations in Susanville are Security & Protection (576 | 14.7%), Law Enforcement (478 | 12.2%), Food Preparation & Serving (259 | 6.6%), Cleaning & Maintenance (131 | 3.3%), and Firefighting & Prevention (98 | 2.5%).
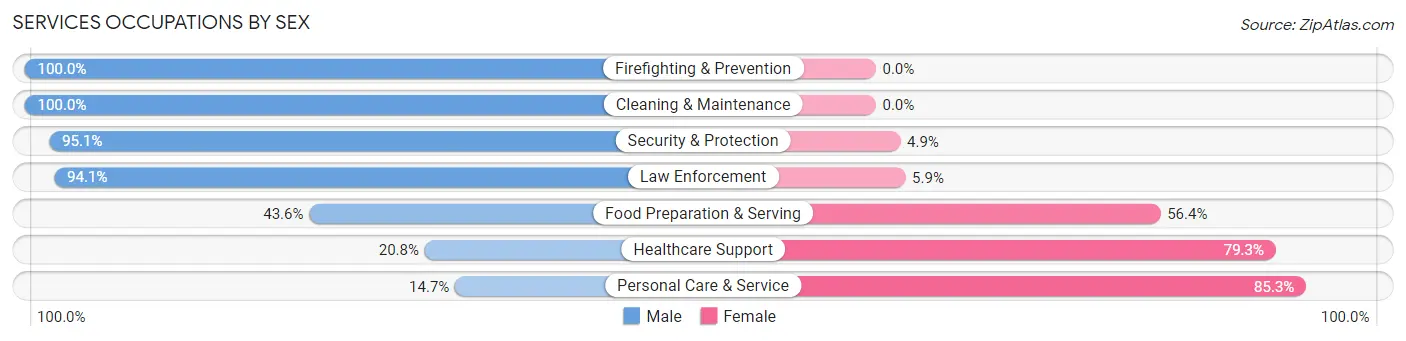
Services Occupations by Sex
Within the Services occupations in Susanville, the most male-oriented occupations are Firefighting & Prevention (100.0%), Cleaning & Maintenance (100.0%), and Security & Protection (95.1%), while the most female-oriented occupations are Personal Care & Service (85.3%), Healthcare Support (79.2%), and Food Preparation & Serving (56.4%).
| Occupation | Male | Female |
| Healthcare Support | 11 (20.7%) | 42 (79.2%) |
| Security & Protection | 548 (95.1%) | 28 (4.9%) |
| Firefighting & Prevention | 98 (100.0%) | 0 (0.0%) |
| Law Enforcement | 450 (94.1%) | 28 (5.9%) |
| Food Preparation & Serving | 113 (43.6%) | 146 (56.4%) |
| Cleaning & Maintenance | 131 (100.0%) | 0 (0.0%) |
| Personal Care & Service | 14 (14.7%) | 81 (85.3%) |
| Total (Category) | 817 (73.3%) | 297 (26.7%) |
| Total (Overall) | 2,141 (54.5%) | 1,786 (45.5%) |
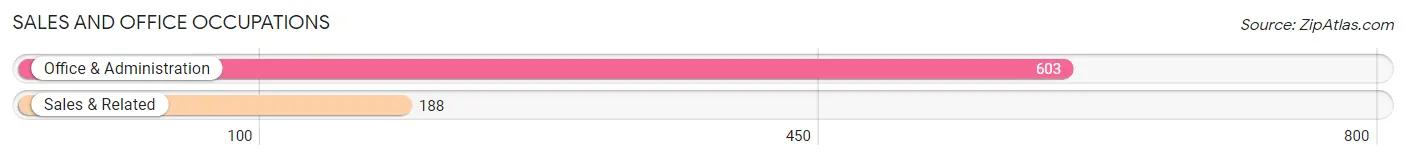
Sales and Office Occupations
The most common Sales and Office occupations in Susanville are Office & Administration (603 | 15.4%), and Sales & Related (188 | 4.8%).
Sales and Office Occupations by Sex
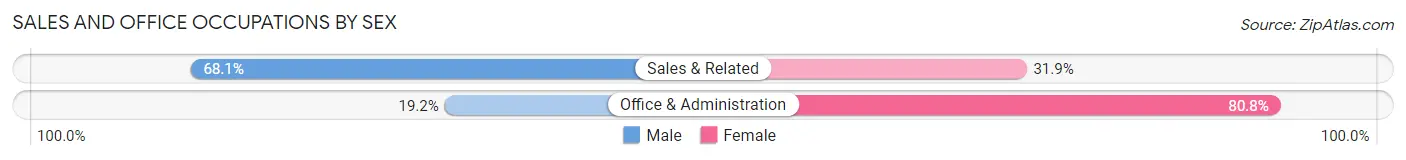
| Occupation | Male | Female |
| Sales & Related | 128 (68.1%) | 60 (31.9%) |
| Office & Administration | 116 (19.2%) | 487 (80.8%) |
| Total (Category) | 244 (30.8%) | 547 (69.2%) |
| Total (Overall) | 2,141 (54.5%) | 1,786 (45.5%) |
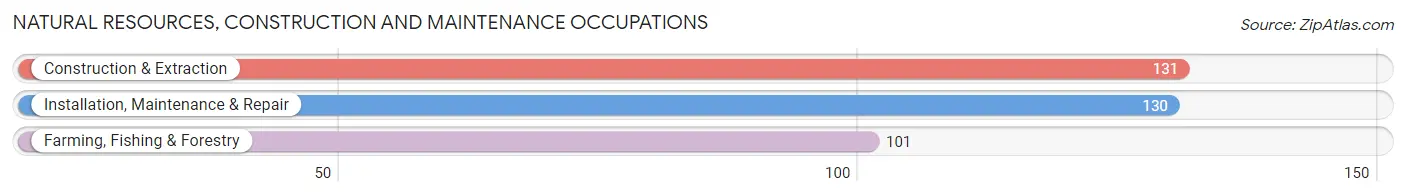
Natural Resources, Construction and Maintenance Occupations
The most common Natural Resources, Construction and Maintenance occupations in Susanville are Construction & Extraction (131 | 3.3%), Installation, Maintenance & Repair (130 | 3.3%), and Farming, Fishing & Forestry (101 | 2.6%).
Natural Resources, Construction and Maintenance Occupations by Sex
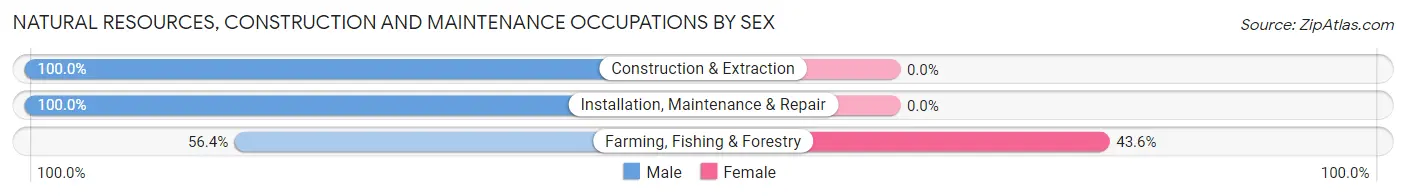
| Occupation | Male | Female |
| Farming, Fishing & Forestry | 57 (56.4%) | 44 (43.6%) |
| Construction & Extraction | 131 (100.0%) | 0 (0.0%) |
| Installation, Maintenance & Repair | 130 (100.0%) | 0 (0.0%) |
| Total (Category) | 318 (87.8%) | 44 (12.1%) |
| Total (Overall) | 2,141 (54.5%) | 1,786 (45.5%) |
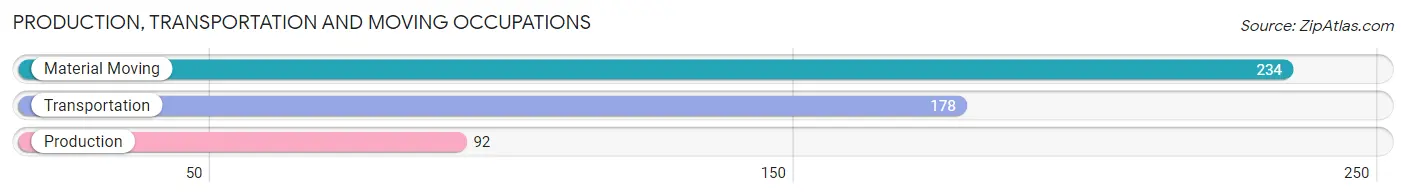
Production, Transportation and Moving Occupations
The most common Production, Transportation and Moving occupations in Susanville are Material Moving (234 | 6.0%), Transportation (178 | 4.5%), and Production (92 | 2.3%).
Production, Transportation and Moving Occupations by Sex
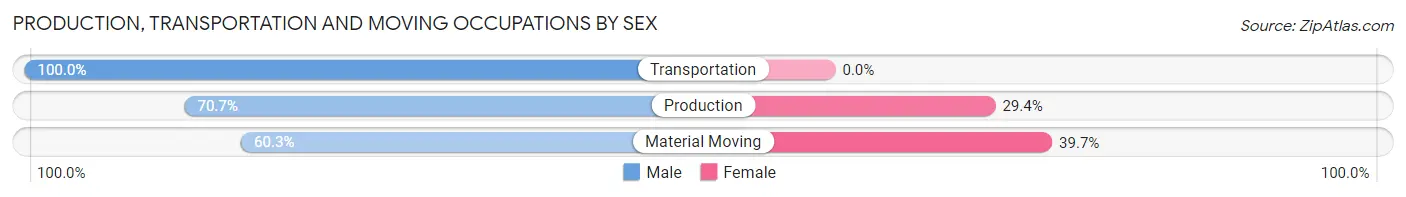
| Occupation | Male | Female |
| Production | 65 (70.7%) | 27 (29.3%) |
| Transportation | 178 (100.0%) | 0 (0.0%) |
| Material Moving | 141 (60.3%) | 93 (39.7%) |
| Total (Category) | 384 (76.2%) | 120 (23.8%) |
| Total (Overall) | 2,141 (54.5%) | 1,786 (45.5%) |
Employment Industries by Sex in Susanville
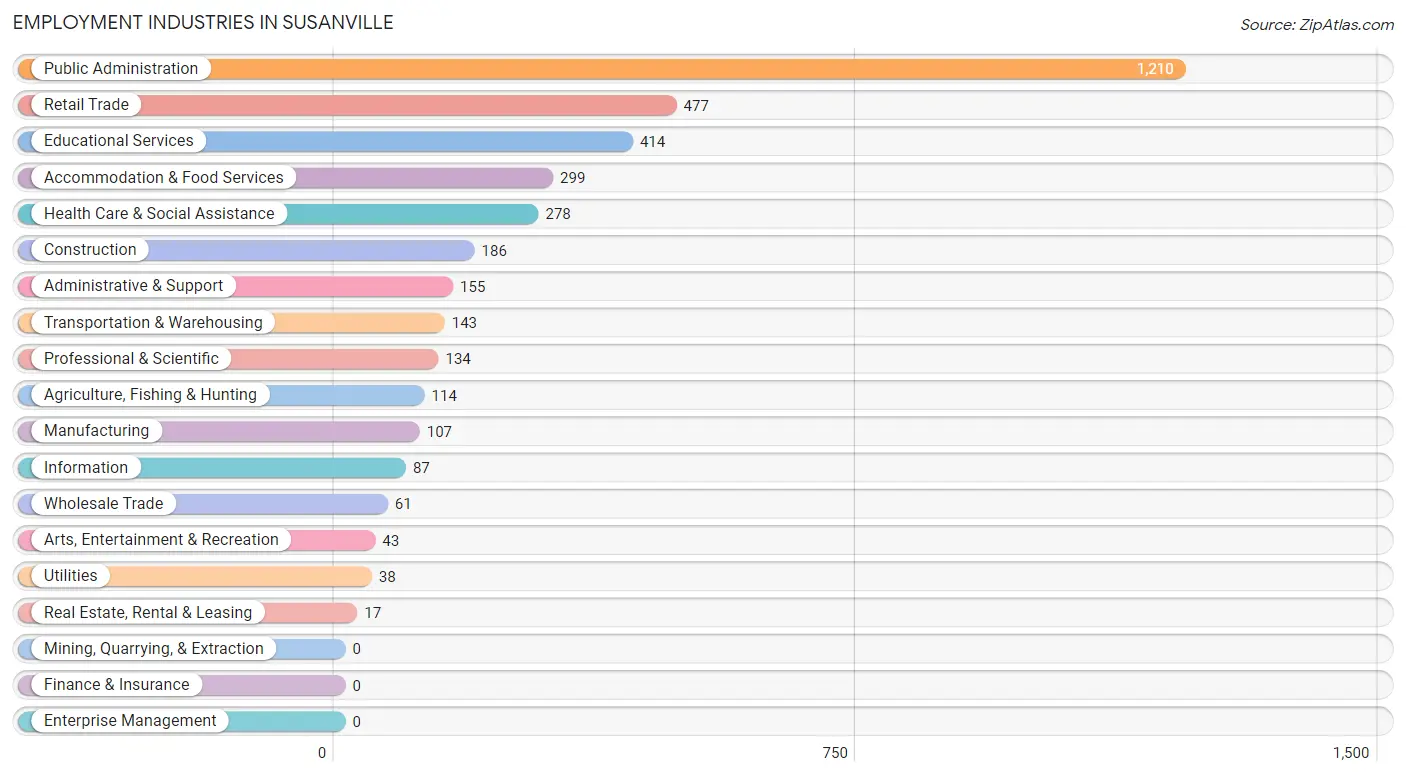
Employment Industries in Susanville
The major employment industries in Susanville include Public Administration (1,210 | 30.8%), Retail Trade (477 | 12.1%), Educational Services (414 | 10.5%), Accommodation & Food Services (299 | 7.6%), and Health Care & Social Assistance (278 | 7.1%).
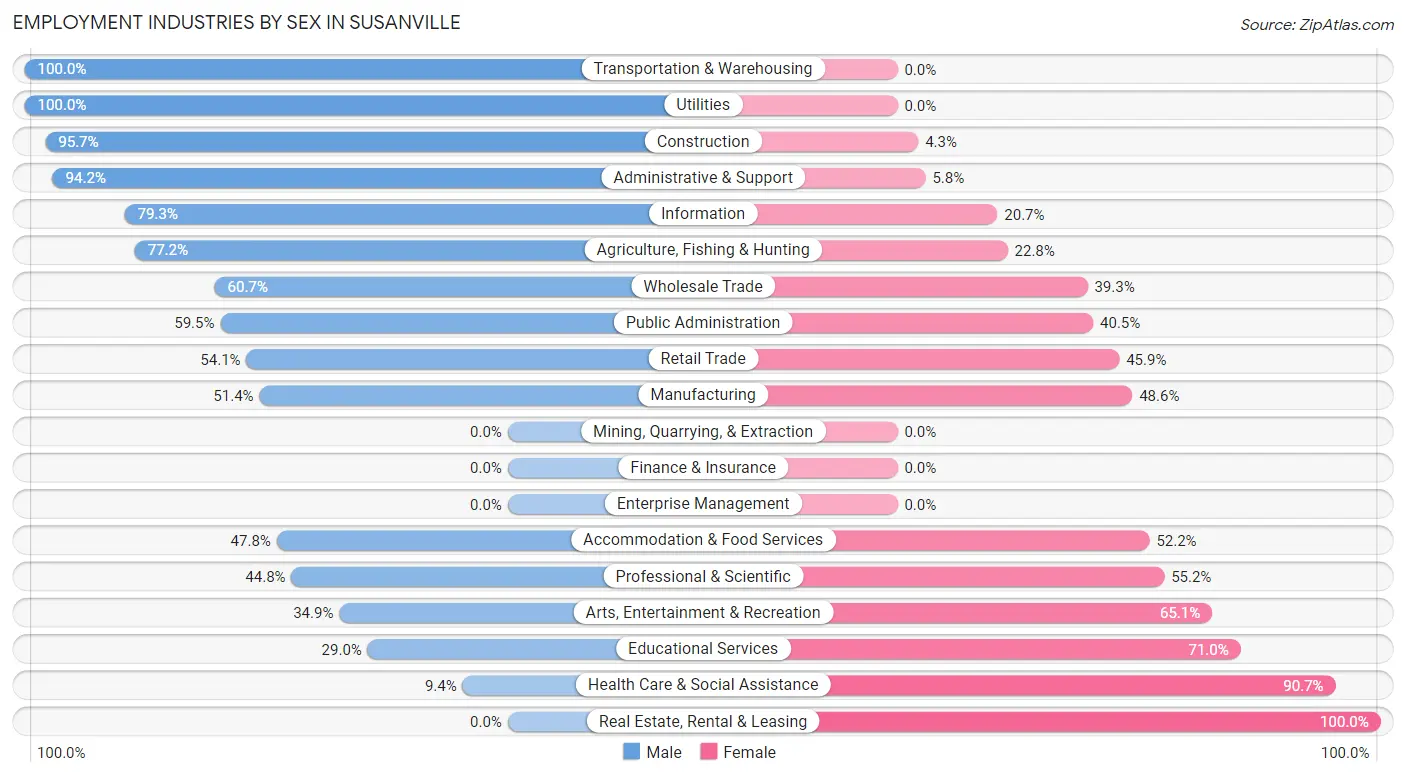
Employment Industries by Sex in Susanville
The Susanville industries that see more men than women are Transportation & Warehousing (100.0%), Utilities (100.0%), and Construction (95.7%), whereas the industries that tend to have a higher number of women are Real Estate, Rental & Leasing (100.0%), Health Care & Social Assistance (90.6%), and Educational Services (71.0%).
| Industry | Male | Female |
| Agriculture, Fishing & Hunting | 88 (77.2%) | 26 (22.8%) |
| Mining, Quarrying, & Extraction | 0 (0.0%) | 0 (0.0%) |
| Construction | 178 (95.7%) | 8 (4.3%) |
| Manufacturing | 55 (51.4%) | 52 (48.6%) |
| Wholesale Trade | 37 (60.7%) | 24 (39.3%) |
| Retail Trade | 258 (54.1%) | 219 (45.9%) |
| Transportation & Warehousing | 143 (100.0%) | 0 (0.0%) |
| Utilities | 38 (100.0%) | 0 (0.0%) |
| Information | 69 (79.3%) | 18 (20.7%) |
| Finance & Insurance | 0 (0.0%) | 0 (0.0%) |
| Real Estate, Rental & Leasing | 0 (0.0%) | 17 (100.0%) |
| Professional & Scientific | 60 (44.8%) | 74 (55.2%) |
| Enterprise Management | 0 (0.0%) | 0 (0.0%) |
| Administrative & Support | 146 (94.2%) | 9 (5.8%) |
| Educational Services | 120 (29.0%) | 294 (71.0%) |
| Health Care & Social Assistance | 26 (9.3%) | 252 (90.6%) |
| Arts, Entertainment & Recreation | 15 (34.9%) | 28 (65.1%) |
| Accommodation & Food Services | 143 (47.8%) | 156 (52.2%) |
| Public Administration | 720 (59.5%) | 490 (40.5%) |
| Total | 2,141 (54.5%) | 1,786 (45.5%) |
Education in Susanville
School Enrollment in Susanville
The most common levels of schooling among the 2,467 students in Susanville are high school (712 | 28.9%), elementary school (525 | 21.3%), and college / undergraduate (525 | 21.3%).
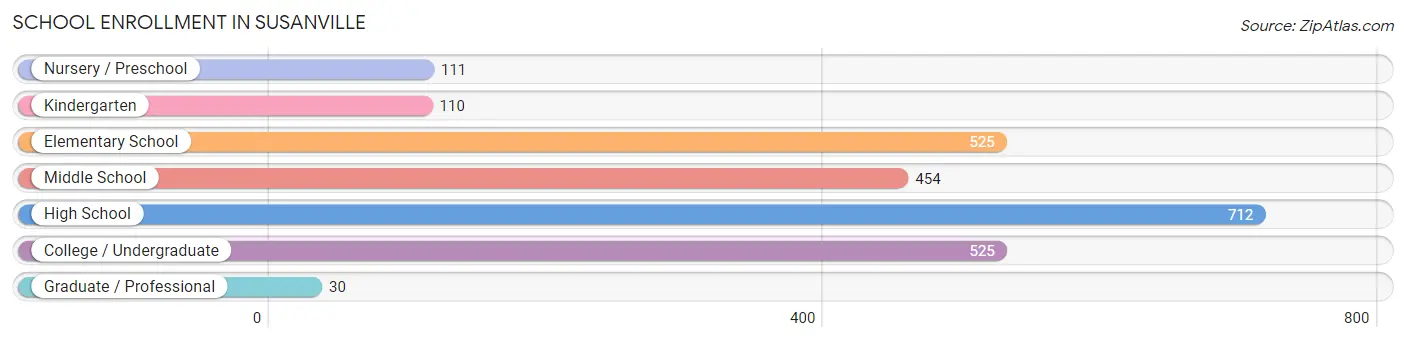
| School Level | # Students | % Students |
| Nursery / Preschool | 111 | 4.5% |
| Kindergarten | 110 | 4.5% |
| Elementary School | 525 | 21.3% |
| Middle School | 454 | 18.4% |
| High School | 712 | 28.9% |
| College / Undergraduate | 525 | 21.3% |
| Graduate / Professional | 30 | 1.2% |
| Total | 2,467 | 100.0% |
School Enrollment by Age by Funding Source in Susanville
Out of a total of 2,467 students who are enrolled in schools in Susanville, 385 (15.6%) attend a private institution, while the remaining 2,082 (84.4%) are enrolled in public schools. The age group of 25 to 34 year olds has the highest likelihood of being enrolled in private schools, with 123 (58.0% in the age bracket) enrolled. Conversely, the age group of 15 to 17 year olds has the lowest likelihood of being enrolled in a private school, with 417 (96.1% in the age bracket) attending a public institution.
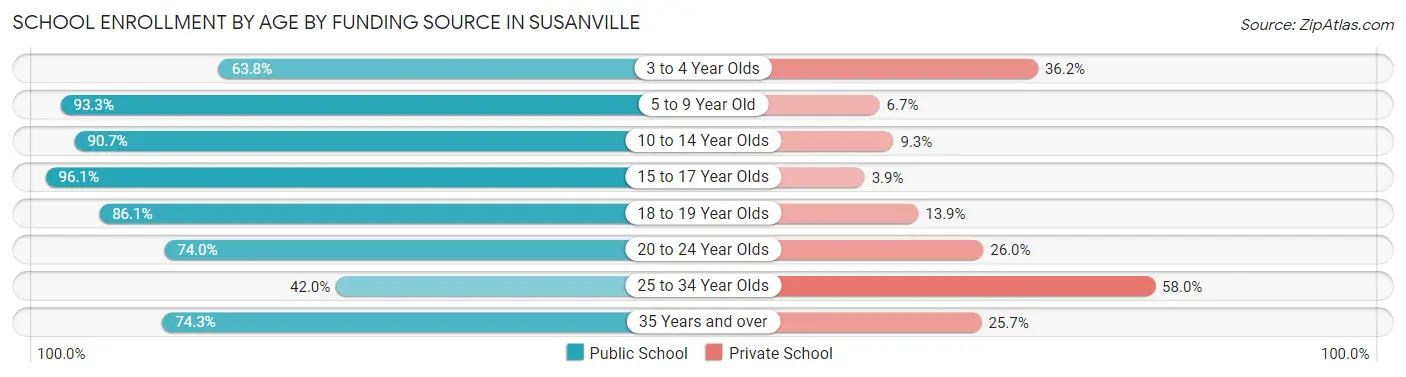
| Age Bracket | Public School | Private School |
| 3 to 4 Year Olds | 67 (63.8%) | 38 (36.2%) |
| 5 to 9 Year Old | 557 (93.3%) | 40 (6.7%) |
| 10 to 14 Year Olds | 566 (90.7%) | 58 (9.3%) |
| 15 to 17 Year Olds | 417 (96.1%) | 17 (3.9%) |
| 18 to 19 Year Olds | 130 (86.1%) | 21 (13.9%) |
| 20 to 24 Year Olds | 145 (74.0%) | 51 (26.0%) |
| 25 to 34 Year Olds | 89 (42.0%) | 123 (58.0%) |
| 35 Years and over | 110 (74.3%) | 38 (25.7%) |
| Total | 2,082 (84.4%) | 385 (15.6%) |
Educational Attainment by Field of Study in Susanville
Business (188 | 18.6%), education (171 | 16.9%), bio, nature & agricultural (133 | 13.1%), liberal arts & history (125 | 12.3%), and arts & humanities (115 | 11.4%) are the most common fields of study among 1,013 individuals in Susanville who have obtained a bachelor's degree or higher.
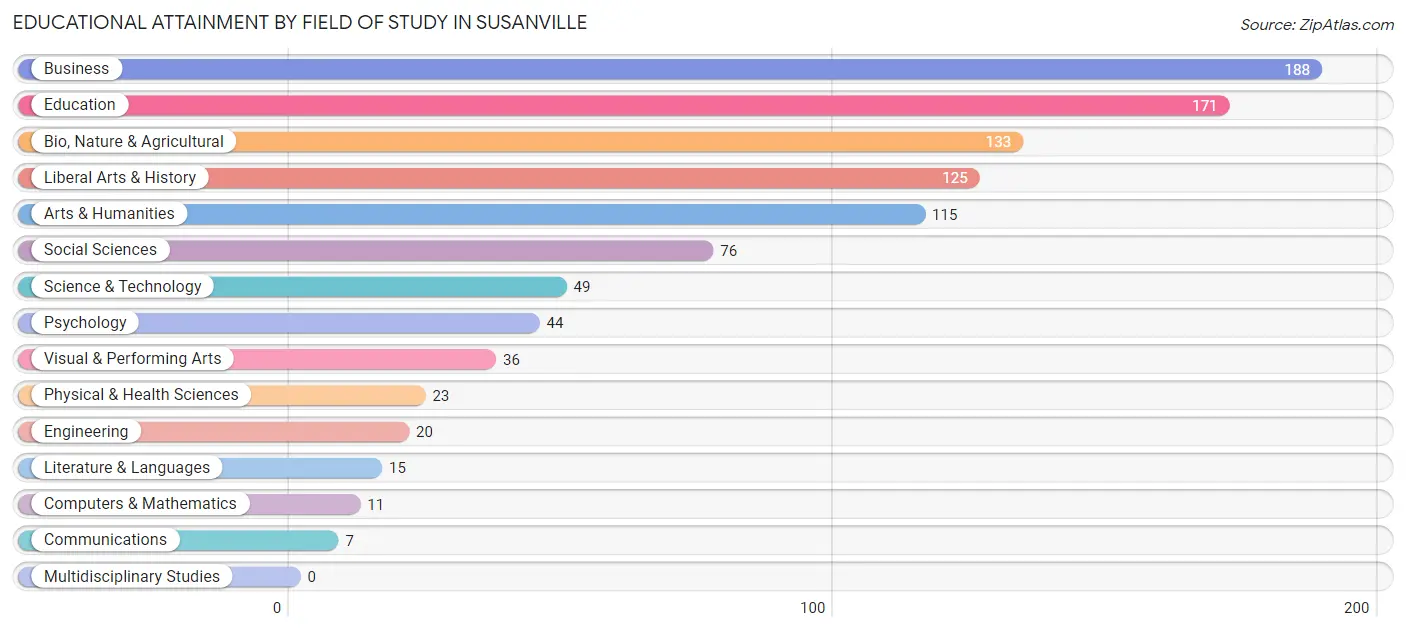
| Field of Study | # Graduates | % Graduates |
| Computers & Mathematics | 11 | 1.1% |
| Bio, Nature & Agricultural | 133 | 13.1% |
| Physical & Health Sciences | 23 | 2.3% |
| Psychology | 44 | 4.3% |
| Social Sciences | 76 | 7.5% |
| Engineering | 20 | 2.0% |
| Multidisciplinary Studies | 0 | 0.0% |
| Science & Technology | 49 | 4.8% |
| Business | 188 | 18.6% |
| Education | 171 | 16.9% |
| Literature & Languages | 15 | 1.5% |
| Liberal Arts & History | 125 | 12.3% |
| Visual & Performing Arts | 36 | 3.5% |
| Communications | 7 | 0.7% |
| Arts & Humanities | 115 | 11.4% |
| Total | 1,013 | 100.0% |
Transportation & Commute in Susanville
Vehicle Availability by Sex in Susanville
The most prevalent vehicle ownership categories in Susanville are males with 2 vehicles (857, accounting for 40.9%) and females with 2 vehicles (770, making up 48.9%).
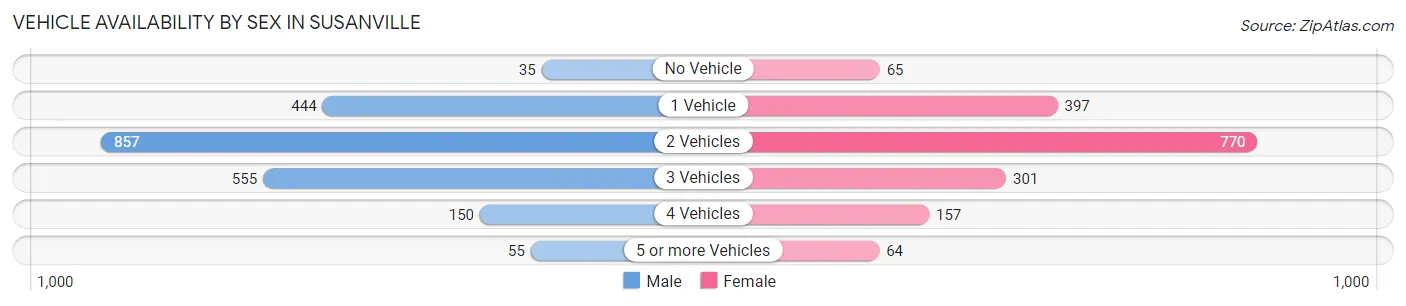
| Vehicles Available | Male | Female |
| No Vehicle | 35 (1.7%) | 65 (3.7%) |
| 1 Vehicle | 444 (21.2%) | 397 (22.6%) |
| 2 Vehicles | 857 (40.9%) | 770 (43.9%) |
| 3 Vehicles | 555 (26.5%) | 301 (17.2%) |
| 4 Vehicles | 150 (7.2%) | 157 (8.9%) |
| 5 or more Vehicles | 55 (2.6%) | 64 (3.6%) |
| Total | 2,096 (100.0%) | 1,754 (100.0%) |
Commute Time in Susanville
The most frequently occuring commute durations in Susanville are 5 to 9 minutes (909 commuters, 23.9%), 10 to 14 minutes (849 commuters, 22.3%), and 15 to 19 minutes (728 commuters, 19.1%).
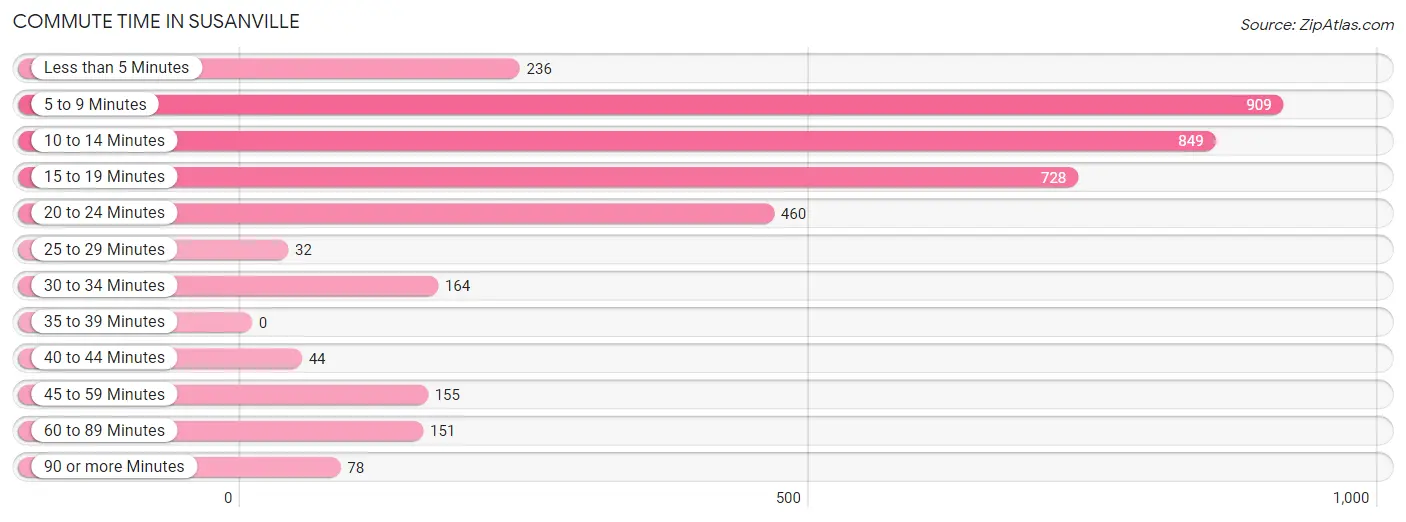
| Commute Time | # Commuters | % Commuters |
| Less than 5 Minutes | 236 | 6.2% |
| 5 to 9 Minutes | 909 | 23.9% |
| 10 to 14 Minutes | 849 | 22.3% |
| 15 to 19 Minutes | 728 | 19.1% |
| 20 to 24 Minutes | 460 | 12.1% |
| 25 to 29 Minutes | 32 | 0.8% |
| 30 to 34 Minutes | 164 | 4.3% |
| 35 to 39 Minutes | 0 | 0.0% |
| 40 to 44 Minutes | 44 | 1.2% |
| 45 to 59 Minutes | 155 | 4.1% |
| 60 to 89 Minutes | 151 | 4.0% |
| 90 or more Minutes | 78 | 2.1% |
Commute Time by Sex in Susanville
The most common commute times in Susanville are 15 to 19 minutes (486 commuters, 23.2%) for males and 10 to 14 minutes (496 commuters, 29.0%) for females.
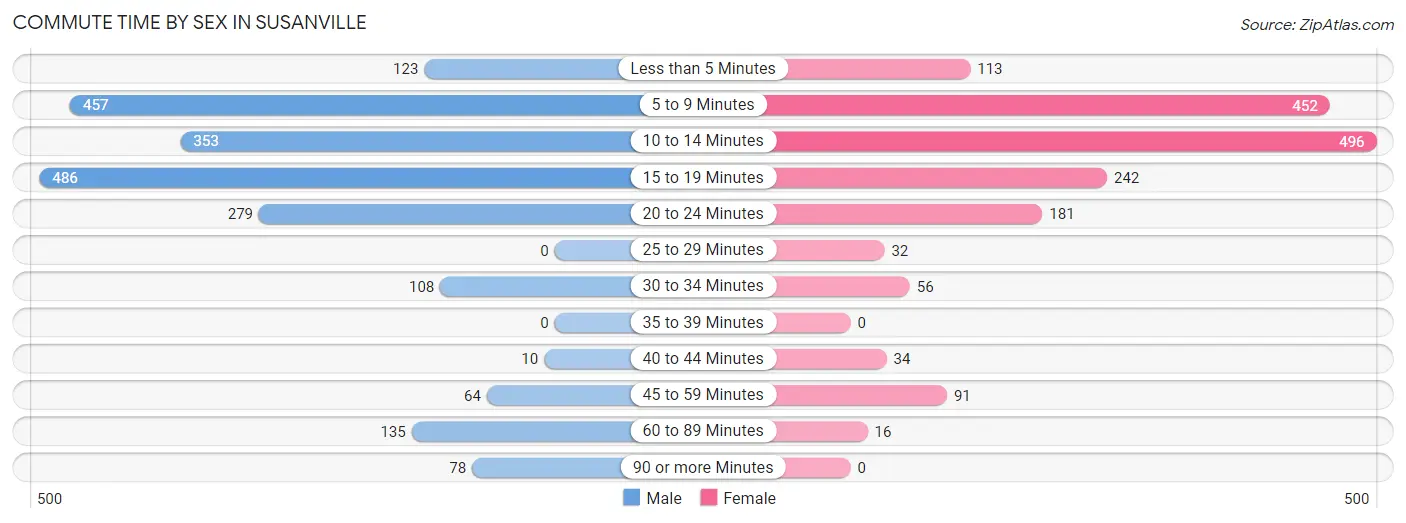
| Commute Time | Male | Female |
| Less than 5 Minutes | 123 (5.9%) | 113 (6.6%) |
| 5 to 9 Minutes | 457 (21.8%) | 452 (26.4%) |
| 10 to 14 Minutes | 353 (16.9%) | 496 (29.0%) |
| 15 to 19 Minutes | 486 (23.2%) | 242 (14.1%) |
| 20 to 24 Minutes | 279 (13.3%) | 181 (10.6%) |
| 25 to 29 Minutes | 0 (0.0%) | 32 (1.9%) |
| 30 to 34 Minutes | 108 (5.2%) | 56 (3.3%) |
| 35 to 39 Minutes | 0 (0.0%) | 0 (0.0%) |
| 40 to 44 Minutes | 10 (0.5%) | 34 (2.0%) |
| 45 to 59 Minutes | 64 (3.1%) | 91 (5.3%) |
| 60 to 89 Minutes | 135 (6.5%) | 16 (0.9%) |
| 90 or more Minutes | 78 (3.7%) | 0 (0.0%) |
Time of Departure to Work by Sex in Susanville
The most frequent times of departure to work in Susanville are 5:30 AM to 5:59 AM (312, 14.9%) for males and 7:30 AM to 7:59 AM (308, 18.0%) for females.
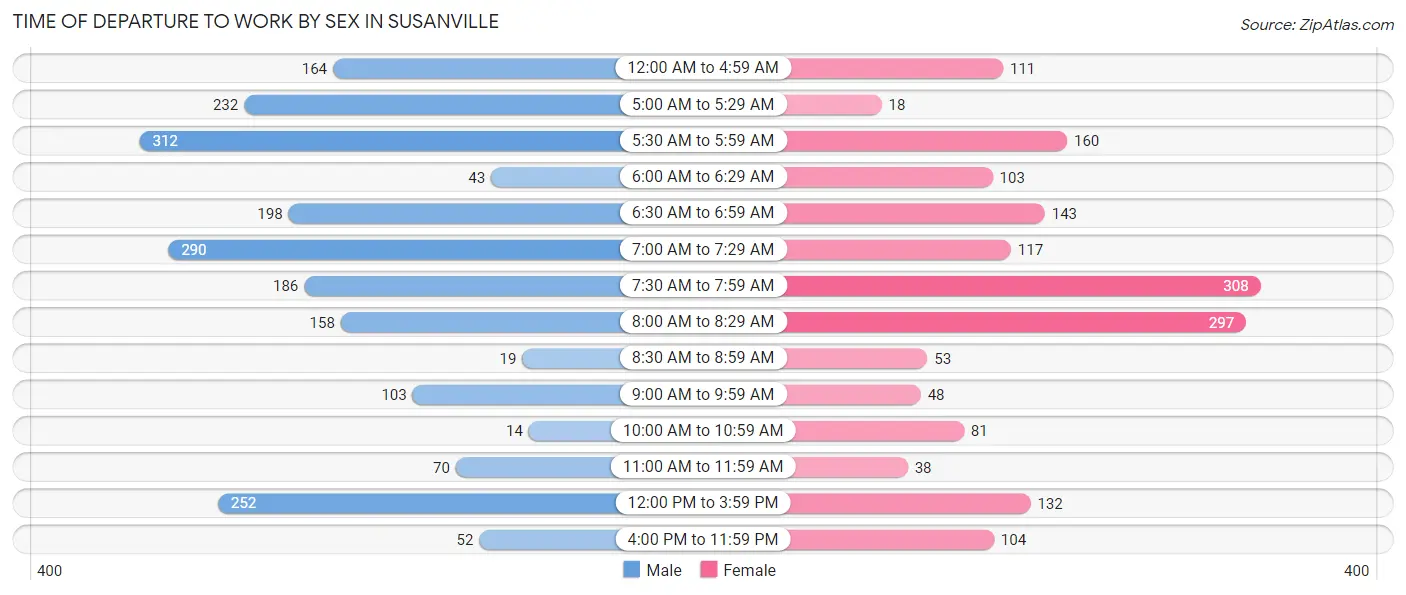
| Time of Departure | Male | Female |
| 12:00 AM to 4:59 AM | 164 (7.8%) | 111 (6.5%) |
| 5:00 AM to 5:29 AM | 232 (11.1%) | 18 (1.1%) |
| 5:30 AM to 5:59 AM | 312 (14.9%) | 160 (9.3%) |
| 6:00 AM to 6:29 AM | 43 (2.1%) | 103 (6.0%) |
| 6:30 AM to 6:59 AM | 198 (9.5%) | 143 (8.4%) |
| 7:00 AM to 7:29 AM | 290 (13.9%) | 117 (6.8%) |
| 7:30 AM to 7:59 AM | 186 (8.9%) | 308 (18.0%) |
| 8:00 AM to 8:29 AM | 158 (7.5%) | 297 (17.3%) |
| 8:30 AM to 8:59 AM | 19 (0.9%) | 53 (3.1%) |
| 9:00 AM to 9:59 AM | 103 (4.9%) | 48 (2.8%) |
| 10:00 AM to 10:59 AM | 14 (0.7%) | 81 (4.7%) |
| 11:00 AM to 11:59 AM | 70 (3.3%) | 38 (2.2%) |
| 12:00 PM to 3:59 PM | 252 (12.0%) | 132 (7.7%) |
| 4:00 PM to 11:59 PM | 52 (2.5%) | 104 (6.1%) |
| Total | 2,093 (100.0%) | 1,713 (100.0%) |
Housing Occupancy in Susanville
Occupancy by Ownership in Susanville
Of the total 3,447 dwellings in Susanville, owner-occupied units account for 1,867 (54.2%), while renter-occupied units make up 1,580 (45.8%).
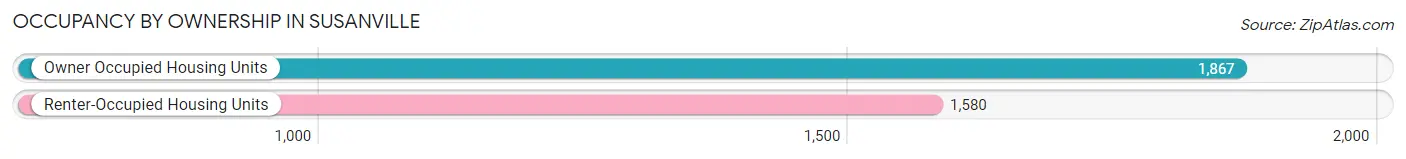
| Occupancy | # Housing Units | % Housing Units |
| Owner Occupied Housing Units | 1,867 | 54.2% |
| Renter-Occupied Housing Units | 1,580 | 45.8% |
| Total Occupied Housing Units | 3,447 | 100.0% |
Occupancy by Household Size in Susanville
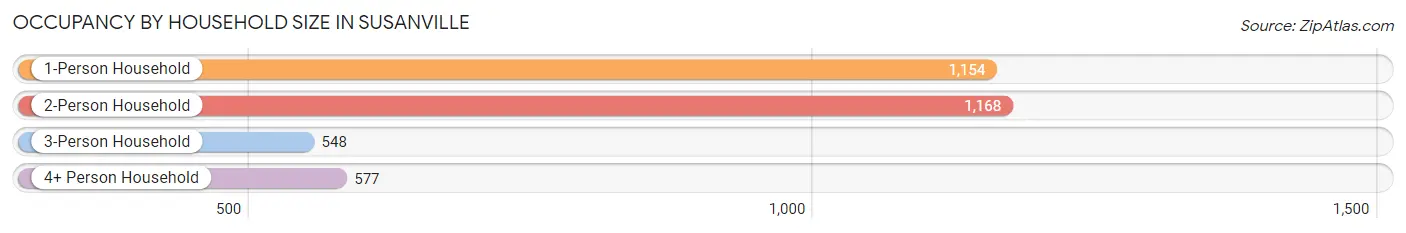
| Household Size | # Housing Units | % Housing Units |
| 1-Person Household | 1,154 | 33.5% |
| 2-Person Household | 1,168 | 33.9% |
| 3-Person Household | 548 | 15.9% |
| 4+ Person Household | 577 | 16.7% |
| Total Housing Units | 3,447 | 100.0% |
Occupancy by Ownership by Household Size in Susanville
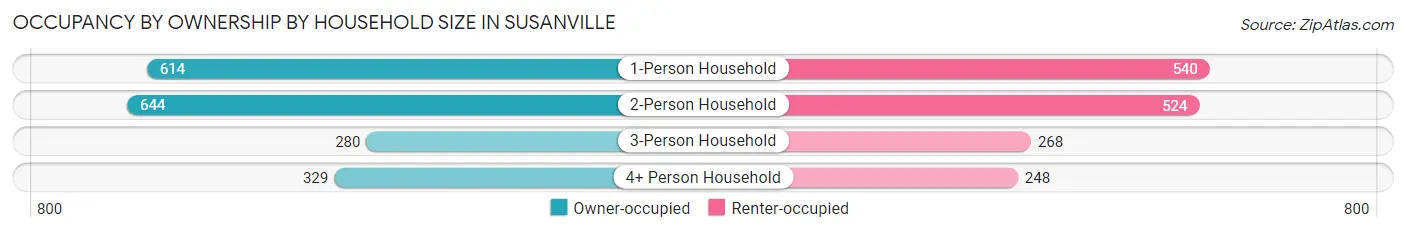
| Household Size | Owner-occupied | Renter-occupied |
| 1-Person Household | 614 (53.2%) | 540 (46.8%) |
| 2-Person Household | 644 (55.1%) | 524 (44.9%) |
| 3-Person Household | 280 (51.1%) | 268 (48.9%) |
| 4+ Person Household | 329 (57.0%) | 248 (43.0%) |
| Total Housing Units | 1,867 (54.2%) | 1,580 (45.8%) |
Occupancy by Educational Attainment in Susanville
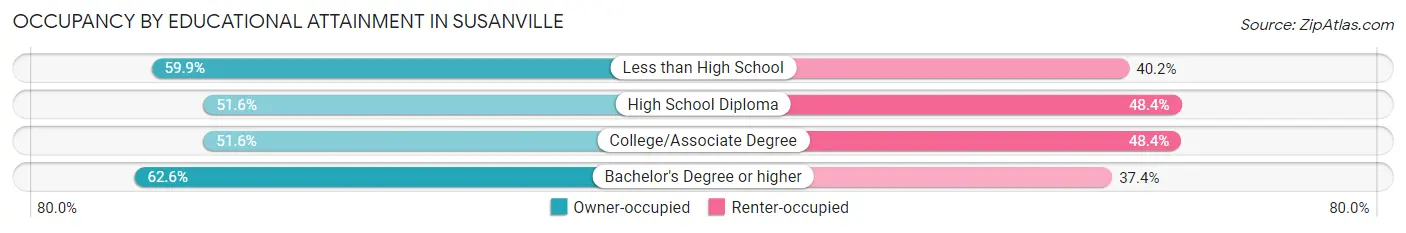
| Household Size | Owner-occupied | Renter-occupied |
| Less than High School | 158 (59.9%) | 106 (40.2%) |
| High School Diploma | 479 (51.6%) | 449 (48.4%) |
| College/Associate Degree | 854 (51.6%) | 800 (48.4%) |
| Bachelor's Degree or higher | 376 (62.6%) | 225 (37.4%) |
Occupancy by Age of Householder in Susanville
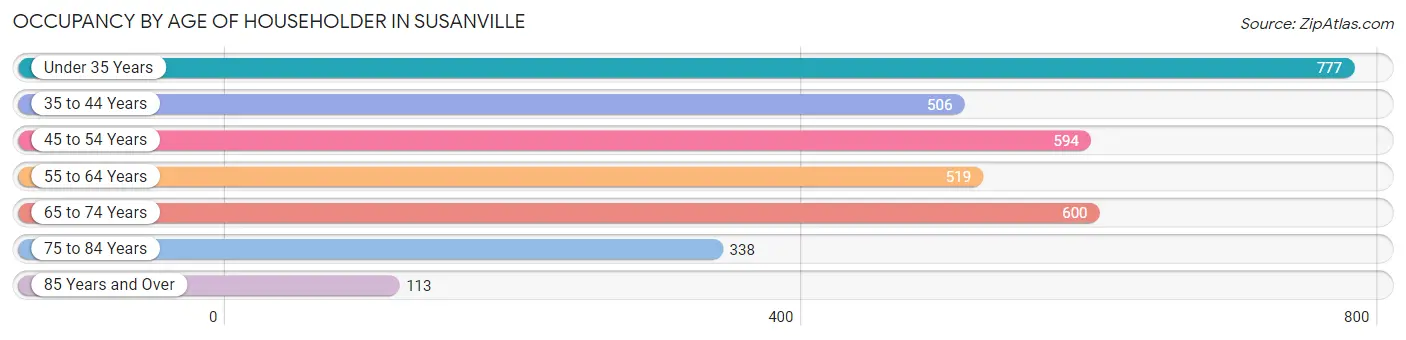
| Age Bracket | # Households | % Households |
| Under 35 Years | 777 | 22.5% |
| 35 to 44 Years | 506 | 14.7% |
| 45 to 54 Years | 594 | 17.2% |
| 55 to 64 Years | 519 | 15.1% |
| 65 to 74 Years | 600 | 17.4% |
| 75 to 84 Years | 338 | 9.8% |
| 85 Years and Over | 113 | 3.3% |
| Total | 3,447 | 100.0% |
Housing Finances in Susanville
Median Income by Occupancy in Susanville
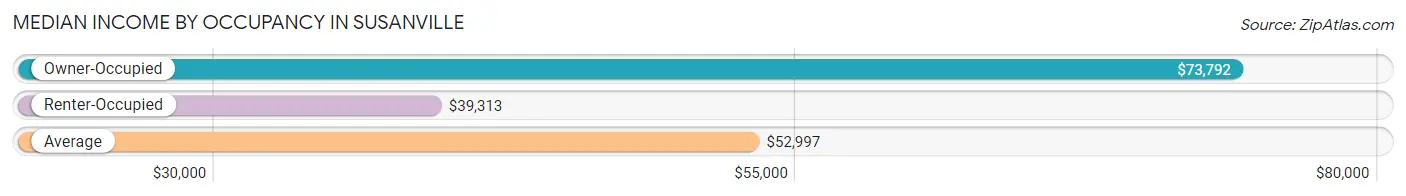
| Occupancy Type | # Households | Median Income |
| Owner-Occupied | 1,867 (54.2%) | $73,792 |
| Renter-Occupied | 1,580 (45.8%) | $39,313 |
| Average | 3,447 (100.0%) | $52,997 |
Occupancy by Householder Income Bracket in Susanville
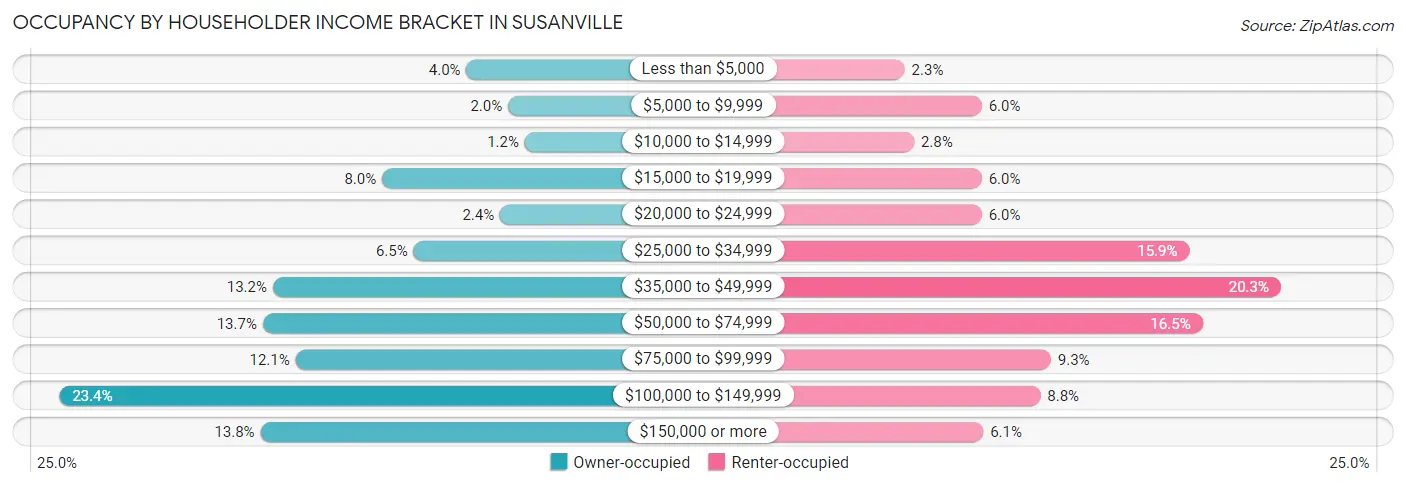
| Income Bracket | Owner-occupied | Renter-occupied |
| Less than $5,000 | 74 (4.0%) | 37 (2.3%) |
| $5,000 to $9,999 | 37 (2.0%) | 95 (6.0%) |
| $10,000 to $14,999 | 22 (1.2%) | 44 (2.8%) |
| $15,000 to $19,999 | 149 (8.0%) | 95 (6.0%) |
| $20,000 to $24,999 | 44 (2.4%) | 95 (6.0%) |
| $25,000 to $34,999 | 121 (6.5%) | 251 (15.9%) |
| $35,000 to $49,999 | 246 (13.2%) | 320 (20.3%) |
| $50,000 to $74,999 | 255 (13.7%) | 261 (16.5%) |
| $75,000 to $99,999 | 226 (12.1%) | 147 (9.3%) |
| $100,000 to $149,999 | 436 (23.4%) | 139 (8.8%) |
| $150,000 or more | 257 (13.8%) | 96 (6.1%) |
| Total | 1,867 (100.0%) | 1,580 (100.0%) |
Monthly Housing Cost Tiers in Susanville
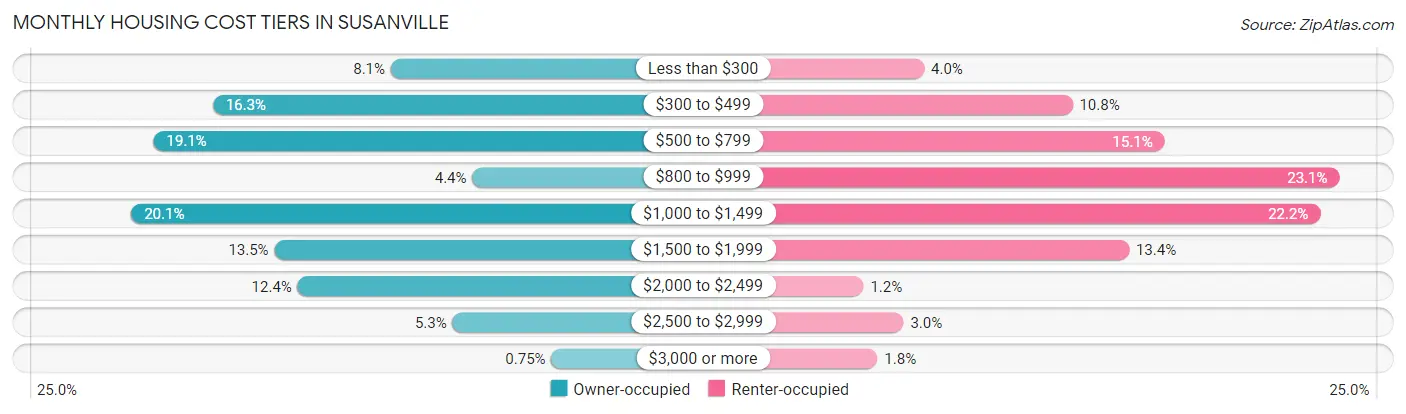
| Monthly Cost | Owner-occupied | Renter-occupied |
| Less than $300 | 152 (8.1%) | 63 (4.0%) |
| $300 to $499 | 305 (16.3%) | 171 (10.8%) |
| $500 to $799 | 356 (19.1%) | 238 (15.1%) |
| $800 to $999 | 82 (4.4%) | 365 (23.1%) |
| $1,000 to $1,499 | 375 (20.1%) | 351 (22.2%) |
| $1,500 to $1,999 | 252 (13.5%) | 212 (13.4%) |
| $2,000 to $2,499 | 232 (12.4%) | 19 (1.2%) |
| $2,500 to $2,999 | 99 (5.3%) | 48 (3.0%) |
| $3,000 or more | 14 (0.7%) | 29 (1.8%) |
| Total | 1,867 (100.0%) | 1,580 (100.0%) |
Physical Housing Characteristics in Susanville
Housing Structures in Susanville
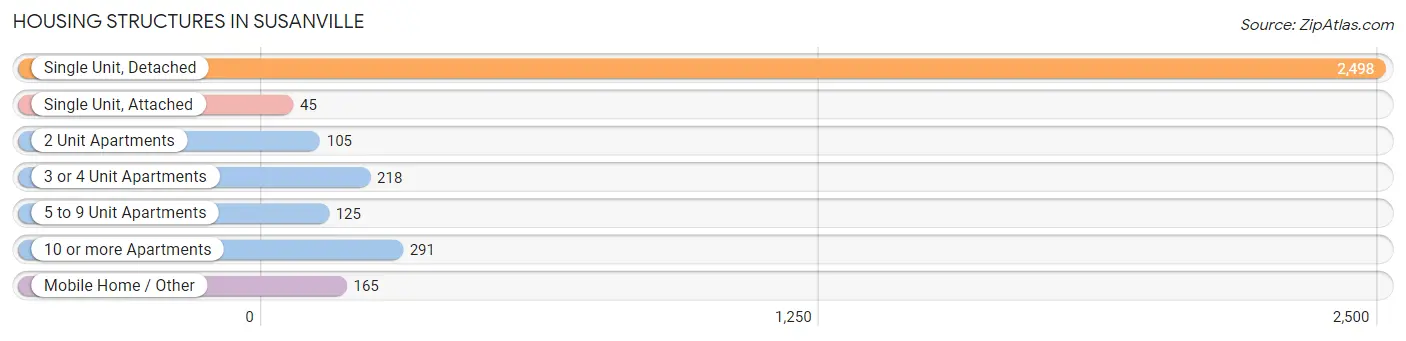
| Structure Type | # Housing Units | % Housing Units |
| Single Unit, Detached | 2,498 | 72.5% |
| Single Unit, Attached | 45 | 1.3% |
| 2 Unit Apartments | 105 | 3.0% |
| 3 or 4 Unit Apartments | 218 | 6.3% |
| 5 to 9 Unit Apartments | 125 | 3.6% |
| 10 or more Apartments | 291 | 8.4% |
| Mobile Home / Other | 165 | 4.8% |
| Total | 3,447 | 100.0% |
Housing Structures by Occupancy in Susanville
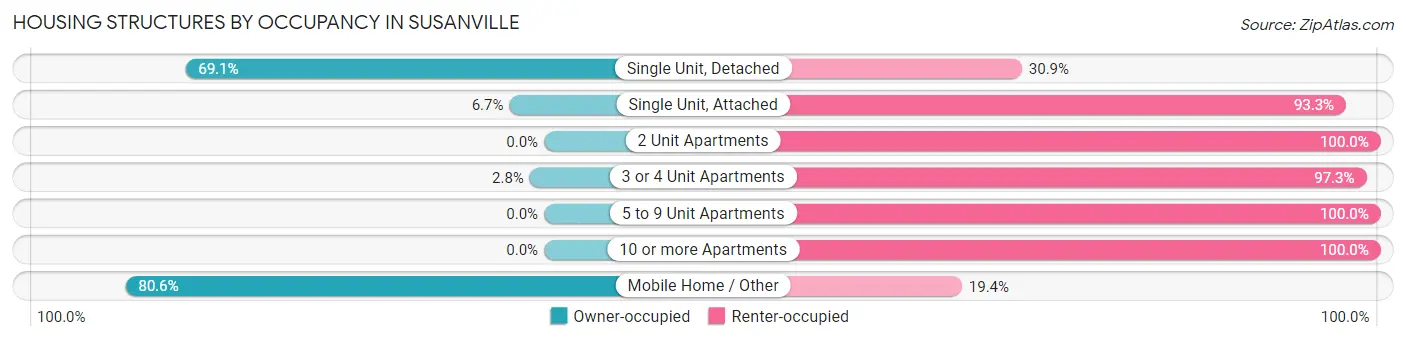
| Structure Type | Owner-occupied | Renter-occupied |
| Single Unit, Detached | 1,725 (69.1%) | 773 (30.9%) |
| Single Unit, Attached | 3 (6.7%) | 42 (93.3%) |
| 2 Unit Apartments | 0 (0.0%) | 105 (100.0%) |
| 3 or 4 Unit Apartments | 6 (2.8%) | 212 (97.3%) |
| 5 to 9 Unit Apartments | 0 (0.0%) | 125 (100.0%) |
| 10 or more Apartments | 0 (0.0%) | 291 (100.0%) |
| Mobile Home / Other | 133 (80.6%) | 32 (19.4%) |
| Total | 1,867 (54.2%) | 1,580 (45.8%) |
Housing Structures by Number of Rooms in Susanville
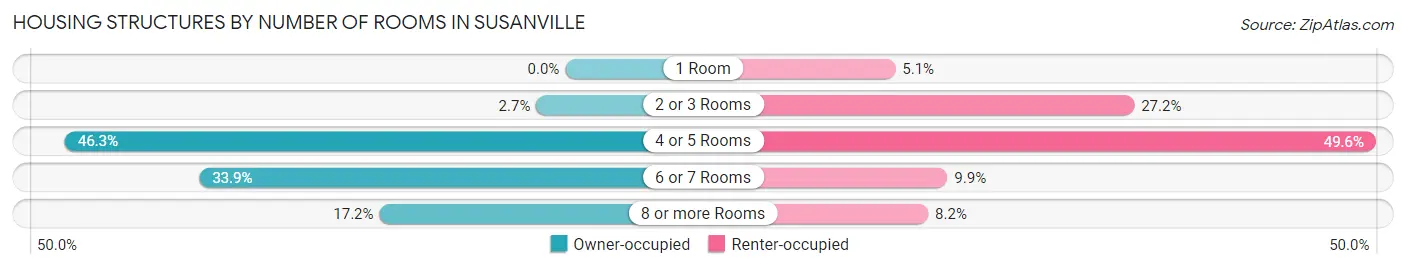
| Number of Rooms | Owner-occupied | Renter-occupied |
| 1 Room | 0 (0.0%) | 81 (5.1%) |
| 2 or 3 Rooms | 50 (2.7%) | 430 (27.2%) |
| 4 or 5 Rooms | 864 (46.3%) | 783 (49.6%) |
| 6 or 7 Rooms | 632 (33.9%) | 157 (9.9%) |
| 8 or more Rooms | 321 (17.2%) | 129 (8.2%) |
| Total | 1,867 (100.0%) | 1,580 (100.0%) |
Housing Structure by Heating Type in Susanville
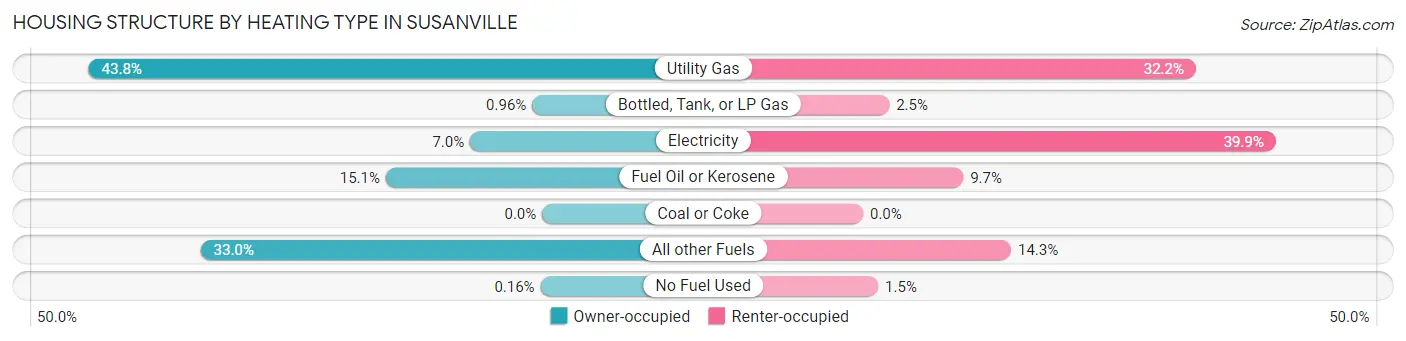
| Heating Type | Owner-occupied | Renter-occupied |
| Utility Gas | 818 (43.8%) | 508 (32.2%) |
| Bottled, Tank, or LP Gas | 18 (1.0%) | 40 (2.5%) |
| Electricity | 130 (7.0%) | 630 (39.9%) |
| Fuel Oil or Kerosene | 282 (15.1%) | 153 (9.7%) |
| Coal or Coke | 0 (0.0%) | 0 (0.0%) |
| All other Fuels | 616 (33.0%) | 226 (14.3%) |
| No Fuel Used | 3 (0.2%) | 23 (1.5%) |
| Total | 1,867 (100.0%) | 1,580 (100.0%) |
Household Vehicle Usage in Susanville
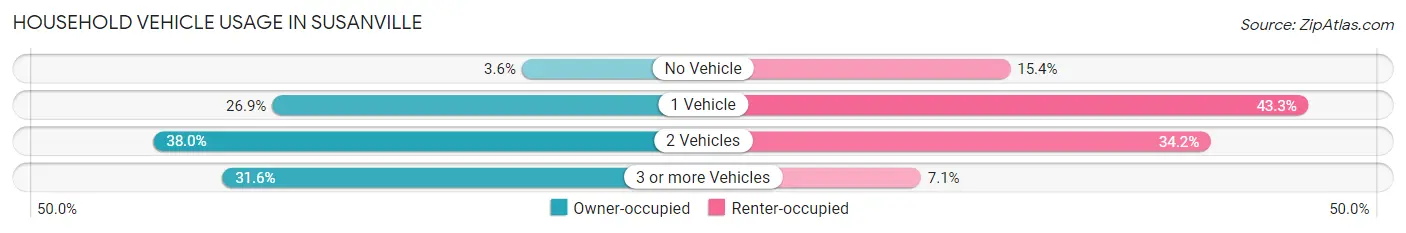
| Vehicles per Household | Owner-occupied | Renter-occupied |
| No Vehicle | 67 (3.6%) | 244 (15.4%) |
| 1 Vehicle | 502 (26.9%) | 684 (43.3%) |
| 2 Vehicles | 709 (38.0%) | 540 (34.2%) |
| 3 or more Vehicles | 589 (31.6%) | 112 (7.1%) |
| Total | 1,867 (100.0%) | 1,580 (100.0%) |
Real Estate & Mortgages in Susanville
Real Estate and Mortgage Overview in Susanville
| Characteristic | Without Mortgage | With Mortgage |
| Housing Units | 769 | 1,098 |
| Median Property Value | $163,800 | $227,300 |
| Median Household Income | $37,930 | $224 |
| Monthly Housing Costs | $477 | $14 |
| Real Estate Taxes | $1,244 | $39 |
Property Value by Mortgage Status in Susanville
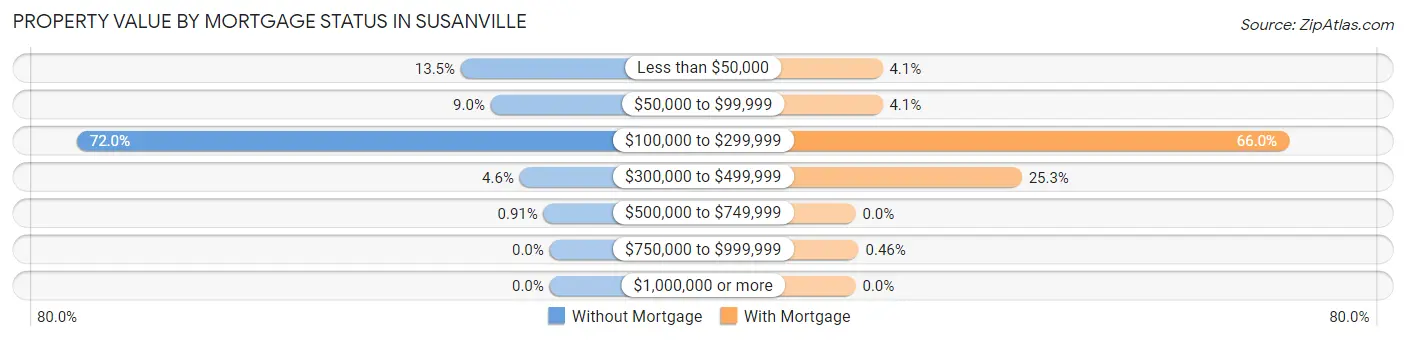
| Property Value | Without Mortgage | With Mortgage |
| Less than $50,000 | 104 (13.5%) | 45 (4.1%) |
| $50,000 to $99,999 | 69 (9.0%) | 45 (4.1%) |
| $100,000 to $299,999 | 554 (72.0%) | 725 (66.0%) |
| $300,000 to $499,999 | 35 (4.5%) | 278 (25.3%) |
| $500,000 to $749,999 | 7 (0.9%) | 0 (0.0%) |
| $750,000 to $999,999 | 0 (0.0%) | 5 (0.5%) |
| $1,000,000 or more | 0 (0.0%) | 0 (0.0%) |
| Total | 769 (100.0%) | 1,098 (100.0%) |
Household Income by Mortgage Status in Susanville
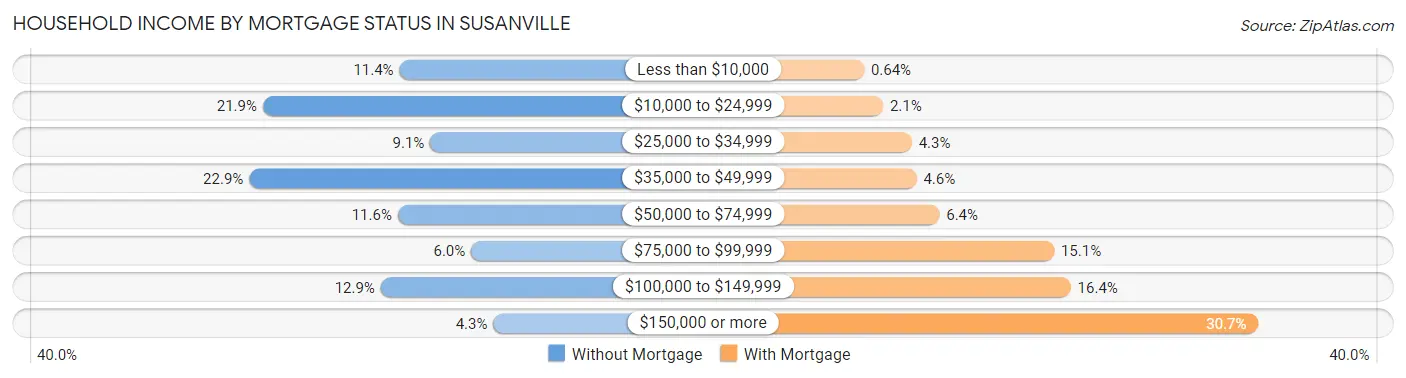
| Household Income | Without Mortgage | With Mortgage |
| Less than $10,000 | 88 (11.4%) | 7 (0.6%) |
| $10,000 to $24,999 | 168 (21.8%) | 23 (2.1%) |
| $25,000 to $34,999 | 70 (9.1%) | 47 (4.3%) |
| $35,000 to $49,999 | 176 (22.9%) | 51 (4.6%) |
| $50,000 to $74,999 | 89 (11.6%) | 70 (6.4%) |
| $75,000 to $99,999 | 46 (6.0%) | 166 (15.1%) |
| $100,000 to $149,999 | 99 (12.9%) | 180 (16.4%) |
| $150,000 or more | 33 (4.3%) | 337 (30.7%) |
| Total | 769 (100.0%) | 1,098 (100.0%) |
Property Value to Household Income Ratio in Susanville
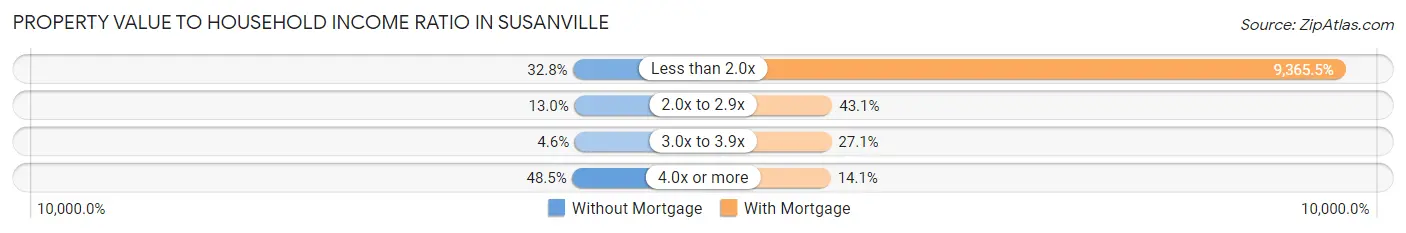
| Value-to-Income Ratio | Without Mortgage | With Mortgage |
| Less than 2.0x | 252 (32.8%) | 102,833 (9,365.5%) |
| 2.0x to 2.9x | 100 (13.0%) | 473 (43.1%) |
| 3.0x to 3.9x | 35 (4.5%) | 297 (27.1%) |
| 4.0x or more | 373 (48.5%) | 155 (14.1%) |
| Total | 769 (100.0%) | 1,098 (100.0%) |
Real Estate Taxes by Mortgage Status in Susanville
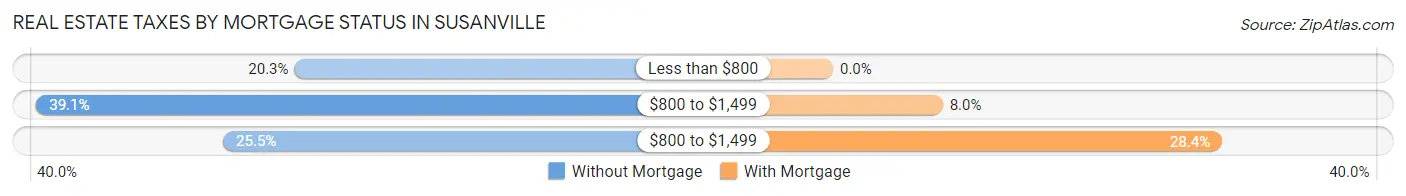
| Property Taxes | Without Mortgage | With Mortgage |
| Less than $800 | 156 (20.3%) | 0 (0.0%) |
| $800 to $1,499 | 301 (39.1%) | 88 (8.0%) |
| $800 to $1,499 | 196 (25.5%) | 312 (28.4%) |
| Total | 769 (100.0%) | 1,098 (100.0%) |
Health & Disability in Susanville
Health Insurance Coverage by Age in Susanville
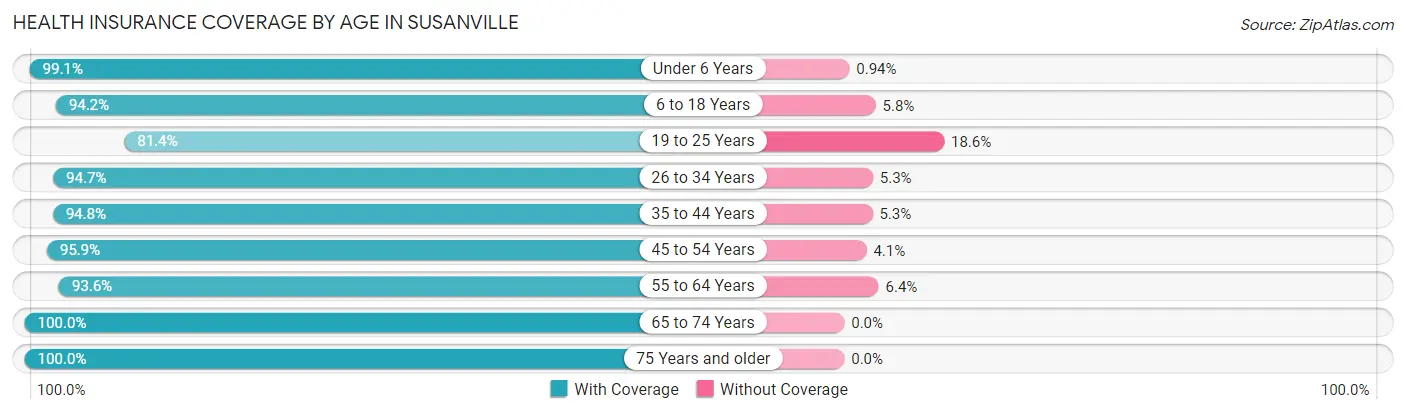
| Age Bracket | With Coverage | Without Coverage |
| Under 6 Years | 633 (99.1%) | 6 (0.9%) |
| 6 to 18 Years | 1,726 (94.2%) | 107 (5.8%) |
| 19 to 25 Years | 700 (81.4%) | 160 (18.6%) |
| 26 to 34 Years | 1,189 (94.7%) | 67 (5.3%) |
| 35 to 44 Years | 1,118 (94.8%) | 62 (5.2%) |
| 45 to 54 Years | 1,041 (95.9%) | 45 (4.1%) |
| 55 to 64 Years | 848 (93.6%) | 58 (6.4%) |
| 65 to 74 Years | 800 (100.0%) | 0 (0.0%) |
| 75 Years and older | 602 (100.0%) | 0 (0.0%) |
| Total | 8,657 (94.5%) | 505 (5.5%) |
Health Insurance Coverage by Citizenship Status in Susanville
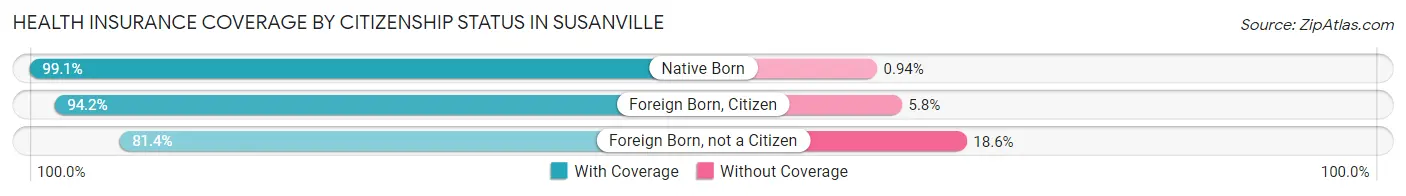
| Citizenship Status | With Coverage | Without Coverage |
| Native Born | 633 (99.1%) | 6 (0.9%) |
| Foreign Born, Citizen | 1,726 (94.2%) | 107 (5.8%) |
| Foreign Born, not a Citizen | 700 (81.4%) | 160 (18.6%) |
Health Insurance Coverage by Household Income in Susanville
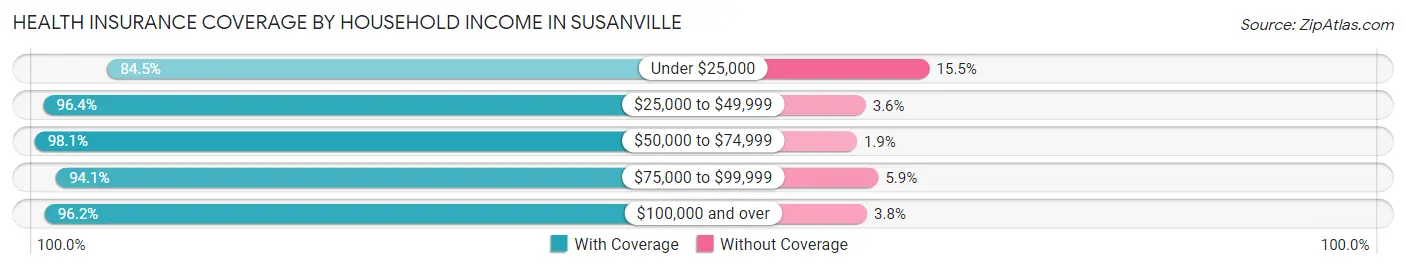
| Household Income | With Coverage | Without Coverage |
| Under $25,000 | 1,083 (84.5%) | 199 (15.5%) |
| $25,000 to $49,999 | 1,814 (96.4%) | 67 (3.6%) |
| $50,000 to $74,999 | 1,346 (98.1%) | 26 (1.9%) |
| $75,000 to $99,999 | 936 (94.1%) | 59 (5.9%) |
| $100,000 and over | 3,358 (96.2%) | 133 (3.8%) |
Public vs Private Health Insurance Coverage by Age in Susanville
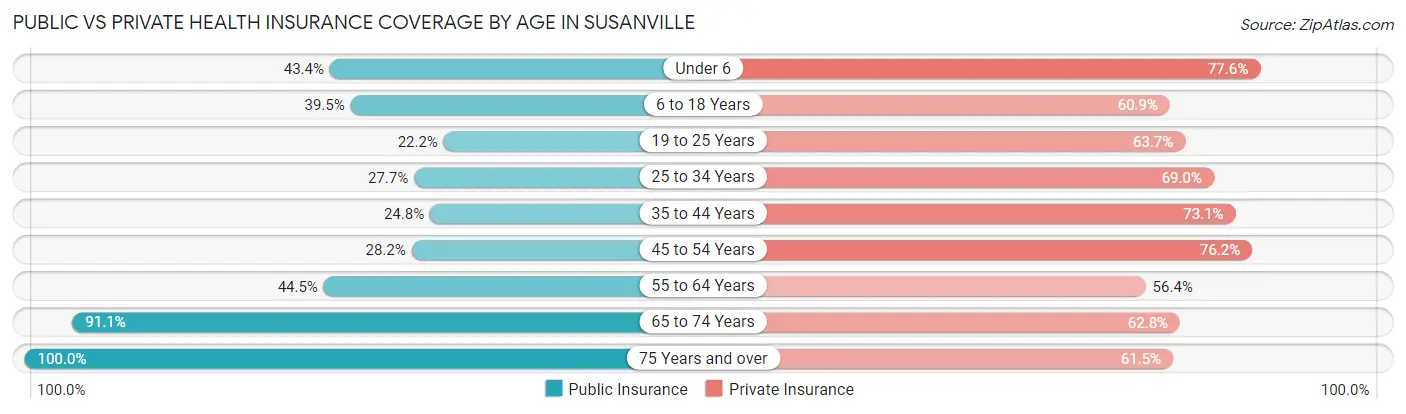
| Age Bracket | Public Insurance | Private Insurance |
| Under 6 | 277 (43.3%) | 496 (77.6%) |
| 6 to 18 Years | 724 (39.5%) | 1,116 (60.9%) |
| 19 to 25 Years | 191 (22.2%) | 548 (63.7%) |
| 25 to 34 Years | 348 (27.7%) | 867 (69.0%) |
| 35 to 44 Years | 292 (24.7%) | 862 (73.1%) |
| 45 to 54 Years | 306 (28.2%) | 827 (76.1%) |
| 55 to 64 Years | 403 (44.5%) | 511 (56.4%) |
| 65 to 74 Years | 729 (91.1%) | 502 (62.7%) |
| 75 Years and over | 602 (100.0%) | 370 (61.5%) |
| Total | 3,872 (42.3%) | 6,099 (66.6%) |
Disability Status by Sex by Age in Susanville
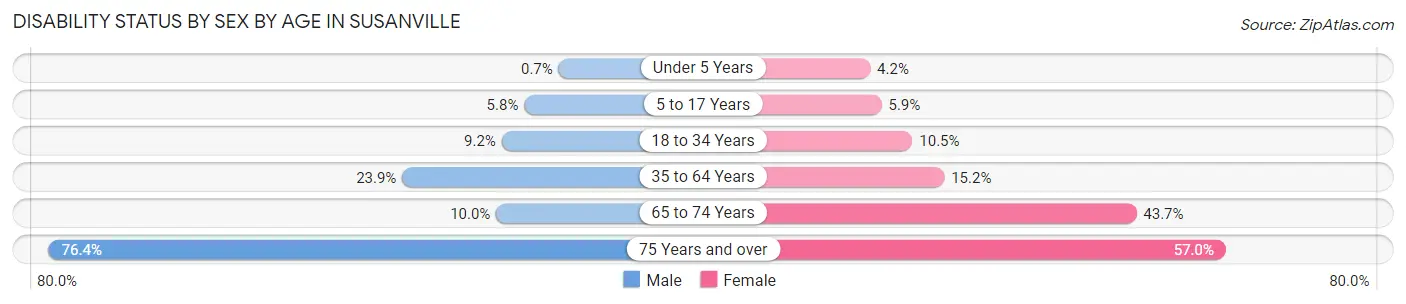
| Age Bracket | Male | Female |
| Under 5 Years | 2 (0.7%) | 12 (4.2%) |
| 5 to 17 Years | 53 (5.8%) | 52 (5.9%) |
| 18 to 34 Years | 119 (9.2%) | 97 (10.5%) |
| 35 to 64 Years | 369 (23.9%) | 248 (15.2%) |
| 65 to 74 Years | 36 (10.0%) | 192 (43.7%) |
| 75 Years and over | 188 (76.4%) | 203 (57.0%) |
Disability Class by Sex by Age in Susanville
Disability Class: Hearing Difficulty
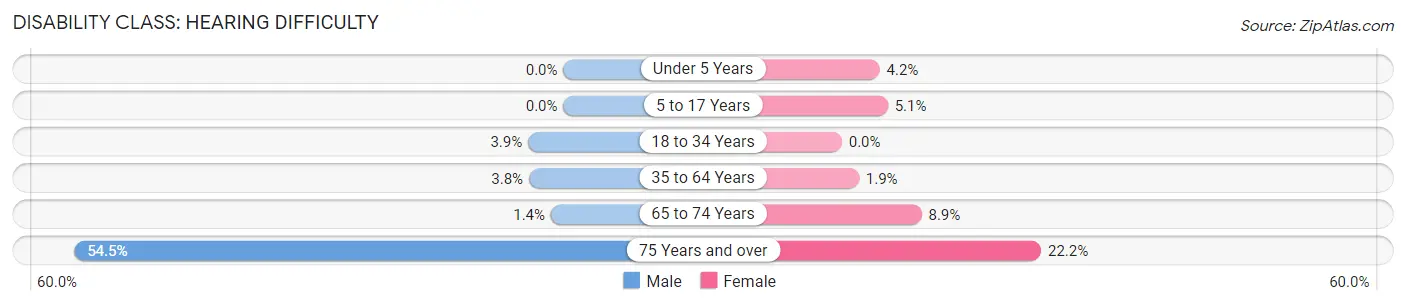
| Age Bracket | Male | Female |
| Under 5 Years | 0 (0.0%) | 12 (4.2%) |
| 5 to 17 Years | 0 (0.0%) | 45 (5.1%) |
| 18 to 34 Years | 51 (3.9%) | 0 (0.0%) |
| 35 to 64 Years | 59 (3.8%) | 31 (1.9%) |
| 65 to 74 Years | 5 (1.4%) | 39 (8.9%) |
| 75 Years and over | 134 (54.5%) | 79 (22.2%) |
Disability Class: Vision Difficulty
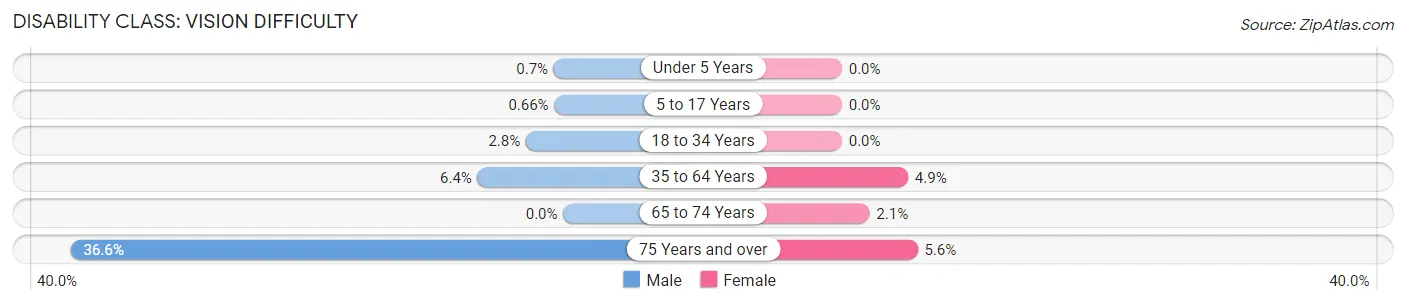
| Age Bracket | Male | Female |
| Under 5 Years | 2 (0.7%) | 0 (0.0%) |
| 5 to 17 Years | 6 (0.7%) | 0 (0.0%) |
| 18 to 34 Years | 36 (2.8%) | 0 (0.0%) |
| 35 to 64 Years | 98 (6.4%) | 80 (4.9%) |
| 65 to 74 Years | 0 (0.0%) | 9 (2.1%) |
| 75 Years and over | 90 (36.6%) | 20 (5.6%) |
Disability Class: Cognitive Difficulty
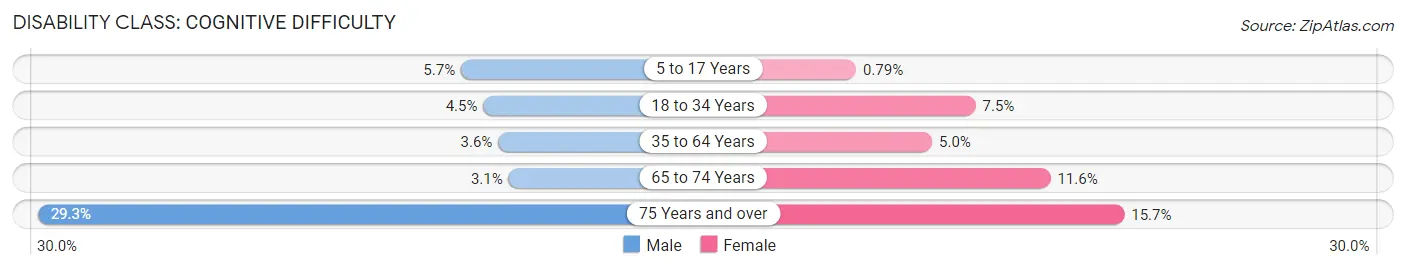
| Age Bracket | Male | Female |
| 5 to 17 Years | 52 (5.7%) | 7 (0.8%) |
| 18 to 34 Years | 58 (4.5%) | 69 (7.4%) |
| 35 to 64 Years | 56 (3.6%) | 82 (5.0%) |
| 65 to 74 Years | 11 (3.0%) | 51 (11.6%) |
| 75 Years and over | 72 (29.3%) | 56 (15.7%) |
Disability Class: Ambulatory Difficulty
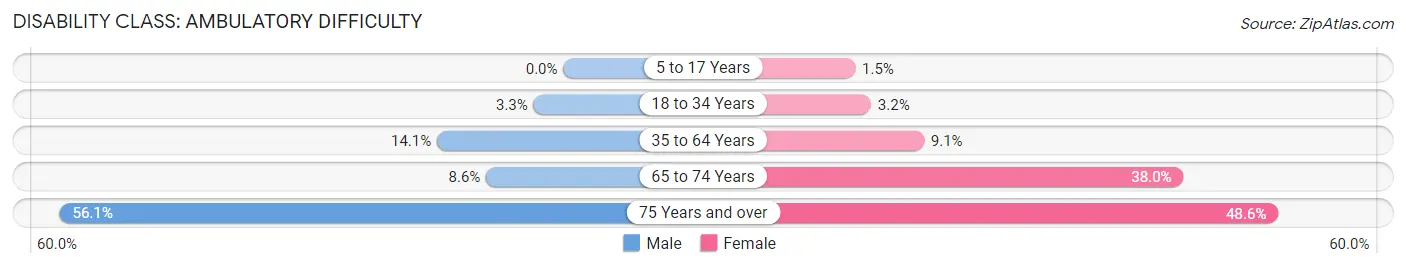
| Age Bracket | Male | Female |
| 5 to 17 Years | 0 (0.0%) | 13 (1.5%) |
| 18 to 34 Years | 43 (3.3%) | 30 (3.2%) |
| 35 to 64 Years | 217 (14.1%) | 149 (9.1%) |
| 65 to 74 Years | 31 (8.6%) | 167 (38.0%) |
| 75 Years and over | 138 (56.1%) | 173 (48.6%) |
Disability Class: Self-Care Difficulty
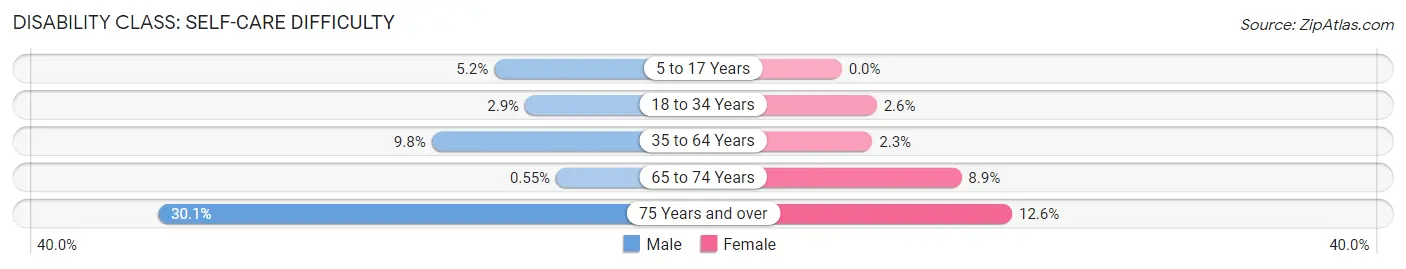
| Age Bracket | Male | Female |
| 5 to 17 Years | 47 (5.1%) | 0 (0.0%) |
| 18 to 34 Years | 37 (2.9%) | 24 (2.6%) |
| 35 to 64 Years | 151 (9.8%) | 37 (2.3%) |
| 65 to 74 Years | 2 (0.5%) | 39 (8.9%) |
| 75 Years and over | 74 (30.1%) | 45 (12.6%) |
Technology Access in Susanville
Computing Device Access in Susanville
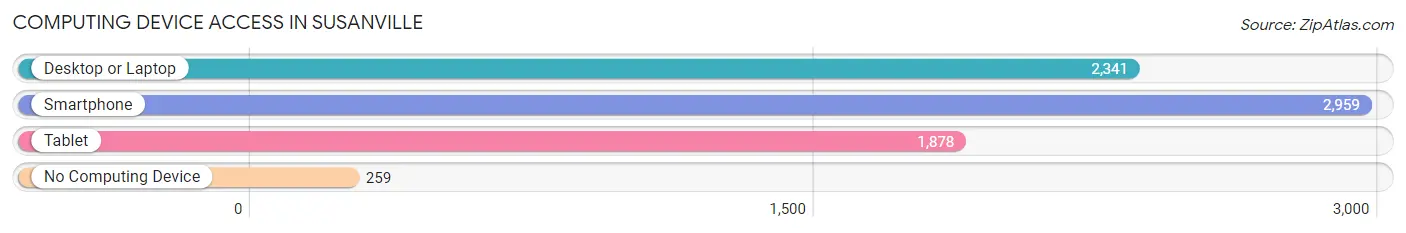
| Device Type | # Households | % Households |
| Desktop or Laptop | 2,341 | 67.9% |
| Smartphone | 2,959 | 85.8% |
| Tablet | 1,878 | 54.5% |
| No Computing Device | 259 | 7.5% |
| Total | 3,447 | 100.0% |
Internet Access in Susanville
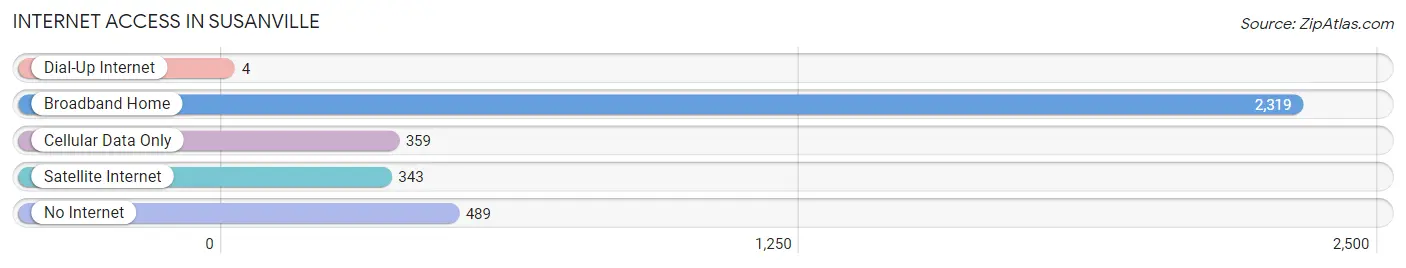
| Internet Type | # Households | % Households |
| Dial-Up Internet | 4 | 0.1% |
| Broadband Home | 2,319 | 67.3% |
| Cellular Data Only | 359 | 10.4% |
| Satellite Internet | 343 | 10.0% |
| No Internet | 489 | 14.2% |
| Total | 3,447 | 100.0% |
Susanville Summary
Susanville, California is a small city located in the northeastern corner of the state, in Lassen County. It is the county seat and the largest city in the county, with a population of 17,947 as of the 2010 census. The city is situated in the Sierra Nevada mountain range, at an elevation of 4,186 feet. It is located on the banks of the Susan River, and is surrounded by the Plumas National Forest.
History
The area that is now Susanville was first inhabited by the Maidu and Washoe Native American tribes. The first European settlers arrived in the area in the 1850s, and the town was officially founded in 1860. It was named after Susan Roop, the daughter of Isaac Roop, who was one of the first settlers in the area.
In the late 19th century, the town became a major hub for the timber industry, and the lumber industry was the primary source of employment for the area. The town was also a major stop on the Central Pacific Railroad, which connected the east and west coasts of the United States.
In the early 20th century, the town began to experience a decline in the timber industry, and the population began to decline as well. In the 1950s, the town was revitalized with the construction of the Lassen County Airport, which brought in new businesses and jobs.
Geography
Susanville is located in the northeastern corner of California, in Lassen County. It is situated in the Sierra Nevada mountain range, at an elevation of 4,186 feet. The city is located on the banks of the Susan River, and is surrounded by the Plumas National Forest.
The city has a total area of 8.3 square miles, of which 8.2 square miles is land and 0.1 square miles is water. The climate is semi-arid, with hot summers and cold winters. The average annual precipitation is 16.3 inches.
Economy
The economy of Susanville is largely based on the timber industry, which is the primary source of employment for the area. The city is also home to a number of manufacturing and service-based businesses, including a large prison complex.
The city is also home to Lassen Community College, which offers a variety of educational programs. The college also serves as a major employer in the area.
Demographics
As of the 2010 census, the population of Susanville was 17,947. The racial makeup of the city was 79.2% White, 1.2% African American, 1.3% Native American, 0.7% Asian, 0.1% Pacific Islander, 13.2% from other races, and 4.3% from two or more races. Hispanic or Latino of any race were 24.2% of the population.
The median income for a household in the city was $35,945, and the median income for a family was $41,945. The per capita income for the city was $17,845. About 17.2% of families and 21.2% of the population were below the poverty line, including 28.2% of those under age 18 and 8.2% of those age 65 or over.
Common Questions
What is Per Capita Income in Susanville?
Per Capita income in Susanville is $17,912.
What is the Median Family Income in Susanville?
Median Family Income in Susanville is $65,774.
What is the Median Household income in Susanville?
Median Household Income in Susanville is $52,997.
What is Income or Wage Gap in Susanville?
Income or Wage Gap in Susanville is 19.6%.
Women in Susanville earn 80.4 cents for every dollar earned by a man.
What is Family Income Deficit in Susanville?
Family Income Deficit in Susanville is $9,796.
Families that are below poverty line in Susanville earn $9,796 less on average than the poverty threshold level.
What is Inequality or Gini Index in Susanville?
Inequality or Gini Index in Susanville is 0.43.
What is the Total Population of Susanville?
Total Population of Susanville is 15,737.
What is the Total Male Population of Susanville?
Total Male Population of Susanville is 11,146.
What is the Total Female Population of Susanville?
Total Female Population of Susanville is 4,591.
What is the Ratio of Males per 100 Females in Susanville?
There are 242.78 Males per 100 Females in Susanville.
What is the Ratio of Females per 100 Males in Susanville?
There are 41.19 Females per 100 Males in Susanville.
What is the Median Population Age in Susanville?
Median Population Age in Susanville is 33.7 Years.
What is the Average Family Size in Susanville
Average Family Size in Susanville is 3.3 People.
What is the Average Household Size in Susanville
Average Household Size in Susanville is 2.6 People.
How Large is the Labor Force in Susanville?
There are 4,246 People in the Labor Forcein in Susanville.
What is the Percentage of People in the Labor Force in Susanville?
31.1% of People are in the Labor Force in Susanville.
What is the Unemployment Rate in Susanville?
Unemployment Rate in Susanville is 7.3%.