Sunol, CA Map & Demographics
Sunol Map
Sunol Overview
$85,523
PER CAPITA INCOME
$212,917
AVG FAMILY INCOME
$182,250
AVG HOUSEHOLD INCOME
44.4%
WAGE / INCOME GAP [ % ]
55.6¢/ $1
WAGE / INCOME GAP [ $ ]
0.42
INEQUALITY / GINI INDEX
920
TOTAL POPULATION
464
MALE POPULATION
456
FEMALE POPULATION
101.75
MALES / 100 FEMALES
98.28
FEMALES / 100 MALES
47.8
MEDIAN AGE
3.0
AVG FAMILY SIZE
2.9
AVG HOUSEHOLD SIZE
491
LABOR FORCE [ PEOPLE ]
64.8%
PERCENT IN LABOR FORCE
6.5%
UNEMPLOYMENT RATE
Sunol Zip Codes
Sunol Area Codes
Income in Sunol
Income Overview in Sunol
Per Capita Income in Sunol is $85,523, while median incomes of families and households are $212,917 and $182,250 respectively.
| Characteristic | Number | Measure |
| Per Capita Income | 920 | $85,523 |
| Median Family Income | 259 | $212,917 |
| Mean Family Income | 259 | $251,499 |
| Median Household Income | 315 | $182,250 |
| Mean Household Income | 315 | $236,797 |
| Income Deficit | 259 | $0 |
| Wage / Income Gap (%) | 920 | 44.39% |
| Wage / Income Gap ($) | 920 | 55.61¢ per $1 |
| Gini / Inequality Index | 920 | 0.42 |
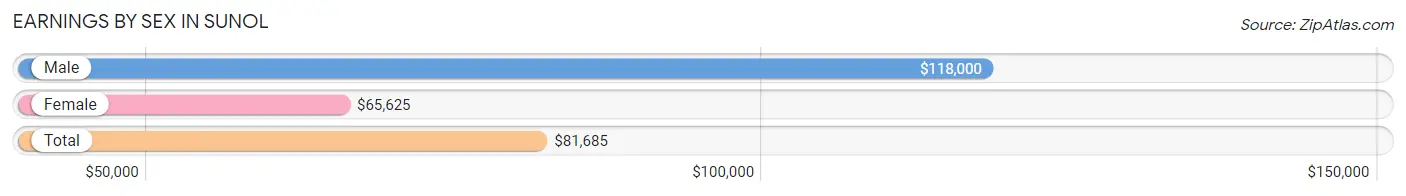
Earnings by Sex in Sunol
Average Earnings in Sunol are $81,685, $118,000 for men and $65,625 for women, a difference of 44.4%.
| Sex | Number | Average Earnings |
| Male | 268 (51.0%) | $118,000 |
| Female | 257 (48.9%) | $65,625 |
| Total | 525 (100.0%) | $81,685 |
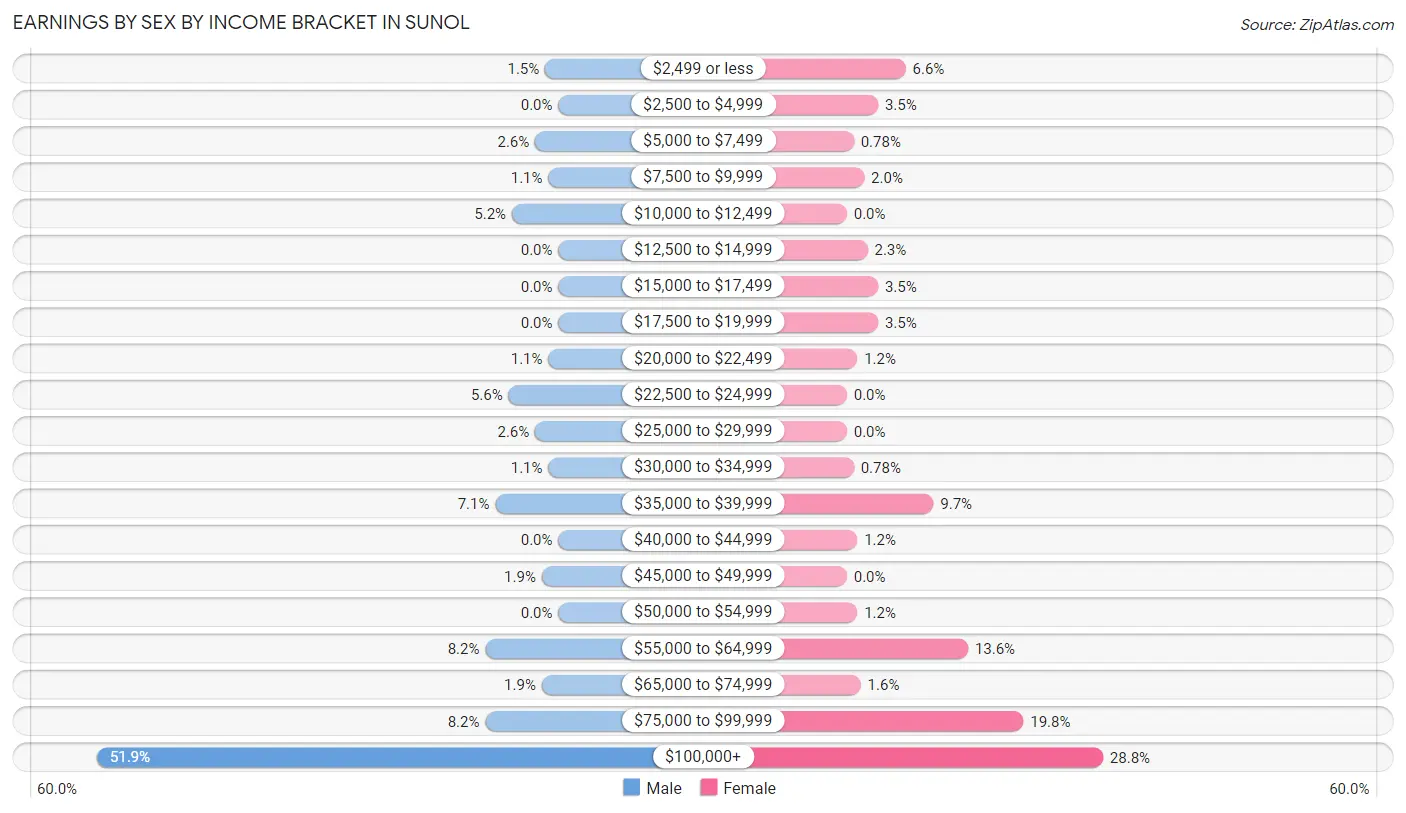
Earnings by Sex by Income Bracket in Sunol
The most common earnings brackets in Sunol are $100,000+ for men (139 | 51.9%) and $100,000+ for women (74 | 28.8%).
| Income | Male | Female |
| $2,499 or less | 4 (1.5%) | 17 (6.6%) |
| $2,500 to $4,999 | 0 (0.0%) | 9 (3.5%) |
| $5,000 to $7,499 | 7 (2.6%) | 2 (0.8%) |
| $7,500 to $9,999 | 3 (1.1%) | 5 (1.9%) |
| $10,000 to $12,499 | 14 (5.2%) | 0 (0.0%) |
| $12,500 to $14,999 | 0 (0.0%) | 6 (2.3%) |
| $15,000 to $17,499 | 0 (0.0%) | 9 (3.5%) |
| $17,500 to $19,999 | 0 (0.0%) | 9 (3.5%) |
| $20,000 to $22,499 | 3 (1.1%) | 3 (1.2%) |
| $22,500 to $24,999 | 15 (5.6%) | 0 (0.0%) |
| $25,000 to $29,999 | 7 (2.6%) | 0 (0.0%) |
| $30,000 to $34,999 | 3 (1.1%) | 2 (0.8%) |
| $35,000 to $39,999 | 19 (7.1%) | 25 (9.7%) |
| $40,000 to $44,999 | 0 (0.0%) | 3 (1.2%) |
| $45,000 to $49,999 | 5 (1.9%) | 0 (0.0%) |
| $50,000 to $54,999 | 0 (0.0%) | 3 (1.2%) |
| $55,000 to $64,999 | 22 (8.2%) | 35 (13.6%) |
| $65,000 to $74,999 | 5 (1.9%) | 4 (1.6%) |
| $75,000 to $99,999 | 22 (8.2%) | 51 (19.8%) |
| $100,000+ | 139 (51.9%) | 74 (28.8%) |
| Total | 268 (100.0%) | 257 (100.0%) |
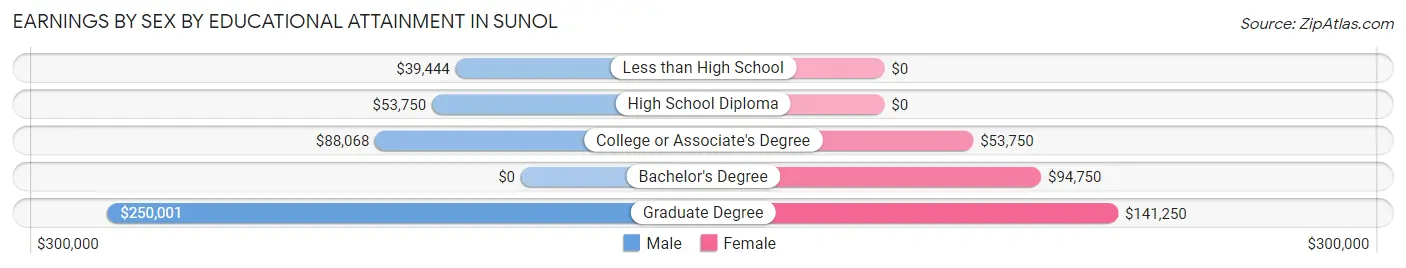
Earnings by Sex by Educational Attainment in Sunol
Average earnings in Sunol are $130,833 for men and $65,625 for women, a difference of 49.8%. Men with an educational attainment of graduate degree enjoy the highest average annual earnings of $250,001, while those with less than high school education earn the least with $39,444. Women with an educational attainment of graduate degree earn the most with the average annual earnings of $141,250, while those with college or associate's degree education have the smallest earnings of $53,750.
| Educational Attainment | Male Income | Female Income |
| Less than High School | $39,444 | $0 |
| High School Diploma | $53,750 | $0 |
| College or Associate's Degree | $88,068 | $53,750 |
| Bachelor's Degree | - | - |
| Graduate Degree | $250,001 | $141,250 |
| Total | $130,833 | $65,625 |
Family Income in Sunol
Family Income Brackets in Sunol
According to the Sunol family income data, there are 137 families falling into the $200,000+ income range, which is the most common income bracket and makes up 52.9% of all families. Conversely, the $10,000 to $14,999 income bracket is the least frequent group with only 1 families (0.4%) belonging to this category.
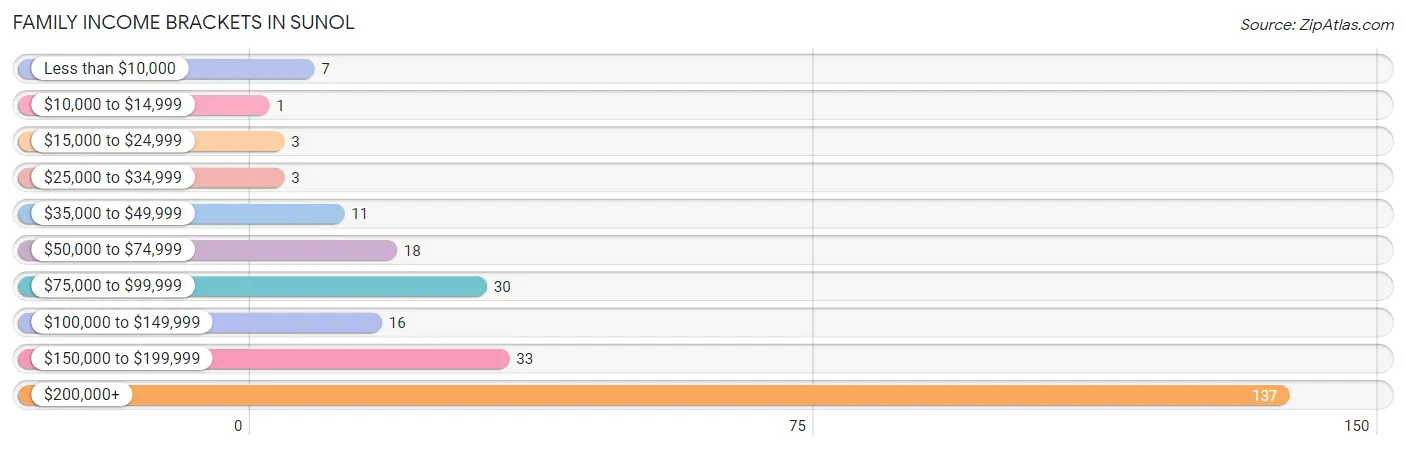
| Income Bracket | # Families | % Families |
| Less than $10,000 | 7 | 2.7% |
| $10,000 to $14,999 | 1 | 0.4% |
| $15,000 to $24,999 | 3 | 1.2% |
| $25,000 to $34,999 | 3 | 1.2% |
| $35,000 to $49,999 | 11 | 4.2% |
| $50,000 to $74,999 | 18 | 6.9% |
| $75,000 to $99,999 | 30 | 11.6% |
| $100,000 to $149,999 | 16 | 6.2% |
| $150,000 to $199,999 | 33 | 12.7% |
| $200,000+ | 137 | 52.9% |
Family Income by Famaliy Size in Sunol
3-person families (50 | 19.3%) account for the highest median family income in Sunol with $250,001 per family, while 3-person families (50 | 19.3%) have the highest median income of $83,334 per family member.
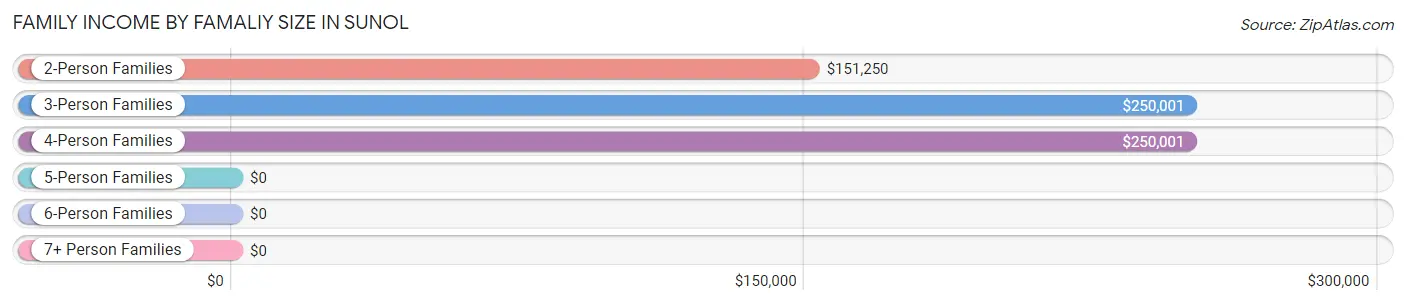
| Income Bracket | # Families | Median Income |
| 2-Person Families | 140 (54.0%) | $151,250 |
| 3-Person Families | 50 (19.3%) | $250,001 |
| 4-Person Families | 43 (16.6%) | $250,001 |
| 5-Person Families | 22 (8.5%) | $0 |
| 6-Person Families | 4 (1.5%) | $0 |
| 7+ Person Families | 0 (0.0%) | $0 |
| Total | 259 (100.0%) | $212,917 |
Family Income by Number of Earners in Sunol
The median family income in Sunol is $212,917, with families comprising 3+ earners (13) having the highest median family income of $250,001, while families with no earners (26) have the lowest median family income of $86,667, accounting for 5.0% and 10.0% of families, respectively.
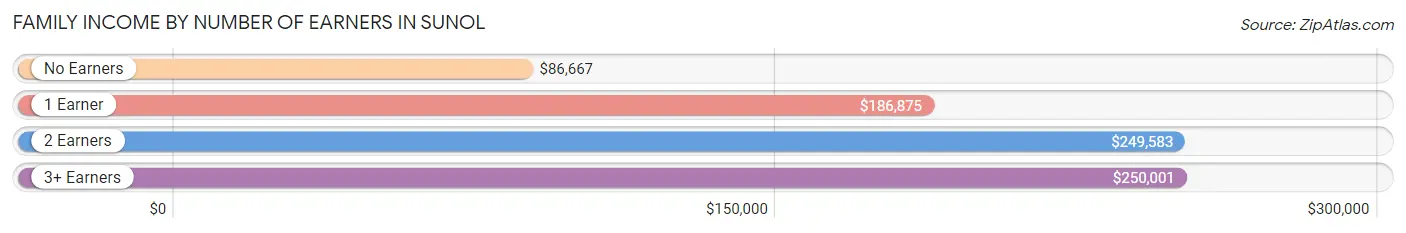
| Number of Earners | # Families | Median Income |
| No Earners | 26 (10.0%) | $86,667 |
| 1 Earner | 83 (32.1%) | $186,875 |
| 2 Earners | 137 (52.9%) | $249,583 |
| 3+ Earners | 13 (5.0%) | $250,001 |
| Total | 259 (100.0%) | $212,917 |
Household Income in Sunol
Household Income Brackets in Sunol
With 141 households falling in the category, the $200,000+ income range is the most frequent in Sunol, accounting for 44.8% of all households. In contrast, only 1 households (0.3%) fall into the $10,000 to $14,999 income bracket, making it the least populous group.
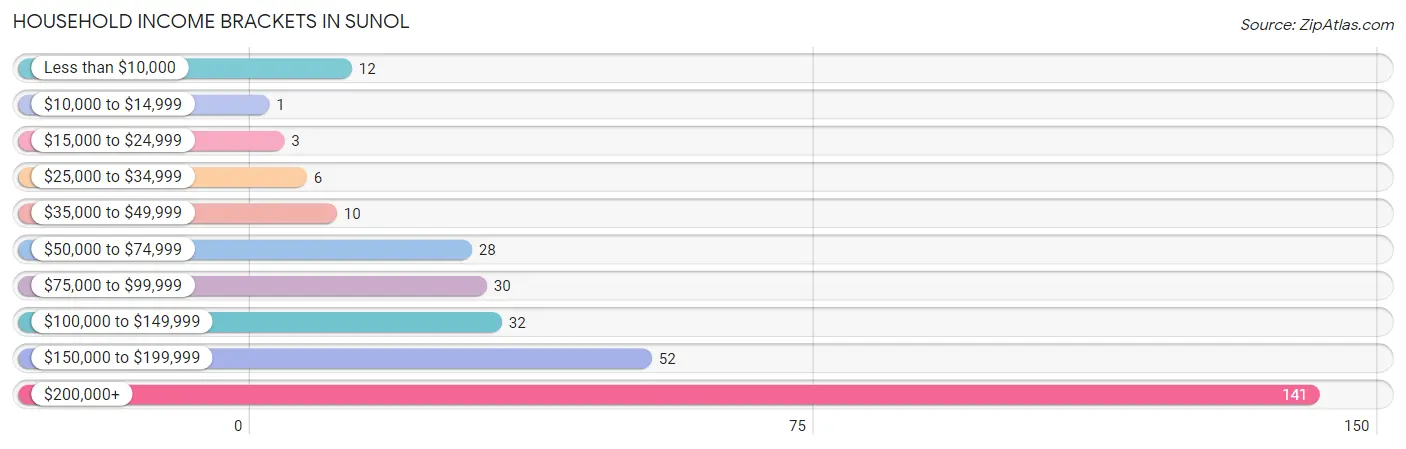
| Income Bracket | # Households | % Households |
| Less than $10,000 | 12 | 3.8% |
| $10,000 to $14,999 | 1 | 0.3% |
| $15,000 to $24,999 | 3 | 1.0% |
| $25,000 to $34,999 | 6 | 1.9% |
| $35,000 to $49,999 | 10 | 3.2% |
| $50,000 to $74,999 | 28 | 8.9% |
| $75,000 to $99,999 | 30 | 9.5% |
| $100,000 to $149,999 | 32 | 10.2% |
| $150,000 to $199,999 | 52 | 16.5% |
| $200,000+ | 141 | 44.8% |
Household Income by Householder Age in Sunol
The median household income in Sunol is $182,250, with the highest median household income of $249,167 found in the 45 to 64 years age bracket for the primary householder. A total of 138 households (43.8%) fall into this category.
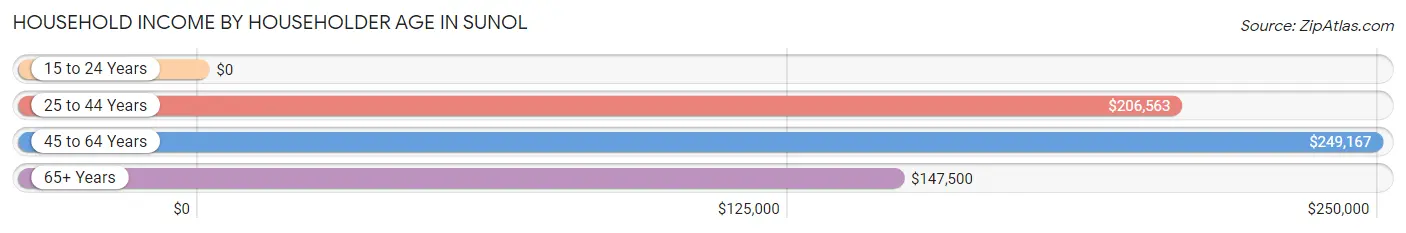
| Income Bracket | # Households | Median Income |
| 15 to 24 Years | 0 (0.0%) | $0 |
| 25 to 44 Years | 81 (25.7%) | $206,563 |
| 45 to 64 Years | 138 (43.8%) | $249,167 |
| 65+ Years | 96 (30.5%) | $147,500 |
| Total | 315 (100.0%) | $182,250 |
Poverty in Sunol
Income Below Poverty by Sex and Age in Sunol
With 6.7% poverty level for males and 5.9% for females among the residents of Sunol, 45 to 54 year old males and 75 year old and over females are the most vulnerable to poverty, with 6 males (20.0%) and 12 females (36.4%) in their respective age groups living below the poverty level.
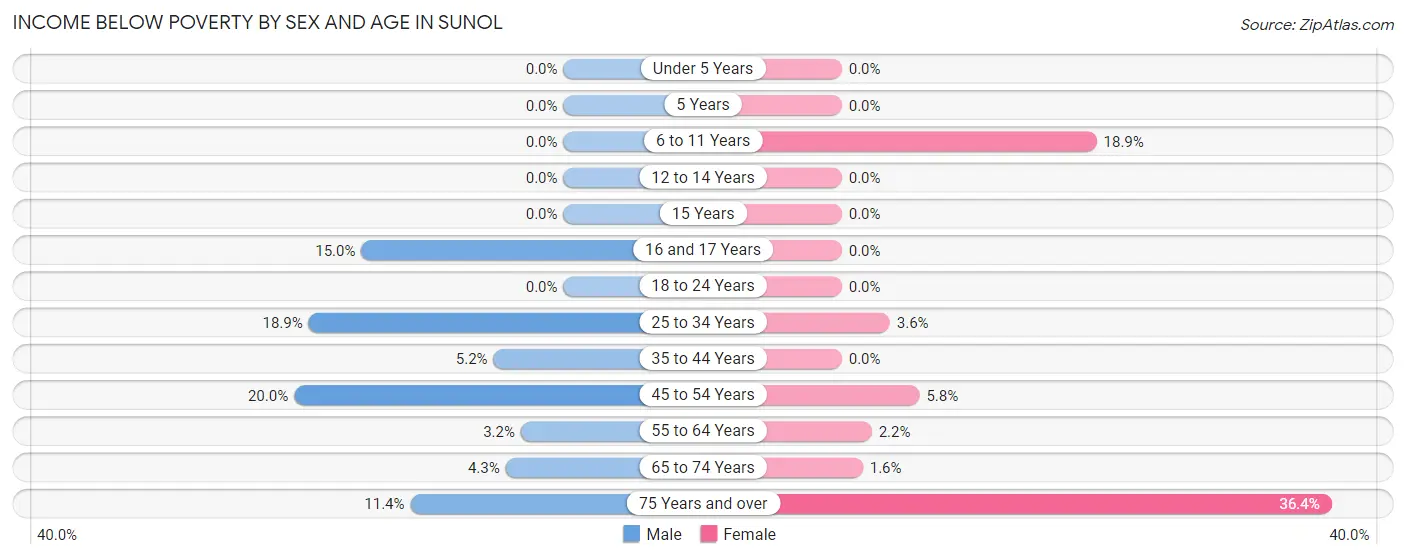
| Age Bracket | Male | Female |
| Under 5 Years | 0 (0.0%) | 0 (0.0%) |
| 5 Years | 0 (0.0%) | 0 (0.0%) |
| 6 to 11 Years | 0 (0.0%) | 7 (18.9%) |
| 12 to 14 Years | 0 (0.0%) | 0 (0.0%) |
| 15 Years | 0 (0.0%) | 0 (0.0%) |
| 16 and 17 Years | 3 (15.0%) | 0 (0.0%) |
| 18 to 24 Years | 0 (0.0%) | 0 (0.0%) |
| 25 to 34 Years | 7 (18.9%) | 2 (3.6%) |
| 35 to 44 Years | 4 (5.2%) | 0 (0.0%) |
| 45 to 54 Years | 6 (20.0%) | 3 (5.8%) |
| 55 to 64 Years | 3 (3.2%) | 2 (2.2%) |
| 65 to 74 Years | 3 (4.3%) | 1 (1.6%) |
| 75 Years and over | 5 (11.4%) | 12 (36.4%) |
| Total | 31 (6.7%) | 27 (5.9%) |
Income Above Poverty by Sex and Age in Sunol
According to the poverty statistics in Sunol, males aged under 5 years and females aged under 5 years are the age groups that are most secure financially, with 100.0% of males and 100.0% of females in these age groups living above the poverty line.
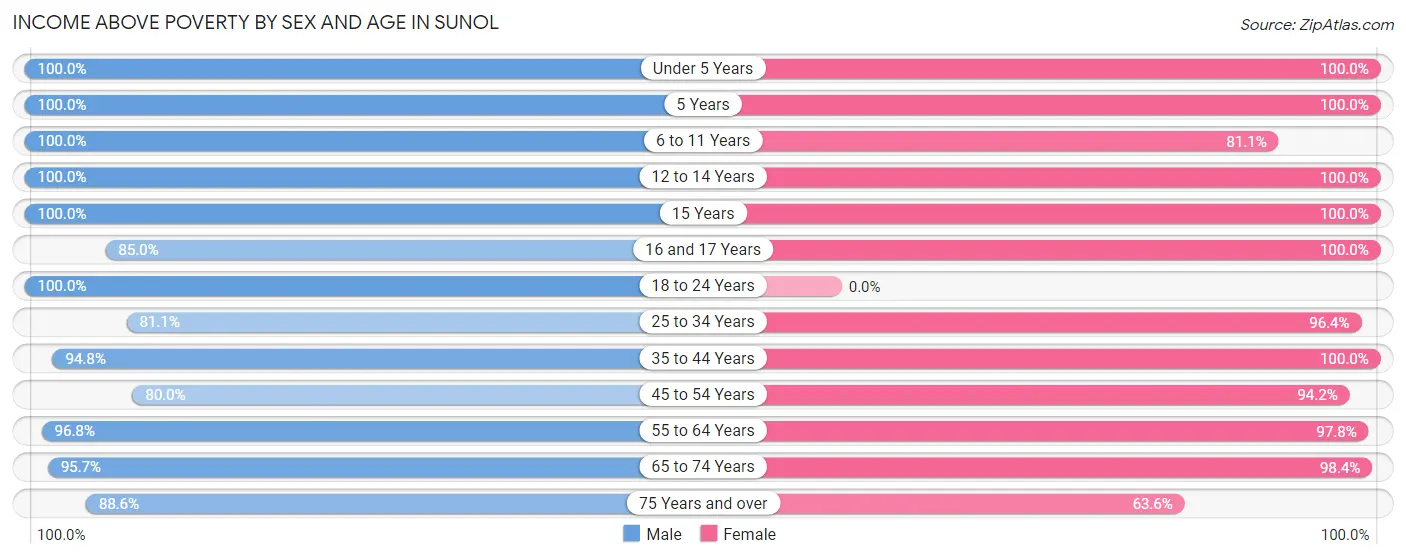
| Age Bracket | Male | Female |
| Under 5 Years | 29 (100.0%) | 17 (100.0%) |
| 5 Years | 10 (100.0%) | 20 (100.0%) |
| 6 to 11 Years | 26 (100.0%) | 30 (81.1%) |
| 12 to 14 Years | 9 (100.0%) | 6 (100.0%) |
| 15 Years | 2 (100.0%) | 6 (100.0%) |
| 16 and 17 Years | 17 (85.0%) | 9 (100.0%) |
| 18 to 24 Years | 14 (100.0%) | 0 (0.0%) |
| 25 to 34 Years | 30 (81.1%) | 54 (96.4%) |
| 35 to 44 Years | 73 (94.8%) | 66 (100.0%) |
| 45 to 54 Years | 24 (80.0%) | 49 (94.2%) |
| 55 to 64 Years | 92 (96.8%) | 88 (97.8%) |
| 65 to 74 Years | 67 (95.7%) | 63 (98.4%) |
| 75 Years and over | 39 (88.6%) | 21 (63.6%) |
| Total | 432 (93.3%) | 429 (94.1%) |
Income Below Poverty Among Married-Couple Families in Sunol
The poverty statistics for married-couple families in Sunol show that 1.8% or 4 of the total 216 families live below the poverty line. Families with 1 or 2 children have the highest poverty rate of 4.1%, comprising of 3 families. On the other hand, families with 3 or 4 children have the lowest poverty rate of 0.0%, which includes 0 families.
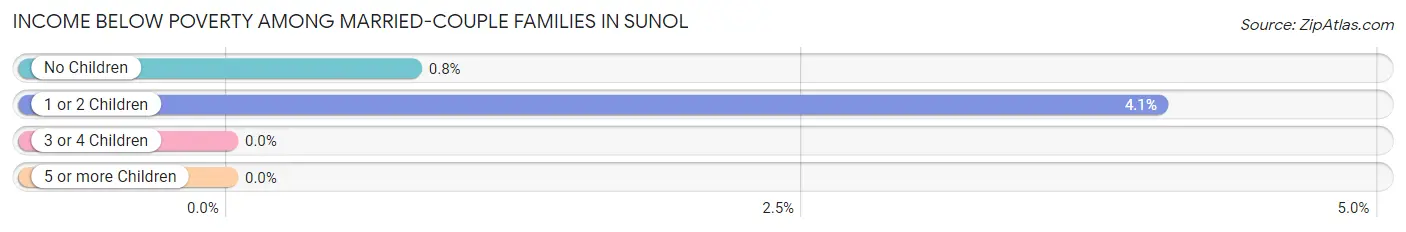
| Children | Above Poverty | Below Poverty |
| No Children | 124 (99.2%) | 1 (0.8%) |
| 1 or 2 Children | 71 (96.0%) | 3 (4.1%) |
| 3 or 4 Children | 17 (100.0%) | 0 (0.0%) |
| 5 or more Children | 0 (0.0%) | 0 (0.0%) |
| Total | 212 (98.2%) | 4 (1.8%) |
Income Below Poverty Among Single-Parent Households in Sunol
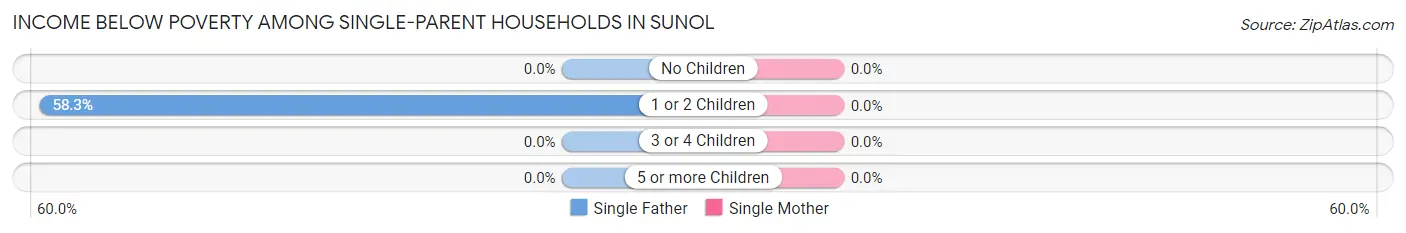
| Children | Single Father | Single Mother |
| No Children | 0 (0.0%) | 0 (0.0%) |
| 1 or 2 Children | 7 (58.3%) | 0 (0.0%) |
| 3 or 4 Children | 0 (0.0%) | 0 (0.0%) |
| 5 or more Children | 0 (0.0%) | 0 (0.0%) |
| Total | 7 (25.0%) | 0 (0.0%) |
Income Below Poverty Among Married-Couple vs Single-Parent Households in Sunol
The poverty data for Sunol shows that 4 of the married-couple family households (1.8%) and 7 of the single-parent households (16.3%) are living below the poverty level. Within the married-couple family households, those with 1 or 2 children have the highest poverty rate, with 3 households (4.1%) falling below the poverty line. Among the single-parent households, those with 1 or 2 children have the highest poverty rate, with 7 household (36.8%) living below poverty.
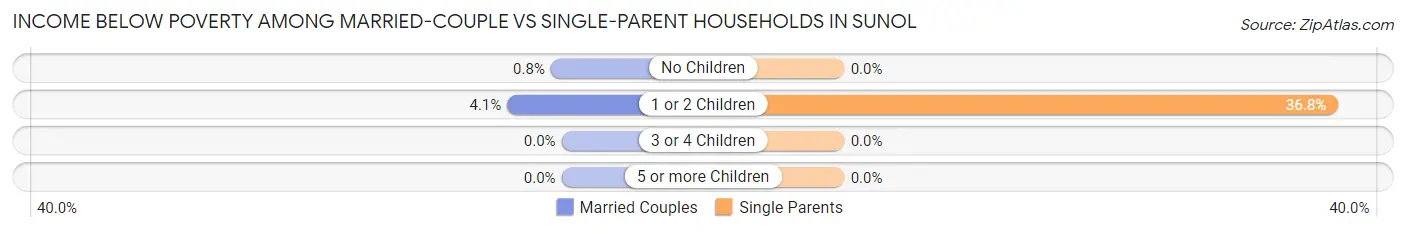
| Children | Married-Couple Families | Single-Parent Households |
| No Children | 1 (0.8%) | 0 (0.0%) |
| 1 or 2 Children | 3 (4.1%) | 7 (36.8%) |
| 3 or 4 Children | 0 (0.0%) | 0 (0.0%) |
| 5 or more Children | 0 (0.0%) | 0 (0.0%) |
| Total | 4 (1.8%) | 7 (16.3%) |
Race in Sunol
The most populous races in Sunol are White / Caucasian (691 | 75.1%), Asian (122 | 13.3%), and Hispanic or Latino (117 | 12.7%).
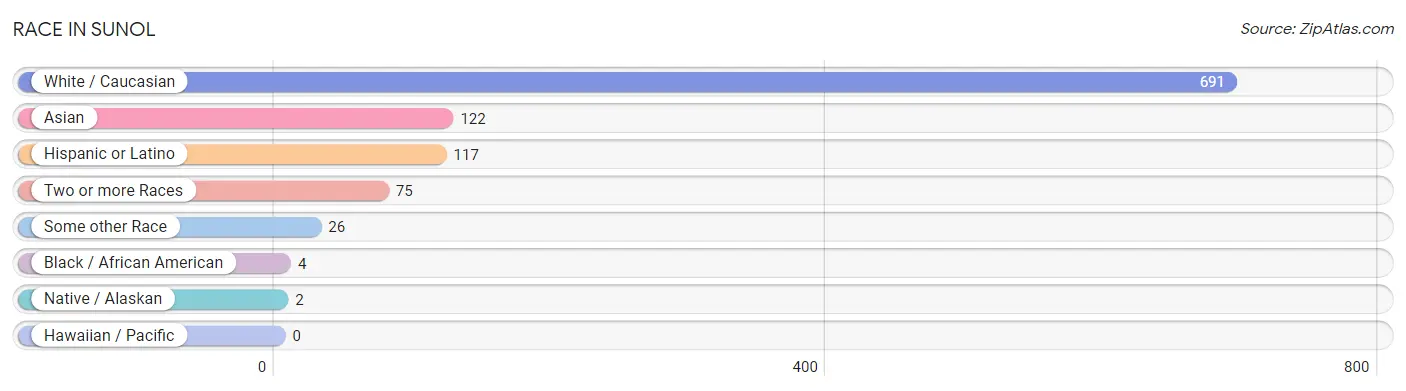
| Race | # Population | % Population |
| Asian | 122 | 13.3% |
| Black / African American | 4 | 0.4% |
| Hawaiian / Pacific | 0 | 0.0% |
| Hispanic or Latino | 117 | 12.7% |
| Native / Alaskan | 2 | 0.2% |
| White / Caucasian | 691 | 75.1% |
| Two or more Races | 75 | 8.2% |
| Some other Race | 26 | 2.8% |
| Total | 920 | 100.0% |
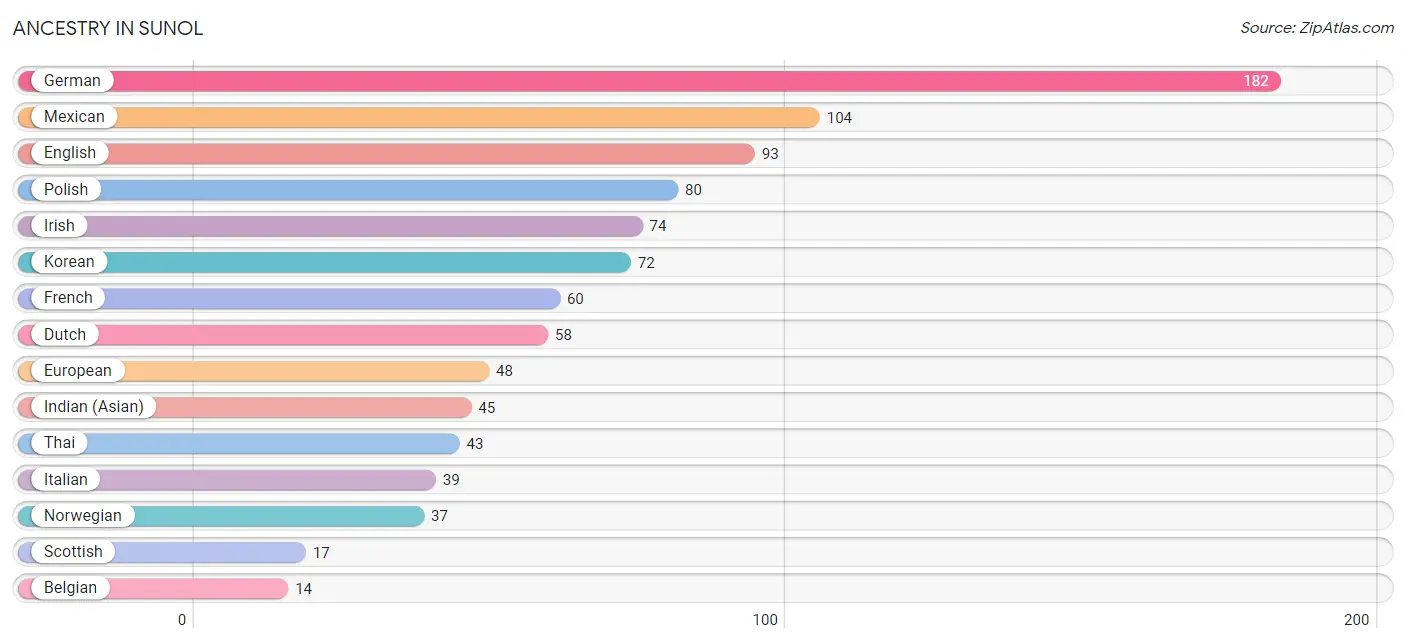
Ancestry in Sunol
The most populous ancestries reported in Sunol are German (182 | 19.8%), Mexican (104 | 11.3%), English (93 | 10.1%), Polish (80 | 8.7%), and Irish (74 | 8.0%), together accounting for 57.9% of all Sunol residents.
| Ancestry | # Population | % Population |
| American | 11 | 1.2% |
| Armenian | 11 | 1.2% |
| Belgian | 14 | 1.5% |
| Bhutanese | 12 | 1.3% |
| Blackfeet | 3 | 0.3% |
| British | 2 | 0.2% |
| Cherokee | 4 | 0.4% |
| Choctaw | 4 | 0.4% |
| Croatian | 7 | 0.8% |
| Danish | 2 | 0.2% |
| Dutch | 58 | 6.3% |
| Eastern European | 8 | 0.9% |
| English | 93 | 10.1% |
| European | 48 | 5.2% |
| French | 60 | 6.5% |
| French Canadian | 3 | 0.3% |
| German | 182 | 19.8% |
| Hungarian | 11 | 1.2% |
| Indian (Asian) | 45 | 4.9% |
| Irish | 74 | 8.0% |
| Italian | 39 | 4.2% |
| Korean | 72 | 7.8% |
| Mexican | 104 | 11.3% |
| Native Hawaiian | 12 | 1.3% |
| Norwegian | 37 | 4.0% |
| Peruvian | 3 | 0.3% |
| Polish | 80 | 8.7% |
| Portuguese | 7 | 0.8% |
| Puerto Rican | 6 | 0.6% |
| Russian | 1 | 0.1% |
| Scottish | 17 | 1.8% |
| Slovene | 2 | 0.2% |
| South American | 3 | 0.3% |
| Spanish | 4 | 0.4% |
| Sri Lankan | 8 | 0.9% |
| Swedish | 3 | 0.3% |
| Thai | 43 | 4.7% |
| Welsh | 12 | 1.3% | View All 38 Rows |
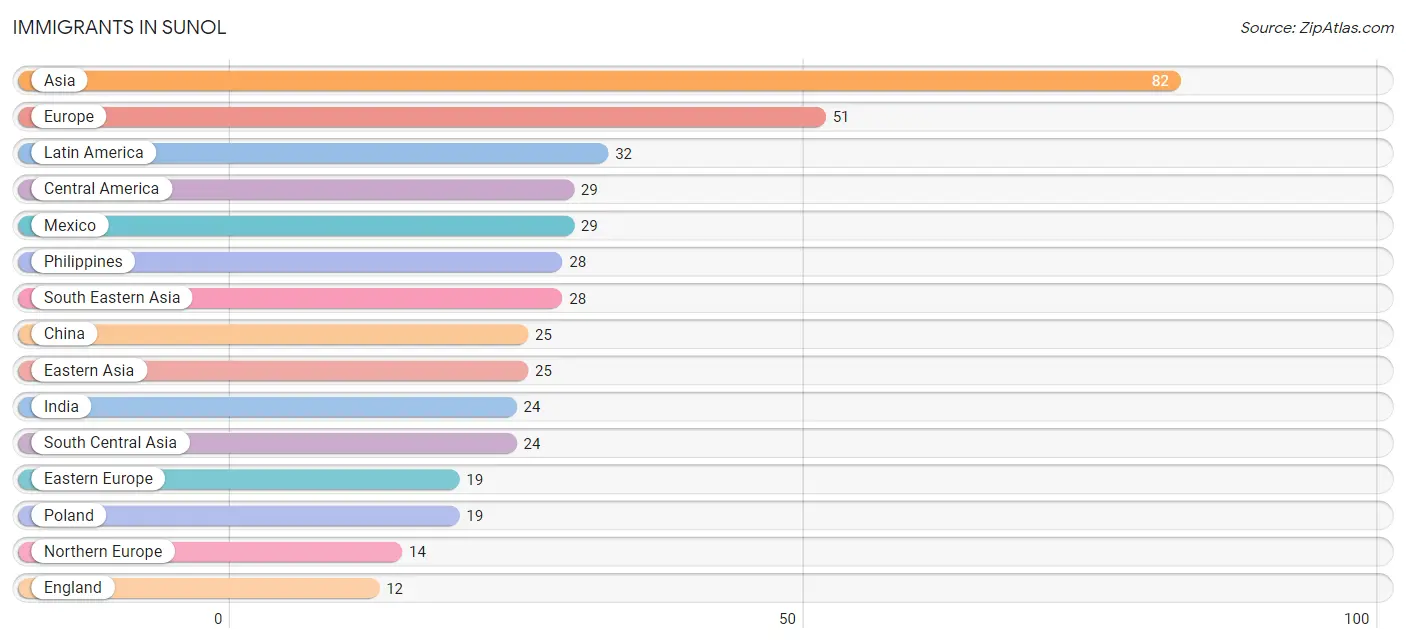
Immigrants in Sunol
The most numerous immigrant groups reported in Sunol came from Asia (82 | 8.9%), Europe (51 | 5.5%), Latin America (32 | 3.5%), Central America (29 | 3.2%), and Mexico (29 | 3.2%), together accounting for 24.2% of all Sunol residents.
| Immigration Origin | # Population | % Population |
| Asia | 82 | 8.9% |
| Belgium | 3 | 0.3% |
| Central America | 29 | 3.2% |
| China | 25 | 2.7% |
| Eastern Asia | 25 | 2.7% |
| Eastern Europe | 19 | 2.1% |
| England | 12 | 1.3% |
| Europe | 51 | 5.5% |
| Germany | 9 | 1.0% |
| Hong Kong | 2 | 0.2% |
| India | 24 | 2.6% |
| Italy | 6 | 0.6% |
| Latin America | 32 | 3.5% |
| Mexico | 29 | 3.2% |
| Northern Europe | 14 | 1.5% |
| Peru | 3 | 0.3% |
| Philippines | 28 | 3.0% |
| Poland | 19 | 2.1% |
| South America | 3 | 0.3% |
| South Central Asia | 24 | 2.6% |
| South Eastern Asia | 28 | 3.0% |
| Southern Europe | 6 | 0.6% |
| Taiwan | 8 | 0.9% |
| Turkey | 5 | 0.5% |
| Western Asia | 5 | 0.5% |
| Western Europe | 12 | 1.3% | View All 26 Rows |
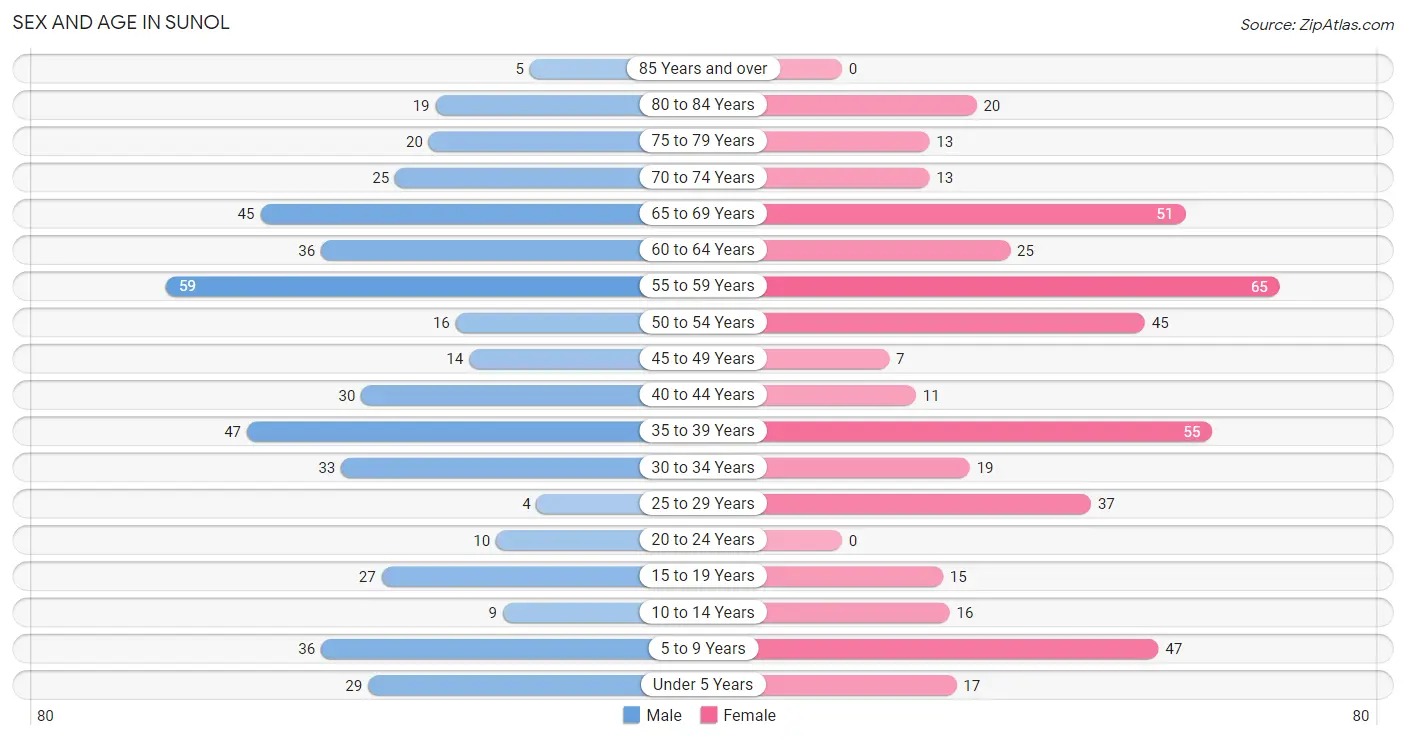
Sex and Age in Sunol
Sex and Age in Sunol
The most populous age groups in Sunol are 55 to 59 Years (59 | 12.7%) for men and 55 to 59 Years (65 | 14.2%) for women.
| Age Bracket | Male | Female |
| Under 5 Years | 29 (6.2%) | 17 (3.7%) |
| 5 to 9 Years | 36 (7.8%) | 47 (10.3%) |
| 10 to 14 Years | 9 (1.9%) | 16 (3.5%) |
| 15 to 19 Years | 27 (5.8%) | 15 (3.3%) |
| 20 to 24 Years | 10 (2.2%) | 0 (0.0%) |
| 25 to 29 Years | 4 (0.9%) | 37 (8.1%) |
| 30 to 34 Years | 33 (7.1%) | 19 (4.2%) |
| 35 to 39 Years | 47 (10.1%) | 55 (12.1%) |
| 40 to 44 Years | 30 (6.5%) | 11 (2.4%) |
| 45 to 49 Years | 14 (3.0%) | 7 (1.5%) |
| 50 to 54 Years | 16 (3.5%) | 45 (9.9%) |
| 55 to 59 Years | 59 (12.7%) | 65 (14.2%) |
| 60 to 64 Years | 36 (7.8%) | 25 (5.5%) |
| 65 to 69 Years | 45 (9.7%) | 51 (11.2%) |
| 70 to 74 Years | 25 (5.4%) | 13 (2.9%) |
| 75 to 79 Years | 20 (4.3%) | 13 (2.9%) |
| 80 to 84 Years | 19 (4.1%) | 20 (4.4%) |
| 85 Years and over | 5 (1.1%) | 0 (0.0%) |
| Total | 464 (100.0%) | 456 (100.0%) |
Families and Households in Sunol
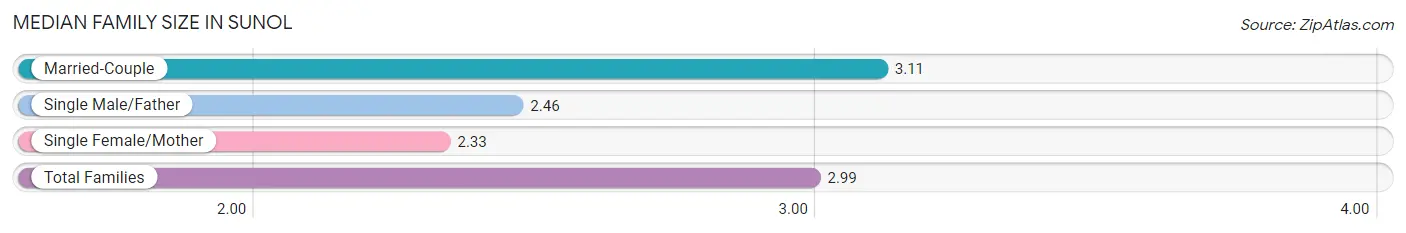
Median Family Size in Sunol
The median family size in Sunol is 2.99 persons per family, with married-couple families (216 | 83.4%) accounting for the largest median family size of 3.11 persons per family. On the other hand, single female/mother families (15 | 5.8%) represent the smallest median family size with 2.33 persons per family.
| Family Type | # Families | Family Size |
| Married-Couple | 216 (83.4%) | 3.11 |
| Single Male/Father | 28 (10.8%) | 2.46 |
| Single Female/Mother | 15 (5.8%) | 2.33 |
| Total Families | 259 (100.0%) | 2.99 |
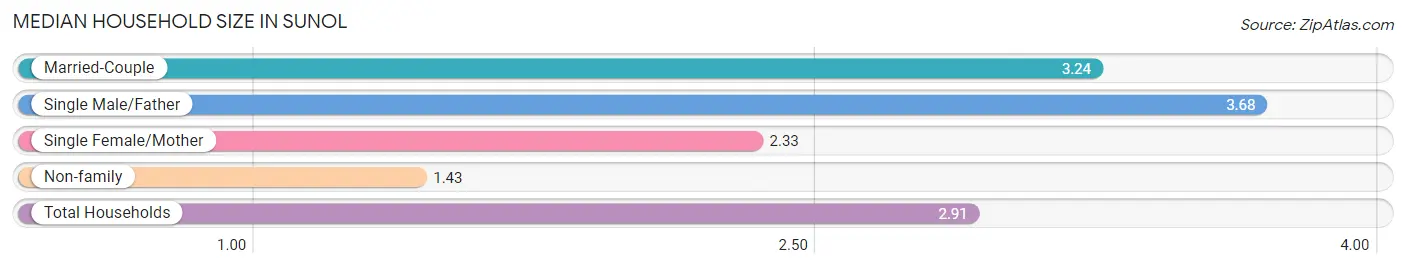
Median Household Size in Sunol
The median household size in Sunol is 2.91 persons per household, with single male/father households (28 | 8.9%) accounting for the largest median household size of 3.68 persons per household. non-family households (56 | 17.8%) represent the smallest median household size with 1.43 persons per household.
| Household Type | # Households | Household Size |
| Married-Couple | 216 (68.6%) | 3.24 |
| Single Male/Father | 28 (8.9%) | 3.68 |
| Single Female/Mother | 15 (4.8%) | 2.33 |
| Non-family | 56 (17.8%) | 1.43 |
| Total Households | 315 (100.0%) | 2.91 |
Household Size by Marriage Status in Sunol
Out of a total of 315 households in Sunol, 259 (82.2%) are family households, while 56 (17.8%) are nonfamily households. The most numerous type of family households are 2-person households, comprising 120, and the most common type of nonfamily households are 1-person households, comprising 36.
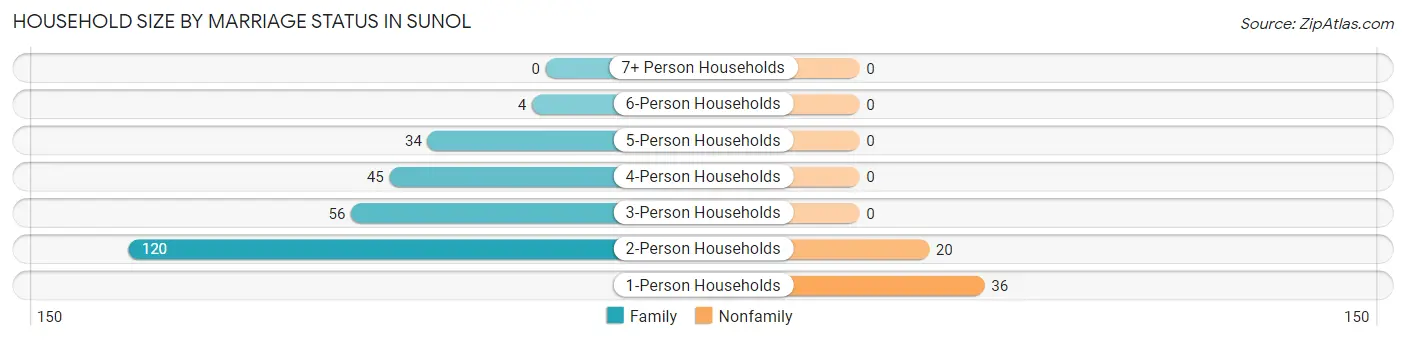
| Household Size | Family Households | Nonfamily Households |
| 1-Person Households | - | 36 (11.4%) |
| 2-Person Households | 120 (38.1%) | 20 (6.4%) |
| 3-Person Households | 56 (17.8%) | 0 (0.0%) |
| 4-Person Households | 45 (14.3%) | 0 (0.0%) |
| 5-Person Households | 34 (10.8%) | 0 (0.0%) |
| 6-Person Households | 4 (1.3%) | 0 (0.0%) |
| 7+ Person Households | 0 (0.0%) | 0 (0.0%) |
| Total | 259 (82.2%) | 56 (17.8%) |
Female Fertility in Sunol
Fertility by Age in Sunol
Average fertility rate in Sunol is 103.0 births per 1,000 women. Women in the age bracket of 35 to 50 years have the highest fertility rate with 176.0 births per 1,000 women. Women in the age bracket of 35 to 50 years acount for 86.7% of all women with births.
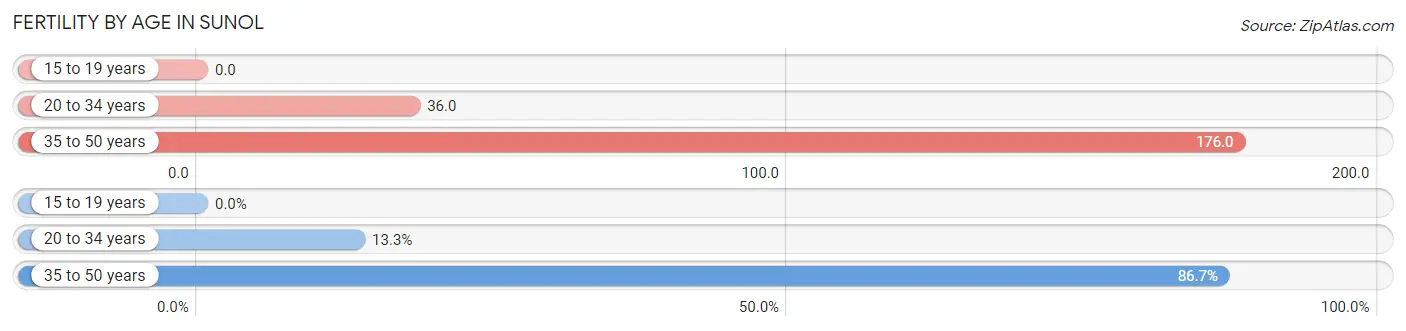
| Age Bracket | Women with Births | Births / 1,000 Women |
| 15 to 19 years | 0 (0.0%) | 0.0 |
| 20 to 34 years | 2 (13.3%) | 36.0 |
| 35 to 50 years | 13 (86.7%) | 176.0 |
| Total | 15 (100.0%) | 103.0 |
Fertility by Age by Marriage Status in Sunol
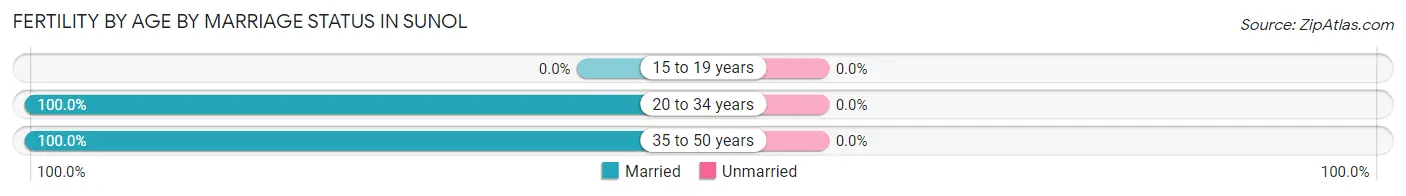
| Age Bracket | Married | Unmarried |
| 15 to 19 years | 0 (0.0%) | 0 (0.0%) |
| 20 to 34 years | 2 (100.0%) | 0 (0.0%) |
| 35 to 50 years | 13 (100.0%) | 0 (0.0%) |
| Total | 15 (100.0%) | 0 (0.0%) |
Fertility by Education in Sunol
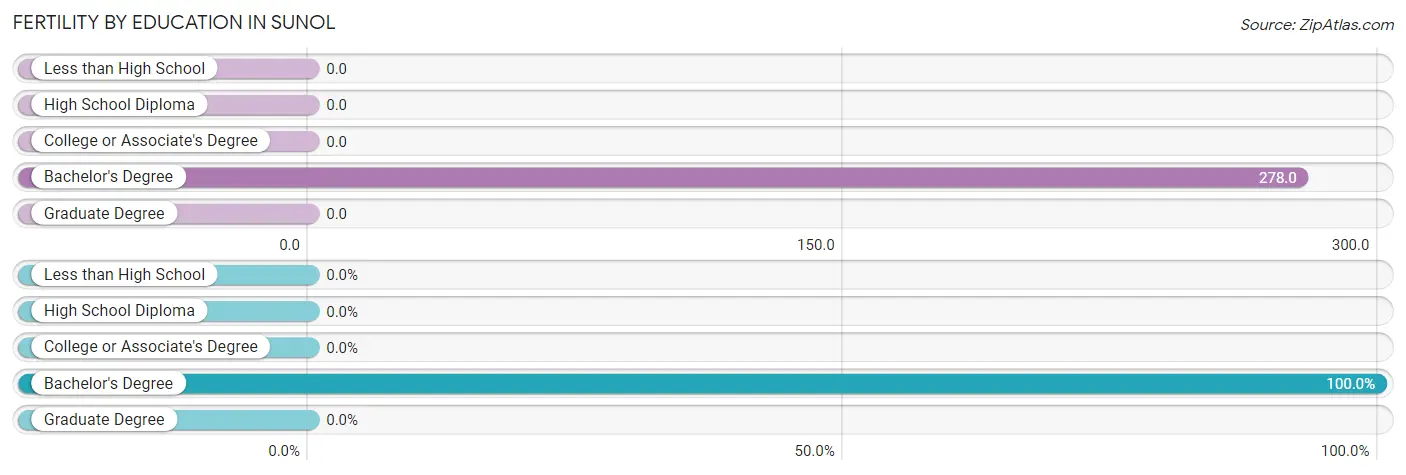
| Educational Attainment | Women with Births | Births / 1,000 Women |
| Less than High School | 0 (0.0%) | 0.0 |
| High School Diploma | 0 (0.0%) | 0.0 |
| College or Associate's Degree | 0 (0.0%) | 0.0 |
| Bachelor's Degree | 15 (100.0%) | 278.0 |
| Graduate Degree | 0 (0.0%) | 0.0 |
| Total | 15 (100.0%) | 103.0 |
Fertility by Education by Marriage Status in Sunol
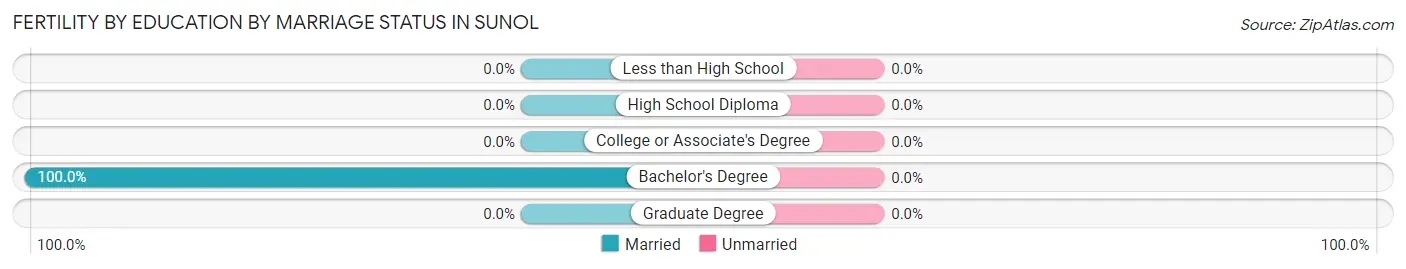
| Educational Attainment | Married | Unmarried |
| Less than High School | 0 (0.0%) | 0 (0.0%) |
| High School Diploma | 0 (0.0%) | 0 (0.0%) |
| College or Associate's Degree | 0 (0.0%) | 0 (0.0%) |
| Bachelor's Degree | 15 (100.0%) | 0 (0.0%) |
| Graduate Degree | 0 (0.0%) | 0 (0.0%) |
| Total | 15 (100.0%) | 0 (0.0%) |
Employment Characteristics in Sunol
Employment by Class of Employer in Sunol
Among the 450 employed individuals in Sunol, private company employees (337 | 74.9%), local government employees (50 | 11.1%), and not-for-profit organizations (22 | 4.9%) make up the most common classes of employment.
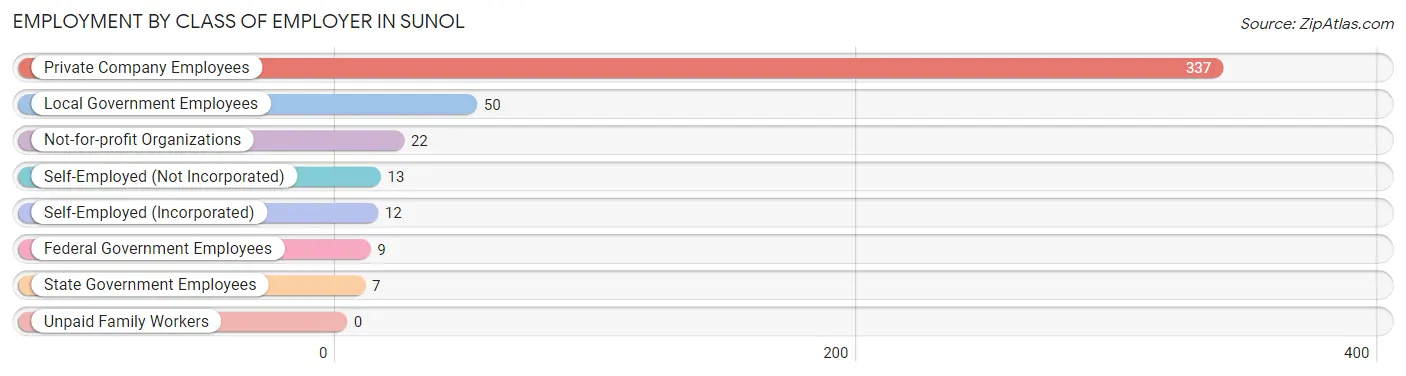
| Employer Class | # Employees | % Employees |
| Private Company Employees | 337 | 74.9% |
| Self-Employed (Incorporated) | 12 | 2.7% |
| Self-Employed (Not Incorporated) | 13 | 2.9% |
| Not-for-profit Organizations | 22 | 4.9% |
| Local Government Employees | 50 | 11.1% |
| State Government Employees | 7 | 1.6% |
| Federal Government Employees | 9 | 2.0% |
| Unpaid Family Workers | 0 | 0.0% |
| Total | 450 | 100.0% |
Employment Status by Age in Sunol
According to the labor force statistics for Sunol, out of the total population over 16 years of age (758), 64.8% or 491 individuals are in the labor force, with 6.5% or 32 of them unemployed. The age group with the highest labor force participation rate is 55 to 59 years, with 95.2% or 118 individuals in the labor force. Within the labor force, the 65 to 74 years age range has the highest percentage of unemployed individuals, with 16.1% or 10 of them being unemployed.
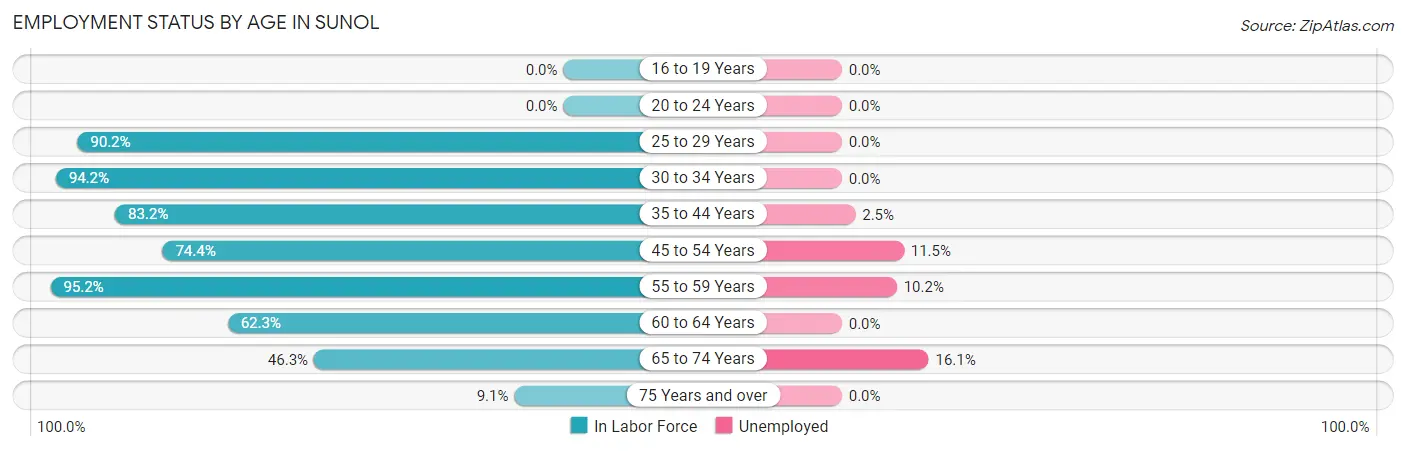
| Age Bracket | In Labor Force | Unemployed |
| 16 to 19 Years | 0 (0.0%) | 0 (0.0%) |
| 20 to 24 Years | 0 (0.0%) | 0 (0.0%) |
| 25 to 29 Years | 37 (90.2%) | 0 (0.0%) |
| 30 to 34 Years | 49 (94.2%) | 0 (0.0%) |
| 35 to 44 Years | 119 (83.2%) | 3 (2.5%) |
| 45 to 54 Years | 61 (74.4%) | 7 (11.5%) |
| 55 to 59 Years | 118 (95.2%) | 12 (10.2%) |
| 60 to 64 Years | 38 (62.3%) | 0 (0.0%) |
| 65 to 74 Years | 62 (46.3%) | 10 (16.1%) |
| 75 Years and over | 7 (9.1%) | 0 (0.0%) |
| Total | 491 (64.8%) | 32 (6.5%) |
Employment Status by Educational Attainment in Sunol
According to labor force statistics for Sunol, 83.9% of individuals (422) out of the total population between 25 and 64 years of age (503) are in the labor force, with 5.2% or 22 of them being unemployed. The group with the highest labor force participation rate are those with the educational attainment of high school diploma, with 86.8% or 66 individuals in the labor force. Within the labor force, individuals with less than high school education have the highest percentage of unemployment, with 17.6% or 3 of them being unemployed.
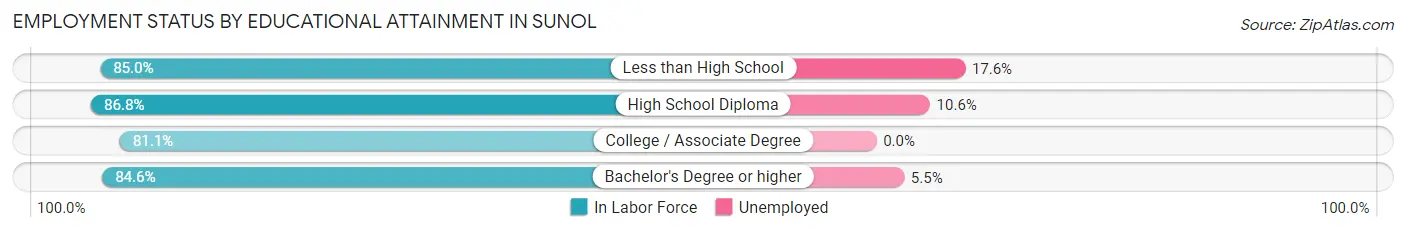
| Educational Attainment | In Labor Force | Unemployed |
| Less than High School | 17 (85.0%) | 4 (17.6%) |
| High School Diploma | 66 (86.8%) | 8 (10.6%) |
| College / Associate Degree | 120 (81.1%) | 0 (0.0%) |
| Bachelor's Degree or higher | 219 (84.6%) | 14 (5.5%) |
| Total | 422 (83.9%) | 26 (5.2%) |
Employment Occupations by Sex in Sunol
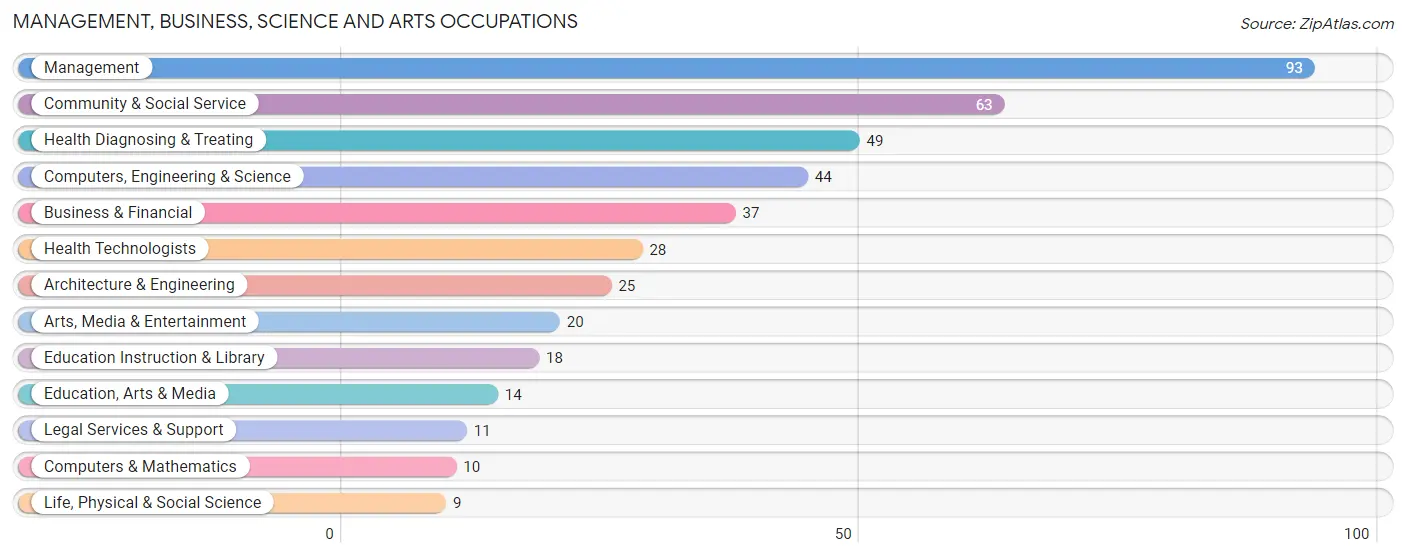
Management, Business, Science and Arts Occupations
The most common Management, Business, Science and Arts occupations in Sunol are Management (93 | 20.3%), Community & Social Service (63 | 13.7%), Health Diagnosing & Treating (49 | 10.7%), Computers, Engineering & Science (44 | 9.6%), and Business & Financial (37 | 8.1%).
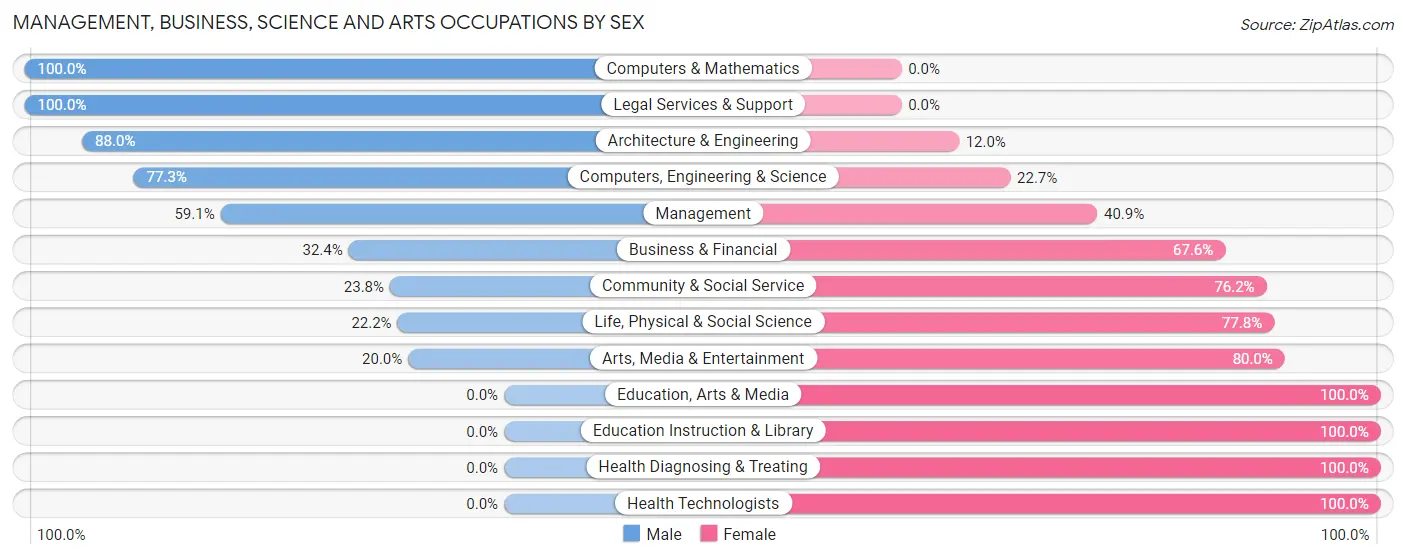
Management, Business, Science and Arts Occupations by Sex
Within the Management, Business, Science and Arts occupations in Sunol, the most male-oriented occupations are Computers & Mathematics (100.0%), Legal Services & Support (100.0%), and Architecture & Engineering (88.0%), while the most female-oriented occupations are Education, Arts & Media (100.0%), Education Instruction & Library (100.0%), and Health Diagnosing & Treating (100.0%).
| Occupation | Male | Female |
| Management | 55 (59.1%) | 38 (40.9%) |
| Business & Financial | 12 (32.4%) | 25 (67.6%) |
| Computers, Engineering & Science | 34 (77.3%) | 10 (22.7%) |
| Computers & Mathematics | 10 (100.0%) | 0 (0.0%) |
| Architecture & Engineering | 22 (88.0%) | 3 (12.0%) |
| Life, Physical & Social Science | 2 (22.2%) | 7 (77.8%) |
| Community & Social Service | 15 (23.8%) | 48 (76.2%) |
| Education, Arts & Media | 0 (0.0%) | 14 (100.0%) |
| Legal Services & Support | 11 (100.0%) | 0 (0.0%) |
| Education Instruction & Library | 0 (0.0%) | 18 (100.0%) |
| Arts, Media & Entertainment | 4 (20.0%) | 16 (80.0%) |
| Health Diagnosing & Treating | 0 (0.0%) | 49 (100.0%) |
| Health Technologists | 0 (0.0%) | 28 (100.0%) |
| Total (Category) | 116 (40.6%) | 170 (59.4%) |
| Total (Overall) | 231 (50.3%) | 228 (49.7%) |
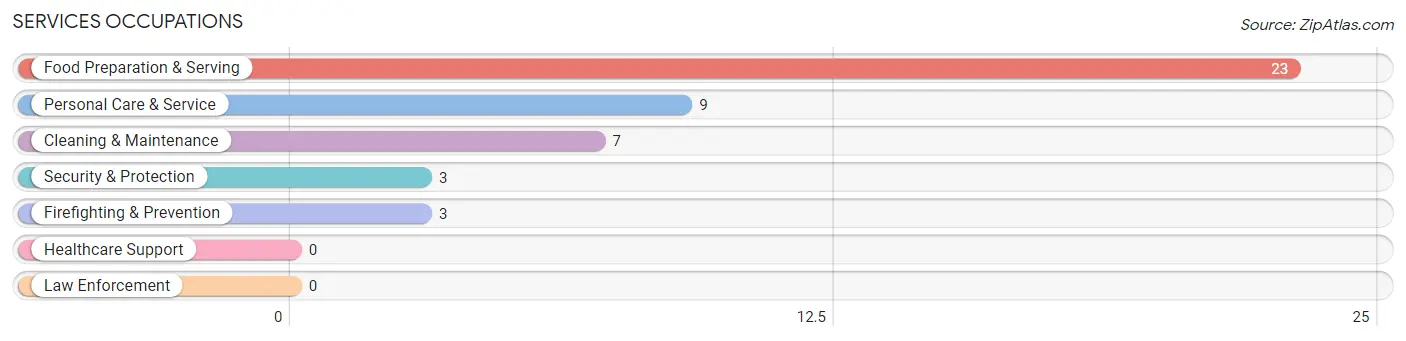
Services Occupations
The most common Services occupations in Sunol are Food Preparation & Serving (23 | 5.0%), Personal Care & Service (9 | 2.0%), Cleaning & Maintenance (7 | 1.5%), Security & Protection (3 | 0.6%), and Firefighting & Prevention (3 | 0.6%).
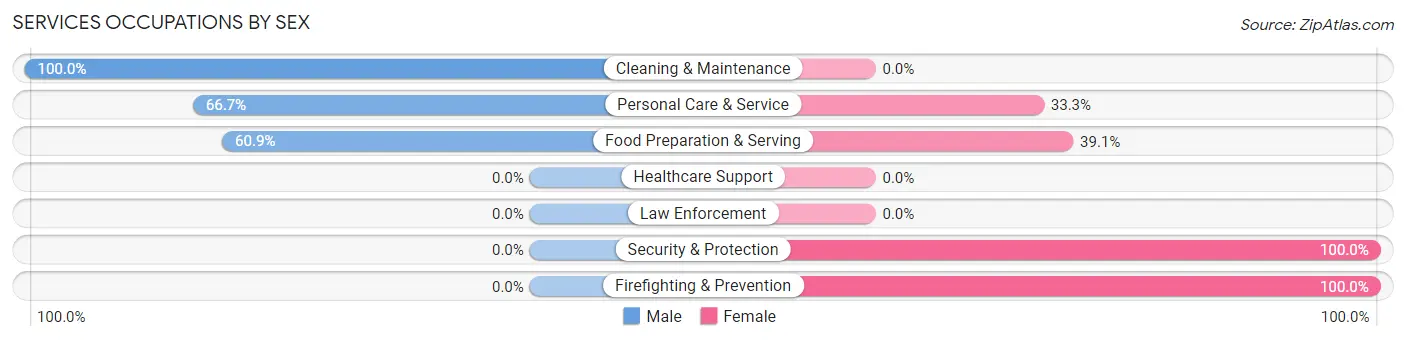
Services Occupations by Sex
Within the Services occupations in Sunol, the most male-oriented occupations are Cleaning & Maintenance (100.0%), Personal Care & Service (66.7%), and Food Preparation & Serving (60.9%), while the most female-oriented occupations are Security & Protection (100.0%), Firefighting & Prevention (100.0%), and Food Preparation & Serving (39.1%).
| Occupation | Male | Female |
| Healthcare Support | 0 (0.0%) | 0 (0.0%) |
| Security & Protection | 0 (0.0%) | 3 (100.0%) |
| Firefighting & Prevention | 0 (0.0%) | 3 (100.0%) |
| Law Enforcement | 0 (0.0%) | 0 (0.0%) |
| Food Preparation & Serving | 14 (60.9%) | 9 (39.1%) |
| Cleaning & Maintenance | 7 (100.0%) | 0 (0.0%) |
| Personal Care & Service | 6 (66.7%) | 3 (33.3%) |
| Total (Category) | 27 (64.3%) | 15 (35.7%) |
| Total (Overall) | 231 (50.3%) | 228 (49.7%) |
Sales and Office Occupations
The most common Sales and Office occupations in Sunol are Office & Administration (36 | 7.8%), and Sales & Related (21 | 4.6%).
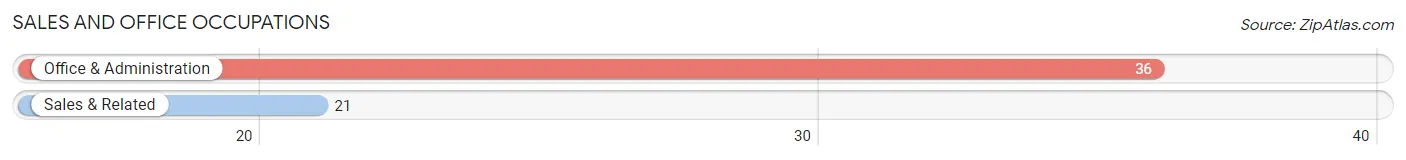
Sales and Office Occupations by Sex
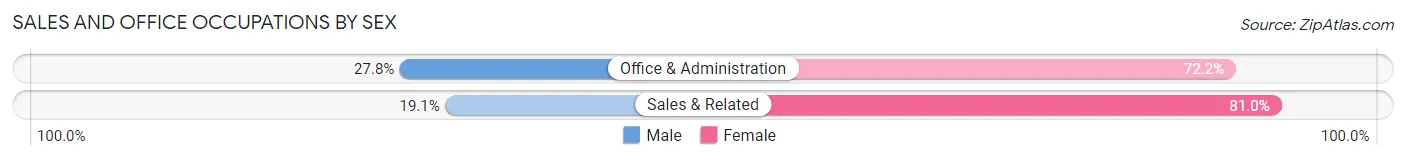
| Occupation | Male | Female |
| Sales & Related | 4 (19.1%) | 17 (80.9%) |
| Office & Administration | 10 (27.8%) | 26 (72.2%) |
| Total (Category) | 14 (24.6%) | 43 (75.4%) |
| Total (Overall) | 231 (50.3%) | 228 (49.7%) |
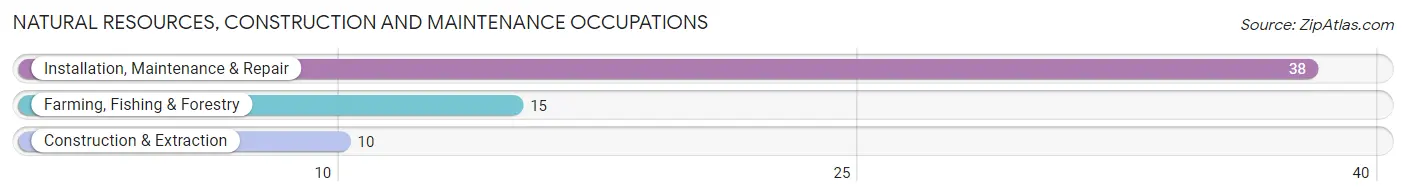
Natural Resources, Construction and Maintenance Occupations
The most common Natural Resources, Construction and Maintenance occupations in Sunol are Installation, Maintenance & Repair (38 | 8.3%), Farming, Fishing & Forestry (15 | 3.3%), and Construction & Extraction (10 | 2.2%).
Natural Resources, Construction and Maintenance Occupations by Sex
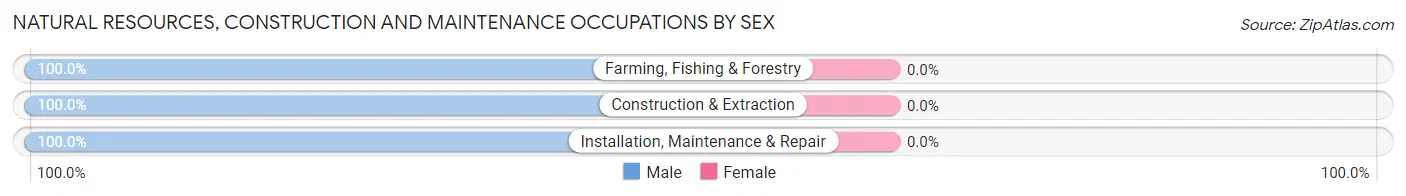
| Occupation | Male | Female |
| Farming, Fishing & Forestry | 15 (100.0%) | 0 (0.0%) |
| Construction & Extraction | 10 (100.0%) | 0 (0.0%) |
| Installation, Maintenance & Repair | 38 (100.0%) | 0 (0.0%) |
| Total (Category) | 63 (100.0%) | 0 (0.0%) |
| Total (Overall) | 231 (50.3%) | 228 (49.7%) |
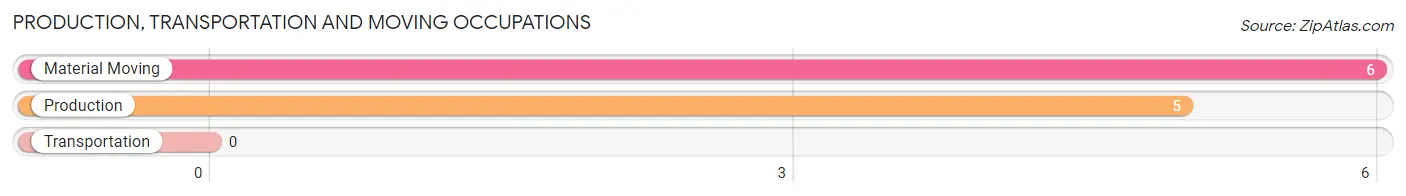
Production, Transportation and Moving Occupations
The most common Production, Transportation and Moving occupations in Sunol are Material Moving (6 | 1.3%), and Production (5 | 1.1%).
Production, Transportation and Moving Occupations by Sex
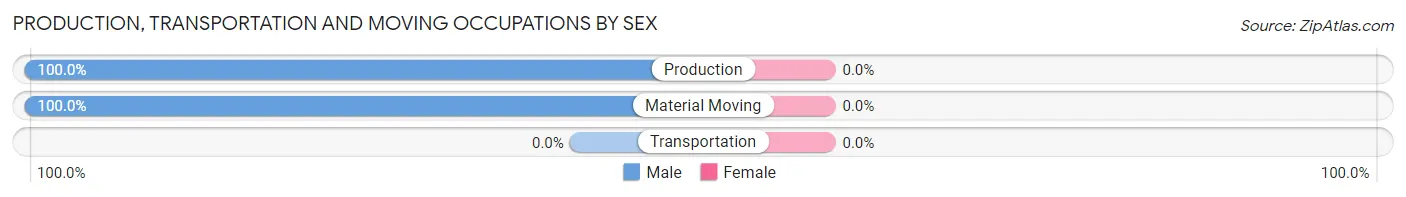
| Occupation | Male | Female |
| Production | 5 (100.0%) | 0 (0.0%) |
| Transportation | 0 (0.0%) | 0 (0.0%) |
| Material Moving | 6 (100.0%) | 0 (0.0%) |
| Total (Category) | 11 (100.0%) | 0 (0.0%) |
| Total (Overall) | 231 (50.3%) | 228 (49.7%) |
Employment Industries by Sex in Sunol
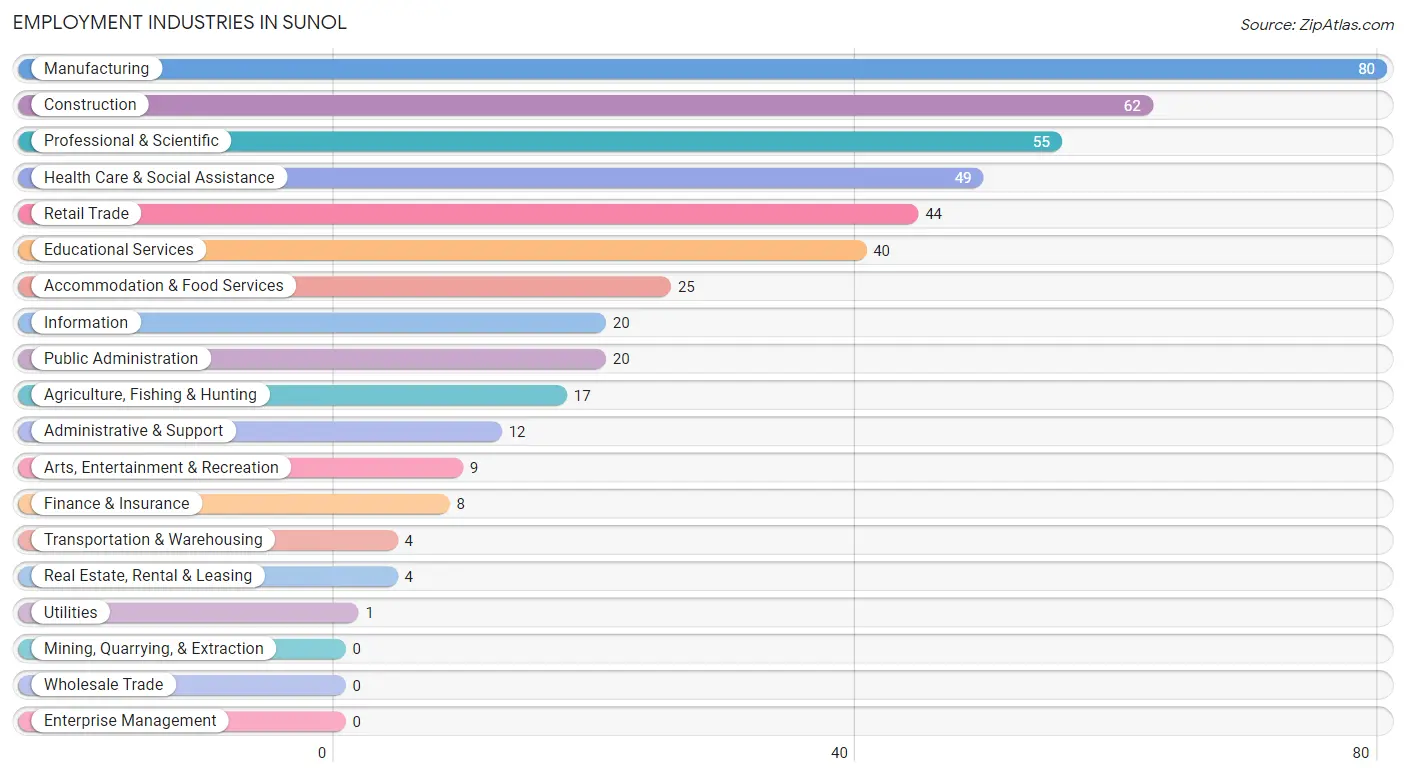
Employment Industries in Sunol
The major employment industries in Sunol include Manufacturing (80 | 17.4%), Construction (62 | 13.5%), Professional & Scientific (55 | 12.0%), Health Care & Social Assistance (49 | 10.7%), and Retail Trade (44 | 9.6%).
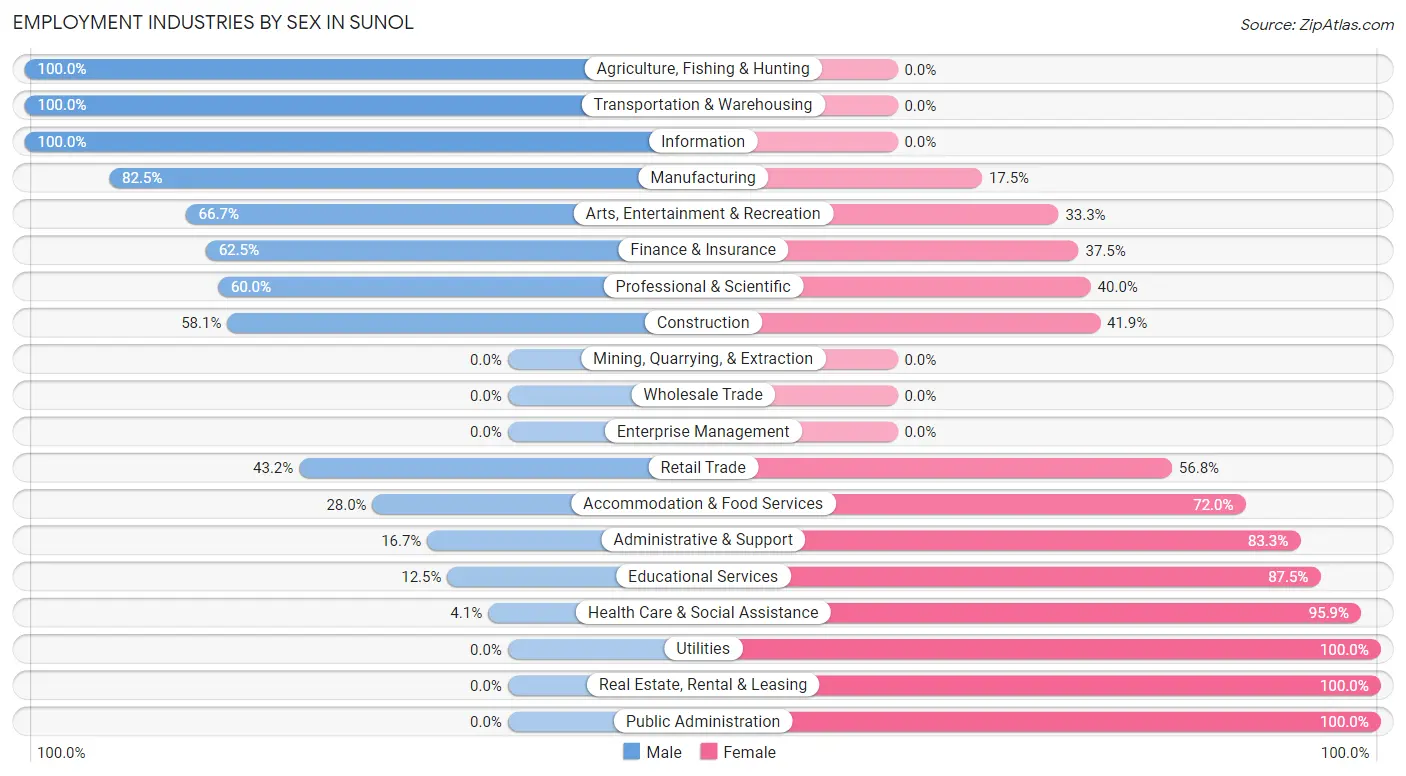
Employment Industries by Sex in Sunol
The Sunol industries that see more men than women are Agriculture, Fishing & Hunting (100.0%), Transportation & Warehousing (100.0%), and Information (100.0%), whereas the industries that tend to have a higher number of women are Utilities (100.0%), Real Estate, Rental & Leasing (100.0%), and Public Administration (100.0%).
| Industry | Male | Female |
| Agriculture, Fishing & Hunting | 17 (100.0%) | 0 (0.0%) |
| Mining, Quarrying, & Extraction | 0 (0.0%) | 0 (0.0%) |
| Construction | 36 (58.1%) | 26 (41.9%) |
| Manufacturing | 66 (82.5%) | 14 (17.5%) |
| Wholesale Trade | 0 (0.0%) | 0 (0.0%) |
| Retail Trade | 19 (43.2%) | 25 (56.8%) |
| Transportation & Warehousing | 4 (100.0%) | 0 (0.0%) |
| Utilities | 0 (0.0%) | 1 (100.0%) |
| Information | 20 (100.0%) | 0 (0.0%) |
| Finance & Insurance | 5 (62.5%) | 3 (37.5%) |
| Real Estate, Rental & Leasing | 0 (0.0%) | 4 (100.0%) |
| Professional & Scientific | 33 (60.0%) | 22 (40.0%) |
| Enterprise Management | 0 (0.0%) | 0 (0.0%) |
| Administrative & Support | 2 (16.7%) | 10 (83.3%) |
| Educational Services | 5 (12.5%) | 35 (87.5%) |
| Health Care & Social Assistance | 2 (4.1%) | 47 (95.9%) |
| Arts, Entertainment & Recreation | 6 (66.7%) | 3 (33.3%) |
| Accommodation & Food Services | 7 (28.0%) | 18 (72.0%) |
| Public Administration | 0 (0.0%) | 20 (100.0%) |
| Total | 231 (50.3%) | 228 (49.7%) |
Education in Sunol
School Enrollment in Sunol
The most common levels of schooling among the 215 students in Sunol are elementary school (61 | 28.4%), college / undergraduate (55 | 25.6%), and high school (41 | 19.1%).
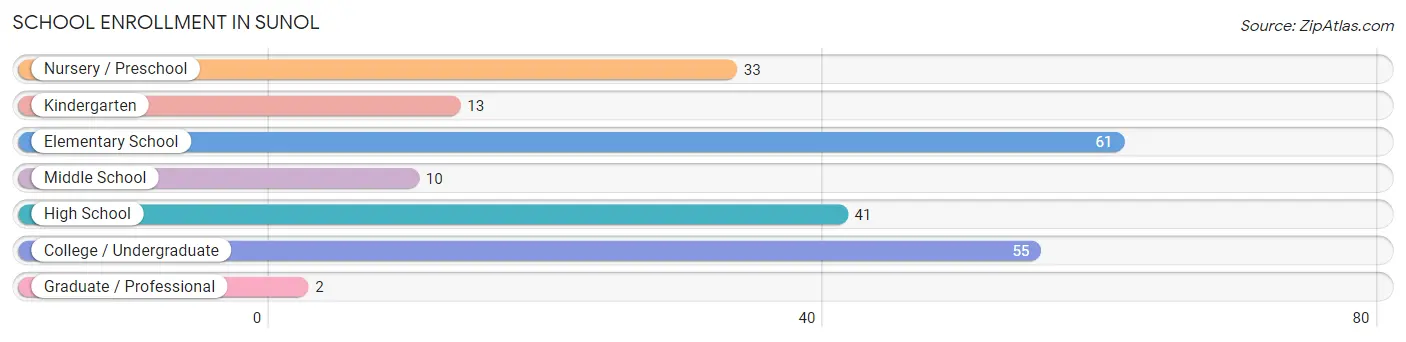
| School Level | # Students | % Students |
| Nursery / Preschool | 33 | 15.3% |
| Kindergarten | 13 | 6.0% |
| Elementary School | 61 | 28.4% |
| Middle School | 10 | 4.6% |
| High School | 41 | 19.1% |
| College / Undergraduate | 55 | 25.6% |
| Graduate / Professional | 2 | 0.9% |
| Total | 215 | 100.0% |
School Enrollment by Age by Funding Source in Sunol
Out of a total of 215 students who are enrolled in schools in Sunol, 21 (9.8%) attend a private institution, while the remaining 194 (90.2%) are enrolled in public schools. The age group of 35 years and over has the highest likelihood of being enrolled in private schools, with 13 (41.9% in the age bracket) enrolled. Conversely, the age group of 10 to 14 year olds has the lowest likelihood of being enrolled in a private school, with 25 (100.0% in the age bracket) attending a public institution.
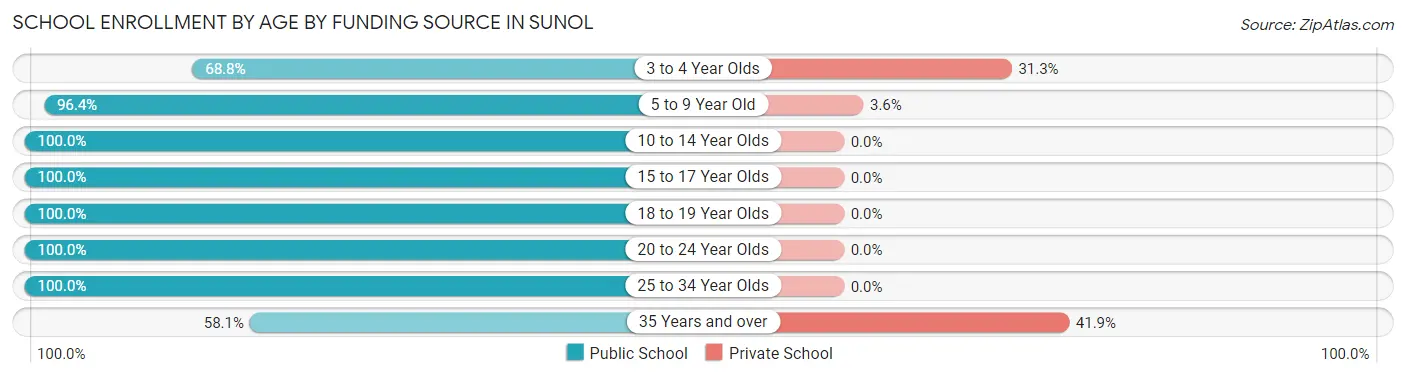
| Age Bracket | Public School | Private School |
| 3 to 4 Year Olds | 11 (68.8%) | 5 (31.2%) |
| 5 to 9 Year Old | 80 (96.4%) | 3 (3.6%) |
| 10 to 14 Year Olds | 25 (100.0%) | 0 (0.0%) |
| 15 to 17 Year Olds | 38 (100.0%) | 0 (0.0%) |
| 18 to 19 Year Olds | 4 (100.0%) | 0 (0.0%) |
| 20 to 24 Year Olds | 10 (100.0%) | 0 (0.0%) |
| 25 to 34 Year Olds | 8 (100.0%) | 0 (0.0%) |
| 35 Years and over | 18 (58.1%) | 13 (41.9%) |
| Total | 194 (90.2%) | 21 (9.8%) |
Educational Attainment by Field of Study in Sunol
Engineering (90 | 24.0%), business (63 | 16.8%), bio, nature & agricultural (41 | 10.9%), social sciences (36 | 9.6%), and science & technology (27 | 7.2%) are the most common fields of study among 375 individuals in Sunol who have obtained a bachelor's degree or higher.
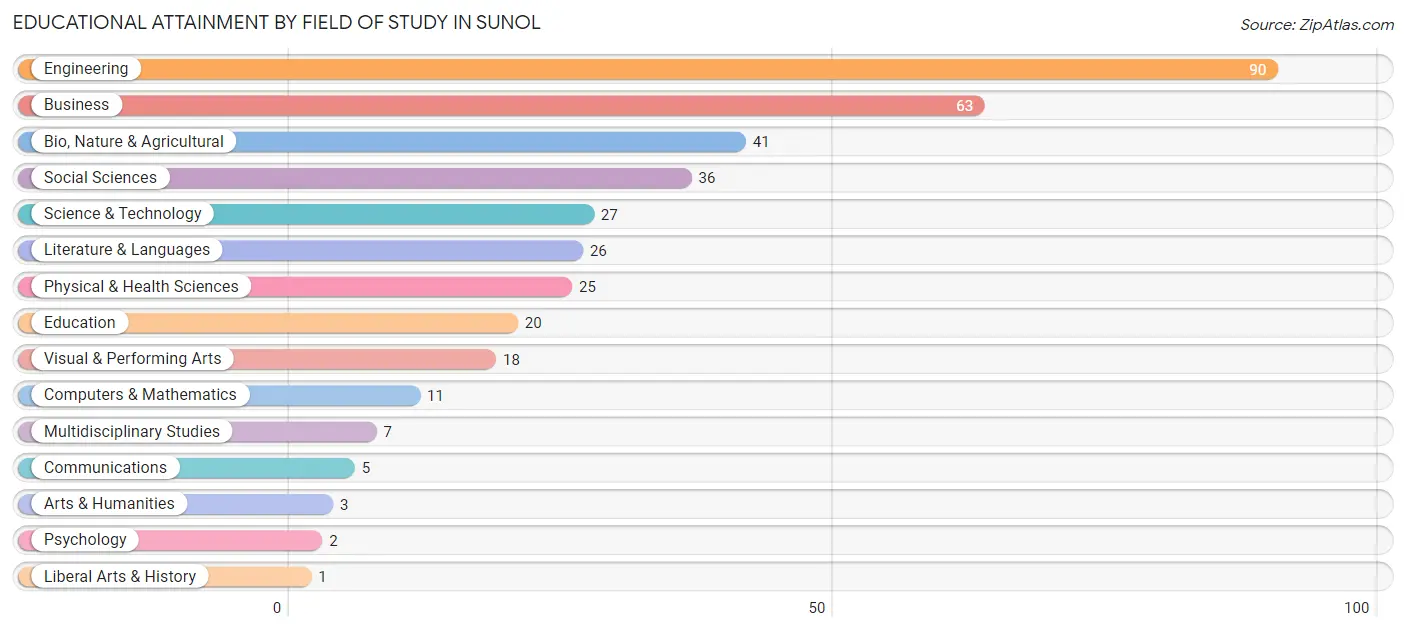
| Field of Study | # Graduates | % Graduates |
| Computers & Mathematics | 11 | 2.9% |
| Bio, Nature & Agricultural | 41 | 10.9% |
| Physical & Health Sciences | 25 | 6.7% |
| Psychology | 2 | 0.5% |
| Social Sciences | 36 | 9.6% |
| Engineering | 90 | 24.0% |
| Multidisciplinary Studies | 7 | 1.9% |
| Science & Technology | 27 | 7.2% |
| Business | 63 | 16.8% |
| Education | 20 | 5.3% |
| Literature & Languages | 26 | 6.9% |
| Liberal Arts & History | 1 | 0.3% |
| Visual & Performing Arts | 18 | 4.8% |
| Communications | 5 | 1.3% |
| Arts & Humanities | 3 | 0.8% |
| Total | 375 | 100.0% |
Transportation & Commute in Sunol
Vehicle Availability by Sex in Sunol
The most prevalent vehicle ownership categories in Sunol are males with 2 vehicles (88, accounting for 38.4%) and females with 2 vehicles (91, making up 40.2%).
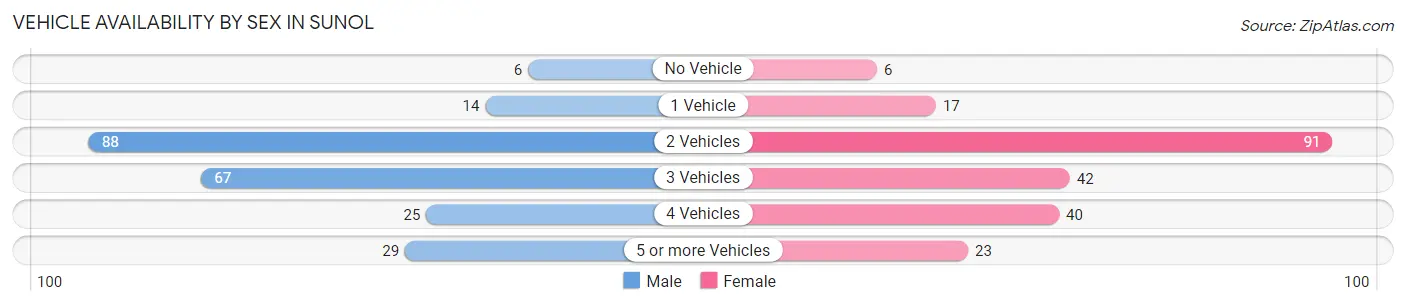
| Vehicles Available | Male | Female |
| No Vehicle | 6 (2.6%) | 6 (2.7%) |
| 1 Vehicle | 14 (6.1%) | 17 (7.8%) |
| 2 Vehicles | 88 (38.4%) | 91 (41.5%) |
| 3 Vehicles | 67 (29.3%) | 42 (19.2%) |
| 4 Vehicles | 25 (10.9%) | 40 (18.3%) |
| 5 or more Vehicles | 29 (12.7%) | 23 (10.5%) |
| Total | 229 (100.0%) | 219 (100.0%) |
Commute Time in Sunol
The most frequently occuring commute durations in Sunol are 30 to 34 minutes (90 commuters, 24.1%), 60 to 89 minutes (68 commuters, 18.2%), and 45 to 59 minutes (41 commuters, 11.0%).
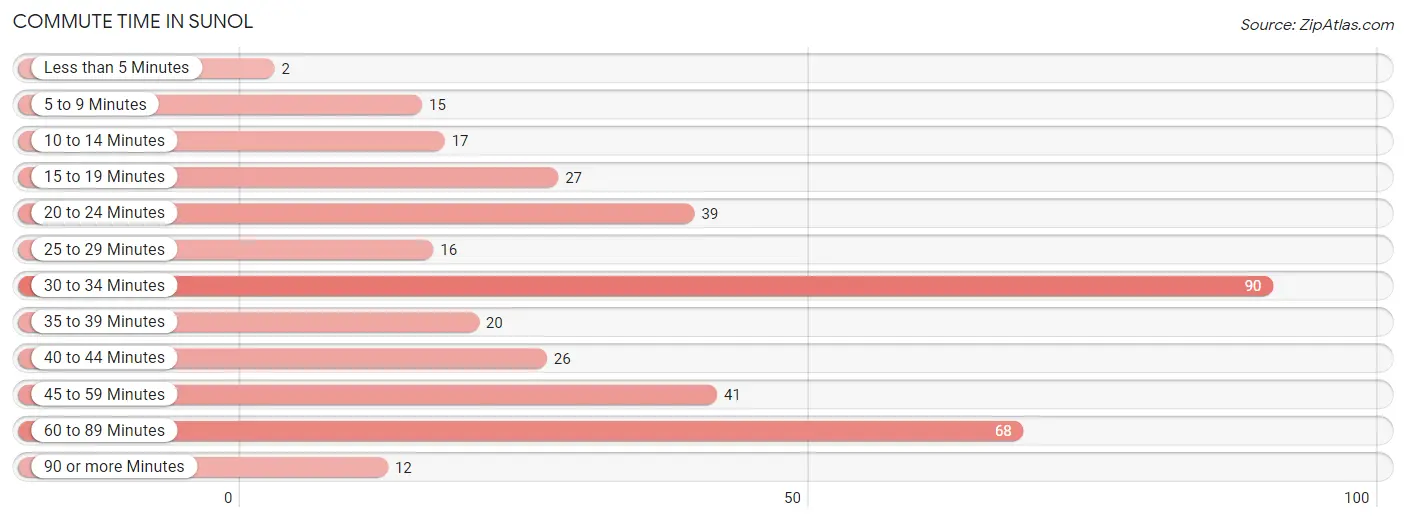
| Commute Time | # Commuters | % Commuters |
| Less than 5 Minutes | 2 | 0.5% |
| 5 to 9 Minutes | 15 | 4.0% |
| 10 to 14 Minutes | 17 | 4.6% |
| 15 to 19 Minutes | 27 | 7.2% |
| 20 to 24 Minutes | 39 | 10.5% |
| 25 to 29 Minutes | 16 | 4.3% |
| 30 to 34 Minutes | 90 | 24.1% |
| 35 to 39 Minutes | 20 | 5.4% |
| 40 to 44 Minutes | 26 | 7.0% |
| 45 to 59 Minutes | 41 | 11.0% |
| 60 to 89 Minutes | 68 | 18.2% |
| 90 or more Minutes | 12 | 3.2% |
Commute Time by Sex in Sunol
The most common commute times in Sunol are 30 to 34 minutes (53 commuters, 29.3%) for males and 30 to 34 minutes (37 commuters, 19.3%) for females.
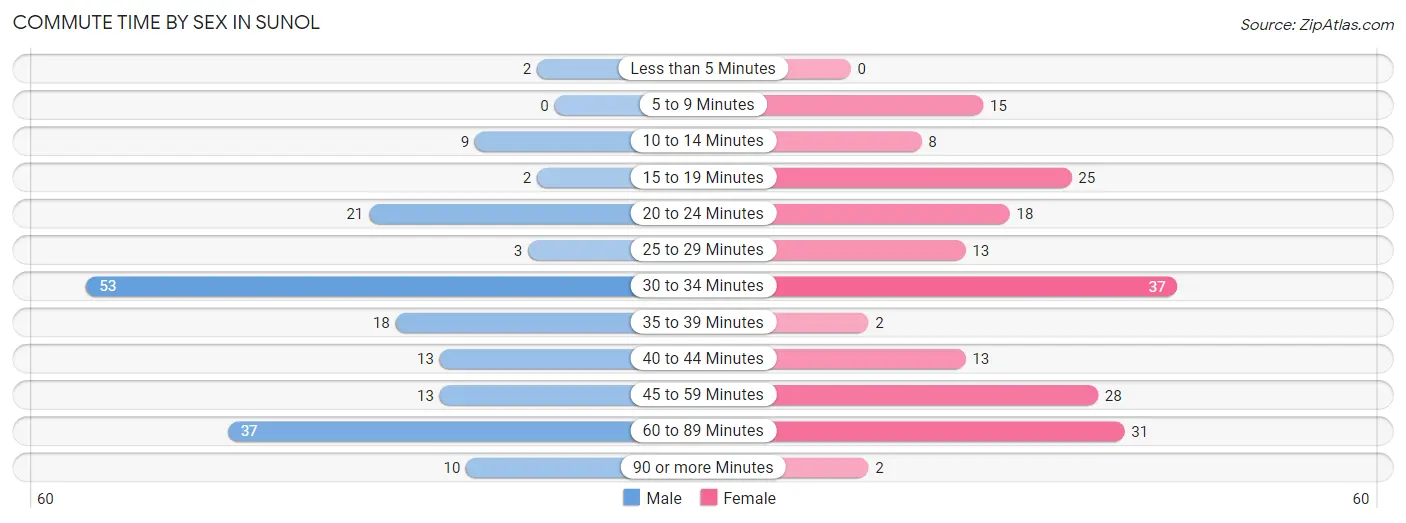
| Commute Time | Male | Female |
| Less than 5 Minutes | 2 (1.1%) | 0 (0.0%) |
| 5 to 9 Minutes | 0 (0.0%) | 15 (7.8%) |
| 10 to 14 Minutes | 9 (5.0%) | 8 (4.2%) |
| 15 to 19 Minutes | 2 (1.1%) | 25 (13.0%) |
| 20 to 24 Minutes | 21 (11.6%) | 18 (9.4%) |
| 25 to 29 Minutes | 3 (1.7%) | 13 (6.8%) |
| 30 to 34 Minutes | 53 (29.3%) | 37 (19.3%) |
| 35 to 39 Minutes | 18 (9.9%) | 2 (1.0%) |
| 40 to 44 Minutes | 13 (7.2%) | 13 (6.8%) |
| 45 to 59 Minutes | 13 (7.2%) | 28 (14.6%) |
| 60 to 89 Minutes | 37 (20.4%) | 31 (16.2%) |
| 90 or more Minutes | 10 (5.5%) | 2 (1.0%) |
Time of Departure to Work by Sex in Sunol
The most frequent times of departure to work in Sunol are 7:00 AM to 7:29 AM (50, 27.6%) for males and 8:00 AM to 8:29 AM (56, 29.2%) for females.
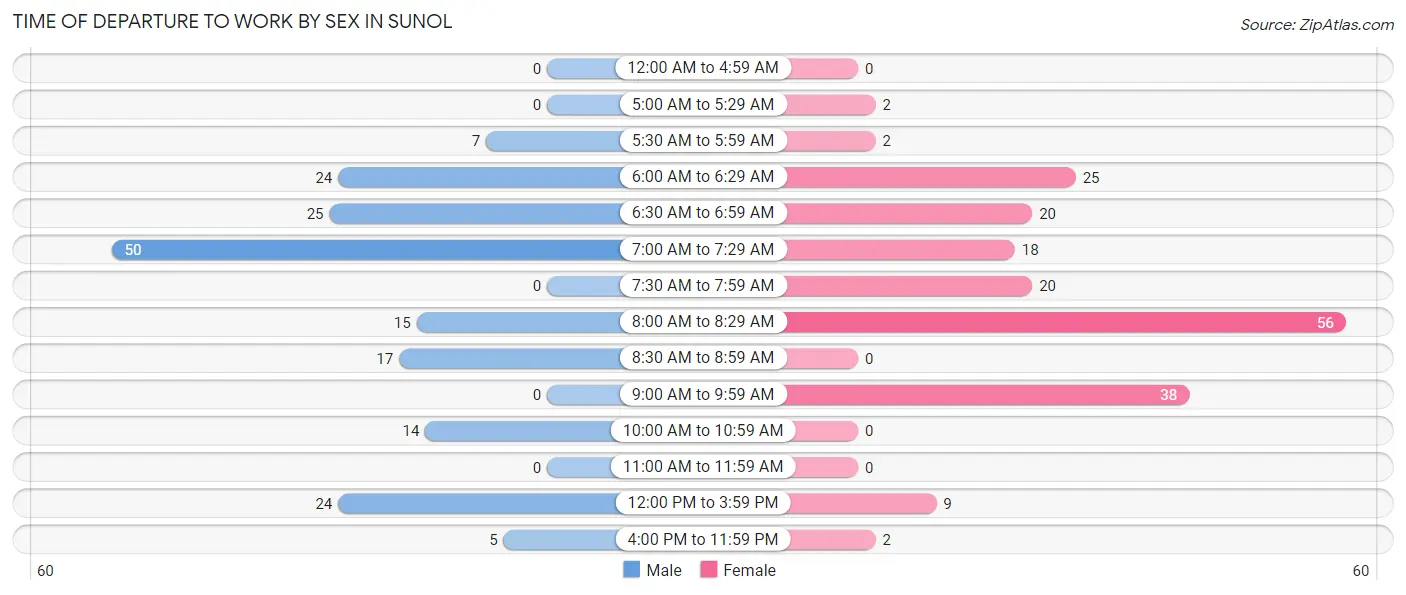
| Time of Departure | Male | Female |
| 12:00 AM to 4:59 AM | 0 (0.0%) | 0 (0.0%) |
| 5:00 AM to 5:29 AM | 0 (0.0%) | 2 (1.0%) |
| 5:30 AM to 5:59 AM | 7 (3.9%) | 2 (1.0%) |
| 6:00 AM to 6:29 AM | 24 (13.3%) | 25 (13.0%) |
| 6:30 AM to 6:59 AM | 25 (13.8%) | 20 (10.4%) |
| 7:00 AM to 7:29 AM | 50 (27.6%) | 18 (9.4%) |
| 7:30 AM to 7:59 AM | 0 (0.0%) | 20 (10.4%) |
| 8:00 AM to 8:29 AM | 15 (8.3%) | 56 (29.2%) |
| 8:30 AM to 8:59 AM | 17 (9.4%) | 0 (0.0%) |
| 9:00 AM to 9:59 AM | 0 (0.0%) | 38 (19.8%) |
| 10:00 AM to 10:59 AM | 14 (7.7%) | 0 (0.0%) |
| 11:00 AM to 11:59 AM | 0 (0.0%) | 0 (0.0%) |
| 12:00 PM to 3:59 PM | 24 (13.3%) | 9 (4.7%) |
| 4:00 PM to 11:59 PM | 5 (2.8%) | 2 (1.0%) |
| Total | 181 (100.0%) | 192 (100.0%) |
Housing Occupancy in Sunol
Occupancy by Ownership in Sunol
Of the total 315 dwellings in Sunol, owner-occupied units account for 259 (82.2%), while renter-occupied units make up 56 (17.8%).
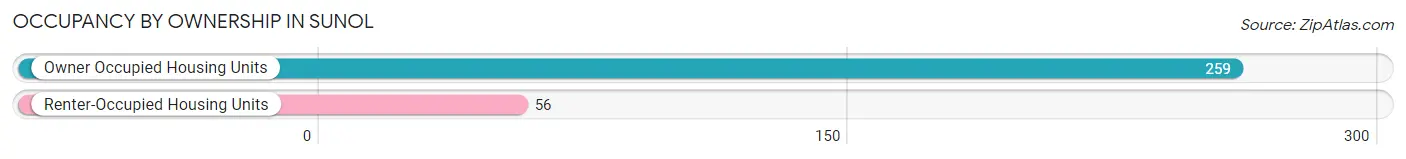
| Occupancy | # Housing Units | % Housing Units |
| Owner Occupied Housing Units | 259 | 82.2% |
| Renter-Occupied Housing Units | 56 | 17.8% |
| Total Occupied Housing Units | 315 | 100.0% |
Occupancy by Household Size in Sunol
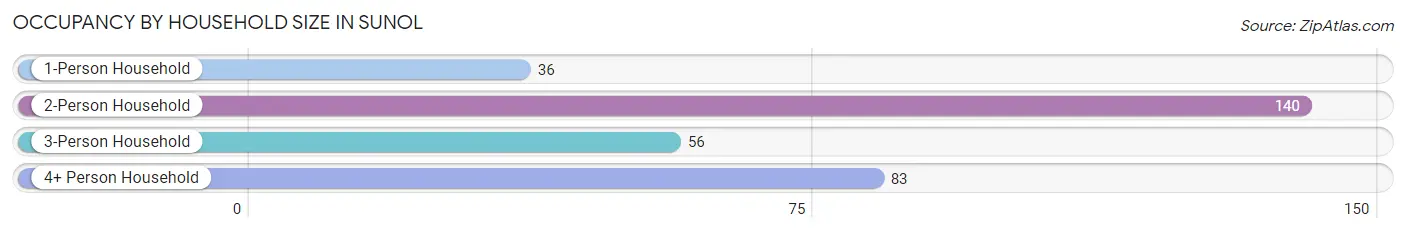
| Household Size | # Housing Units | % Housing Units |
| 1-Person Household | 36 | 11.4% |
| 2-Person Household | 140 | 44.4% |
| 3-Person Household | 56 | 17.8% |
| 4+ Person Household | 83 | 26.4% |
| Total Housing Units | 315 | 100.0% |
Occupancy by Ownership by Household Size in Sunol
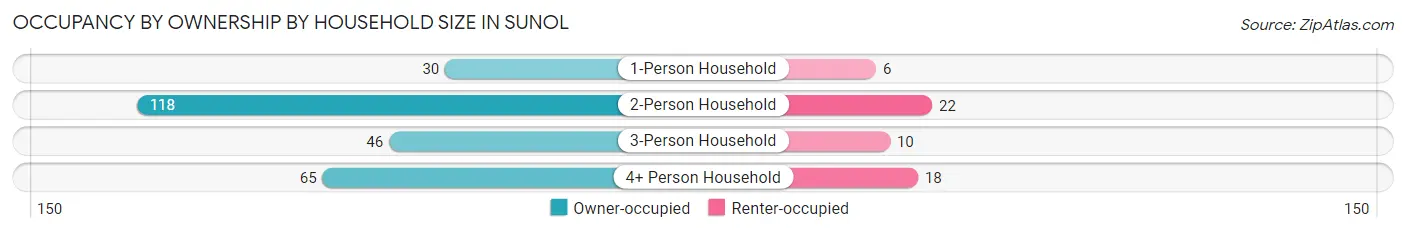
| Household Size | Owner-occupied | Renter-occupied |
| 1-Person Household | 30 (83.3%) | 6 (16.7%) |
| 2-Person Household | 118 (84.3%) | 22 (15.7%) |
| 3-Person Household | 46 (82.1%) | 10 (17.9%) |
| 4+ Person Household | 65 (78.3%) | 18 (21.7%) |
| Total Housing Units | 259 (82.2%) | 56 (17.8%) |
Occupancy by Educational Attainment in Sunol
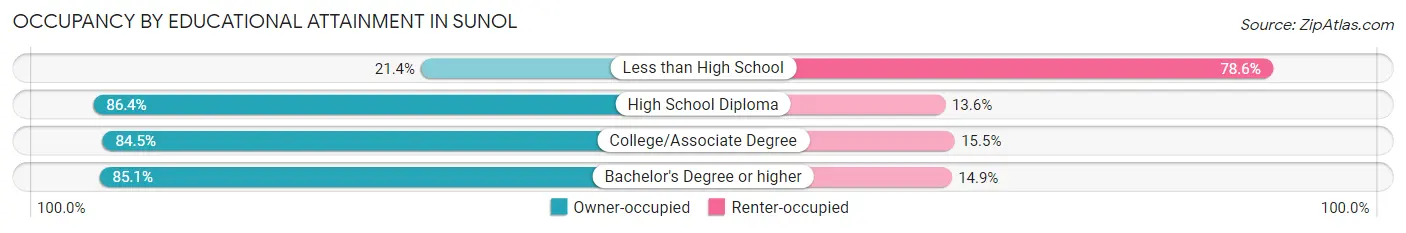
| Household Size | Owner-occupied | Renter-occupied |
| Less than High School | 3 (21.4%) | 11 (78.6%) |
| High School Diploma | 19 (86.4%) | 3 (13.6%) |
| College/Associate Degree | 71 (84.5%) | 13 (15.5%) |
| Bachelor's Degree or higher | 166 (85.1%) | 29 (14.9%) |
Occupancy by Age of Householder in Sunol
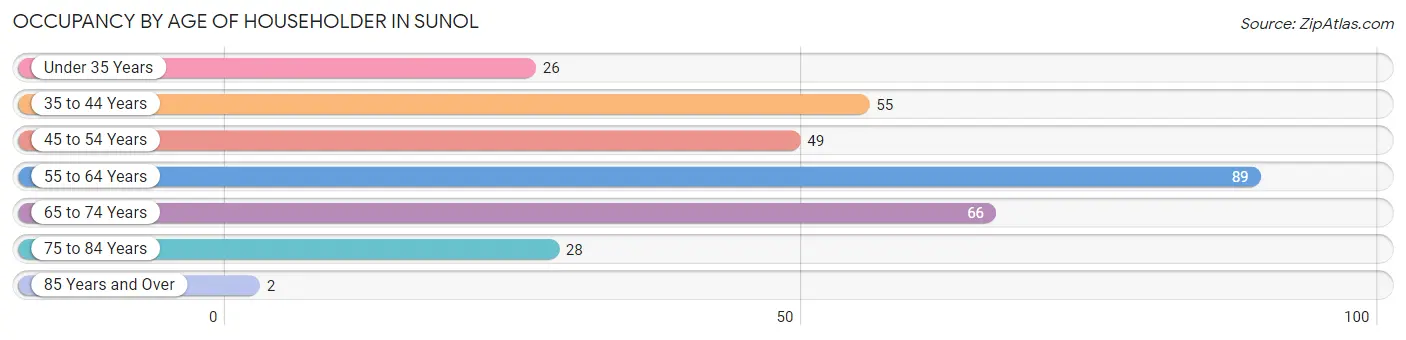
| Age Bracket | # Households | % Households |
| Under 35 Years | 26 | 8.3% |
| 35 to 44 Years | 55 | 17.5% |
| 45 to 54 Years | 49 | 15.6% |
| 55 to 64 Years | 89 | 28.2% |
| 65 to 74 Years | 66 | 20.9% |
| 75 to 84 Years | 28 | 8.9% |
| 85 Years and Over | 2 | 0.6% |
| Total | 315 | 100.0% |
Housing Finances in Sunol
Median Income by Occupancy in Sunol
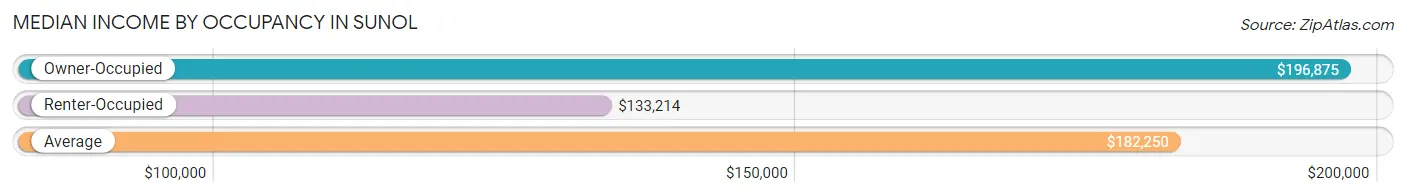
| Occupancy Type | # Households | Median Income |
| Owner-Occupied | 259 (82.2%) | $196,875 |
| Renter-Occupied | 56 (17.8%) | $133,214 |
| Average | 315 (100.0%) | $182,250 |
Occupancy by Householder Income Bracket in Sunol
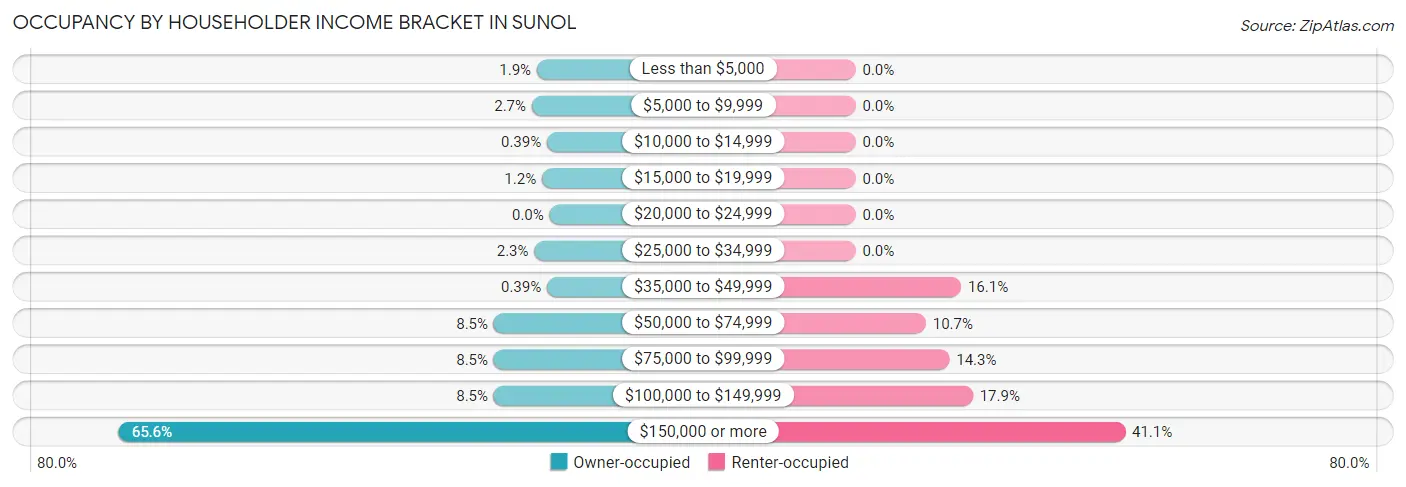
| Income Bracket | Owner-occupied | Renter-occupied |
| Less than $5,000 | 5 (1.9%) | 0 (0.0%) |
| $5,000 to $9,999 | 7 (2.7%) | 0 (0.0%) |
| $10,000 to $14,999 | 1 (0.4%) | 0 (0.0%) |
| $15,000 to $19,999 | 3 (1.2%) | 0 (0.0%) |
| $20,000 to $24,999 | 0 (0.0%) | 0 (0.0%) |
| $25,000 to $34,999 | 6 (2.3%) | 0 (0.0%) |
| $35,000 to $49,999 | 1 (0.4%) | 9 (16.1%) |
| $50,000 to $74,999 | 22 (8.5%) | 6 (10.7%) |
| $75,000 to $99,999 | 22 (8.5%) | 8 (14.3%) |
| $100,000 to $149,999 | 22 (8.5%) | 10 (17.9%) |
| $150,000 or more | 170 (65.6%) | 23 (41.1%) |
| Total | 259 (100.0%) | 56 (100.0%) |
Monthly Housing Cost Tiers in Sunol
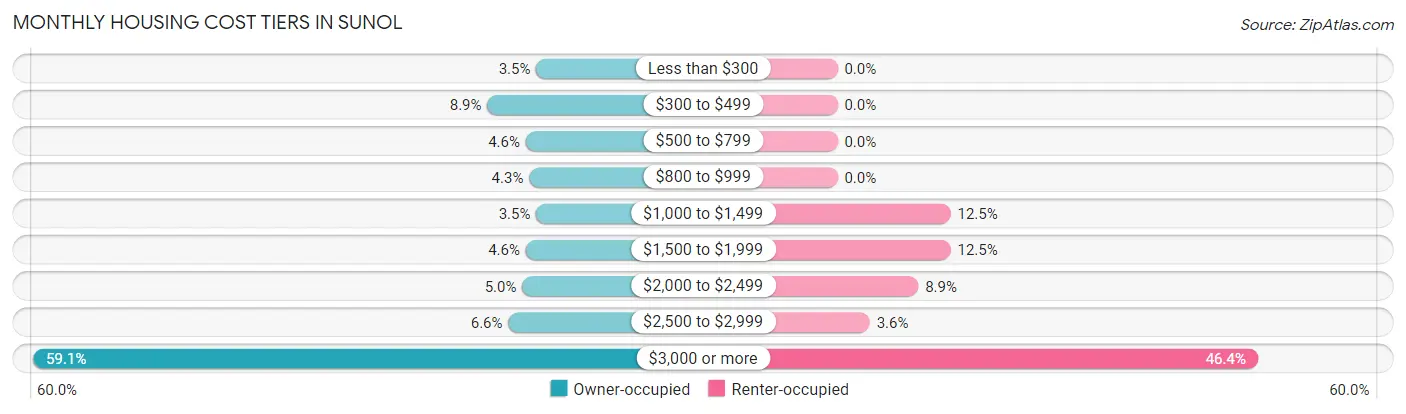
| Monthly Cost | Owner-occupied | Renter-occupied |
| Less than $300 | 9 (3.5%) | 0 (0.0%) |
| $300 to $499 | 23 (8.9%) | 0 (0.0%) |
| $500 to $799 | 12 (4.6%) | 0 (0.0%) |
| $800 to $999 | 11 (4.3%) | 0 (0.0%) |
| $1,000 to $1,499 | 9 (3.5%) | 7 (12.5%) |
| $1,500 to $1,999 | 12 (4.6%) | 7 (12.5%) |
| $2,000 to $2,499 | 13 (5.0%) | 5 (8.9%) |
| $2,500 to $2,999 | 17 (6.6%) | 2 (3.6%) |
| $3,000 or more | 153 (59.1%) | 26 (46.4%) |
| Total | 259 (100.0%) | 56 (100.0%) |
Physical Housing Characteristics in Sunol
Housing Structures in Sunol
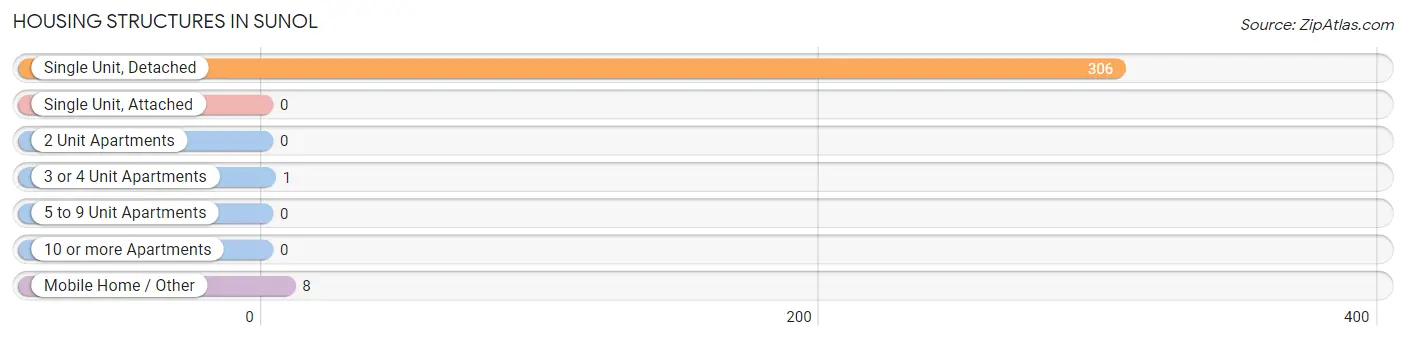
| Structure Type | # Housing Units | % Housing Units |
| Single Unit, Detached | 306 | 97.1% |
| Single Unit, Attached | 0 | 0.0% |
| 2 Unit Apartments | 0 | 0.0% |
| 3 or 4 Unit Apartments | 1 | 0.3% |
| 5 to 9 Unit Apartments | 0 | 0.0% |
| 10 or more Apartments | 0 | 0.0% |
| Mobile Home / Other | 8 | 2.5% |
| Total | 315 | 100.0% |
Housing Structures by Occupancy in Sunol
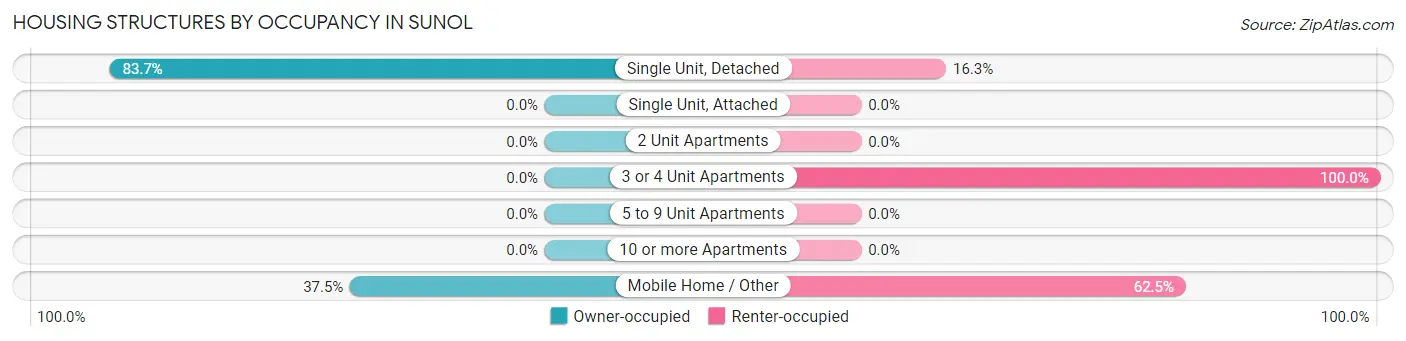
| Structure Type | Owner-occupied | Renter-occupied |
| Single Unit, Detached | 256 (83.7%) | 50 (16.3%) |
| Single Unit, Attached | 0 (0.0%) | 0 (0.0%) |
| 2 Unit Apartments | 0 (0.0%) | 0 (0.0%) |
| 3 or 4 Unit Apartments | 0 (0.0%) | 1 (100.0%) |
| 5 to 9 Unit Apartments | 0 (0.0%) | 0 (0.0%) |
| 10 or more Apartments | 0 (0.0%) | 0 (0.0%) |
| Mobile Home / Other | 3 (37.5%) | 5 (62.5%) |
| Total | 259 (82.2%) | 56 (17.8%) |
Housing Structures by Number of Rooms in Sunol
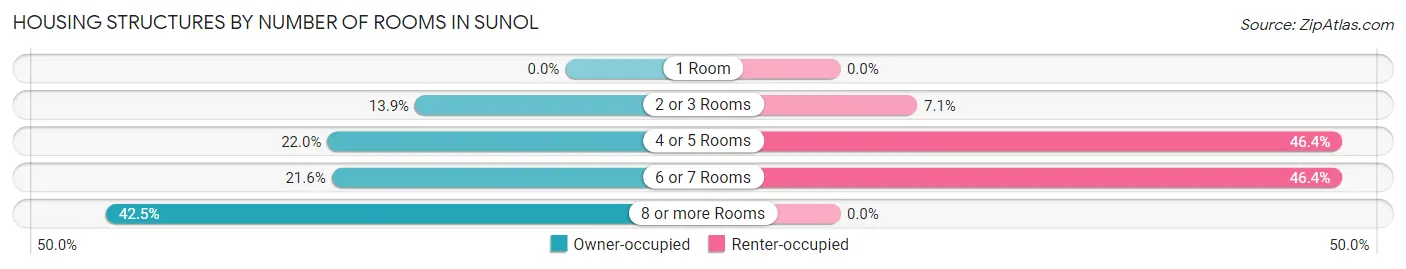
| Number of Rooms | Owner-occupied | Renter-occupied |
| 1 Room | 0 (0.0%) | 0 (0.0%) |
| 2 or 3 Rooms | 36 (13.9%) | 4 (7.1%) |
| 4 or 5 Rooms | 57 (22.0%) | 26 (46.4%) |
| 6 or 7 Rooms | 56 (21.6%) | 26 (46.4%) |
| 8 or more Rooms | 110 (42.5%) | 0 (0.0%) |
| Total | 259 (100.0%) | 56 (100.0%) |
Housing Structure by Heating Type in Sunol
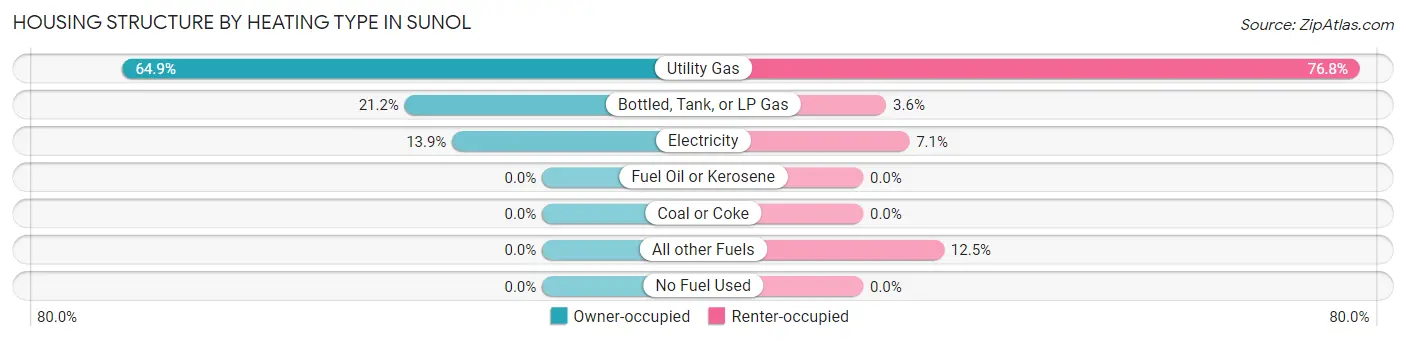
| Heating Type | Owner-occupied | Renter-occupied |
| Utility Gas | 168 (64.9%) | 43 (76.8%) |
| Bottled, Tank, or LP Gas | 55 (21.2%) | 2 (3.6%) |
| Electricity | 36 (13.9%) | 4 (7.1%) |
| Fuel Oil or Kerosene | 0 (0.0%) | 0 (0.0%) |
| Coal or Coke | 0 (0.0%) | 0 (0.0%) |
| All other Fuels | 0 (0.0%) | 7 (12.5%) |
| No Fuel Used | 0 (0.0%) | 0 (0.0%) |
| Total | 259 (100.0%) | 56 (100.0%) |
Household Vehicle Usage in Sunol
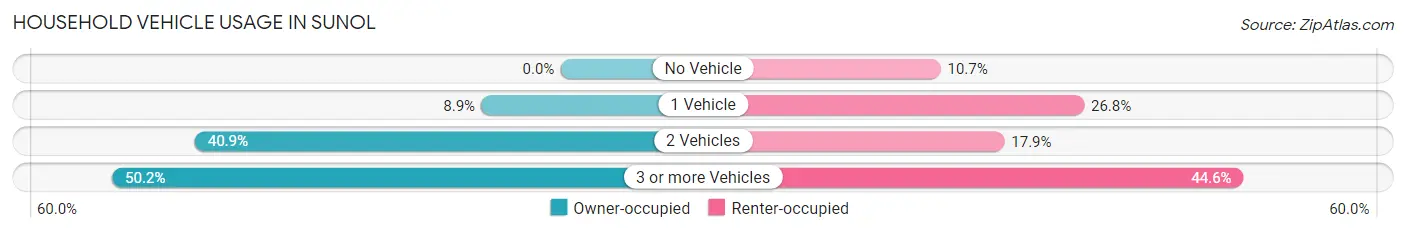
| Vehicles per Household | Owner-occupied | Renter-occupied |
| No Vehicle | 0 (0.0%) | 6 (10.7%) |
| 1 Vehicle | 23 (8.9%) | 15 (26.8%) |
| 2 Vehicles | 106 (40.9%) | 10 (17.9%) |
| 3 or more Vehicles | 130 (50.2%) | 25 (44.6%) |
| Total | 259 (100.0%) | 56 (100.0%) |
Real Estate & Mortgages in Sunol
Real Estate and Mortgage Overview in Sunol
| Characteristic | Without Mortgage | With Mortgage |
| Housing Units | 99 | 160 |
| Median Property Value | $1,102,300 | $1,250,000 |
| Median Household Income | $118,125 | $128 |
| Monthly Housing Costs | $931 | $135 |
| Real Estate Taxes | - | - |
Property Value by Mortgage Status in Sunol
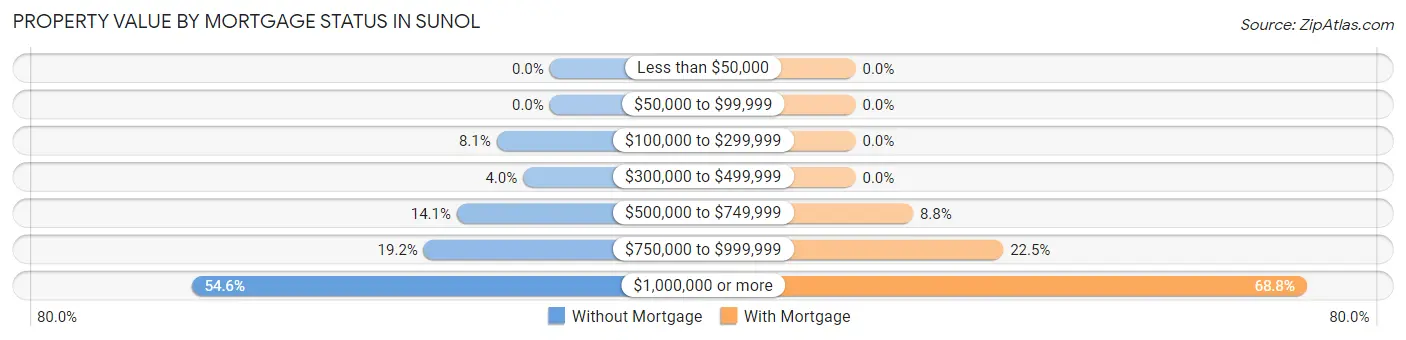
| Property Value | Without Mortgage | With Mortgage |
| Less than $50,000 | 0 (0.0%) | 0 (0.0%) |
| $50,000 to $99,999 | 0 (0.0%) | 0 (0.0%) |
| $100,000 to $299,999 | 8 (8.1%) | 0 (0.0%) |
| $300,000 to $499,999 | 4 (4.0%) | 0 (0.0%) |
| $500,000 to $749,999 | 14 (14.1%) | 14 (8.7%) |
| $750,000 to $999,999 | 19 (19.2%) | 36 (22.5%) |
| $1,000,000 or more | 54 (54.5%) | 110 (68.8%) |
| Total | 99 (100.0%) | 160 (100.0%) |
Household Income by Mortgage Status in Sunol
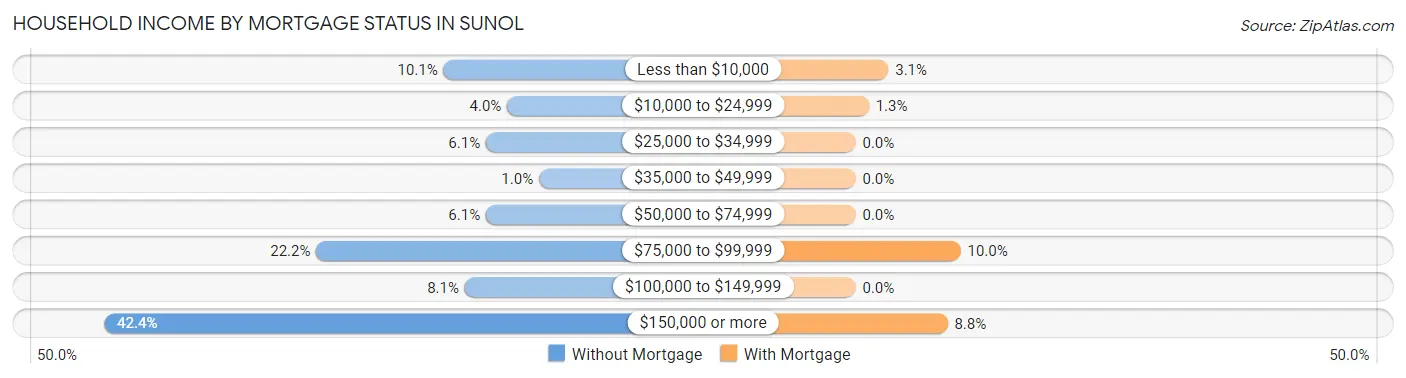
| Household Income | Without Mortgage | With Mortgage |
| Less than $10,000 | 10 (10.1%) | 5 (3.1%) |
| $10,000 to $24,999 | 4 (4.0%) | 2 (1.3%) |
| $25,000 to $34,999 | 6 (6.1%) | 0 (0.0%) |
| $35,000 to $49,999 | 1 (1.0%) | 0 (0.0%) |
| $50,000 to $74,999 | 6 (6.1%) | 0 (0.0%) |
| $75,000 to $99,999 | 22 (22.2%) | 16 (10.0%) |
| $100,000 to $149,999 | 8 (8.1%) | 0 (0.0%) |
| $150,000 or more | 42 (42.4%) | 14 (8.7%) |
| Total | 99 (100.0%) | 160 (100.0%) |
Property Value to Household Income Ratio in Sunol
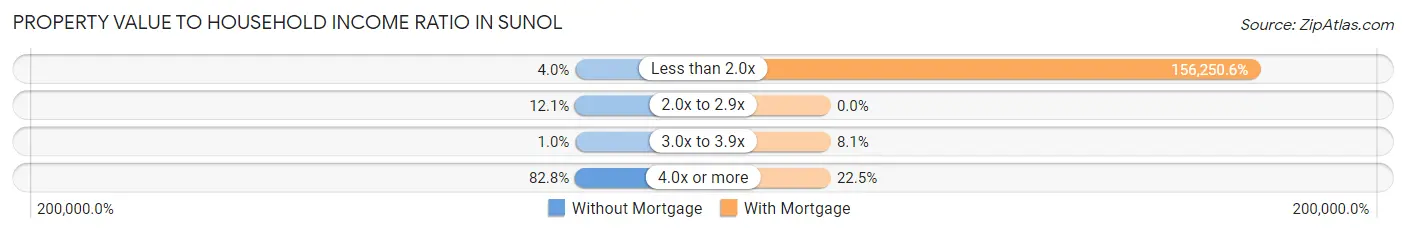
| Value-to-Income Ratio | Without Mortgage | With Mortgage |
| Less than 2.0x | 4 (4.0%) | 250,001 (156,250.6%) |
| 2.0x to 2.9x | 12 (12.1%) | 0 (0.0%) |
| 3.0x to 3.9x | 1 (1.0%) | 13 (8.1%) |
| 4.0x or more | 82 (82.8%) | 36 (22.5%) |
| Total | 99 (100.0%) | 160 (100.0%) |
Real Estate Taxes by Mortgage Status in Sunol
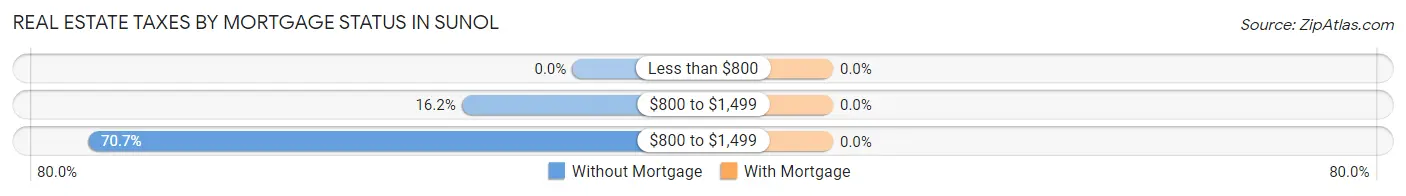
| Property Taxes | Without Mortgage | With Mortgage |
| Less than $800 | 0 (0.0%) | 0 (0.0%) |
| $800 to $1,499 | 16 (16.2%) | 0 (0.0%) |
| $800 to $1,499 | 70 (70.7%) | 0 (0.0%) |
| Total | 99 (100.0%) | 160 (100.0%) |
Health & Disability in Sunol
Health Insurance Coverage by Age in Sunol
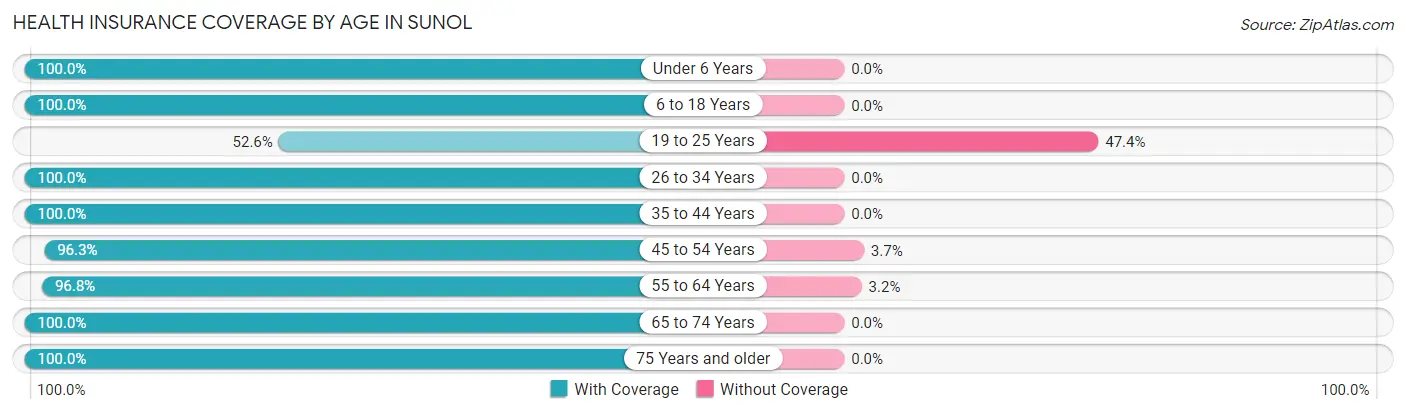
| Age Bracket | With Coverage | Without Coverage |
| Under 6 Years | 76 (100.0%) | 0 (0.0%) |
| 6 to 18 Years | 119 (100.0%) | 0 (0.0%) |
| 19 to 25 Years | 10 (52.6%) | 9 (47.4%) |
| 26 to 34 Years | 84 (100.0%) | 0 (0.0%) |
| 35 to 44 Years | 143 (100.0%) | 0 (0.0%) |
| 45 to 54 Years | 79 (96.3%) | 3 (3.7%) |
| 55 to 64 Years | 179 (96.8%) | 6 (3.2%) |
| 65 to 74 Years | 134 (100.0%) | 0 (0.0%) |
| 75 Years and older | 77 (100.0%) | 0 (0.0%) |
| Total | 901 (98.0%) | 18 (2.0%) |
Health Insurance Coverage by Citizenship Status in Sunol
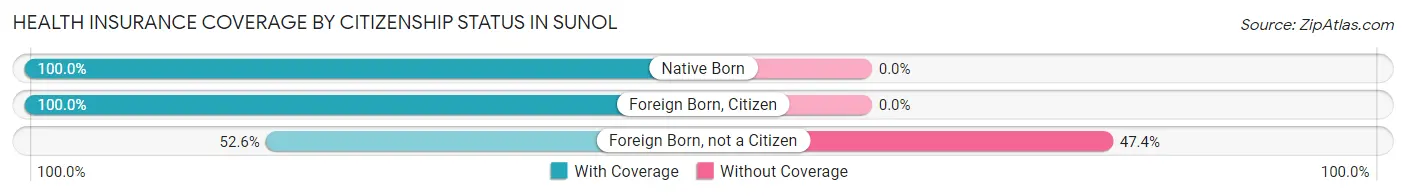
| Citizenship Status | With Coverage | Without Coverage |
| Native Born | 76 (100.0%) | 0 (0.0%) |
| Foreign Born, Citizen | 119 (100.0%) | 0 (0.0%) |
| Foreign Born, not a Citizen | 10 (52.6%) | 9 (47.4%) |
Health Insurance Coverage by Household Income in Sunol
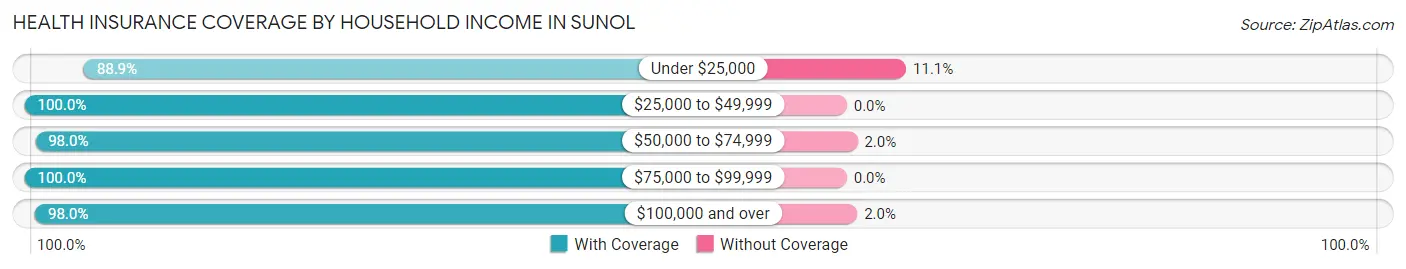
| Household Income | With Coverage | Without Coverage |
| Under $25,000 | 24 (88.9%) | 3 (11.1%) |
| $25,000 to $49,999 | 43 (100.0%) | 0 (0.0%) |
| $50,000 to $74,999 | 49 (98.0%) | 1 (2.0%) |
| $75,000 to $99,999 | 82 (100.0%) | 0 (0.0%) |
| $100,000 and over | 701 (98.0%) | 14 (2.0%) |
Public vs Private Health Insurance Coverage by Age in Sunol
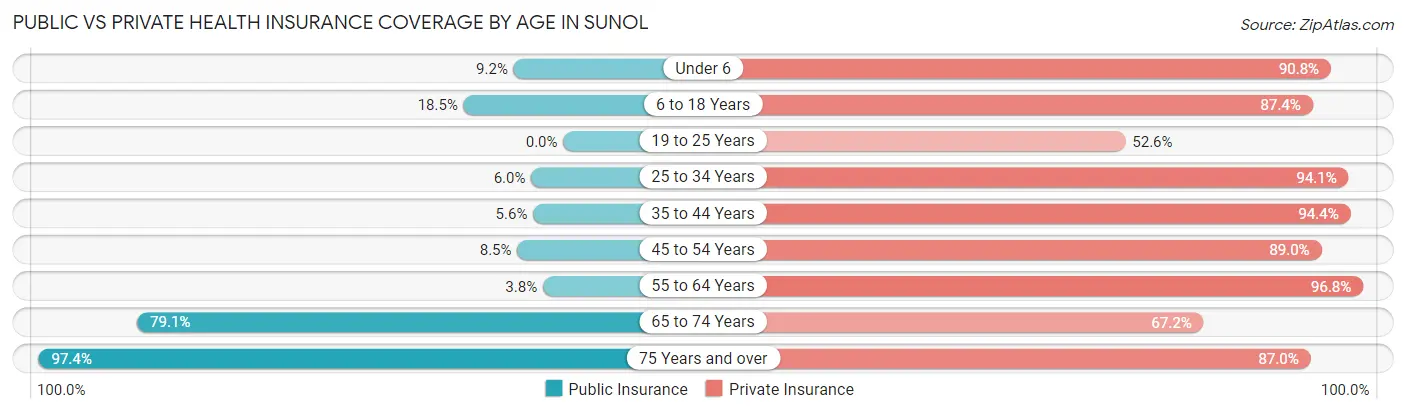
| Age Bracket | Public Insurance | Private Insurance |
| Under 6 | 7 (9.2%) | 69 (90.8%) |
| 6 to 18 Years | 22 (18.5%) | 104 (87.4%) |
| 19 to 25 Years | 0 (0.0%) | 10 (52.6%) |
| 25 to 34 Years | 5 (5.9%) | 79 (94.1%) |
| 35 to 44 Years | 8 (5.6%) | 135 (94.4%) |
| 45 to 54 Years | 7 (8.5%) | 73 (89.0%) |
| 55 to 64 Years | 7 (3.8%) | 179 (96.8%) |
| 65 to 74 Years | 106 (79.1%) | 90 (67.2%) |
| 75 Years and over | 75 (97.4%) | 67 (87.0%) |
| Total | 237 (25.8%) | 806 (87.7%) |
Disability Status by Sex by Age in Sunol
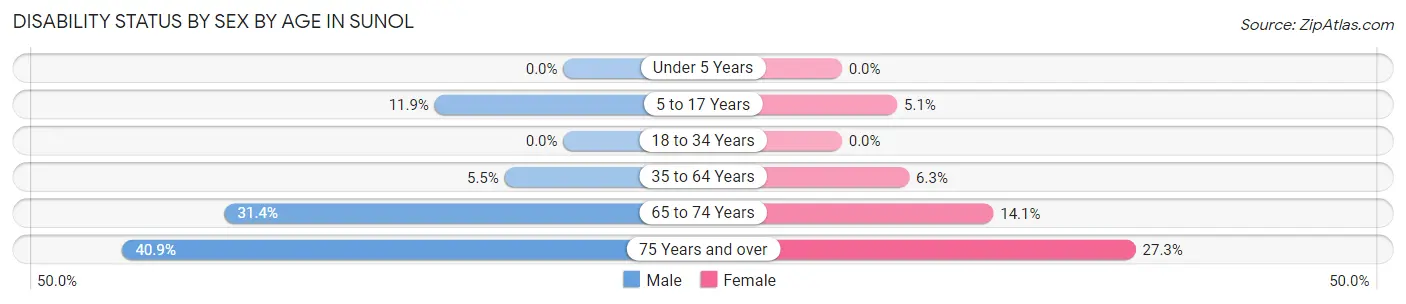
| Age Bracket | Male | Female |
| Under 5 Years | 0 (0.0%) | 0 (0.0%) |
| 5 to 17 Years | 8 (11.9%) | 4 (5.1%) |
| 18 to 34 Years | 0 (0.0%) | 0 (0.0%) |
| 35 to 64 Years | 11 (5.4%) | 13 (6.2%) |
| 65 to 74 Years | 22 (31.4%) | 9 (14.1%) |
| 75 Years and over | 18 (40.9%) | 9 (27.3%) |
Disability Class by Sex by Age in Sunol
Disability Class: Hearing Difficulty
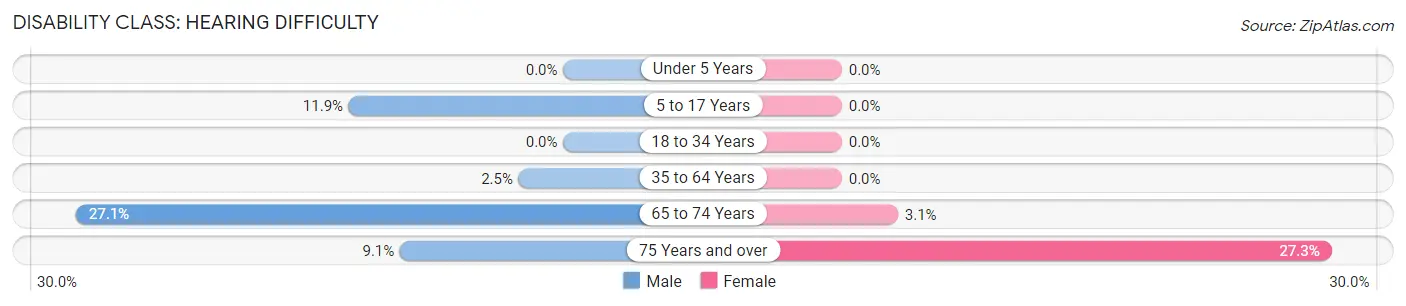
| Age Bracket | Male | Female |
| Under 5 Years | 0 (0.0%) | 0 (0.0%) |
| 5 to 17 Years | 8 (11.9%) | 0 (0.0%) |
| 18 to 34 Years | 0 (0.0%) | 0 (0.0%) |
| 35 to 64 Years | 5 (2.5%) | 0 (0.0%) |
| 65 to 74 Years | 19 (27.1%) | 2 (3.1%) |
| 75 Years and over | 4 (9.1%) | 9 (27.3%) |
Disability Class: Vision Difficulty
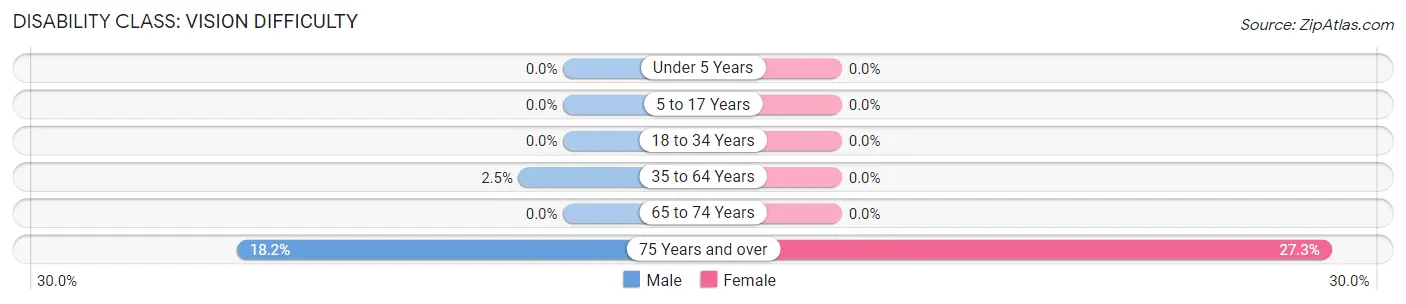
| Age Bracket | Male | Female |
| Under 5 Years | 0 (0.0%) | 0 (0.0%) |
| 5 to 17 Years | 0 (0.0%) | 0 (0.0%) |
| 18 to 34 Years | 0 (0.0%) | 0 (0.0%) |
| 35 to 64 Years | 5 (2.5%) | 0 (0.0%) |
| 65 to 74 Years | 0 (0.0%) | 0 (0.0%) |
| 75 Years and over | 8 (18.2%) | 9 (27.3%) |
Disability Class: Cognitive Difficulty
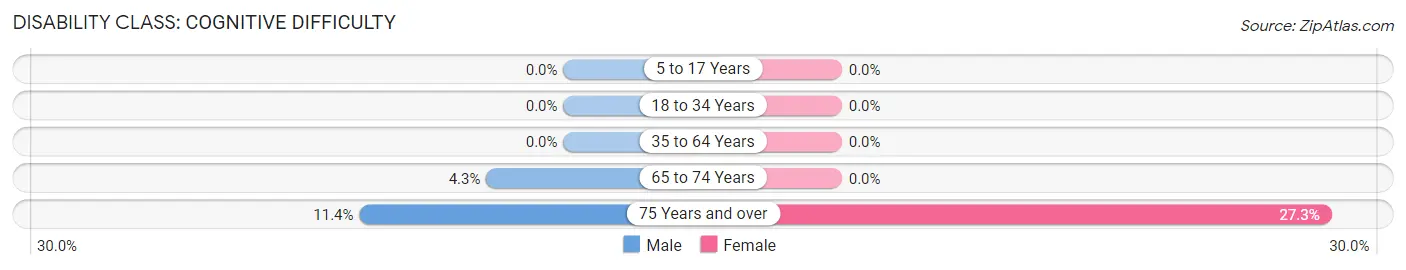
| Age Bracket | Male | Female |
| 5 to 17 Years | 0 (0.0%) | 0 (0.0%) |
| 18 to 34 Years | 0 (0.0%) | 0 (0.0%) |
| 35 to 64 Years | 0 (0.0%) | 0 (0.0%) |
| 65 to 74 Years | 3 (4.3%) | 0 (0.0%) |
| 75 Years and over | 5 (11.4%) | 9 (27.3%) |
Disability Class: Ambulatory Difficulty
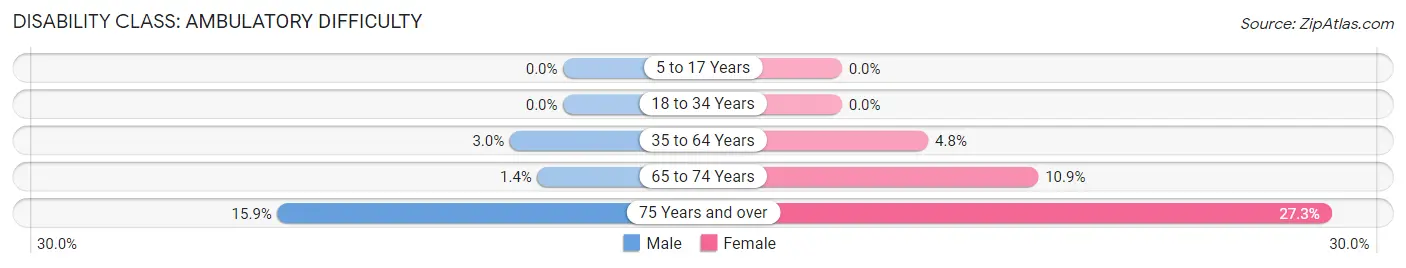
| Age Bracket | Male | Female |
| 5 to 17 Years | 0 (0.0%) | 0 (0.0%) |
| 18 to 34 Years | 0 (0.0%) | 0 (0.0%) |
| 35 to 64 Years | 6 (3.0%) | 10 (4.8%) |
| 65 to 74 Years | 1 (1.4%) | 7 (10.9%) |
| 75 Years and over | 7 (15.9%) | 9 (27.3%) |
Disability Class: Self-Care Difficulty
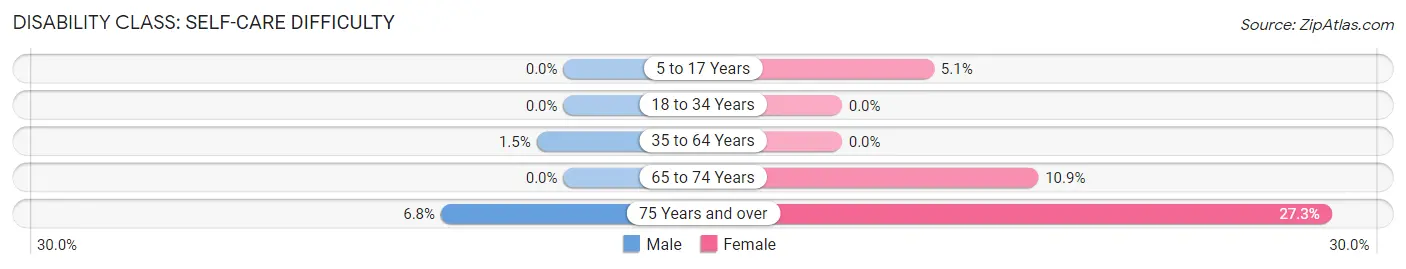
| Age Bracket | Male | Female |
| 5 to 17 Years | 0 (0.0%) | 4 (5.1%) |
| 18 to 34 Years | 0 (0.0%) | 0 (0.0%) |
| 35 to 64 Years | 3 (1.5%) | 0 (0.0%) |
| 65 to 74 Years | 0 (0.0%) | 7 (10.9%) |
| 75 Years and over | 3 (6.8%) | 9 (27.3%) |
Technology Access in Sunol
Computing Device Access in Sunol
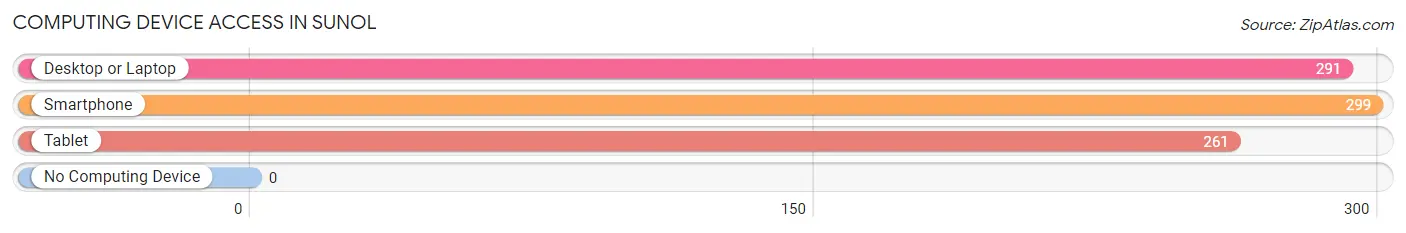
| Device Type | # Households | % Households |
| Desktop or Laptop | 291 | 92.4% |
| Smartphone | 299 | 94.9% |
| Tablet | 261 | 82.9% |
| No Computing Device | 0 | 0.0% |
| Total | 315 | 100.0% |
Internet Access in Sunol
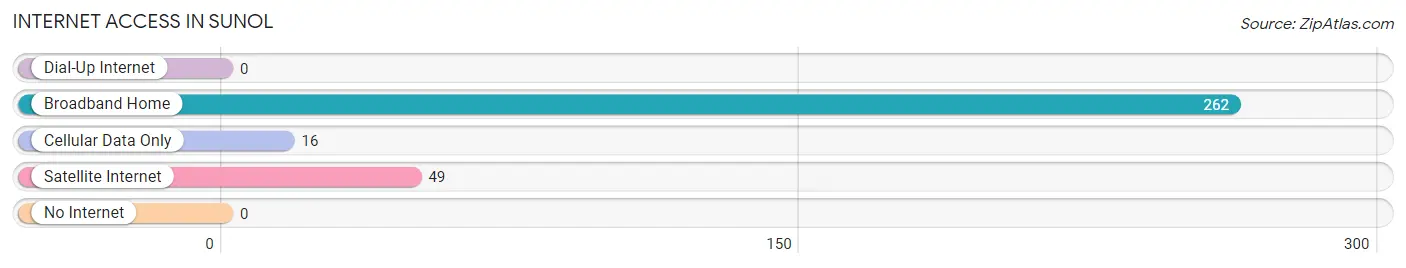
| Internet Type | # Households | % Households |
| Dial-Up Internet | 0 | 0.0% |
| Broadband Home | 262 | 83.2% |
| Cellular Data Only | 16 | 5.1% |
| Satellite Internet | 49 | 15.6% |
| No Internet | 0 | 0.0% |
| Total | 315 | 100.0% |
Sunol Summary
Sunol is a small unincorporated community located in Alameda County, California. It is situated in the foothills of the Diablo Range, approximately 25 miles east of San Jose and 30 miles south of Oakland. The population of Sunol was 813 as of the 2010 census.
History
Sunol was originally inhabited by the Ohlone people, who lived in the area for thousands of years before the arrival of Europeans. The first Europeans to settle in the area were Spanish missionaries, who established a mission in nearby Mission San Jose in 1797. The area was later part of the Rancho Valle de San Jose, a Mexican land grant given to Jose Maria Amador in 1834.
In 1868, the Central Pacific Railroad built a station in Sunol, which was then known as Vallecitos. The station was used to transport goods and passengers between San Francisco and San Jose. The town was renamed Sunol in 1876, after Antonio Suñol, a local landowner.
In the late 19th century, Sunol became a popular destination for wealthy San Franciscans, who built summer homes in the area. The town was incorporated in 1911, but the incorporation was dissolved in 1925 due to financial difficulties.
Geography
Sunol is located at 37°33'N 121°48'W, at an elevation of 545 feet (166 m). It is situated in the foothills of the Diablo Range, approximately 25 miles east of San Jose and 30 miles south of Oakland. The town is bordered by the cities of Pleasanton to the north, Livermore to the east, and Fremont to the south.
The climate in Sunol is Mediterranean, with hot, dry summers and mild, wet winters. The average annual precipitation is 17.5 inches (445 mm).
Economy
Sunol is primarily a residential community, with no major industries or businesses. The town is home to several small businesses, including a winery, a bed and breakfast, and a few restaurants.
The town is also home to the Sunol Regional Wilderness, a 6,859-acre (2,772 ha) park managed by the East Bay Regional Park District. The park offers a variety of recreational activities, including hiking, biking, and horseback riding.
Demographics
As of the 2010 census, Sunol had a population of 813. The racial makeup of the town was 77.2% White, 0.7% African American, 0.4% Native American, 11.2% Asian, 0.1% Pacific Islander, 7.2% from other races, and 3.2% from two or more races. Hispanic or Latino of any race were 18.2% of the population.
The median household income in Sunol was $112,917, and the median family income was $125,000. The per capita income was $50,945. About 4.2% of families and 5.3% of the population were below the poverty line.
Common Questions
What is Per Capita Income in Sunol?
Per Capita income in Sunol is $85,523.
What is the Median Family Income in Sunol?
Median Family Income in Sunol is $212,917.
What is the Median Household income in Sunol?
Median Household Income in Sunol is $182,250.
What is Income or Wage Gap in Sunol?
Income or Wage Gap in Sunol is 44.4%.
Women in Sunol earn 55.6 cents for every dollar earned by a man.
What is Inequality or Gini Index in Sunol?
Inequality or Gini Index in Sunol is 0.42.
What is the Total Population of Sunol?
Total Population of Sunol is 920.
What is the Total Male Population of Sunol?
Total Male Population of Sunol is 464.
What is the Total Female Population of Sunol?
Total Female Population of Sunol is 456.
What is the Ratio of Males per 100 Females in Sunol?
There are 101.75 Males per 100 Females in Sunol.
What is the Ratio of Females per 100 Males in Sunol?
There are 98.28 Females per 100 Males in Sunol.
What is the Median Population Age in Sunol?
Median Population Age in Sunol is 47.8 Years.
What is the Average Family Size in Sunol
Average Family Size in Sunol is 3.0 People.
What is the Average Household Size in Sunol
Average Household Size in Sunol is 2.9 People.
How Large is the Labor Force in Sunol?
There are 491 People in the Labor Forcein in Sunol.
What is the Percentage of People in the Labor Force in Sunol?
64.8% of People are in the Labor Force in Sunol.
What is the Unemployment Rate in Sunol?
Unemployment Rate in Sunol is 6.5%.