Squaw Valley, CA Map & Demographics
Squaw Valley Map
Squaw Valley Overview
$31,123
PER CAPITA INCOME
$94,583
AVG FAMILY INCOME
$82,969
AVG HOUSEHOLD INCOME
21.7%
WAGE / INCOME GAP [ % ]
78.3¢/ $1
WAGE / INCOME GAP [ $ ]
0.43
INEQUALITY / GINI INDEX
4,568
TOTAL POPULATION
2,479
MALE POPULATION
2,089
FEMALE POPULATION
118.67
MALES / 100 FEMALES
84.27
FEMALES / 100 MALES
37.4
MEDIAN AGE
4.1
AVG FAMILY SIZE
3.6
AVG HOUSEHOLD SIZE
1,343
LABOR FORCE [ PEOPLE ]
41.4%
PERCENT IN LABOR FORCE
2.8%
UNEMPLOYMENT RATE
Squaw Valley Zip Codes
Squaw Valley Area Codes
Income in Squaw Valley
Income Overview in Squaw Valley
Per Capita Income in Squaw Valley is $31,123, while median incomes of families and households are $94,583 and $82,969 respectively.
| Characteristic | Number | Measure |
| Per Capita Income | 4,568 | $31,123 |
| Median Family Income | 1,056 | $94,583 |
| Mean Family Income | 1,056 | $114,993 |
| Median Household Income | 1,271 | $82,969 |
| Mean Household Income | 1,271 | $109,876 |
| Income Deficit | 1,056 | $0 |
| Wage / Income Gap (%) | 4,568 | 21.66% |
| Wage / Income Gap ($) | 4,568 | 78.34¢ per $1 |
| Gini / Inequality Index | 4,568 | 0.43 |
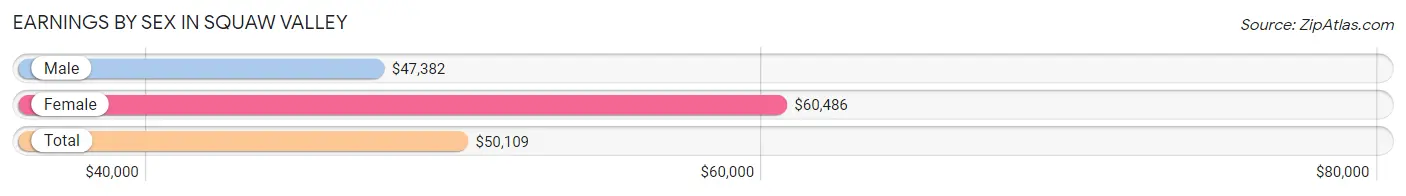
Earnings by Sex in Squaw Valley
Average Earnings in Squaw Valley are $50,109, $47,382 for men and $60,486 for women, a difference of 21.7%.
| Sex | Number | Average Earnings |
| Male | 943 (71.9%) | $47,382 |
| Female | 369 (28.1%) | $60,486 |
| Total | 1,312 (100.0%) | $50,109 |
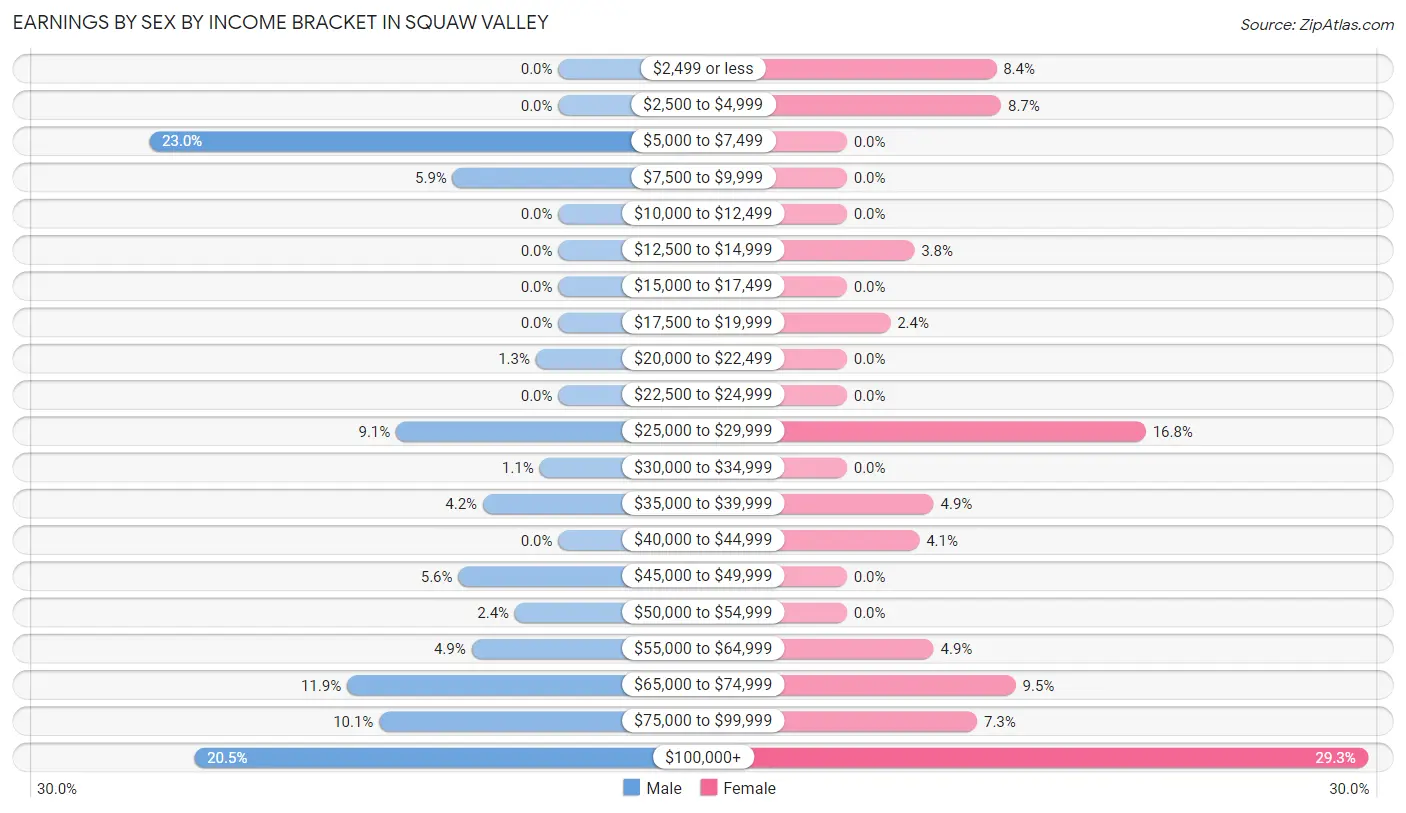
Earnings by Sex by Income Bracket in Squaw Valley
The most common earnings brackets in Squaw Valley are $5,000 to $7,499 for men (217 | 23.0%) and $100,000+ for women (108 | 29.3%).
| Income | Male | Female |
| $2,499 or less | 0 (0.0%) | 31 (8.4%) |
| $2,500 to $4,999 | 0 (0.0%) | 32 (8.7%) |
| $5,000 to $7,499 | 217 (23.0%) | 0 (0.0%) |
| $7,500 to $9,999 | 56 (5.9%) | 0 (0.0%) |
| $10,000 to $12,499 | 0 (0.0%) | 0 (0.0%) |
| $12,500 to $14,999 | 0 (0.0%) | 14 (3.8%) |
| $15,000 to $17,499 | 0 (0.0%) | 0 (0.0%) |
| $17,500 to $19,999 | 0 (0.0%) | 9 (2.4%) |
| $20,000 to $22,499 | 12 (1.3%) | 0 (0.0%) |
| $22,500 to $24,999 | 0 (0.0%) | 0 (0.0%) |
| $25,000 to $29,999 | 86 (9.1%) | 62 (16.8%) |
| $30,000 to $34,999 | 10 (1.1%) | 0 (0.0%) |
| $35,000 to $39,999 | 40 (4.2%) | 18 (4.9%) |
| $40,000 to $44,999 | 0 (0.0%) | 15 (4.1%) |
| $45,000 to $49,999 | 53 (5.6%) | 0 (0.0%) |
| $50,000 to $54,999 | 23 (2.4%) | 0 (0.0%) |
| $55,000 to $64,999 | 46 (4.9%) | 18 (4.9%) |
| $65,000 to $74,999 | 112 (11.9%) | 35 (9.5%) |
| $75,000 to $99,999 | 95 (10.1%) | 27 (7.3%) |
| $100,000+ | 193 (20.5%) | 108 (29.3%) |
| Total | 943 (100.0%) | 369 (100.0%) |
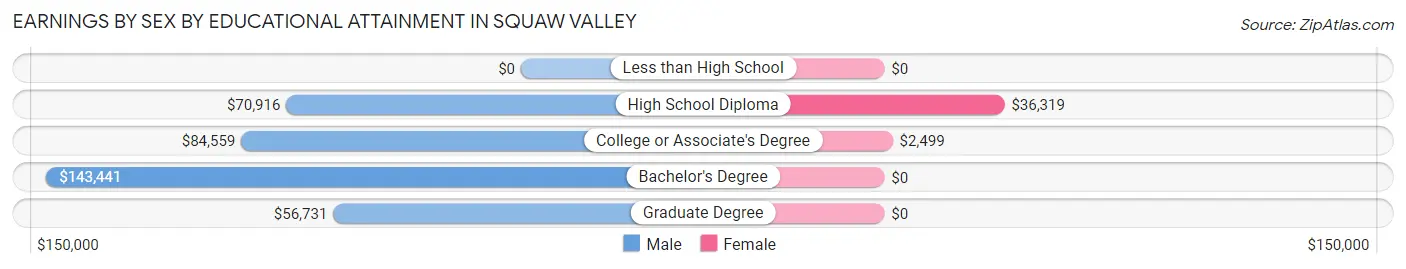
Earnings by Sex by Educational Attainment in Squaw Valley
Average earnings in Squaw Valley are $71,730 for men and $62,361 for women, a difference of 13.1%. Men with an educational attainment of bachelor's degree enjoy the highest average annual earnings of $143,441, while those with graduate degree education earn the least with $56,731. Women with an educational attainment of high school diploma earn the most with the average annual earnings of $36,319, while those with college or associate's degree education have the smallest earnings of $2,499.
| Educational Attainment | Male Income | Female Income |
| Less than High School | - | - |
| High School Diploma | $70,916 | $36,319 |
| College or Associate's Degree | $84,559 | $2,499 |
| Bachelor's Degree | $143,441 | $0 |
| Graduate Degree | $56,731 | $0 |
| Total | $71,730 | $62,361 |
Family Income in Squaw Valley
Family Income Brackets in Squaw Valley
According to the Squaw Valley family income data, there are 229 families falling into the $150,000 to $199,999 income range, which is the most common income bracket and makes up 21.7% of all families.
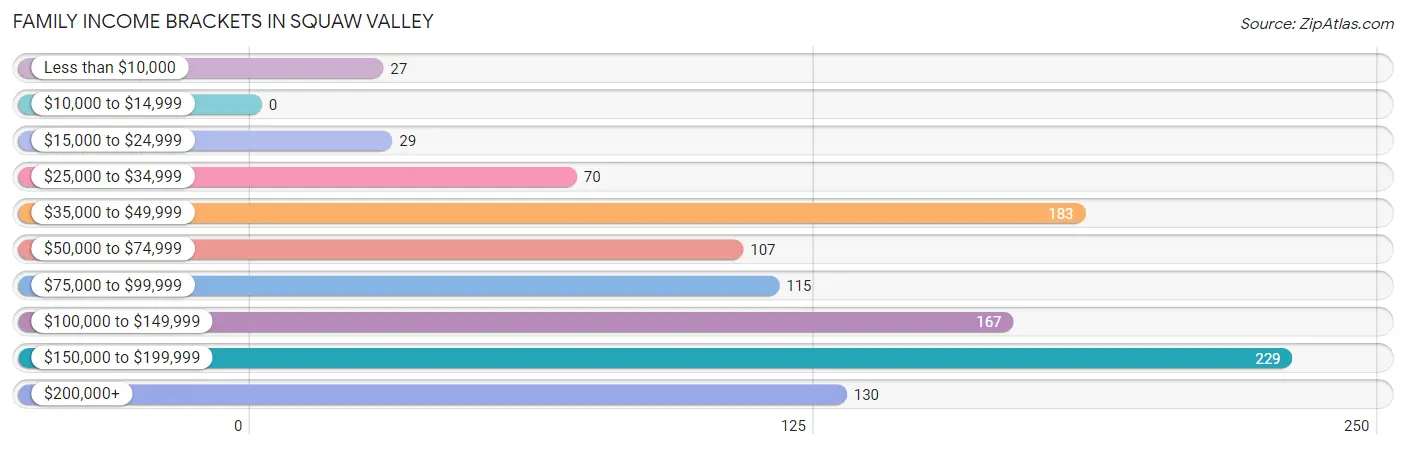
| Income Bracket | # Families | % Families |
| Less than $10,000 | 27 | 2.6% |
| $10,000 to $14,999 | 0 | 0.0% |
| $15,000 to $24,999 | 29 | 2.7% |
| $25,000 to $34,999 | 70 | 6.6% |
| $35,000 to $49,999 | 183 | 17.3% |
| $50,000 to $74,999 | 107 | 10.1% |
| $75,000 to $99,999 | 115 | 10.9% |
| $100,000 to $149,999 | 167 | 15.8% |
| $150,000 to $199,999 | 229 | 21.7% |
| $200,000+ | 130 | 12.3% |
Family Income by Famaliy Size in Squaw Valley
7+ person families (110 | 10.4%) account for the highest median family income in Squaw Valley with $238,401 per family, while 2-person families (449 | 42.5%) have the highest median income of $42,092 per family member.
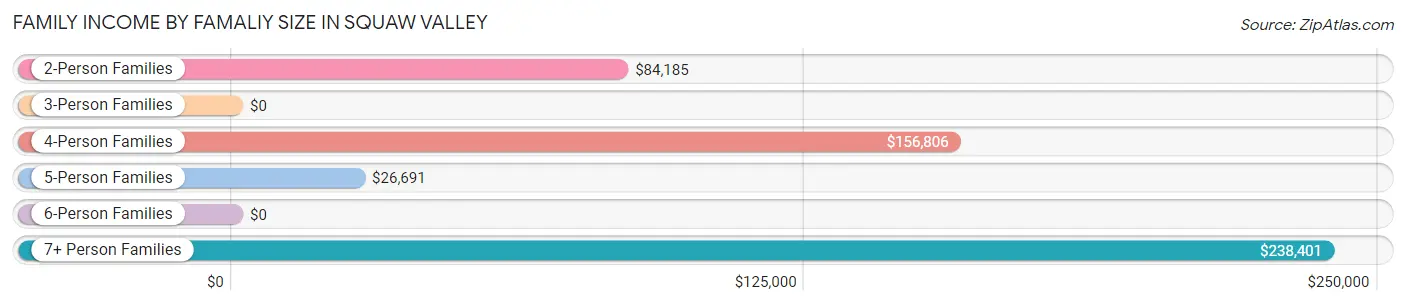
| Income Bracket | # Families | Median Income |
| 2-Person Families | 449 (42.5%) | $84,185 |
| 3-Person Families | 251 (23.8%) | $0 |
| 4-Person Families | 151 (14.3%) | $156,806 |
| 5-Person Families | 69 (6.5%) | $26,691 |
| 6-Person Families | 26 (2.5%) | $0 |
| 7+ Person Families | 110 (10.4%) | $238,401 |
| Total | 1,056 (100.0%) | $94,583 |
Family Income by Number of Earners in Squaw Valley
The median family income in Squaw Valley is $94,583, with families comprising 3+ earners (81) having the highest median family income of $169,119, while families with no earners (399) have the lowest median family income of $46,845, accounting for 7.7% and 37.8% of families, respectively.
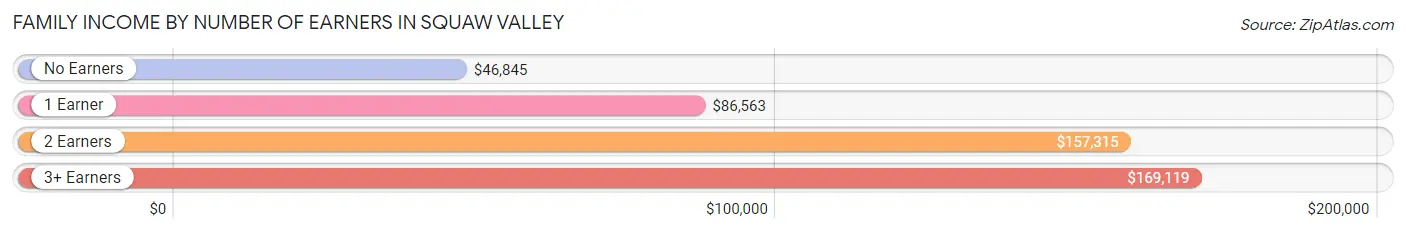
| Number of Earners | # Families | Median Income |
| No Earners | 399 (37.8%) | $46,845 |
| 1 Earner | 288 (27.3%) | $86,563 |
| 2 Earners | 288 (27.3%) | $157,315 |
| 3+ Earners | 81 (7.7%) | $169,119 |
| Total | 1,056 (100.0%) | $94,583 |
Household Income in Squaw Valley
Household Income Brackets in Squaw Valley
With 217 households falling in the category, the $150,000 to $199,999 income range is the most frequent in Squaw Valley, accounting for 17.1% of all households. In contrast, only 17 households (1.3%) fall into the $10,000 to $14,999 income bracket, making it the least populous group.
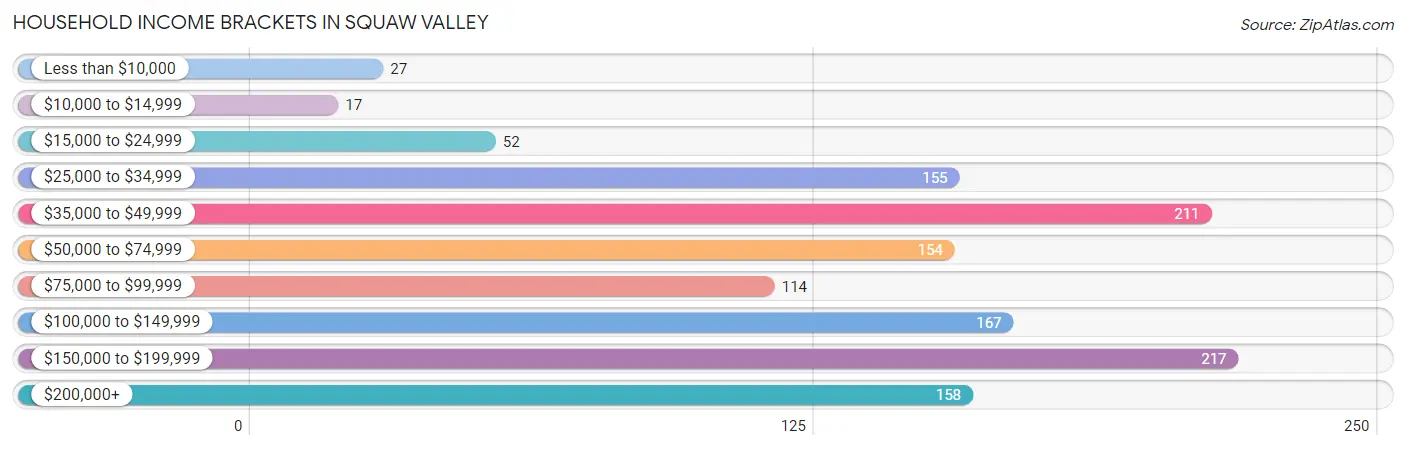
| Income Bracket | # Households | % Households |
| Less than $10,000 | 27 | 2.1% |
| $10,000 to $14,999 | 17 | 1.3% |
| $15,000 to $24,999 | 52 | 4.1% |
| $25,000 to $34,999 | 155 | 12.2% |
| $35,000 to $49,999 | 211 | 16.6% |
| $50,000 to $74,999 | 154 | 12.1% |
| $75,000 to $99,999 | 114 | 9.0% |
| $100,000 to $149,999 | 167 | 13.1% |
| $150,000 to $199,999 | 217 | 17.1% |
| $200,000+ | 158 | 12.4% |
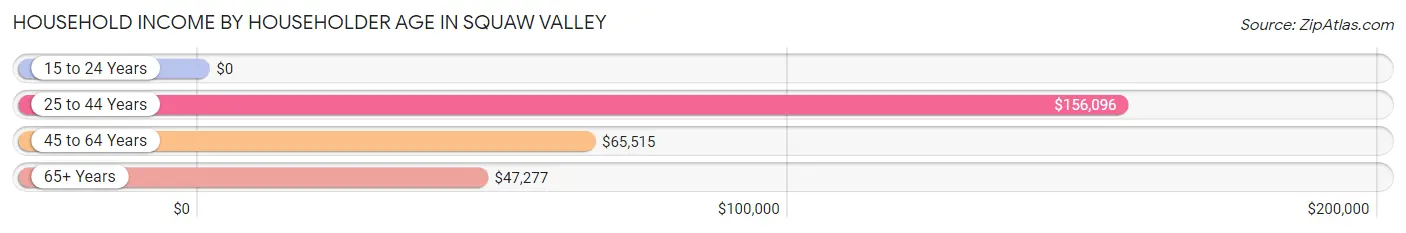
Household Income by Householder Age in Squaw Valley
The median household income in Squaw Valley is $82,969, with the highest median household income of $156,096 found in the 25 to 44 years age bracket for the primary householder. A total of 327 households (25.7%) fall into this category.
| Income Bracket | # Households | Median Income |
| 15 to 24 Years | 0 (0.0%) | $0 |
| 25 to 44 Years | 327 (25.7%) | $156,096 |
| 45 to 64 Years | 553 (43.5%) | $65,515 |
| 65+ Years | 391 (30.8%) | $47,277 |
| Total | 1,271 (100.0%) | $82,969 |
Poverty in Squaw Valley
Income Below Poverty by Sex and Age in Squaw Valley
With 6.2% poverty level for males and 10.6% for females among the residents of Squaw Valley, 25 to 34 year old males and 5 year old females are the most vulnerable to poverty, with 57 males (28.6%) and 56 females (100.0%) in their respective age groups living below the poverty level.
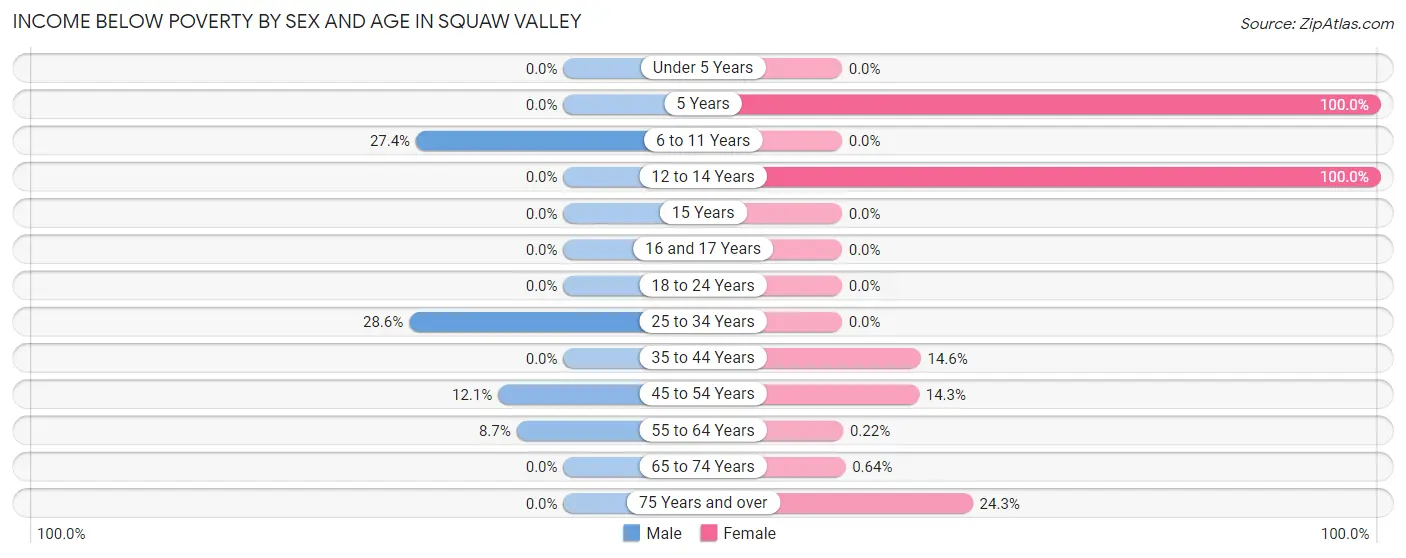
| Age Bracket | Male | Female |
| Under 5 Years | 0 (0.0%) | 0 (0.0%) |
| 5 Years | 0 (0.0%) | 56 (100.0%) |
| 6 to 11 Years | 55 (27.4%) | 0 (0.0%) |
| 12 to 14 Years | 0 (0.0%) | 56 (100.0%) |
| 15 Years | 0 (0.0%) | 0 (0.0%) |
| 16 and 17 Years | 0 (0.0%) | 0 (0.0%) |
| 18 to 24 Years | 0 (0.0%) | 0 (0.0%) |
| 25 to 34 Years | 57 (28.6%) | 0 (0.0%) |
| 35 to 44 Years | 0 (0.0%) | 51 (14.6%) |
| 45 to 54 Years | 12 (12.1%) | 14 (14.3%) |
| 55 to 64 Years | 31 (8.7%) | 1 (0.2%) |
| 65 to 74 Years | 0 (0.0%) | 1 (0.6%) |
| 75 Years and over | 0 (0.0%) | 43 (24.3%) |
| Total | 155 (6.2%) | 222 (10.6%) |
Income Above Poverty by Sex and Age in Squaw Valley
According to the poverty statistics in Squaw Valley, males aged under 5 years and females aged under 5 years are the age groups that are most secure financially, with 100.0% of males and 100.0% of females in these age groups living above the poverty line.
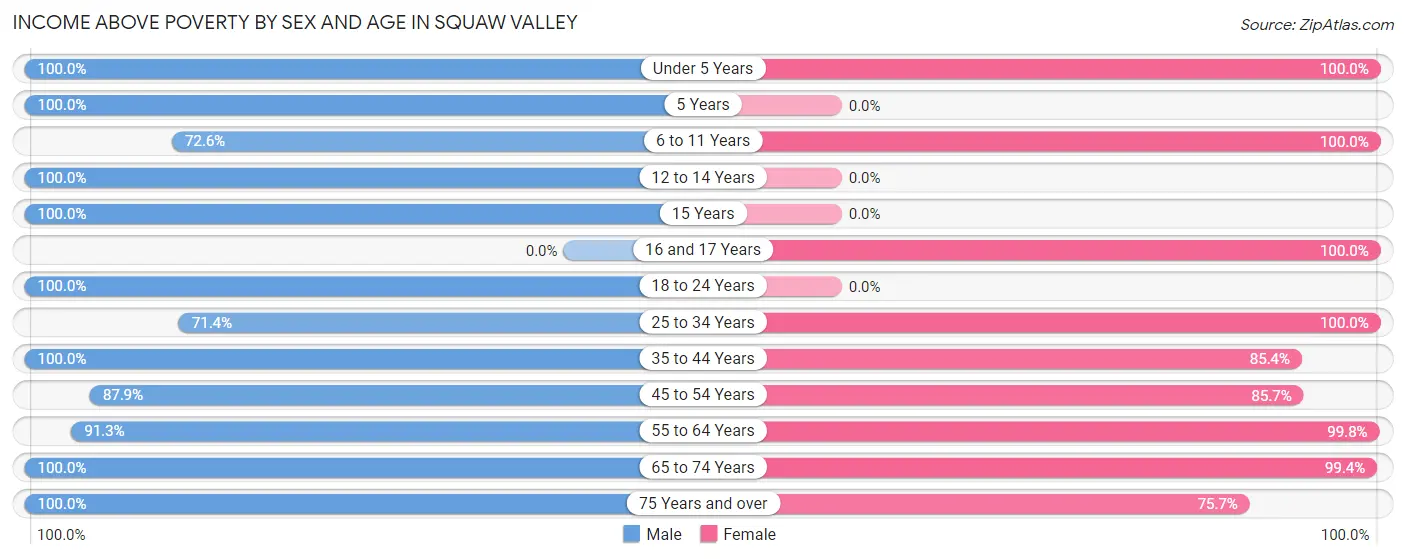
| Age Bracket | Male | Female |
| Under 5 Years | 163 (100.0%) | 146 (100.0%) |
| 5 Years | 107 (100.0%) | 0 (0.0%) |
| 6 to 11 Years | 146 (72.6%) | 281 (100.0%) |
| 12 to 14 Years | 224 (100.0%) | 0 (0.0%) |
| 15 Years | 89 (100.0%) | 0 (0.0%) |
| 16 and 17 Years | 0 (0.0%) | 194 (100.0%) |
| 18 to 24 Years | 325 (100.0%) | 0 (0.0%) |
| 25 to 34 Years | 142 (71.4%) | 111 (100.0%) |
| 35 to 44 Years | 213 (100.0%) | 298 (85.4%) |
| 45 to 54 Years | 87 (87.9%) | 84 (85.7%) |
| 55 to 64 Years | 326 (91.3%) | 463 (99.8%) |
| 65 to 74 Years | 410 (100.0%) | 156 (99.4%) |
| 75 Years and over | 92 (100.0%) | 134 (75.7%) |
| Total | 2,324 (93.8%) | 1,867 (89.4%) |
Income Below Poverty Among Married-Couple Families in Squaw Valley
The poverty statistics for married-couple families in Squaw Valley show that 6.8% or 65 of the total 957 families live below the poverty line. Families with 3 or 4 children have the highest poverty rate of 60.0%, comprising of 51 families. On the other hand, families with 1 or 2 children have the lowest poverty rate of 0.0%, which includes 0 families.
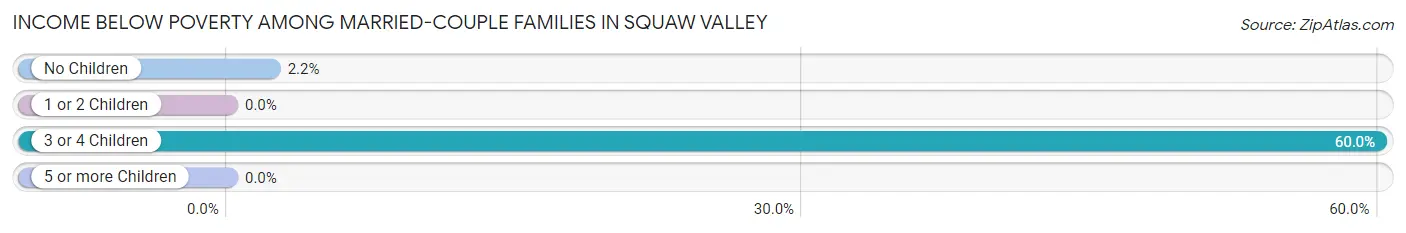
| Children | Above Poverty | Below Poverty |
| No Children | 615 (97.8%) | 14 (2.2%) |
| 1 or 2 Children | 149 (100.0%) | 0 (0.0%) |
| 3 or 4 Children | 34 (40.0%) | 51 (60.0%) |
| 5 or more Children | 94 (100.0%) | 0 (0.0%) |
| Total | 892 (93.2%) | 65 (6.8%) |
Income Below Poverty Among Single-Parent Households in Squaw Valley
According to the poverty data in Squaw Valley, 57.1% or 12 single-father households and 16.7% or 13 single-mother households are living below the poverty line. Among single-father households, those with no children have the highest poverty rate, with 12 households (57.1%) experiencing poverty. Likewise, among single-mother households, those with no children have the highest poverty rate, with 13 households (22.0%) falling below the poverty line.
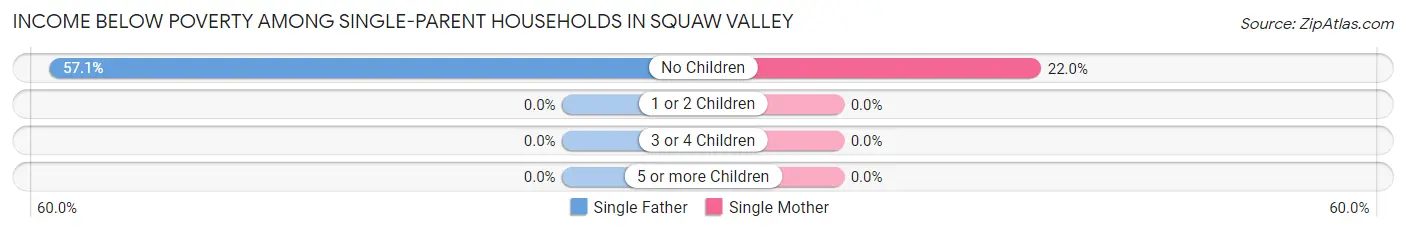
| Children | Single Father | Single Mother |
| No Children | 12 (57.1%) | 13 (22.0%) |
| 1 or 2 Children | 0 (0.0%) | 0 (0.0%) |
| 3 or 4 Children | 0 (0.0%) | 0 (0.0%) |
| 5 or more Children | 0 (0.0%) | 0 (0.0%) |
| Total | 12 (57.1%) | 13 (16.7%) |
Income Below Poverty Among Married-Couple vs Single-Parent Households in Squaw Valley
The poverty data for Squaw Valley shows that 65 of the married-couple family households (6.8%) and 25 of the single-parent households (25.3%) are living below the poverty level. Within the married-couple family households, those with 3 or 4 children have the highest poverty rate, with 51 households (60.0%) falling below the poverty line. Among the single-parent households, those with no children have the highest poverty rate, with 25 household (31.2%) living below poverty.
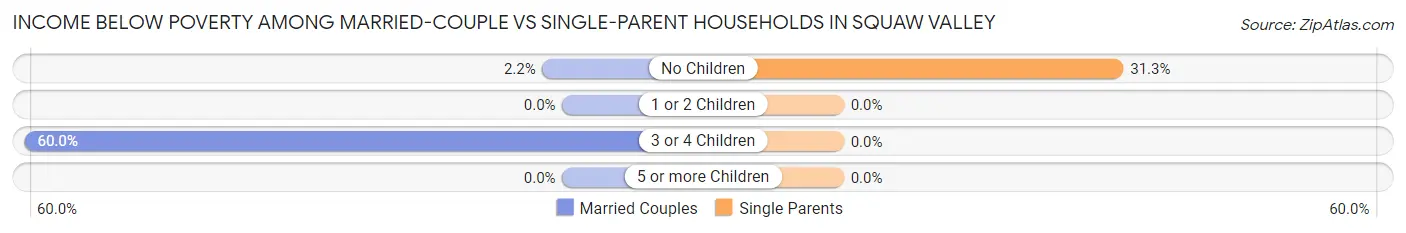
| Children | Married-Couple Families | Single-Parent Households |
| No Children | 14 (2.2%) | 25 (31.2%) |
| 1 or 2 Children | 0 (0.0%) | 0 (0.0%) |
| 3 or 4 Children | 51 (60.0%) | 0 (0.0%) |
| 5 or more Children | 0 (0.0%) | 0 (0.0%) |
| Total | 65 (6.8%) | 25 (25.3%) |
Race in Squaw Valley
The most populous races in Squaw Valley are White / Caucasian (3,482 | 76.2%), Hispanic or Latino (809 | 17.7%), and Some other Race (576 | 12.6%).
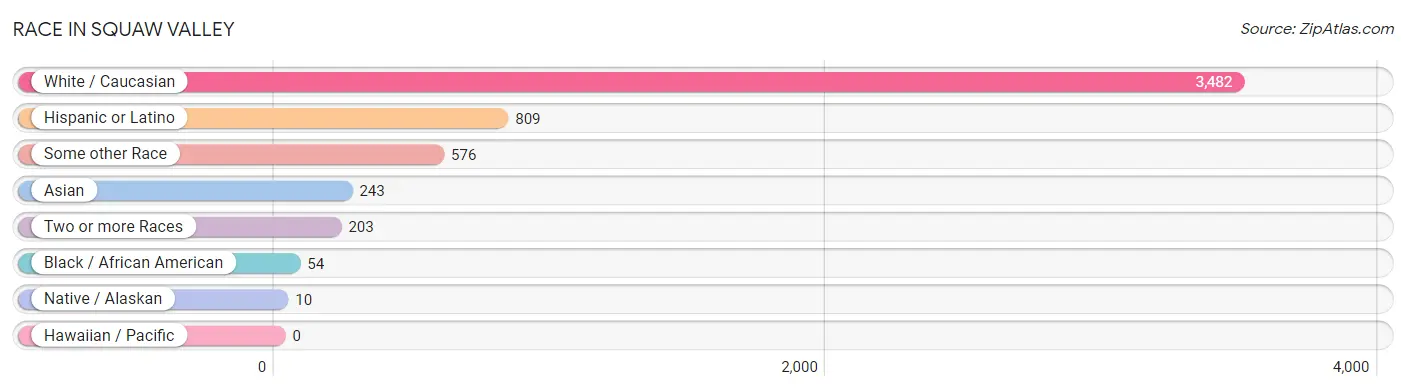
| Race | # Population | % Population |
| Asian | 243 | 5.3% |
| Black / African American | 54 | 1.2% |
| Hawaiian / Pacific | 0 | 0.0% |
| Hispanic or Latino | 809 | 17.7% |
| Native / Alaskan | 10 | 0.2% |
| White / Caucasian | 3,482 | 76.2% |
| Two or more Races | 203 | 4.4% |
| Some other Race | 576 | 12.6% |
| Total | 4,568 | 100.0% |
Ancestry in Squaw Valley
The most populous ancestries reported in Squaw Valley are Mexican (770 | 16.9%), German (335 | 7.3%), English (260 | 5.7%), Irish (228 | 5.0%), and Bangladeshi (189 | 4.1%), together accounting for 39.0% of all Squaw Valley residents.
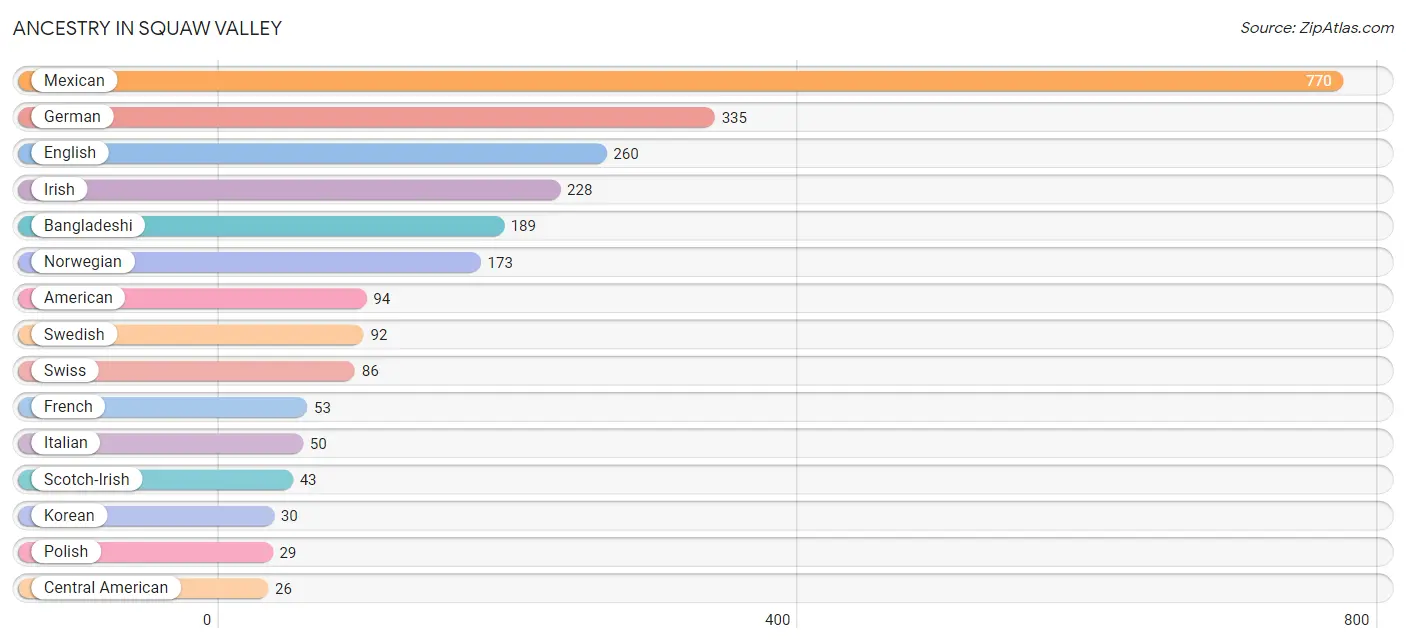
| Ancestry | # Population | % Population |
| African | 7 | 0.2% |
| American | 94 | 2.1% |
| Bangladeshi | 189 | 4.1% |
| Central American | 26 | 0.6% |
| Cherokee | 4 | 0.1% |
| Choctaw | 8 | 0.2% |
| Colombian | 13 | 0.3% |
| Danish | 14 | 0.3% |
| Dutch | 19 | 0.4% |
| English | 260 | 5.7% |
| European | 7 | 0.2% |
| Finnish | 7 | 0.2% |
| French | 53 | 1.2% |
| German | 335 | 7.3% |
| Greek | 19 | 0.4% |
| Guatemalan | 16 | 0.4% |
| Hungarian | 14 | 0.3% |
| Indian (Asian) | 17 | 0.4% |
| Irish | 228 | 5.0% |
| Iroquois | 10 | 0.2% |
| Italian | 50 | 1.1% |
| Korean | 30 | 0.7% |
| Laotian | 15 | 0.3% |
| Luxembourger | 1 | 0.0% |
| Malaysian | 19 | 0.4% |
| Mexican | 770 | 16.9% |
| Native Hawaiian | 1 | 0.0% |
| Norwegian | 173 | 3.8% |
| Polish | 29 | 0.6% |
| Portuguese | 1 | 0.0% |
| Salvadoran | 10 | 0.2% |
| Scotch-Irish | 43 | 0.9% |
| Scottish | 7 | 0.2% |
| South American | 13 | 0.3% |
| Sri Lankan | 6 | 0.1% |
| Subsaharan African | 7 | 0.2% |
| Swedish | 92 | 2.0% |
| Swiss | 86 | 1.9% |
| Welsh | 8 | 0.2% | View All 39 Rows |
Immigrants in Squaw Valley
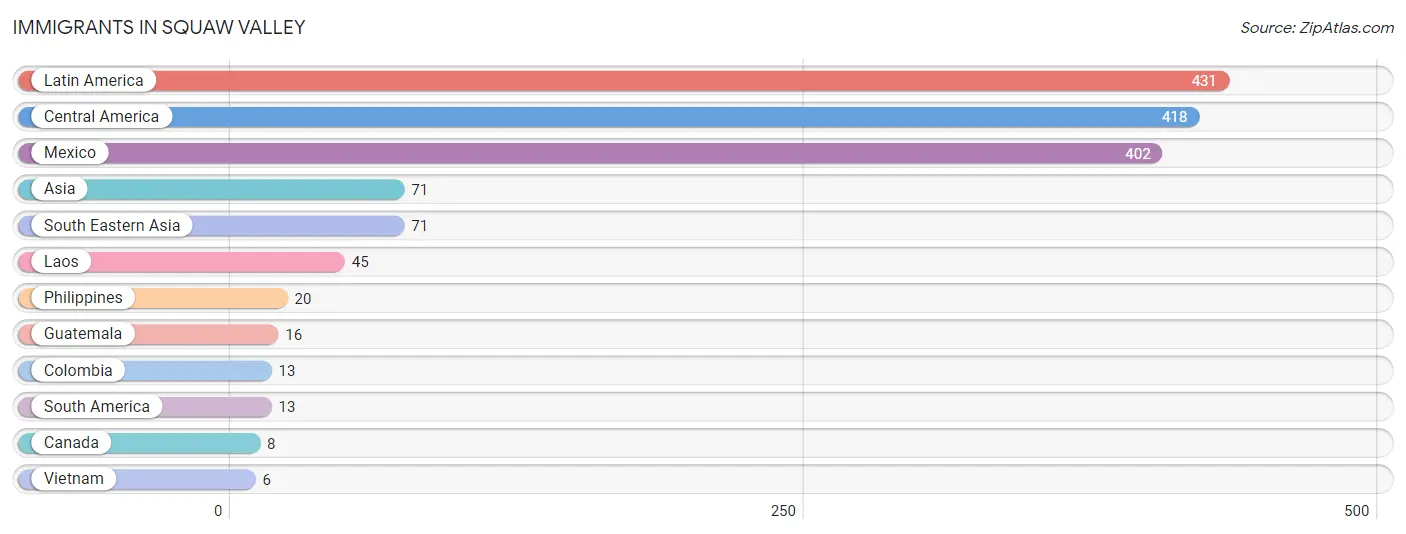
The most numerous immigrant groups reported in Squaw Valley came from Latin America (431 | 9.4%), Central America (418 | 9.1%), Mexico (402 | 8.8%), Asia (71 | 1.5%), and South Eastern Asia (71 | 1.5%), together accounting for 30.5% of all Squaw Valley residents.
| Immigration Origin | # Population | % Population |
| Asia | 71 | 1.5% |
| Canada | 8 | 0.2% |
| Central America | 418 | 9.1% |
| Colombia | 13 | 0.3% |
| Guatemala | 16 | 0.4% |
| Laos | 45 | 1.0% |
| Latin America | 431 | 9.4% |
| Mexico | 402 | 8.8% |
| Philippines | 20 | 0.4% |
| South America | 13 | 0.3% |
| South Eastern Asia | 71 | 1.5% |
| Vietnam | 6 | 0.1% | View All 12 Rows |
Sex and Age in Squaw Valley
Sex and Age in Squaw Valley
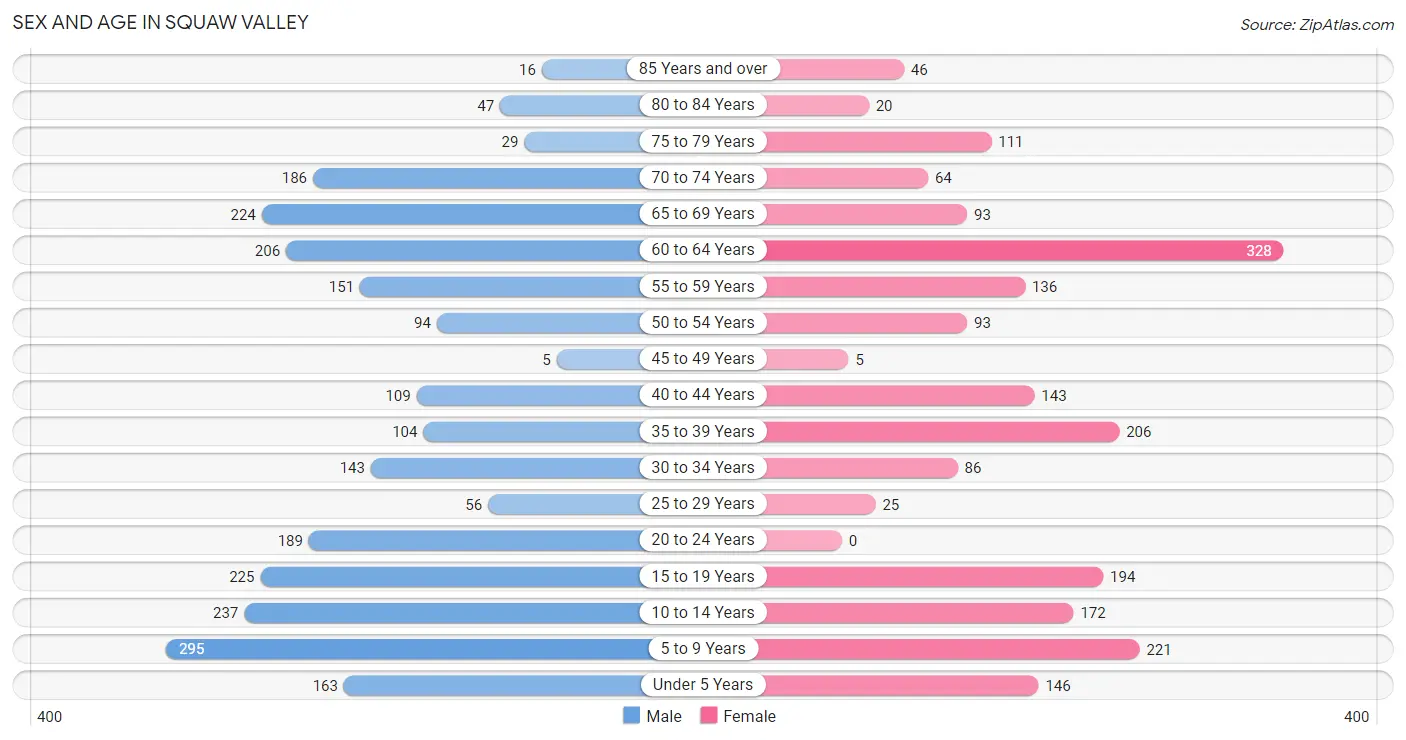
The most populous age groups in Squaw Valley are 5 to 9 Years (295 | 11.9%) for men and 60 to 64 Years (328 | 15.7%) for women.
| Age Bracket | Male | Female |
| Under 5 Years | 163 (6.6%) | 146 (7.0%) |
| 5 to 9 Years | 295 (11.9%) | 221 (10.6%) |
| 10 to 14 Years | 237 (9.6%) | 172 (8.2%) |
| 15 to 19 Years | 225 (9.1%) | 194 (9.3%) |
| 20 to 24 Years | 189 (7.6%) | 0 (0.0%) |
| 25 to 29 Years | 56 (2.3%) | 25 (1.2%) |
| 30 to 34 Years | 143 (5.8%) | 86 (4.1%) |
| 35 to 39 Years | 104 (4.2%) | 206 (9.9%) |
| 40 to 44 Years | 109 (4.4%) | 143 (6.9%) |
| 45 to 49 Years | 5 (0.2%) | 5 (0.2%) |
| 50 to 54 Years | 94 (3.8%) | 93 (4.4%) |
| 55 to 59 Years | 151 (6.1%) | 136 (6.5%) |
| 60 to 64 Years | 206 (8.3%) | 328 (15.7%) |
| 65 to 69 Years | 224 (9.0%) | 93 (4.4%) |
| 70 to 74 Years | 186 (7.5%) | 64 (3.1%) |
| 75 to 79 Years | 29 (1.2%) | 111 (5.3%) |
| 80 to 84 Years | 47 (1.9%) | 20 (1.0%) |
| 85 Years and over | 16 (0.6%) | 46 (2.2%) |
| Total | 2,479 (100.0%) | 2,089 (100.0%) |
Families and Households in Squaw Valley
Median Family Size in Squaw Valley
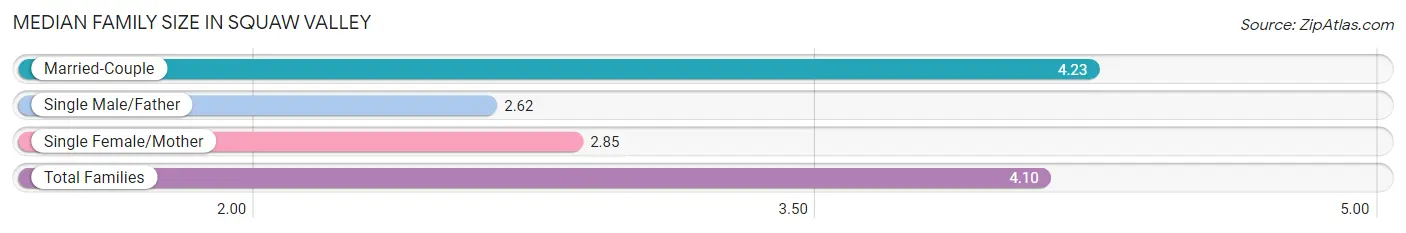
The median family size in Squaw Valley is 4.10 persons per family, with married-couple families (957 | 90.6%) accounting for the largest median family size of 4.23 persons per family. On the other hand, single male/father families (21 | 2.0%) represent the smallest median family size with 2.62 persons per family.
| Family Type | # Families | Family Size |
| Married-Couple | 957 (90.6%) | 4.23 |
| Single Male/Father | 21 (2.0%) | 2.62 |
| Single Female/Mother | 78 (7.4%) | 2.85 |
| Total Families | 1,056 (100.0%) | 4.10 |
Median Household Size in Squaw Valley
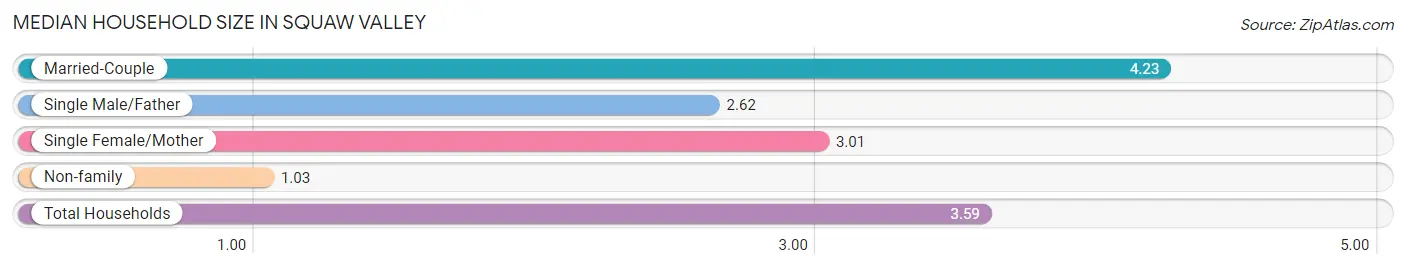
The median household size in Squaw Valley is 3.59 persons per household, with married-couple households (957 | 75.3%) accounting for the largest median household size of 4.23 persons per household. non-family households (215 | 16.9%) represent the smallest median household size with 1.03 persons per household.
| Household Type | # Households | Household Size |
| Married-Couple | 957 (75.3%) | 4.23 |
| Single Male/Father | 21 (1.7%) | 2.62 |
| Single Female/Mother | 78 (6.1%) | 3.01 |
| Non-family | 215 (16.9%) | 1.03 |
| Total Households | 1,271 (100.0%) | 3.59 |
Household Size by Marriage Status in Squaw Valley
Out of a total of 1,271 households in Squaw Valley, 1,056 (83.1%) are family households, while 215 (16.9%) are nonfamily households. The most numerous type of family households are 2-person households, comprising 449, and the most common type of nonfamily households are 1-person households, comprising 208.
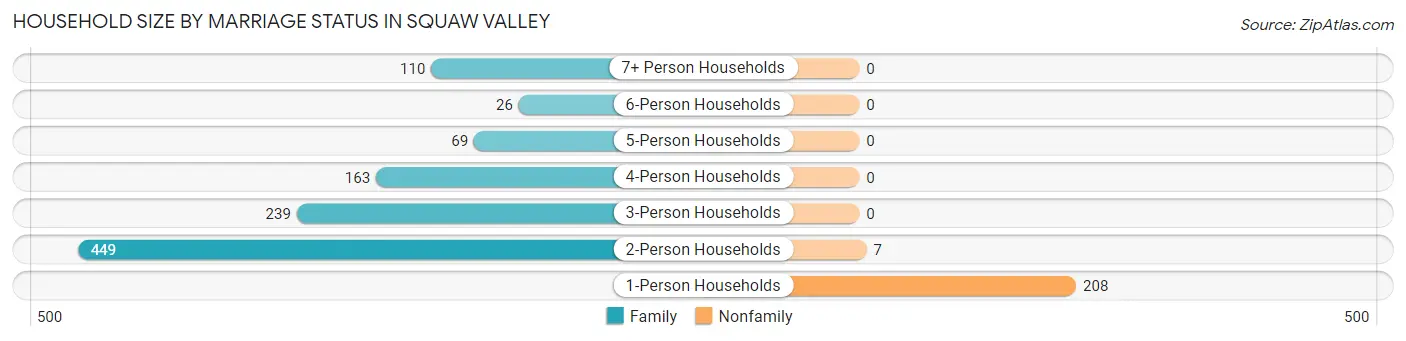
| Household Size | Family Households | Nonfamily Households |
| 1-Person Households | - | 208 (16.4%) |
| 2-Person Households | 449 (35.3%) | 7 (0.5%) |
| 3-Person Households | 239 (18.8%) | 0 (0.0%) |
| 4-Person Households | 163 (12.8%) | 0 (0.0%) |
| 5-Person Households | 69 (5.4%) | 0 (0.0%) |
| 6-Person Households | 26 (2.1%) | 0 (0.0%) |
| 7+ Person Households | 110 (8.6%) | 0 (0.0%) |
| Total | 1,056 (83.1%) | 215 (16.9%) |
Female Fertility in Squaw Valley
Fertility by Age in Squaw Valley
Average fertility rate in Squaw Valley is 39.0 births per 1,000 women. Women in the age bracket of 35 to 50 years have the highest fertility rate with 71.0 births per 1,000 women. Women in the age bracket of 35 to 50 years acount for 100.0% of all women with births.
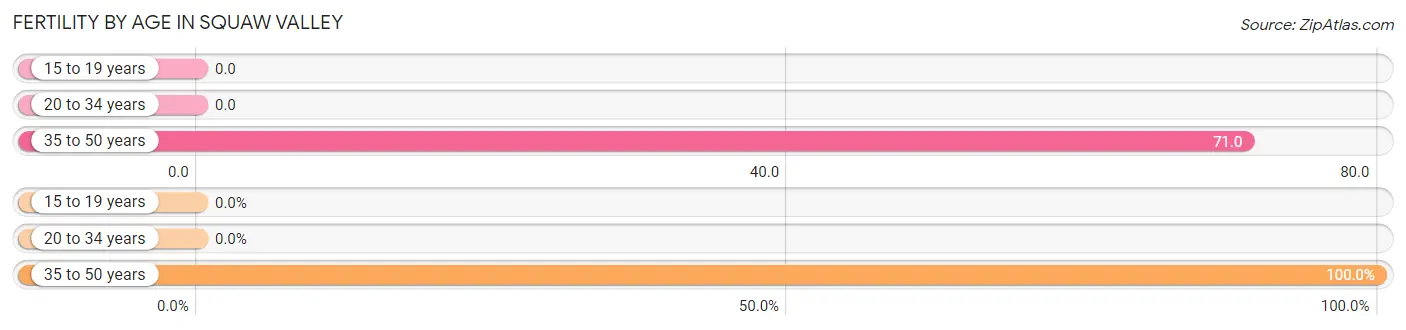
| Age Bracket | Women with Births | Births / 1,000 Women |
| 15 to 19 years | 0 (0.0%) | 0.0 |
| 20 to 34 years | 0 (0.0%) | 0.0 |
| 35 to 50 years | 26 (100.0%) | 71.0 |
| Total | 26 (100.0%) | 39.0 |
Fertility by Age by Marriage Status in Squaw Valley
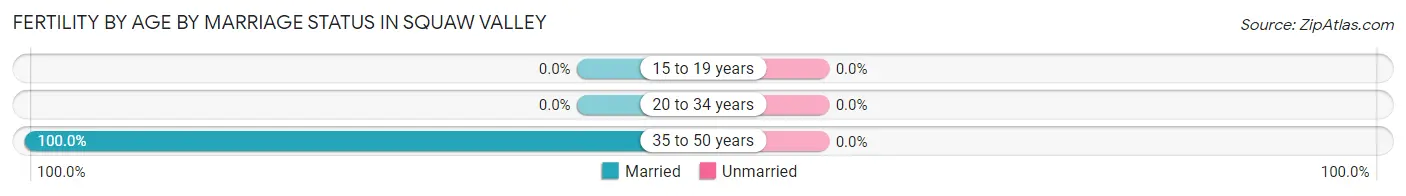
| Age Bracket | Married | Unmarried |
| 15 to 19 years | 0 (0.0%) | 0 (0.0%) |
| 20 to 34 years | 0 (0.0%) | 0 (0.0%) |
| 35 to 50 years | 26 (100.0%) | 0 (0.0%) |
| Total | 26 (100.0%) | 0 (0.0%) |
Fertility by Education in Squaw Valley
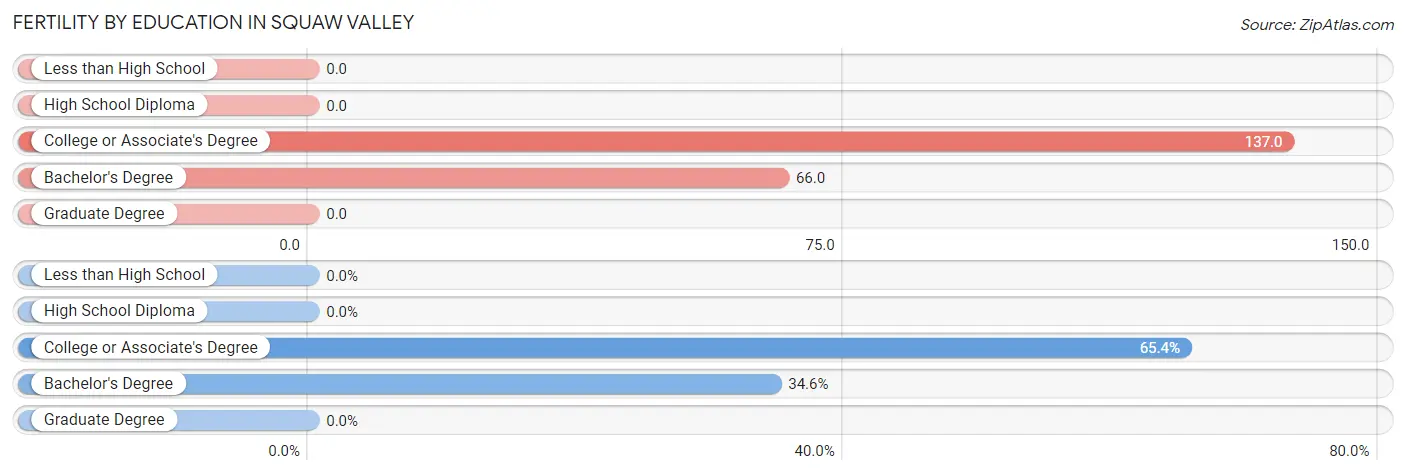
| Educational Attainment | Women with Births | Births / 1,000 Women |
| Less than High School | 0 (0.0%) | 0.0 |
| High School Diploma | 0 (0.0%) | 0.0 |
| College or Associate's Degree | 17 (65.4%) | 137.0 |
| Bachelor's Degree | 9 (34.6%) | 66.0 |
| Graduate Degree | 0 (0.0%) | 0.0 |
| Total | 26 (100.0%) | 39.0 |
Fertility by Education by Marriage Status in Squaw Valley
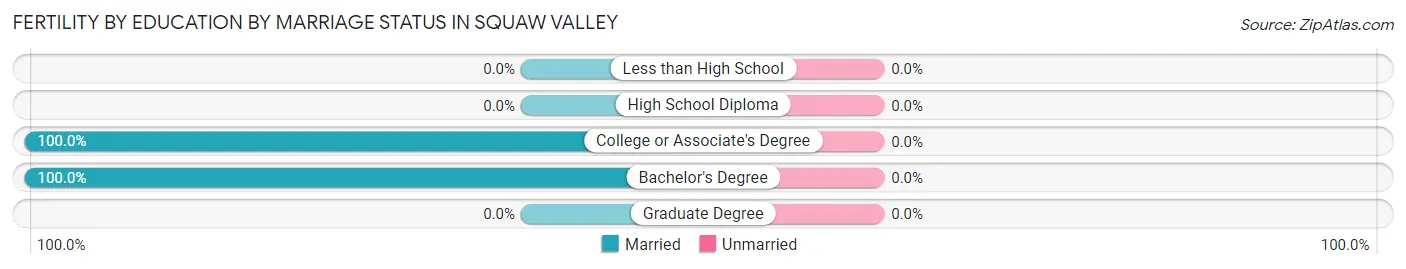
| Educational Attainment | Married | Unmarried |
| Less than High School | 0 (0.0%) | 0 (0.0%) |
| High School Diploma | 0 (0.0%) | 0 (0.0%) |
| College or Associate's Degree | 17 (100.0%) | 0 (0.0%) |
| Bachelor's Degree | 9 (100.0%) | 0 (0.0%) |
| Graduate Degree | 0 (0.0%) | 0 (0.0%) |
| Total | 26 (100.0%) | 0 (0.0%) |
Employment Characteristics in Squaw Valley
Employment by Class of Employer in Squaw Valley
Among the 1,307 employed individuals in Squaw Valley, private company employees (814 | 62.3%), local government employees (111 | 8.5%), and state government employees (110 | 8.4%) make up the most common classes of employment.
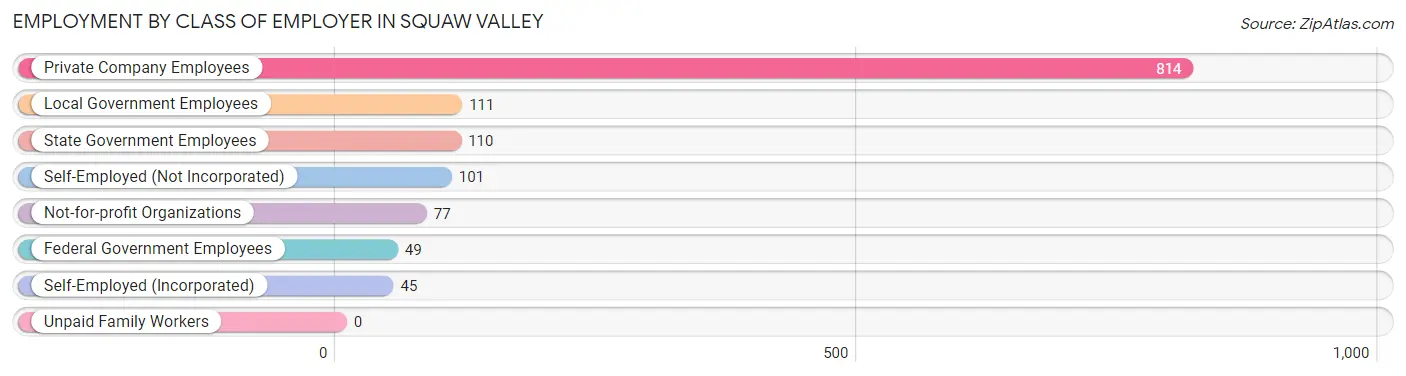
| Employer Class | # Employees | % Employees |
| Private Company Employees | 814 | 62.3% |
| Self-Employed (Incorporated) | 45 | 3.4% |
| Self-Employed (Not Incorporated) | 101 | 7.7% |
| Not-for-profit Organizations | 77 | 5.9% |
| Local Government Employees | 111 | 8.5% |
| State Government Employees | 110 | 8.4% |
| Federal Government Employees | 49 | 3.7% |
| Unpaid Family Workers | 0 | 0.0% |
| Total | 1,307 | 100.0% |
Employment Status by Age in Squaw Valley
According to the labor force statistics for Squaw Valley, out of the total population over 16 years of age (3,245), 41.4% or 1,343 individuals are in the labor force, with 2.8% or 38 of them unemployed. The age group with the highest labor force participation rate is 20 to 24 years, with 100.0% or 189 individuals in the labor force. Within the labor force, the 35 to 44 years age range has the highest percentage of unemployed individuals, with 11.8% or 32 of them being unemployed.
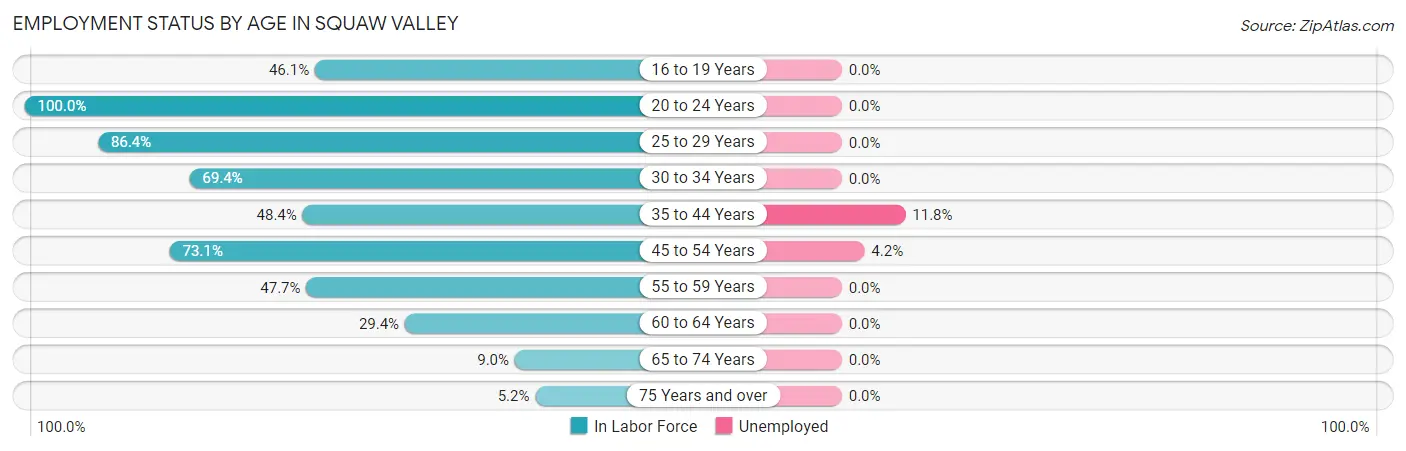
| Age Bracket | In Labor Force | Unemployed |
| 16 to 19 Years | 152 (46.1%) | 0 (0.0%) |
| 20 to 24 Years | 189 (100.0%) | 0 (0.0%) |
| 25 to 29 Years | 70 (86.4%) | 0 (0.0%) |
| 30 to 34 Years | 159 (69.4%) | 0 (0.0%) |
| 35 to 44 Years | 272 (48.4%) | 32 (11.8%) |
| 45 to 54 Years | 144 (73.1%) | 6 (4.2%) |
| 55 to 59 Years | 137 (47.7%) | 0 (0.0%) |
| 60 to 64 Years | 157 (29.4%) | 0 (0.0%) |
| 65 to 74 Years | 51 (9.0%) | 0 (0.0%) |
| 75 Years and over | 14 (5.2%) | 0 (0.0%) |
| Total | 1,343 (41.4%) | 38 (2.8%) |
Employment Status by Educational Attainment in Squaw Valley
According to labor force statistics for Squaw Valley, 49.7% of individuals (939) out of the total population between 25 and 64 years of age (1,890) are in the labor force, with 4.0% or 38 of them being unemployed. The group with the highest labor force participation rate are those with the educational attainment of bachelor's degree or higher, with 86.9% or 385 individuals in the labor force. Within the labor force, individuals with less than high school education have the highest percentage of unemployment, with 8.2% or 6 of them being unemployed.
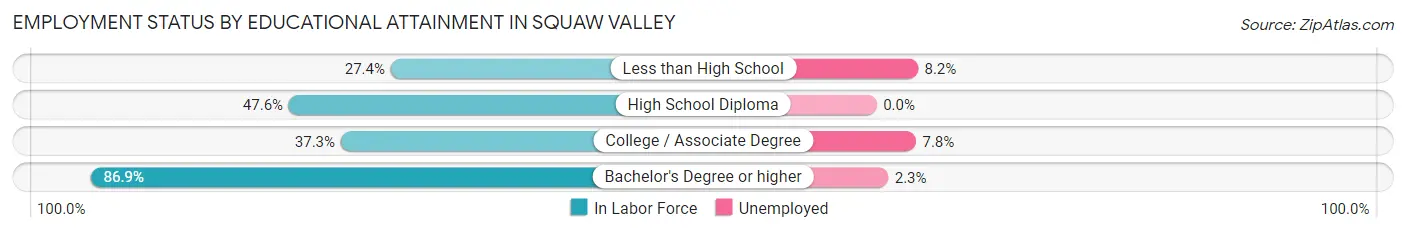
| Educational Attainment | In Labor Force | Unemployed |
| Less than High School | 73 (27.4%) | 22 (8.2%) |
| High School Diploma | 186 (47.6%) | 0 (0.0%) |
| College / Associate Degree | 295 (37.3%) | 62 (7.8%) |
| Bachelor's Degree or higher | 385 (86.9%) | 10 (2.3%) |
| Total | 939 (49.7%) | 76 (4.0%) |
Employment Occupations by Sex in Squaw Valley
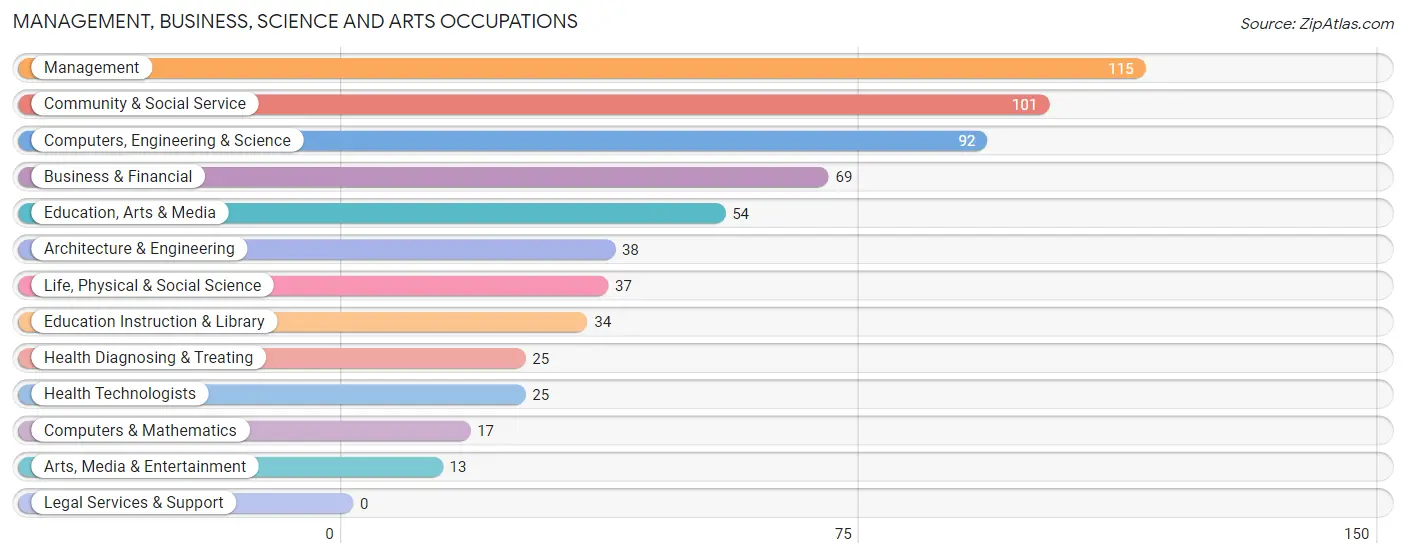
Management, Business, Science and Arts Occupations
The most common Management, Business, Science and Arts occupations in Squaw Valley are Management (115 | 8.8%), Community & Social Service (101 | 7.7%), Computers, Engineering & Science (92 | 7.0%), Business & Financial (69 | 5.3%), and Education, Arts & Media (54 | 4.1%).
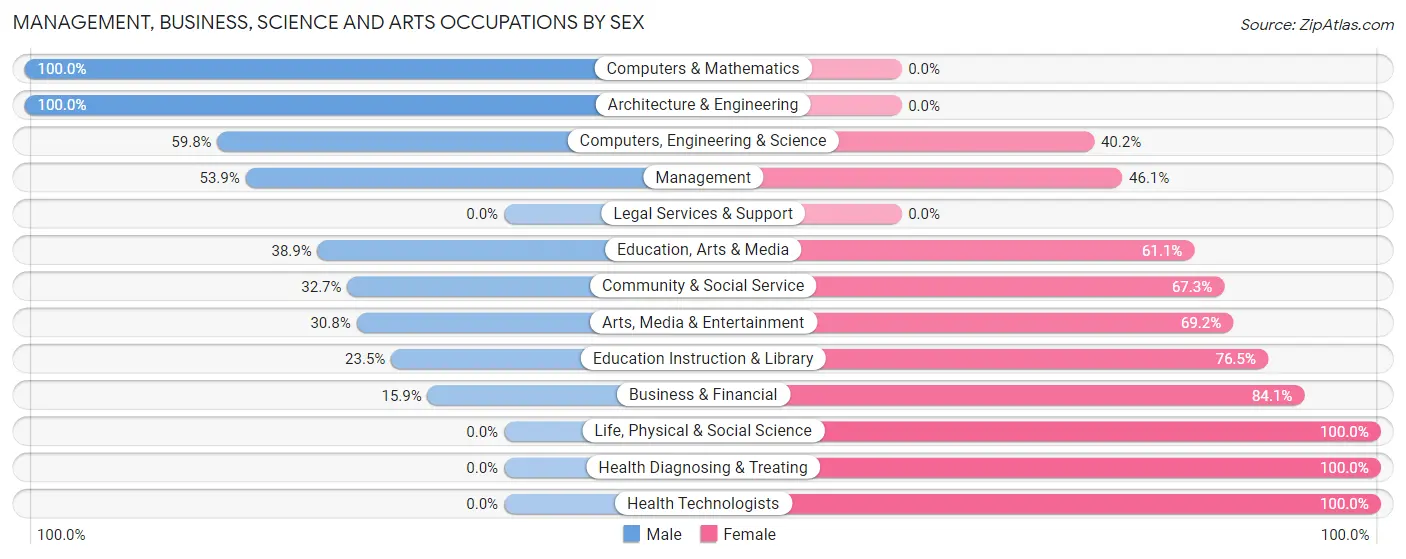
Management, Business, Science and Arts Occupations by Sex
Within the Management, Business, Science and Arts occupations in Squaw Valley, the most male-oriented occupations are Computers & Mathematics (100.0%), Architecture & Engineering (100.0%), and Computers, Engineering & Science (59.8%), while the most female-oriented occupations are Life, Physical & Social Science (100.0%), Health Diagnosing & Treating (100.0%), and Health Technologists (100.0%).
| Occupation | Male | Female |
| Management | 62 (53.9%) | 53 (46.1%) |
| Business & Financial | 11 (15.9%) | 58 (84.1%) |
| Computers, Engineering & Science | 55 (59.8%) | 37 (40.2%) |
| Computers & Mathematics | 17 (100.0%) | 0 (0.0%) |
| Architecture & Engineering | 38 (100.0%) | 0 (0.0%) |
| Life, Physical & Social Science | 0 (0.0%) | 37 (100.0%) |
| Community & Social Service | 33 (32.7%) | 68 (67.3%) |
| Education, Arts & Media | 21 (38.9%) | 33 (61.1%) |
| Legal Services & Support | 0 (0.0%) | 0 (0.0%) |
| Education Instruction & Library | 8 (23.5%) | 26 (76.5%) |
| Arts, Media & Entertainment | 4 (30.8%) | 9 (69.2%) |
| Health Diagnosing & Treating | 0 (0.0%) | 25 (100.0%) |
| Health Technologists | 0 (0.0%) | 25 (100.0%) |
| Total (Category) | 161 (40.1%) | 241 (60.0%) |
| Total (Overall) | 943 (72.2%) | 364 (27.9%) |
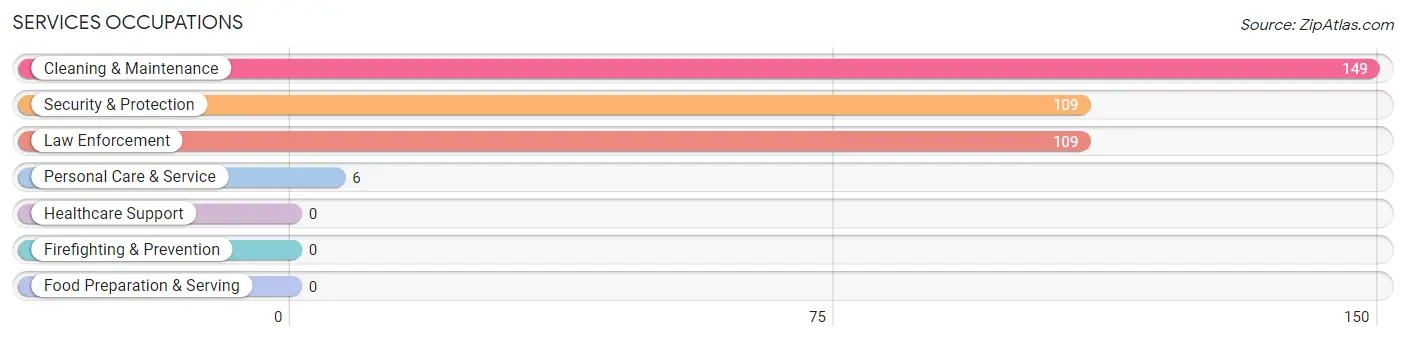
Services Occupations
The most common Services occupations in Squaw Valley are Cleaning & Maintenance (149 | 11.4%), Security & Protection (109 | 8.3%), Law Enforcement (109 | 8.3%), and Personal Care & Service (6 | 0.5%).
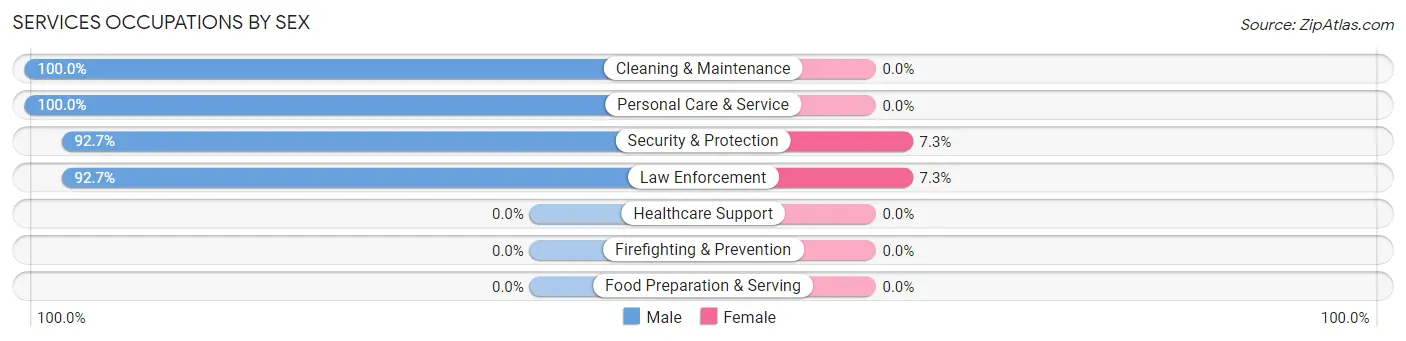
Services Occupations by Sex
Within the Services occupations in Squaw Valley, the most male-oriented occupations are Cleaning & Maintenance (100.0%), Personal Care & Service (100.0%), and Security & Protection (92.7%), while the most female-oriented occupations are Security & Protection (7.3%), and Law Enforcement (7.3%).
| Occupation | Male | Female |
| Healthcare Support | 0 (0.0%) | 0 (0.0%) |
| Security & Protection | 101 (92.7%) | 8 (7.3%) |
| Firefighting & Prevention | 0 (0.0%) | 0 (0.0%) |
| Law Enforcement | 101 (92.7%) | 8 (7.3%) |
| Food Preparation & Serving | 0 (0.0%) | 0 (0.0%) |
| Cleaning & Maintenance | 149 (100.0%) | 0 (0.0%) |
| Personal Care & Service | 6 (100.0%) | 0 (0.0%) |
| Total (Category) | 256 (97.0%) | 8 (3.0%) |
| Total (Overall) | 943 (72.2%) | 364 (27.9%) |
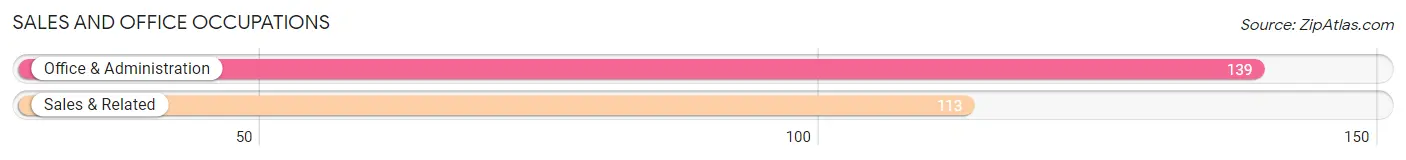
Sales and Office Occupations
The most common Sales and Office occupations in Squaw Valley are Office & Administration (139 | 10.6%), and Sales & Related (113 | 8.6%).
Sales and Office Occupations by Sex
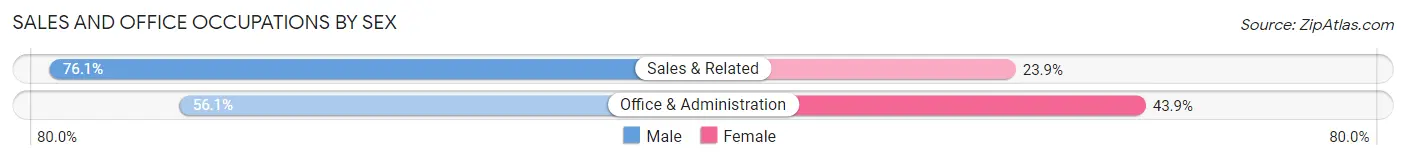
| Occupation | Male | Female |
| Sales & Related | 86 (76.1%) | 27 (23.9%) |
| Office & Administration | 78 (56.1%) | 61 (43.9%) |
| Total (Category) | 164 (65.1%) | 88 (34.9%) |
| Total (Overall) | 943 (72.2%) | 364 (27.9%) |
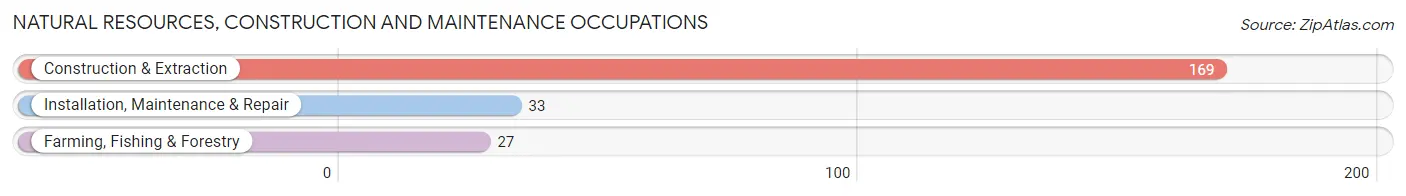
Natural Resources, Construction and Maintenance Occupations
The most common Natural Resources, Construction and Maintenance occupations in Squaw Valley are Construction & Extraction (169 | 12.9%), Installation, Maintenance & Repair (33 | 2.5%), and Farming, Fishing & Forestry (27 | 2.1%).
Natural Resources, Construction and Maintenance Occupations by Sex
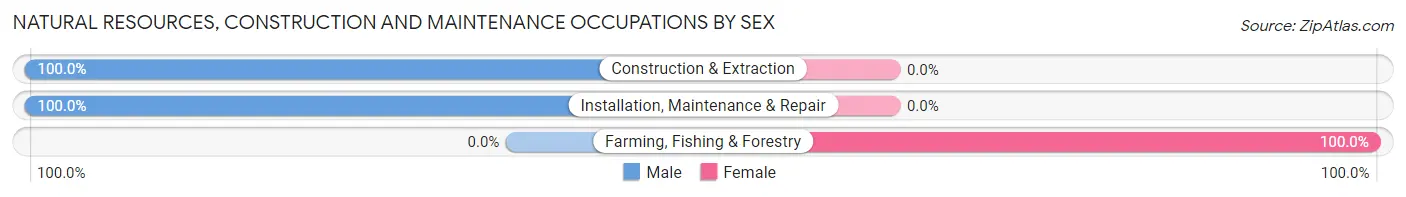
| Occupation | Male | Female |
| Farming, Fishing & Forestry | 0 (0.0%) | 27 (100.0%) |
| Construction & Extraction | 169 (100.0%) | 0 (0.0%) |
| Installation, Maintenance & Repair | 33 (100.0%) | 0 (0.0%) |
| Total (Category) | 202 (88.2%) | 27 (11.8%) |
| Total (Overall) | 943 (72.2%) | 364 (27.9%) |
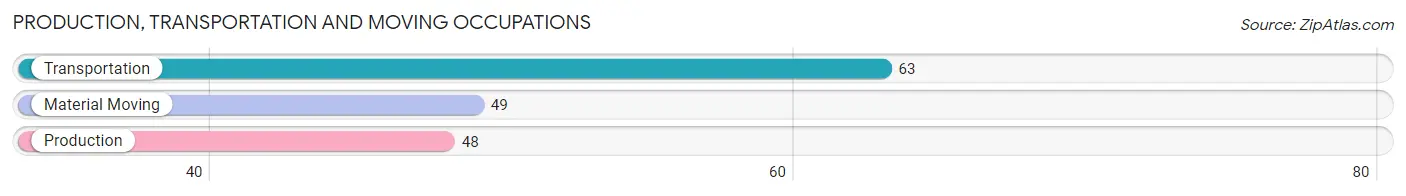
Production, Transportation and Moving Occupations
The most common Production, Transportation and Moving occupations in Squaw Valley are Transportation (63 | 4.8%), Material Moving (49 | 3.7%), and Production (48 | 3.7%).
Production, Transportation and Moving Occupations by Sex
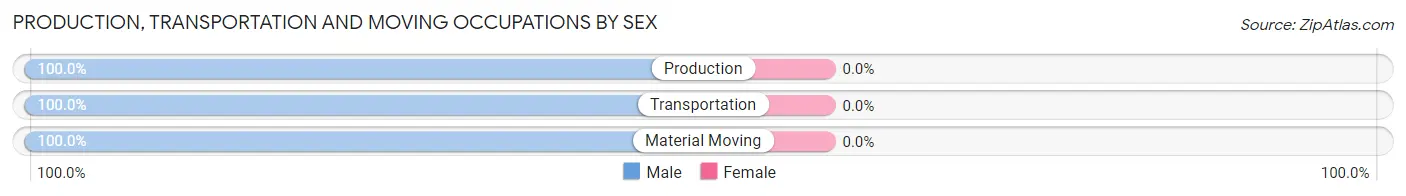
| Occupation | Male | Female |
| Production | 48 (100.0%) | 0 (0.0%) |
| Transportation | 63 (100.0%) | 0 (0.0%) |
| Material Moving | 49 (100.0%) | 0 (0.0%) |
| Total (Category) | 160 (100.0%) | 0 (0.0%) |
| Total (Overall) | 943 (72.2%) | 364 (27.9%) |
Employment Industries by Sex in Squaw Valley
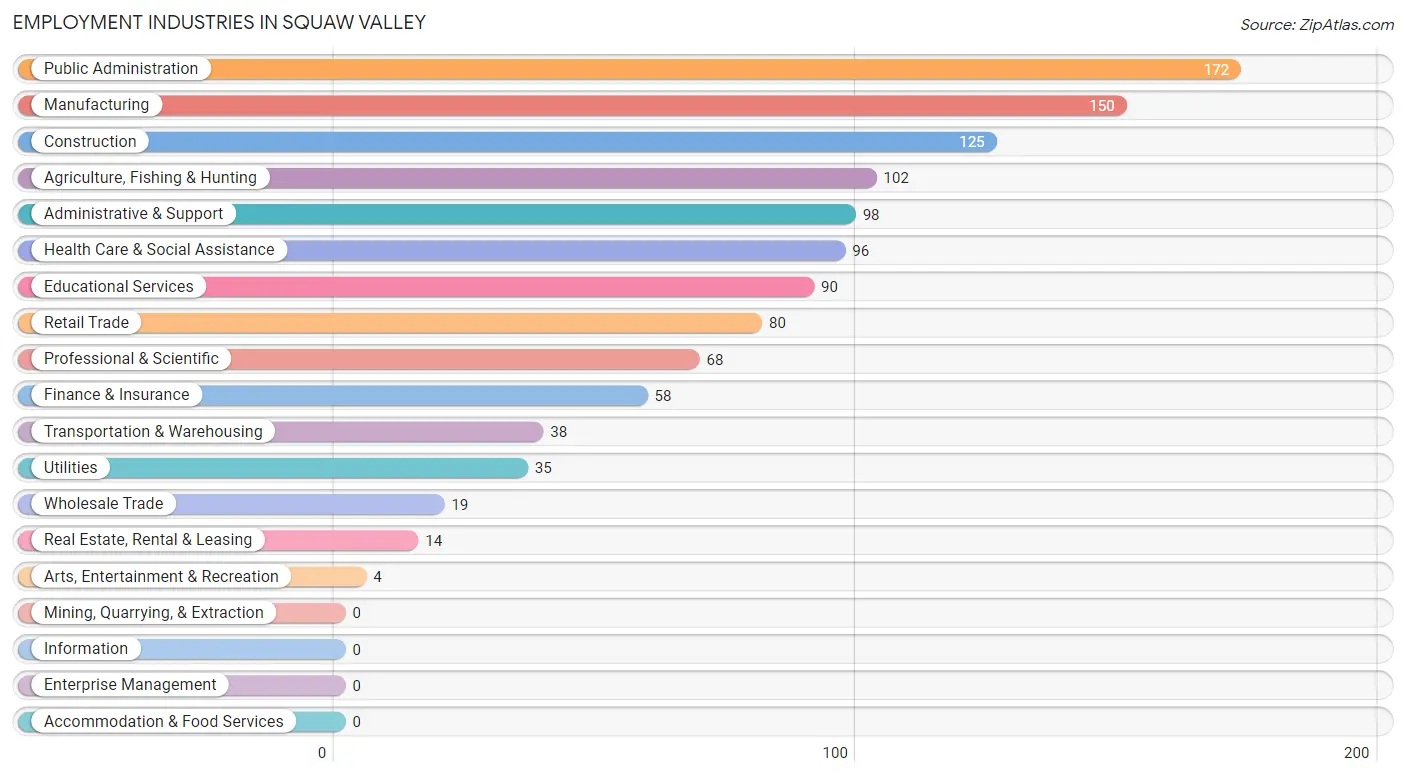
Employment Industries in Squaw Valley
The major employment industries in Squaw Valley include Public Administration (172 | 13.2%), Manufacturing (150 | 11.5%), Construction (125 | 9.6%), Agriculture, Fishing & Hunting (102 | 7.8%), and Administrative & Support (98 | 7.5%).
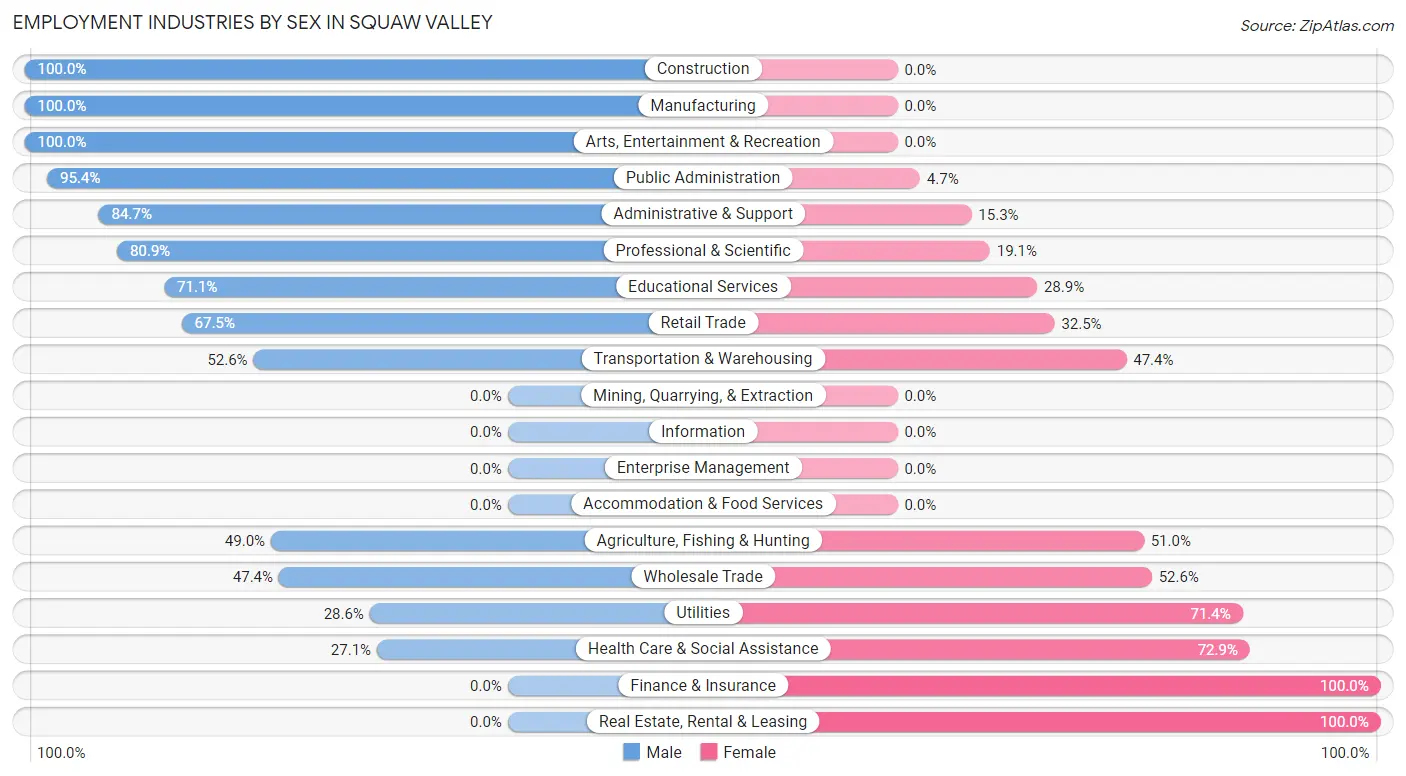
Employment Industries by Sex in Squaw Valley
The Squaw Valley industries that see more men than women are Construction (100.0%), Manufacturing (100.0%), and Arts, Entertainment & Recreation (100.0%), whereas the industries that tend to have a higher number of women are Finance & Insurance (100.0%), Real Estate, Rental & Leasing (100.0%), and Health Care & Social Assistance (72.9%).
| Industry | Male | Female |
| Agriculture, Fishing & Hunting | 50 (49.0%) | 52 (51.0%) |
| Mining, Quarrying, & Extraction | 0 (0.0%) | 0 (0.0%) |
| Construction | 125 (100.0%) | 0 (0.0%) |
| Manufacturing | 150 (100.0%) | 0 (0.0%) |
| Wholesale Trade | 9 (47.4%) | 10 (52.6%) |
| Retail Trade | 54 (67.5%) | 26 (32.5%) |
| Transportation & Warehousing | 20 (52.6%) | 18 (47.4%) |
| Utilities | 10 (28.6%) | 25 (71.4%) |
| Information | 0 (0.0%) | 0 (0.0%) |
| Finance & Insurance | 0 (0.0%) | 58 (100.0%) |
| Real Estate, Rental & Leasing | 0 (0.0%) | 14 (100.0%) |
| Professional & Scientific | 55 (80.9%) | 13 (19.1%) |
| Enterprise Management | 0 (0.0%) | 0 (0.0%) |
| Administrative & Support | 83 (84.7%) | 15 (15.3%) |
| Educational Services | 64 (71.1%) | 26 (28.9%) |
| Health Care & Social Assistance | 26 (27.1%) | 70 (72.9%) |
| Arts, Entertainment & Recreation | 4 (100.0%) | 0 (0.0%) |
| Accommodation & Food Services | 0 (0.0%) | 0 (0.0%) |
| Public Administration | 164 (95.4%) | 8 (4.6%) |
| Total | 943 (72.2%) | 364 (27.9%) |
Education in Squaw Valley
School Enrollment in Squaw Valley
The most common levels of schooling among the 1,547 students in Squaw Valley are middle school (404 | 26.1%), college / undergraduate (296 | 19.1%), and kindergarten (279 | 18.0%).
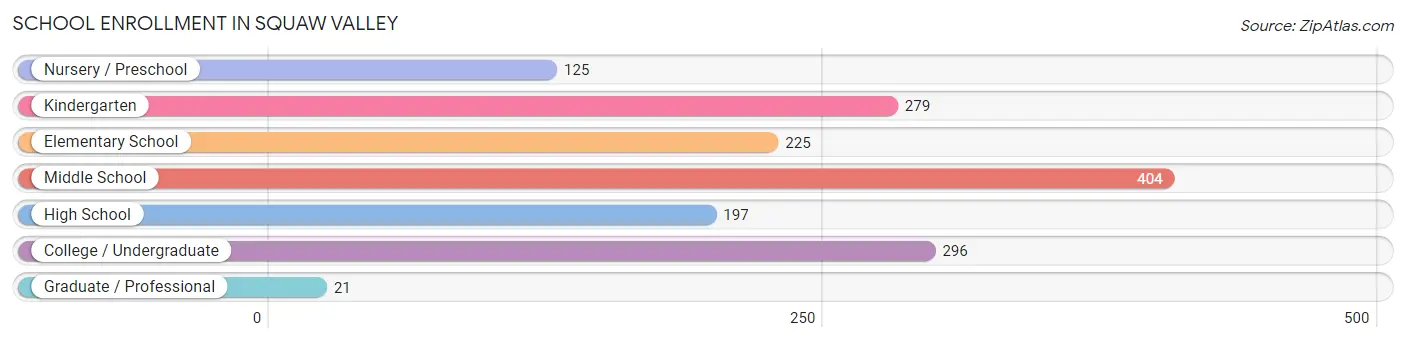
| School Level | # Students | % Students |
| Nursery / Preschool | 125 | 8.1% |
| Kindergarten | 279 | 18.0% |
| Elementary School | 225 | 14.5% |
| Middle School | 404 | 26.1% |
| High School | 197 | 12.7% |
| College / Undergraduate | 296 | 19.1% |
| Graduate / Professional | 21 | 1.4% |
| Total | 1,547 | 100.0% |
School Enrollment by Age by Funding Source in Squaw Valley
Out of a total of 1,547 students who are enrolled in schools in Squaw Valley, 521 (33.7%) attend a private institution, while the remaining 1,026 (66.3%) are enrolled in public schools. The age group of 18 to 19 year olds has the highest likelihood of being enrolled in private schools, with 11 (100.0% in the age bracket) enrolled. Conversely, the age group of 20 to 24 year olds has the lowest likelihood of being enrolled in a private school, with 140 (100.0% in the age bracket) attending a public institution.
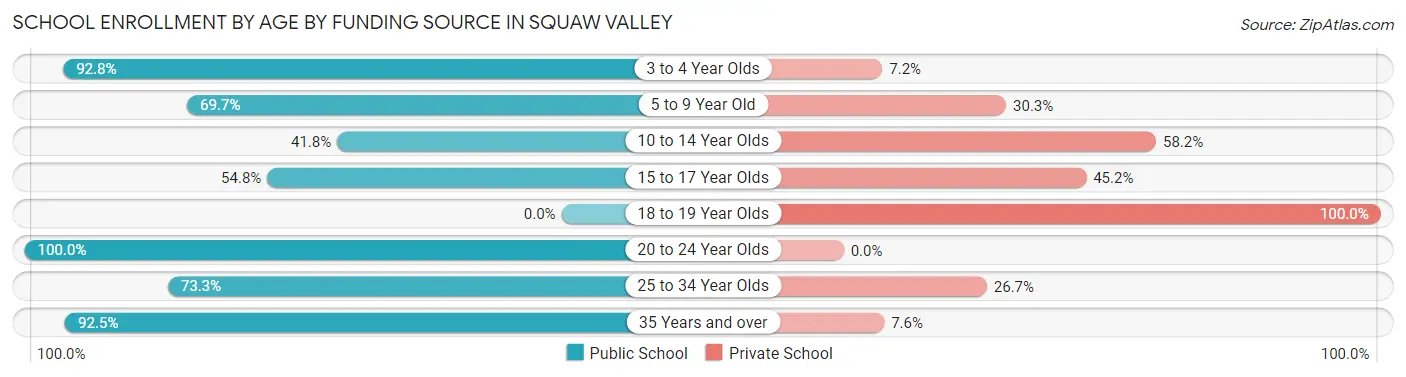
| Age Bracket | Public School | Private School |
| 3 to 4 Year Olds | 116 (92.8%) | 9 (7.2%) |
| 5 to 9 Year Old | 348 (69.7%) | 151 (30.3%) |
| 10 to 14 Year Olds | 171 (41.8%) | 238 (58.2%) |
| 15 to 17 Year Olds | 108 (54.8%) | 89 (45.2%) |
| 18 to 19 Year Olds | 0 (0.0%) | 11 (100.0%) |
| 20 to 24 Year Olds | 140 (100.0%) | 0 (0.0%) |
| 25 to 34 Year Olds | 44 (73.3%) | 16 (26.7%) |
| 35 Years and over | 98 (92.4%) | 8 (7.5%) |
| Total | 1,026 (66.3%) | 521 (33.7%) |
Educational Attainment by Field of Study in Squaw Valley
Bio, nature & agricultural (213 | 27.7%), science & technology (190 | 24.7%), business (136 | 17.7%), visual & performing arts (63 | 8.2%), and liberal arts & history (45 | 5.9%) are the most common fields of study among 769 individuals in Squaw Valley who have obtained a bachelor's degree or higher.
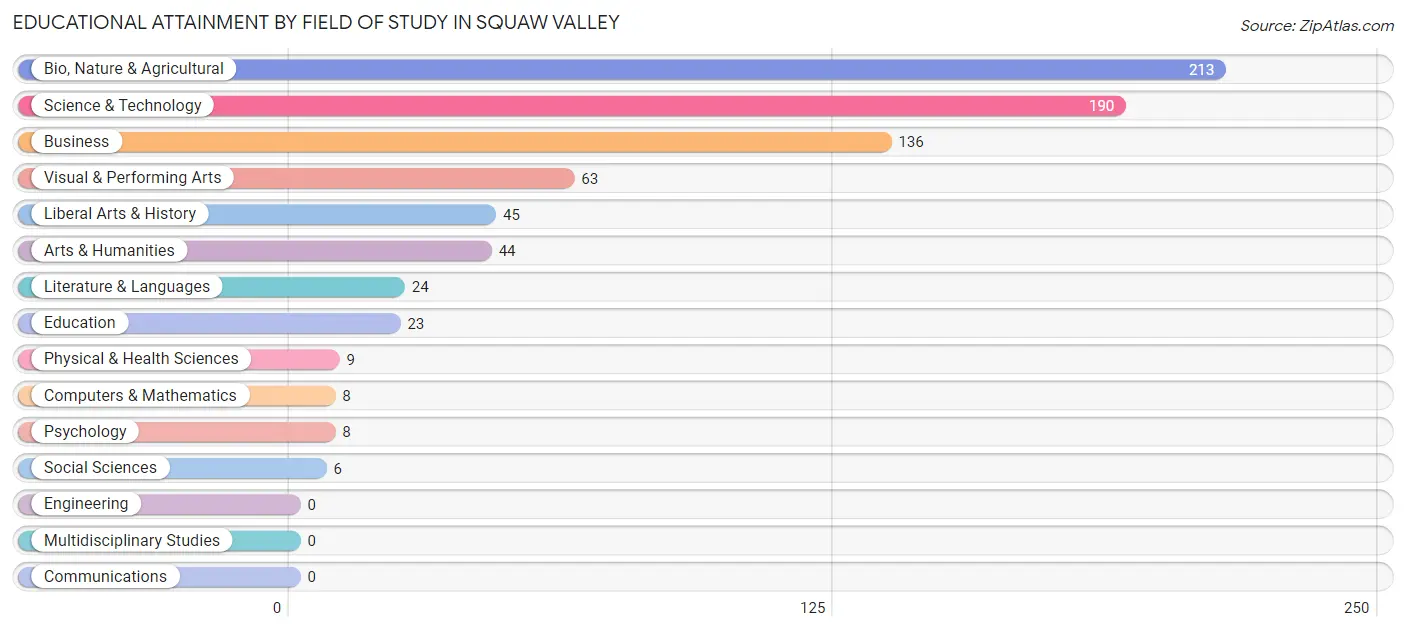
| Field of Study | # Graduates | % Graduates |
| Computers & Mathematics | 8 | 1.0% |
| Bio, Nature & Agricultural | 213 | 27.7% |
| Physical & Health Sciences | 9 | 1.2% |
| Psychology | 8 | 1.0% |
| Social Sciences | 6 | 0.8% |
| Engineering | 0 | 0.0% |
| Multidisciplinary Studies | 0 | 0.0% |
| Science & Technology | 190 | 24.7% |
| Business | 136 | 17.7% |
| Education | 23 | 3.0% |
| Literature & Languages | 24 | 3.1% |
| Liberal Arts & History | 45 | 5.9% |
| Visual & Performing Arts | 63 | 8.2% |
| Communications | 0 | 0.0% |
| Arts & Humanities | 44 | 5.7% |
| Total | 769 | 100.0% |
Transportation & Commute in Squaw Valley
Vehicle Availability by Sex in Squaw Valley
The most prevalent vehicle ownership categories in Squaw Valley are males with 4 vehicles (424, accounting for 45.0%) and females with 4 vehicles (57, making up 116.8%).
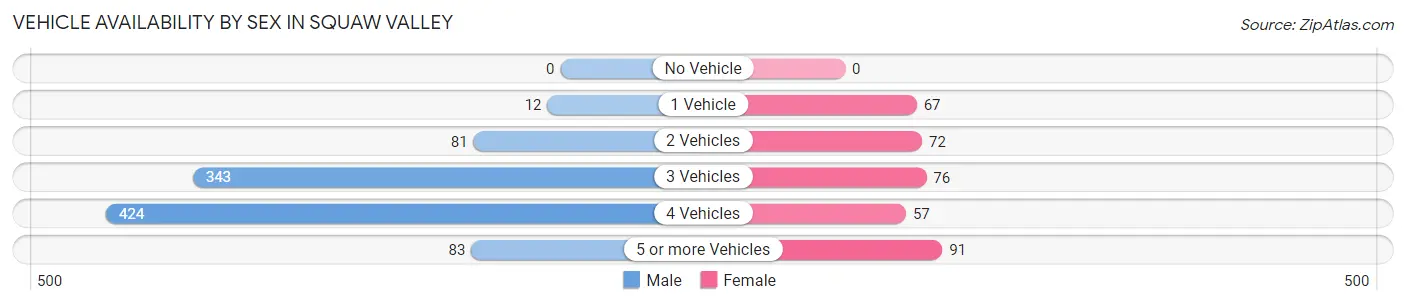
| Vehicles Available | Male | Female |
| No Vehicle | 0 (0.0%) | 0 (0.0%) |
| 1 Vehicle | 12 (1.3%) | 67 (18.5%) |
| 2 Vehicles | 81 (8.6%) | 72 (19.8%) |
| 3 Vehicles | 343 (36.4%) | 76 (20.9%) |
| 4 Vehicles | 424 (45.0%) | 57 (15.7%) |
| 5 or more Vehicles | 83 (8.8%) | 91 (25.1%) |
| Total | 943 (100.0%) | 363 (100.0%) |
Commute Time in Squaw Valley
The most frequently occuring commute durations in Squaw Valley are 45 to 59 minutes (377 commuters, 31.2%), 60 to 89 minutes (206 commuters, 17.1%), and 20 to 24 minutes (135 commuters, 11.2%).
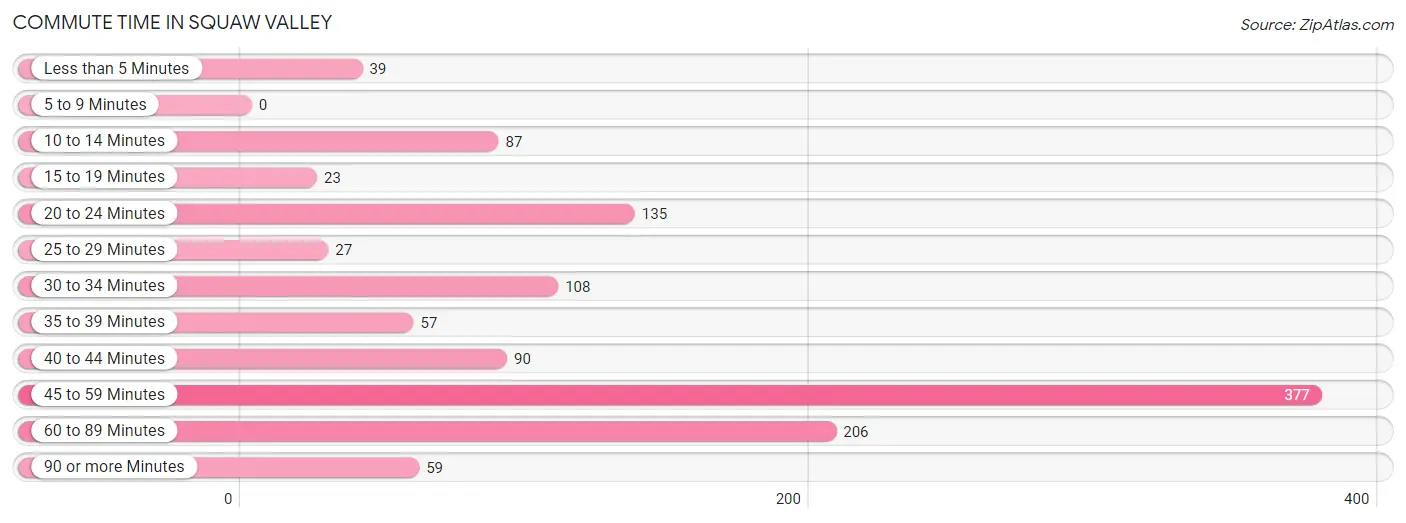
| Commute Time | # Commuters | % Commuters |
| Less than 5 Minutes | 39 | 3.2% |
| 5 to 9 Minutes | 0 | 0.0% |
| 10 to 14 Minutes | 87 | 7.2% |
| 15 to 19 Minutes | 23 | 1.9% |
| 20 to 24 Minutes | 135 | 11.2% |
| 25 to 29 Minutes | 27 | 2.2% |
| 30 to 34 Minutes | 108 | 8.9% |
| 35 to 39 Minutes | 57 | 4.7% |
| 40 to 44 Minutes | 90 | 7.4% |
| 45 to 59 Minutes | 377 | 31.2% |
| 60 to 89 Minutes | 206 | 17.1% |
| 90 or more Minutes | 59 | 4.9% |
Commute Time by Sex in Squaw Valley
The most common commute times in Squaw Valley are 45 to 59 minutes (284 commuters, 33.0%) for males and 45 to 59 minutes (93 commuters, 26.8%) for females.
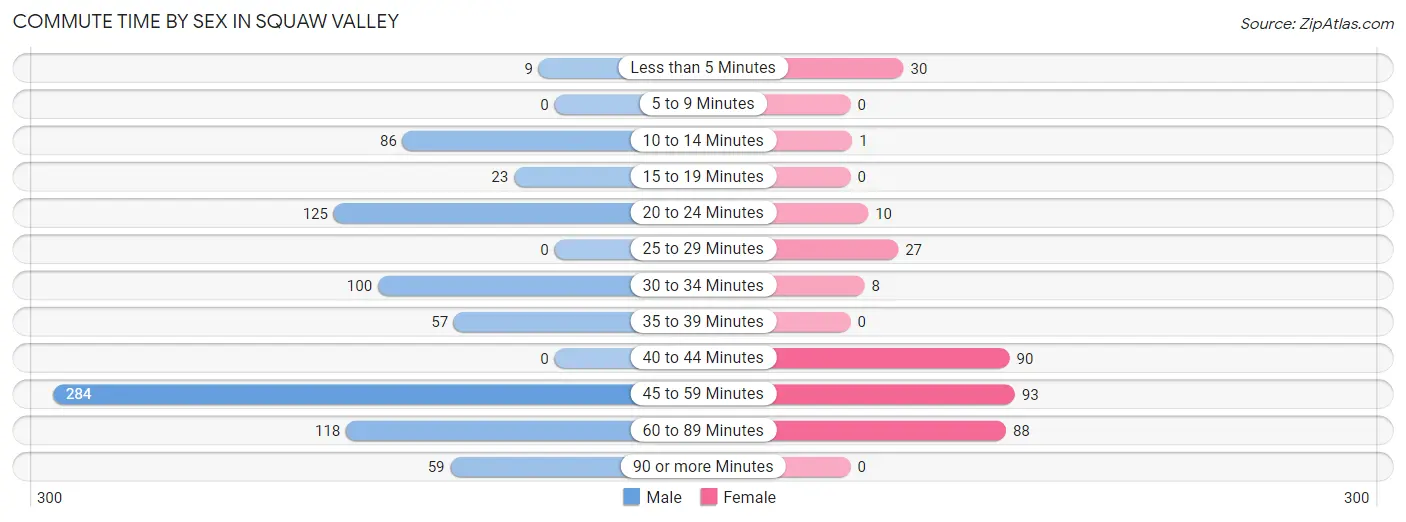
| Commute Time | Male | Female |
| Less than 5 Minutes | 9 (1.1%) | 30 (8.6%) |
| 5 to 9 Minutes | 0 (0.0%) | 0 (0.0%) |
| 10 to 14 Minutes | 86 (10.0%) | 1 (0.3%) |
| 15 to 19 Minutes | 23 (2.7%) | 0 (0.0%) |
| 20 to 24 Minutes | 125 (14.5%) | 10 (2.9%) |
| 25 to 29 Minutes | 0 (0.0%) | 27 (7.8%) |
| 30 to 34 Minutes | 100 (11.6%) | 8 (2.3%) |
| 35 to 39 Minutes | 57 (6.6%) | 0 (0.0%) |
| 40 to 44 Minutes | 0 (0.0%) | 90 (25.9%) |
| 45 to 59 Minutes | 284 (33.0%) | 93 (26.8%) |
| 60 to 89 Minutes | 118 (13.7%) | 88 (25.4%) |
| 90 or more Minutes | 59 (6.9%) | 0 (0.0%) |
Time of Departure to Work by Sex in Squaw Valley
The most frequent times of departure to work in Squaw Valley are 7:30 AM to 7:59 AM (246, 28.6%) for males and 6:00 AM to 6:29 AM (86, 24.8%) for females.
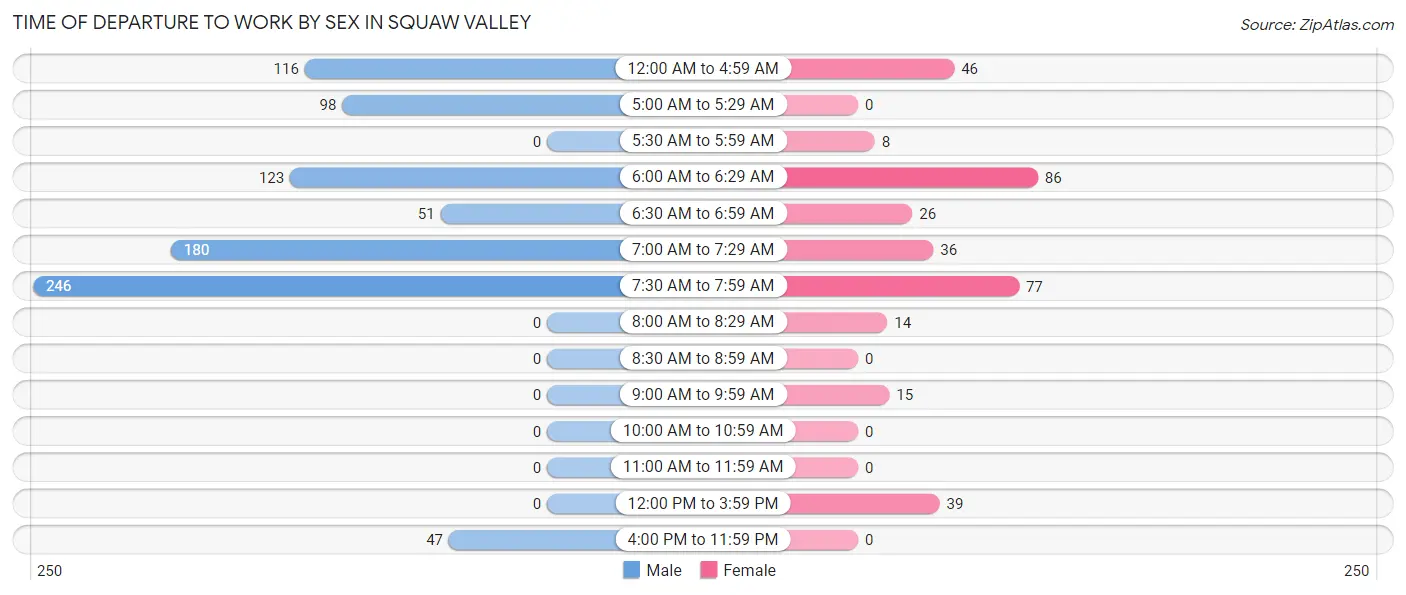
| Time of Departure | Male | Female |
| 12:00 AM to 4:59 AM | 116 (13.5%) | 46 (13.3%) |
| 5:00 AM to 5:29 AM | 98 (11.4%) | 0 (0.0%) |
| 5:30 AM to 5:59 AM | 0 (0.0%) | 8 (2.3%) |
| 6:00 AM to 6:29 AM | 123 (14.3%) | 86 (24.8%) |
| 6:30 AM to 6:59 AM | 51 (5.9%) | 26 (7.5%) |
| 7:00 AM to 7:29 AM | 180 (20.9%) | 36 (10.4%) |
| 7:30 AM to 7:59 AM | 246 (28.6%) | 77 (22.2%) |
| 8:00 AM to 8:29 AM | 0 (0.0%) | 14 (4.0%) |
| 8:30 AM to 8:59 AM | 0 (0.0%) | 0 (0.0%) |
| 9:00 AM to 9:59 AM | 0 (0.0%) | 15 (4.3%) |
| 10:00 AM to 10:59 AM | 0 (0.0%) | 0 (0.0%) |
| 11:00 AM to 11:59 AM | 0 (0.0%) | 0 (0.0%) |
| 12:00 PM to 3:59 PM | 0 (0.0%) | 39 (11.2%) |
| 4:00 PM to 11:59 PM | 47 (5.5%) | 0 (0.0%) |
| Total | 861 (100.0%) | 347 (100.0%) |
Housing Occupancy in Squaw Valley
Occupancy by Ownership in Squaw Valley
Of the total 1,271 dwellings in Squaw Valley, owner-occupied units account for 1,000 (78.7%), while renter-occupied units make up 271 (21.3%).
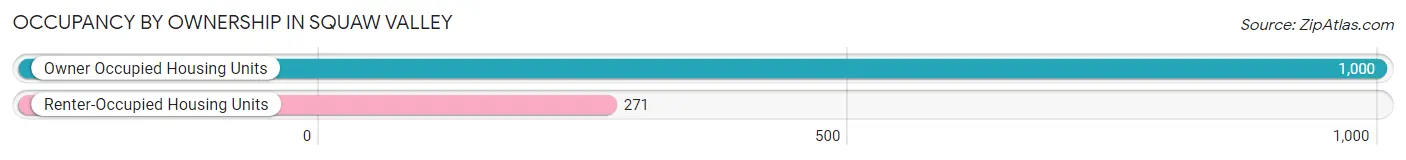
| Occupancy | # Housing Units | % Housing Units |
| Owner Occupied Housing Units | 1,000 | 78.7% |
| Renter-Occupied Housing Units | 271 | 21.3% |
| Total Occupied Housing Units | 1,271 | 100.0% |
Occupancy by Household Size in Squaw Valley
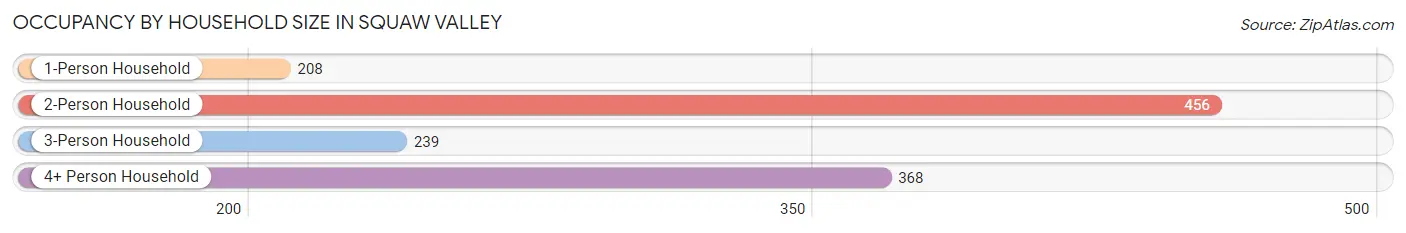
| Household Size | # Housing Units | % Housing Units |
| 1-Person Household | 208 | 16.4% |
| 2-Person Household | 456 | 35.9% |
| 3-Person Household | 239 | 18.8% |
| 4+ Person Household | 368 | 28.9% |
| Total Housing Units | 1,271 | 100.0% |
Occupancy by Ownership by Household Size in Squaw Valley
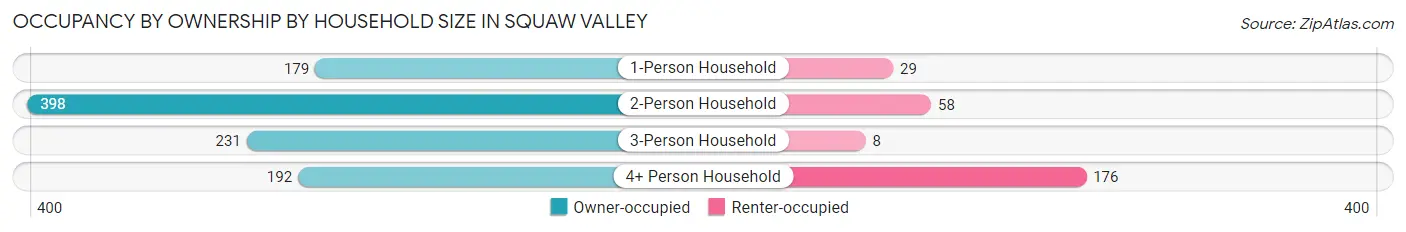
| Household Size | Owner-occupied | Renter-occupied |
| 1-Person Household | 179 (86.1%) | 29 (13.9%) |
| 2-Person Household | 398 (87.3%) | 58 (12.7%) |
| 3-Person Household | 231 (96.7%) | 8 (3.4%) |
| 4+ Person Household | 192 (52.2%) | 176 (47.8%) |
| Total Housing Units | 1,000 (78.7%) | 271 (21.3%) |
Occupancy by Educational Attainment in Squaw Valley
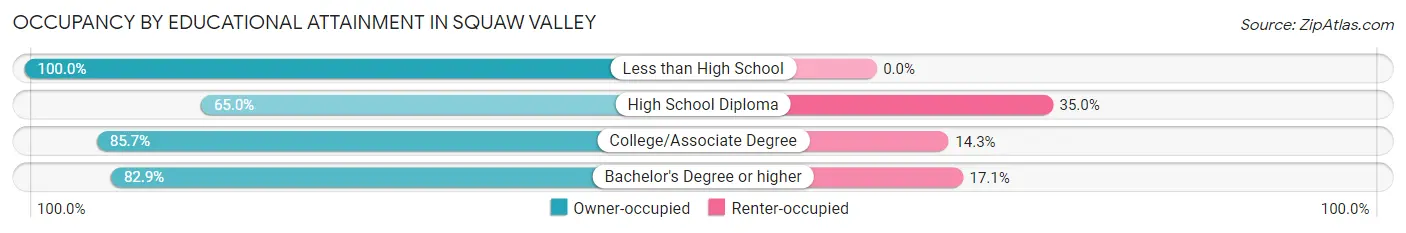
| Household Size | Owner-occupied | Renter-occupied |
| Less than High School | 60 (100.0%) | 0 (0.0%) |
| High School Diploma | 279 (65.0%) | 150 (35.0%) |
| College/Associate Degree | 395 (85.7%) | 66 (14.3%) |
| Bachelor's Degree or higher | 266 (82.9%) | 55 (17.1%) |
Occupancy by Age of Householder in Squaw Valley
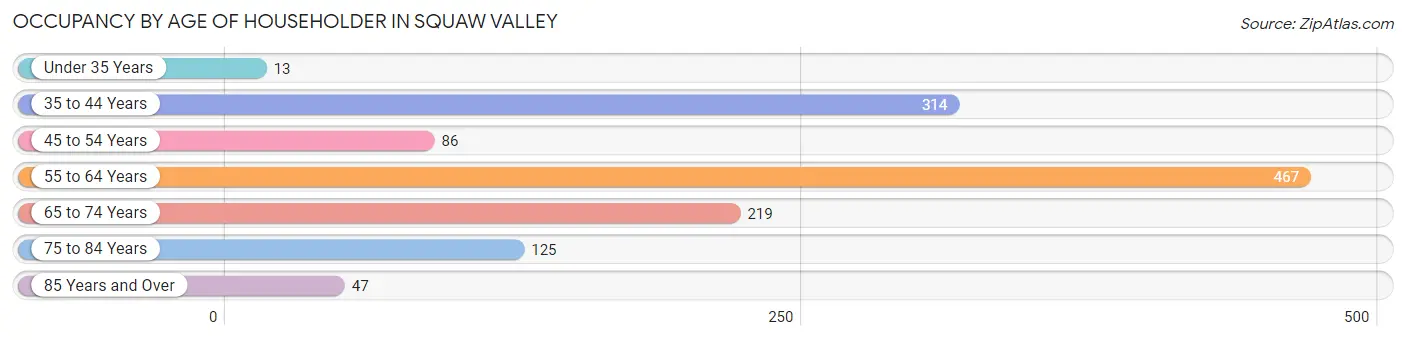
| Age Bracket | # Households | % Households |
| Under 35 Years | 13 | 1.0% |
| 35 to 44 Years | 314 | 24.7% |
| 45 to 54 Years | 86 | 6.8% |
| 55 to 64 Years | 467 | 36.7% |
| 65 to 74 Years | 219 | 17.2% |
| 75 to 84 Years | 125 | 9.8% |
| 85 Years and Over | 47 | 3.7% |
| Total | 1,271 | 100.0% |
Housing Finances in Squaw Valley
Median Income by Occupancy in Squaw Valley
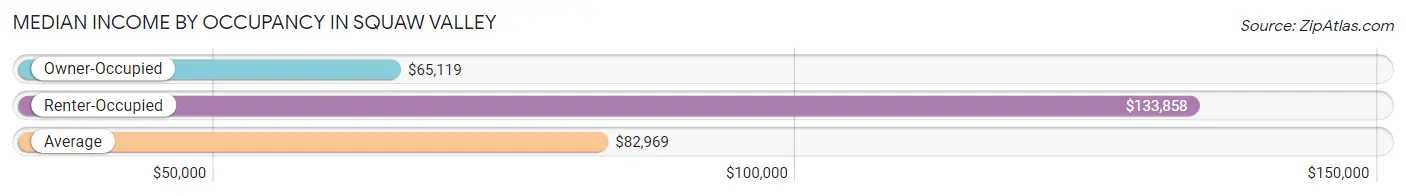
| Occupancy Type | # Households | Median Income |
| Owner-Occupied | 1,000 (78.7%) | $65,119 |
| Renter-Occupied | 271 (21.3%) | $133,858 |
| Average | 1,271 (100.0%) | $82,969 |
Occupancy by Householder Income Bracket in Squaw Valley
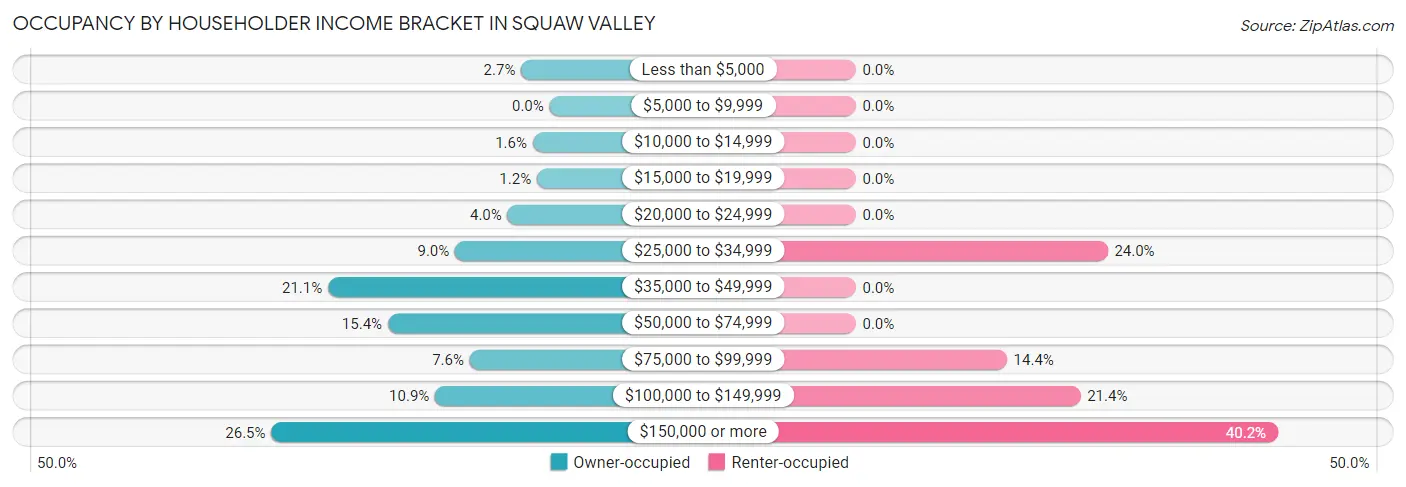
| Income Bracket | Owner-occupied | Renter-occupied |
| Less than $5,000 | 27 (2.7%) | 0 (0.0%) |
| $5,000 to $9,999 | 0 (0.0%) | 0 (0.0%) |
| $10,000 to $14,999 | 16 (1.6%) | 0 (0.0%) |
| $15,000 to $19,999 | 12 (1.2%) | 0 (0.0%) |
| $20,000 to $24,999 | 40 (4.0%) | 0 (0.0%) |
| $25,000 to $34,999 | 90 (9.0%) | 65 (24.0%) |
| $35,000 to $49,999 | 211 (21.1%) | 0 (0.0%) |
| $50,000 to $74,999 | 154 (15.4%) | 0 (0.0%) |
| $75,000 to $99,999 | 76 (7.6%) | 39 (14.4%) |
| $100,000 to $149,999 | 109 (10.9%) | 58 (21.4%) |
| $150,000 or more | 265 (26.5%) | 109 (40.2%) |
| Total | 1,000 (100.0%) | 271 (100.0%) |
Monthly Housing Cost Tiers in Squaw Valley
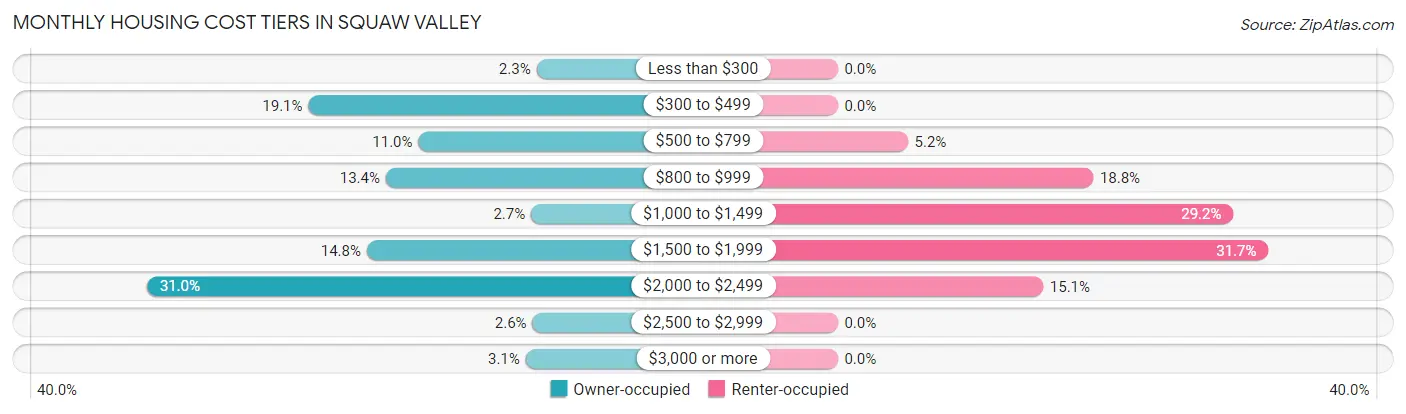
| Monthly Cost | Owner-occupied | Renter-occupied |
| Less than $300 | 23 (2.3%) | 0 (0.0%) |
| $300 to $499 | 191 (19.1%) | 0 (0.0%) |
| $500 to $799 | 110 (11.0%) | 14 (5.2%) |
| $800 to $999 | 134 (13.4%) | 51 (18.8%) |
| $1,000 to $1,499 | 27 (2.7%) | 79 (29.1%) |
| $1,500 to $1,999 | 148 (14.8%) | 86 (31.7%) |
| $2,000 to $2,499 | 310 (31.0%) | 41 (15.1%) |
| $2,500 to $2,999 | 26 (2.6%) | 0 (0.0%) |
| $3,000 or more | 31 (3.1%) | 0 (0.0%) |
| Total | 1,000 (100.0%) | 271 (100.0%) |
Physical Housing Characteristics in Squaw Valley
Housing Structures in Squaw Valley
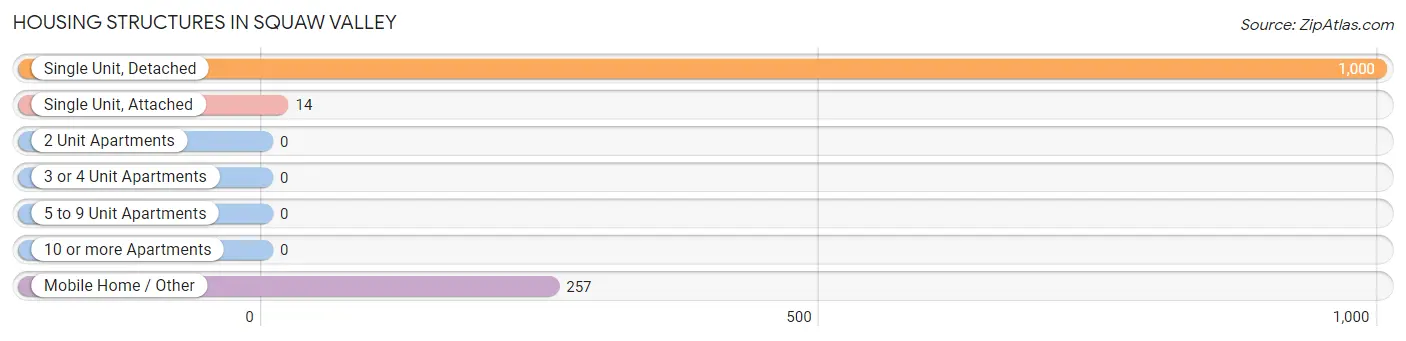
| Structure Type | # Housing Units | % Housing Units |
| Single Unit, Detached | 1,000 | 78.7% |
| Single Unit, Attached | 14 | 1.1% |
| 2 Unit Apartments | 0 | 0.0% |
| 3 or 4 Unit Apartments | 0 | 0.0% |
| 5 to 9 Unit Apartments | 0 | 0.0% |
| 10 or more Apartments | 0 | 0.0% |
| Mobile Home / Other | 257 | 20.2% |
| Total | 1,271 | 100.0% |
Housing Structures by Occupancy in Squaw Valley
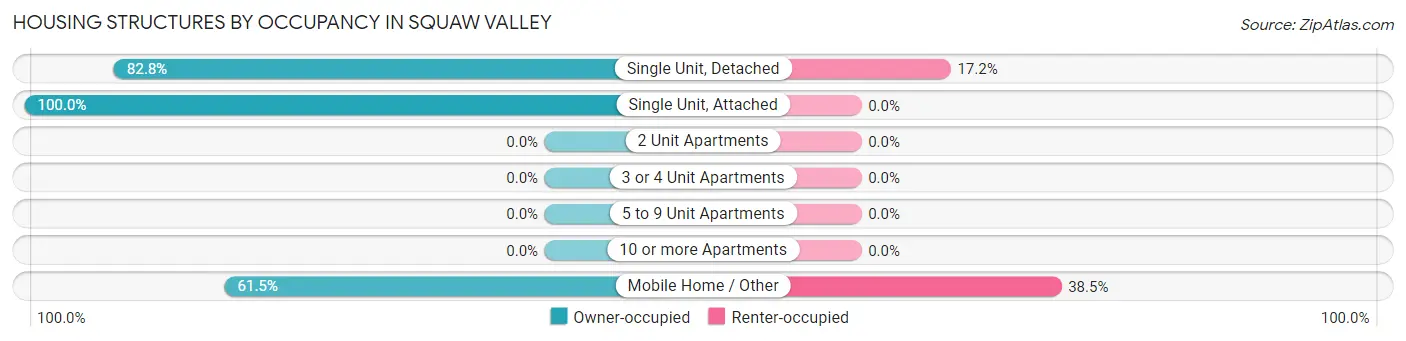
| Structure Type | Owner-occupied | Renter-occupied |
| Single Unit, Detached | 828 (82.8%) | 172 (17.2%) |
| Single Unit, Attached | 14 (100.0%) | 0 (0.0%) |
| 2 Unit Apartments | 0 (0.0%) | 0 (0.0%) |
| 3 or 4 Unit Apartments | 0 (0.0%) | 0 (0.0%) |
| 5 to 9 Unit Apartments | 0 (0.0%) | 0 (0.0%) |
| 10 or more Apartments | 0 (0.0%) | 0 (0.0%) |
| Mobile Home / Other | 158 (61.5%) | 99 (38.5%) |
| Total | 1,000 (78.7%) | 271 (21.3%) |
Housing Structures by Number of Rooms in Squaw Valley
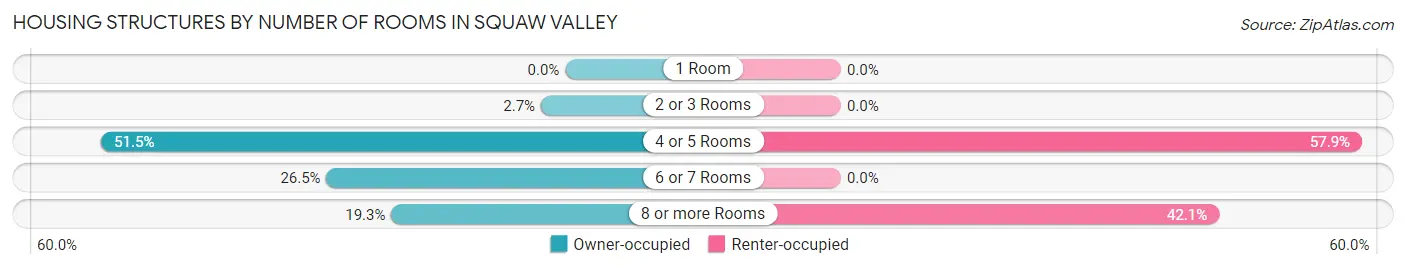
| Number of Rooms | Owner-occupied | Renter-occupied |
| 1 Room | 0 (0.0%) | 0 (0.0%) |
| 2 or 3 Rooms | 27 (2.7%) | 0 (0.0%) |
| 4 or 5 Rooms | 515 (51.5%) | 157 (57.9%) |
| 6 or 7 Rooms | 265 (26.5%) | 0 (0.0%) |
| 8 or more Rooms | 193 (19.3%) | 114 (42.1%) |
| Total | 1,000 (100.0%) | 271 (100.0%) |
Housing Structure by Heating Type in Squaw Valley
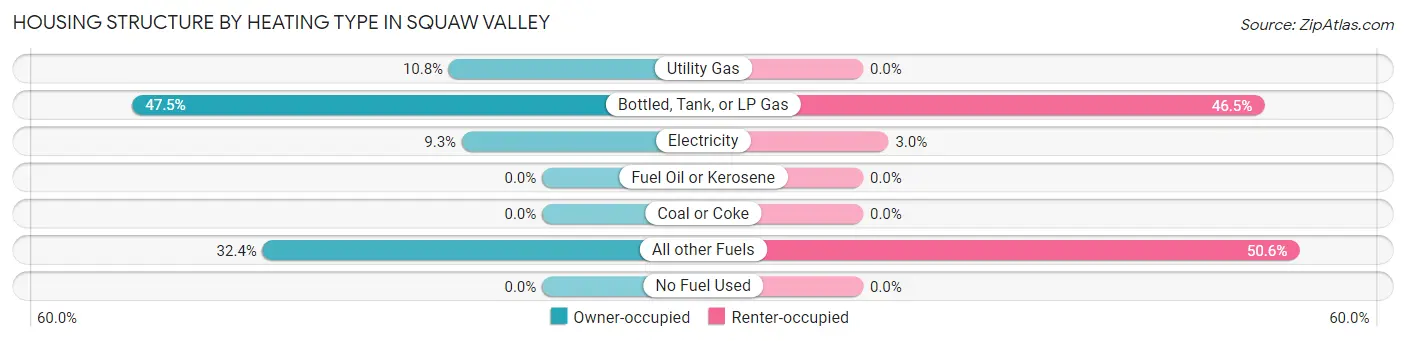
| Heating Type | Owner-occupied | Renter-occupied |
| Utility Gas | 108 (10.8%) | 0 (0.0%) |
| Bottled, Tank, or LP Gas | 475 (47.5%) | 126 (46.5%) |
| Electricity | 93 (9.3%) | 8 (2.9%) |
| Fuel Oil or Kerosene | 0 (0.0%) | 0 (0.0%) |
| Coal or Coke | 0 (0.0%) | 0 (0.0%) |
| All other Fuels | 324 (32.4%) | 137 (50.5%) |
| No Fuel Used | 0 (0.0%) | 0 (0.0%) |
| Total | 1,000 (100.0%) | 271 (100.0%) |
Household Vehicle Usage in Squaw Valley
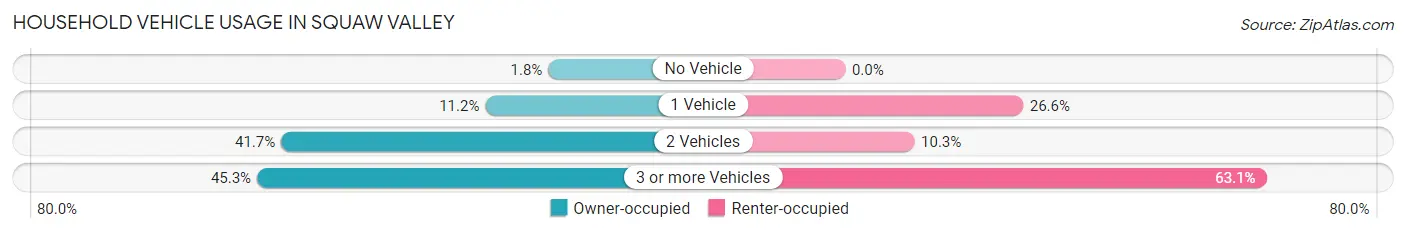
| Vehicles per Household | Owner-occupied | Renter-occupied |
| No Vehicle | 18 (1.8%) | 0 (0.0%) |
| 1 Vehicle | 112 (11.2%) | 72 (26.6%) |
| 2 Vehicles | 417 (41.7%) | 28 (10.3%) |
| 3 or more Vehicles | 453 (45.3%) | 171 (63.1%) |
| Total | 1,000 (100.0%) | 271 (100.0%) |
Real Estate & Mortgages in Squaw Valley
Real Estate and Mortgage Overview in Squaw Valley
| Characteristic | Without Mortgage | With Mortgage |
| Housing Units | 439 | 561 |
| Median Property Value | $281,400 | $291,600 |
| Median Household Income | $64,934 | $144 |
| Monthly Housing Costs | $515 | $31 |
| Real Estate Taxes | $1,856 | $0 |
Property Value by Mortgage Status in Squaw Valley
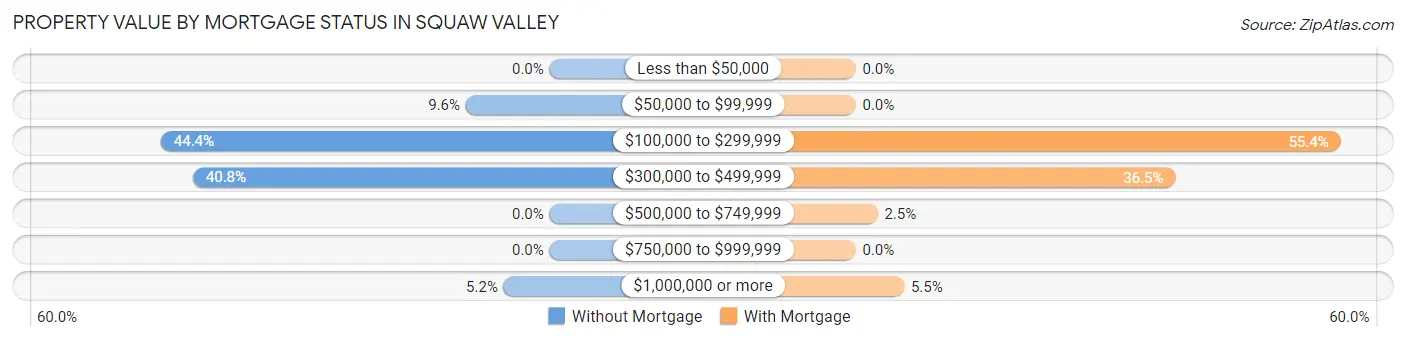
| Property Value | Without Mortgage | With Mortgage |
| Less than $50,000 | 0 (0.0%) | 0 (0.0%) |
| $50,000 to $99,999 | 42 (9.6%) | 0 (0.0%) |
| $100,000 to $299,999 | 195 (44.4%) | 311 (55.4%) |
| $300,000 to $499,999 | 179 (40.8%) | 205 (36.5%) |
| $500,000 to $749,999 | 0 (0.0%) | 14 (2.5%) |
| $750,000 to $999,999 | 0 (0.0%) | 0 (0.0%) |
| $1,000,000 or more | 23 (5.2%) | 31 (5.5%) |
| Total | 439 (100.0%) | 561 (100.0%) |
Household Income by Mortgage Status in Squaw Valley
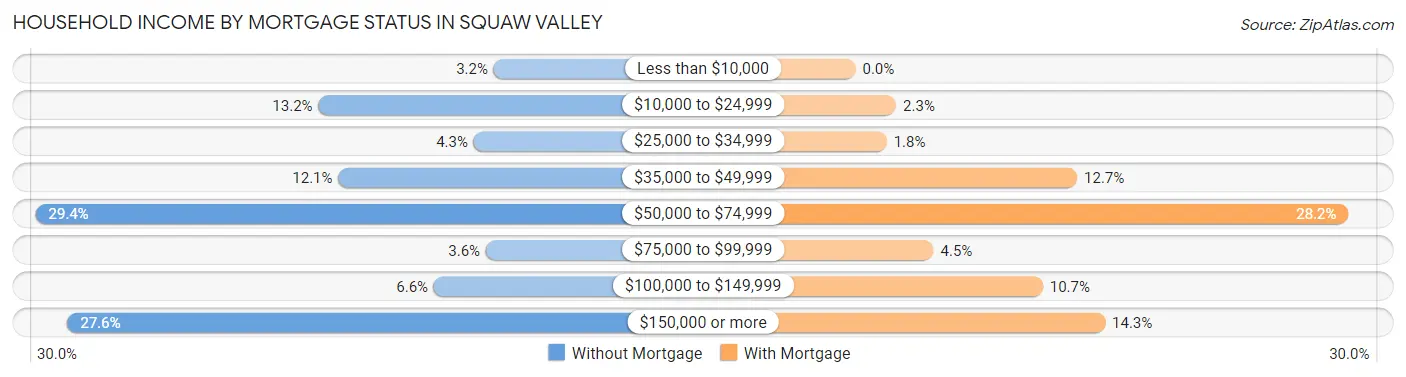
| Household Income | Without Mortgage | With Mortgage |
| Less than $10,000 | 14 (3.2%) | 0 (0.0%) |
| $10,000 to $24,999 | 58 (13.2%) | 13 (2.3%) |
| $25,000 to $34,999 | 19 (4.3%) | 10 (1.8%) |
| $35,000 to $49,999 | 53 (12.1%) | 71 (12.7%) |
| $50,000 to $74,999 | 129 (29.4%) | 158 (28.2%) |
| $75,000 to $99,999 | 16 (3.6%) | 25 (4.5%) |
| $100,000 to $149,999 | 29 (6.6%) | 60 (10.7%) |
| $150,000 or more | 121 (27.6%) | 80 (14.3%) |
| Total | 439 (100.0%) | 561 (100.0%) |
Property Value to Household Income Ratio in Squaw Valley
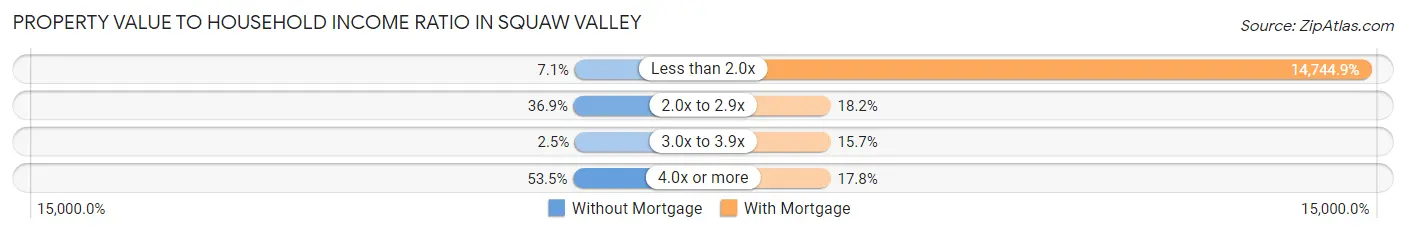
| Value-to-Income Ratio | Without Mortgage | With Mortgage |
| Less than 2.0x | 31 (7.1%) | 82,719 (14,744.9%) |
| 2.0x to 2.9x | 162 (36.9%) | 102 (18.2%) |
| 3.0x to 3.9x | 11 (2.5%) | 88 (15.7%) |
| 4.0x or more | 235 (53.5%) | 100 (17.8%) |
| Total | 439 (100.0%) | 561 (100.0%) |
Real Estate Taxes by Mortgage Status in Squaw Valley
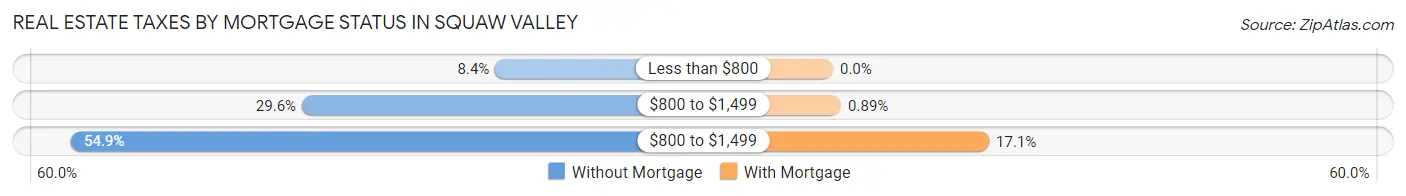
| Property Taxes | Without Mortgage | With Mortgage |
| Less than $800 | 37 (8.4%) | 0 (0.0%) |
| $800 to $1,499 | 130 (29.6%) | 5 (0.9%) |
| $800 to $1,499 | 241 (54.9%) | 96 (17.1%) |
| Total | 439 (100.0%) | 561 (100.0%) |
Health & Disability in Squaw Valley
Health Insurance Coverage by Age in Squaw Valley
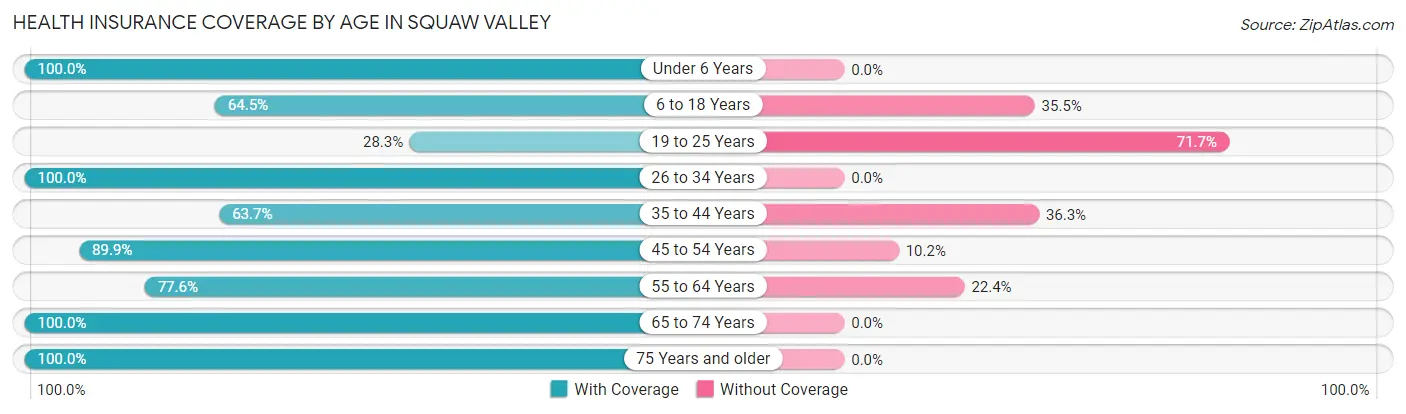
| Age Bracket | With Coverage | Without Coverage |
| Under 6 Years | 472 (100.0%) | 0 (0.0%) |
| 6 to 18 Years | 674 (64.5%) | 371 (35.5%) |
| 19 to 25 Years | 92 (28.3%) | 233 (71.7%) |
| 26 to 34 Years | 310 (100.0%) | 0 (0.0%) |
| 35 to 44 Years | 358 (63.7%) | 204 (36.3%) |
| 45 to 54 Years | 177 (89.8%) | 20 (10.2%) |
| 55 to 64 Years | 637 (77.6%) | 184 (22.4%) |
| 65 to 74 Years | 567 (100.0%) | 0 (0.0%) |
| 75 Years and older | 269 (100.0%) | 0 (0.0%) |
| Total | 3,556 (77.8%) | 1,012 (22.2%) |
Health Insurance Coverage by Citizenship Status in Squaw Valley
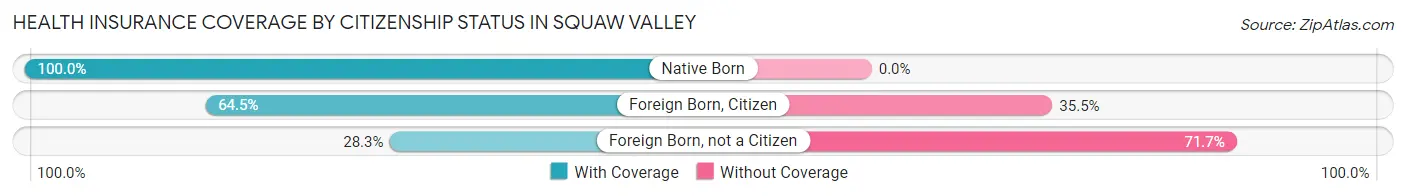
| Citizenship Status | With Coverage | Without Coverage |
| Native Born | 472 (100.0%) | 0 (0.0%) |
| Foreign Born, Citizen | 674 (64.5%) | 371 (35.5%) |
| Foreign Born, not a Citizen | 92 (28.3%) | 233 (71.7%) |
Health Insurance Coverage by Household Income in Squaw Valley
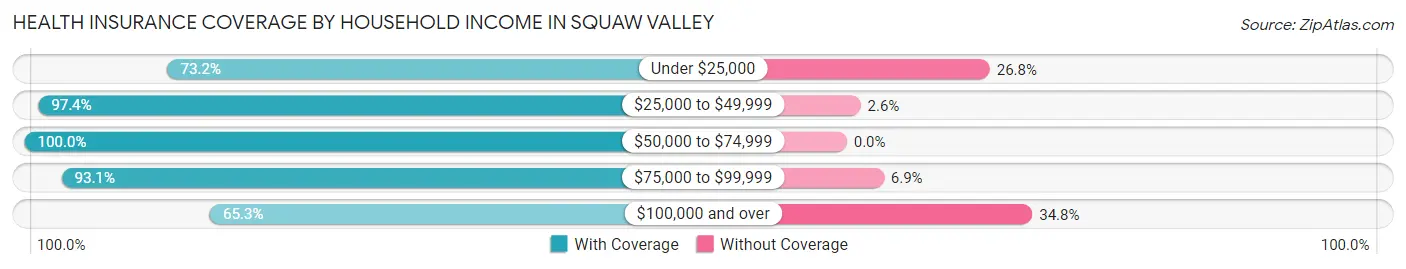
| Household Income | With Coverage | Without Coverage |
| Under $25,000 | 123 (73.2%) | 45 (26.8%) |
| $25,000 to $49,999 | 902 (97.4%) | 24 (2.6%) |
| $50,000 to $74,999 | 260 (100.0%) | 0 (0.0%) |
| $75,000 to $99,999 | 577 (93.1%) | 43 (6.9%) |
| $100,000 and over | 1,690 (65.2%) | 900 (34.7%) |
Public vs Private Health Insurance Coverage by Age in Squaw Valley
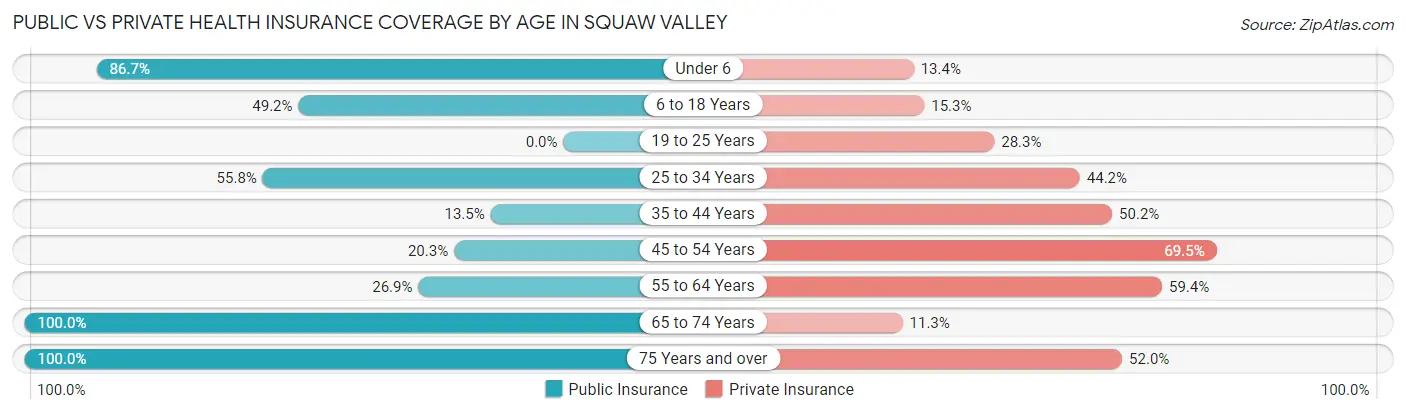
| Age Bracket | Public Insurance | Private Insurance |
| Under 6 | 409 (86.7%) | 63 (13.4%) |
| 6 to 18 Years | 514 (49.2%) | 160 (15.3%) |
| 19 to 25 Years | 0 (0.0%) | 92 (28.3%) |
| 25 to 34 Years | 173 (55.8%) | 137 (44.2%) |
| 35 to 44 Years | 76 (13.5%) | 282 (50.2%) |
| 45 to 54 Years | 40 (20.3%) | 137 (69.5%) |
| 55 to 64 Years | 221 (26.9%) | 488 (59.4%) |
| 65 to 74 Years | 567 (100.0%) | 64 (11.3%) |
| 75 Years and over | 269 (100.0%) | 140 (52.0%) |
| Total | 2,269 (49.7%) | 1,563 (34.2%) |
Disability Status by Sex by Age in Squaw Valley
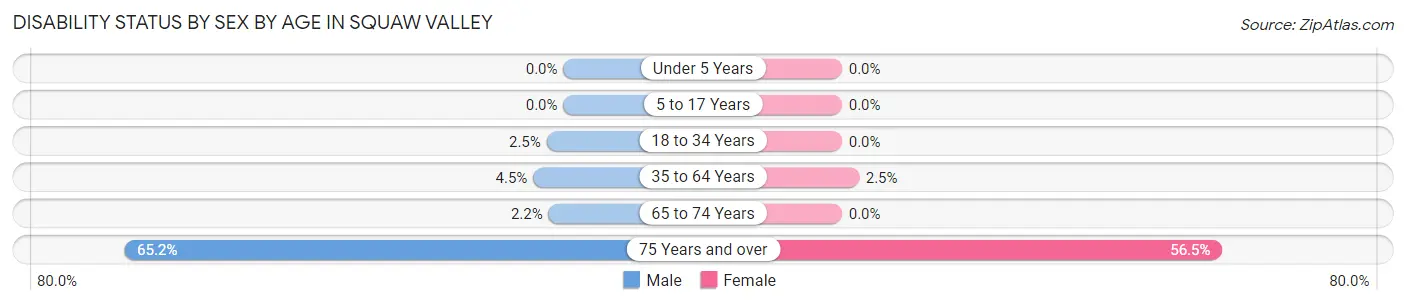
| Age Bracket | Male | Female |
| Under 5 Years | 0 (0.0%) | 0 (0.0%) |
| 5 to 17 Years | 0 (0.0%) | 0 (0.0%) |
| 18 to 34 Years | 13 (2.5%) | 0 (0.0%) |
| 35 to 64 Years | 30 (4.5%) | 23 (2.5%) |
| 65 to 74 Years | 9 (2.2%) | 0 (0.0%) |
| 75 Years and over | 60 (65.2%) | 100 (56.5%) |
Disability Class by Sex by Age in Squaw Valley
Disability Class: Hearing Difficulty
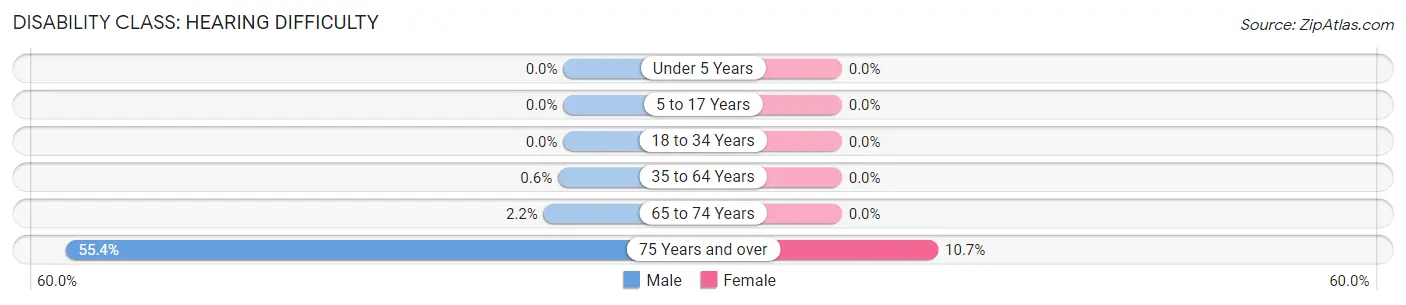
| Age Bracket | Male | Female |
| Under 5 Years | 0 (0.0%) | 0 (0.0%) |
| 5 to 17 Years | 0 (0.0%) | 0 (0.0%) |
| 18 to 34 Years | 0 (0.0%) | 0 (0.0%) |
| 35 to 64 Years | 4 (0.6%) | 0 (0.0%) |
| 65 to 74 Years | 9 (2.2%) | 0 (0.0%) |
| 75 Years and over | 51 (55.4%) | 19 (10.7%) |
Disability Class: Vision Difficulty
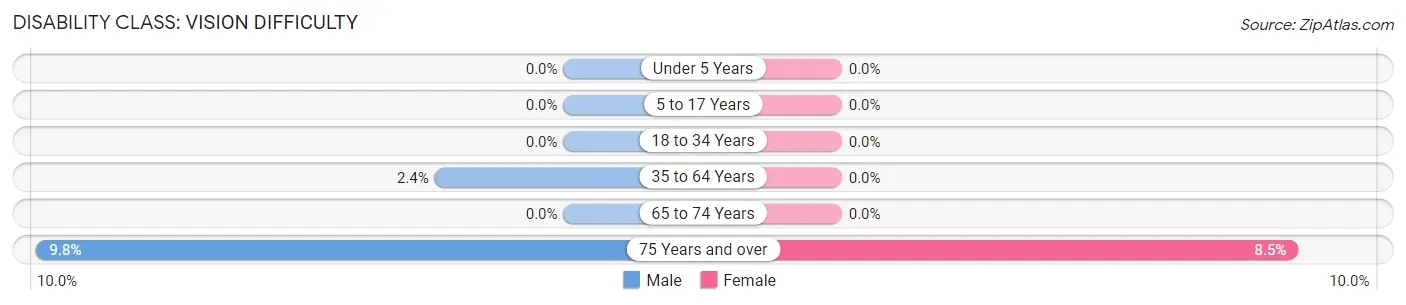
| Age Bracket | Male | Female |
| Under 5 Years | 0 (0.0%) | 0 (0.0%) |
| 5 to 17 Years | 0 (0.0%) | 0 (0.0%) |
| 18 to 34 Years | 0 (0.0%) | 0 (0.0%) |
| 35 to 64 Years | 16 (2.4%) | 0 (0.0%) |
| 65 to 74 Years | 0 (0.0%) | 0 (0.0%) |
| 75 Years and over | 9 (9.8%) | 15 (8.5%) |
Disability Class: Cognitive Difficulty
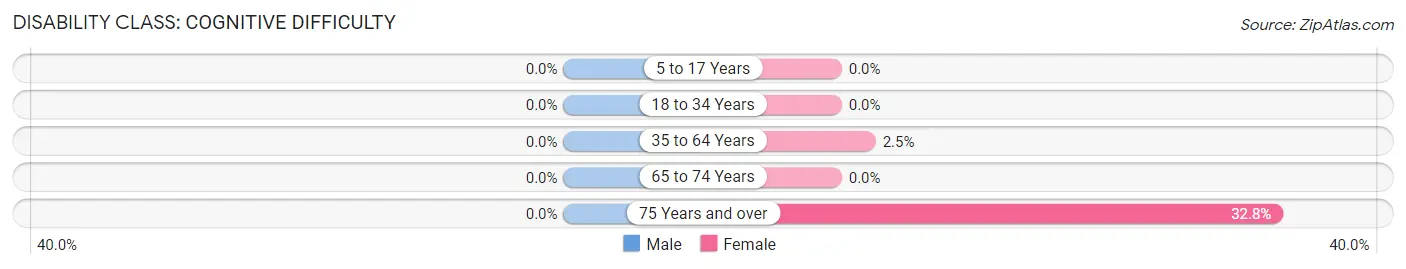
| Age Bracket | Male | Female |
| 5 to 17 Years | 0 (0.0%) | 0 (0.0%) |
| 18 to 34 Years | 0 (0.0%) | 0 (0.0%) |
| 35 to 64 Years | 0 (0.0%) | 23 (2.5%) |
| 65 to 74 Years | 0 (0.0%) | 0 (0.0%) |
| 75 Years and over | 0 (0.0%) | 58 (32.8%) |
Disability Class: Ambulatory Difficulty
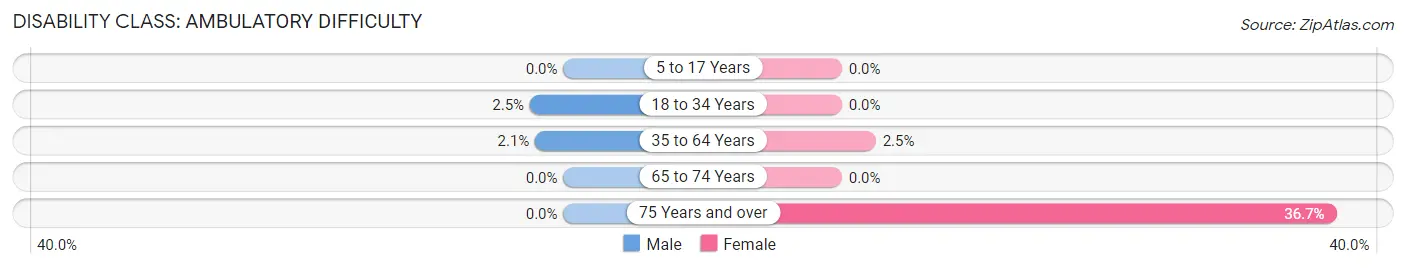
| Age Bracket | Male | Female |
| 5 to 17 Years | 0 (0.0%) | 0 (0.0%) |
| 18 to 34 Years | 13 (2.5%) | 0 (0.0%) |
| 35 to 64 Years | 14 (2.1%) | 23 (2.5%) |
| 65 to 74 Years | 0 (0.0%) | 0 (0.0%) |
| 75 Years and over | 0 (0.0%) | 65 (36.7%) |
Disability Class: Self-Care Difficulty
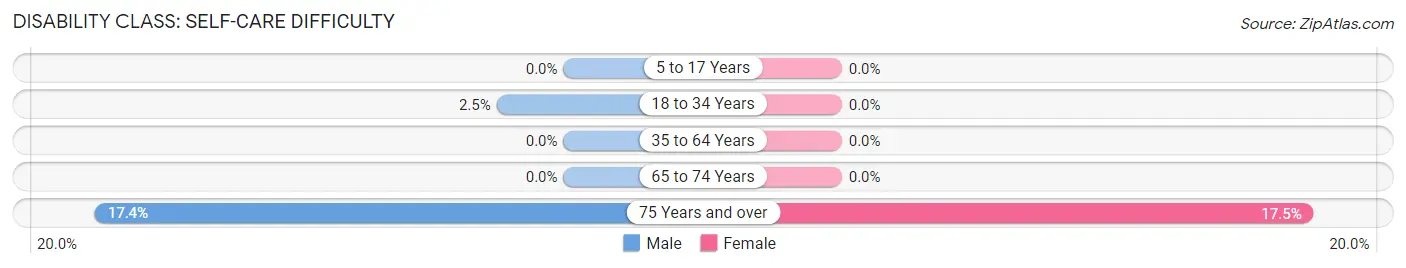
| Age Bracket | Male | Female |
| 5 to 17 Years | 0 (0.0%) | 0 (0.0%) |
| 18 to 34 Years | 13 (2.5%) | 0 (0.0%) |
| 35 to 64 Years | 0 (0.0%) | 0 (0.0%) |
| 65 to 74 Years | 0 (0.0%) | 0 (0.0%) |
| 75 Years and over | 16 (17.4%) | 31 (17.5%) |
Technology Access in Squaw Valley
Computing Device Access in Squaw Valley
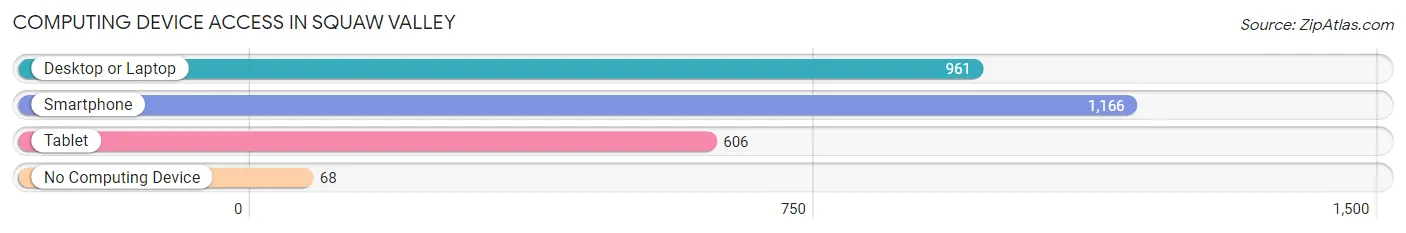
| Device Type | # Households | % Households |
| Desktop or Laptop | 961 | 75.6% |
| Smartphone | 1,166 | 91.7% |
| Tablet | 606 | 47.7% |
| No Computing Device | 68 | 5.3% |
| Total | 1,271 | 100.0% |
Internet Access in Squaw Valley
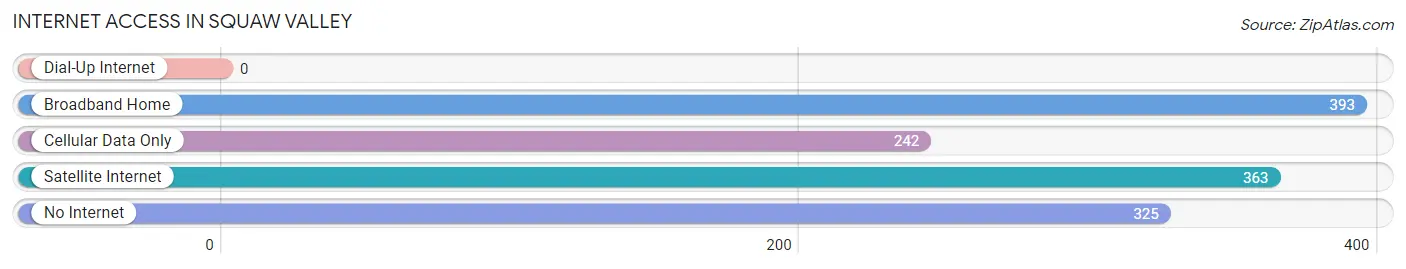
| Internet Type | # Households | % Households |
| Dial-Up Internet | 0 | 0.0% |
| Broadband Home | 393 | 30.9% |
| Cellular Data Only | 242 | 19.0% |
| Satellite Internet | 363 | 28.6% |
| No Internet | 325 | 25.6% |
| Total | 1,271 | 100.0% |
Squaw Valley Summary
Squaw Valley is a small mountain resort community located in Placer County, California, United States. It is situated in the Sierra Nevada mountain range, approximately 6 miles (9.7 km) northwest of the city of Truckee and 18 miles (29 km) west of the Nevada state line. The area is known for its skiing and snowboarding, and is home to the Squaw Valley Ski Resort, which hosted the 1960 Winter Olympics.
History
The area now known as Squaw Valley was originally inhabited by the Washoe people, who lived in the area for thousands of years before the arrival of European settlers. The first recorded exploration of the area was in 1844, when a group of trappers led by Joseph Walker passed through the valley. The first permanent settlers arrived in the area in the late 1850s, and the area was officially named Squaw Valley in 1860.
In the early 1900s, the area began to attract tourists, and the first ski lift was built in 1928. The area was further developed in the 1940s, when the first ski lodge was built and the first ski school was established. In 1949, the area was purchased by Alexander Cushing, who developed the area into a ski resort. In 1960, Squaw Valley hosted the Winter Olympics, becoming the first ski resort in the United States to do so.
Geography
Squaw Valley is located in the Sierra Nevada mountain range, approximately 6 miles (9.7 km) northwest of the city of Truckee and 18 miles (29 km) west of the Nevada state line. The area is surrounded by the Tahoe National Forest and is situated at an elevation of 6,200 feet (1,890 m). The area is known for its steep terrain and deep snowpack, which makes it an ideal location for skiing and snowboarding.
Economy
The economy of Squaw Valley is largely based on tourism, with the ski resort being the main source of income for the area. The resort is open year-round and offers a variety of activities, including skiing, snowboarding, hiking, mountain biking, and more. The resort also offers lodging, dining, and shopping options. In addition to the ski resort, the area is also home to a number of other businesses, including restaurants, bars, and retail stores.
Demographics
As of the 2010 census, the population of Squaw Valley was 1,945. The racial makeup of the area was 94.3% White, 0.7% African American, 0.3% Native American, 0.7% Asian, 0.1% Pacific Islander, 1.2% from other races, and 2.7% from two or more races. The median household income in the area was $68,750, and the median family income was $77,500. The per capita income in the area was $37,845.
Conclusion
Squaw Valley is a small mountain resort community located in Placer County, California, United States. It is situated in the Sierra Nevada mountain range, and is known for its skiing and snowboarding. The area was originally inhabited by the Washoe people, and was officially named Squaw Valley in 1860. The economy of Squaw Valley is largely based on tourism, with the ski resort being the main source of income for the area. As of the 2010 census, the population of Squaw Valley was 1,945, with a median household income of $68,750.
Common Questions
What is Per Capita Income in Squaw Valley?
Per Capita income in Squaw Valley is $31,123.
What is the Median Family Income in Squaw Valley?
Median Family Income in Squaw Valley is $94,583.
What is the Median Household income in Squaw Valley?
Median Household Income in Squaw Valley is $82,969.
What is Income or Wage Gap in Squaw Valley?
Income or Wage Gap in Squaw Valley is 21.7%.
Women in Squaw Valley earn 78.3 cents for every dollar earned by a man.
What is Inequality or Gini Index in Squaw Valley?
Inequality or Gini Index in Squaw Valley is 0.43.
What is the Total Population of Squaw Valley?
Total Population of Squaw Valley is 4,568.
What is the Total Male Population of Squaw Valley?
Total Male Population of Squaw Valley is 2,479.
What is the Total Female Population of Squaw Valley?
Total Female Population of Squaw Valley is 2,089.
What is the Ratio of Males per 100 Females in Squaw Valley?
There are 118.67 Males per 100 Females in Squaw Valley.
What is the Ratio of Females per 100 Males in Squaw Valley?
There are 84.27 Females per 100 Males in Squaw Valley.
What is the Median Population Age in Squaw Valley?
Median Population Age in Squaw Valley is 37.4 Years.
What is the Average Family Size in Squaw Valley
Average Family Size in Squaw Valley is 4.1 People.
What is the Average Household Size in Squaw Valley
Average Household Size in Squaw Valley is 3.6 People.
How Large is the Labor Force in Squaw Valley?
There are 1,343 People in the Labor Forcein in Squaw Valley.
What is the Percentage of People in the Labor Force in Squaw Valley?
41.4% of People are in the Labor Force in Squaw Valley.
What is the Unemployment Rate in Squaw Valley?
Unemployment Rate in Squaw Valley is 2.8%.