Soulsbyville, CA Map & Demographics
Soulsbyville Map
Soulsbyville Overview
$30,454
PER CAPITA INCOME
$94,575
AVG FAMILY INCOME
$75,344
AVG HOUSEHOLD INCOME
58.0%
WAGE / INCOME GAP [ % ]
42.0¢/ $1
WAGE / INCOME GAP [ $ ]
0.36
INEQUALITY / GINI INDEX
1,972
TOTAL POPULATION
1,105
MALE POPULATION
867
FEMALE POPULATION
127.45
MALES / 100 FEMALES
78.46
FEMALES / 100 MALES
34.4
MEDIAN AGE
3.8
AVG FAMILY SIZE
2.9
AVG HOUSEHOLD SIZE
1,027
LABOR FORCE [ PEOPLE ]
67.1%
PERCENT IN LABOR FORCE
10.9%
UNEMPLOYMENT RATE
Soulsbyville Zip Codes
Soulsbyville Area Codes
Income in Soulsbyville
Income Overview in Soulsbyville
Per Capita Income in Soulsbyville is $30,454, while median incomes of families and households are $94,575 and $75,344 respectively.
| Characteristic | Number | Measure |
| Per Capita Income | 1,972 | $30,454 |
| Median Family Income | 422 | $94,575 |
| Mean Family Income | 422 | $114,305 |
| Median Household Income | 685 | $75,344 |
| Mean Household Income | 685 | $85,727 |
| Income Deficit | 422 | $0 |
| Wage / Income Gap (%) | 1,972 | 57.96% |
| Wage / Income Gap ($) | 1,972 | 42.04¢ per $1 |
| Gini / Inequality Index | 1,972 | 0.36 |
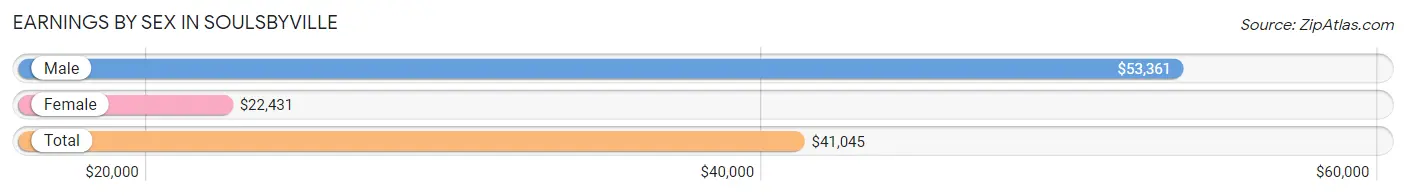
Earnings by Sex in Soulsbyville
Average Earnings in Soulsbyville are $41,045, $53,361 for men and $22,431 for women, a difference of 58.0%.
| Sex | Number | Average Earnings |
| Male | 550 (54.5%) | $53,361 |
| Female | 459 (45.5%) | $22,431 |
| Total | 1,009 (100.0%) | $41,045 |
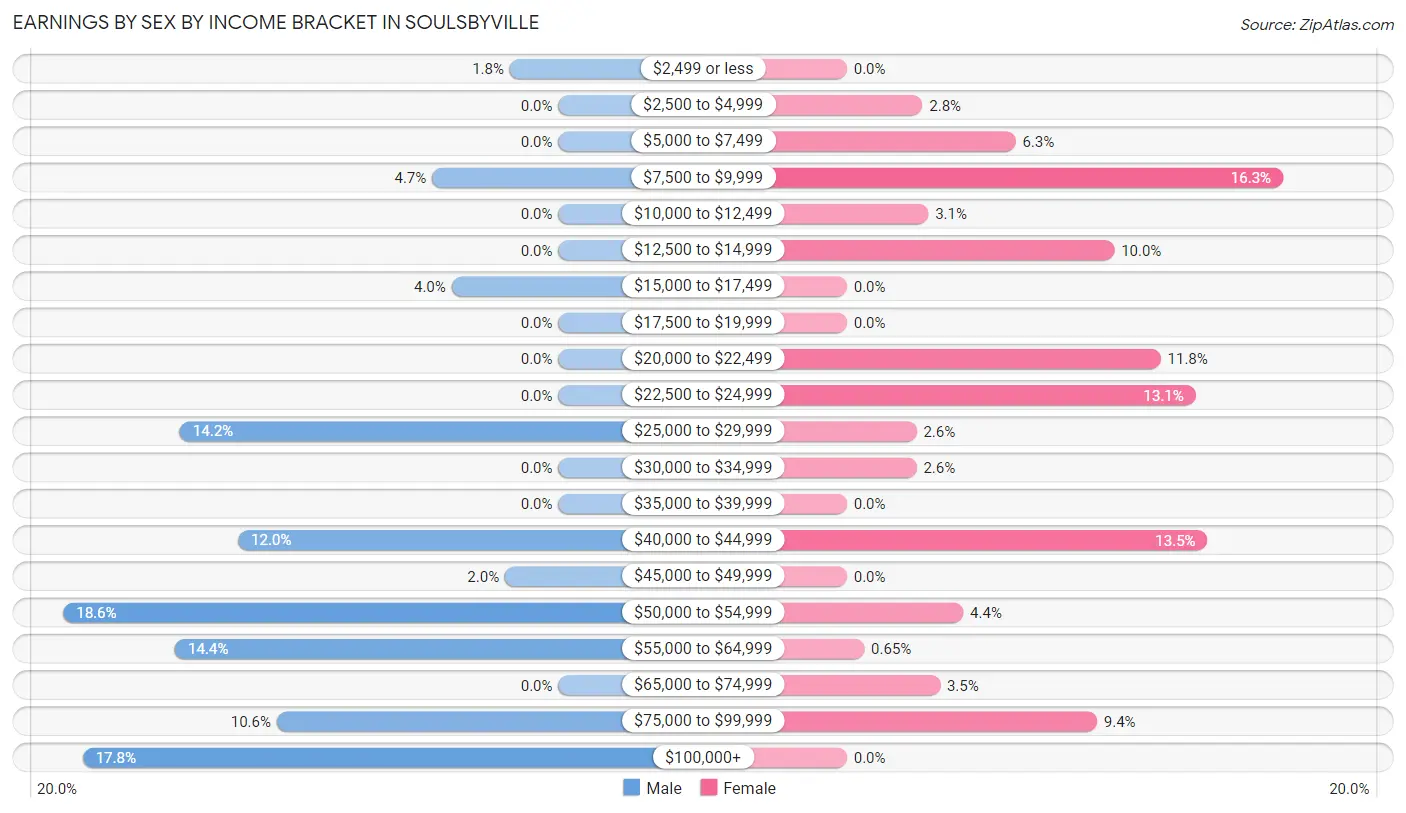
Earnings by Sex by Income Bracket in Soulsbyville
The most common earnings brackets in Soulsbyville are $50,000 to $54,999 for men (102 | 18.5%) and $7,500 to $9,999 for women (75 | 16.3%).
| Income | Male | Female |
| $2,499 or less | 10 (1.8%) | 0 (0.0%) |
| $2,500 to $4,999 | 0 (0.0%) | 13 (2.8%) |
| $5,000 to $7,499 | 0 (0.0%) | 29 (6.3%) |
| $7,500 to $9,999 | 26 (4.7%) | 75 (16.3%) |
| $10,000 to $12,499 | 0 (0.0%) | 14 (3.0%) |
| $12,500 to $14,999 | 0 (0.0%) | 46 (10.0%) |
| $15,000 to $17,499 | 22 (4.0%) | 0 (0.0%) |
| $17,500 to $19,999 | 0 (0.0%) | 0 (0.0%) |
| $20,000 to $22,499 | 0 (0.0%) | 54 (11.8%) |
| $22,500 to $24,999 | 0 (0.0%) | 60 (13.1%) |
| $25,000 to $29,999 | 78 (14.2%) | 12 (2.6%) |
| $30,000 to $34,999 | 0 (0.0%) | 12 (2.6%) |
| $35,000 to $39,999 | 0 (0.0%) | 0 (0.0%) |
| $40,000 to $44,999 | 66 (12.0%) | 62 (13.5%) |
| $45,000 to $49,999 | 11 (2.0%) | 0 (0.0%) |
| $50,000 to $54,999 | 102 (18.5%) | 20 (4.4%) |
| $55,000 to $64,999 | 79 (14.4%) | 3 (0.6%) |
| $65,000 to $74,999 | 0 (0.0%) | 16 (3.5%) |
| $75,000 to $99,999 | 58 (10.5%) | 43 (9.4%) |
| $100,000+ | 98 (17.8%) | 0 (0.0%) |
| Total | 550 (100.0%) | 459 (100.0%) |
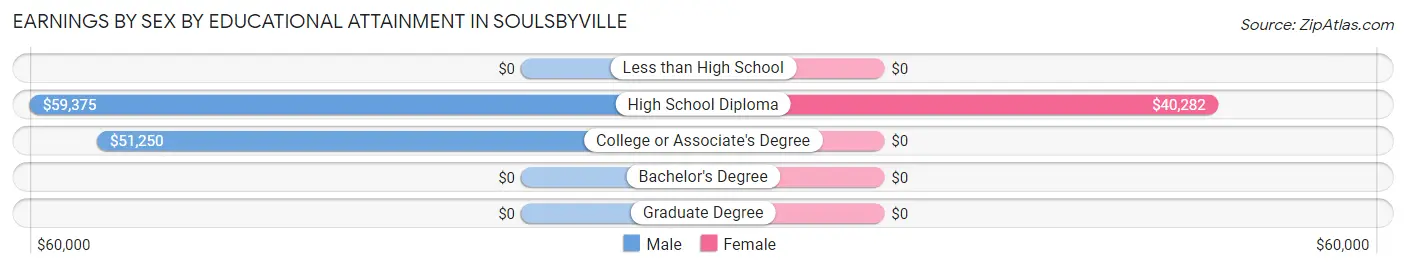
Earnings by Sex by Educational Attainment in Soulsbyville
Average earnings in Soulsbyville are $59,612 for men and $25,313 for women, a difference of 57.5%. Men with an educational attainment of high school diploma enjoy the highest average annual earnings of $59,375, while those with college or associate's degree education earn the least with $51,250. Women with an educational attainment of high school diploma earn the most with the average annual earnings of $40,282, while those with high school diploma education have the smallest earnings of $40,282.
| Educational Attainment | Male Income | Female Income |
| Less than High School | - | - |
| High School Diploma | $59,375 | $40,282 |
| College or Associate's Degree | $51,250 | $0 |
| Bachelor's Degree | - | - |
| Graduate Degree | - | - |
| Total | $59,612 | $25,313 |
Family Income in Soulsbyville
Family Income Brackets in Soulsbyville
According to the Soulsbyville family income data, there are 138 families falling into the $75,000 to $99,999 income range, which is the most common income bracket and makes up 32.7% of all families.
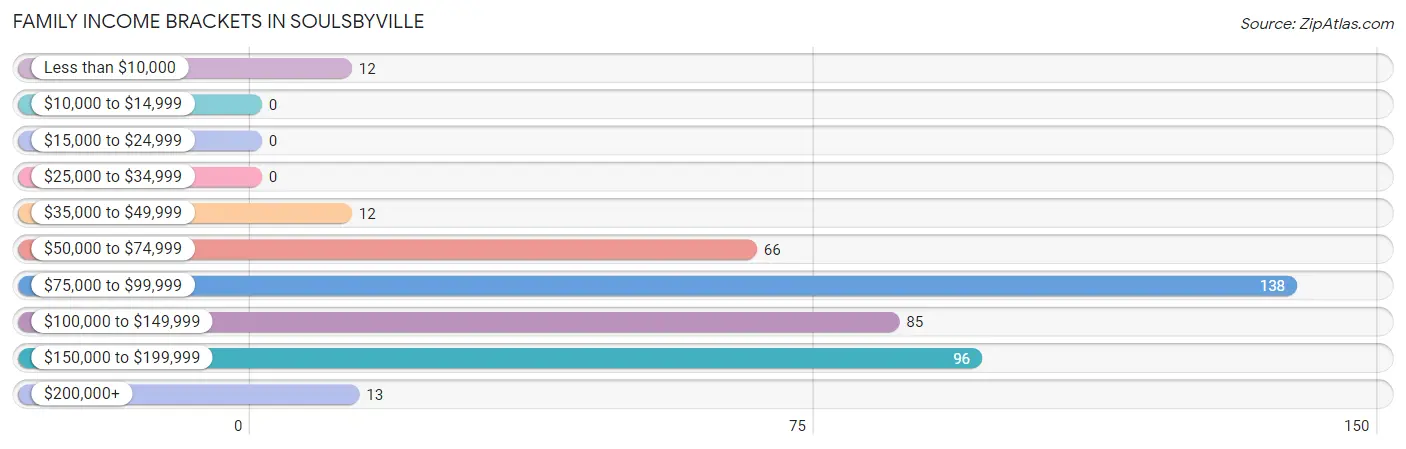
| Income Bracket | # Families | % Families |
| Less than $10,000 | 12 | 2.8% |
| $10,000 to $14,999 | 0 | 0.0% |
| $15,000 to $24,999 | 0 | 0.0% |
| $25,000 to $34,999 | 0 | 0.0% |
| $35,000 to $49,999 | 12 | 2.8% |
| $50,000 to $74,999 | 66 | 15.6% |
| $75,000 to $99,999 | 138 | 32.7% |
| $100,000 to $149,999 | 85 | 20.1% |
| $150,000 to $199,999 | 96 | 22.7% |
| $200,000+ | 13 | 3.1% |
Family Income by Famaliy Size in Soulsbyville
5-person families (58 | 13.7%) account for the highest median family income in Soulsbyville with $173,041 per family, while 5-person families (58 | 13.7%) have the highest median income of $34,608 per family member.
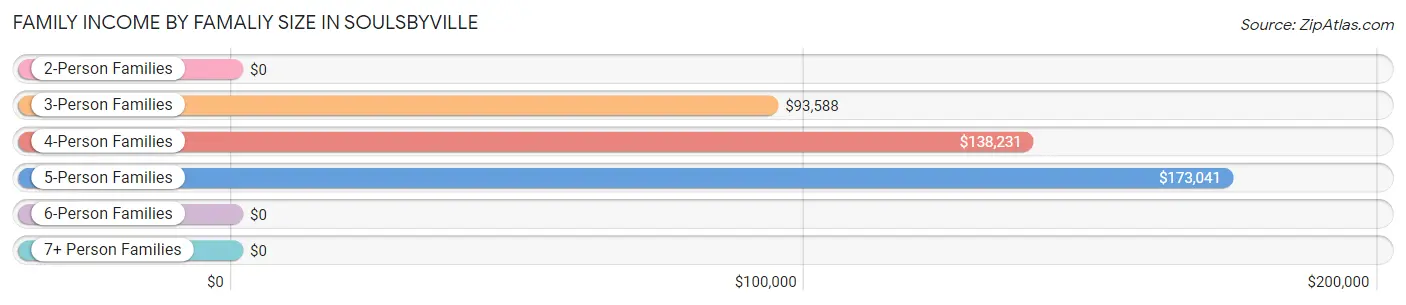
| Income Bracket | # Families | Median Income |
| 2-Person Families | 132 (31.3%) | $0 |
| 3-Person Families | 126 (29.9%) | $93,588 |
| 4-Person Families | 101 (23.9%) | $138,231 |
| 5-Person Families | 58 (13.7%) | $173,041 |
| 6-Person Families | 5 (1.2%) | $0 |
| 7+ Person Families | 0 (0.0%) | $0 |
| Total | 422 (100.0%) | $94,575 |
Family Income by Number of Earners in Soulsbyville
The median family income in Soulsbyville is $94,575, with families comprising 3+ earners (81) having the highest median family income of $139,410, while families with no earners (57) have the lowest median family income of $76,094, accounting for 19.2% and 13.5% of families, respectively.
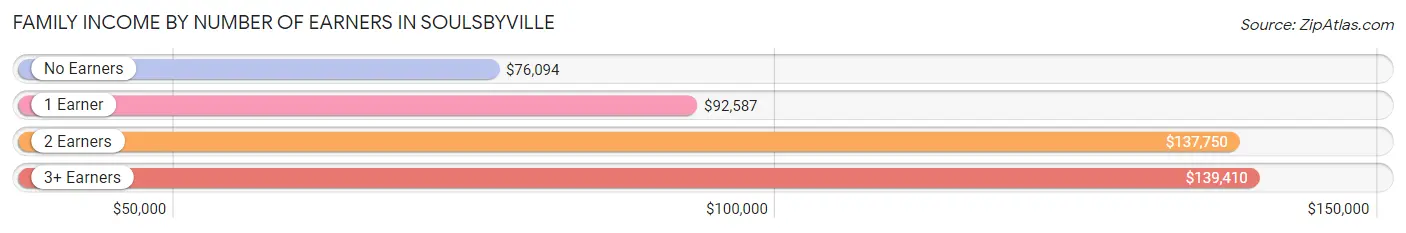
| Number of Earners | # Families | Median Income |
| No Earners | 57 (13.5%) | $76,094 |
| 1 Earner | 157 (37.2%) | $92,587 |
| 2 Earners | 127 (30.1%) | $137,750 |
| 3+ Earners | 81 (19.2%) | $139,410 |
| Total | 422 (100.0%) | $94,575 |
Household Income in Soulsbyville
Household Income Brackets in Soulsbyville
With 208 households falling in the category, the $50,000 to $74,999 income range is the most frequent in Soulsbyville, accounting for 30.4% of all households.
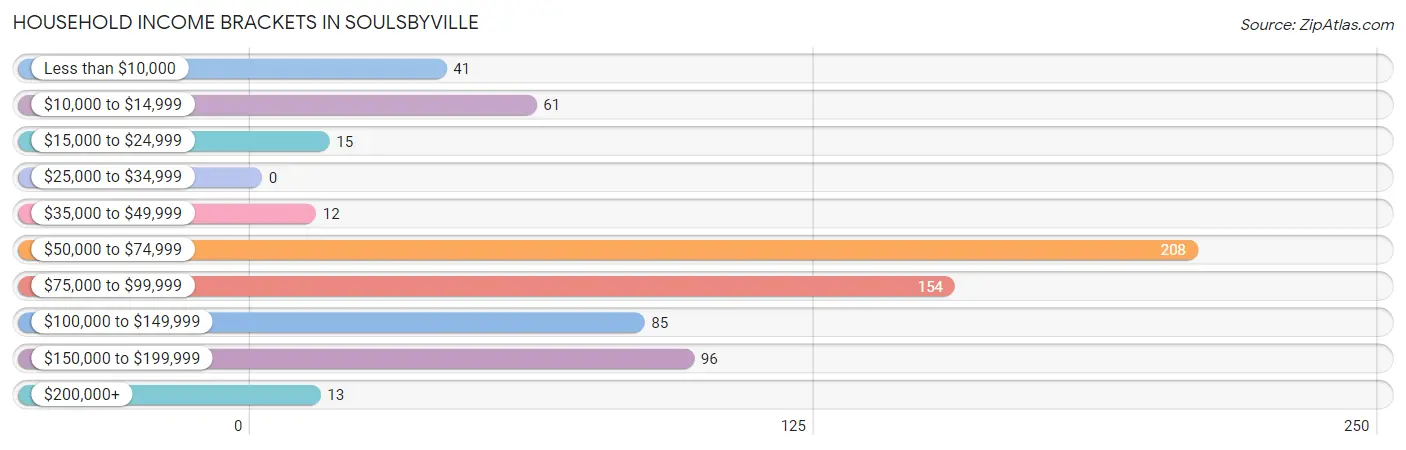
| Income Bracket | # Households | % Households |
| Less than $10,000 | 41 | 6.0% |
| $10,000 to $14,999 | 61 | 8.9% |
| $15,000 to $24,999 | 15 | 2.2% |
| $25,000 to $34,999 | 0 | 0.0% |
| $35,000 to $49,999 | 12 | 1.8% |
| $50,000 to $74,999 | 208 | 30.4% |
| $75,000 to $99,999 | 154 | 22.5% |
| $100,000 to $149,999 | 85 | 12.4% |
| $150,000 to $199,999 | 96 | 14.0% |
| $200,000+ | 13 | 1.9% |
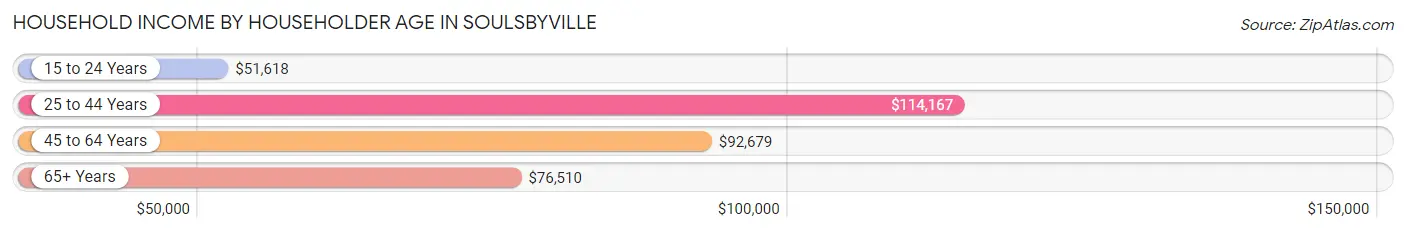
Household Income by Householder Age in Soulsbyville
The median household income in Soulsbyville is $75,344, with the highest median household income of $114,167 found in the 25 to 44 years age bracket for the primary householder. A total of 198 households (28.9%) fall into this category. Meanwhile, the 15 to 24 years age bracket for the primary householder has the lowest median household income of $51,618, with 158 households (23.1%) in this group.
| Income Bracket | # Households | Median Income |
| 15 to 24 Years | 158 (23.1%) | $51,618 |
| 25 to 44 Years | 198 (28.9%) | $114,167 |
| 45 to 64 Years | 252 (36.8%) | $92,679 |
| 65+ Years | 77 (11.2%) | $76,510 |
| Total | 685 (100.0%) | $75,344 |
Poverty in Soulsbyville
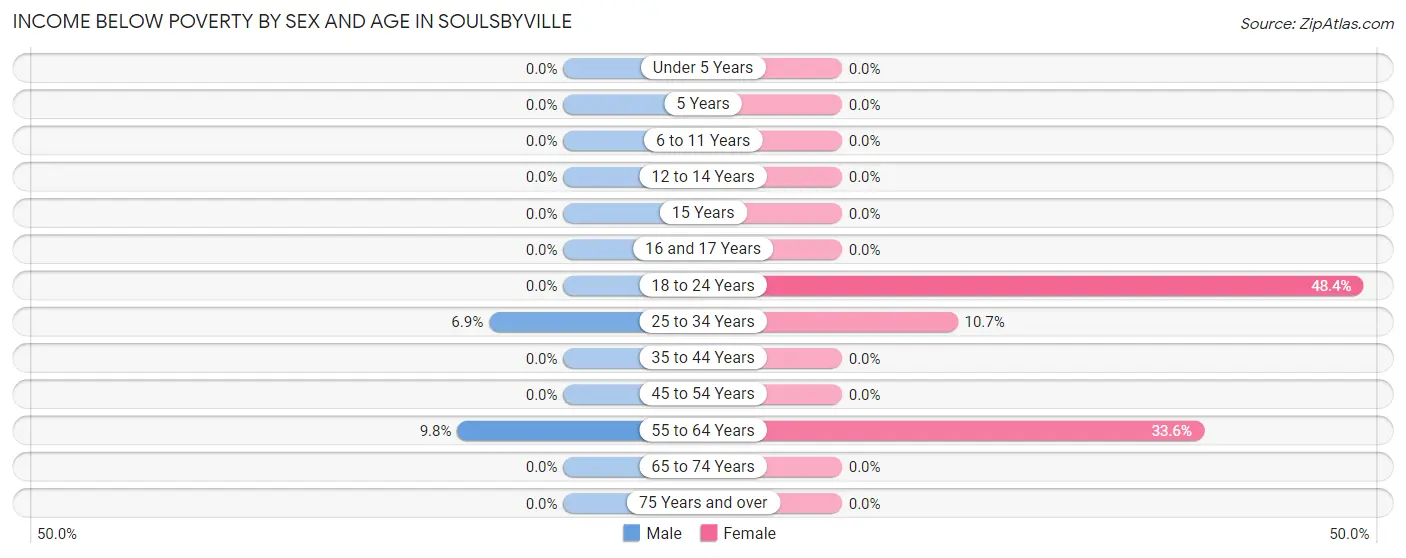
Income Below Poverty by Sex and Age in Soulsbyville
With 3.2% poverty level for males and 13.6% for females among the residents of Soulsbyville, 55 to 64 year old males and 18 to 24 year old females are the most vulnerable to poverty, with 25 males (9.8%) and 61 females (48.4%) in their respective age groups living below the poverty level.
| Age Bracket | Male | Female |
| Under 5 Years | 0 (0.0%) | 0 (0.0%) |
| 5 Years | 0 (0.0%) | 0 (0.0%) |
| 6 to 11 Years | 0 (0.0%) | 0 (0.0%) |
| 12 to 14 Years | 0 (0.0%) | 0 (0.0%) |
| 15 Years | 0 (0.0%) | 0 (0.0%) |
| 16 and 17 Years | 0 (0.0%) | 0 (0.0%) |
| 18 to 24 Years | 0 (0.0%) | 61 (48.4%) |
| 25 to 34 Years | 10 (6.9%) | 13 (10.7%) |
| 35 to 44 Years | 0 (0.0%) | 0 (0.0%) |
| 45 to 54 Years | 0 (0.0%) | 0 (0.0%) |
| 55 to 64 Years | 25 (9.8%) | 44 (33.6%) |
| 65 to 74 Years | 0 (0.0%) | 0 (0.0%) |
| 75 Years and over | 0 (0.0%) | 0 (0.0%) |
| Total | 35 (3.2%) | 118 (13.6%) |
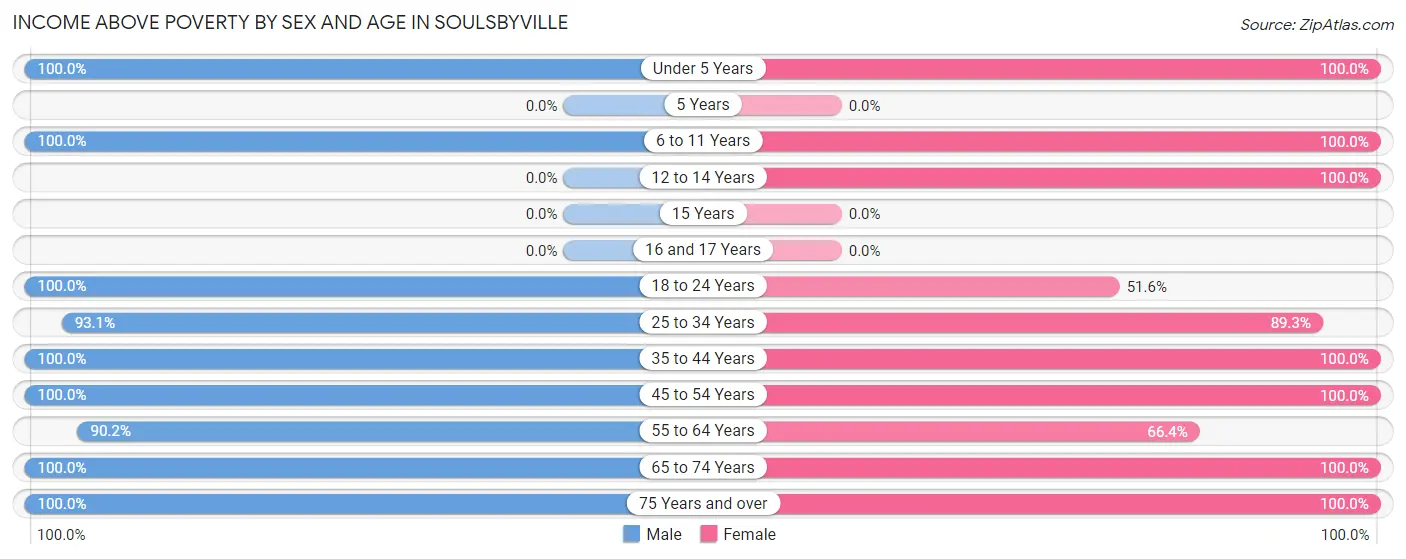
Income Above Poverty by Sex and Age in Soulsbyville
According to the poverty statistics in Soulsbyville, males aged under 5 years and females aged under 5 years are the age groups that are most secure financially, with 100.0% of males and 100.0% of females in these age groups living above the poverty line.
| Age Bracket | Male | Female |
| Under 5 Years | 63 (100.0%) | 81 (100.0%) |
| 5 Years | 0 (0.0%) | 0 (0.0%) |
| 6 to 11 Years | 175 (100.0%) | 112 (100.0%) |
| 12 to 14 Years | 0 (0.0%) | 10 (100.0%) |
| 15 Years | 0 (0.0%) | 0 (0.0%) |
| 16 and 17 Years | 0 (0.0%) | 0 (0.0%) |
| 18 to 24 Years | 223 (100.0%) | 65 (51.6%) |
| 25 to 34 Years | 135 (93.1%) | 108 (89.3%) |
| 35 to 44 Years | 42 (100.0%) | 114 (100.0%) |
| 45 to 54 Years | 34 (100.0%) | 93 (100.0%) |
| 55 to 64 Years | 229 (90.2%) | 87 (66.4%) |
| 65 to 74 Years | 48 (100.0%) | 24 (100.0%) |
| 75 Years and over | 121 (100.0%) | 55 (100.0%) |
| Total | 1,070 (96.8%) | 749 (86.4%) |
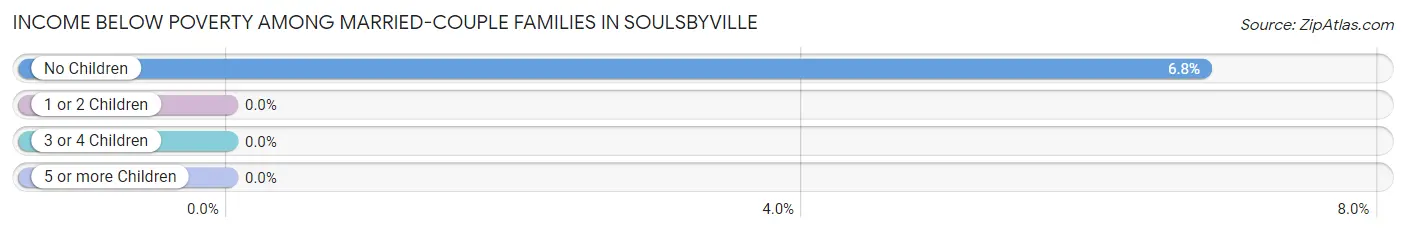
Income Below Poverty Among Married-Couple Families in Soulsbyville
The poverty statistics for married-couple families in Soulsbyville show that 3.5% or 12 of the total 346 families live below the poverty line. Families with no children have the highest poverty rate of 6.8%, comprising of 12 families. On the other hand, families with 1 or 2 children have the lowest poverty rate of 0.0%, which includes 0 families.
| Children | Above Poverty | Below Poverty |
| No Children | 165 (93.2%) | 12 (6.8%) |
| 1 or 2 Children | 143 (100.0%) | 0 (0.0%) |
| 3 or 4 Children | 26 (100.0%) | 0 (0.0%) |
| 5 or more Children | 0 (0.0%) | 0 (0.0%) |
| Total | 334 (96.5%) | 12 (3.5%) |
Income Below Poverty Among Single-Parent Households in Soulsbyville
| Children | Single Father | Single Mother |
| No Children | 0 (0.0%) | 0 (0.0%) |
| 1 or 2 Children | 0 (0.0%) | 0 (0.0%) |
| 3 or 4 Children | 0 (0.0%) | 0 (0.0%) |
| 5 or more Children | 0 (0.0%) | 0 (0.0%) |
| Total | 0 (0.0%) | 0 (0.0%) |
Income Below Poverty Among Married-Couple vs Single-Parent Households in Soulsbyville
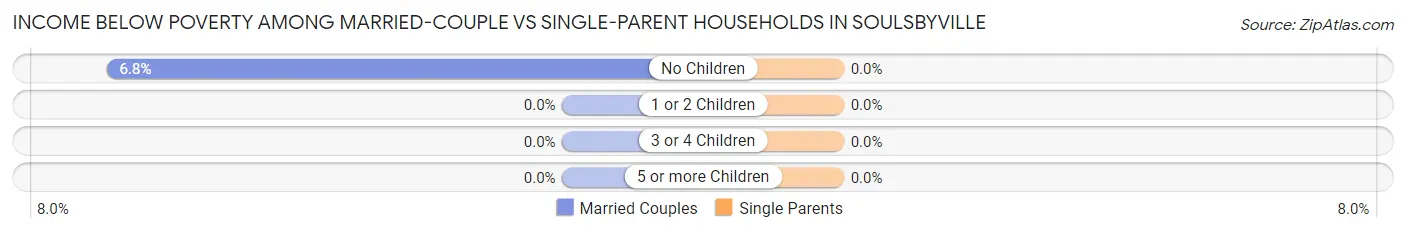
| Children | Married-Couple Families | Single-Parent Households |
| No Children | 12 (6.8%) | 0 (0.0%) |
| 1 or 2 Children | 0 (0.0%) | 0 (0.0%) |
| 3 or 4 Children | 0 (0.0%) | 0 (0.0%) |
| 5 or more Children | 0 (0.0%) | 0 (0.0%) |
| Total | 12 (3.5%) | 0 (0.0%) |
Race in Soulsbyville
The most populous races in Soulsbyville are White / Caucasian (1,772 | 89.9%), Hispanic or Latino (252 | 12.8%), and Two or more Races (160 | 8.1%).
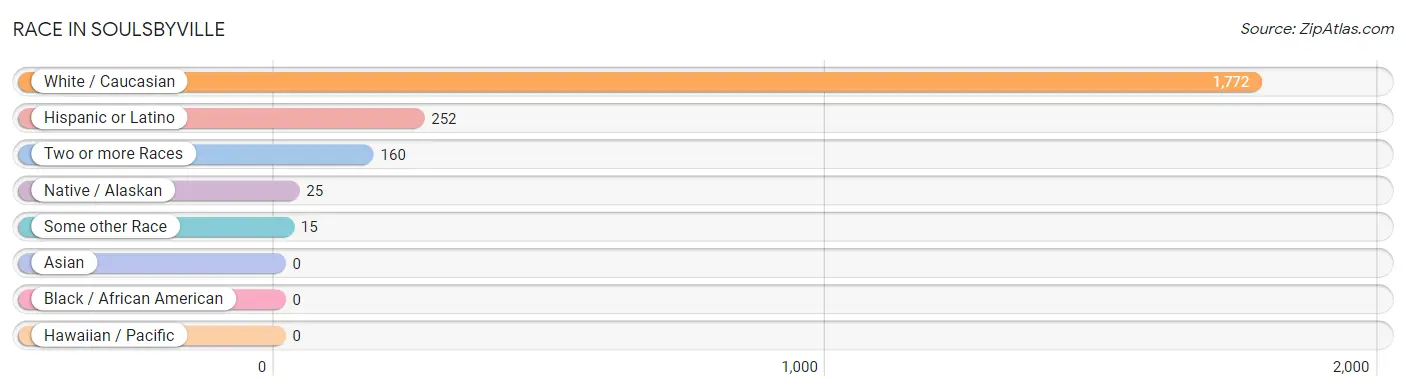
| Race | # Population | % Population |
| Asian | 0 | 0.0% |
| Black / African American | 0 | 0.0% |
| Hawaiian / Pacific | 0 | 0.0% |
| Hispanic or Latino | 252 | 12.8% |
| Native / Alaskan | 25 | 1.3% |
| White / Caucasian | 1,772 | 89.9% |
| Two or more Races | 160 | 8.1% |
| Some other Race | 15 | 0.8% |
| Total | 1,972 | 100.0% |
Ancestry in Soulsbyville
The most populous ancestries reported in Soulsbyville are German (659 | 33.4%), English (373 | 18.9%), Irish (360 | 18.3%), French (228 | 11.6%), and Mexican (192 | 9.7%), together accounting for 91.9% of all Soulsbyville residents.
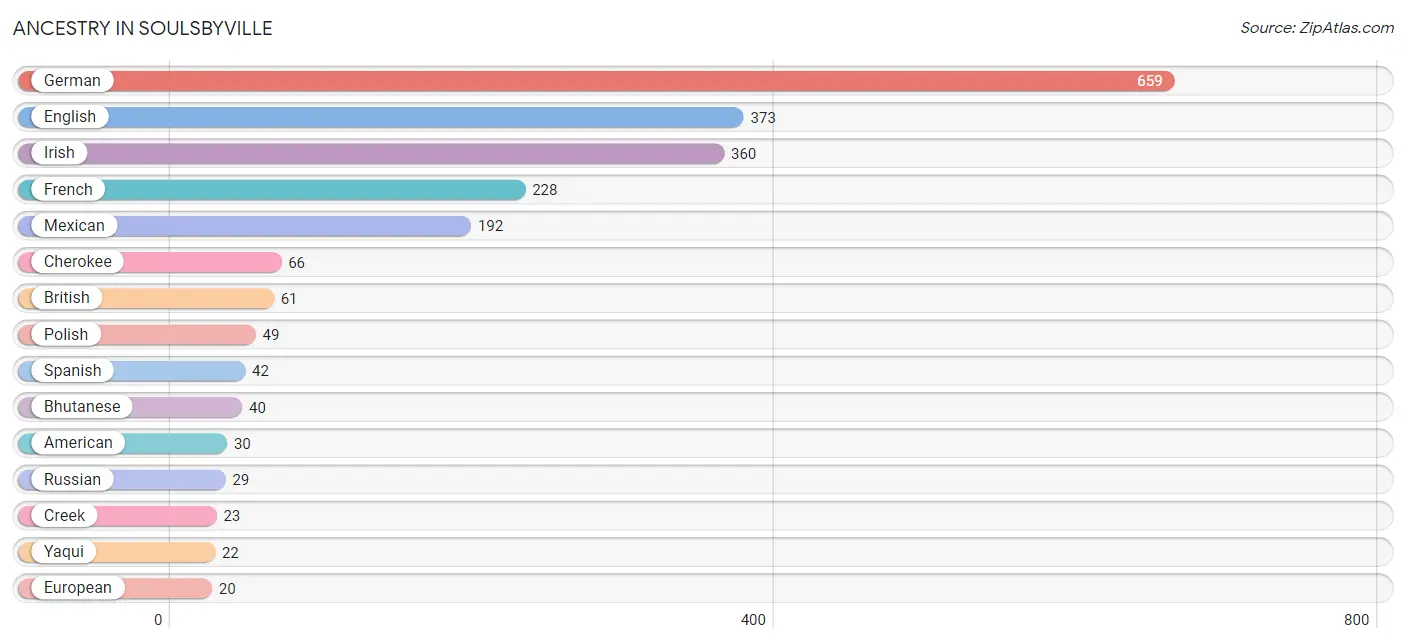
| Ancestry | # Population | % Population |
| American | 30 | 1.5% |
| Bhutanese | 40 | 2.0% |
| British | 61 | 3.1% |
| Burmese | 11 | 0.6% |
| Canadian | 14 | 0.7% |
| Cherokee | 66 | 3.4% |
| Creek | 23 | 1.2% |
| English | 373 | 18.9% |
| European | 20 | 1.0% |
| French | 228 | 11.6% |
| German | 659 | 33.4% |
| Indian (Asian) | 19 | 1.0% |
| Irish | 360 | 18.3% |
| Mexican | 192 | 9.7% |
| Polish | 49 | 2.5% |
| Russian | 29 | 1.5% |
| Scottish | 9 | 0.5% |
| Spaniard | 3 | 0.2% |
| Spanish | 42 | 2.1% |
| Welsh | 10 | 0.5% |
| Yaqui | 22 | 1.1% | View All 21 Rows |
Immigrants in Soulsbyville
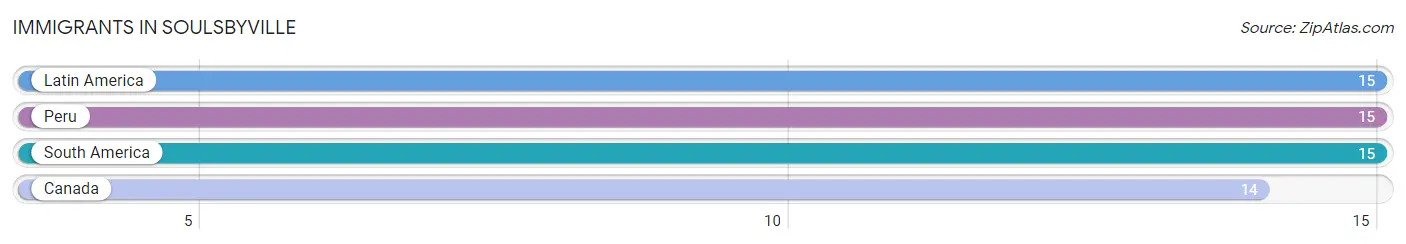
The most numerous immigrant groups reported in Soulsbyville came from Latin America (15 | 0.8%), Peru (15 | 0.8%), South America (15 | 0.8%), and Canada (14 | 0.7%), together accounting for 3.0% of all Soulsbyville residents.
| Immigration Origin | # Population | % Population |
| Canada | 14 | 0.7% |
| Latin America | 15 | 0.8% |
| Peru | 15 | 0.8% |
| South America | 15 | 0.8% | View All 4 Rows |
Sex and Age in Soulsbyville
Sex and Age in Soulsbyville
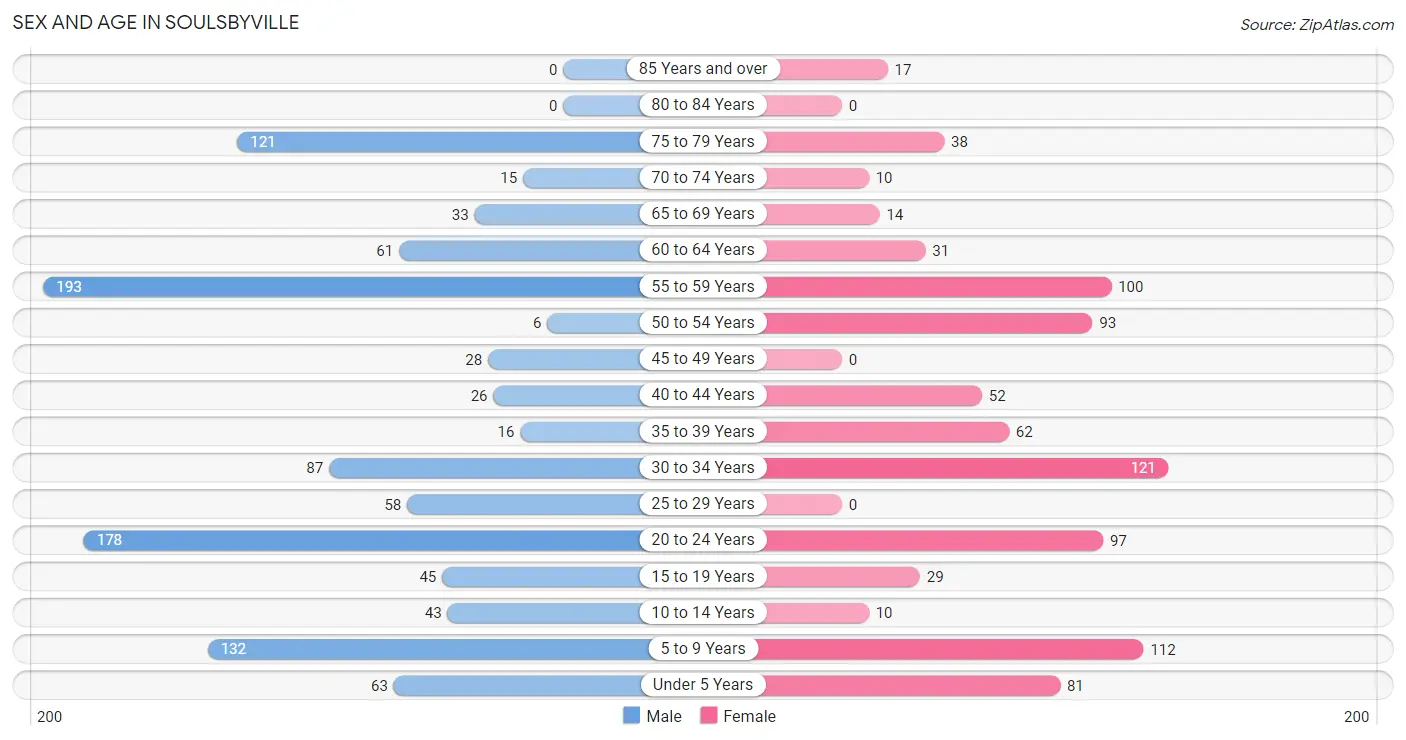
The most populous age groups in Soulsbyville are 55 to 59 Years (193 | 17.5%) for men and 30 to 34 Years (121 | 14.0%) for women.
| Age Bracket | Male | Female |
| Under 5 Years | 63 (5.7%) | 81 (9.3%) |
| 5 to 9 Years | 132 (11.9%) | 112 (12.9%) |
| 10 to 14 Years | 43 (3.9%) | 10 (1.1%) |
| 15 to 19 Years | 45 (4.1%) | 29 (3.3%) |
| 20 to 24 Years | 178 (16.1%) | 97 (11.2%) |
| 25 to 29 Years | 58 (5.2%) | 0 (0.0%) |
| 30 to 34 Years | 87 (7.9%) | 121 (14.0%) |
| 35 to 39 Years | 16 (1.5%) | 62 (7.1%) |
| 40 to 44 Years | 26 (2.4%) | 52 (6.0%) |
| 45 to 49 Years | 28 (2.5%) | 0 (0.0%) |
| 50 to 54 Years | 6 (0.5%) | 93 (10.7%) |
| 55 to 59 Years | 193 (17.5%) | 100 (11.5%) |
| 60 to 64 Years | 61 (5.5%) | 31 (3.6%) |
| 65 to 69 Years | 33 (3.0%) | 14 (1.6%) |
| 70 to 74 Years | 15 (1.4%) | 10 (1.1%) |
| 75 to 79 Years | 121 (11.0%) | 38 (4.4%) |
| 80 to 84 Years | 0 (0.0%) | 0 (0.0%) |
| 85 Years and over | 0 (0.0%) | 17 (2.0%) |
| Total | 1,105 (100.0%) | 867 (100.0%) |
Families and Households in Soulsbyville
Median Family Size in Soulsbyville
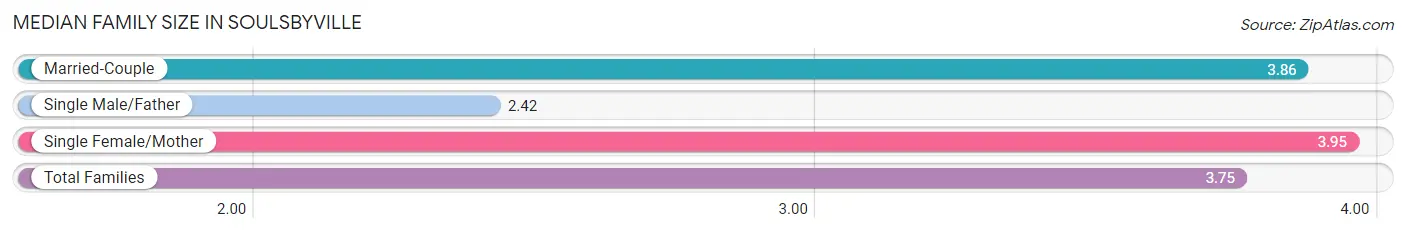
The median family size in Soulsbyville is 3.75 persons per family, with single female/mother families (43 | 10.2%) accounting for the largest median family size of 3.95 persons per family. On the other hand, single male/father families (33 | 7.8%) represent the smallest median family size with 2.42 persons per family.
| Family Type | # Families | Family Size |
| Married-Couple | 346 (82.0%) | 3.86 |
| Single Male/Father | 33 (7.8%) | 2.42 |
| Single Female/Mother | 43 (10.2%) | 3.95 |
| Total Families | 422 (100.0%) | 3.75 |
Median Household Size in Soulsbyville
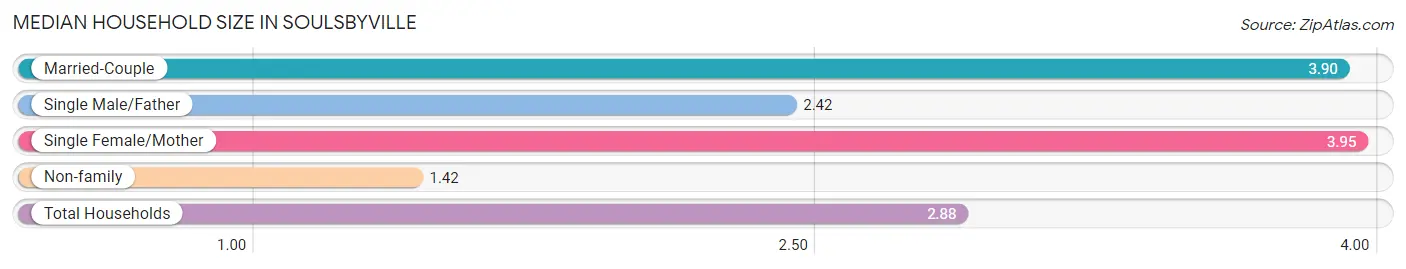
The median household size in Soulsbyville is 2.88 persons per household, with single female/mother households (43 | 6.3%) accounting for the largest median household size of 3.95 persons per household. non-family households (263 | 38.4%) represent the smallest median household size with 1.42 persons per household.
| Household Type | # Households | Household Size |
| Married-Couple | 346 (50.5%) | 3.90 |
| Single Male/Father | 33 (4.8%) | 2.42 |
| Single Female/Mother | 43 (6.3%) | 3.95 |
| Non-family | 263 (38.4%) | 1.42 |
| Total Households | 685 (100.0%) | 2.88 |
Household Size by Marriage Status in Soulsbyville
Out of a total of 685 households in Soulsbyville, 422 (61.6%) are family households, while 263 (38.4%) are nonfamily households. The most numerous type of family households are 2-person households, comprising 132, and the most common type of nonfamily households are 1-person households, comprising 167.
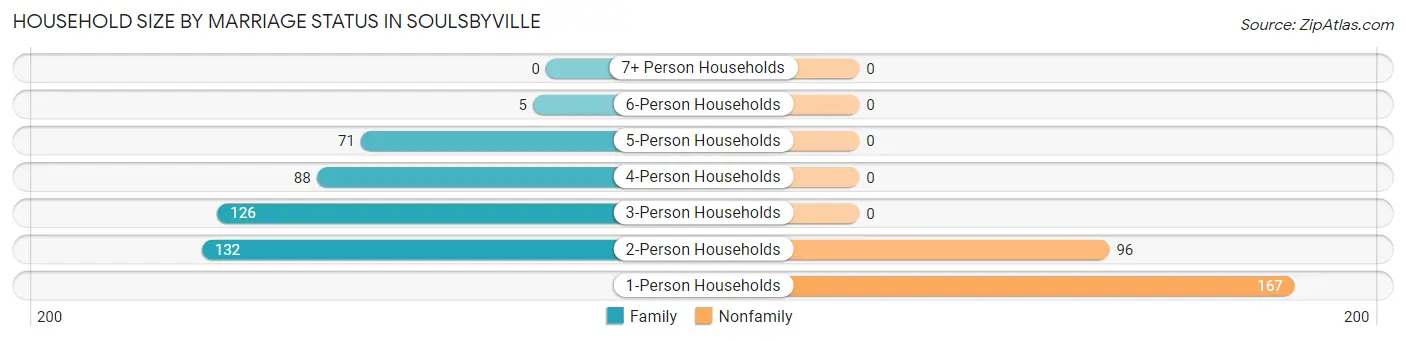
| Household Size | Family Households | Nonfamily Households |
| 1-Person Households | - | 167 (24.4%) |
| 2-Person Households | 132 (19.3%) | 96 (14.0%) |
| 3-Person Households | 126 (18.4%) | 0 (0.0%) |
| 4-Person Households | 88 (12.9%) | 0 (0.0%) |
| 5-Person Households | 71 (10.4%) | 0 (0.0%) |
| 6-Person Households | 5 (0.7%) | 0 (0.0%) |
| 7+ Person Households | 0 (0.0%) | 0 (0.0%) |
| Total | 422 (61.6%) | 263 (38.4%) |
Female Fertility in Soulsbyville
Fertility by Age in Soulsbyville
Average fertility rate in Soulsbyville is 102.0 births per 1,000 women. Women in the age bracket of 35 to 50 years have the highest fertility rate with 325.0 births per 1,000 women. Women in the age bracket of 35 to 50 years acount for 100.0% of all women with births.
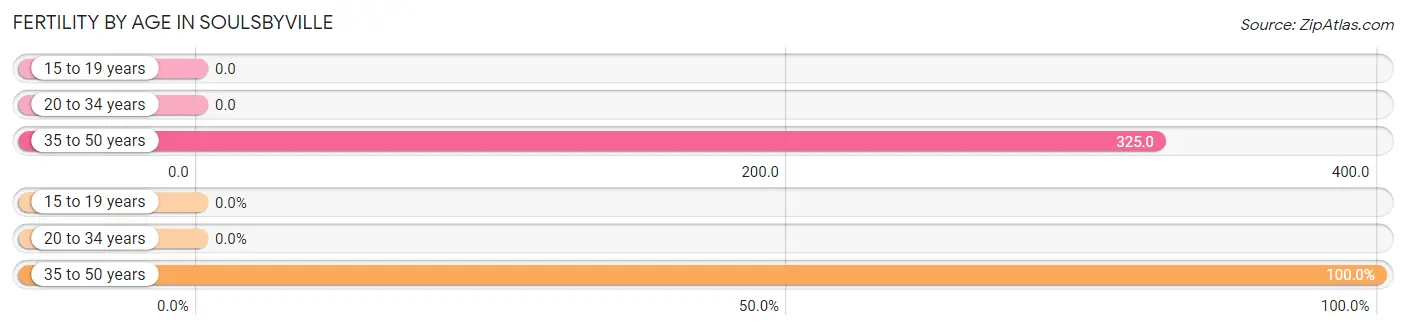
| Age Bracket | Women with Births | Births / 1,000 Women |
| 15 to 19 years | 0 (0.0%) | 0.0 |
| 20 to 34 years | 0 (0.0%) | 0.0 |
| 35 to 50 years | 37 (100.0%) | 325.0 |
| Total | 37 (100.0%) | 102.0 |
Fertility by Age by Marriage Status in Soulsbyville
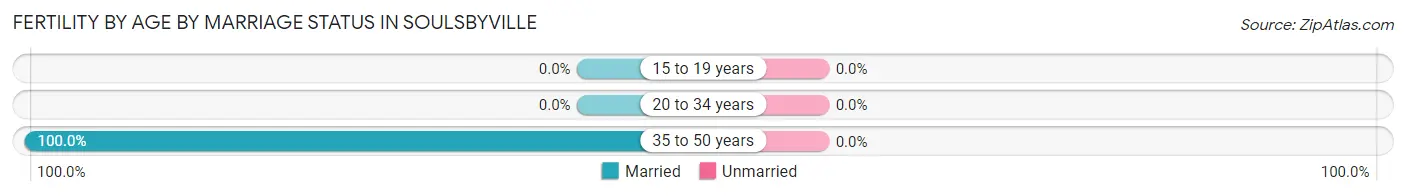
| Age Bracket | Married | Unmarried |
| 15 to 19 years | 0 (0.0%) | 0 (0.0%) |
| 20 to 34 years | 0 (0.0%) | 0 (0.0%) |
| 35 to 50 years | 37 (100.0%) | 0 (0.0%) |
| Total | 37 (100.0%) | 0 (0.0%) |
Fertility by Education in Soulsbyville
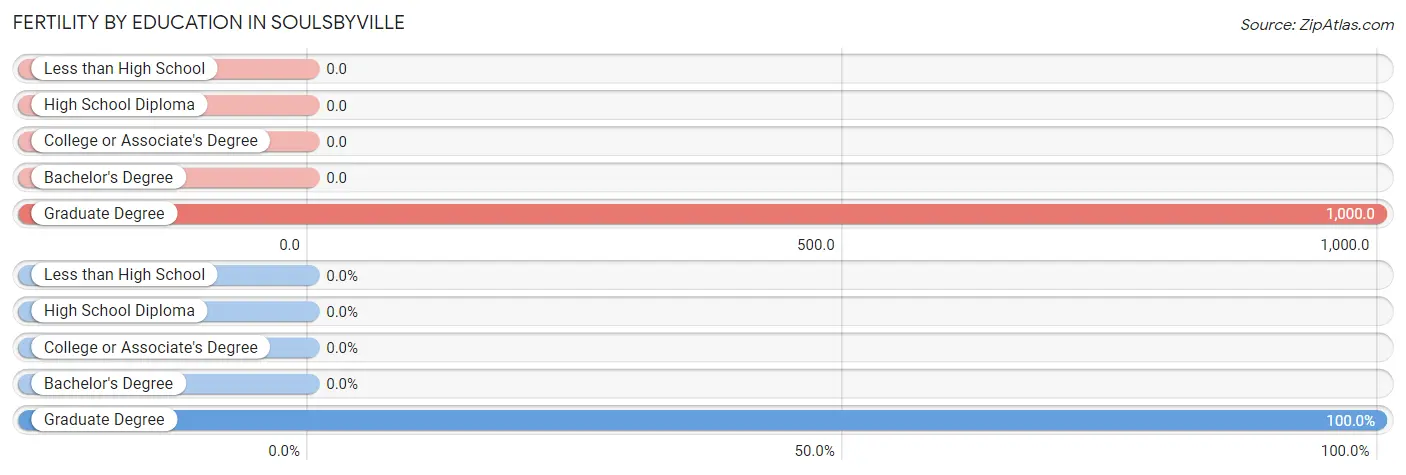
| Educational Attainment | Women with Births | Births / 1,000 Women |
| Less than High School | 0 (0.0%) | 0.0 |
| High School Diploma | 0 (0.0%) | 0.0 |
| College or Associate's Degree | 0 (0.0%) | 0.0 |
| Bachelor's Degree | 0 (0.0%) | 0.0 |
| Graduate Degree | 37 (100.0%) | 1,000.0 |
| Total | 37 (100.0%) | 102.0 |
Fertility by Education by Marriage Status in Soulsbyville
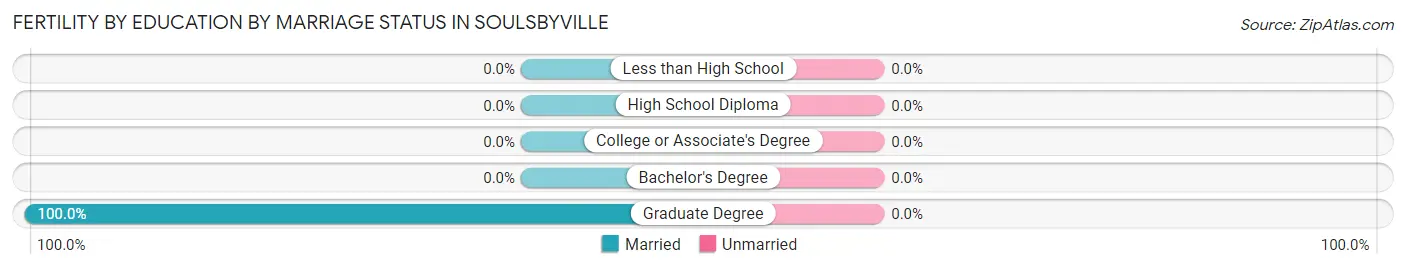
| Educational Attainment | Married | Unmarried |
| Less than High School | 0 (0.0%) | 0 (0.0%) |
| High School Diploma | 0 (0.0%) | 0 (0.0%) |
| College or Associate's Degree | 0 (0.0%) | 0 (0.0%) |
| Bachelor's Degree | 0 (0.0%) | 0 (0.0%) |
| Graduate Degree | 37 (100.0%) | 0 (0.0%) |
| Total | 37 (100.0%) | 0 (0.0%) |
Employment Characteristics in Soulsbyville
Employment by Class of Employer in Soulsbyville
Among the 862 employed individuals in Soulsbyville, private company employees (659 | 76.4%), state government employees (70 | 8.1%), and not-for-profit organizations (59 | 6.8%) make up the most common classes of employment.
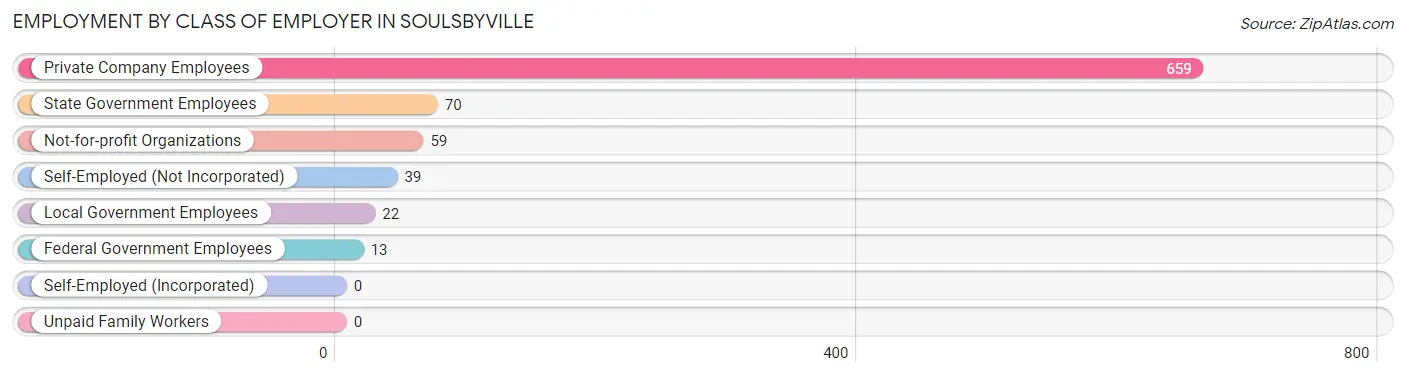
| Employer Class | # Employees | % Employees |
| Private Company Employees | 659 | 76.4% |
| Self-Employed (Incorporated) | 0 | 0.0% |
| Self-Employed (Not Incorporated) | 39 | 4.5% |
| Not-for-profit Organizations | 59 | 6.8% |
| Local Government Employees | 22 | 2.5% |
| State Government Employees | 70 | 8.1% |
| Federal Government Employees | 13 | 1.5% |
| Unpaid Family Workers | 0 | 0.0% |
| Total | 862 | 100.0% |
Employment Status by Age in Soulsbyville
According to the labor force statistics for Soulsbyville, out of the total population over 16 years of age (1,531), 67.1% or 1,027 individuals are in the labor force, with 10.9% or 112 of them unemployed. The age group with the highest labor force participation rate is 16 to 19 years, with 100.0% or 74 individuals in the labor force. Within the labor force, the 16 to 19 years age range has the highest percentage of unemployed individuals, with 81.1% or 60 of them being unemployed.
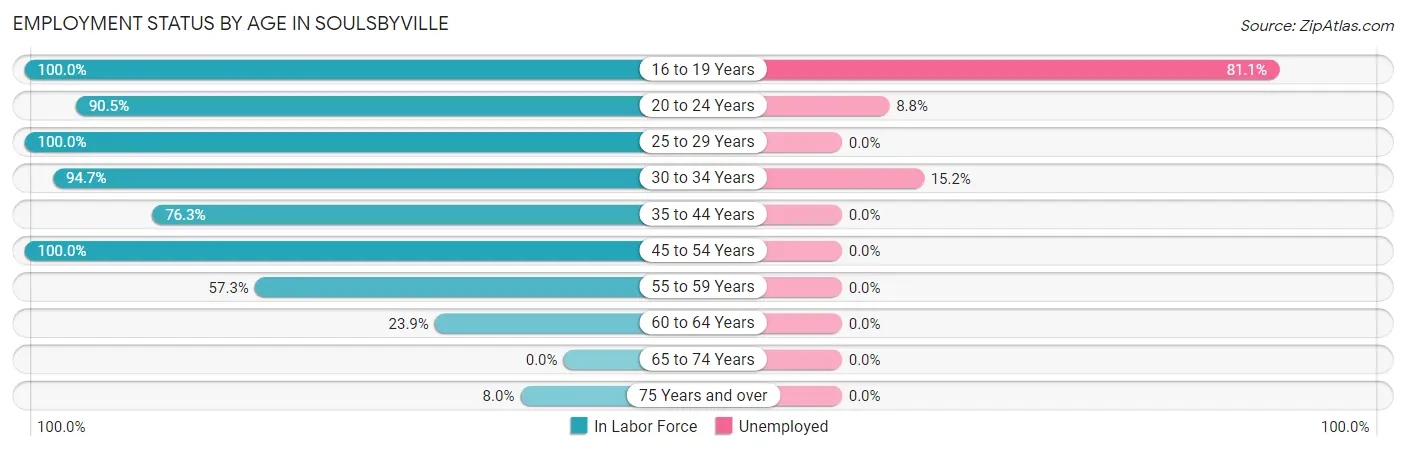
| Age Bracket | In Labor Force | Unemployed |
| 16 to 19 Years | 74 (100.0%) | 60 (81.1%) |
| 20 to 24 Years | 249 (90.5%) | 22 (8.8%) |
| 25 to 29 Years | 58 (100.0%) | 0 (0.0%) |
| 30 to 34 Years | 197 (94.7%) | 30 (15.2%) |
| 35 to 44 Years | 119 (76.3%) | 0 (0.0%) |
| 45 to 54 Years | 127 (100.0%) | 0 (0.0%) |
| 55 to 59 Years | 168 (57.3%) | 0 (0.0%) |
| 60 to 64 Years | 22 (23.9%) | 0 (0.0%) |
| 65 to 74 Years | 0 (0.0%) | 0 (0.0%) |
| 75 Years and over | 14 (8.0%) | 0 (0.0%) |
| Total | 1,027 (67.1%) | 112 (10.9%) |
Employment Status by Educational Attainment in Soulsbyville
According to labor force statistics for Soulsbyville, 74.0% of individuals (691) out of the total population between 25 and 64 years of age (934) are in the labor force, with 4.3% or 30 of them being unemployed. The group with the highest labor force participation rate are those with the educational attainment of high school diploma, with 77.9% or 327 individuals in the labor force. Within the labor force, individuals with college / associate degree education have the highest percentage of unemployment, with 12.6% or 30 of them being unemployed.
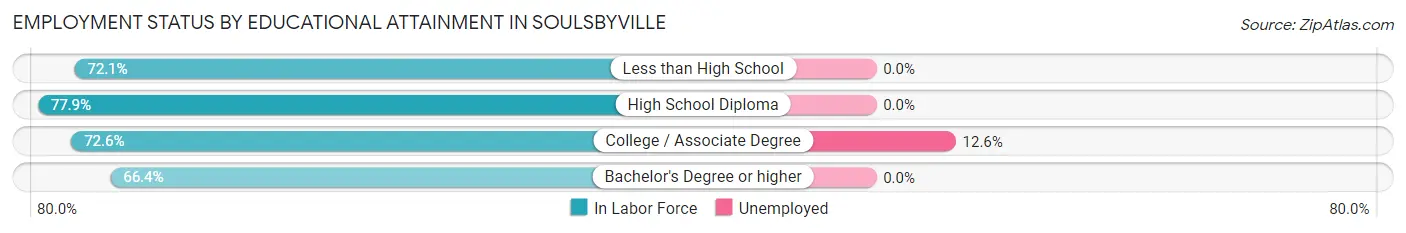
| Educational Attainment | In Labor Force | Unemployed |
| Less than High School | 31 (72.1%) | 0 (0.0%) |
| High School Diploma | 327 (77.9%) | 0 (0.0%) |
| College / Associate Degree | 238 (72.6%) | 41 (12.6%) |
| Bachelor's Degree or higher | 95 (66.4%) | 0 (0.0%) |
| Total | 691 (74.0%) | 40 (4.3%) |
Employment Occupations by Sex in Soulsbyville
Management, Business, Science and Arts Occupations
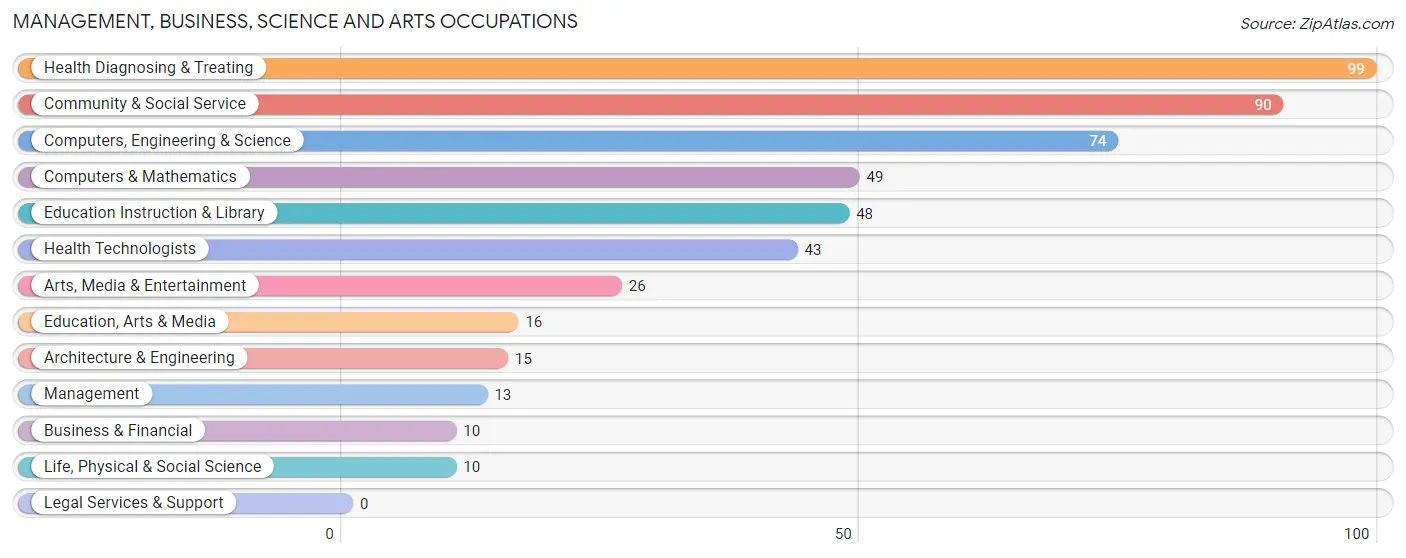
The most common Management, Business, Science and Arts occupations in Soulsbyville are Health Diagnosing & Treating (99 | 10.8%), Community & Social Service (90 | 9.8%), Computers, Engineering & Science (74 | 8.1%), Computers & Mathematics (49 | 5.3%), and Education Instruction & Library (48 | 5.2%).
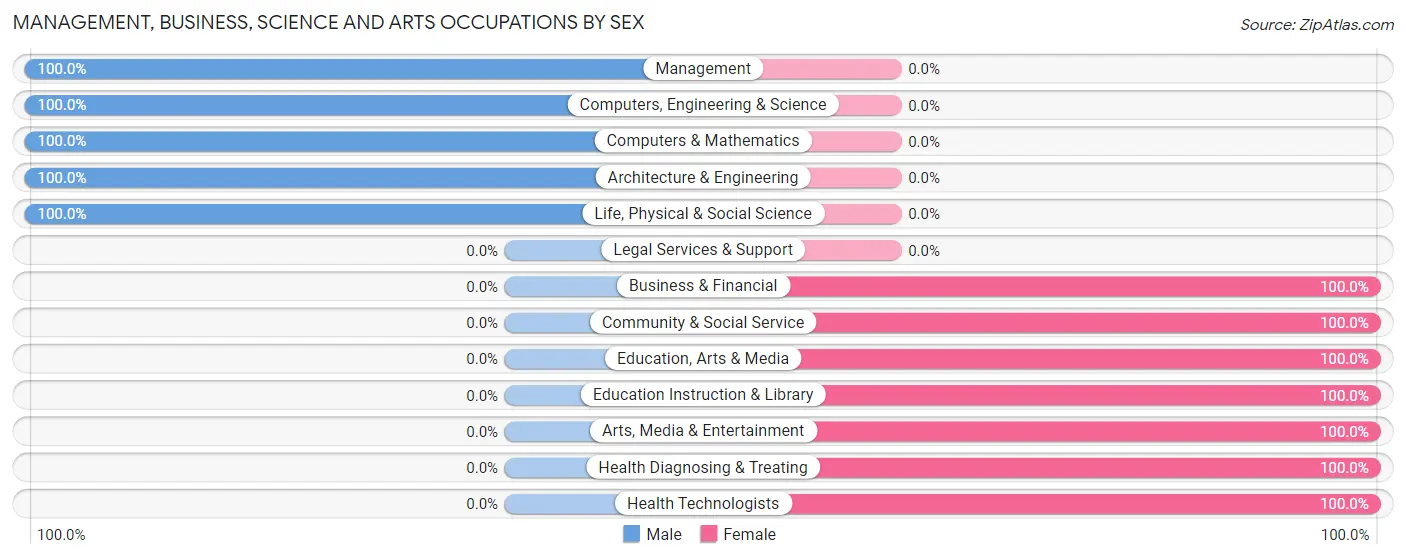
Management, Business, Science and Arts Occupations by Sex
Within the Management, Business, Science and Arts occupations in Soulsbyville, the most male-oriented occupations are Management (100.0%), Computers, Engineering & Science (100.0%), and Computers & Mathematics (100.0%), while the most female-oriented occupations are Business & Financial (100.0%), Community & Social Service (100.0%), and Education, Arts & Media (100.0%).
| Occupation | Male | Female |
| Management | 13 (100.0%) | 0 (0.0%) |
| Business & Financial | 0 (0.0%) | 10 (100.0%) |
| Computers, Engineering & Science | 74 (100.0%) | 0 (0.0%) |
| Computers & Mathematics | 49 (100.0%) | 0 (0.0%) |
| Architecture & Engineering | 15 (100.0%) | 0 (0.0%) |
| Life, Physical & Social Science | 10 (100.0%) | 0 (0.0%) |
| Community & Social Service | 0 (0.0%) | 90 (100.0%) |
| Education, Arts & Media | 0 (0.0%) | 16 (100.0%) |
| Legal Services & Support | 0 (0.0%) | 0 (0.0%) |
| Education Instruction & Library | 0 (0.0%) | 48 (100.0%) |
| Arts, Media & Entertainment | 0 (0.0%) | 26 (100.0%) |
| Health Diagnosing & Treating | 0 (0.0%) | 99 (100.0%) |
| Health Technologists | 0 (0.0%) | 43 (100.0%) |
| Total (Category) | 87 (30.4%) | 199 (69.6%) |
| Total (Overall) | 502 (54.8%) | 414 (45.2%) |
Services Occupations
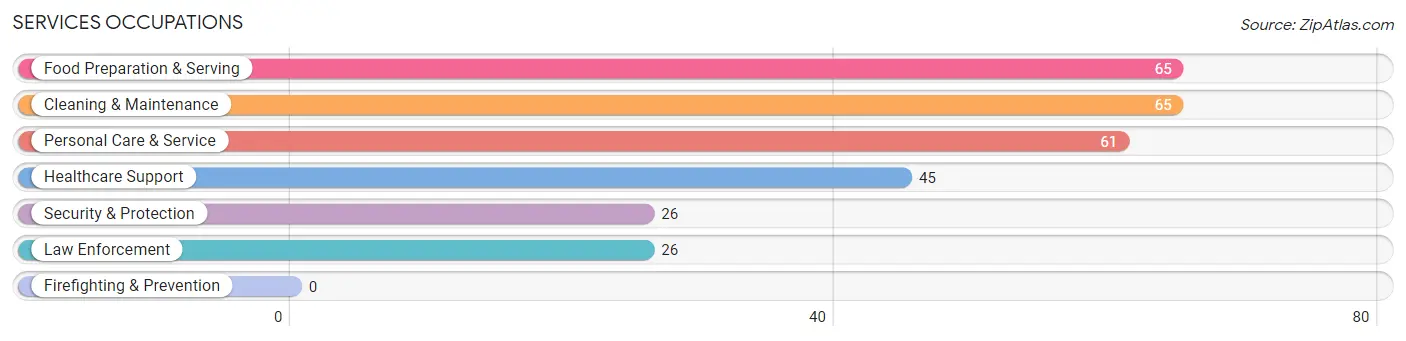
The most common Services occupations in Soulsbyville are Food Preparation & Serving (65 | 7.1%), Cleaning & Maintenance (65 | 7.1%), Personal Care & Service (61 | 6.7%), Healthcare Support (45 | 4.9%), and Security & Protection (26 | 2.8%).
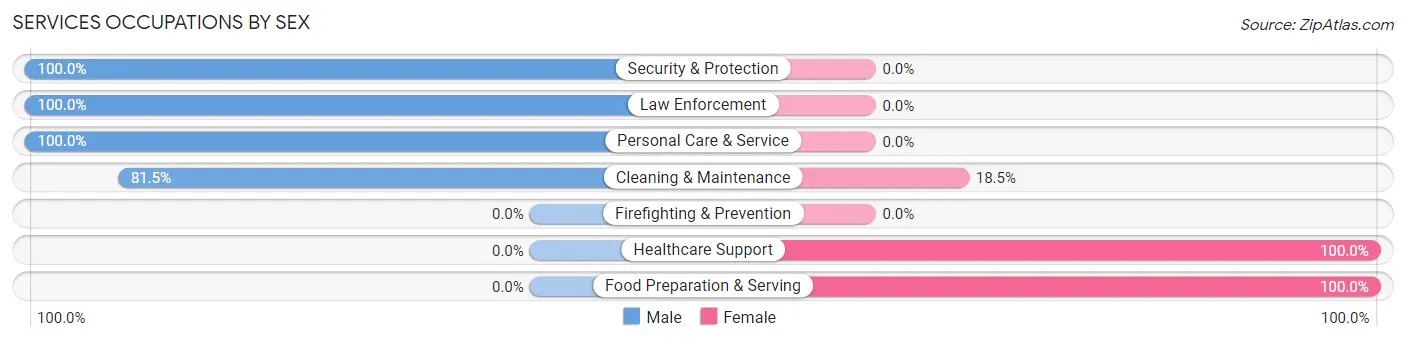
Services Occupations by Sex
Within the Services occupations in Soulsbyville, the most male-oriented occupations are Security & Protection (100.0%), Law Enforcement (100.0%), and Personal Care & Service (100.0%), while the most female-oriented occupations are Healthcare Support (100.0%), Food Preparation & Serving (100.0%), and Cleaning & Maintenance (18.5%).
| Occupation | Male | Female |
| Healthcare Support | 0 (0.0%) | 45 (100.0%) |
| Security & Protection | 26 (100.0%) | 0 (0.0%) |
| Firefighting & Prevention | 0 (0.0%) | 0 (0.0%) |
| Law Enforcement | 26 (100.0%) | 0 (0.0%) |
| Food Preparation & Serving | 0 (0.0%) | 65 (100.0%) |
| Cleaning & Maintenance | 53 (81.5%) | 12 (18.5%) |
| Personal Care & Service | 61 (100.0%) | 0 (0.0%) |
| Total (Category) | 140 (53.4%) | 122 (46.6%) |
| Total (Overall) | 502 (54.8%) | 414 (45.2%) |
Sales and Office Occupations
The most common Sales and Office occupations in Soulsbyville are Office & Administration (90 | 9.8%), and Sales & Related (6 | 0.7%).
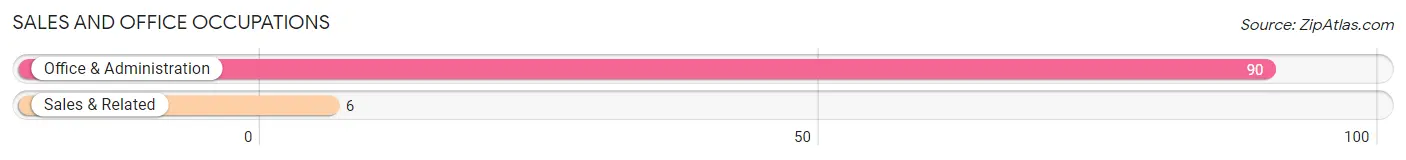
Sales and Office Occupations by Sex
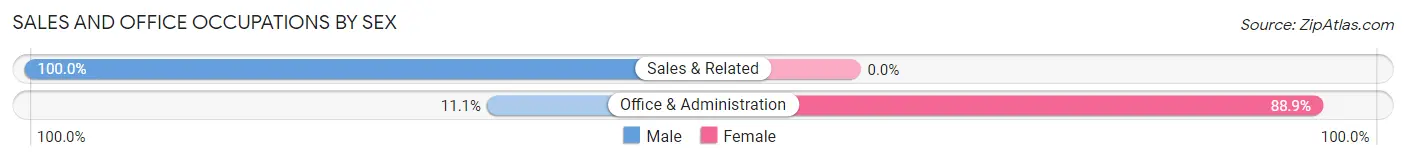
| Occupation | Male | Female |
| Sales & Related | 6 (100.0%) | 0 (0.0%) |
| Office & Administration | 10 (11.1%) | 80 (88.9%) |
| Total (Category) | 16 (16.7%) | 80 (83.3%) |
| Total (Overall) | 502 (54.8%) | 414 (45.2%) |
Natural Resources, Construction and Maintenance Occupations
The most common Natural Resources, Construction and Maintenance occupations in Soulsbyville are Installation, Maintenance & Repair (150 | 16.4%), and Construction & Extraction (74 | 8.1%).
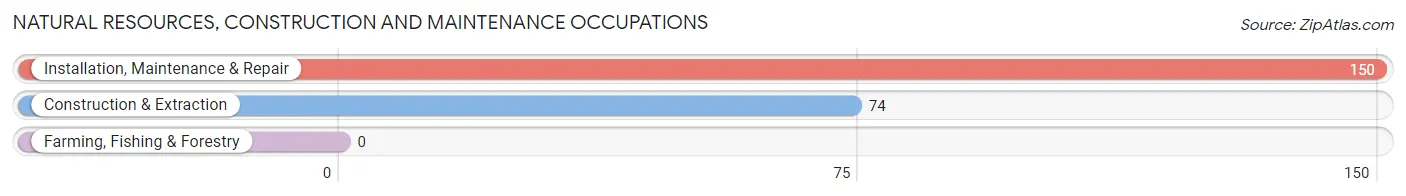
Natural Resources, Construction and Maintenance Occupations by Sex
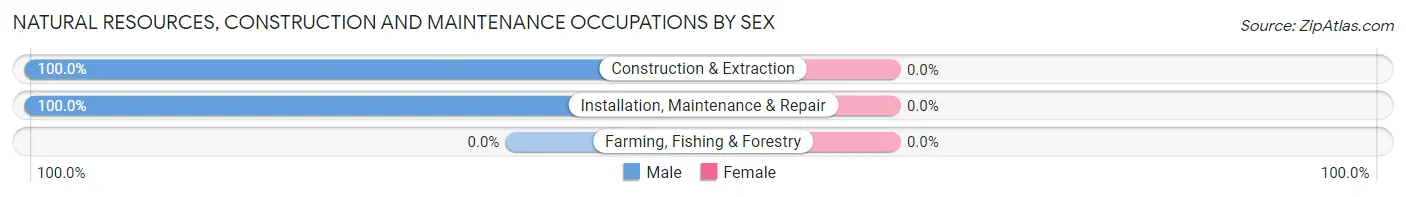
| Occupation | Male | Female |
| Farming, Fishing & Forestry | 0 (0.0%) | 0 (0.0%) |
| Construction & Extraction | 74 (100.0%) | 0 (0.0%) |
| Installation, Maintenance & Repair | 150 (100.0%) | 0 (0.0%) |
| Total (Category) | 224 (100.0%) | 0 (0.0%) |
| Total (Overall) | 502 (54.8%) | 414 (45.2%) |
Production, Transportation and Moving Occupations
The most common Production, Transportation and Moving occupations in Soulsbyville are Production (35 | 3.8%), and Transportation (13 | 1.4%).
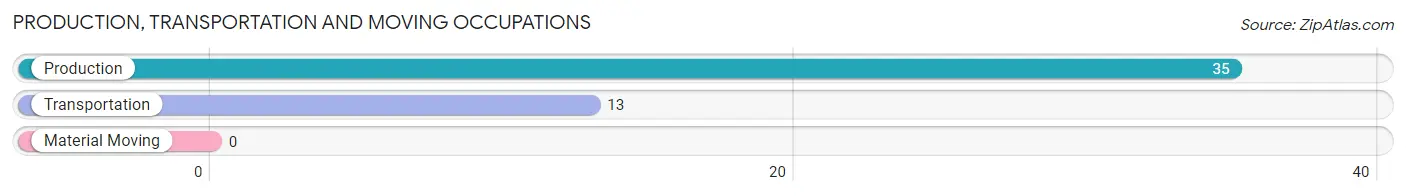
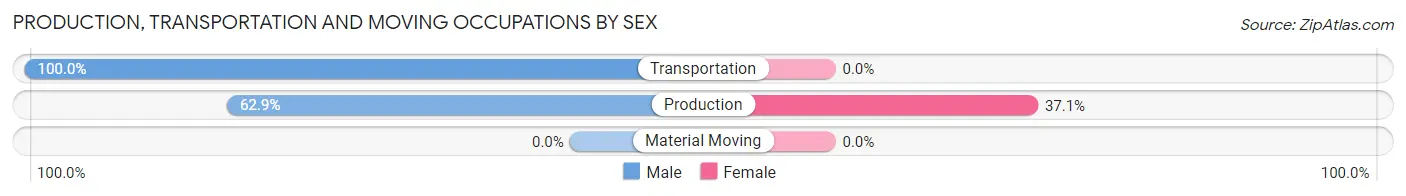
Production, Transportation and Moving Occupations by Sex
| Occupation | Male | Female |
| Production | 22 (62.9%) | 13 (37.1%) |
| Transportation | 13 (100.0%) | 0 (0.0%) |
| Material Moving | 0 (0.0%) | 0 (0.0%) |
| Total (Category) | 35 (72.9%) | 13 (27.1%) |
| Total (Overall) | 502 (54.8%) | 414 (45.2%) |
Employment Industries by Sex in Soulsbyville
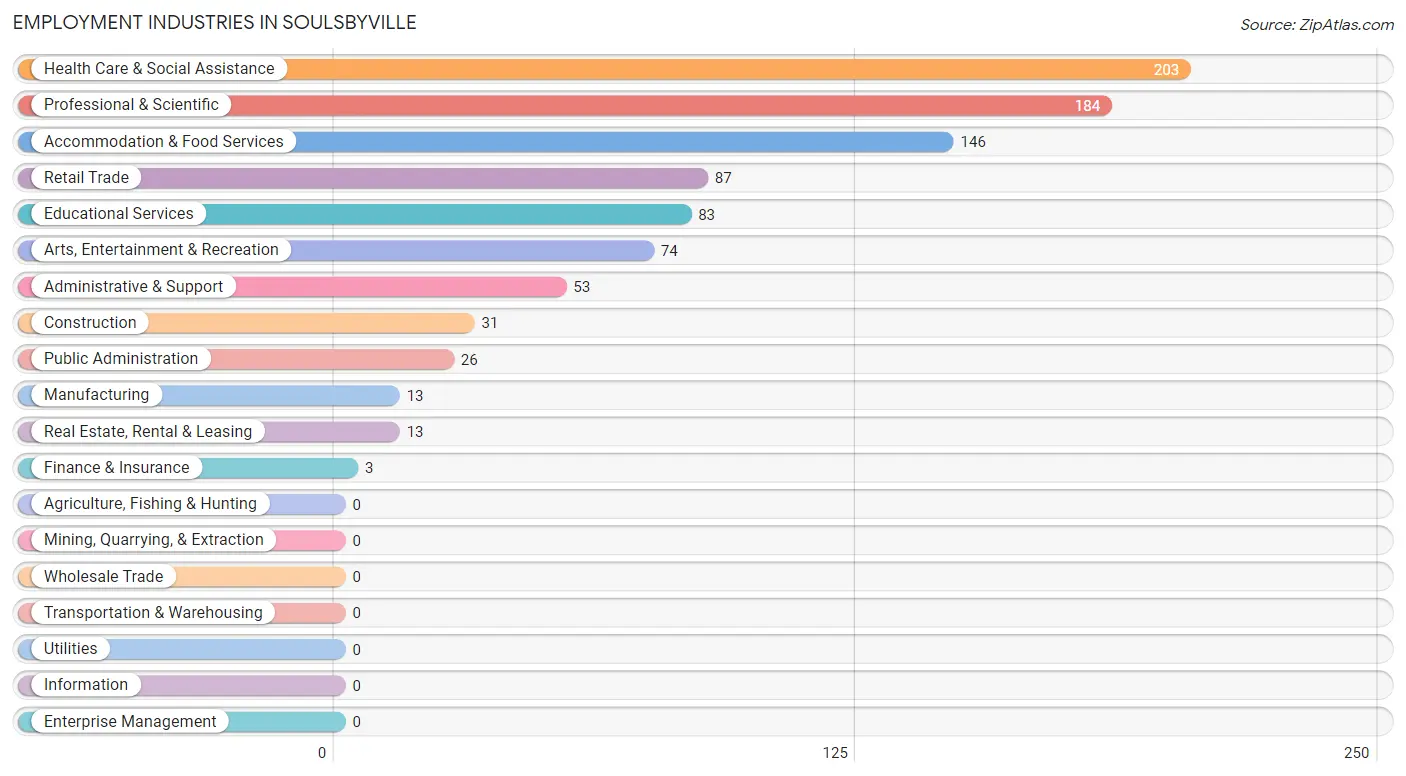
Employment Industries in Soulsbyville
The major employment industries in Soulsbyville include Health Care & Social Assistance (203 | 22.2%), Professional & Scientific (184 | 20.1%), Accommodation & Food Services (146 | 15.9%), Retail Trade (87 | 9.5%), and Educational Services (83 | 9.1%).
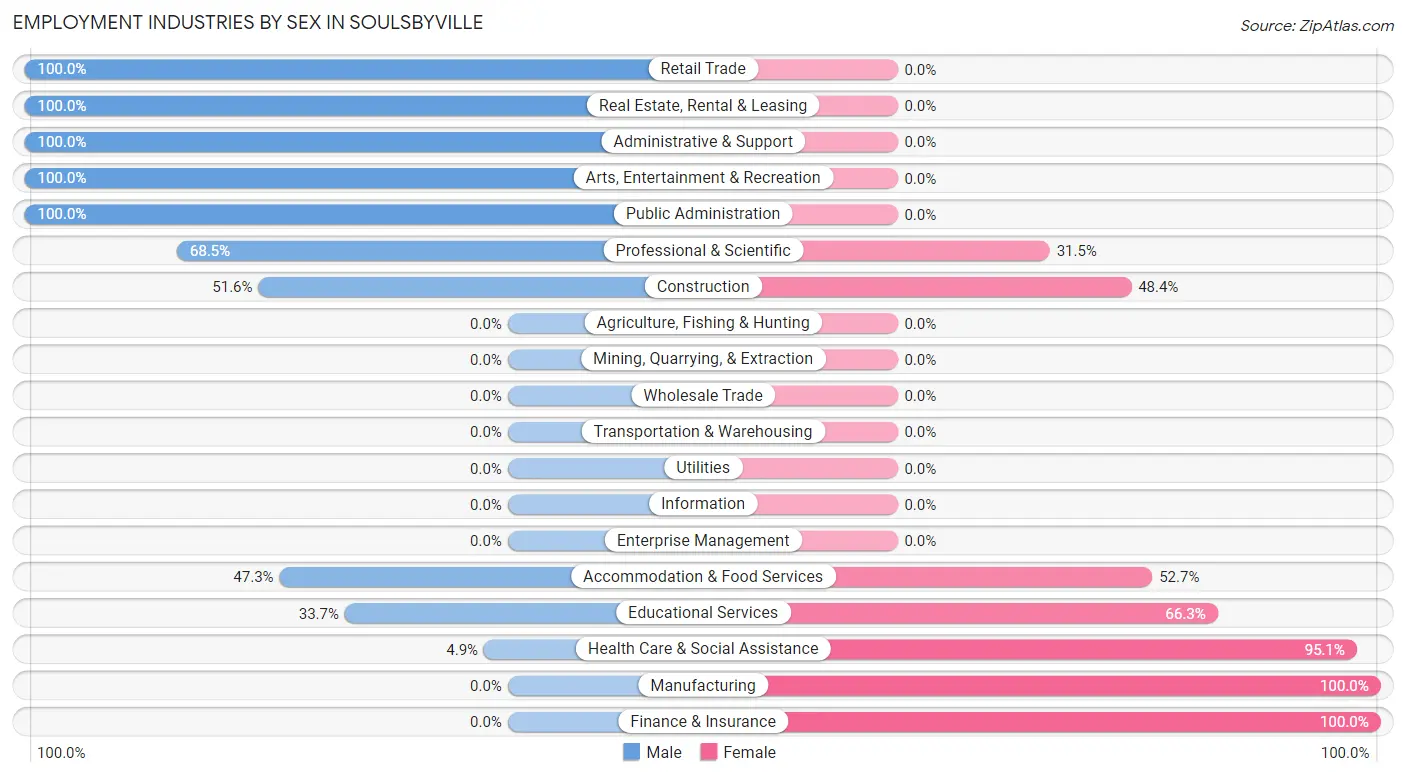
Employment Industries by Sex in Soulsbyville
The Soulsbyville industries that see more men than women are Retail Trade (100.0%), Real Estate, Rental & Leasing (100.0%), and Administrative & Support (100.0%), whereas the industries that tend to have a higher number of women are Manufacturing (100.0%), Finance & Insurance (100.0%), and Health Care & Social Assistance (95.1%).
| Industry | Male | Female |
| Agriculture, Fishing & Hunting | 0 (0.0%) | 0 (0.0%) |
| Mining, Quarrying, & Extraction | 0 (0.0%) | 0 (0.0%) |
| Construction | 16 (51.6%) | 15 (48.4%) |
| Manufacturing | 0 (0.0%) | 13 (100.0%) |
| Wholesale Trade | 0 (0.0%) | 0 (0.0%) |
| Retail Trade | 87 (100.0%) | 0 (0.0%) |
| Transportation & Warehousing | 0 (0.0%) | 0 (0.0%) |
| Utilities | 0 (0.0%) | 0 (0.0%) |
| Information | 0 (0.0%) | 0 (0.0%) |
| Finance & Insurance | 0 (0.0%) | 3 (100.0%) |
| Real Estate, Rental & Leasing | 13 (100.0%) | 0 (0.0%) |
| Professional & Scientific | 126 (68.5%) | 58 (31.5%) |
| Enterprise Management | 0 (0.0%) | 0 (0.0%) |
| Administrative & Support | 53 (100.0%) | 0 (0.0%) |
| Educational Services | 28 (33.7%) | 55 (66.3%) |
| Health Care & Social Assistance | 10 (4.9%) | 193 (95.1%) |
| Arts, Entertainment & Recreation | 74 (100.0%) | 0 (0.0%) |
| Accommodation & Food Services | 69 (47.3%) | 77 (52.7%) |
| Public Administration | 26 (100.0%) | 0 (0.0%) |
| Total | 502 (54.8%) | 414 (45.2%) |
Education in Soulsbyville
School Enrollment in Soulsbyville
The most common levels of schooling among the 413 students in Soulsbyville are elementary school (244 | 59.1%), middle school (53 | 12.8%), and high school (45 | 10.9%).
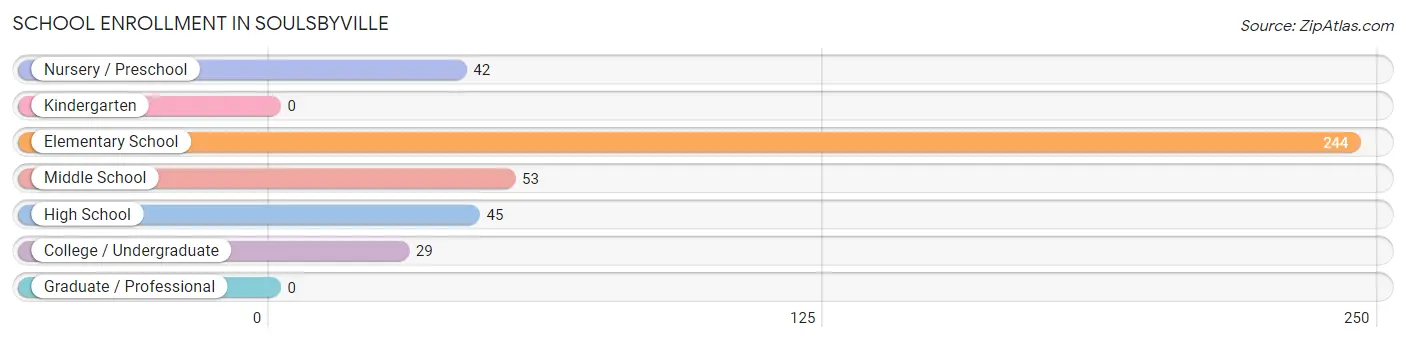
| School Level | # Students | % Students |
| Nursery / Preschool | 42 | 10.2% |
| Kindergarten | 0 | 0.0% |
| Elementary School | 244 | 59.1% |
| Middle School | 53 | 12.8% |
| High School | 45 | 10.9% |
| College / Undergraduate | 29 | 7.0% |
| Graduate / Professional | 0 | 0.0% |
| Total | 413 | 100.0% |
School Enrollment by Age by Funding Source in Soulsbyville
Out of a total of 413 students who are enrolled in schools in Soulsbyville, 171 (41.4%) attend a private institution, while the remaining 242 (58.6%) are enrolled in public schools. The age group of 3 to 4 year olds has the highest likelihood of being enrolled in private schools, with 42 (100.0% in the age bracket) enrolled. Conversely, the age group of 18 to 19 year olds has the lowest likelihood of being enrolled in a private school, with 74 (100.0% in the age bracket) attending a public institution.
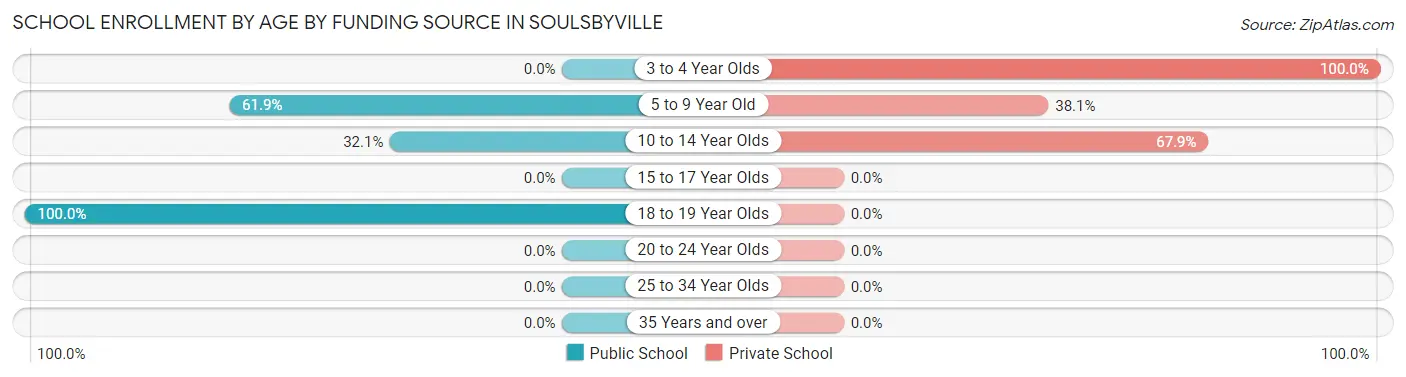
| Age Bracket | Public School | Private School |
| 3 to 4 Year Olds | 0 (0.0%) | 42 (100.0%) |
| 5 to 9 Year Old | 151 (61.9%) | 93 (38.1%) |
| 10 to 14 Year Olds | 17 (32.1%) | 36 (67.9%) |
| 15 to 17 Year Olds | 0 (0.0%) | 0 (0.0%) |
| 18 to 19 Year Olds | 74 (100.0%) | 0 (0.0%) |
| 20 to 24 Year Olds | 0 (0.0%) | 0 (0.0%) |
| 25 to 34 Year Olds | 0 (0.0%) | 0 (0.0%) |
| 35 Years and over | 0 (0.0%) | 0 (0.0%) |
| Total | 242 (58.6%) | 171 (41.4%) |
Educational Attainment by Field of Study in Soulsbyville
Psychology (68 | 21.7%), bio, nature & agricultural (49 | 15.6%), social sciences (49 | 15.6%), business (42 | 13.4%), and arts & humanities (42 | 13.4%) are the most common fields of study among 314 individuals in Soulsbyville who have obtained a bachelor's degree or higher.
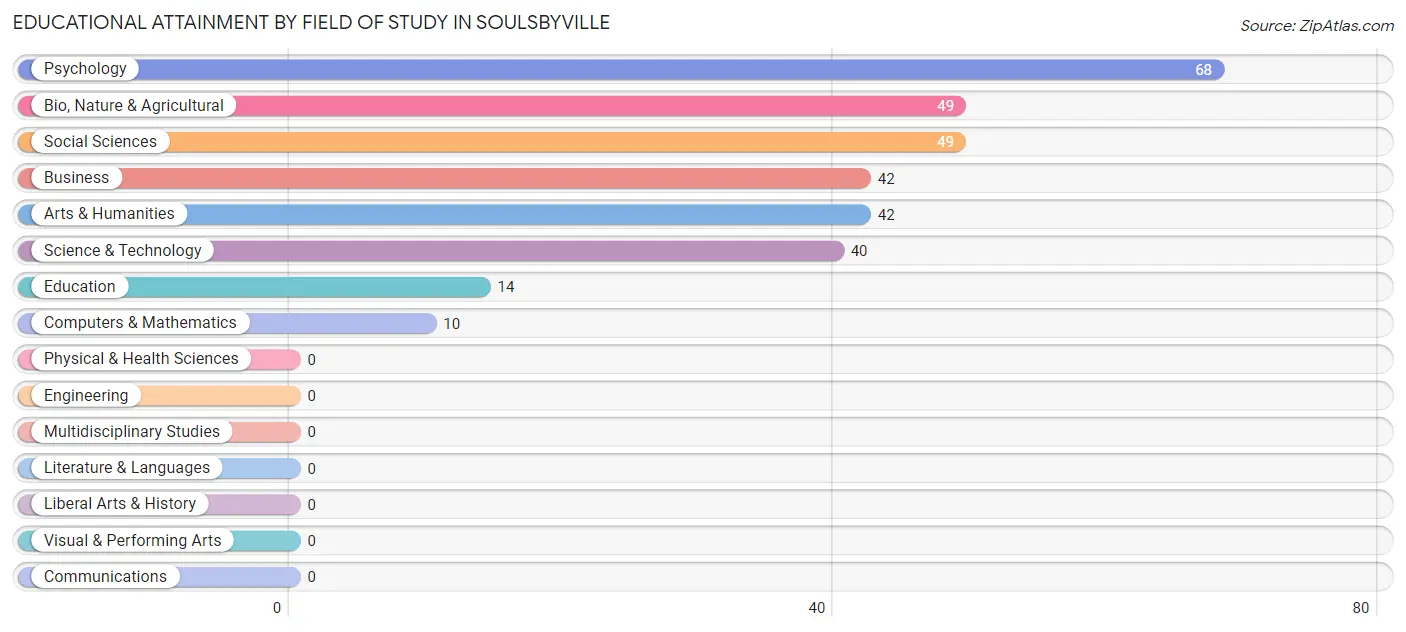
| Field of Study | # Graduates | % Graduates |
| Computers & Mathematics | 10 | 3.2% |
| Bio, Nature & Agricultural | 49 | 15.6% |
| Physical & Health Sciences | 0 | 0.0% |
| Psychology | 68 | 21.7% |
| Social Sciences | 49 | 15.6% |
| Engineering | 0 | 0.0% |
| Multidisciplinary Studies | 0 | 0.0% |
| Science & Technology | 40 | 12.7% |
| Business | 42 | 13.4% |
| Education | 14 | 4.5% |
| Literature & Languages | 0 | 0.0% |
| Liberal Arts & History | 0 | 0.0% |
| Visual & Performing Arts | 0 | 0.0% |
| Communications | 0 | 0.0% |
| Arts & Humanities | 42 | 13.4% |
| Total | 314 | 100.0% |
Transportation & Commute in Soulsbyville
Vehicle Availability by Sex in Soulsbyville
The most prevalent vehicle ownership categories in Soulsbyville are males with 3 vehicles (262, accounting for 53.1%) and females with 3 vehicles (186, making up 71.0%).
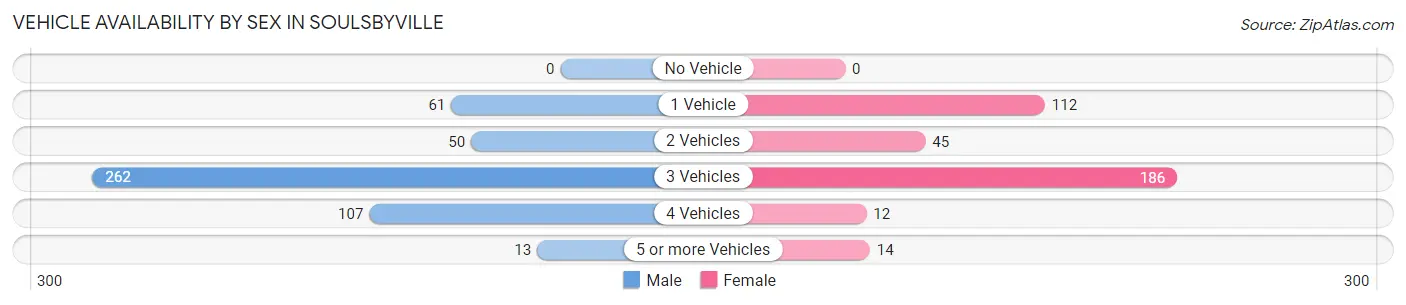
| Vehicles Available | Male | Female |
| No Vehicle | 0 (0.0%) | 0 (0.0%) |
| 1 Vehicle | 61 (12.4%) | 112 (30.3%) |
| 2 Vehicles | 50 (10.1%) | 45 (12.2%) |
| 3 Vehicles | 262 (53.1%) | 186 (50.4%) |
| 4 Vehicles | 107 (21.7%) | 12 (3.3%) |
| 5 or more Vehicles | 13 (2.6%) | 14 (3.8%) |
| Total | 493 (100.0%) | 369 (100.0%) |
Commute Time in Soulsbyville
The most frequently occuring commute durations in Soulsbyville are 15 to 19 minutes (189 commuters, 23.4%), 60 to 89 minutes (125 commuters, 15.5%), and 90 or more minutes (111 commuters, 13.8%).
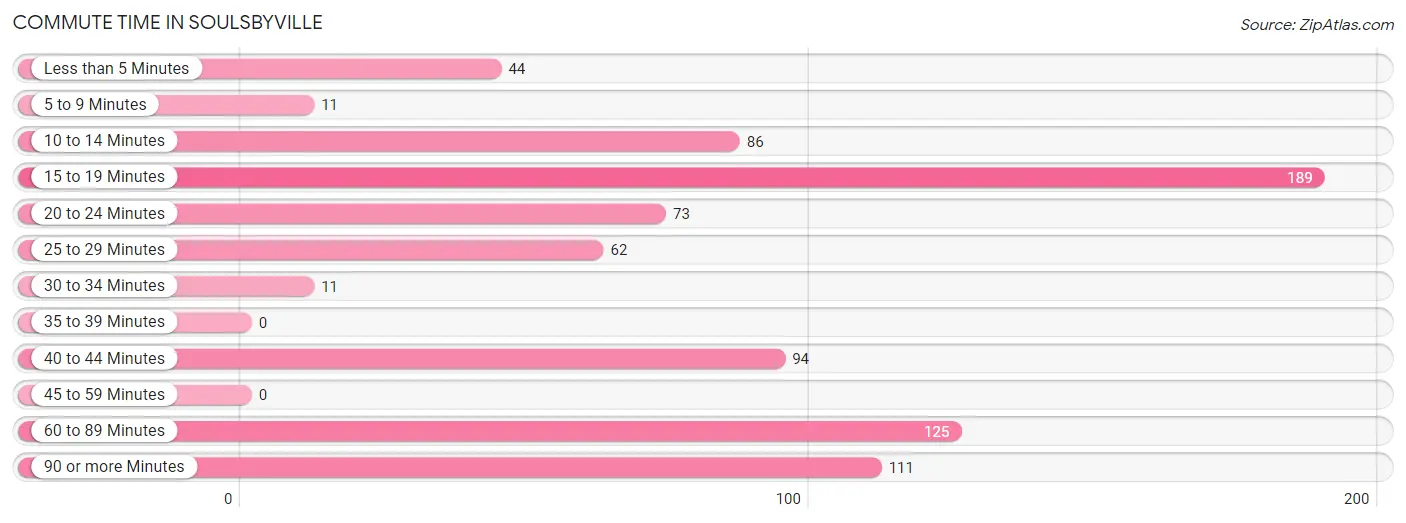
| Commute Time | # Commuters | % Commuters |
| Less than 5 Minutes | 44 | 5.5% |
| 5 to 9 Minutes | 11 | 1.4% |
| 10 to 14 Minutes | 86 | 10.7% |
| 15 to 19 Minutes | 189 | 23.4% |
| 20 to 24 Minutes | 73 | 9.1% |
| 25 to 29 Minutes | 62 | 7.7% |
| 30 to 34 Minutes | 11 | 1.4% |
| 35 to 39 Minutes | 0 | 0.0% |
| 40 to 44 Minutes | 94 | 11.7% |
| 45 to 59 Minutes | 0 | 0.0% |
| 60 to 89 Minutes | 125 | 15.5% |
| 90 or more Minutes | 111 | 13.8% |
Commute Time by Sex in Soulsbyville
The most common commute times in Soulsbyville are 60 to 89 minutes (122 commuters, 25.4%) for males and 15 to 19 minutes (118 commuters, 36.2%) for females.
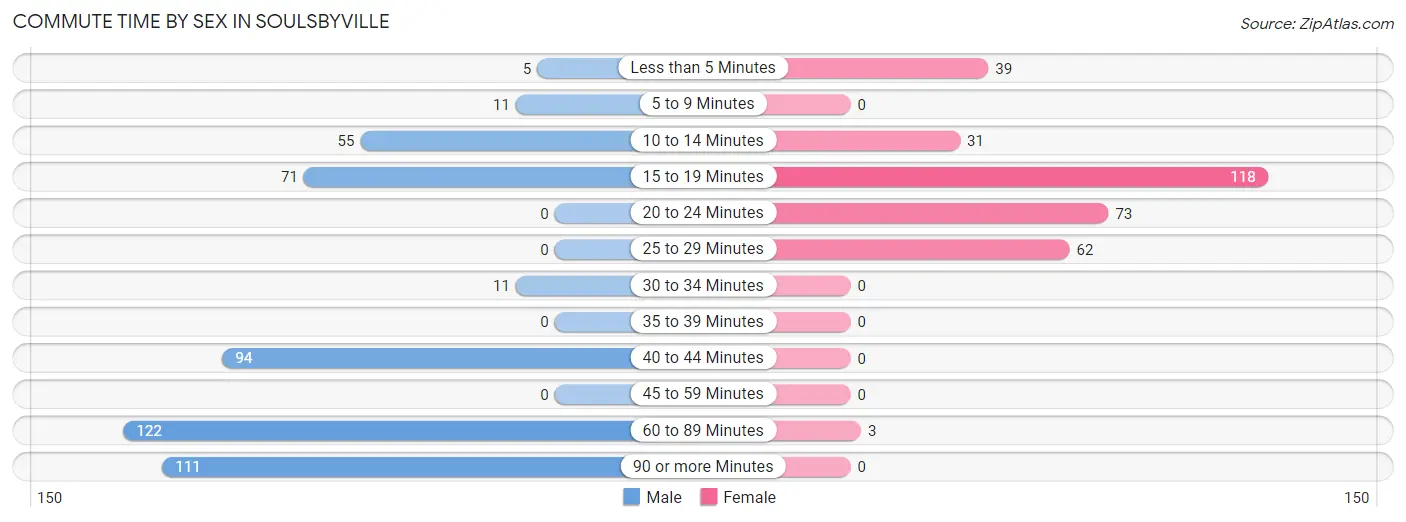
| Commute Time | Male | Female |
| Less than 5 Minutes | 5 (1.0%) | 39 (12.0%) |
| 5 to 9 Minutes | 11 (2.3%) | 0 (0.0%) |
| 10 to 14 Minutes | 55 (11.5%) | 31 (9.5%) |
| 15 to 19 Minutes | 71 (14.8%) | 118 (36.2%) |
| 20 to 24 Minutes | 0 (0.0%) | 73 (22.4%) |
| 25 to 29 Minutes | 0 (0.0%) | 62 (19.0%) |
| 30 to 34 Minutes | 11 (2.3%) | 0 (0.0%) |
| 35 to 39 Minutes | 0 (0.0%) | 0 (0.0%) |
| 40 to 44 Minutes | 94 (19.6%) | 0 (0.0%) |
| 45 to 59 Minutes | 0 (0.0%) | 0 (0.0%) |
| 60 to 89 Minutes | 122 (25.4%) | 3 (0.9%) |
| 90 or more Minutes | 111 (23.1%) | 0 (0.0%) |
Time of Departure to Work by Sex in Soulsbyville
The most frequent times of departure to work in Soulsbyville are 4:00 PM to 11:59 PM (119, 24.8%) for males and 8:00 AM to 8:29 AM (101, 31.0%) for females.
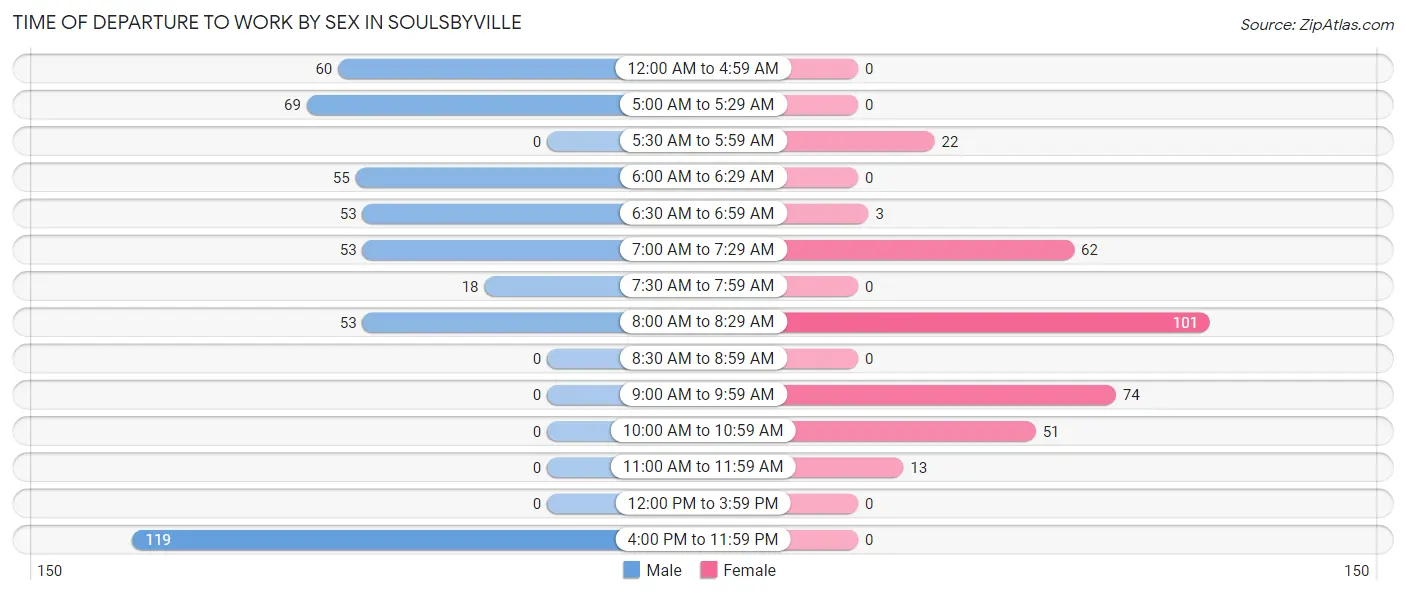
| Time of Departure | Male | Female |
| 12:00 AM to 4:59 AM | 60 (12.5%) | 0 (0.0%) |
| 5:00 AM to 5:29 AM | 69 (14.4%) | 0 (0.0%) |
| 5:30 AM to 5:59 AM | 0 (0.0%) | 22 (6.8%) |
| 6:00 AM to 6:29 AM | 55 (11.5%) | 0 (0.0%) |
| 6:30 AM to 6:59 AM | 53 (11.0%) | 3 (0.9%) |
| 7:00 AM to 7:29 AM | 53 (11.0%) | 62 (19.0%) |
| 7:30 AM to 7:59 AM | 18 (3.7%) | 0 (0.0%) |
| 8:00 AM to 8:29 AM | 53 (11.0%) | 101 (31.0%) |
| 8:30 AM to 8:59 AM | 0 (0.0%) | 0 (0.0%) |
| 9:00 AM to 9:59 AM | 0 (0.0%) | 74 (22.7%) |
| 10:00 AM to 10:59 AM | 0 (0.0%) | 51 (15.6%) |
| 11:00 AM to 11:59 AM | 0 (0.0%) | 13 (4.0%) |
| 12:00 PM to 3:59 PM | 0 (0.0%) | 0 (0.0%) |
| 4:00 PM to 11:59 PM | 119 (24.8%) | 0 (0.0%) |
| Total | 480 (100.0%) | 326 (100.0%) |
Housing Occupancy in Soulsbyville
Occupancy by Ownership in Soulsbyville
Of the total 685 dwellings in Soulsbyville, owner-occupied units account for 563 (82.2%), while renter-occupied units make up 122 (17.8%).
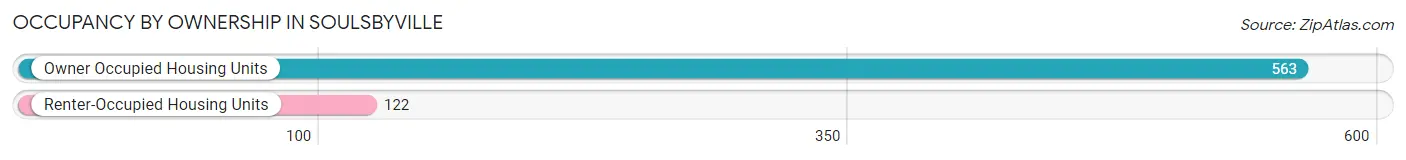
| Occupancy | # Housing Units | % Housing Units |
| Owner Occupied Housing Units | 563 | 82.2% |
| Renter-Occupied Housing Units | 122 | 17.8% |
| Total Occupied Housing Units | 685 | 100.0% |
Occupancy by Household Size in Soulsbyville
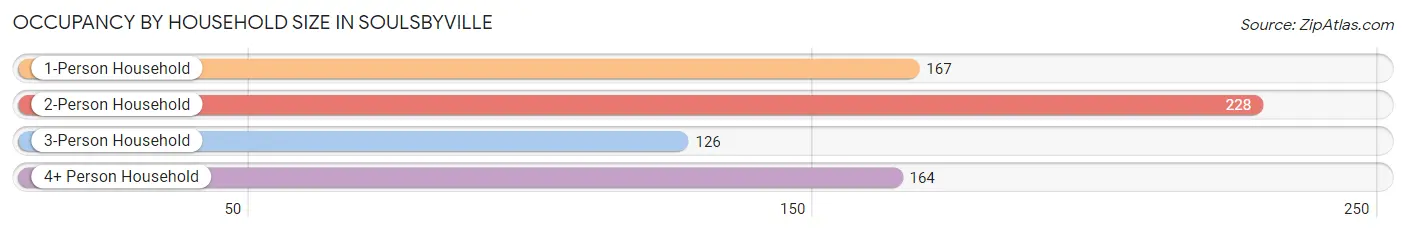
| Household Size | # Housing Units | % Housing Units |
| 1-Person Household | 167 | 24.4% |
| 2-Person Household | 228 | 33.3% |
| 3-Person Household | 126 | 18.4% |
| 4+ Person Household | 164 | 23.9% |
| Total Housing Units | 685 | 100.0% |
Occupancy by Ownership by Household Size in Soulsbyville
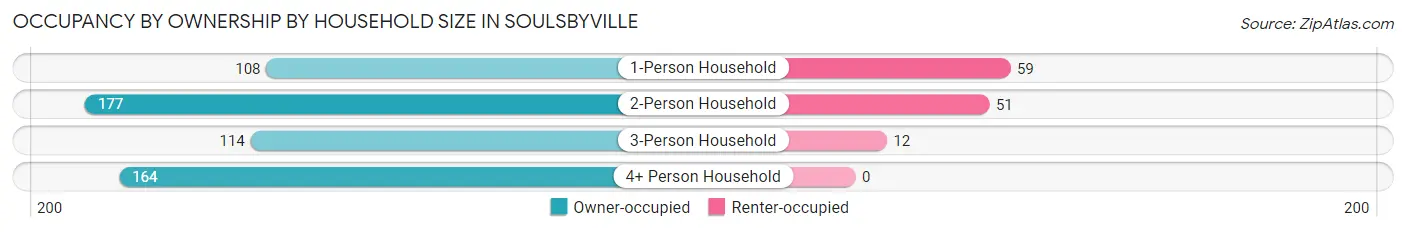
| Household Size | Owner-occupied | Renter-occupied |
| 1-Person Household | 108 (64.7%) | 59 (35.3%) |
| 2-Person Household | 177 (77.6%) | 51 (22.4%) |
| 3-Person Household | 114 (90.5%) | 12 (9.5%) |
| 4+ Person Household | 164 (100.0%) | 0 (0.0%) |
| Total Housing Units | 563 (82.2%) | 122 (17.8%) |
Occupancy by Educational Attainment in Soulsbyville
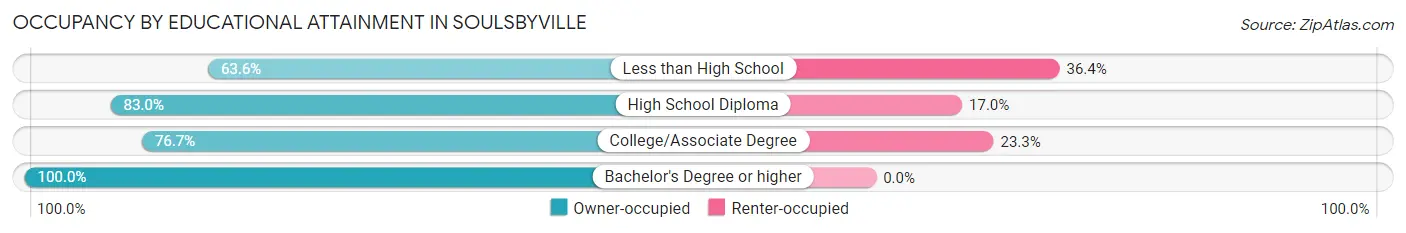
| Household Size | Owner-occupied | Renter-occupied |
| Less than High School | 21 (63.6%) | 12 (36.4%) |
| High School Diploma | 224 (83.0%) | 46 (17.0%) |
| College/Associate Degree | 211 (76.7%) | 64 (23.3%) |
| Bachelor's Degree or higher | 107 (100.0%) | 0 (0.0%) |
Occupancy by Age of Householder in Soulsbyville
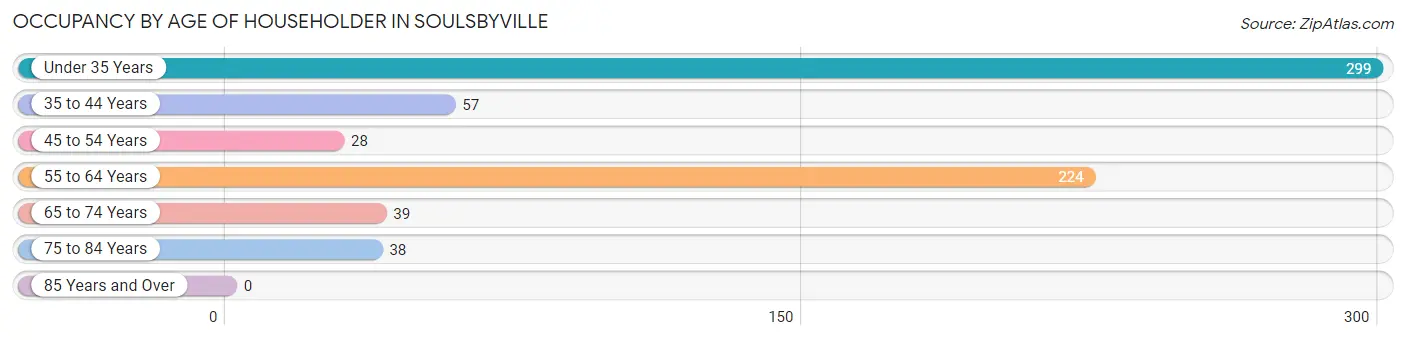
| Age Bracket | # Households | % Households |
| Under 35 Years | 299 | 43.6% |
| 35 to 44 Years | 57 | 8.3% |
| 45 to 54 Years | 28 | 4.1% |
| 55 to 64 Years | 224 | 32.7% |
| 65 to 74 Years | 39 | 5.7% |
| 75 to 84 Years | 38 | 5.6% |
| 85 Years and Over | 0 | 0.0% |
| Total | 685 | 100.0% |
Housing Finances in Soulsbyville
Median Income by Occupancy in Soulsbyville
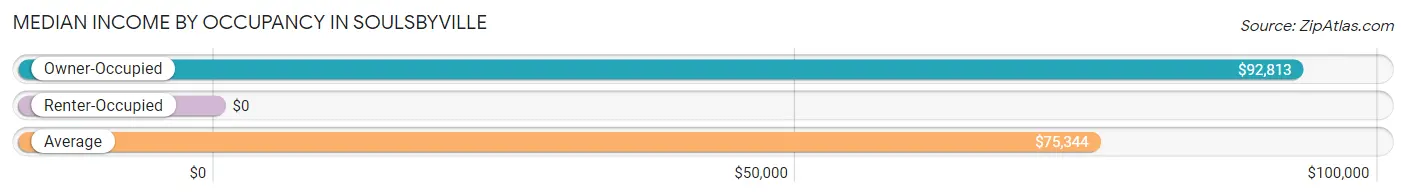
| Occupancy Type | # Households | Median Income |
| Owner-Occupied | 563 (82.2%) | $92,813 |
| Renter-Occupied | 122 (17.8%) | $0 |
| Average | 685 (100.0%) | $75,344 |
Occupancy by Householder Income Bracket in Soulsbyville
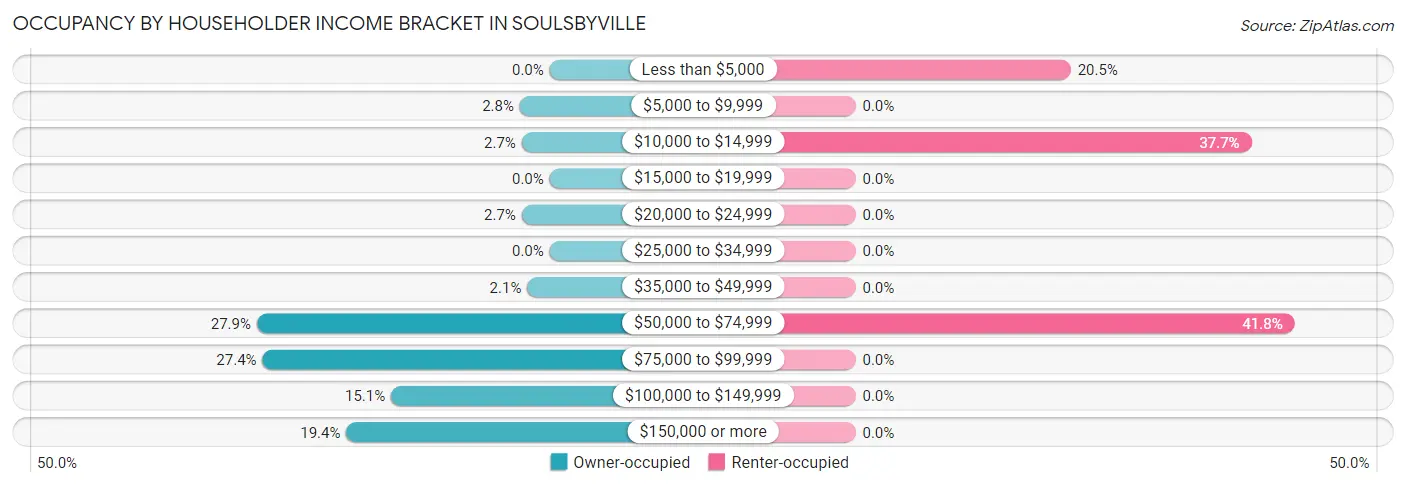
| Income Bracket | Owner-occupied | Renter-occupied |
| Less than $5,000 | 0 (0.0%) | 25 (20.5%) |
| $5,000 to $9,999 | 16 (2.8%) | 0 (0.0%) |
| $10,000 to $14,999 | 15 (2.7%) | 46 (37.7%) |
| $15,000 to $19,999 | 0 (0.0%) | 0 (0.0%) |
| $20,000 to $24,999 | 15 (2.7%) | 0 (0.0%) |
| $25,000 to $34,999 | 0 (0.0%) | 0 (0.0%) |
| $35,000 to $49,999 | 12 (2.1%) | 0 (0.0%) |
| $50,000 to $74,999 | 157 (27.9%) | 51 (41.8%) |
| $75,000 to $99,999 | 154 (27.4%) | 0 (0.0%) |
| $100,000 to $149,999 | 85 (15.1%) | 0 (0.0%) |
| $150,000 or more | 109 (19.4%) | 0 (0.0%) |
| Total | 563 (100.0%) | 122 (100.0%) |
Monthly Housing Cost Tiers in Soulsbyville
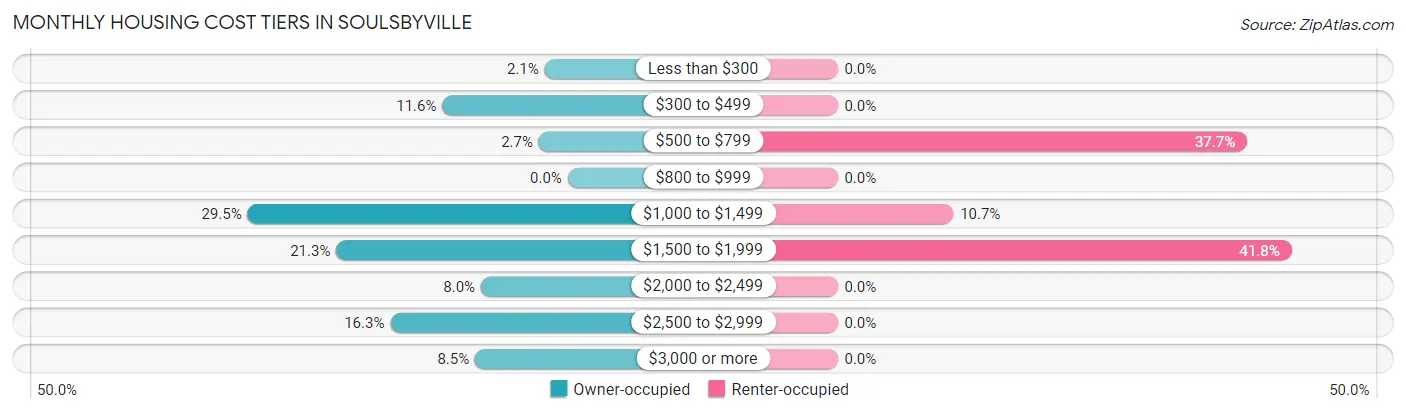
| Monthly Cost | Owner-occupied | Renter-occupied |
| Less than $300 | 12 (2.1%) | 0 (0.0%) |
| $300 to $499 | 65 (11.6%) | 0 (0.0%) |
| $500 to $799 | 15 (2.7%) | 46 (37.7%) |
| $800 to $999 | 0 (0.0%) | 0 (0.0%) |
| $1,000 to $1,499 | 166 (29.5%) | 13 (10.7%) |
| $1,500 to $1,999 | 120 (21.3%) | 51 (41.8%) |
| $2,000 to $2,499 | 45 (8.0%) | 0 (0.0%) |
| $2,500 to $2,999 | 92 (16.3%) | 0 (0.0%) |
| $3,000 or more | 48 (8.5%) | 0 (0.0%) |
| Total | 563 (100.0%) | 122 (100.0%) |
Physical Housing Characteristics in Soulsbyville
Housing Structures in Soulsbyville
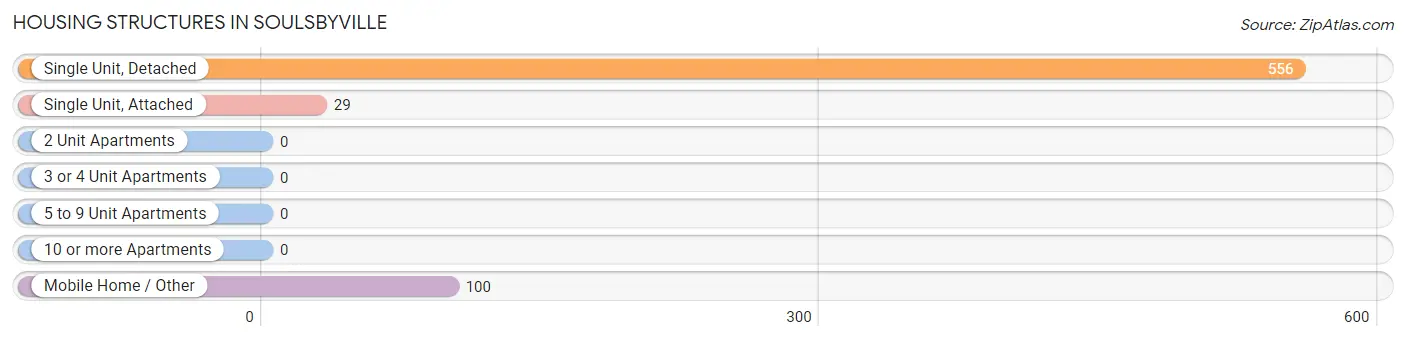
| Structure Type | # Housing Units | % Housing Units |
| Single Unit, Detached | 556 | 81.2% |
| Single Unit, Attached | 29 | 4.2% |
| 2 Unit Apartments | 0 | 0.0% |
| 3 or 4 Unit Apartments | 0 | 0.0% |
| 5 to 9 Unit Apartments | 0 | 0.0% |
| 10 or more Apartments | 0 | 0.0% |
| Mobile Home / Other | 100 | 14.6% |
| Total | 685 | 100.0% |
Housing Structures by Occupancy in Soulsbyville
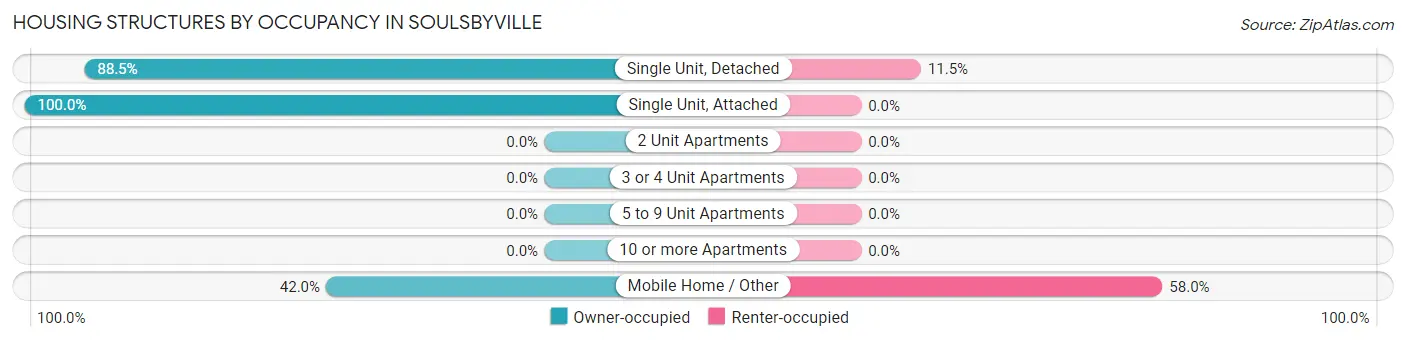
| Structure Type | Owner-occupied | Renter-occupied |
| Single Unit, Detached | 492 (88.5%) | 64 (11.5%) |
| Single Unit, Attached | 29 (100.0%) | 0 (0.0%) |
| 2 Unit Apartments | 0 (0.0%) | 0 (0.0%) |
| 3 or 4 Unit Apartments | 0 (0.0%) | 0 (0.0%) |
| 5 to 9 Unit Apartments | 0 (0.0%) | 0 (0.0%) |
| 10 or more Apartments | 0 (0.0%) | 0 (0.0%) |
| Mobile Home / Other | 42 (42.0%) | 58 (58.0%) |
| Total | 563 (82.2%) | 122 (17.8%) |
Housing Structures by Number of Rooms in Soulsbyville
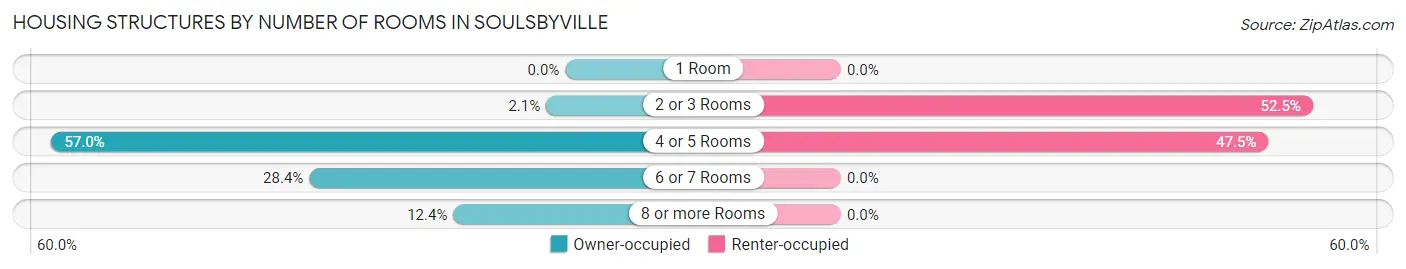
| Number of Rooms | Owner-occupied | Renter-occupied |
| 1 Room | 0 (0.0%) | 0 (0.0%) |
| 2 or 3 Rooms | 12 (2.1%) | 64 (52.5%) |
| 4 or 5 Rooms | 321 (57.0%) | 58 (47.5%) |
| 6 or 7 Rooms | 160 (28.4%) | 0 (0.0%) |
| 8 or more Rooms | 70 (12.4%) | 0 (0.0%) |
| Total | 563 (100.0%) | 122 (100.0%) |
Housing Structure by Heating Type in Soulsbyville
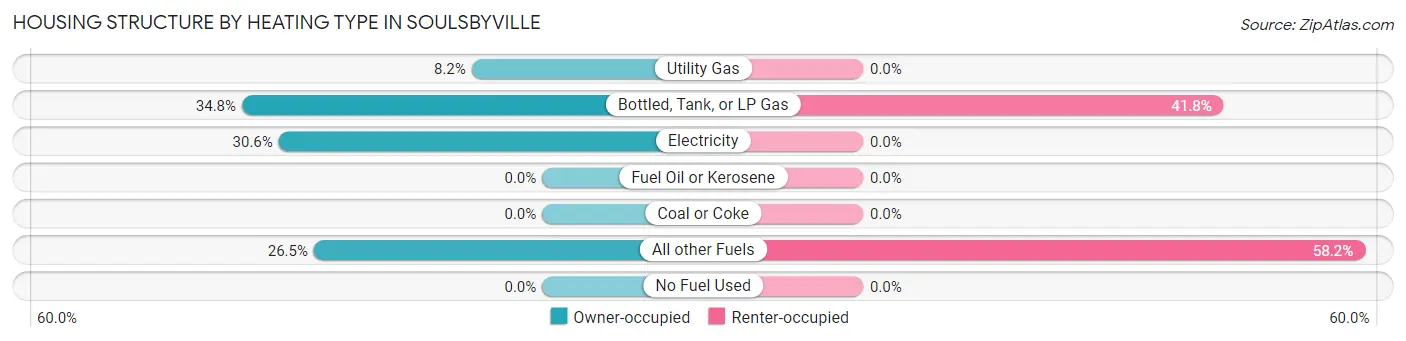
| Heating Type | Owner-occupied | Renter-occupied |
| Utility Gas | 46 (8.2%) | 0 (0.0%) |
| Bottled, Tank, or LP Gas | 196 (34.8%) | 51 (41.8%) |
| Electricity | 172 (30.5%) | 0 (0.0%) |
| Fuel Oil or Kerosene | 0 (0.0%) | 0 (0.0%) |
| Coal or Coke | 0 (0.0%) | 0 (0.0%) |
| All other Fuels | 149 (26.5%) | 71 (58.2%) |
| No Fuel Used | 0 (0.0%) | 0 (0.0%) |
| Total | 563 (100.0%) | 122 (100.0%) |
Household Vehicle Usage in Soulsbyville
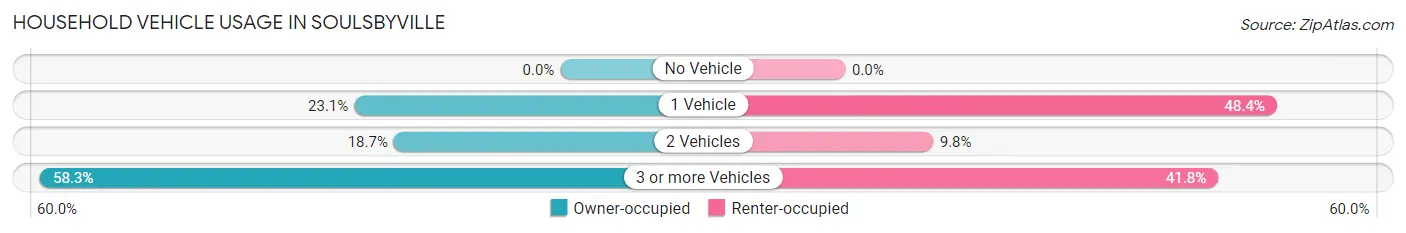
| Vehicles per Household | Owner-occupied | Renter-occupied |
| No Vehicle | 0 (0.0%) | 0 (0.0%) |
| 1 Vehicle | 130 (23.1%) | 59 (48.4%) |
| 2 Vehicles | 105 (18.6%) | 12 (9.8%) |
| 3 or more Vehicles | 328 (58.3%) | 51 (41.8%) |
| Total | 563 (100.0%) | 122 (100.0%) |
Real Estate & Mortgages in Soulsbyville
Real Estate and Mortgage Overview in Soulsbyville
| Characteristic | Without Mortgage | With Mortgage |
| Housing Units | 115 | 448 |
| Median Property Value | $338,600 | $323,000 |
| Median Household Income | - | - |
| Monthly Housing Costs | $470 | $48 |
| Real Estate Taxes | $2,817 | $0 |
Property Value by Mortgage Status in Soulsbyville
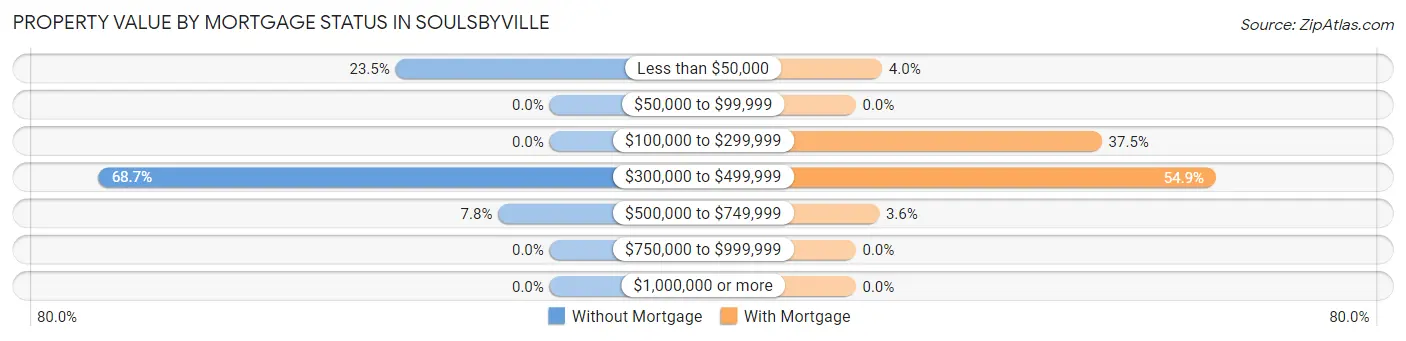
| Property Value | Without Mortgage | With Mortgage |
| Less than $50,000 | 27 (23.5%) | 18 (4.0%) |
| $50,000 to $99,999 | 0 (0.0%) | 0 (0.0%) |
| $100,000 to $299,999 | 0 (0.0%) | 168 (37.5%) |
| $300,000 to $499,999 | 79 (68.7%) | 246 (54.9%) |
| $500,000 to $749,999 | 9 (7.8%) | 16 (3.6%) |
| $750,000 to $999,999 | 0 (0.0%) | 0 (0.0%) |
| $1,000,000 or more | 0 (0.0%) | 0 (0.0%) |
| Total | 115 (100.0%) | 448 (100.0%) |
Household Income by Mortgage Status in Soulsbyville
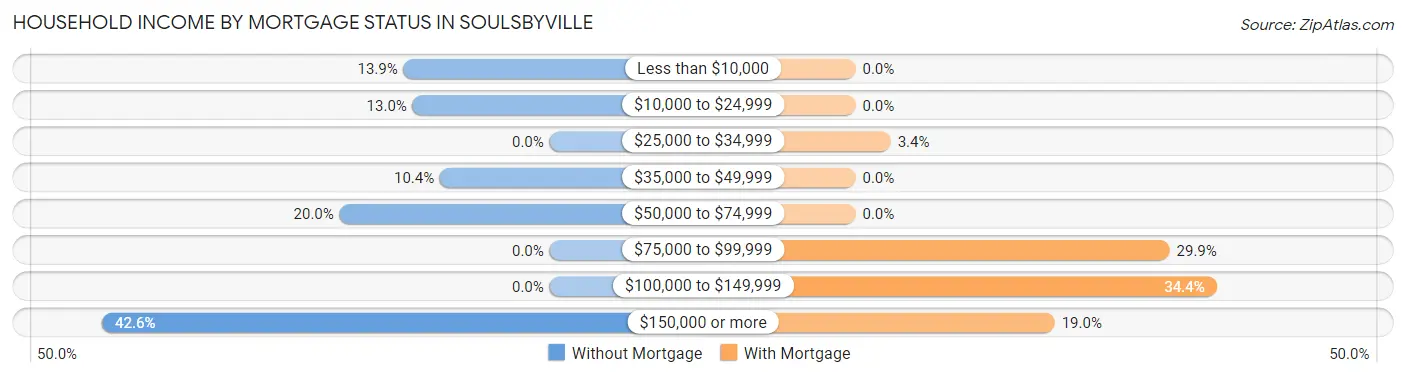
| Household Income | Without Mortgage | With Mortgage |
| Less than $10,000 | 16 (13.9%) | 0 (0.0%) |
| $10,000 to $24,999 | 15 (13.0%) | 0 (0.0%) |
| $25,000 to $34,999 | 0 (0.0%) | 15 (3.4%) |
| $35,000 to $49,999 | 12 (10.4%) | 0 (0.0%) |
| $50,000 to $74,999 | 23 (20.0%) | 0 (0.0%) |
| $75,000 to $99,999 | 0 (0.0%) | 134 (29.9%) |
| $100,000 to $149,999 | 0 (0.0%) | 154 (34.4%) |
| $150,000 or more | 49 (42.6%) | 85 (19.0%) |
| Total | 115 (100.0%) | 448 (100.0%) |
Property Value to Household Income Ratio in Soulsbyville
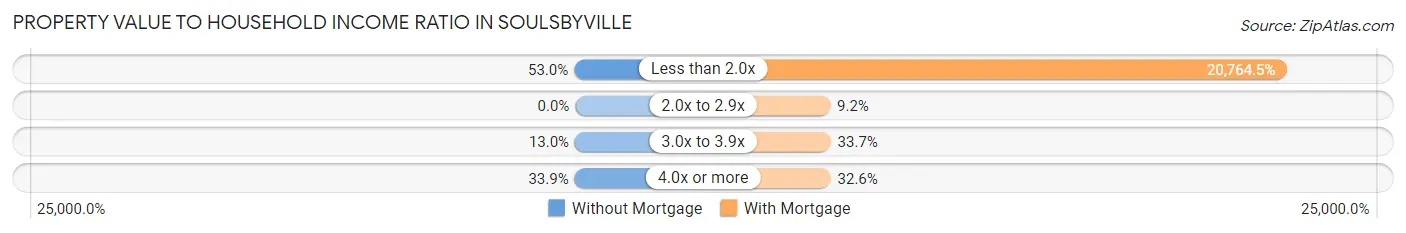
| Value-to-Income Ratio | Without Mortgage | With Mortgage |
| Less than 2.0x | 61 (53.0%) | 93,025 (20,764.5%) |
| 2.0x to 2.9x | 0 (0.0%) | 41 (9.1%) |
| 3.0x to 3.9x | 15 (13.0%) | 151 (33.7%) |
| 4.0x or more | 39 (33.9%) | 146 (32.6%) |
| Total | 115 (100.0%) | 448 (100.0%) |
Real Estate Taxes by Mortgage Status in Soulsbyville
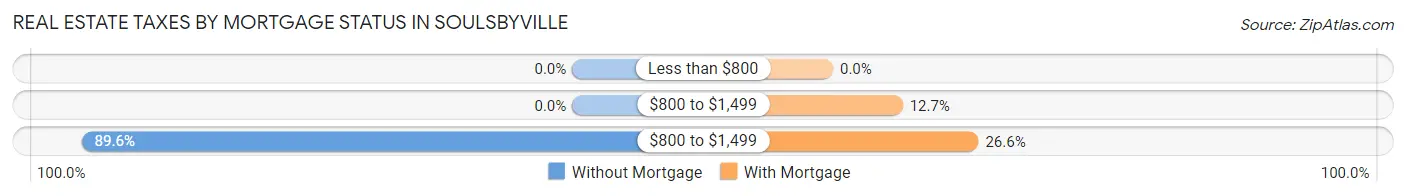
| Property Taxes | Without Mortgage | With Mortgage |
| Less than $800 | 0 (0.0%) | 0 (0.0%) |
| $800 to $1,499 | 0 (0.0%) | 57 (12.7%) |
| $800 to $1,499 | 103 (89.6%) | 119 (26.6%) |
| Total | 115 (100.0%) | 448 (100.0%) |
Health & Disability in Soulsbyville
Health Insurance Coverage by Age in Soulsbyville
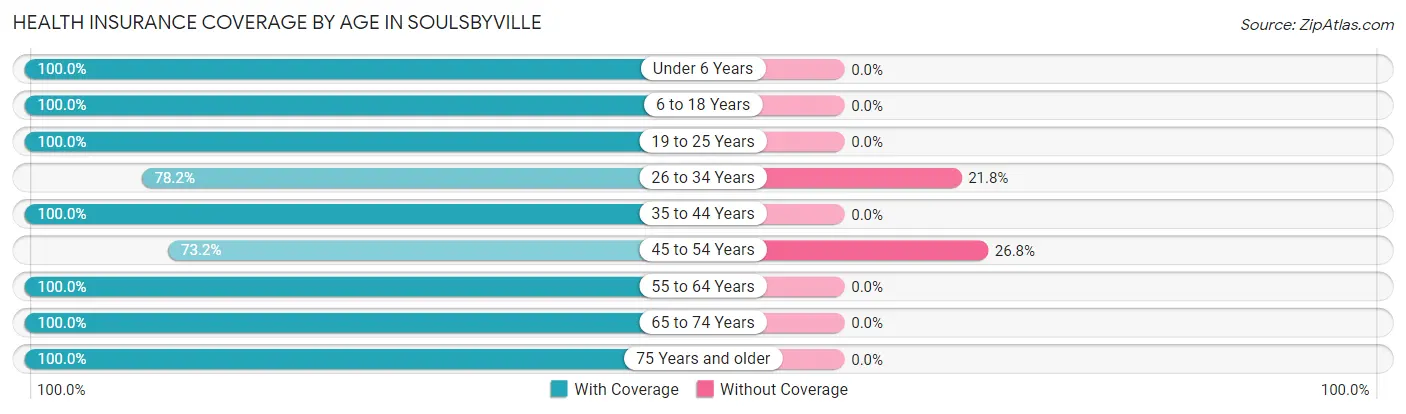
| Age Bracket | With Coverage | Without Coverage |
| Under 6 Years | 144 (100.0%) | 0 (0.0%) |
| 6 to 18 Years | 342 (100.0%) | 0 (0.0%) |
| 19 to 25 Years | 304 (100.0%) | 0 (0.0%) |
| 26 to 34 Years | 208 (78.2%) | 58 (21.8%) |
| 35 to 44 Years | 156 (100.0%) | 0 (0.0%) |
| 45 to 54 Years | 93 (73.2%) | 34 (26.8%) |
| 55 to 64 Years | 385 (100.0%) | 0 (0.0%) |
| 65 to 74 Years | 72 (100.0%) | 0 (0.0%) |
| 75 Years and older | 176 (100.0%) | 0 (0.0%) |
| Total | 1,880 (95.3%) | 92 (4.7%) |
Health Insurance Coverage by Citizenship Status in Soulsbyville
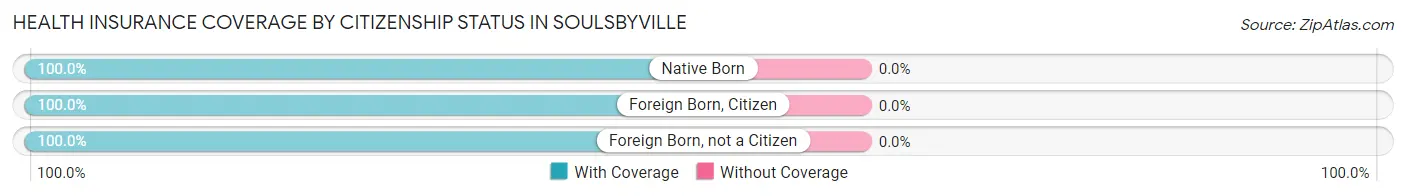
| Citizenship Status | With Coverage | Without Coverage |
| Native Born | 144 (100.0%) | 0 (0.0%) |
| Foreign Born, Citizen | 342 (100.0%) | 0 (0.0%) |
| Foreign Born, not a Citizen | 304 (100.0%) | 0 (0.0%) |
Health Insurance Coverage by Household Income in Soulsbyville
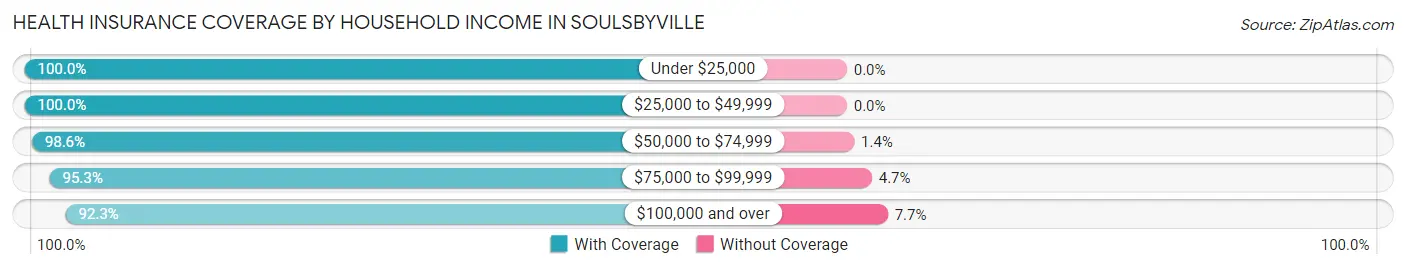
| Household Income | With Coverage | Without Coverage |
| Under $25,000 | 153 (100.0%) | 0 (0.0%) |
| $25,000 to $49,999 | 26 (100.0%) | 0 (0.0%) |
| $50,000 to $74,999 | 432 (98.6%) | 6 (1.4%) |
| $75,000 to $99,999 | 570 (95.3%) | 28 (4.7%) |
| $100,000 and over | 699 (92.3%) | 58 (7.7%) |
Public vs Private Health Insurance Coverage by Age in Soulsbyville
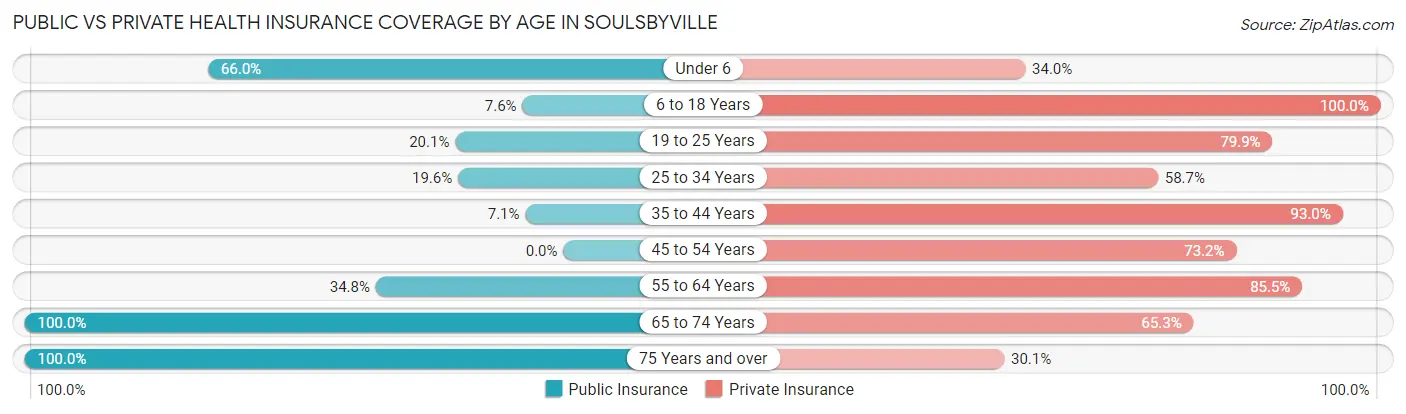
| Age Bracket | Public Insurance | Private Insurance |
| Under 6 | 95 (66.0%) | 49 (34.0%) |
| 6 to 18 Years | 26 (7.6%) | 342 (100.0%) |
| 19 to 25 Years | 61 (20.1%) | 243 (79.9%) |
| 25 to 34 Years | 52 (19.6%) | 156 (58.7%) |
| 35 to 44 Years | 11 (7.0%) | 145 (92.9%) |
| 45 to 54 Years | 0 (0.0%) | 93 (73.2%) |
| 55 to 64 Years | 134 (34.8%) | 329 (85.5%) |
| 65 to 74 Years | 72 (100.0%) | 47 (65.3%) |
| 75 Years and over | 176 (100.0%) | 53 (30.1%) |
| Total | 627 (31.8%) | 1,457 (73.9%) |
Disability Status by Sex by Age in Soulsbyville
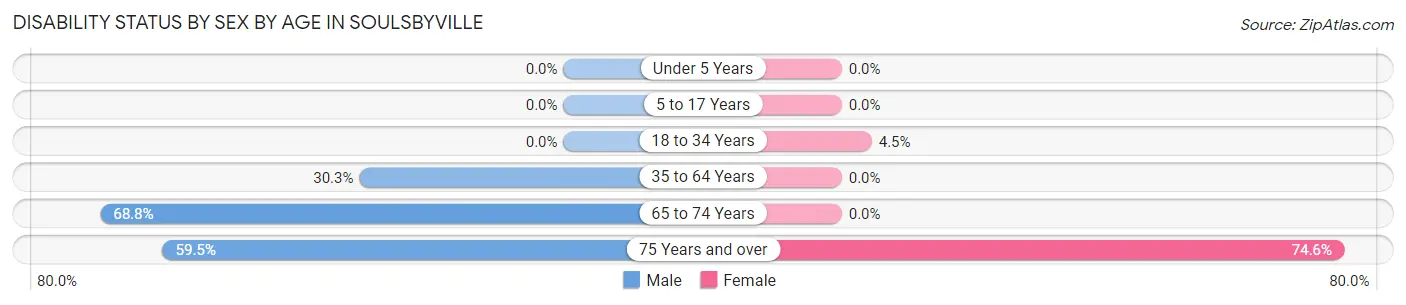
| Age Bracket | Male | Female |
| Under 5 Years | 0 (0.0%) | 0 (0.0%) |
| 5 to 17 Years | 0 (0.0%) | 0 (0.0%) |
| 18 to 34 Years | 0 (0.0%) | 11 (4.4%) |
| 35 to 64 Years | 100 (30.3%) | 0 (0.0%) |
| 65 to 74 Years | 33 (68.8%) | 0 (0.0%) |
| 75 Years and over | 72 (59.5%) | 41 (74.6%) |
Disability Class by Sex by Age in Soulsbyville
Disability Class: Hearing Difficulty
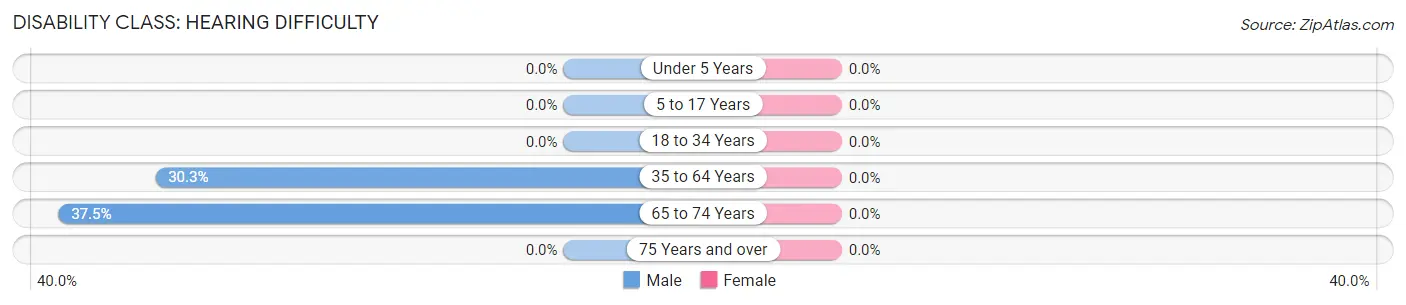
| Age Bracket | Male | Female |
| Under 5 Years | 0 (0.0%) | 0 (0.0%) |
| 5 to 17 Years | 0 (0.0%) | 0 (0.0%) |
| 18 to 34 Years | 0 (0.0%) | 0 (0.0%) |
| 35 to 64 Years | 100 (30.3%) | 0 (0.0%) |
| 65 to 74 Years | 18 (37.5%) | 0 (0.0%) |
| 75 Years and over | 0 (0.0%) | 0 (0.0%) |
Disability Class: Vision Difficulty
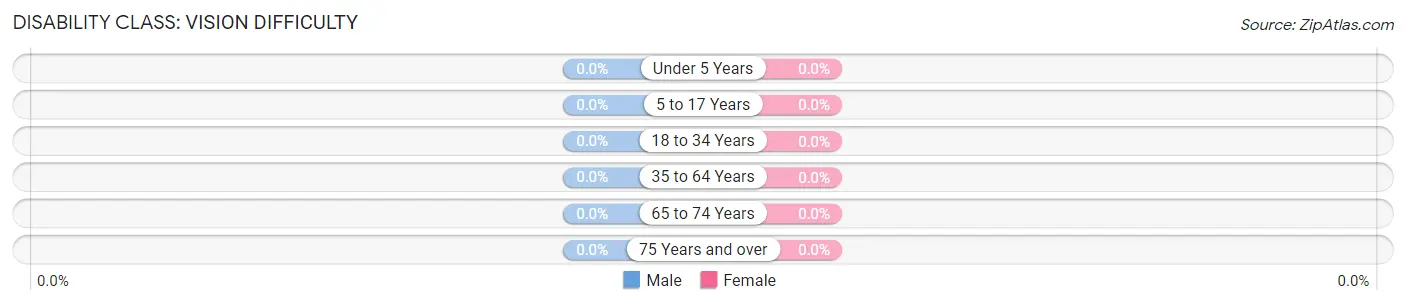
| Age Bracket | Male | Female |
| Under 5 Years | 0 (0.0%) | 0 (0.0%) |
| 5 to 17 Years | 0 (0.0%) | 0 (0.0%) |
| 18 to 34 Years | 0 (0.0%) | 0 (0.0%) |
| 35 to 64 Years | 0 (0.0%) | 0 (0.0%) |
| 65 to 74 Years | 0 (0.0%) | 0 (0.0%) |
| 75 Years and over | 0 (0.0%) | 0 (0.0%) |
Disability Class: Cognitive Difficulty
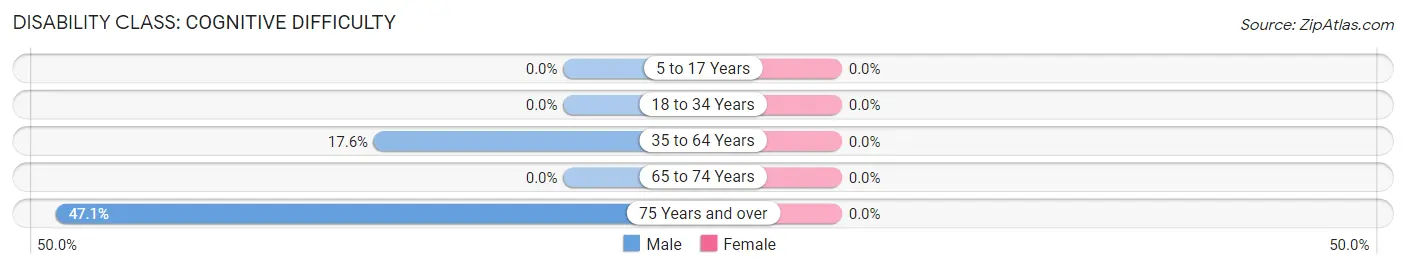
| Age Bracket | Male | Female |
| 5 to 17 Years | 0 (0.0%) | 0 (0.0%) |
| 18 to 34 Years | 0 (0.0%) | 0 (0.0%) |
| 35 to 64 Years | 58 (17.6%) | 0 (0.0%) |
| 65 to 74 Years | 0 (0.0%) | 0 (0.0%) |
| 75 Years and over | 57 (47.1%) | 0 (0.0%) |
Disability Class: Ambulatory Difficulty
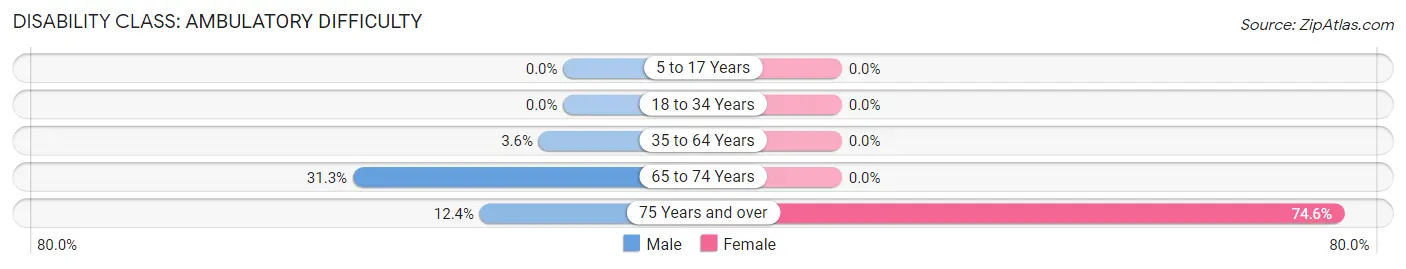
| Age Bracket | Male | Female |
| 5 to 17 Years | 0 (0.0%) | 0 (0.0%) |
| 18 to 34 Years | 0 (0.0%) | 0 (0.0%) |
| 35 to 64 Years | 12 (3.6%) | 0 (0.0%) |
| 65 to 74 Years | 15 (31.2%) | 0 (0.0%) |
| 75 Years and over | 15 (12.4%) | 41 (74.6%) |
Disability Class: Self-Care Difficulty
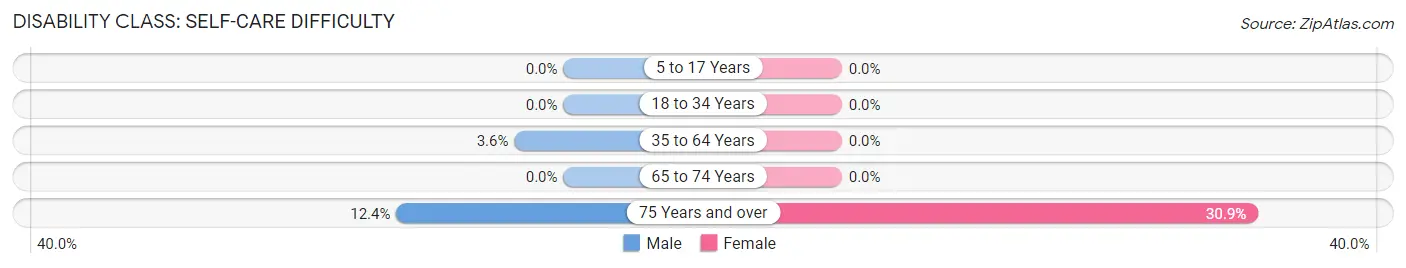
| Age Bracket | Male | Female |
| 5 to 17 Years | 0 (0.0%) | 0 (0.0%) |
| 18 to 34 Years | 0 (0.0%) | 0 (0.0%) |
| 35 to 64 Years | 12 (3.6%) | 0 (0.0%) |
| 65 to 74 Years | 0 (0.0%) | 0 (0.0%) |
| 75 Years and over | 15 (12.4%) | 17 (30.9%) |
Technology Access in Soulsbyville
Computing Device Access in Soulsbyville
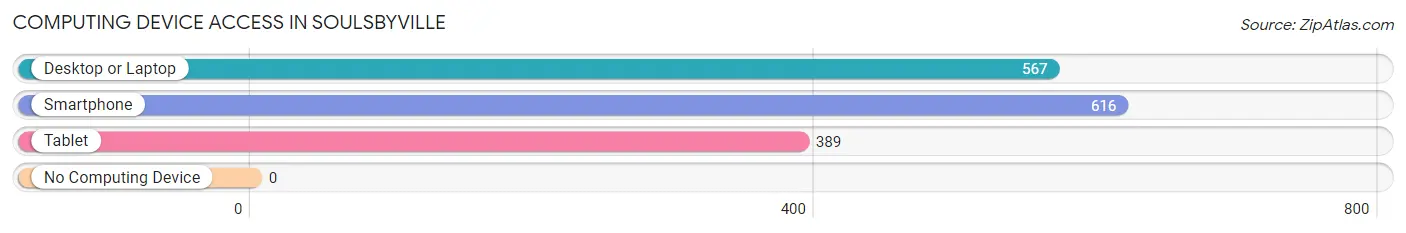
| Device Type | # Households | % Households |
| Desktop or Laptop | 567 | 82.8% |
| Smartphone | 616 | 89.9% |
| Tablet | 389 | 56.8% |
| No Computing Device | 0 | 0.0% |
| Total | 685 | 100.0% |
Internet Access in Soulsbyville
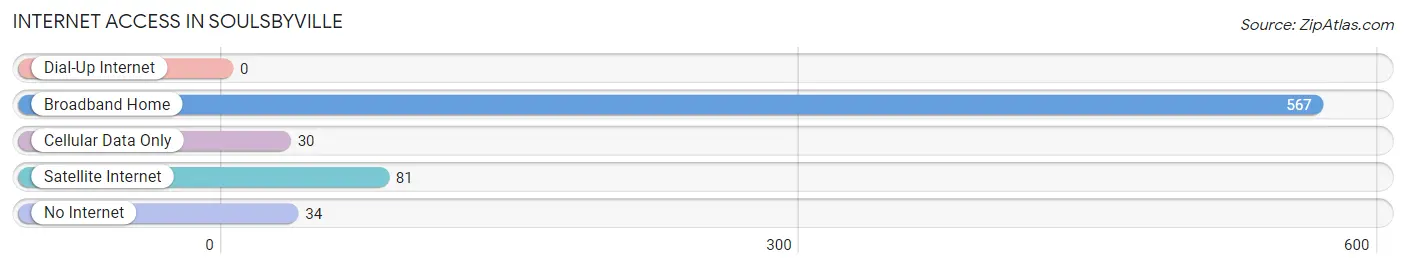
| Internet Type | # Households | % Households |
| Dial-Up Internet | 0 | 0.0% |
| Broadband Home | 567 | 82.8% |
| Cellular Data Only | 30 | 4.4% |
| Satellite Internet | 81 | 11.8% |
| No Internet | 34 | 5.0% |
| Total | 685 | 100.0% |
Soulsbyville Summary
Soulsbyville is a small unincorporated community located in Tuolumne County, California. It is situated in the Sierra Nevada foothills, approximately 8 miles east of Sonora and 25 miles east of Modesto. The population of Soulsbyville was 1,845 at the 2010 census.
History
The area that is now Soulsbyville was originally inhabited by the Miwok and Mono Native American tribes. The first European settlers arrived in the area in the 1850s, and the town was founded in 1854 by William Soulsby, a miner from England. Soulsbyville was originally a mining town, and the area was home to several gold mines. The town was also home to a number of lumber mills, which provided lumber for the construction of homes and other buildings in the area.
Geography
Soulsbyville is located in the Sierra Nevada foothills, at an elevation of 2,717 feet. The town is situated in a valley surrounded by the Sierra Nevada Mountains to the east and the Stanislaus National Forest to the west. The town is located approximately 8 miles east of Sonora and 25 miles east of Modesto.
Climate
Soulsbyville has a Mediterranean climate, with hot, dry summers and cool, wet winters. The average high temperature in the summer is around 90°F, and the average low temperature in the winter is around 30°F. The area receives an average of 20 inches of precipitation per year.
Economy
The economy of Soulsbyville is largely based on tourism and agriculture. The town is home to several wineries, and the area is popular with tourists who come to enjoy the scenery and the local wines. The town is also home to several farms, which produce a variety of fruits and vegetables.
Demographics
As of the 2010 census, the population of Soulsbyville was 1,845. The racial makeup of the town was 87.3% White, 0.7% African American, 0.7% Native American, 0.7% Asian, 0.2% Pacific Islander, 8.2% from other races, and 2.2% from two or more races. The median household income in Soulsbyville was $45,000, and the median family income was $50,000. The per capita income in Soulsbyville was $20,000.
Common Questions
What is Per Capita Income in Soulsbyville?
Per Capita income in Soulsbyville is $30,454.
What is the Median Family Income in Soulsbyville?
Median Family Income in Soulsbyville is $94,575.
What is the Median Household income in Soulsbyville?
Median Household Income in Soulsbyville is $75,344.
What is Income or Wage Gap in Soulsbyville?
Income or Wage Gap in Soulsbyville is 58.0%.
Women in Soulsbyville earn 42.0 cents for every dollar earned by a man.
What is Inequality or Gini Index in Soulsbyville?
Inequality or Gini Index in Soulsbyville is 0.36.
What is the Total Population of Soulsbyville?
Total Population of Soulsbyville is 1,972.
What is the Total Male Population of Soulsbyville?
Total Male Population of Soulsbyville is 1,105.
What is the Total Female Population of Soulsbyville?
Total Female Population of Soulsbyville is 867.
What is the Ratio of Males per 100 Females in Soulsbyville?
There are 127.45 Males per 100 Females in Soulsbyville.
What is the Ratio of Females per 100 Males in Soulsbyville?
There are 78.46 Females per 100 Males in Soulsbyville.
What is the Median Population Age in Soulsbyville?
Median Population Age in Soulsbyville is 34.4 Years.
What is the Average Family Size in Soulsbyville
Average Family Size in Soulsbyville is 3.8 People.
What is the Average Household Size in Soulsbyville
Average Household Size in Soulsbyville is 2.9 People.
How Large is the Labor Force in Soulsbyville?
There are 1,027 People in the Labor Forcein in Soulsbyville.
What is the Percentage of People in the Labor Force in Soulsbyville?
67.1% of People are in the Labor Force in Soulsbyville.
What is the Unemployment Rate in Soulsbyville?
Unemployment Rate in Soulsbyville is 10.9%.