Sonora, CA Map & Demographics
Sonora Map
Sonora Overview
$36,000
PER CAPITA INCOME
$101,595
AVG FAMILY INCOME
$60,492
AVG HOUSEHOLD INCOME
9.3%
WAGE / INCOME GAP [ % ]
90.7¢/ $1
WAGE / INCOME GAP [ $ ]
$10,801
FAMILY INCOME DEFICIT
0.46
INEQUALITY / GINI INDEX
4,963
TOTAL POPULATION
2,201
MALE POPULATION
2,762
FEMALE POPULATION
79.69
MALES / 100 FEMALES
125.49
FEMALES / 100 MALES
41.5
MEDIAN AGE
3.0
AVG FAMILY SIZE
2.2
AVG HOUSEHOLD SIZE
2,197
LABOR FORCE [ PEOPLE ]
54.3%
PERCENT IN LABOR FORCE
9.4%
UNEMPLOYMENT RATE
Sonora Zip Codes
Sonora Area Codes
Income in Sonora
Income Overview in Sonora
Per Capita Income in Sonora is $36,000, while median incomes of families and households are $101,595 and $60,492 respectively.
| Characteristic | Number | Measure |
| Per Capita Income | 4,963 | $36,000 |
| Median Family Income | 979 | $101,595 |
| Mean Family Income | 979 | $91,341 |
| Median Household Income | 2,178 | $60,492 |
| Mean Household Income | 2,178 | $82,216 |
| Income Deficit | 979 | $10,801 |
| Wage / Income Gap (%) | 4,963 | 9.31% |
| Wage / Income Gap ($) | 4,963 | 90.69¢ per $1 |
| Gini / Inequality Index | 4,963 | 0.46 |
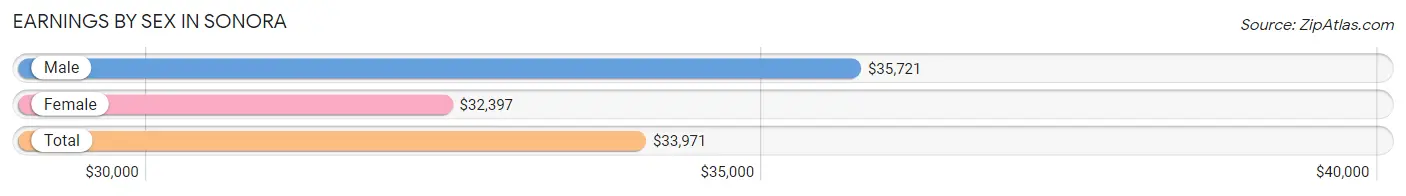
Earnings by Sex in Sonora
Average Earnings in Sonora are $33,971, $35,721 for men and $32,397 for women, a difference of 9.3%.
| Sex | Number | Average Earnings |
| Male | 1,004 (41.0%) | $35,721 |
| Female | 1,446 (59.0%) | $32,397 |
| Total | 2,450 (100.0%) | $33,971 |
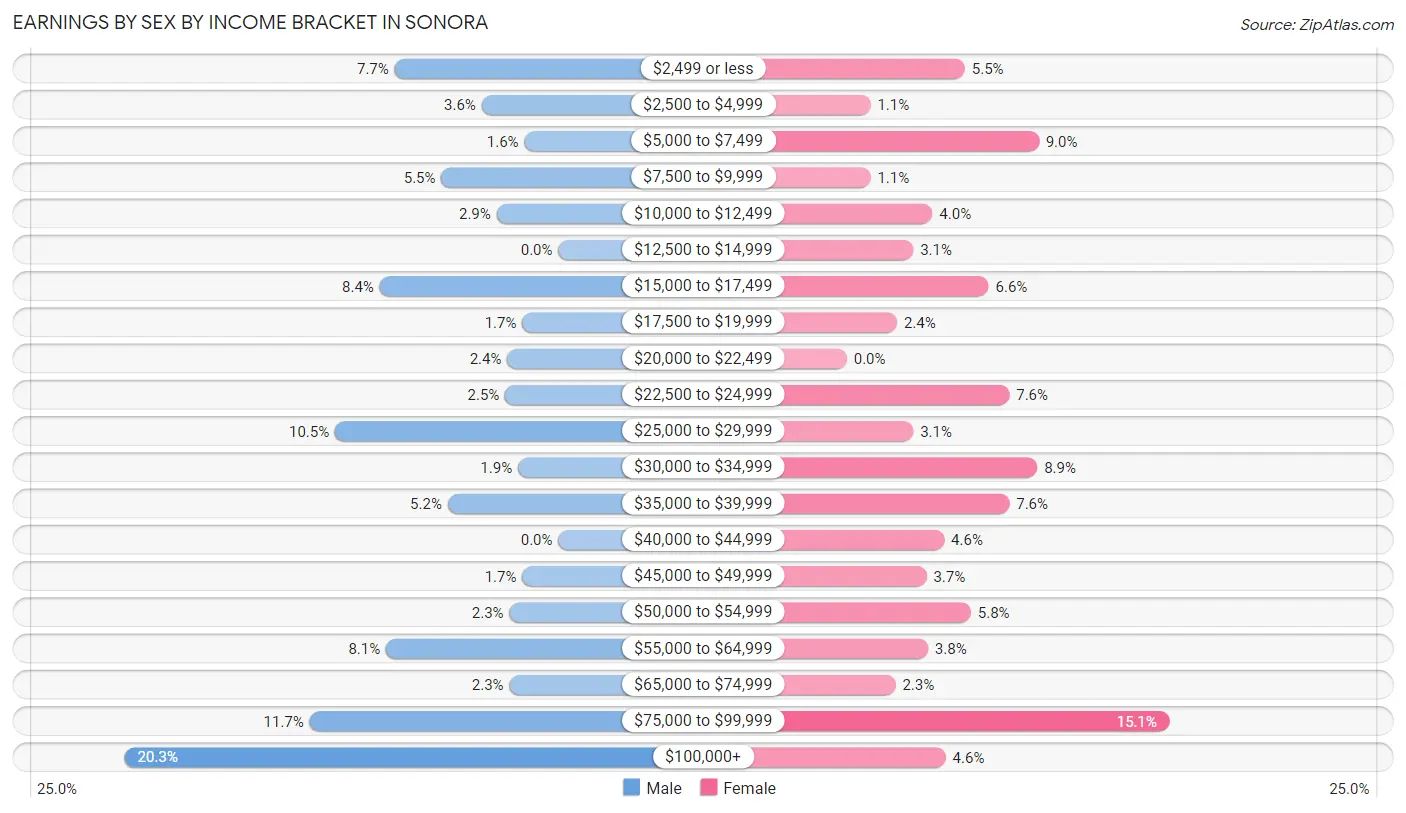
Earnings by Sex by Income Bracket in Sonora
The most common earnings brackets in Sonora are $100,000+ for men (204 | 20.3%) and $75,000 to $99,999 for women (218 | 15.1%).
| Income | Male | Female |
| $2,499 or less | 77 (7.7%) | 80 (5.5%) |
| $2,500 to $4,999 | 36 (3.6%) | 16 (1.1%) |
| $5,000 to $7,499 | 16 (1.6%) | 130 (9.0%) |
| $7,500 to $9,999 | 55 (5.5%) | 16 (1.1%) |
| $10,000 to $12,499 | 29 (2.9%) | 58 (4.0%) |
| $12,500 to $14,999 | 0 (0.0%) | 45 (3.1%) |
| $15,000 to $17,499 | 84 (8.4%) | 96 (6.6%) |
| $17,500 to $19,999 | 17 (1.7%) | 34 (2.4%) |
| $20,000 to $22,499 | 24 (2.4%) | 0 (0.0%) |
| $22,500 to $24,999 | 25 (2.5%) | 110 (7.6%) |
| $25,000 to $29,999 | 105 (10.5%) | 45 (3.1%) |
| $30,000 to $34,999 | 19 (1.9%) | 129 (8.9%) |
| $35,000 to $39,999 | 52 (5.2%) | 110 (7.6%) |
| $40,000 to $44,999 | 0 (0.0%) | 66 (4.6%) |
| $45,000 to $49,999 | 17 (1.7%) | 54 (3.7%) |
| $50,000 to $54,999 | 23 (2.3%) | 84 (5.8%) |
| $55,000 to $64,999 | 81 (8.1%) | 55 (3.8%) |
| $65,000 to $74,999 | 23 (2.3%) | 33 (2.3%) |
| $75,000 to $99,999 | 117 (11.7%) | 218 (15.1%) |
| $100,000+ | 204 (20.3%) | 67 (4.6%) |
| Total | 1,004 (100.0%) | 1,446 (100.0%) |
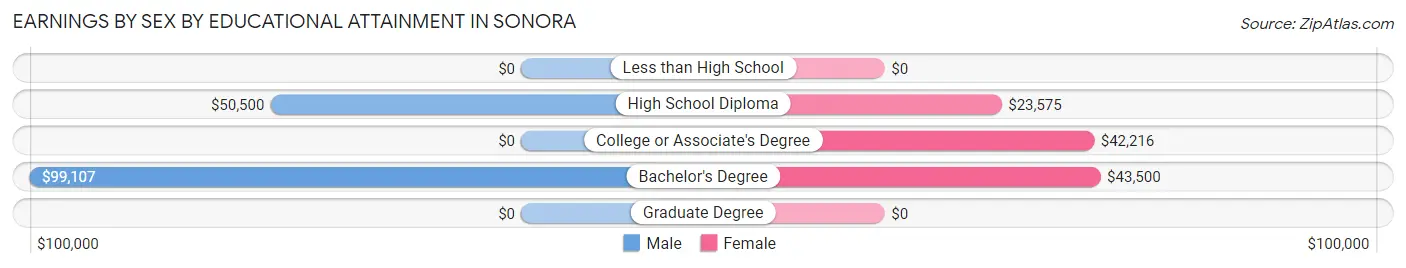
Earnings by Sex by Educational Attainment in Sonora
Average earnings in Sonora are $50,870 for men and $37,354 for women, a difference of 26.6%. Men with an educational attainment of bachelor's degree enjoy the highest average annual earnings of $99,107, while those with high school diploma education earn the least with $50,500. Women with an educational attainment of bachelor's degree earn the most with the average annual earnings of $43,500, while those with high school diploma education have the smallest earnings of $23,575.
| Educational Attainment | Male Income | Female Income |
| Less than High School | - | - |
| High School Diploma | $50,500 | $23,575 |
| College or Associate's Degree | - | - |
| Bachelor's Degree | $99,107 | $43,500 |
| Graduate Degree | - | - |
| Total | $50,870 | $37,354 |
Family Income in Sonora
Family Income Brackets in Sonora
According to the Sonora family income data, there are 351 families falling into the $100,000 to $149,999 income range, which is the most common income bracket and makes up 35.8% of all families. Conversely, the $75,000 to $99,999 income bracket is the least frequent group with only 34 families (3.5%) belonging to this category.
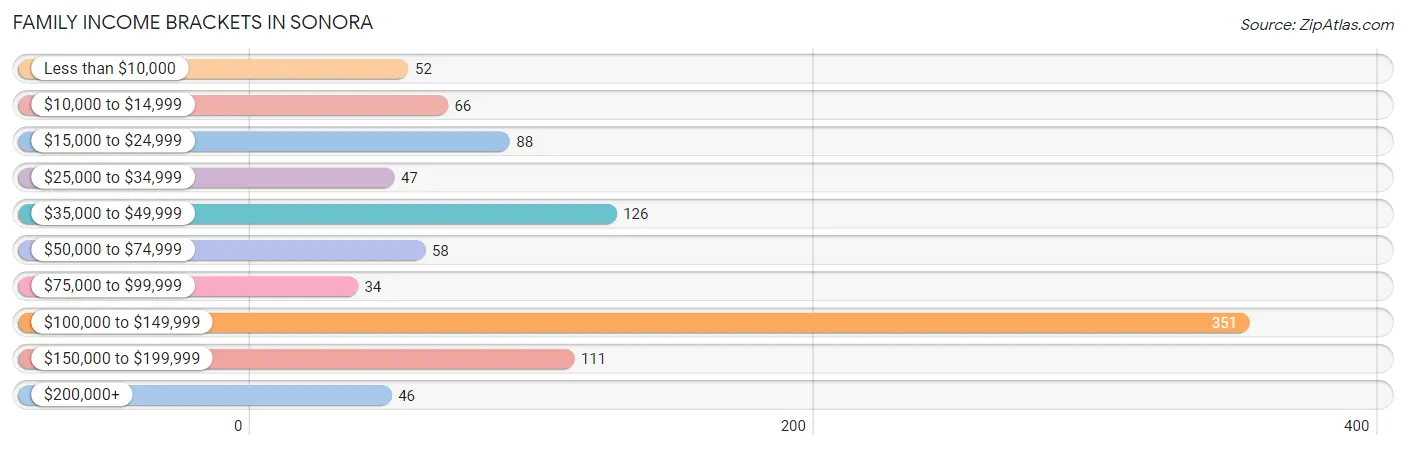
| Income Bracket | # Families | % Families |
| Less than $10,000 | 52 | 5.3% |
| $10,000 to $14,999 | 66 | 6.7% |
| $15,000 to $24,999 | 88 | 9.0% |
| $25,000 to $34,999 | 47 | 4.8% |
| $35,000 to $49,999 | 126 | 12.9% |
| $50,000 to $74,999 | 58 | 5.9% |
| $75,000 to $99,999 | 34 | 3.5% |
| $100,000 to $149,999 | 351 | 35.9% |
| $150,000 to $199,999 | 111 | 11.3% |
| $200,000+ | 46 | 4.7% |
Family Income by Famaliy Size in Sonora
5-person families (47 | 4.8%) account for the highest median family income in Sonora with $160,179 per family, while 2-person families (534 | 54.5%) have the highest median income of $36,875 per family member.
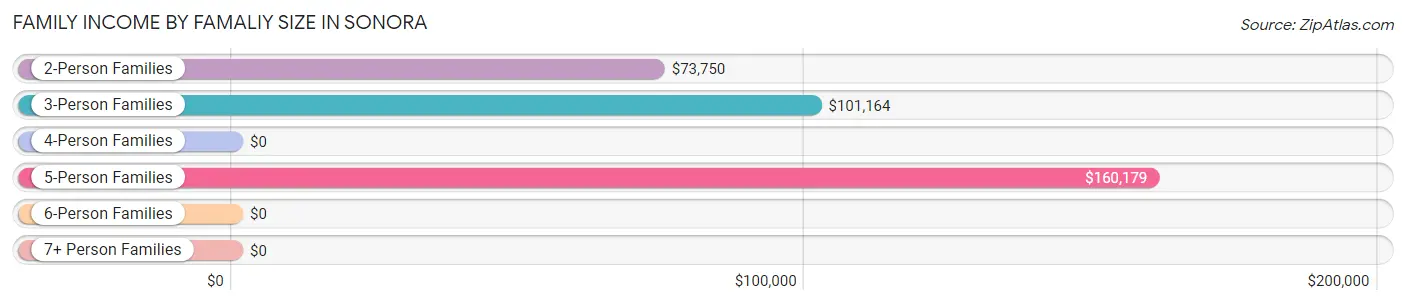
| Income Bracket | # Families | Median Income |
| 2-Person Families | 534 (54.5%) | $73,750 |
| 3-Person Families | 277 (28.3%) | $101,164 |
| 4-Person Families | 106 (10.8%) | $0 |
| 5-Person Families | 47 (4.8%) | $160,179 |
| 6-Person Families | 0 (0.0%) | $0 |
| 7+ Person Families | 15 (1.5%) | $0 |
| Total | 979 (100.0%) | $101,595 |
Family Income by Number of Earners in Sonora
The median family income in Sonora is $101,595, with families comprising 2 earners (332) having the highest median family income of $133,679, while families with no earners (265) have the lowest median family income of $16,616, accounting for 33.9% and 27.1% of families, respectively.
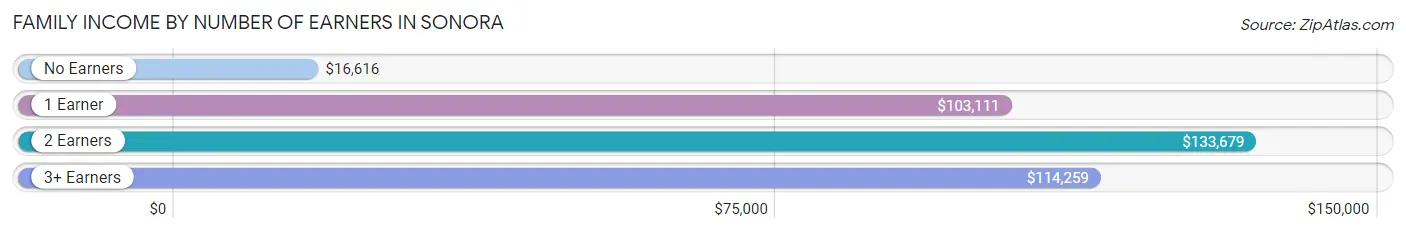
| Number of Earners | # Families | Median Income |
| No Earners | 265 (27.1%) | $16,616 |
| 1 Earner | 274 (28.0%) | $103,111 |
| 2 Earners | 332 (33.9%) | $133,679 |
| 3+ Earners | 108 (11.0%) | $114,259 |
| Total | 979 (100.0%) | $101,595 |
Household Income in Sonora
Household Income Brackets in Sonora
With 407 households falling in the category, the $100,000 to $149,999 income range is the most frequent in Sonora, accounting for 18.7% of all households. In contrast, only 72 households (3.3%) fall into the less than $10,000 income bracket, making it the least populous group.
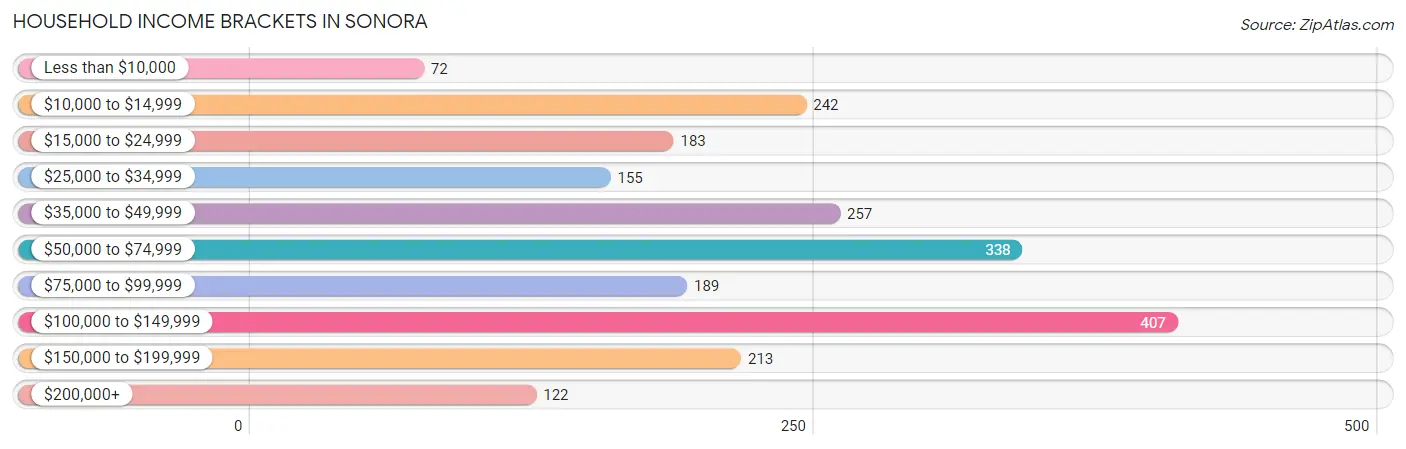
| Income Bracket | # Households | % Households |
| Less than $10,000 | 72 | 3.3% |
| $10,000 to $14,999 | 242 | 11.1% |
| $15,000 to $24,999 | 183 | 8.4% |
| $25,000 to $34,999 | 155 | 7.1% |
| $35,000 to $49,999 | 257 | 11.8% |
| $50,000 to $74,999 | 338 | 15.5% |
| $75,000 to $99,999 | 189 | 8.7% |
| $100,000 to $149,999 | 407 | 18.7% |
| $150,000 to $199,999 | 213 | 9.8% |
| $200,000+ | 122 | 5.6% |
Household Income by Householder Age in Sonora
The median household income in Sonora is $60,492, with the highest median household income of $87,792 found in the 45 to 64 years age bracket for the primary householder. A total of 647 households (29.7%) fall into this category. Meanwhile, the 15 to 24 years age bracket for the primary householder has the lowest median household income of $43,750, with 120 households (5.5%) in this group.
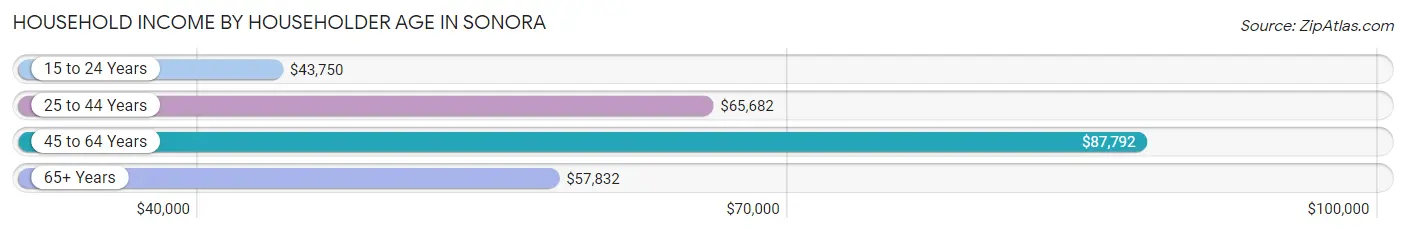
| Income Bracket | # Households | Median Income |
| 15 to 24 Years | 120 (5.5%) | $43,750 |
| 25 to 44 Years | 680 (31.2%) | $65,682 |
| 45 to 64 Years | 647 (29.7%) | $87,792 |
| 65+ Years | 731 (33.6%) | $57,832 |
| Total | 2,178 (100.0%) | $60,492 |
Poverty in Sonora
Income Below Poverty by Sex and Age in Sonora
With 19.8% poverty level for males and 20.2% for females among the residents of Sonora, 16 and 17 year old males and 6 to 11 year old females are the most vulnerable to poverty, with 14 males (73.7%) and 154 females (47.2%) in their respective age groups living below the poverty level.
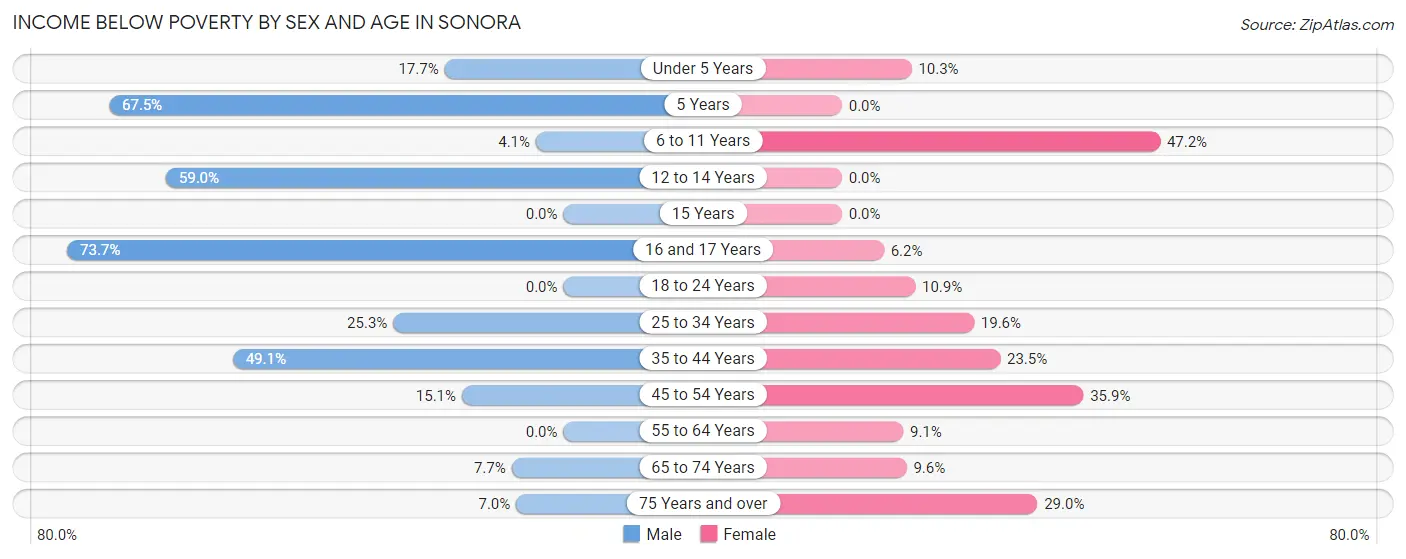
| Age Bracket | Male | Female |
| Under 5 Years | 6 (17.6%) | 9 (10.3%) |
| 5 Years | 56 (67.5%) | 0 (0.0%) |
| 6 to 11 Years | 4 (4.1%) | 154 (47.2%) |
| 12 to 14 Years | 36 (59.0%) | 0 (0.0%) |
| 15 Years | 0 (0.0%) | 0 (0.0%) |
| 16 and 17 Years | 14 (73.7%) | 13 (6.2%) |
| 18 to 24 Years | 0 (0.0%) | 16 (10.9%) |
| 25 to 34 Years | 94 (25.3%) | 80 (19.6%) |
| 35 to 44 Years | 108 (49.1%) | 51 (23.5%) |
| 45 to 54 Years | 33 (15.1%) | 95 (35.8%) |
| 55 to 64 Years | 0 (0.0%) | 33 (9.1%) |
| 65 to 74 Years | 27 (7.7%) | 34 (9.6%) |
| 75 Years and over | 15 (7.0%) | 56 (29.0%) |
| Total | 393 (19.8%) | 541 (20.2%) |
Income Above Poverty by Sex and Age in Sonora
According to the poverty statistics in Sonora, males aged 15 years and females aged 5 years are the age groups that are most secure financially, with 100.0% of males and 100.0% of females in these age groups living above the poverty line.
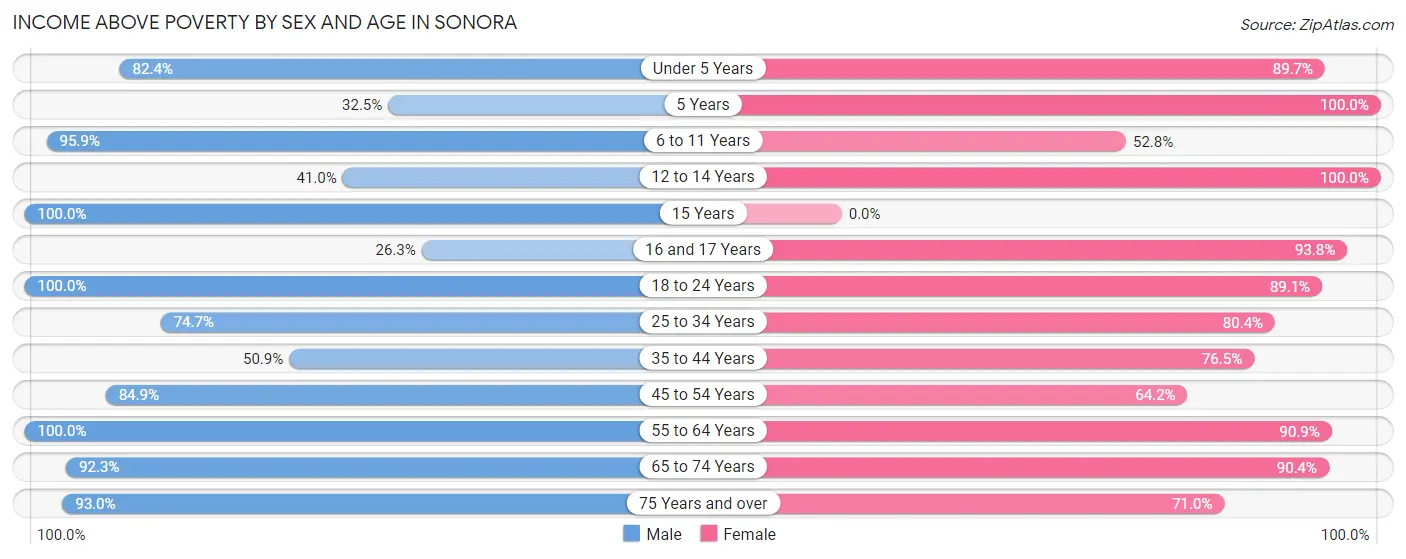
| Age Bracket | Male | Female |
| Under 5 Years | 28 (82.4%) | 78 (89.7%) |
| 5 Years | 27 (32.5%) | 47 (100.0%) |
| 6 to 11 Years | 94 (95.9%) | 172 (52.8%) |
| 12 to 14 Years | 25 (41.0%) | 59 (100.0%) |
| 15 Years | 25 (100.0%) | 0 (0.0%) |
| 16 and 17 Years | 5 (26.3%) | 196 (93.8%) |
| 18 to 24 Years | 108 (100.0%) | 131 (89.1%) |
| 25 to 34 Years | 278 (74.7%) | 328 (80.4%) |
| 35 to 44 Years | 112 (50.9%) | 166 (76.5%) |
| 45 to 54 Years | 186 (84.9%) | 170 (64.1%) |
| 55 to 64 Years | 185 (100.0%) | 330 (90.9%) |
| 65 to 74 Years | 324 (92.3%) | 320 (90.4%) |
| 75 Years and over | 199 (93.0%) | 137 (71.0%) |
| Total | 1,596 (80.2%) | 2,134 (79.8%) |
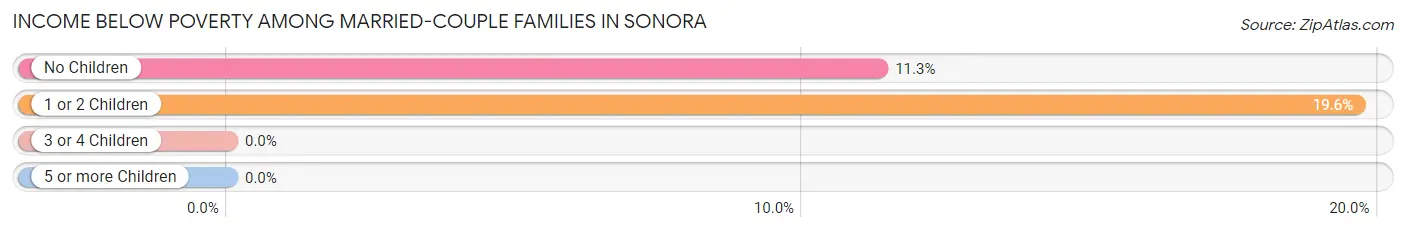
Income Below Poverty Among Married-Couple Families in Sonora
The poverty statistics for married-couple families in Sonora show that 12.7% or 73 of the total 576 families live below the poverty line. Families with 1 or 2 children have the highest poverty rate of 19.6%, comprising of 31 families. On the other hand, families with 3 or 4 children have the lowest poverty rate of 0.0%, which includes 0 families.
| Children | Above Poverty | Below Poverty |
| No Children | 329 (88.7%) | 42 (11.3%) |
| 1 or 2 Children | 127 (80.4%) | 31 (19.6%) |
| 3 or 4 Children | 47 (100.0%) | 0 (0.0%) |
| 5 or more Children | 0 (0.0%) | 0 (0.0%) |
| Total | 503 (87.3%) | 73 (12.7%) |
Income Below Poverty Among Single-Parent Households in Sonora
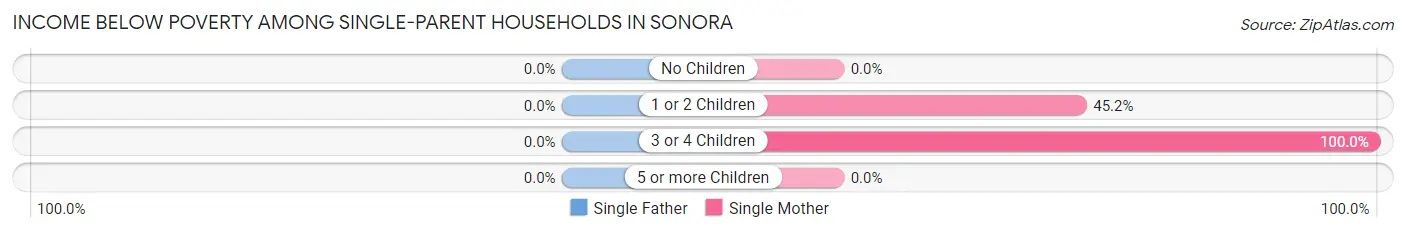
| Children | Single Father | Single Mother |
| No Children | 0 (0.0%) | 0 (0.0%) |
| 1 or 2 Children | 0 (0.0%) | 94 (45.2%) |
| 3 or 4 Children | 0 (0.0%) | 6 (100.0%) |
| 5 or more Children | 0 (0.0%) | 0 (0.0%) |
| Total | 0 (0.0%) | 100 (30.8%) |
Income Below Poverty Among Married-Couple vs Single-Parent Households in Sonora
The poverty data for Sonora shows that 73 of the married-couple family households (12.7%) and 100 of the single-parent households (24.8%) are living below the poverty level. Within the married-couple family households, those with 1 or 2 children have the highest poverty rate, with 31 households (19.6%) falling below the poverty line. Among the single-parent households, those with 3 or 4 children have the highest poverty rate, with 6 household (100.0%) living below poverty.
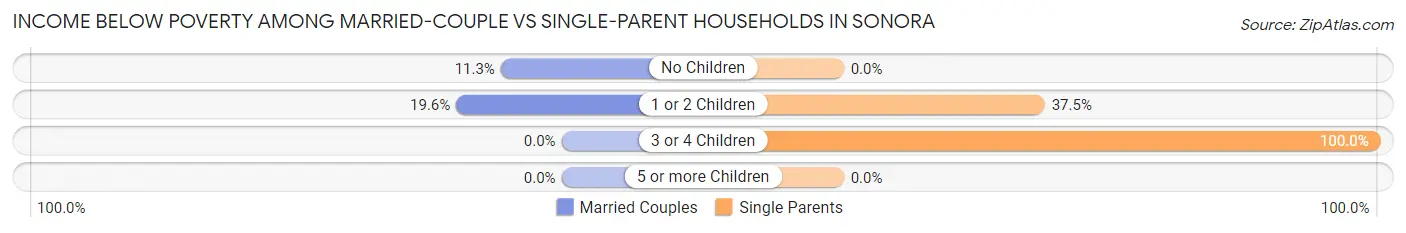
| Children | Married-Couple Families | Single-Parent Households |
| No Children | 42 (11.3%) | 0 (0.0%) |
| 1 or 2 Children | 31 (19.6%) | 94 (37.4%) |
| 3 or 4 Children | 0 (0.0%) | 6 (100.0%) |
| 5 or more Children | 0 (0.0%) | 0 (0.0%) |
| Total | 73 (12.7%) | 100 (24.8%) |
Race in Sonora
The most populous races in Sonora are White / Caucasian (4,356 | 87.8%), Hispanic or Latino (422 | 8.5%), and Two or more Races (227 | 4.6%).
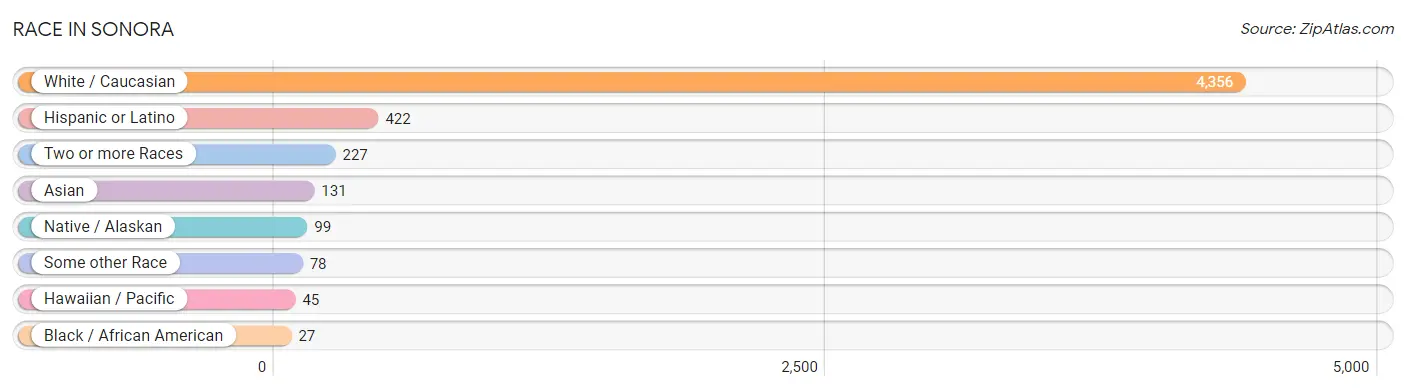
| Race | # Population | % Population |
| Asian | 131 | 2.6% |
| Black / African American | 27 | 0.5% |
| Hawaiian / Pacific | 45 | 0.9% |
| Hispanic or Latino | 422 | 8.5% |
| Native / Alaskan | 99 | 2.0% |
| White / Caucasian | 4,356 | 87.8% |
| Two or more Races | 227 | 4.6% |
| Some other Race | 78 | 1.6% |
| Total | 4,963 | 100.0% |
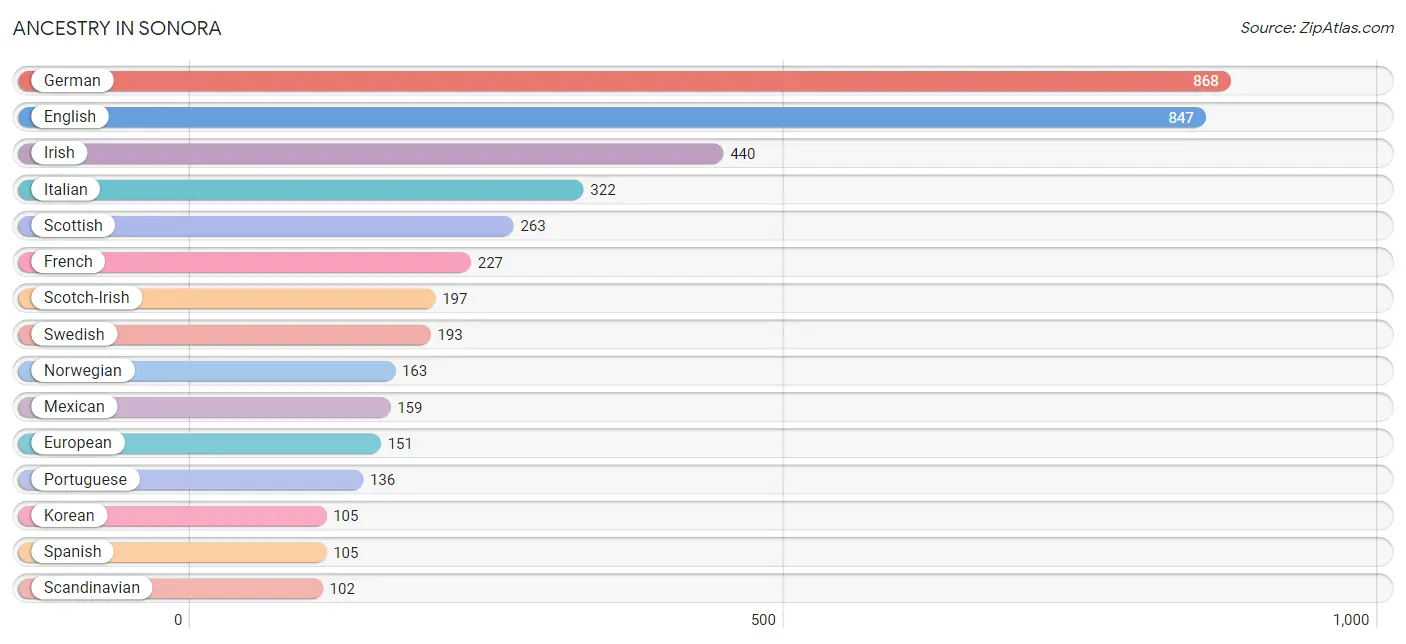
Ancestry in Sonora
The most populous ancestries reported in Sonora are German (868 | 17.5%), English (847 | 17.1%), Irish (440 | 8.9%), Italian (322 | 6.5%), and Scottish (263 | 5.3%), together accounting for 55.2% of all Sonora residents.
| Ancestry | # Population | % Population |
| American | 87 | 1.8% |
| Armenian | 11 | 0.2% |
| Basque | 2 | 0.0% |
| Bhutanese | 7 | 0.1% |
| Blackfeet | 9 | 0.2% |
| British | 31 | 0.6% |
| Canadian | 2 | 0.0% |
| Celtic | 14 | 0.3% |
| Central American | 17 | 0.3% |
| Cherokee | 44 | 0.9% |
| Choctaw | 52 | 1.1% |
| Comanche | 4 | 0.1% |
| Croatian | 8 | 0.2% |
| Danish | 41 | 0.8% |
| Dutch | 27 | 0.5% |
| English | 847 | 17.1% |
| European | 151 | 3.0% |
| Finnish | 18 | 0.4% |
| French | 227 | 4.6% |
| German | 868 | 17.5% |
| Guamanian / Chamorro | 2 | 0.0% |
| Guatemalan | 17 | 0.3% |
| Hungarian | 31 | 0.6% |
| Indian (Asian) | 14 | 0.3% |
| Irish | 440 | 8.9% |
| Italian | 322 | 6.5% |
| Korean | 105 | 2.1% |
| Lithuanian | 20 | 0.4% |
| Mexican | 159 | 3.2% |
| Native Hawaiian | 43 | 0.9% |
| Northern European | 29 | 0.6% |
| Norwegian | 163 | 3.3% |
| Polish | 8 | 0.2% |
| Portuguese | 136 | 2.7% |
| Puerto Rican | 92 | 1.8% |
| Russian | 91 | 1.8% |
| Samoan | 43 | 0.9% |
| Scandinavian | 102 | 2.1% |
| Scotch-Irish | 197 | 4.0% |
| Scottish | 263 | 5.3% |
| Shoshone | 36 | 0.7% |
| Spaniard | 42 | 0.9% |
| Spanish | 105 | 2.1% |
| Sri Lankan | 7 | 0.1% |
| Swedish | 193 | 3.9% |
| Swiss | 21 | 0.4% |
| Welsh | 20 | 0.4% |
| West Indian | 29 | 0.6% | View All 48 Rows |
Immigrants in Sonora
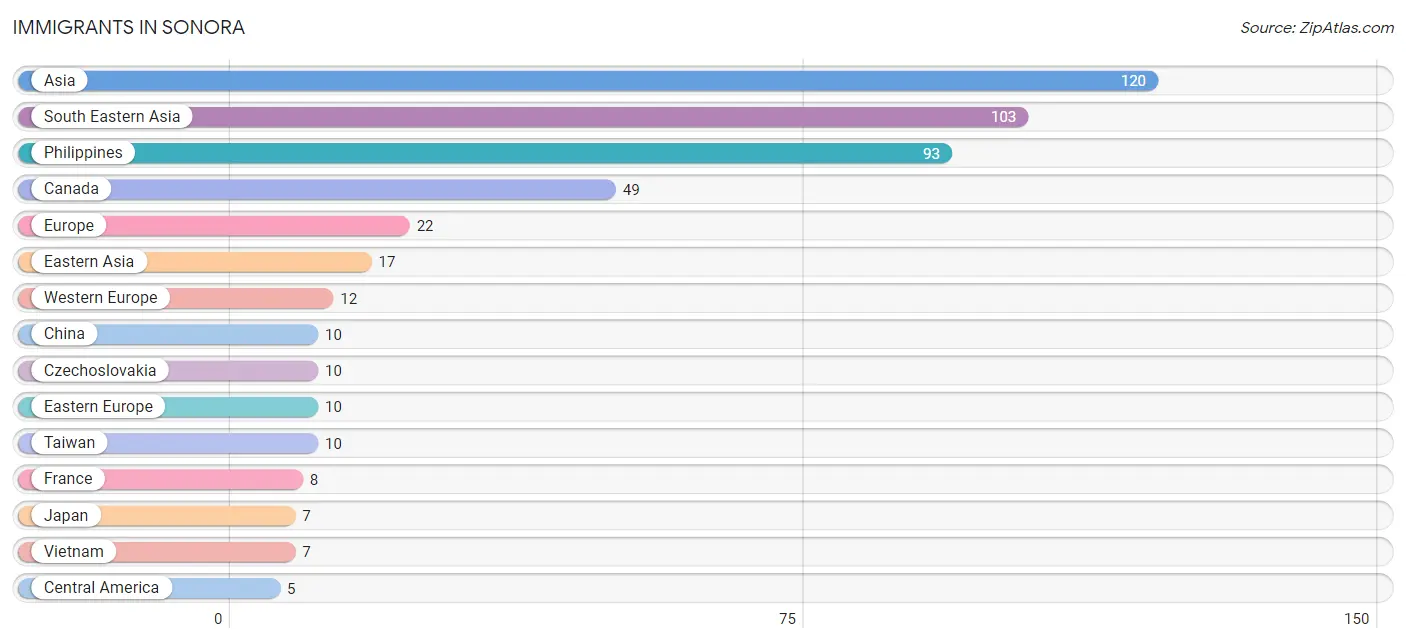
The most numerous immigrant groups reported in Sonora came from Asia (120 | 2.4%), South Eastern Asia (103 | 2.1%), Philippines (93 | 1.9%), Canada (49 | 1.0%), and Europe (22 | 0.4%), together accounting for 7.8% of all Sonora residents.
| Immigration Origin | # Population | % Population |
| Asia | 120 | 2.4% |
| Canada | 49 | 1.0% |
| Central America | 5 | 0.1% |
| China | 10 | 0.2% |
| Czechoslovakia | 10 | 0.2% |
| Eastern Asia | 17 | 0.3% |
| Eastern Europe | 10 | 0.2% |
| Europe | 22 | 0.4% |
| France | 8 | 0.2% |
| Germany | 4 | 0.1% |
| Japan | 7 | 0.1% |
| Latin America | 5 | 0.1% |
| Mexico | 5 | 0.1% |
| Philippines | 93 | 1.9% |
| South Eastern Asia | 103 | 2.1% |
| Taiwan | 10 | 0.2% |
| Vietnam | 7 | 0.1% |
| Western Europe | 12 | 0.2% | View All 18 Rows |
Sex and Age in Sonora
Sex and Age in Sonora
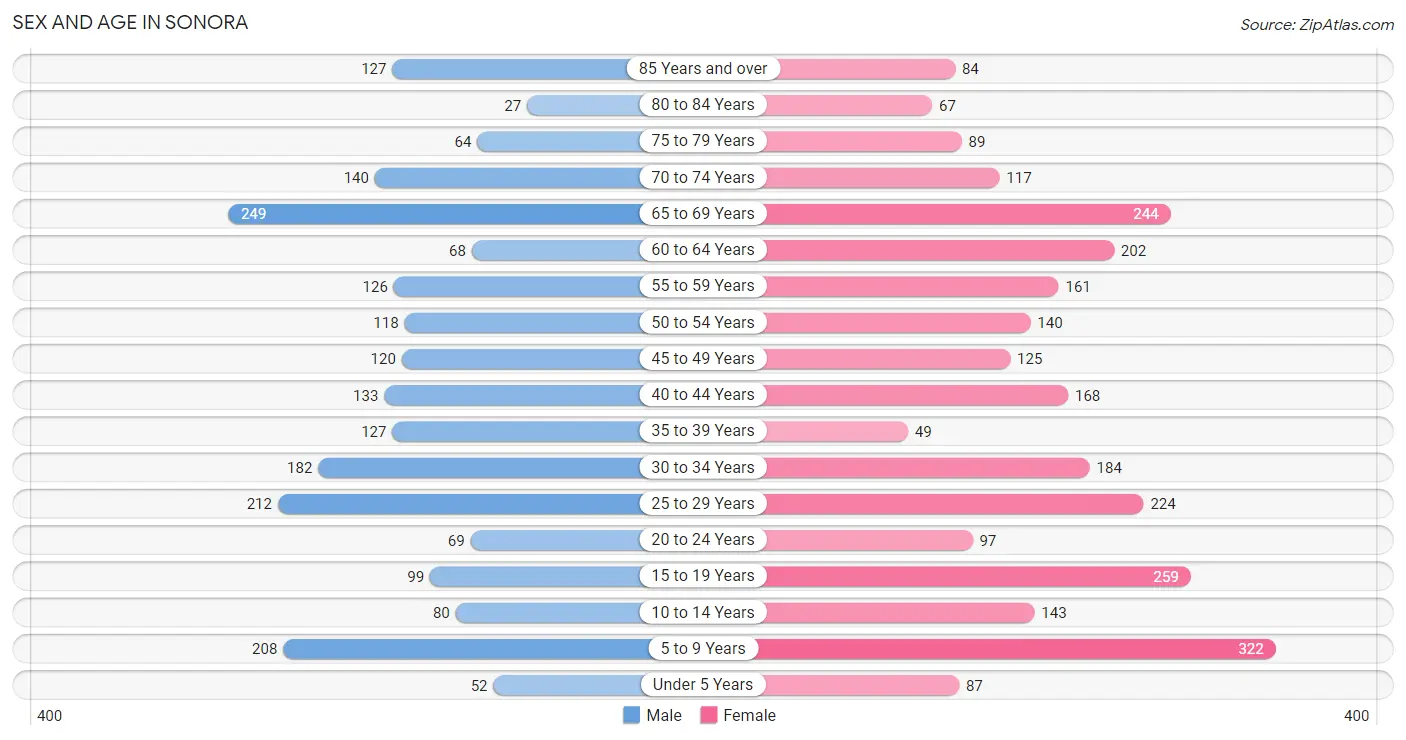
The most populous age groups in Sonora are 65 to 69 Years (249 | 11.3%) for men and 5 to 9 Years (322 | 11.7%) for women.
| Age Bracket | Male | Female |
| Under 5 Years | 52 (2.4%) | 87 (3.2%) |
| 5 to 9 Years | 208 (9.5%) | 322 (11.7%) |
| 10 to 14 Years | 80 (3.6%) | 143 (5.2%) |
| 15 to 19 Years | 99 (4.5%) | 259 (9.4%) |
| 20 to 24 Years | 69 (3.1%) | 97 (3.5%) |
| 25 to 29 Years | 212 (9.6%) | 224 (8.1%) |
| 30 to 34 Years | 182 (8.3%) | 184 (6.7%) |
| 35 to 39 Years | 127 (5.8%) | 49 (1.8%) |
| 40 to 44 Years | 133 (6.0%) | 168 (6.1%) |
| 45 to 49 Years | 120 (5.4%) | 125 (4.5%) |
| 50 to 54 Years | 118 (5.4%) | 140 (5.1%) |
| 55 to 59 Years | 126 (5.7%) | 161 (5.8%) |
| 60 to 64 Years | 68 (3.1%) | 202 (7.3%) |
| 65 to 69 Years | 249 (11.3%) | 244 (8.8%) |
| 70 to 74 Years | 140 (6.4%) | 117 (4.2%) |
| 75 to 79 Years | 64 (2.9%) | 89 (3.2%) |
| 80 to 84 Years | 27 (1.2%) | 67 (2.4%) |
| 85 Years and over | 127 (5.8%) | 84 (3.0%) |
| Total | 2,201 (100.0%) | 2,762 (100.0%) |
Families and Households in Sonora
Median Family Size in Sonora
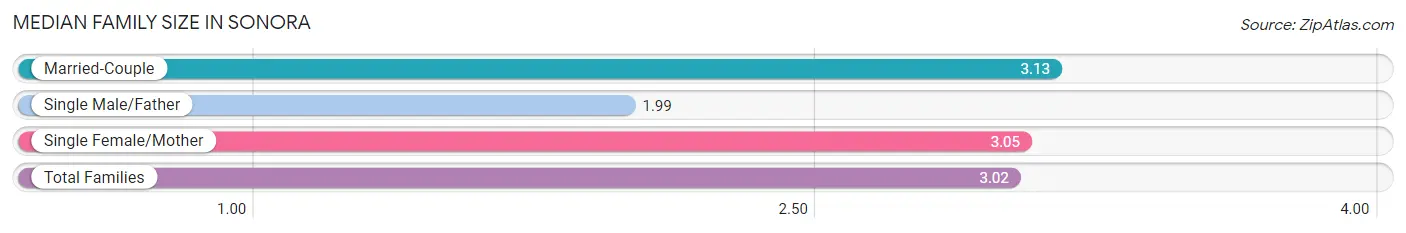
The median family size in Sonora is 3.02 persons per family, with married-couple families (576 | 58.8%) accounting for the largest median family size of 3.13 persons per family. On the other hand, single male/father families (78 | 8.0%) represent the smallest median family size with 1.99 persons per family.
| Family Type | # Families | Family Size |
| Married-Couple | 576 (58.8%) | 3.13 |
| Single Male/Father | 78 (8.0%) | 1.99 |
| Single Female/Mother | 325 (33.2%) | 3.05 |
| Total Families | 979 (100.0%) | 3.02 |
Median Household Size in Sonora
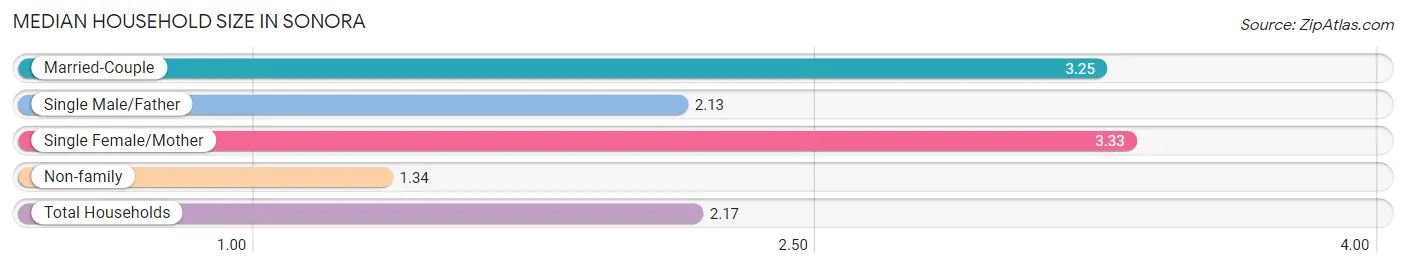
The median household size in Sonora is 2.17 persons per household, with single female/mother households (325 | 14.9%) accounting for the largest median household size of 3.33 persons per household. non-family households (1,199 | 55.0%) represent the smallest median household size with 1.34 persons per household.
| Household Type | # Households | Household Size |
| Married-Couple | 576 (26.5%) | 3.25 |
| Single Male/Father | 78 (3.6%) | 2.13 |
| Single Female/Mother | 325 (14.9%) | 3.33 |
| Non-family | 1,199 (55.0%) | 1.34 |
| Total Households | 2,178 (100.0%) | 2.17 |
Household Size by Marriage Status in Sonora
Out of a total of 2,178 households in Sonora, 979 (45.0%) are family households, while 1,199 (55.0%) are nonfamily households. The most numerous type of family households are 2-person households, comprising 518, and the most common type of nonfamily households are 1-person households, comprising 938.
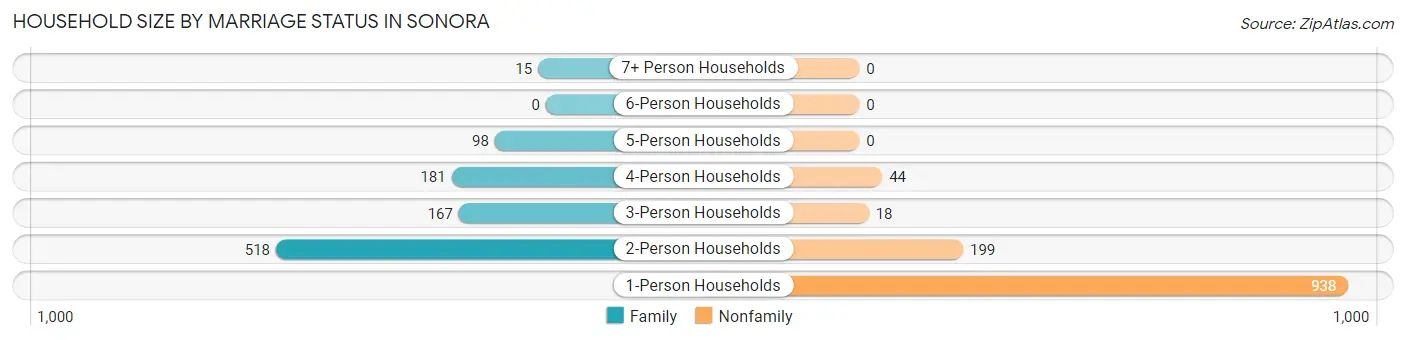
| Household Size | Family Households | Nonfamily Households |
| 1-Person Households | - | 938 (43.1%) |
| 2-Person Households | 518 (23.8%) | 199 (9.1%) |
| 3-Person Households | 167 (7.7%) | 18 (0.8%) |
| 4-Person Households | 181 (8.3%) | 44 (2.0%) |
| 5-Person Households | 98 (4.5%) | 0 (0.0%) |
| 6-Person Households | 0 (0.0%) | 0 (0.0%) |
| 7+ Person Households | 15 (0.7%) | 0 (0.0%) |
| Total | 979 (45.0%) | 1,199 (55.0%) |
Female Fertility in Sonora
Fertility by Age in Sonora
Average fertility rate in Sonora is 15.0 births per 1,000 women. Women in the age bracket of 20 to 34 years have the highest fertility rate with 34.0 births per 1,000 women. Women in the age bracket of 20 to 34 years acount for 100.0% of all women with births.
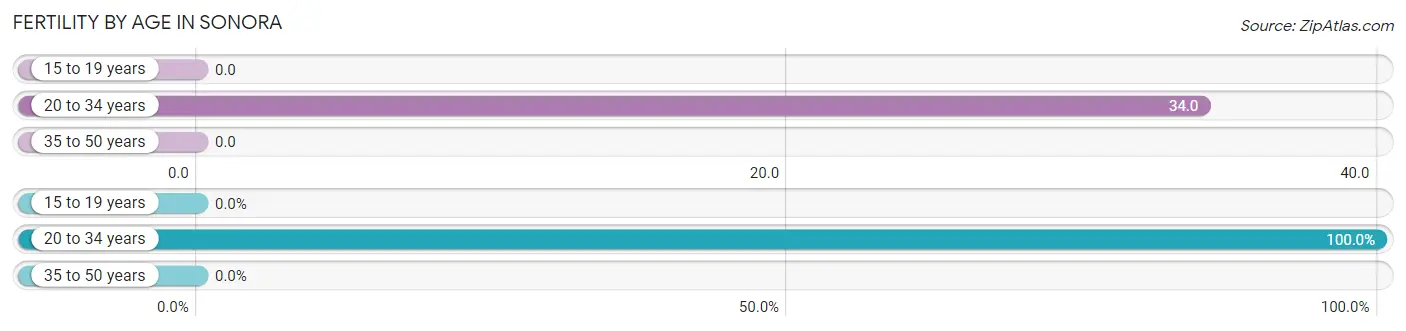
| Age Bracket | Women with Births | Births / 1,000 Women |
| 15 to 19 years | 0 (0.0%) | 0.0 |
| 20 to 34 years | 17 (100.0%) | 34.0 |
| 35 to 50 years | 0 (0.0%) | 0.0 |
| Total | 17 (100.0%) | 15.0 |
Fertility by Age by Marriage Status in Sonora
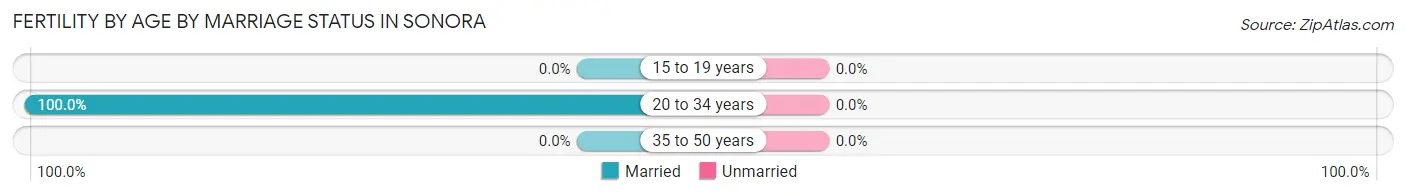
| Age Bracket | Married | Unmarried |
| 15 to 19 years | 0 (0.0%) | 0 (0.0%) |
| 20 to 34 years | 17 (100.0%) | 0 (0.0%) |
| 35 to 50 years | 0 (0.0%) | 0 (0.0%) |
| Total | 17 (100.0%) | 0 (0.0%) |
Fertility by Education in Sonora
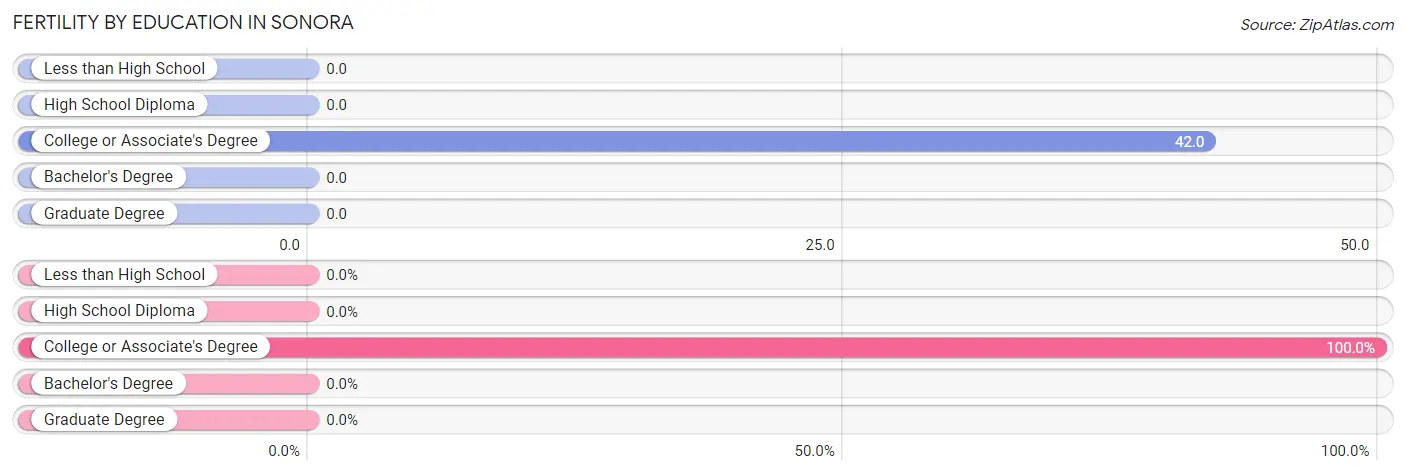
| Educational Attainment | Women with Births | Births / 1,000 Women |
| Less than High School | 0 (0.0%) | 0.0 |
| High School Diploma | 0 (0.0%) | 0.0 |
| College or Associate's Degree | 17 (100.0%) | 42.0 |
| Bachelor's Degree | 0 (0.0%) | 0.0 |
| Graduate Degree | 0 (0.0%) | 0.0 |
| Total | 17 (100.0%) | 15.0 |
Fertility by Education by Marriage Status in Sonora
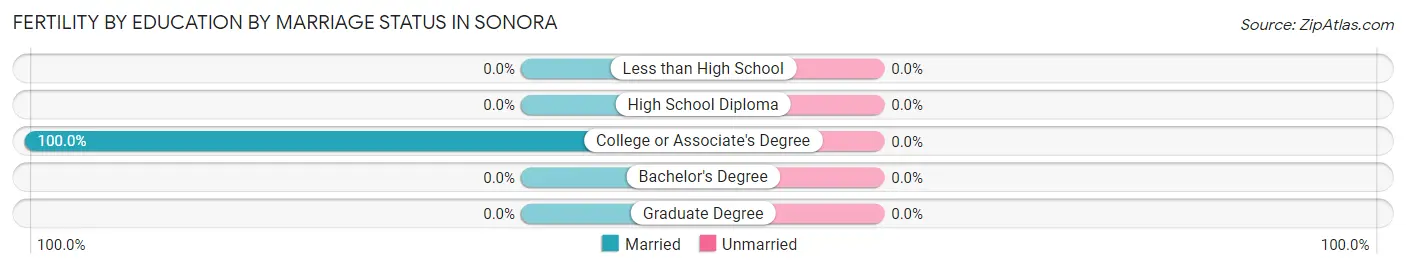
| Educational Attainment | Married | Unmarried |
| Less than High School | 0 (0.0%) | 0 (0.0%) |
| High School Diploma | 0 (0.0%) | 0 (0.0%) |
| College or Associate's Degree | 17 (100.0%) | 0 (0.0%) |
| Bachelor's Degree | 0 (0.0%) | 0 (0.0%) |
| Graduate Degree | 0 (0.0%) | 0 (0.0%) |
| Total | 17 (100.0%) | 0 (0.0%) |
Employment Characteristics in Sonora
Employment by Class of Employer in Sonora
Among the 1,968 employed individuals in Sonora, private company employees (894 | 45.4%), local government employees (348 | 17.7%), and not-for-profit organizations (336 | 17.1%) make up the most common classes of employment.
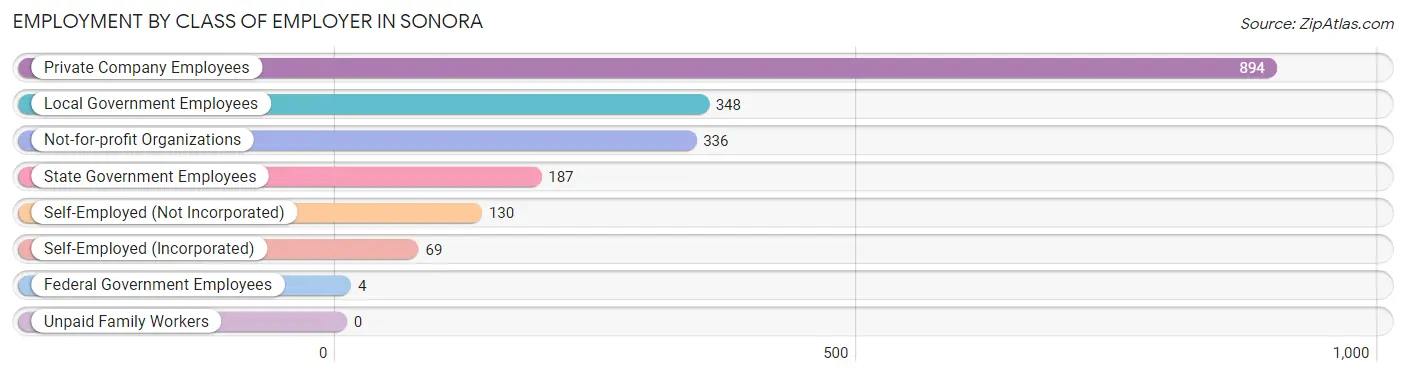
| Employer Class | # Employees | % Employees |
| Private Company Employees | 894 | 45.4% |
| Self-Employed (Incorporated) | 69 | 3.5% |
| Self-Employed (Not Incorporated) | 130 | 6.6% |
| Not-for-profit Organizations | 336 | 17.1% |
| Local Government Employees | 348 | 17.7% |
| State Government Employees | 187 | 9.5% |
| Federal Government Employees | 4 | 0.2% |
| Unpaid Family Workers | 0 | 0.0% |
| Total | 1,968 | 100.0% |
Employment Status by Age in Sonora
According to the labor force statistics for Sonora, out of the total population over 16 years of age (4,046), 54.3% or 2,197 individuals are in the labor force, with 9.4% or 207 of them unemployed. The age group with the highest labor force participation rate is 25 to 29 years, with 86.0% or 375 individuals in the labor force. Within the labor force, the 16 to 19 years age range has the highest percentage of unemployed individuals, with 47.4% or 100 of them being unemployed.
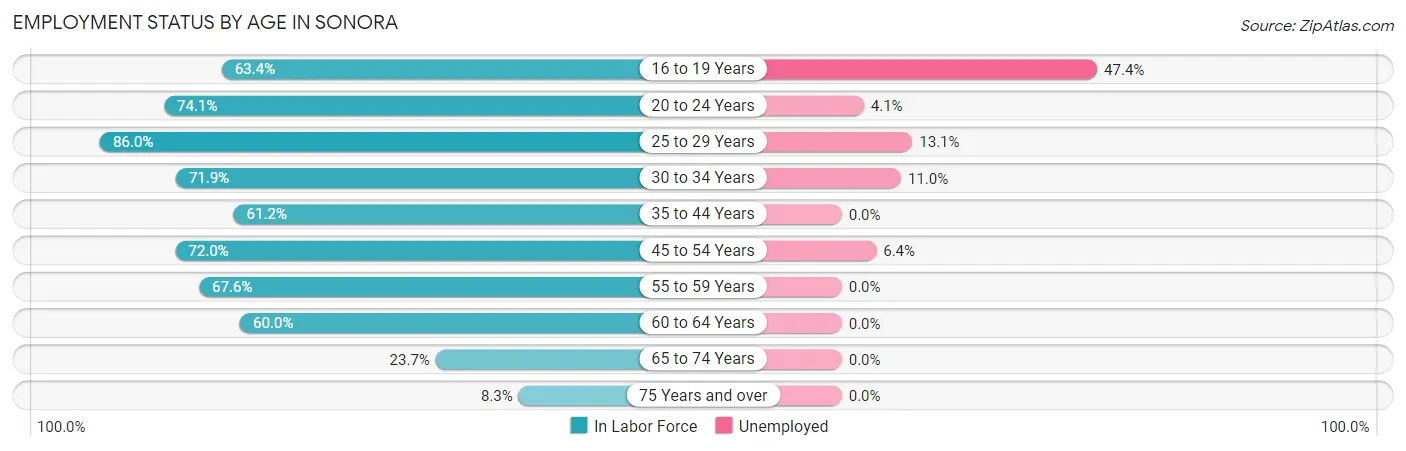
| Age Bracket | In Labor Force | Unemployed |
| 16 to 19 Years | 211 (63.4%) | 100 (47.4%) |
| 20 to 24 Years | 123 (74.1%) | 5 (4.1%) |
| 25 to 29 Years | 375 (86.0%) | 49 (13.1%) |
| 30 to 34 Years | 263 (71.9%) | 29 (11.0%) |
| 35 to 44 Years | 292 (61.2%) | 0 (0.0%) |
| 45 to 54 Years | 362 (72.0%) | 23 (6.4%) |
| 55 to 59 Years | 194 (67.6%) | 0 (0.0%) |
| 60 to 64 Years | 162 (60.0%) | 0 (0.0%) |
| 65 to 74 Years | 178 (23.7%) | 0 (0.0%) |
| 75 Years and over | 38 (8.3%) | 0 (0.0%) |
| Total | 2,197 (54.3%) | 207 (9.4%) |
Employment Status by Educational Attainment in Sonora
According to labor force statistics for Sonora, 70.5% of individuals (1,649) out of the total population between 25 and 64 years of age (2,339) are in the labor force, with 6.1% or 101 of them being unemployed. The group with the highest labor force participation rate are those with the educational attainment of bachelor's degree or higher, with 90.6% or 501 individuals in the labor force. Within the labor force, individuals with less than high school education have the highest percentage of unemployment, with 15.4% or 6 of them being unemployed.
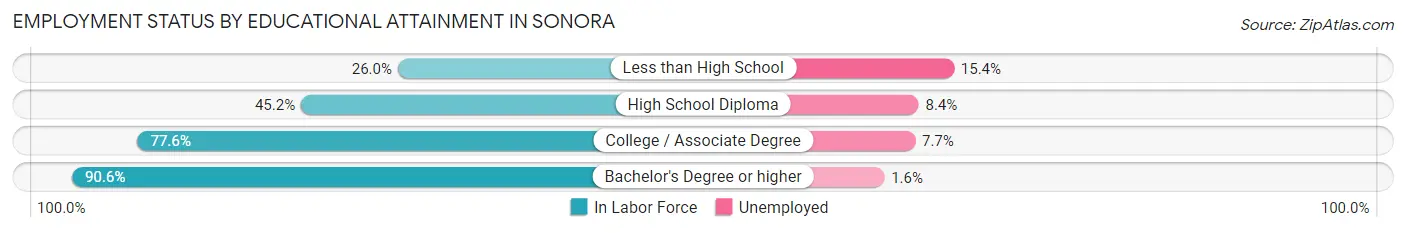
| Educational Attainment | In Labor Force | Unemployed |
| Less than High School | 39 (26.0%) | 23 (15.4%) |
| High School Diploma | 226 (45.2%) | 42 (8.4%) |
| College / Associate Degree | 882 (77.6%) | 87 (7.7%) |
| Bachelor's Degree or higher | 501 (90.6%) | 9 (1.6%) |
| Total | 1,649 (70.5%) | 143 (6.1%) |
Employment Occupations by Sex in Sonora
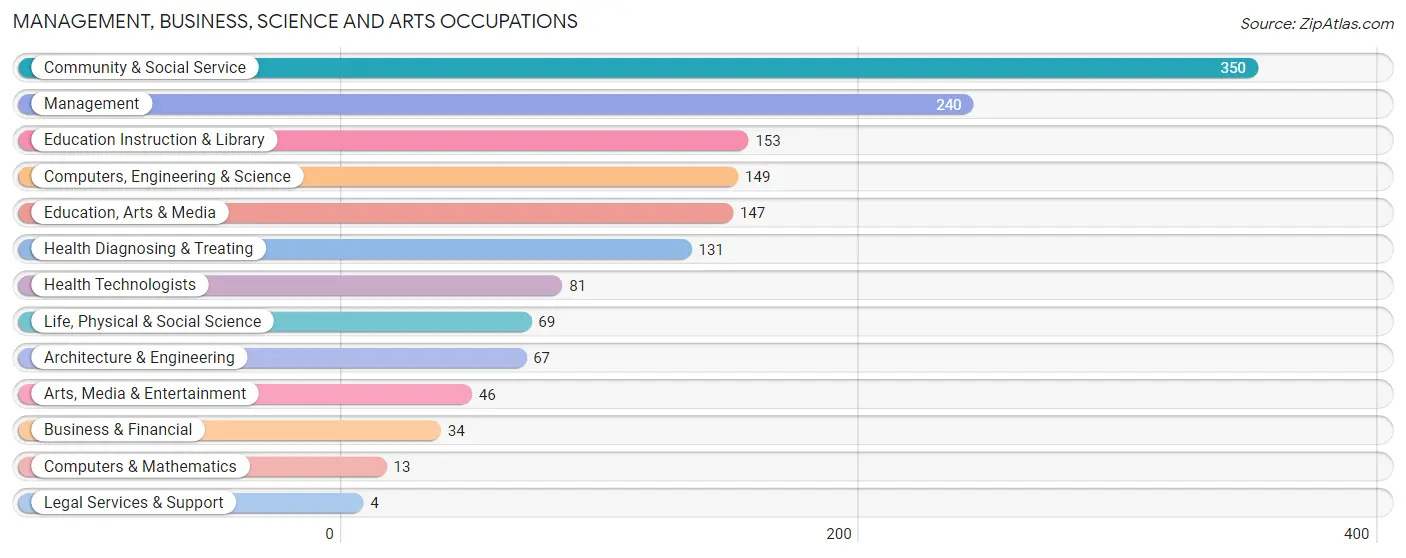
Management, Business, Science and Arts Occupations
The most common Management, Business, Science and Arts occupations in Sonora are Community & Social Service (350 | 17.6%), Management (240 | 12.0%), Education Instruction & Library (153 | 7.7%), Computers, Engineering & Science (149 | 7.5%), and Education, Arts & Media (147 | 7.4%).
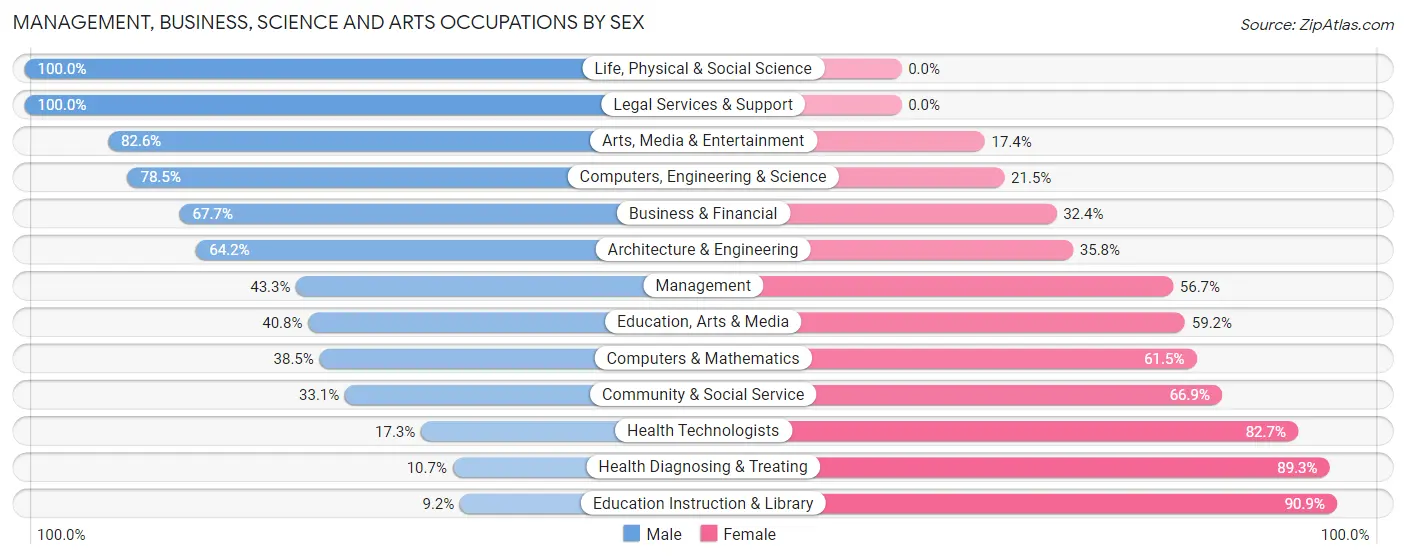
Management, Business, Science and Arts Occupations by Sex
Within the Management, Business, Science and Arts occupations in Sonora, the most male-oriented occupations are Life, Physical & Social Science (100.0%), Legal Services & Support (100.0%), and Arts, Media & Entertainment (82.6%), while the most female-oriented occupations are Education Instruction & Library (90.8%), Health Diagnosing & Treating (89.3%), and Health Technologists (82.7%).
| Occupation | Male | Female |
| Management | 104 (43.3%) | 136 (56.7%) |
| Business & Financial | 23 (67.6%) | 11 (32.4%) |
| Computers, Engineering & Science | 117 (78.5%) | 32 (21.5%) |
| Computers & Mathematics | 5 (38.5%) | 8 (61.5%) |
| Architecture & Engineering | 43 (64.2%) | 24 (35.8%) |
| Life, Physical & Social Science | 69 (100.0%) | 0 (0.0%) |
| Community & Social Service | 116 (33.1%) | 234 (66.9%) |
| Education, Arts & Media | 60 (40.8%) | 87 (59.2%) |
| Legal Services & Support | 4 (100.0%) | 0 (0.0%) |
| Education Instruction & Library | 14 (9.1%) | 139 (90.8%) |
| Arts, Media & Entertainment | 38 (82.6%) | 8 (17.4%) |
| Health Diagnosing & Treating | 14 (10.7%) | 117 (89.3%) |
| Health Technologists | 14 (17.3%) | 67 (82.7%) |
| Total (Category) | 374 (41.4%) | 530 (58.6%) |
| Total (Overall) | 847 (42.5%) | 1,145 (57.5%) |
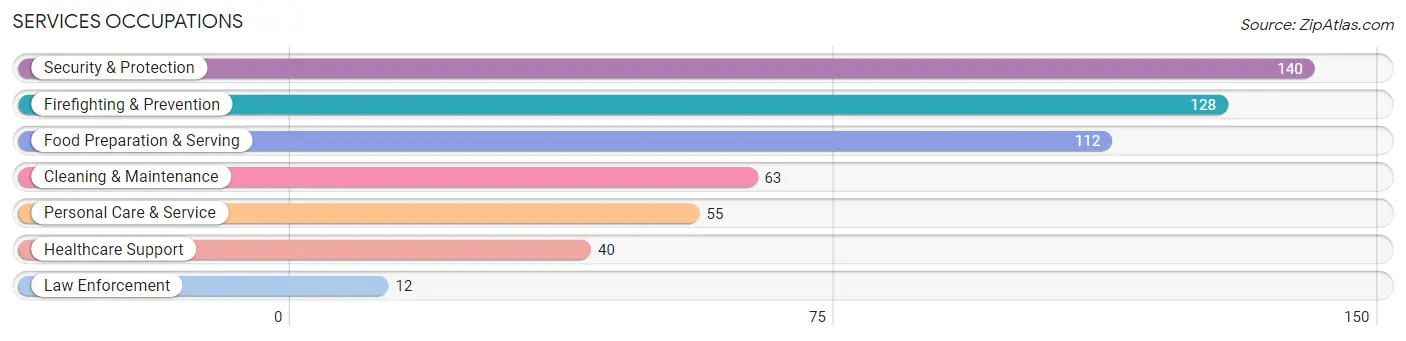
Services Occupations
The most common Services occupations in Sonora are Security & Protection (140 | 7.0%), Firefighting & Prevention (128 | 6.4%), Food Preparation & Serving (112 | 5.6%), Cleaning & Maintenance (63 | 3.2%), and Personal Care & Service (55 | 2.8%).
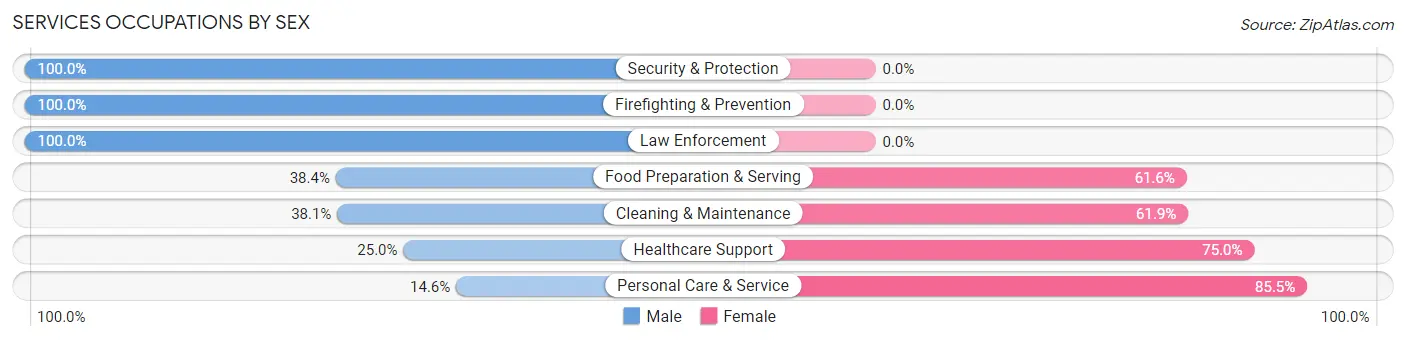
Services Occupations by Sex
Within the Services occupations in Sonora, the most male-oriented occupations are Security & Protection (100.0%), Firefighting & Prevention (100.0%), and Law Enforcement (100.0%), while the most female-oriented occupations are Personal Care & Service (85.5%), Healthcare Support (75.0%), and Cleaning & Maintenance (61.9%).
| Occupation | Male | Female |
| Healthcare Support | 10 (25.0%) | 30 (75.0%) |
| Security & Protection | 140 (100.0%) | 0 (0.0%) |
| Firefighting & Prevention | 128 (100.0%) | 0 (0.0%) |
| Law Enforcement | 12 (100.0%) | 0 (0.0%) |
| Food Preparation & Serving | 43 (38.4%) | 69 (61.6%) |
| Cleaning & Maintenance | 24 (38.1%) | 39 (61.9%) |
| Personal Care & Service | 8 (14.5%) | 47 (85.5%) |
| Total (Category) | 225 (54.9%) | 185 (45.1%) |
| Total (Overall) | 847 (42.5%) | 1,145 (57.5%) |
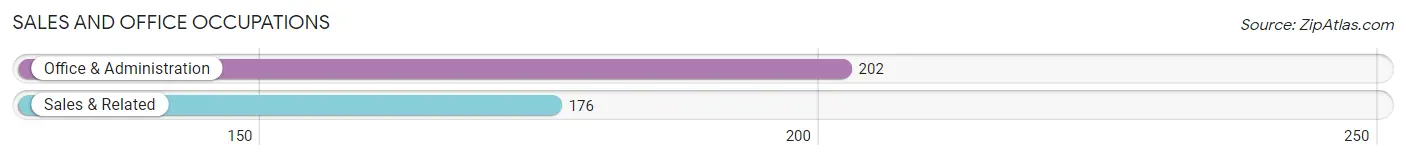
Sales and Office Occupations
The most common Sales and Office occupations in Sonora are Office & Administration (202 | 10.1%), and Sales & Related (176 | 8.8%).
Sales and Office Occupations by Sex
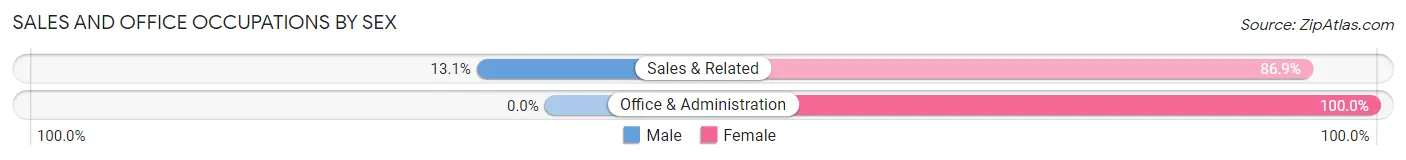
| Occupation | Male | Female |
| Sales & Related | 23 (13.1%) | 153 (86.9%) |
| Office & Administration | 0 (0.0%) | 202 (100.0%) |
| Total (Category) | 23 (6.1%) | 355 (93.9%) |
| Total (Overall) | 847 (42.5%) | 1,145 (57.5%) |
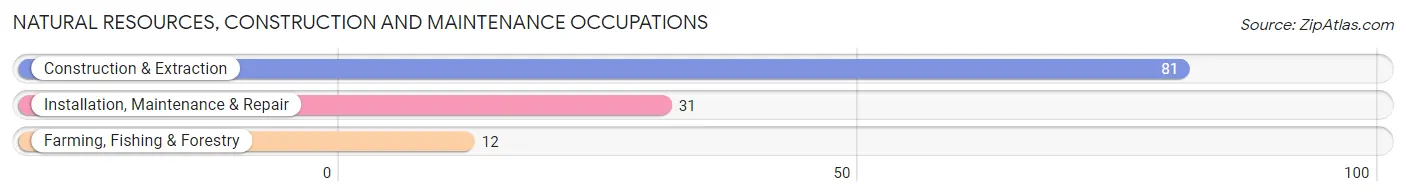
Natural Resources, Construction and Maintenance Occupations
The most common Natural Resources, Construction and Maintenance occupations in Sonora are Construction & Extraction (81 | 4.1%), Installation, Maintenance & Repair (31 | 1.6%), and Farming, Fishing & Forestry (12 | 0.6%).
Natural Resources, Construction and Maintenance Occupations by Sex
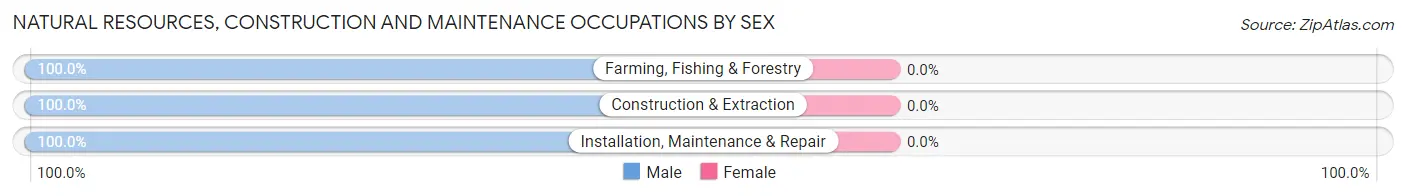
| Occupation | Male | Female |
| Farming, Fishing & Forestry | 12 (100.0%) | 0 (0.0%) |
| Construction & Extraction | 81 (100.0%) | 0 (0.0%) |
| Installation, Maintenance & Repair | 31 (100.0%) | 0 (0.0%) |
| Total (Category) | 124 (100.0%) | 0 (0.0%) |
| Total (Overall) | 847 (42.5%) | 1,145 (57.5%) |
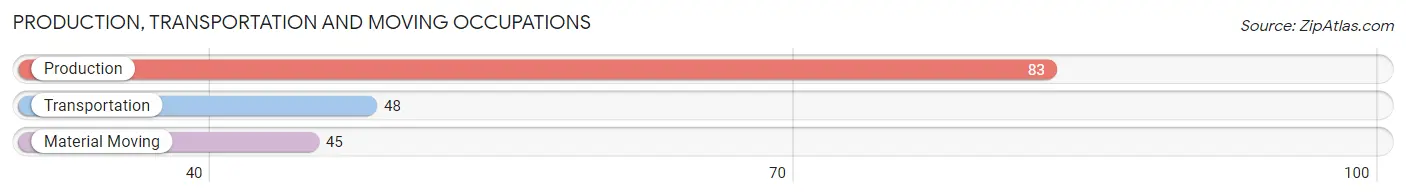
Production, Transportation and Moving Occupations
The most common Production, Transportation and Moving occupations in Sonora are Production (83 | 4.2%), Transportation (48 | 2.4%), and Material Moving (45 | 2.3%).
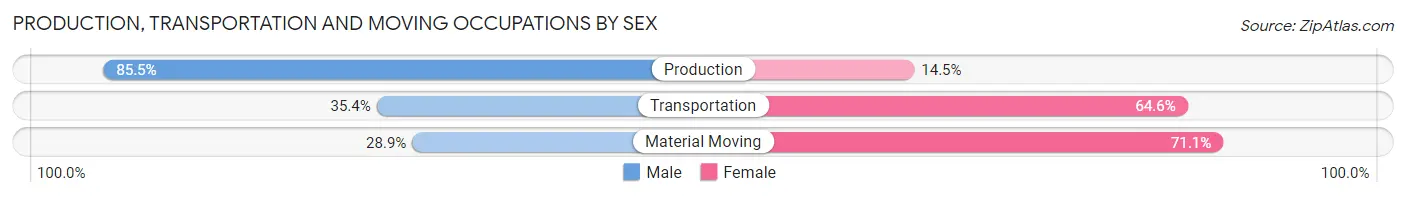
Production, Transportation and Moving Occupations by Sex
| Occupation | Male | Female |
| Production | 71 (85.5%) | 12 (14.5%) |
| Transportation | 17 (35.4%) | 31 (64.6%) |
| Material Moving | 13 (28.9%) | 32 (71.1%) |
| Total (Category) | 101 (57.4%) | 75 (42.6%) |
| Total (Overall) | 847 (42.5%) | 1,145 (57.5%) |
Employment Industries by Sex in Sonora
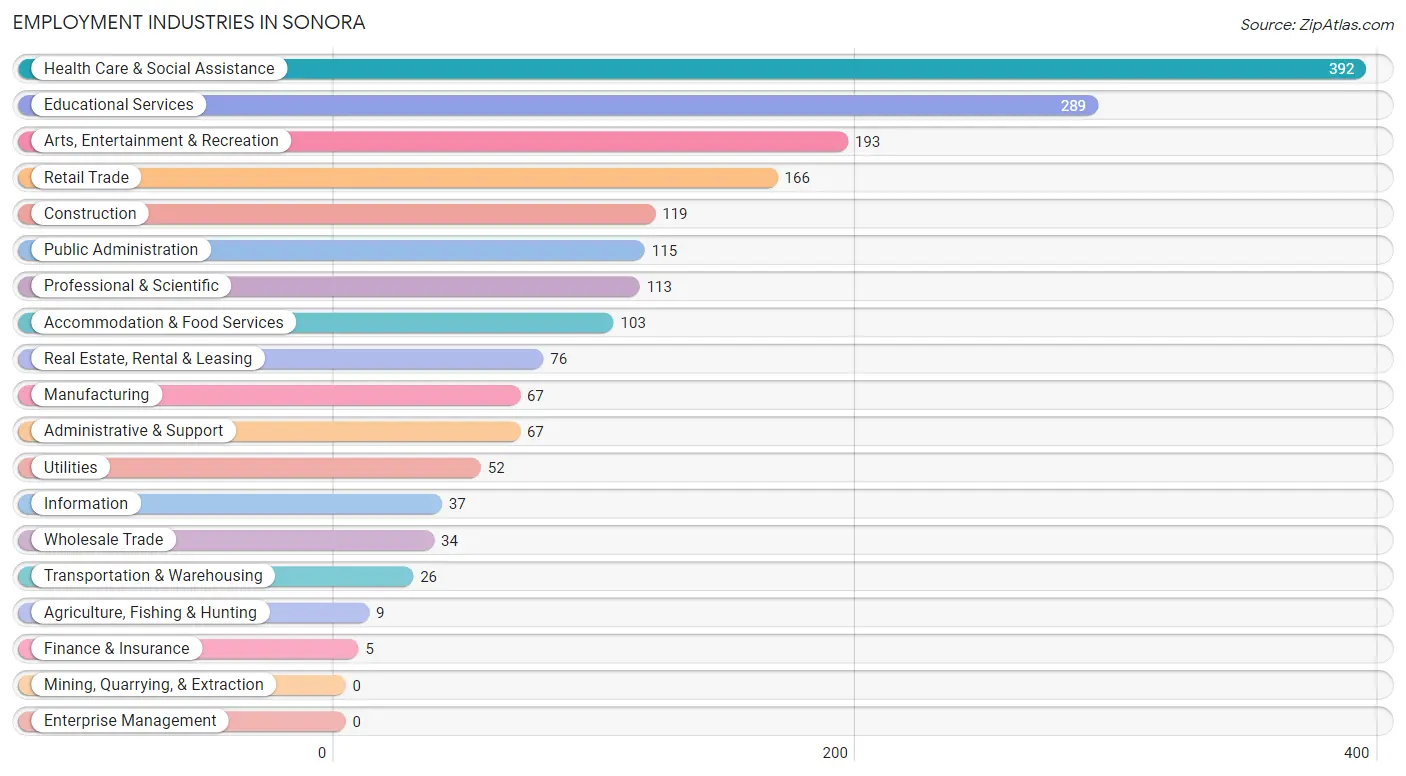
Employment Industries in Sonora
The major employment industries in Sonora include Health Care & Social Assistance (392 | 19.7%), Educational Services (289 | 14.5%), Arts, Entertainment & Recreation (193 | 9.7%), Retail Trade (166 | 8.3%), and Construction (119 | 6.0%).
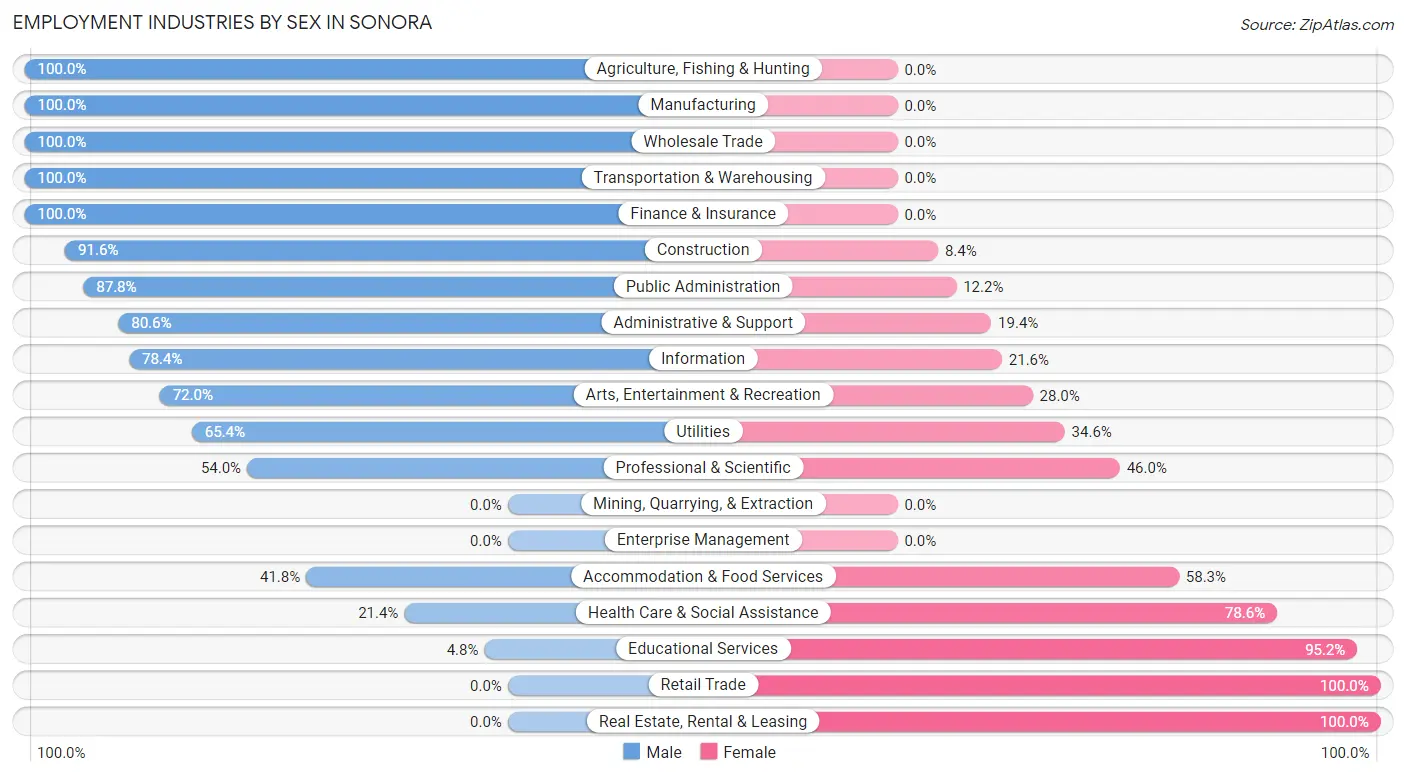
Employment Industries by Sex in Sonora
The Sonora industries that see more men than women are Agriculture, Fishing & Hunting (100.0%), Manufacturing (100.0%), and Wholesale Trade (100.0%), whereas the industries that tend to have a higher number of women are Retail Trade (100.0%), Real Estate, Rental & Leasing (100.0%), and Educational Services (95.2%).
| Industry | Male | Female |
| Agriculture, Fishing & Hunting | 9 (100.0%) | 0 (0.0%) |
| Mining, Quarrying, & Extraction | 0 (0.0%) | 0 (0.0%) |
| Construction | 109 (91.6%) | 10 (8.4%) |
| Manufacturing | 67 (100.0%) | 0 (0.0%) |
| Wholesale Trade | 34 (100.0%) | 0 (0.0%) |
| Retail Trade | 0 (0.0%) | 166 (100.0%) |
| Transportation & Warehousing | 26 (100.0%) | 0 (0.0%) |
| Utilities | 34 (65.4%) | 18 (34.6%) |
| Information | 29 (78.4%) | 8 (21.6%) |
| Finance & Insurance | 5 (100.0%) | 0 (0.0%) |
| Real Estate, Rental & Leasing | 0 (0.0%) | 76 (100.0%) |
| Professional & Scientific | 61 (54.0%) | 52 (46.0%) |
| Enterprise Management | 0 (0.0%) | 0 (0.0%) |
| Administrative & Support | 54 (80.6%) | 13 (19.4%) |
| Educational Services | 14 (4.8%) | 275 (95.2%) |
| Health Care & Social Assistance | 84 (21.4%) | 308 (78.6%) |
| Arts, Entertainment & Recreation | 139 (72.0%) | 54 (28.0%) |
| Accommodation & Food Services | 43 (41.7%) | 60 (58.3%) |
| Public Administration | 101 (87.8%) | 14 (12.2%) |
| Total | 847 (42.5%) | 1,145 (57.5%) |
Education in Sonora
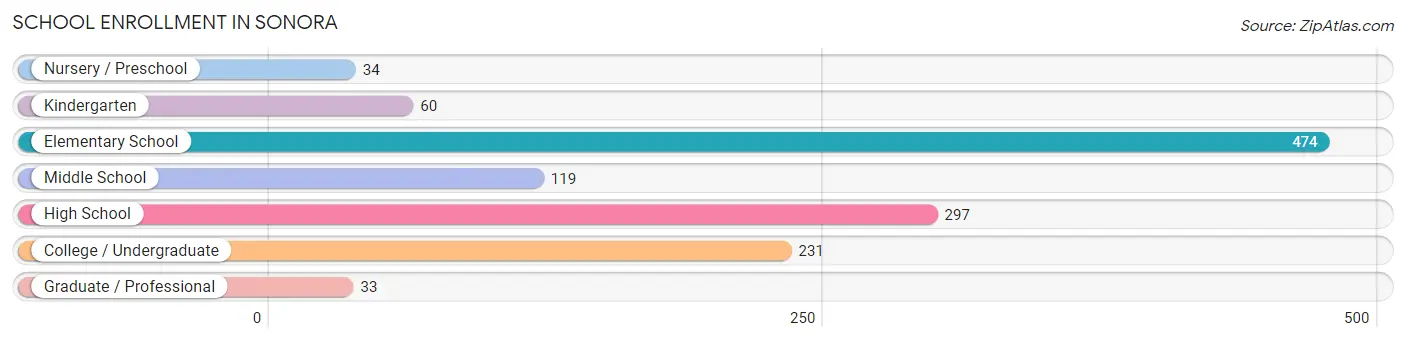
School Enrollment in Sonora
The most common levels of schooling among the 1,248 students in Sonora are elementary school (474 | 38.0%), high school (297 | 23.8%), and college / undergraduate (231 | 18.5%).
| School Level | # Students | % Students |
| Nursery / Preschool | 34 | 2.7% |
| Kindergarten | 60 | 4.8% |
| Elementary School | 474 | 38.0% |
| Middle School | 119 | 9.5% |
| High School | 297 | 23.8% |
| College / Undergraduate | 231 | 18.5% |
| Graduate / Professional | 33 | 2.6% |
| Total | 1,248 | 100.0% |
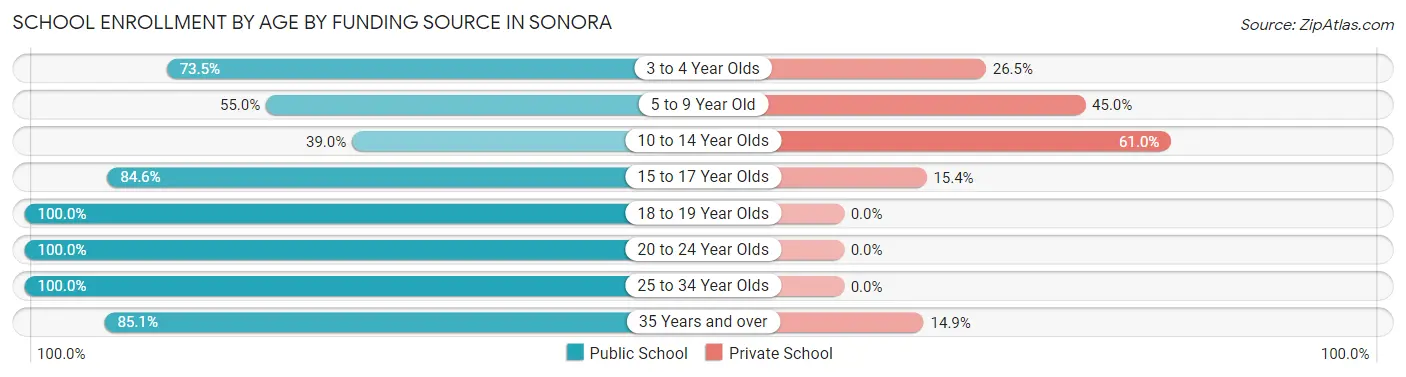
School Enrollment by Age by Funding Source in Sonora
Out of a total of 1,248 students who are enrolled in schools in Sonora, 392 (31.4%) attend a private institution, while the remaining 856 (68.6%) are enrolled in public schools. The age group of 10 to 14 year olds has the highest likelihood of being enrolled in private schools, with 136 (61.0% in the age bracket) enrolled. Conversely, the age group of 18 to 19 year olds has the lowest likelihood of being enrolled in a private school, with 71 (100.0% in the age bracket) attending a public institution.
| Age Bracket | Public School | Private School |
| 3 to 4 Year Olds | 25 (73.5%) | 9 (26.5%) |
| 5 to 9 Year Old | 246 (55.0%) | 201 (45.0%) |
| 10 to 14 Year Olds | 87 (39.0%) | 136 (61.0%) |
| 15 to 17 Year Olds | 214 (84.6%) | 39 (15.4%) |
| 18 to 19 Year Olds | 71 (100.0%) | 0 (0.0%) |
| 20 to 24 Year Olds | 5 (100.0%) | 0 (0.0%) |
| 25 to 34 Year Olds | 168 (100.0%) | 0 (0.0%) |
| 35 Years and over | 40 (85.1%) | 7 (14.9%) |
| Total | 856 (68.6%) | 392 (31.4%) |
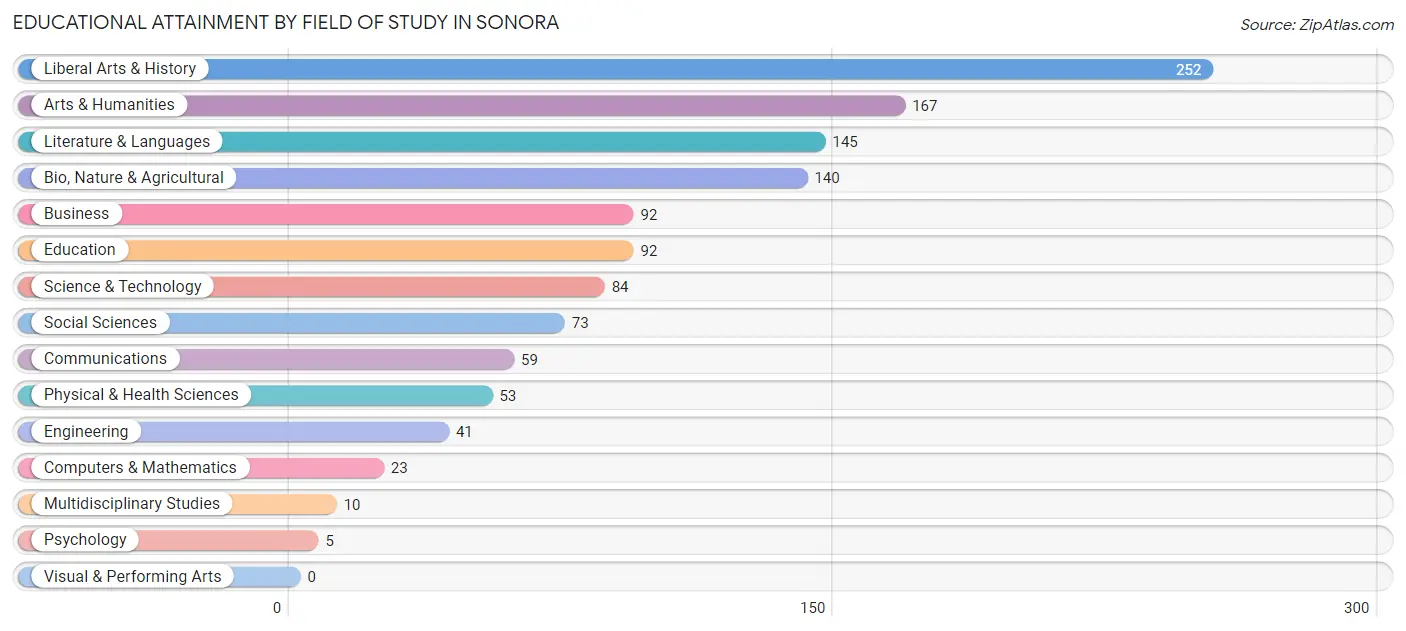
Educational Attainment by Field of Study in Sonora
Liberal arts & history (252 | 20.4%), arts & humanities (167 | 13.5%), literature & languages (145 | 11.7%), bio, nature & agricultural (140 | 11.3%), and business (92 | 7.4%) are the most common fields of study among 1,236 individuals in Sonora who have obtained a bachelor's degree or higher.
| Field of Study | # Graduates | % Graduates |
| Computers & Mathematics | 23 | 1.9% |
| Bio, Nature & Agricultural | 140 | 11.3% |
| Physical & Health Sciences | 53 | 4.3% |
| Psychology | 5 | 0.4% |
| Social Sciences | 73 | 5.9% |
| Engineering | 41 | 3.3% |
| Multidisciplinary Studies | 10 | 0.8% |
| Science & Technology | 84 | 6.8% |
| Business | 92 | 7.4% |
| Education | 92 | 7.4% |
| Literature & Languages | 145 | 11.7% |
| Liberal Arts & History | 252 | 20.4% |
| Visual & Performing Arts | 0 | 0.0% |
| Communications | 59 | 4.8% |
| Arts & Humanities | 167 | 13.5% |
| Total | 1,236 | 100.0% |
Transportation & Commute in Sonora
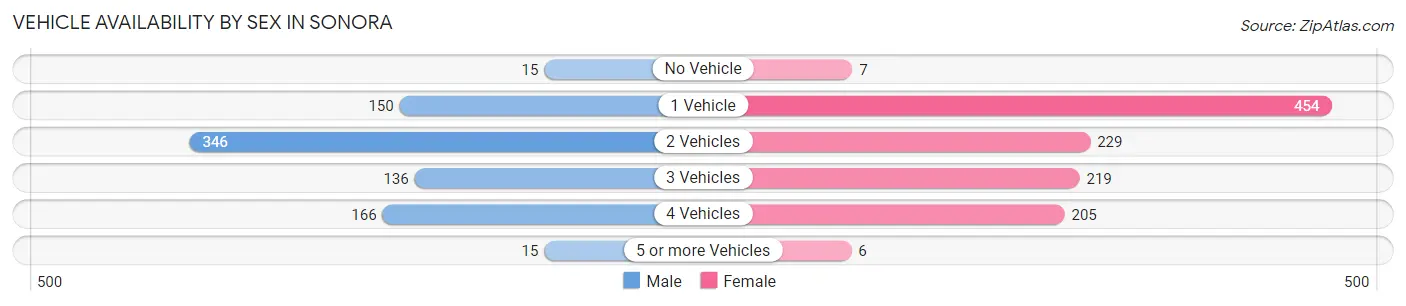
Vehicle Availability by Sex in Sonora
The most prevalent vehicle ownership categories in Sonora are males with 2 vehicles (346, accounting for 41.8%) and females with 2 vehicles (229, making up 30.9%).
| Vehicles Available | Male | Female |
| No Vehicle | 15 (1.8%) | 7 (0.6%) |
| 1 Vehicle | 150 (18.1%) | 454 (40.5%) |
| 2 Vehicles | 346 (41.8%) | 229 (20.4%) |
| 3 Vehicles | 136 (16.4%) | 219 (19.6%) |
| 4 Vehicles | 166 (20.1%) | 205 (18.3%) |
| 5 or more Vehicles | 15 (1.8%) | 6 (0.5%) |
| Total | 828 (100.0%) | 1,120 (100.0%) |
Commute Time in Sonora
The most frequently occuring commute durations in Sonora are 5 to 9 minutes (479 commuters, 27.2%), 10 to 14 minutes (355 commuters, 20.1%), and 15 to 19 minutes (226 commuters, 12.8%).
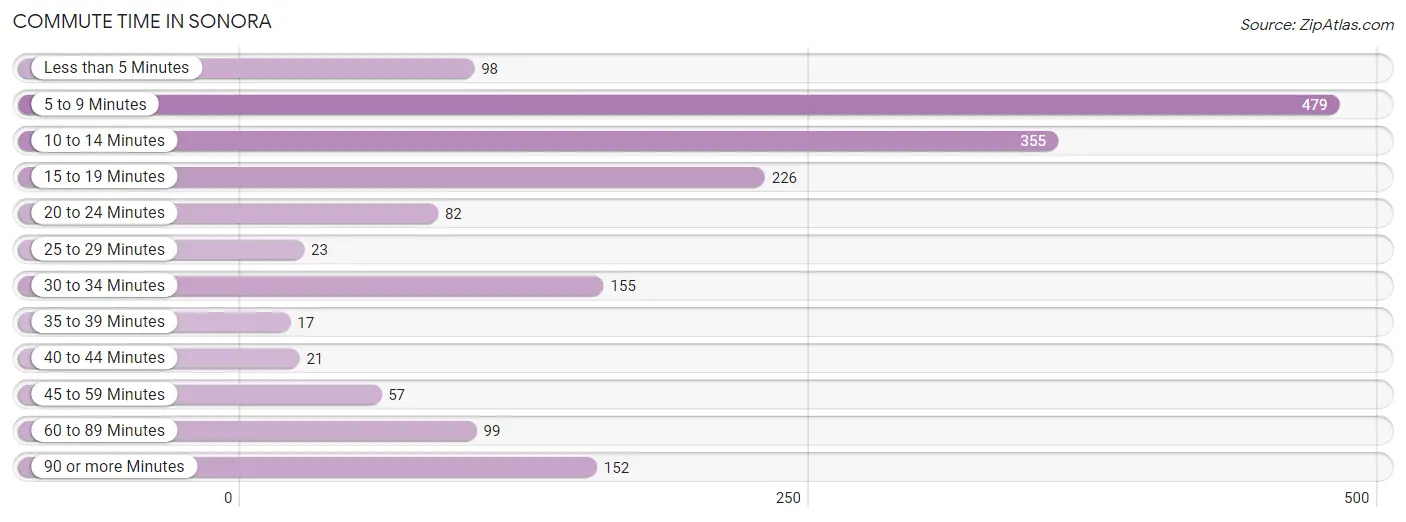
| Commute Time | # Commuters | % Commuters |
| Less than 5 Minutes | 98 | 5.6% |
| 5 to 9 Minutes | 479 | 27.2% |
| 10 to 14 Minutes | 355 | 20.1% |
| 15 to 19 Minutes | 226 | 12.8% |
| 20 to 24 Minutes | 82 | 4.6% |
| 25 to 29 Minutes | 23 | 1.3% |
| 30 to 34 Minutes | 155 | 8.8% |
| 35 to 39 Minutes | 17 | 1.0% |
| 40 to 44 Minutes | 21 | 1.2% |
| 45 to 59 Minutes | 57 | 3.2% |
| 60 to 89 Minutes | 99 | 5.6% |
| 90 or more Minutes | 152 | 8.6% |
Commute Time by Sex in Sonora
The most common commute times in Sonora are 10 to 14 minutes (148 commuters, 18.7%) for males and 5 to 9 minutes (374 commuters, 38.5%) for females.
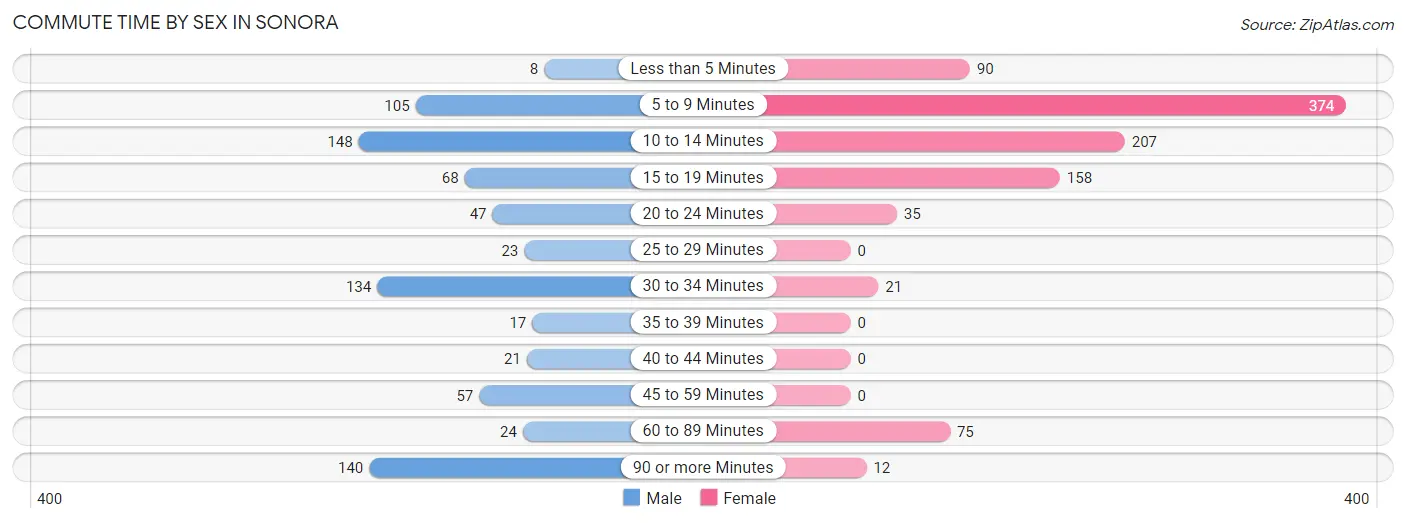
| Commute Time | Male | Female |
| Less than 5 Minutes | 8 (1.0%) | 90 (9.3%) |
| 5 to 9 Minutes | 105 (13.3%) | 374 (38.5%) |
| 10 to 14 Minutes | 148 (18.7%) | 207 (21.3%) |
| 15 to 19 Minutes | 68 (8.6%) | 158 (16.3%) |
| 20 to 24 Minutes | 47 (5.9%) | 35 (3.6%) |
| 25 to 29 Minutes | 23 (2.9%) | 0 (0.0%) |
| 30 to 34 Minutes | 134 (16.9%) | 21 (2.2%) |
| 35 to 39 Minutes | 17 (2.1%) | 0 (0.0%) |
| 40 to 44 Minutes | 21 (2.6%) | 0 (0.0%) |
| 45 to 59 Minutes | 57 (7.2%) | 0 (0.0%) |
| 60 to 89 Minutes | 24 (3.0%) | 75 (7.7%) |
| 90 or more Minutes | 140 (17.7%) | 12 (1.2%) |
Time of Departure to Work by Sex in Sonora
The most frequent times of departure to work in Sonora are 8:00 AM to 8:29 AM (167, 21.1%) for males and 7:30 AM to 7:59 AM (225, 23.2%) for females.
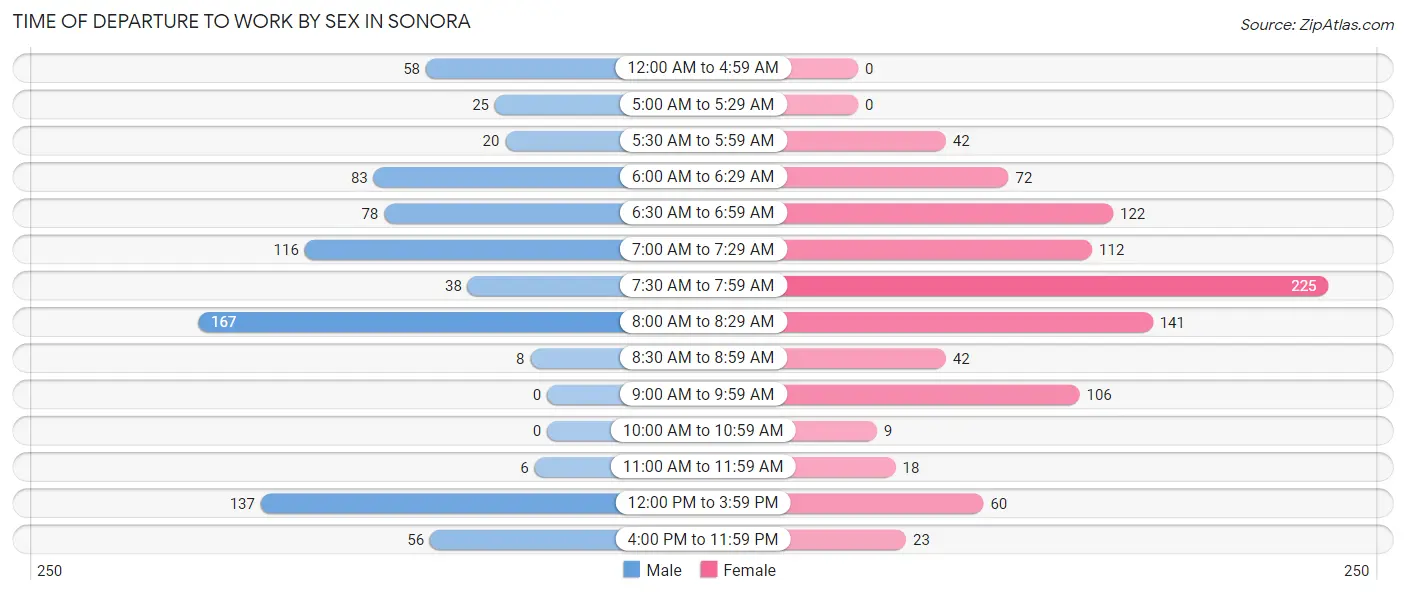
| Time of Departure | Male | Female |
| 12:00 AM to 4:59 AM | 58 (7.3%) | 0 (0.0%) |
| 5:00 AM to 5:29 AM | 25 (3.2%) | 0 (0.0%) |
| 5:30 AM to 5:59 AM | 20 (2.5%) | 42 (4.3%) |
| 6:00 AM to 6:29 AM | 83 (10.5%) | 72 (7.4%) |
| 6:30 AM to 6:59 AM | 78 (9.9%) | 122 (12.6%) |
| 7:00 AM to 7:29 AM | 116 (14.6%) | 112 (11.5%) |
| 7:30 AM to 7:59 AM | 38 (4.8%) | 225 (23.2%) |
| 8:00 AM to 8:29 AM | 167 (21.1%) | 141 (14.5%) |
| 8:30 AM to 8:59 AM | 8 (1.0%) | 42 (4.3%) |
| 9:00 AM to 9:59 AM | 0 (0.0%) | 106 (10.9%) |
| 10:00 AM to 10:59 AM | 0 (0.0%) | 9 (0.9%) |
| 11:00 AM to 11:59 AM | 6 (0.8%) | 18 (1.8%) |
| 12:00 PM to 3:59 PM | 137 (17.3%) | 60 (6.2%) |
| 4:00 PM to 11:59 PM | 56 (7.1%) | 23 (2.4%) |
| Total | 792 (100.0%) | 972 (100.0%) |
Housing Occupancy in Sonora
Occupancy by Ownership in Sonora
Of the total 2,178 dwellings in Sonora, owner-occupied units account for 1,059 (48.6%), while renter-occupied units make up 1,119 (51.4%).
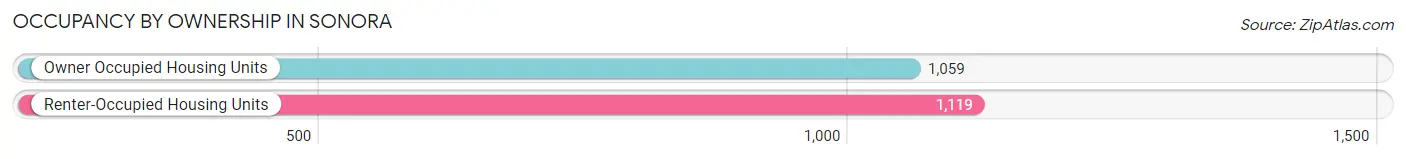
| Occupancy | # Housing Units | % Housing Units |
| Owner Occupied Housing Units | 1,059 | 48.6% |
| Renter-Occupied Housing Units | 1,119 | 51.4% |
| Total Occupied Housing Units | 2,178 | 100.0% |
Occupancy by Household Size in Sonora
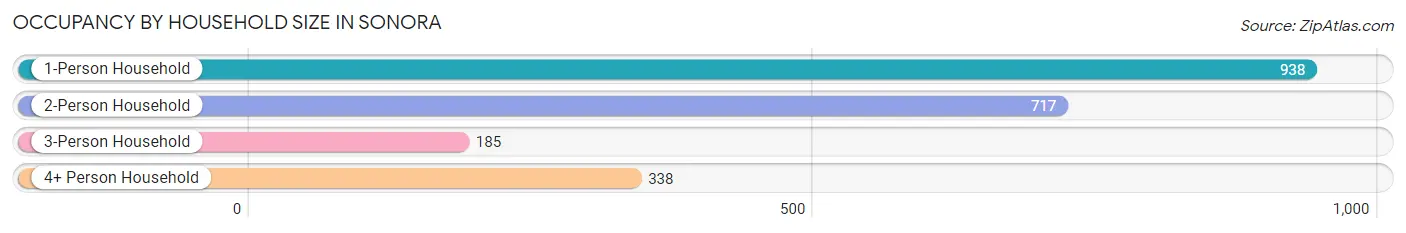
| Household Size | # Housing Units | % Housing Units |
| 1-Person Household | 938 | 43.1% |
| 2-Person Household | 717 | 32.9% |
| 3-Person Household | 185 | 8.5% |
| 4+ Person Household | 338 | 15.5% |
| Total Housing Units | 2,178 | 100.0% |
Occupancy by Ownership by Household Size in Sonora
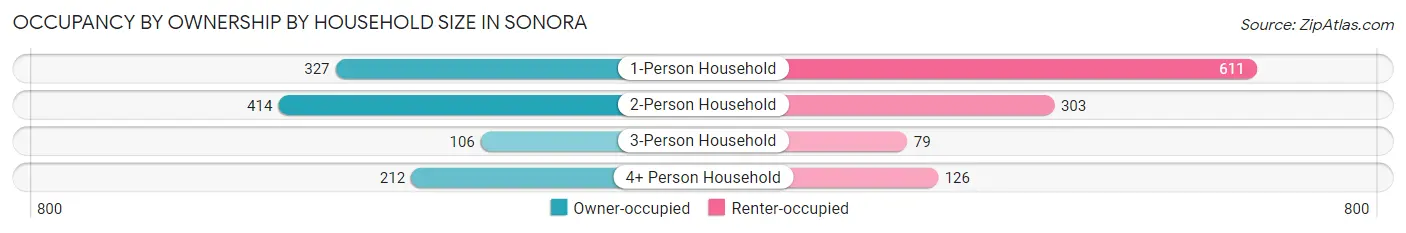
| Household Size | Owner-occupied | Renter-occupied |
| 1-Person Household | 327 (34.9%) | 611 (65.1%) |
| 2-Person Household | 414 (57.7%) | 303 (42.3%) |
| 3-Person Household | 106 (57.3%) | 79 (42.7%) |
| 4+ Person Household | 212 (62.7%) | 126 (37.3%) |
| Total Housing Units | 1,059 (48.6%) | 1,119 (51.4%) |
Occupancy by Educational Attainment in Sonora
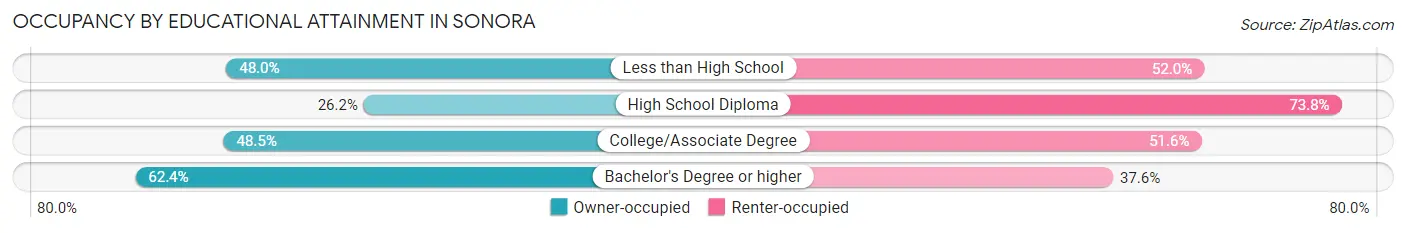
| Household Size | Owner-occupied | Renter-occupied |
| Less than High School | 72 (48.0%) | 78 (52.0%) |
| High School Diploma | 114 (26.2%) | 321 (73.8%) |
| College/Associate Degree | 421 (48.4%) | 448 (51.5%) |
| Bachelor's Degree or higher | 452 (62.4%) | 272 (37.6%) |
Occupancy by Age of Householder in Sonora
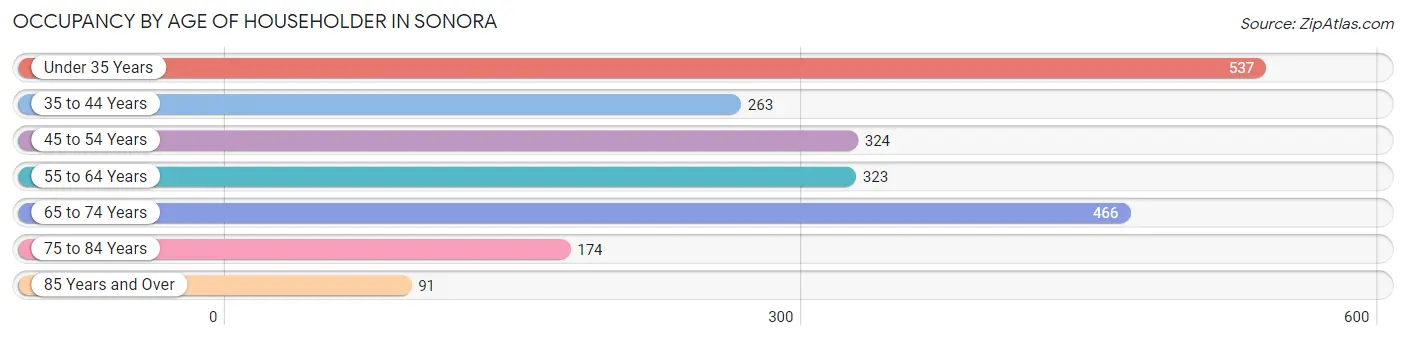
| Age Bracket | # Households | % Households |
| Under 35 Years | 537 | 24.7% |
| 35 to 44 Years | 263 | 12.1% |
| 45 to 54 Years | 324 | 14.9% |
| 55 to 64 Years | 323 | 14.8% |
| 65 to 74 Years | 466 | 21.4% |
| 75 to 84 Years | 174 | 8.0% |
| 85 Years and Over | 91 | 4.2% |
| Total | 2,178 | 100.0% |
Housing Finances in Sonora
Median Income by Occupancy in Sonora
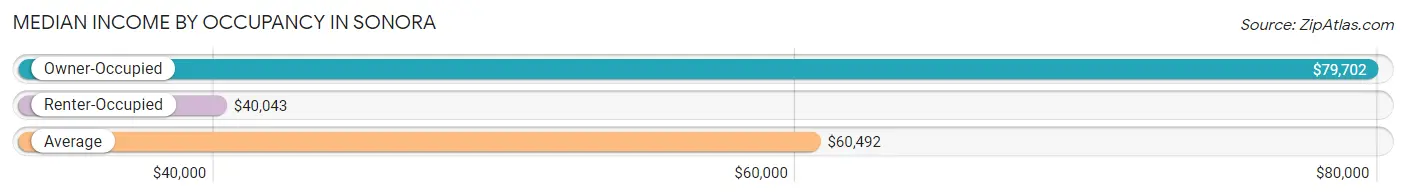
| Occupancy Type | # Households | Median Income |
| Owner-Occupied | 1,059 (48.6%) | $79,702 |
| Renter-Occupied | 1,119 (51.4%) | $40,043 |
| Average | 2,178 (100.0%) | $60,492 |
Occupancy by Householder Income Bracket in Sonora
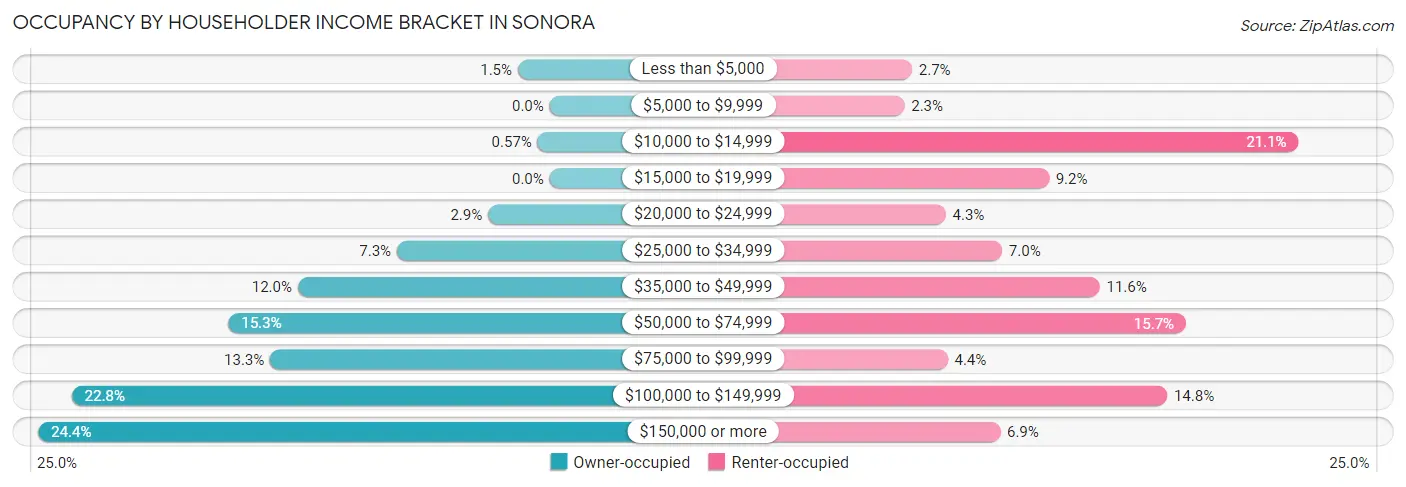
| Income Bracket | Owner-occupied | Renter-occupied |
| Less than $5,000 | 16 (1.5%) | 30 (2.7%) |
| $5,000 to $9,999 | 0 (0.0%) | 26 (2.3%) |
| $10,000 to $14,999 | 6 (0.6%) | 236 (21.1%) |
| $15,000 to $19,999 | 0 (0.0%) | 103 (9.2%) |
| $20,000 to $24,999 | 31 (2.9%) | 48 (4.3%) |
| $25,000 to $34,999 | 77 (7.3%) | 78 (7.0%) |
| $35,000 to $49,999 | 127 (12.0%) | 130 (11.6%) |
| $50,000 to $74,999 | 162 (15.3%) | 176 (15.7%) |
| $75,000 to $99,999 | 141 (13.3%) | 49 (4.4%) |
| $100,000 to $149,999 | 241 (22.8%) | 166 (14.8%) |
| $150,000 or more | 258 (24.4%) | 77 (6.9%) |
| Total | 1,059 (100.0%) | 1,119 (100.0%) |
Monthly Housing Cost Tiers in Sonora
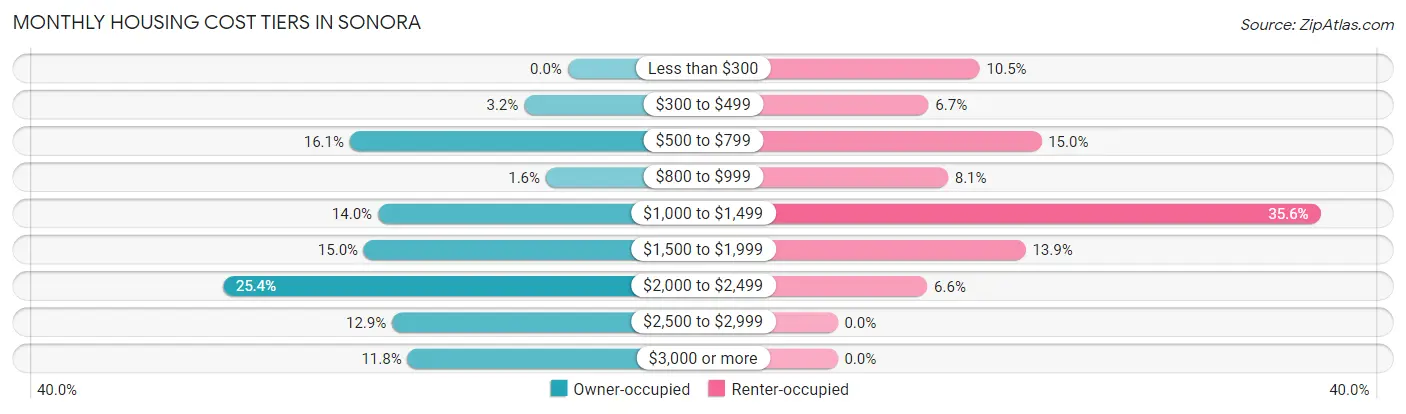
| Monthly Cost | Owner-occupied | Renter-occupied |
| Less than $300 | 0 (0.0%) | 117 (10.5%) |
| $300 to $499 | 34 (3.2%) | 75 (6.7%) |
| $500 to $799 | 170 (16.1%) | 168 (15.0%) |
| $800 to $999 | 17 (1.6%) | 91 (8.1%) |
| $1,000 to $1,499 | 148 (14.0%) | 398 (35.6%) |
| $1,500 to $1,999 | 159 (15.0%) | 155 (13.9%) |
| $2,000 to $2,499 | 269 (25.4%) | 74 (6.6%) |
| $2,500 to $2,999 | 137 (12.9%) | 0 (0.0%) |
| $3,000 or more | 125 (11.8%) | 0 (0.0%) |
| Total | 1,059 (100.0%) | 1,119 (100.0%) |
Physical Housing Characteristics in Sonora
Housing Structures in Sonora
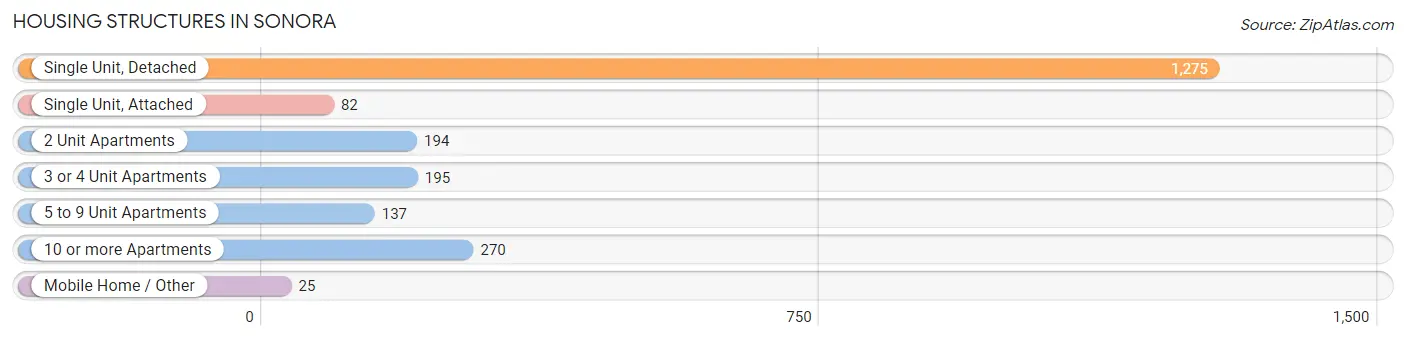
| Structure Type | # Housing Units | % Housing Units |
| Single Unit, Detached | 1,275 | 58.5% |
| Single Unit, Attached | 82 | 3.8% |
| 2 Unit Apartments | 194 | 8.9% |
| 3 or 4 Unit Apartments | 195 | 8.9% |
| 5 to 9 Unit Apartments | 137 | 6.3% |
| 10 or more Apartments | 270 | 12.4% |
| Mobile Home / Other | 25 | 1.1% |
| Total | 2,178 | 100.0% |
Housing Structures by Occupancy in Sonora
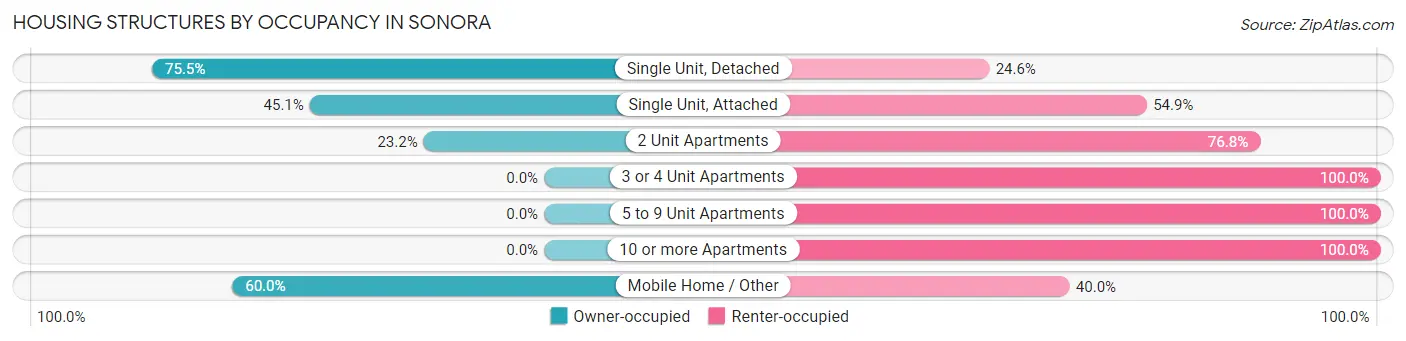
| Structure Type | Owner-occupied | Renter-occupied |
| Single Unit, Detached | 962 (75.4%) | 313 (24.5%) |
| Single Unit, Attached | 37 (45.1%) | 45 (54.9%) |
| 2 Unit Apartments | 45 (23.2%) | 149 (76.8%) |
| 3 or 4 Unit Apartments | 0 (0.0%) | 195 (100.0%) |
| 5 to 9 Unit Apartments | 0 (0.0%) | 137 (100.0%) |
| 10 or more Apartments | 0 (0.0%) | 270 (100.0%) |
| Mobile Home / Other | 15 (60.0%) | 10 (40.0%) |
| Total | 1,059 (48.6%) | 1,119 (51.4%) |
Housing Structures by Number of Rooms in Sonora
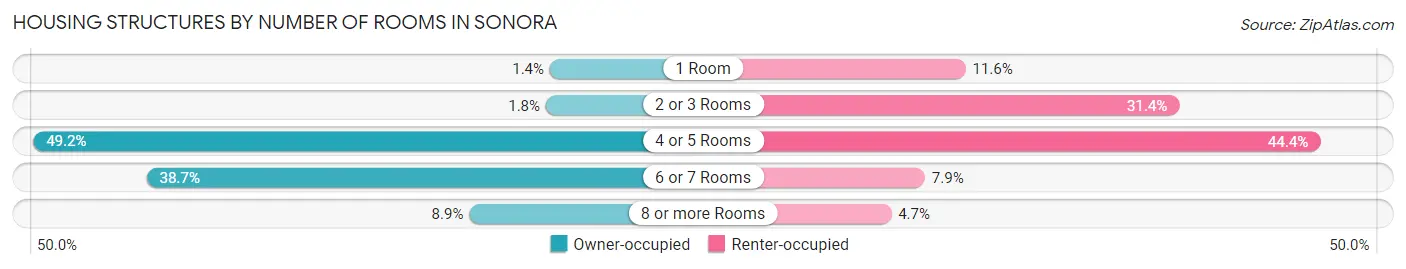
| Number of Rooms | Owner-occupied | Renter-occupied |
| 1 Room | 15 (1.4%) | 130 (11.6%) |
| 2 or 3 Rooms | 19 (1.8%) | 351 (31.4%) |
| 4 or 5 Rooms | 521 (49.2%) | 497 (44.4%) |
| 6 or 7 Rooms | 410 (38.7%) | 88 (7.9%) |
| 8 or more Rooms | 94 (8.9%) | 53 (4.7%) |
| Total | 1,059 (100.0%) | 1,119 (100.0%) |
Housing Structure by Heating Type in Sonora
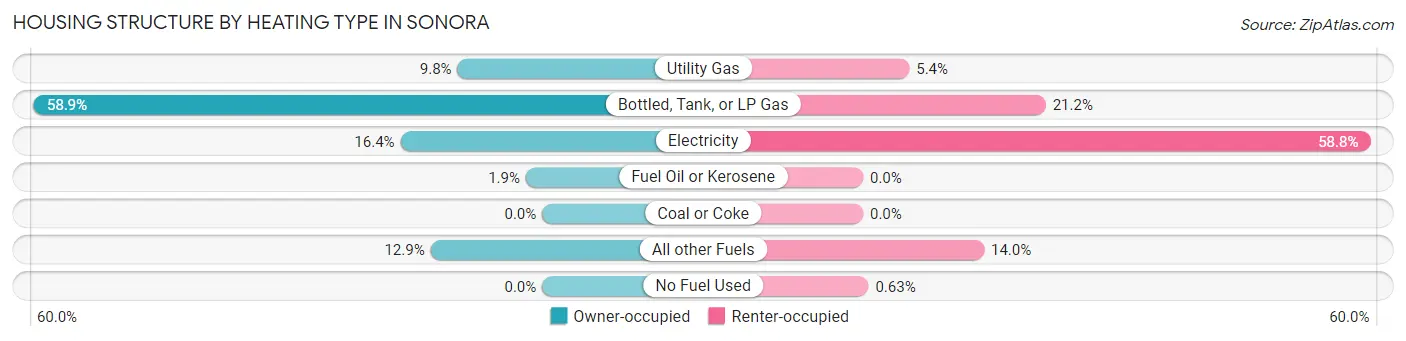
| Heating Type | Owner-occupied | Renter-occupied |
| Utility Gas | 104 (9.8%) | 60 (5.4%) |
| Bottled, Tank, or LP Gas | 624 (58.9%) | 237 (21.2%) |
| Electricity | 174 (16.4%) | 658 (58.8%) |
| Fuel Oil or Kerosene | 20 (1.9%) | 0 (0.0%) |
| Coal or Coke | 0 (0.0%) | 0 (0.0%) |
| All other Fuels | 137 (12.9%) | 157 (14.0%) |
| No Fuel Used | 0 (0.0%) | 7 (0.6%) |
| Total | 1,059 (100.0%) | 1,119 (100.0%) |
Household Vehicle Usage in Sonora
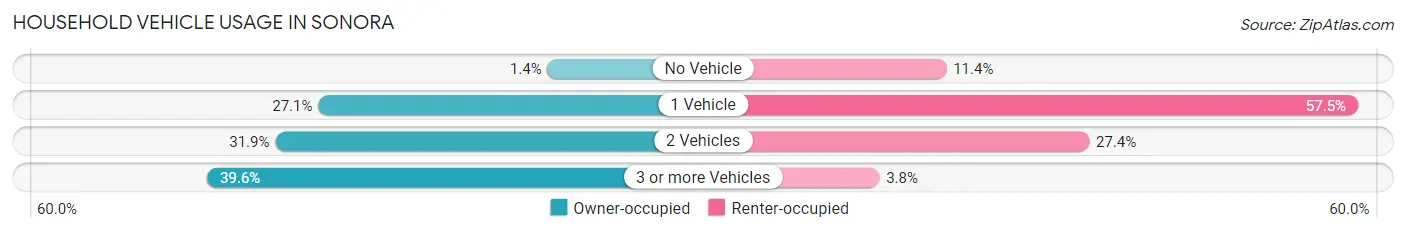
| Vehicles per Household | Owner-occupied | Renter-occupied |
| No Vehicle | 15 (1.4%) | 127 (11.4%) |
| 1 Vehicle | 287 (27.1%) | 643 (57.5%) |
| 2 Vehicles | 338 (31.9%) | 306 (27.4%) |
| 3 or more Vehicles | 419 (39.6%) | 43 (3.8%) |
| Total | 1,059 (100.0%) | 1,119 (100.0%) |
Real Estate & Mortgages in Sonora
Real Estate and Mortgage Overview in Sonora
| Characteristic | Without Mortgage | With Mortgage |
| Housing Units | 246 | 813 |
| Median Property Value | $322,800 | $385,800 |
| Median Household Income | $60,488 | $235 |
| Monthly Housing Costs | $659 | $125 |
| Real Estate Taxes | $1,670 | $0 |
Property Value by Mortgage Status in Sonora
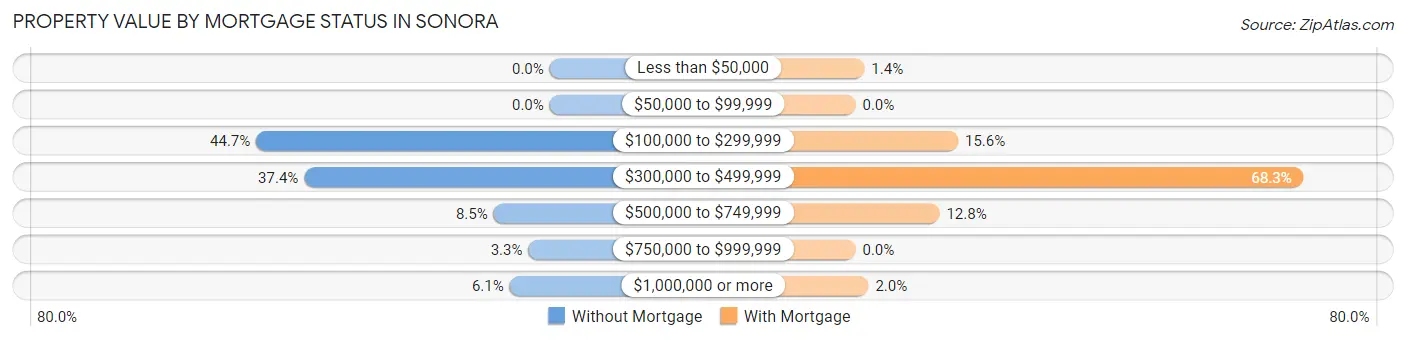
| Property Value | Without Mortgage | With Mortgage |
| Less than $50,000 | 0 (0.0%) | 11 (1.3%) |
| $50,000 to $99,999 | 0 (0.0%) | 0 (0.0%) |
| $100,000 to $299,999 | 110 (44.7%) | 127 (15.6%) |
| $300,000 to $499,999 | 92 (37.4%) | 555 (68.3%) |
| $500,000 to $749,999 | 21 (8.5%) | 104 (12.8%) |
| $750,000 to $999,999 | 8 (3.3%) | 0 (0.0%) |
| $1,000,000 or more | 15 (6.1%) | 16 (2.0%) |
| Total | 246 (100.0%) | 813 (100.0%) |
Household Income by Mortgage Status in Sonora
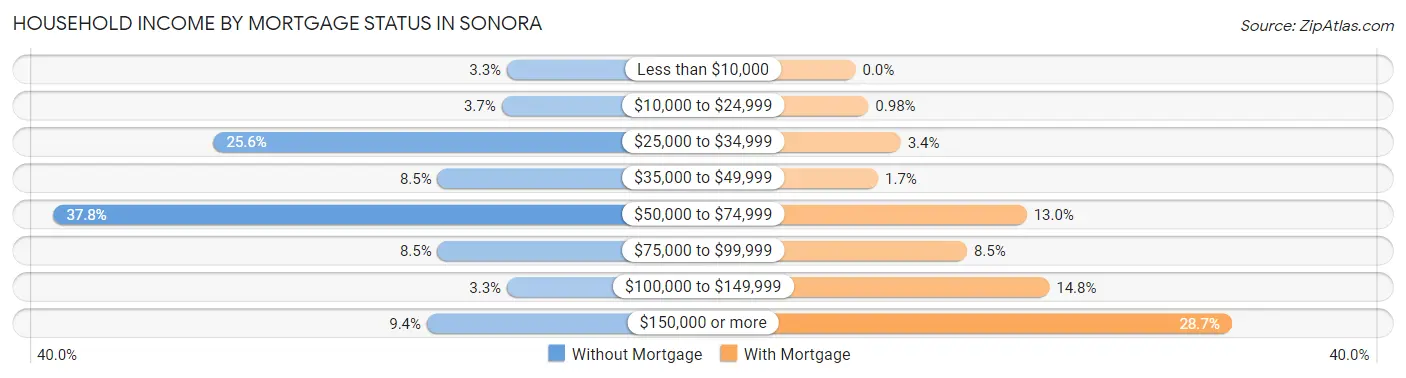
| Household Income | Without Mortgage | With Mortgage |
| Less than $10,000 | 8 (3.3%) | 0 (0.0%) |
| $10,000 to $24,999 | 9 (3.7%) | 8 (1.0%) |
| $25,000 to $34,999 | 63 (25.6%) | 28 (3.4%) |
| $35,000 to $49,999 | 21 (8.5%) | 14 (1.7%) |
| $50,000 to $74,999 | 93 (37.8%) | 106 (13.0%) |
| $75,000 to $99,999 | 21 (8.5%) | 69 (8.5%) |
| $100,000 to $149,999 | 8 (3.3%) | 120 (14.8%) |
| $150,000 or more | 23 (9.3%) | 233 (28.7%) |
| Total | 246 (100.0%) | 813 (100.0%) |
Property Value to Household Income Ratio in Sonora
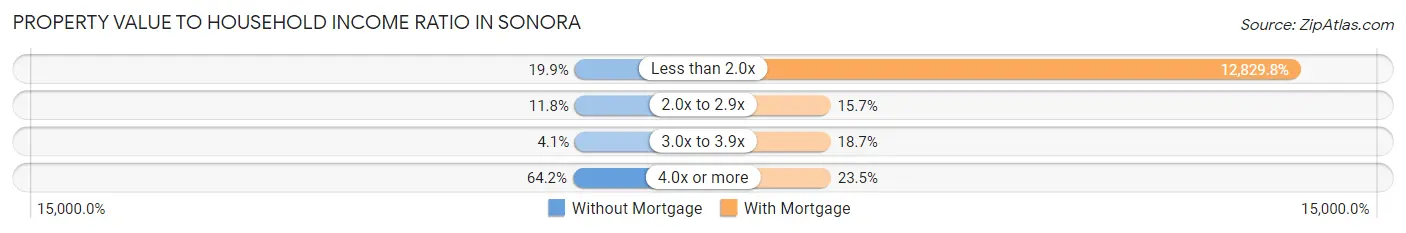
| Value-to-Income Ratio | Without Mortgage | With Mortgage |
| Less than 2.0x | 49 (19.9%) | 104,306 (12,829.8%) |
| 2.0x to 2.9x | 29 (11.8%) | 128 (15.7%) |
| 3.0x to 3.9x | 10 (4.1%) | 152 (18.7%) |
| 4.0x or more | 158 (64.2%) | 191 (23.5%) |
| Total | 246 (100.0%) | 813 (100.0%) |
Real Estate Taxes by Mortgage Status in Sonora
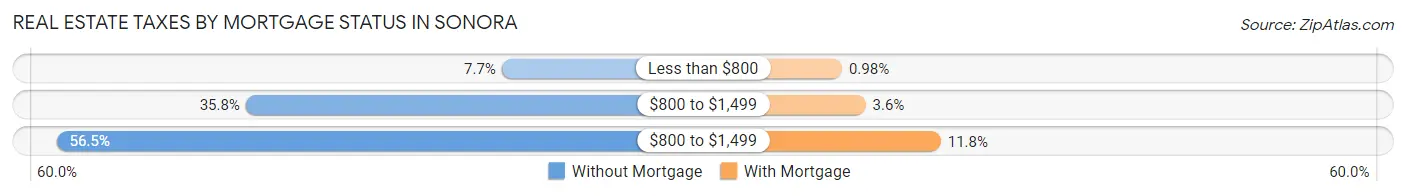
| Property Taxes | Without Mortgage | With Mortgage |
| Less than $800 | 19 (7.7%) | 8 (1.0%) |
| $800 to $1,499 | 88 (35.8%) | 29 (3.6%) |
| $800 to $1,499 | 139 (56.5%) | 96 (11.8%) |
| Total | 246 (100.0%) | 813 (100.0%) |
Health & Disability in Sonora
Health Insurance Coverage by Age in Sonora
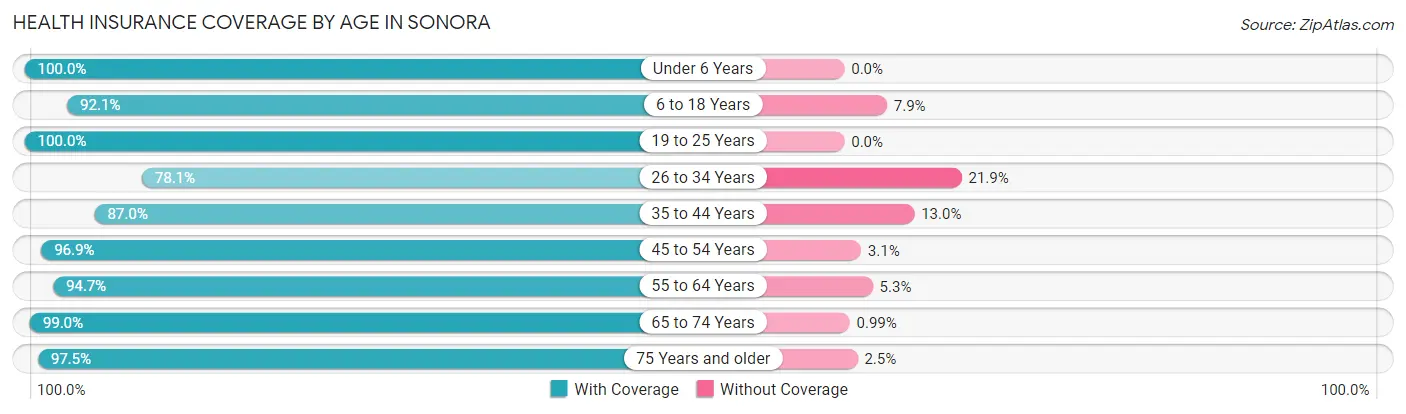
| Age Bracket | With Coverage | Without Coverage |
| Under 6 Years | 269 (100.0%) | 0 (0.0%) |
| 6 to 18 Years | 870 (92.1%) | 75 (7.9%) |
| 19 to 25 Years | 303 (100.0%) | 0 (0.0%) |
| 26 to 34 Years | 518 (78.1%) | 145 (21.9%) |
| 35 to 44 Years | 380 (87.0%) | 57 (13.0%) |
| 45 to 54 Years | 469 (96.9%) | 15 (3.1%) |
| 55 to 64 Years | 519 (94.7%) | 29 (5.3%) |
| 65 to 74 Years | 698 (99.0%) | 7 (1.0%) |
| 75 Years and older | 397 (97.5%) | 10 (2.5%) |
| Total | 4,423 (92.9%) | 338 (7.1%) |
Health Insurance Coverage by Citizenship Status in Sonora
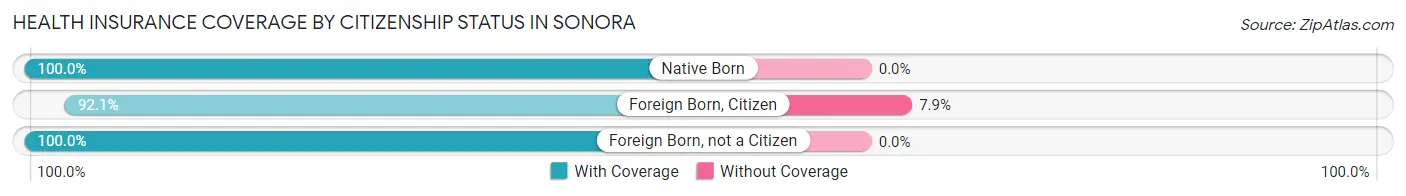
| Citizenship Status | With Coverage | Without Coverage |
| Native Born | 269 (100.0%) | 0 (0.0%) |
| Foreign Born, Citizen | 870 (92.1%) | 75 (7.9%) |
| Foreign Born, not a Citizen | 303 (100.0%) | 0 (0.0%) |
Health Insurance Coverage by Household Income in Sonora
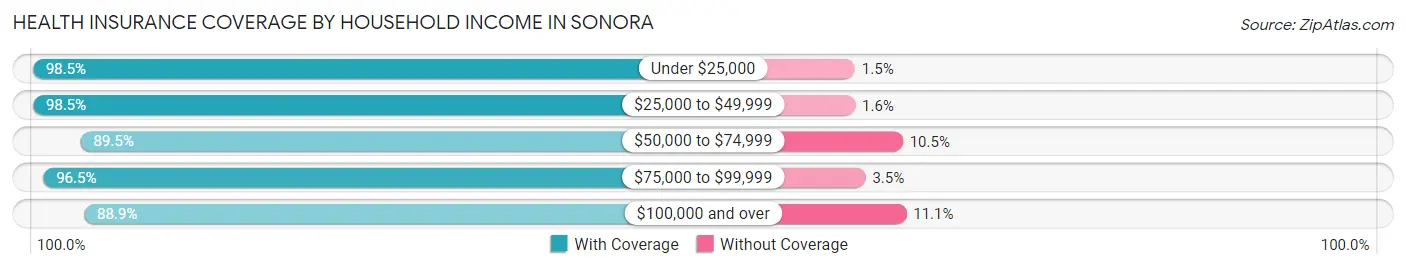
| Household Income | With Coverage | Without Coverage |
| Under $25,000 | 909 (98.5%) | 14 (1.5%) |
| $25,000 to $49,999 | 764 (98.5%) | 12 (1.5%) |
| $50,000 to $74,999 | 521 (89.5%) | 61 (10.5%) |
| $75,000 to $99,999 | 276 (96.5%) | 10 (3.5%) |
| $100,000 and over | 1,922 (88.9%) | 241 (11.1%) |
Public vs Private Health Insurance Coverage by Age in Sonora
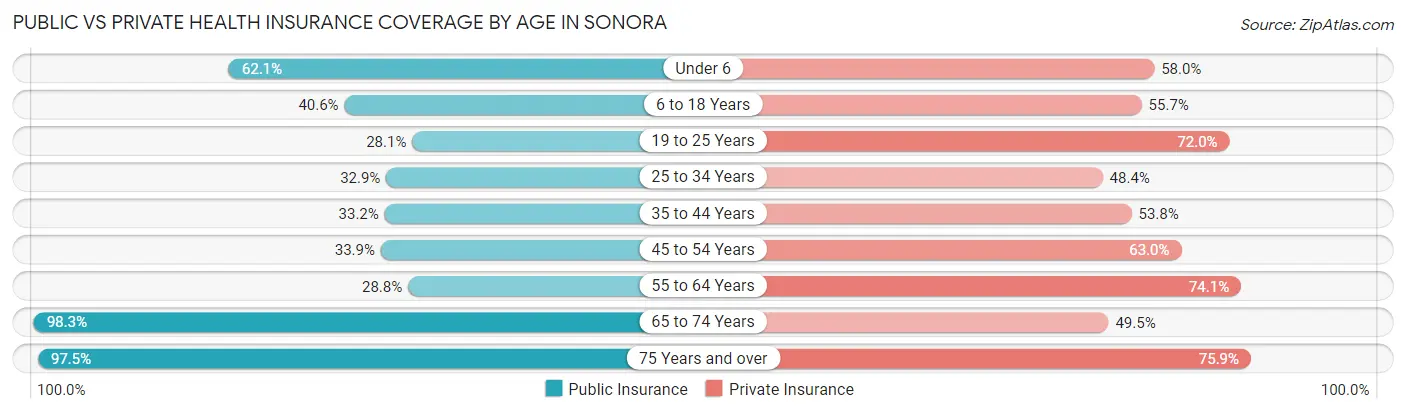
| Age Bracket | Public Insurance | Private Insurance |
| Under 6 | 167 (62.1%) | 156 (58.0%) |
| 6 to 18 Years | 384 (40.6%) | 526 (55.7%) |
| 19 to 25 Years | 85 (28.1%) | 218 (72.0%) |
| 25 to 34 Years | 218 (32.9%) | 321 (48.4%) |
| 35 to 44 Years | 145 (33.2%) | 235 (53.8%) |
| 45 to 54 Years | 164 (33.9%) | 305 (63.0%) |
| 55 to 64 Years | 158 (28.8%) | 406 (74.1%) |
| 65 to 74 Years | 693 (98.3%) | 349 (49.5%) |
| 75 Years and over | 397 (97.5%) | 309 (75.9%) |
| Total | 2,411 (50.6%) | 2,825 (59.3%) |
Disability Status by Sex by Age in Sonora
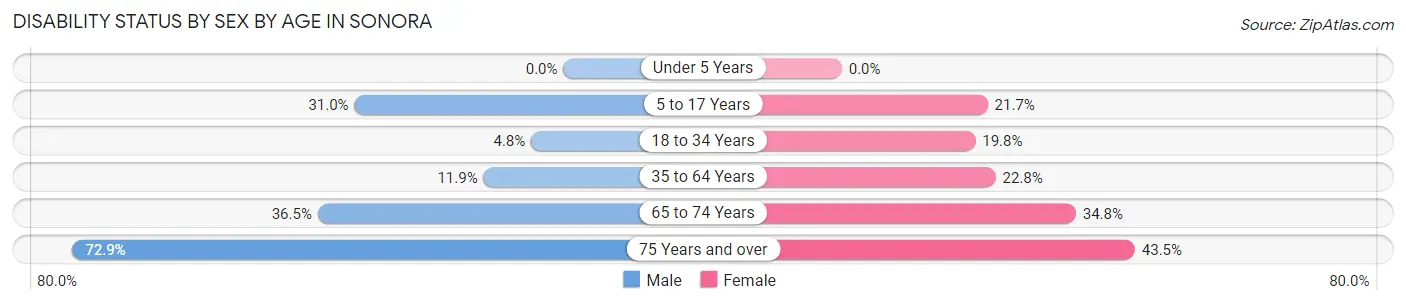
| Age Bracket | Male | Female |
| Under 5 Years | 0 (0.0%) | 0 (0.0%) |
| 5 to 17 Years | 103 (31.0%) | 146 (21.7%) |
| 18 to 34 Years | 23 (4.8%) | 110 (19.8%) |
| 35 to 64 Years | 74 (11.9%) | 193 (22.8%) |
| 65 to 74 Years | 128 (36.5%) | 123 (34.7%) |
| 75 Years and over | 156 (72.9%) | 84 (43.5%) |
Disability Class by Sex by Age in Sonora
Disability Class: Hearing Difficulty
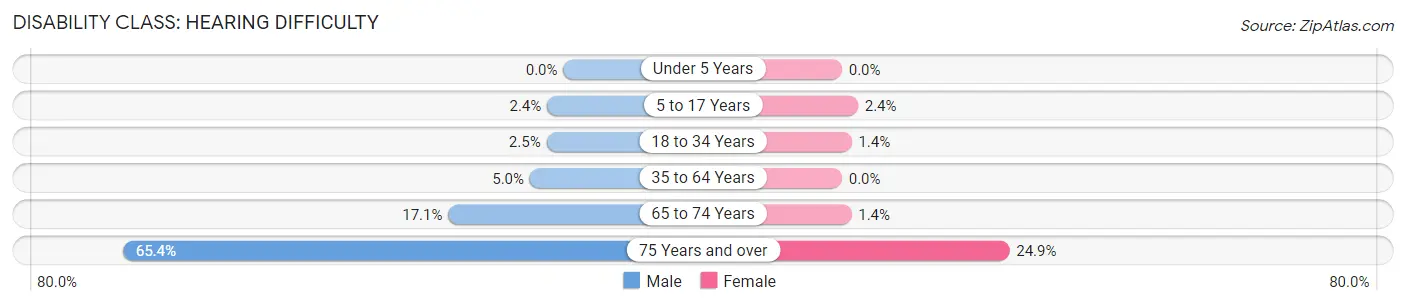
| Age Bracket | Male | Female |
| Under 5 Years | 0 (0.0%) | 0 (0.0%) |
| 5 to 17 Years | 8 (2.4%) | 16 (2.4%) |
| 18 to 34 Years | 12 (2.5%) | 8 (1.4%) |
| 35 to 64 Years | 31 (5.0%) | 0 (0.0%) |
| 65 to 74 Years | 60 (17.1%) | 5 (1.4%) |
| 75 Years and over | 140 (65.4%) | 48 (24.9%) |
Disability Class: Vision Difficulty
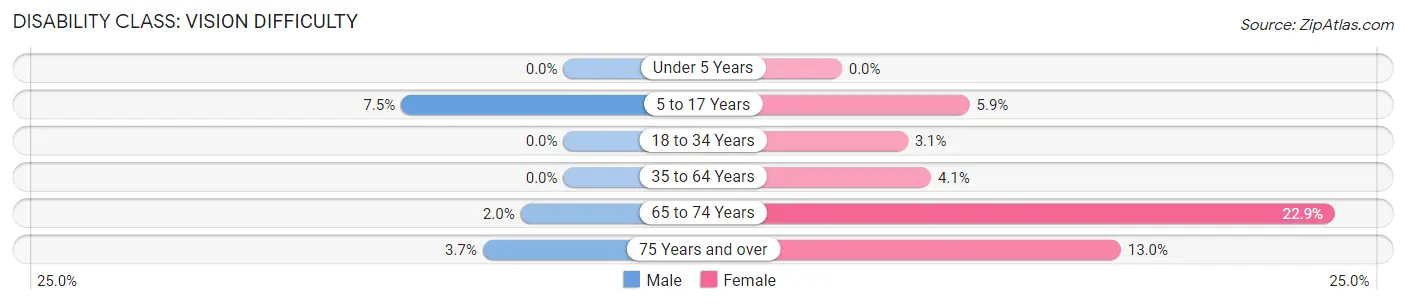
| Age Bracket | Male | Female |
| Under 5 Years | 0 (0.0%) | 0 (0.0%) |
| 5 to 17 Years | 25 (7.5%) | 40 (5.9%) |
| 18 to 34 Years | 0 (0.0%) | 17 (3.1%) |
| 35 to 64 Years | 0 (0.0%) | 35 (4.1%) |
| 65 to 74 Years | 7 (2.0%) | 81 (22.9%) |
| 75 Years and over | 8 (3.7%) | 25 (13.0%) |
Disability Class: Cognitive Difficulty
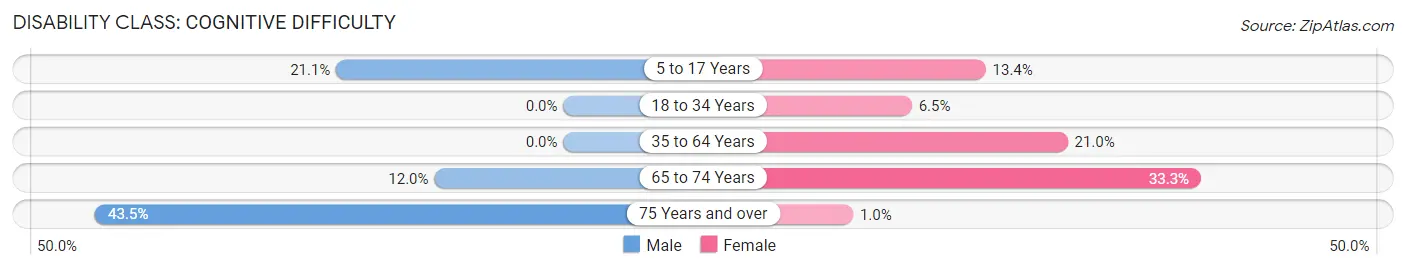
| Age Bracket | Male | Female |
| 5 to 17 Years | 70 (21.1%) | 90 (13.4%) |
| 18 to 34 Years | 0 (0.0%) | 36 (6.5%) |
| 35 to 64 Years | 0 (0.0%) | 177 (20.9%) |
| 65 to 74 Years | 42 (12.0%) | 118 (33.3%) |
| 75 Years and over | 93 (43.5%) | 2 (1.0%) |
Disability Class: Ambulatory Difficulty
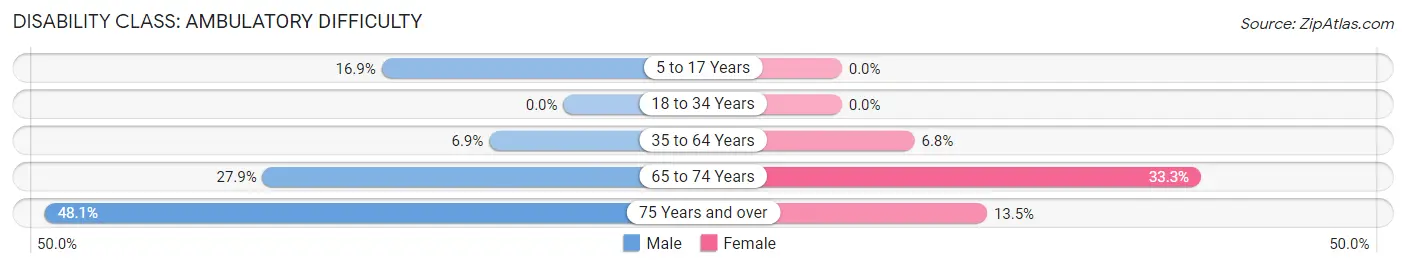
| Age Bracket | Male | Female |
| 5 to 17 Years | 56 (16.9%) | 0 (0.0%) |
| 18 to 34 Years | 0 (0.0%) | 0 (0.0%) |
| 35 to 64 Years | 43 (6.9%) | 57 (6.8%) |
| 65 to 74 Years | 98 (27.9%) | 118 (33.3%) |
| 75 Years and over | 103 (48.1%) | 26 (13.5%) |
Disability Class: Self-Care Difficulty
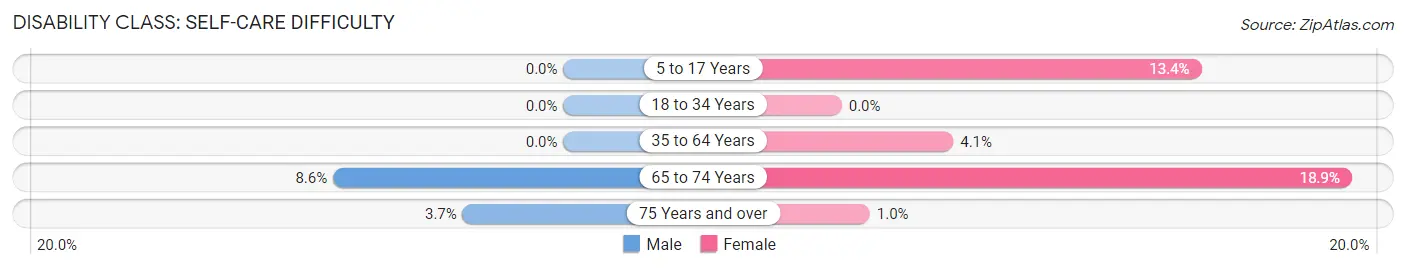
| Age Bracket | Male | Female |
| 5 to 17 Years | 0 (0.0%) | 90 (13.4%) |
| 18 to 34 Years | 0 (0.0%) | 0 (0.0%) |
| 35 to 64 Years | 0 (0.0%) | 35 (4.1%) |
| 65 to 74 Years | 30 (8.6%) | 67 (18.9%) |
| 75 Years and over | 8 (3.7%) | 2 (1.0%) |
Technology Access in Sonora
Computing Device Access in Sonora
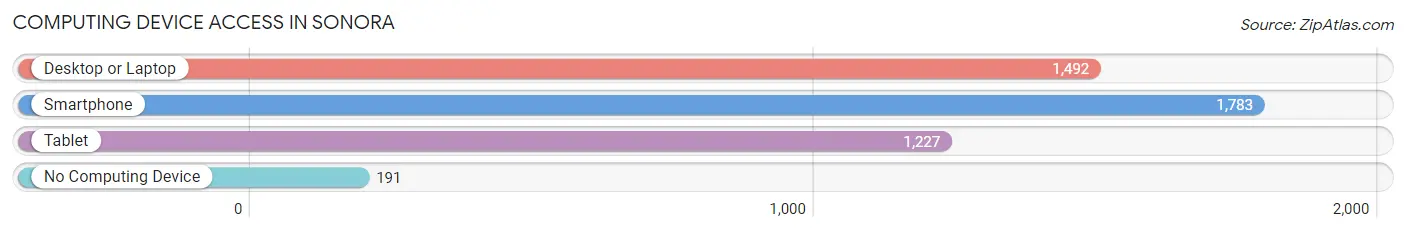
| Device Type | # Households | % Households |
| Desktop or Laptop | 1,492 | 68.5% |
| Smartphone | 1,783 | 81.9% |
| Tablet | 1,227 | 56.3% |
| No Computing Device | 191 | 8.8% |
| Total | 2,178 | 100.0% |
Internet Access in Sonora
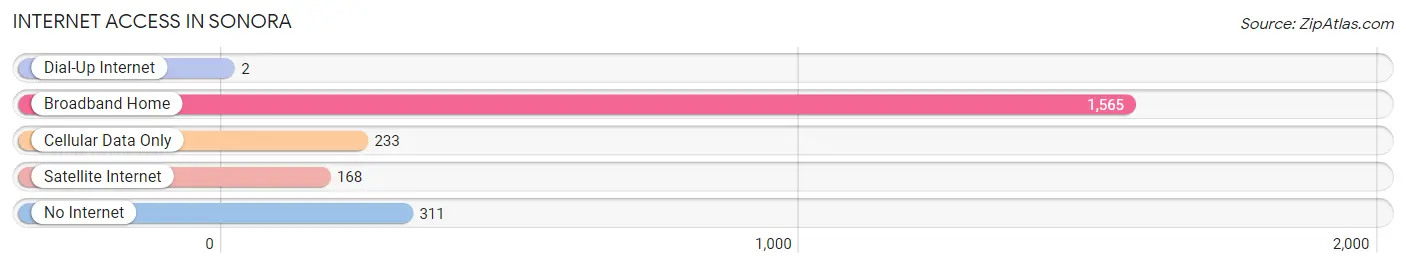
| Internet Type | # Households | % Households |
| Dial-Up Internet | 2 | 0.1% |
| Broadband Home | 1,565 | 71.9% |
| Cellular Data Only | 233 | 10.7% |
| Satellite Internet | 168 | 7.7% |
| No Internet | 311 | 14.3% |
| Total | 2,178 | 100.0% |
Sonora Summary
Sonora, California is a small city located in the Sierra Nevada foothills of Tuolumne County, California. It is the county seat and the largest city in the county. The city is situated at an elevation of 1,924 feet (586 m) and is located along State Route 49, which is the main thoroughfare through the city. As of the 2010 census, the population of Sonora was 4,903.
History
The area that is now Sonora was first inhabited by the Miwok and Mono Native American tribes. The first European settlers arrived in the area in the early 1850s, and the city was officially founded in 1851. The city was named after the nearby Sonora Mine, which was named after the Sonora River in Mexico.
The city quickly grew and became an important center for commerce and transportation in the region. In 1854, the first post office was established in Sonora, and in 1856, the first newspaper was published. The city was incorporated in 1866 and was designated as the county seat of Tuolumne County.
In the late 19th century, Sonora was a major center for gold mining and timber production. The city was also home to several large lumber mills and other industries. The city continued to grow and prosper throughout the 20th century, and today it is a popular tourist destination.
Geography
Sonora is located in the Sierra Nevada foothills of Tuolumne County, California. The city is situated at an elevation of 1,924 feet (586 m) and is located along State Route 49, which is the main thoroughfare through the city.
The city is surrounded by the Stanislaus National Forest and is located near the confluence of the Tuolumne and Stanislaus Rivers. The city is also located near several popular recreational areas, including Pinecrest Lake, Don Pedro Lake, and New Melones Lake.
Economy
The economy of Sonora is largely based on tourism, retail, and services. The city is home to several popular tourist attractions, including the Sonora Opera Hall, the Tuolumne County Museum, and the Sierra Repertory Theatre. The city is also home to several retail stores, restaurants, and other businesses.
The city is also home to several manufacturing and industrial businesses, including a large lumber mill and a metal fabrication plant. The city is also home to several government offices, including the Tuolumne County Courthouse and the Tuolumne County Sheriff's Office.
Demographics
As of the 2010 census, the population of Sonora was 4,903. The racial makeup of the city was 87.3% White, 0.7% African American, 1.2% Native American, 0.7% Asian, 0.1% Pacific Islander, 8.2% from other races, and 2.0% from two or more races. Hispanic or Latino of any race were 18.2% of the population.
The median income for a household in the city was $37,917, and the median income for a family was $45,938. The per capita income for the city was $20,945. About 14.2% of families and 17.7% of the population were below the poverty line, including 25.2% of those under age 18 and 8.2% of those age 65 or over.
Common Questions
What is Per Capita Income in Sonora?
Per Capita income in Sonora is $36,000.
What is the Median Family Income in Sonora?
Median Family Income in Sonora is $101,595.
What is the Median Household income in Sonora?
Median Household Income in Sonora is $60,492.
What is Income or Wage Gap in Sonora?
Income or Wage Gap in Sonora is 9.3%.
Women in Sonora earn 90.7 cents for every dollar earned by a man.
What is Family Income Deficit in Sonora?
Family Income Deficit in Sonora is $10,801.
Families that are below poverty line in Sonora earn $10,801 less on average than the poverty threshold level.
What is Inequality or Gini Index in Sonora?
Inequality or Gini Index in Sonora is 0.46.
What is the Total Population of Sonora?
Total Population of Sonora is 4,963.
What is the Total Male Population of Sonora?
Total Male Population of Sonora is 2,201.
What is the Total Female Population of Sonora?
Total Female Population of Sonora is 2,762.
What is the Ratio of Males per 100 Females in Sonora?
There are 79.69 Males per 100 Females in Sonora.
What is the Ratio of Females per 100 Males in Sonora?
There are 125.49 Females per 100 Males in Sonora.
What is the Median Population Age in Sonora?
Median Population Age in Sonora is 41.5 Years.
What is the Average Family Size in Sonora
Average Family Size in Sonora is 3.0 People.
What is the Average Household Size in Sonora
Average Household Size in Sonora is 2.2 People.
How Large is the Labor Force in Sonora?
There are 2,197 People in the Labor Forcein in Sonora.
What is the Percentage of People in the Labor Force in Sonora?
54.3% of People are in the Labor Force in Sonora.
What is the Unemployment Rate in Sonora?
Unemployment Rate in Sonora is 9.4%.