Soledad, CA Map & Demographics
Soledad Map
Soledad Overview
$18,573
PER CAPITA INCOME
$86,956
AVG FAMILY INCOME
$85,040
AVG HOUSEHOLD INCOME
8.9%
WAGE / INCOME GAP [ % ]
91.1¢/ $1
WAGE / INCOME GAP [ $ ]
0.39
INEQUALITY / GINI INDEX
24,781
TOTAL POPULATION
16,112
MALE POPULATION
8,669
FEMALE POPULATION
185.86
MALES / 100 FEMALES
53.80
FEMALES / 100 MALES
35.6
MEDIAN AGE
4.4
AVG FAMILY SIZE
4.2
AVG HOUSEHOLD SIZE
7,634
LABOR FORCE [ PEOPLE ]
39.1%
PERCENT IN LABOR FORCE
2.9%
UNEMPLOYMENT RATE
Soledad Zip Codes
Soledad Area Codes
Income in Soledad
Income Overview in Soledad
Per Capita Income in Soledad is $18,573, while median incomes of families and households are $86,956 and $85,040 respectively.
| Characteristic | Number | Measure |
| Per Capita Income | 24,781 | $18,573 |
| Median Family Income | 3,755 | $86,956 |
| Mean Family Income | 3,755 | $94,494 |
| Median Household Income | 4,314 | $85,040 |
| Mean Household Income | 4,314 | $91,104 |
| Income Deficit | 3,755 | $0 |
| Wage / Income Gap (%) | 24,781 | 8.87% |
| Wage / Income Gap ($) | 24,781 | 91.13¢ per $1 |
| Gini / Inequality Index | 24,781 | 0.39 |
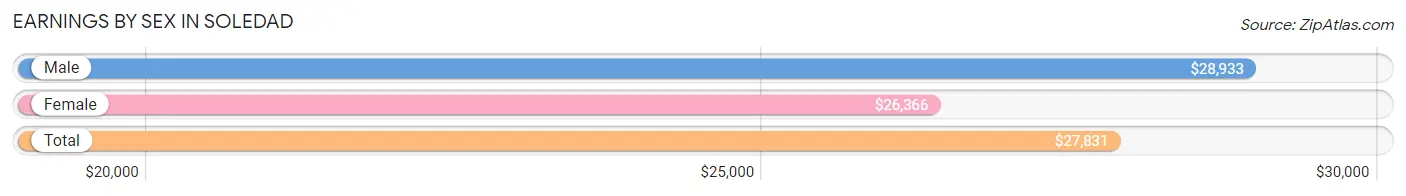
Earnings by Sex in Soledad
Average Earnings in Soledad are $27,831, $28,933 for men and $26,366 for women, a difference of 8.9%.
| Sex | Number | Average Earnings |
| Male | 7,611 (69.0%) | $28,933 |
| Female | 3,419 (31.0%) | $26,366 |
| Total | 11,030 (100.0%) | $27,831 |
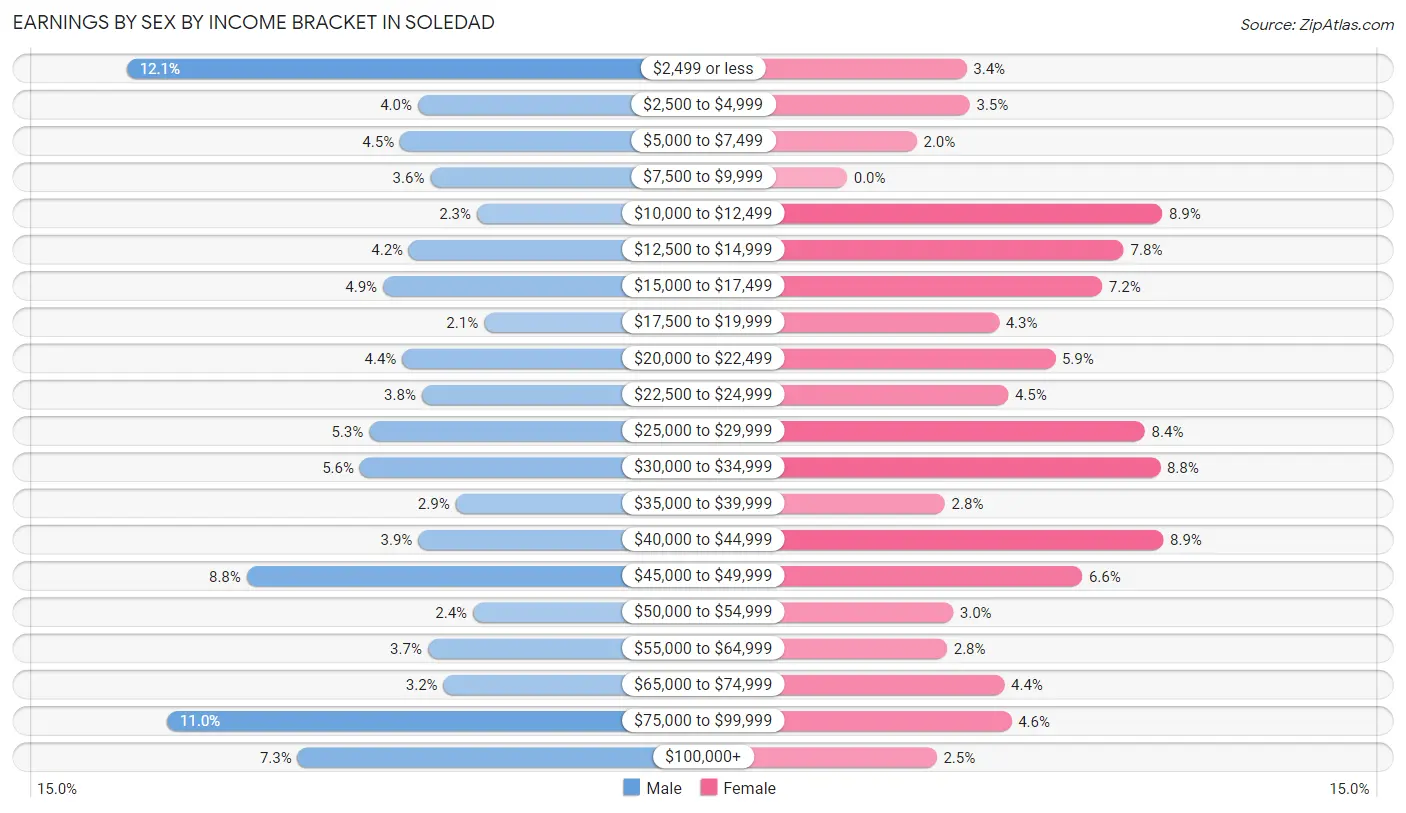
Earnings by Sex by Income Bracket in Soledad
The most common earnings brackets in Soledad are $2,499 or less for men (923 | 12.1%) and $40,000 to $44,999 for women (304 | 8.9%).
| Income | Male | Female |
| $2,499 or less | 923 (12.1%) | 115 (3.4%) |
| $2,500 to $4,999 | 301 (4.0%) | 118 (3.5%) |
| $5,000 to $7,499 | 339 (4.4%) | 67 (2.0%) |
| $7,500 to $9,999 | 274 (3.6%) | 0 (0.0%) |
| $10,000 to $12,499 | 174 (2.3%) | 303 (8.9%) |
| $12,500 to $14,999 | 320 (4.2%) | 266 (7.8%) |
| $15,000 to $17,499 | 375 (4.9%) | 245 (7.2%) |
| $17,500 to $19,999 | 159 (2.1%) | 146 (4.3%) |
| $20,000 to $22,499 | 334 (4.4%) | 200 (5.9%) |
| $22,500 to $24,999 | 292 (3.8%) | 155 (4.5%) |
| $25,000 to $29,999 | 405 (5.3%) | 286 (8.4%) |
| $30,000 to $34,999 | 425 (5.6%) | 301 (8.8%) |
| $35,000 to $39,999 | 220 (2.9%) | 94 (2.8%) |
| $40,000 to $44,999 | 300 (3.9%) | 304 (8.9%) |
| $45,000 to $49,999 | 667 (8.8%) | 226 (6.6%) |
| $50,000 to $54,999 | 183 (2.4%) | 102 (3.0%) |
| $55,000 to $64,999 | 279 (3.7%) | 96 (2.8%) |
| $65,000 to $74,999 | 246 (3.2%) | 151 (4.4%) |
| $75,000 to $99,999 | 837 (11.0%) | 158 (4.6%) |
| $100,000+ | 558 (7.3%) | 86 (2.5%) |
| Total | 7,611 (100.0%) | 3,419 (100.0%) |
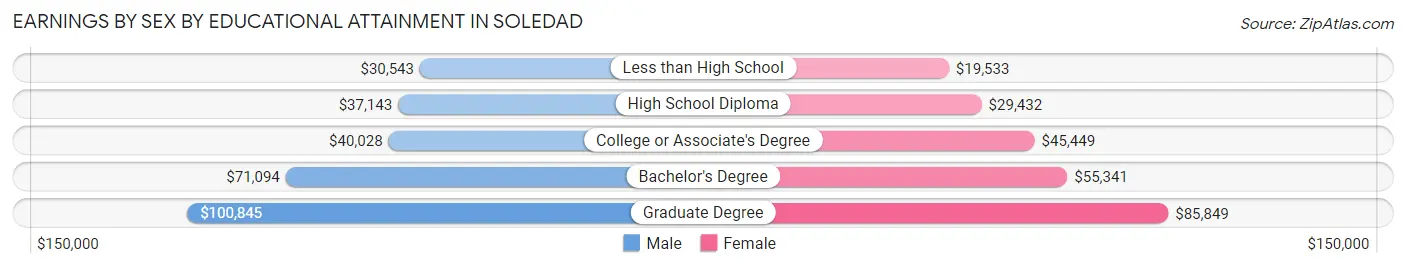
Earnings by Sex by Educational Attainment in Soledad
Average earnings in Soledad are $32,412 for men and $29,401 for women, a difference of 9.3%. Men with an educational attainment of graduate degree enjoy the highest average annual earnings of $100,845, while those with less than high school education earn the least with $30,543. Women with an educational attainment of graduate degree earn the most with the average annual earnings of $85,849, while those with less than high school education have the smallest earnings of $19,533.
| Educational Attainment | Male Income | Female Income |
| Less than High School | $30,543 | $19,533 |
| High School Diploma | $37,143 | $29,432 |
| College or Associate's Degree | $40,028 | $45,449 |
| Bachelor's Degree | $71,094 | $55,341 |
| Graduate Degree | $100,845 | $85,849 |
| Total | $32,412 | $29,401 |
Family Income in Soledad
Family Income Brackets in Soledad
According to the Soledad family income data, there are 683 families falling into the $100,000 to $149,999 income range, which is the most common income bracket and makes up 18.2% of all families. Conversely, the less than $10,000 income bracket is the least frequent group with only 94 families (2.5%) belonging to this category.
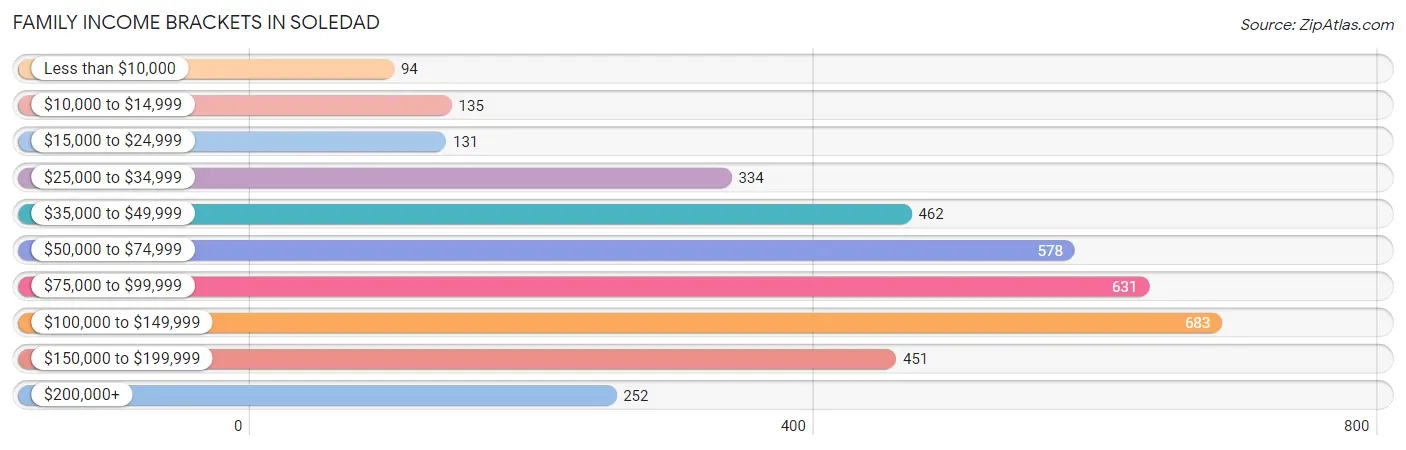
| Income Bracket | # Families | % Families |
| Less than $10,000 | 94 | 2.5% |
| $10,000 to $14,999 | 135 | 3.6% |
| $15,000 to $24,999 | 131 | 3.5% |
| $25,000 to $34,999 | 334 | 8.9% |
| $35,000 to $49,999 | 462 | 12.3% |
| $50,000 to $74,999 | 578 | 15.4% |
| $75,000 to $99,999 | 631 | 16.8% |
| $100,000 to $149,999 | 683 | 18.2% |
| $150,000 to $199,999 | 451 | 12.0% |
| $200,000+ | 252 | 6.7% |
Family Income by Famaliy Size in Soledad
7+ person families (360 | 9.6%) account for the highest median family income in Soledad with $119,314 per family, while 2-person families (485 | 12.9%) have the highest median income of $43,772 per family member.
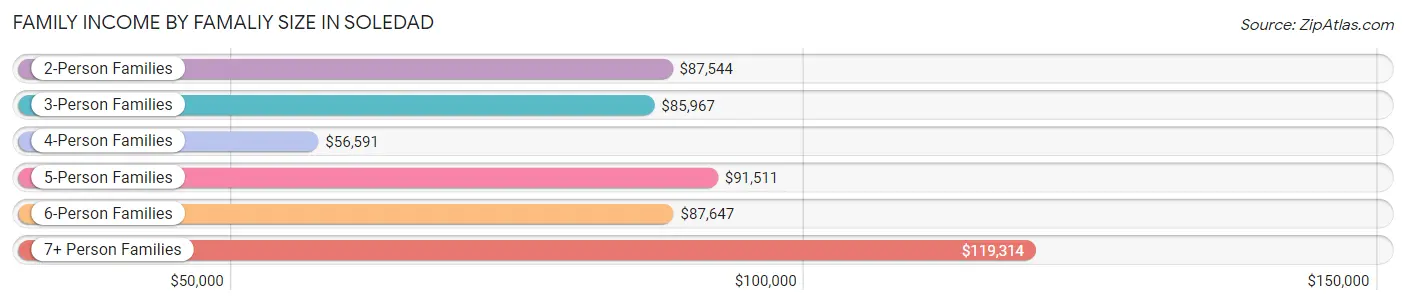
| Income Bracket | # Families | Median Income |
| 2-Person Families | 485 (12.9%) | $87,544 |
| 3-Person Families | 811 (21.6%) | $85,967 |
| 4-Person Families | 818 (21.8%) | $56,591 |
| 5-Person Families | 887 (23.6%) | $91,511 |
| 6-Person Families | 394 (10.5%) | $87,647 |
| 7+ Person Families | 360 (9.6%) | $119,314 |
| Total | 3,755 (100.0%) | $86,956 |
Family Income by Number of Earners in Soledad
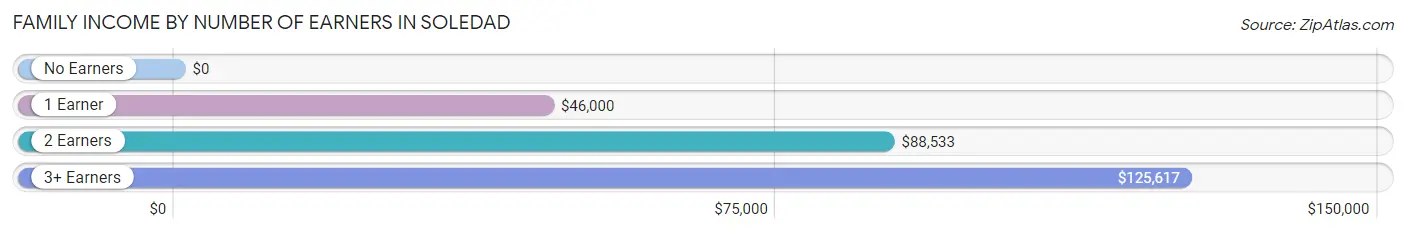
| Number of Earners | # Families | Median Income |
| No Earners | 337 (9.0%) | $0 |
| 1 Earner | 1,238 (33.0%) | $46,000 |
| 2 Earners | 1,030 (27.4%) | $88,533 |
| 3+ Earners | 1,150 (30.6%) | $125,617 |
| Total | 3,755 (100.0%) | $86,956 |
Household Income in Soledad
Household Income Brackets in Soledad
With 798 households falling in the category, the $100,000 to $149,999 income range is the most frequent in Soledad, accounting for 18.5% of all households. In contrast, only 78 households (1.8%) fall into the less than $10,000 income bracket, making it the least populous group.
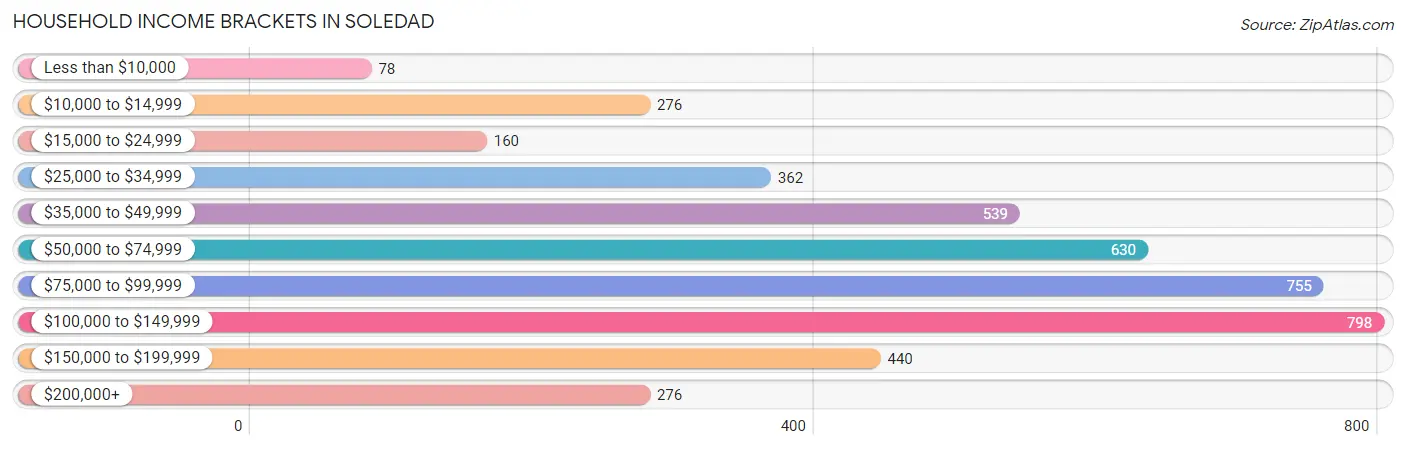
| Income Bracket | # Households | % Households |
| Less than $10,000 | 78 | 1.8% |
| $10,000 to $14,999 | 276 | 6.4% |
| $15,000 to $24,999 | 160 | 3.7% |
| $25,000 to $34,999 | 362 | 8.4% |
| $35,000 to $49,999 | 539 | 12.5% |
| $50,000 to $74,999 | 630 | 14.6% |
| $75,000 to $99,999 | 755 | 17.5% |
| $100,000 to $149,999 | 798 | 18.5% |
| $150,000 to $199,999 | 440 | 10.2% |
| $200,000+ | 276 | 6.4% |
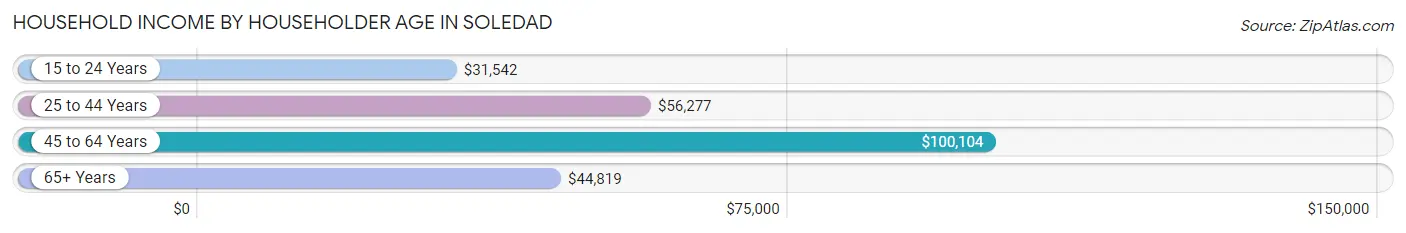
Household Income by Householder Age in Soledad
The median household income in Soledad is $85,040, with the highest median household income of $100,104 found in the 45 to 64 years age bracket for the primary householder. A total of 2,039 households (47.3%) fall into this category. Meanwhile, the 15 to 24 years age bracket for the primary householder has the lowest median household income of $31,542, with 169 households (3.9%) in this group.
| Income Bracket | # Households | Median Income |
| 15 to 24 Years | 169 (3.9%) | $31,542 |
| 25 to 44 Years | 1,406 (32.6%) | $56,277 |
| 45 to 64 Years | 2,039 (47.3%) | $100,104 |
| 65+ Years | 700 (16.2%) | $44,819 |
| Total | 4,314 (100.0%) | $85,040 |
Poverty in Soledad
Income Below Poverty by Sex and Age in Soledad
With 18.1% poverty level for males and 16.3% for females among the residents of Soledad, 6 to 11 year old males and 15 year old females are the most vulnerable to poverty, with 481 males (41.1%) and 117 females (38.6%) in their respective age groups living below the poverty level.
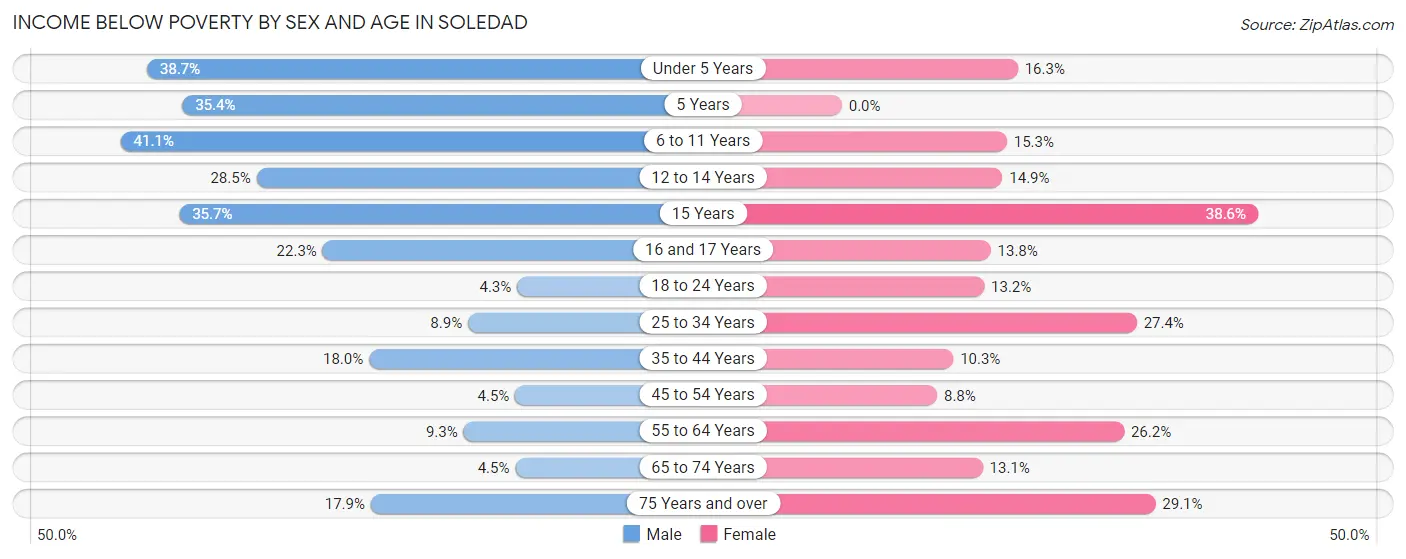
| Age Bracket | Male | Female |
| Under 5 Years | 240 (38.7%) | 65 (16.3%) |
| 5 Years | 52 (35.4%) | 0 (0.0%) |
| 6 to 11 Years | 481 (41.1%) | 134 (15.3%) |
| 12 to 14 Years | 223 (28.5%) | 104 (14.9%) |
| 15 Years | 41 (35.6%) | 117 (38.6%) |
| 16 and 17 Years | 88 (22.3%) | 29 (13.8%) |
| 18 to 24 Years | 41 (4.3%) | 181 (13.2%) |
| 25 to 34 Years | 83 (8.8%) | 214 (27.4%) |
| 35 to 44 Years | 222 (18.0%) | 137 (10.3%) |
| 45 to 54 Years | 61 (4.5%) | 98 (8.8%) |
| 55 to 64 Years | 84 (9.3%) | 181 (26.2%) |
| 65 to 74 Years | 16 (4.5%) | 69 (13.1%) |
| 75 Years and over | 52 (17.9%) | 78 (29.1%) |
| Total | 1,684 (18.1%) | 1,407 (16.3%) |
Income Above Poverty by Sex and Age in Soledad
According to the poverty statistics in Soledad, males aged 18 to 24 years and females aged 5 years are the age groups that are most secure financially, with 95.7% of males and 100.0% of females in these age groups living above the poverty line.
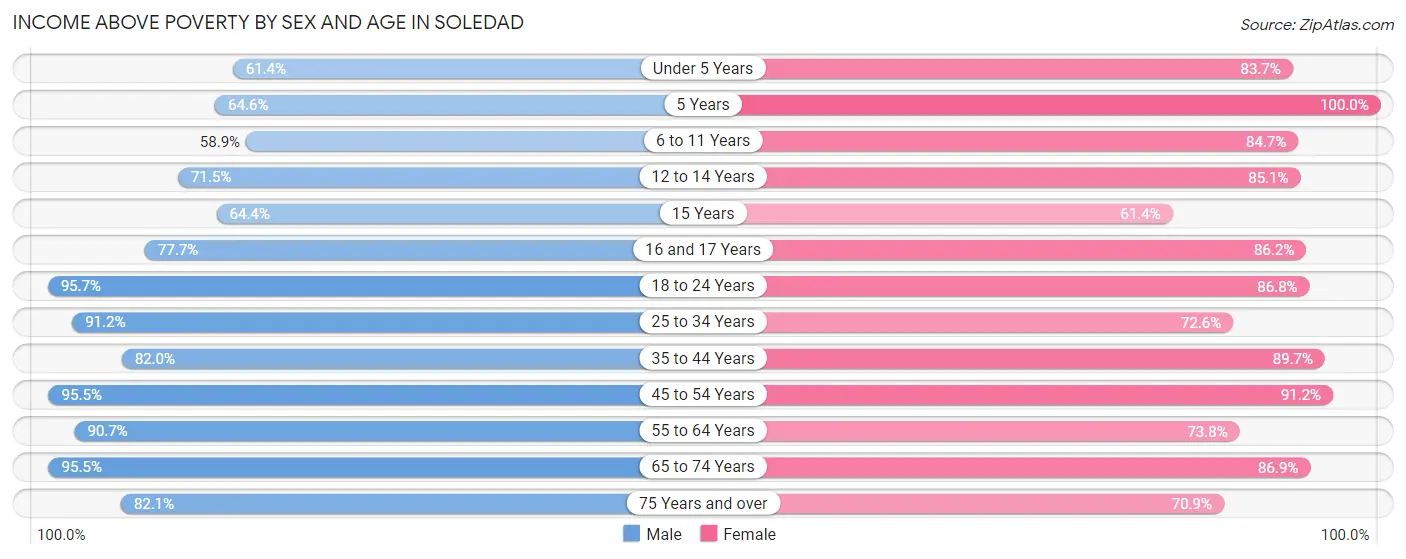
| Age Bracket | Male | Female |
| Under 5 Years | 381 (61.4%) | 333 (83.7%) |
| 5 Years | 95 (64.6%) | 90 (100.0%) |
| 6 to 11 Years | 690 (58.9%) | 741 (84.7%) |
| 12 to 14 Years | 560 (71.5%) | 594 (85.1%) |
| 15 Years | 74 (64.3%) | 186 (61.4%) |
| 16 and 17 Years | 306 (77.7%) | 181 (86.2%) |
| 18 to 24 Years | 915 (95.7%) | 1,189 (86.8%) |
| 25 to 34 Years | 855 (91.1%) | 568 (72.6%) |
| 35 to 44 Years | 1,009 (82.0%) | 1,188 (89.7%) |
| 45 to 54 Years | 1,303 (95.5%) | 1,011 (91.2%) |
| 55 to 64 Years | 823 (90.7%) | 510 (73.8%) |
| 65 to 74 Years | 343 (95.5%) | 459 (86.9%) |
| 75 Years and over | 239 (82.1%) | 190 (70.9%) |
| Total | 7,593 (81.9%) | 7,240 (83.7%) |
Income Below Poverty Among Married-Couple Families in Soledad
The poverty statistics for married-couple families in Soledad show that 11.0% or 305 of the total 2,779 families live below the poverty line. Families with 3 or 4 children have the highest poverty rate of 27.6%, comprising of 168 families. On the other hand, families with 1 or 2 children have the lowest poverty rate of 2.8%, which includes 35 families.
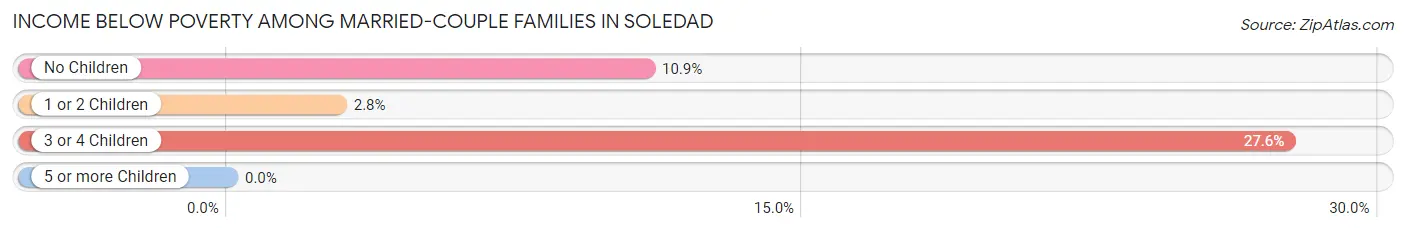
| Children | Above Poverty | Below Poverty |
| No Children | 835 (89.1%) | 102 (10.9%) |
| 1 or 2 Children | 1,199 (97.2%) | 35 (2.8%) |
| 3 or 4 Children | 440 (72.4%) | 168 (27.6%) |
| 5 or more Children | 0 (0.0%) | 0 (0.0%) |
| Total | 2,474 (89.0%) | 305 (11.0%) |
Income Below Poverty Among Single-Parent Households in Soledad
According to the poverty data in Soledad, 17.6% or 54 single-father households and 28.7% or 192 single-mother households are living below the poverty line. Among single-father households, those with 1 or 2 children have the highest poverty rate, with 21 households (42.0%) experiencing poverty. Likewise, among single-mother households, those with 5 or more children have the highest poverty rate, with 38 households (100.0%) falling below the poverty line.
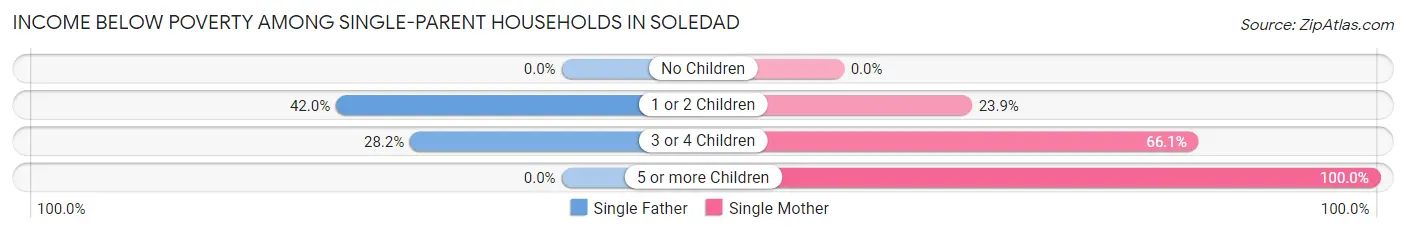
| Children | Single Father | Single Mother |
| No Children | 0 (0.0%) | 0 (0.0%) |
| 1 or 2 Children | 21 (42.0%) | 78 (23.8%) |
| 3 or 4 Children | 33 (28.2%) | 76 (66.1%) |
| 5 or more Children | 0 (0.0%) | 38 (100.0%) |
| Total | 54 (17.6%) | 192 (28.7%) |
Income Below Poverty Among Married-Couple vs Single-Parent Households in Soledad
The poverty data for Soledad shows that 305 of the married-couple family households (11.0%) and 246 of the single-parent households (25.2%) are living below the poverty level. Within the married-couple family households, those with 3 or 4 children have the highest poverty rate, with 168 households (27.6%) falling below the poverty line. Among the single-parent households, those with 5 or more children have the highest poverty rate, with 38 household (100.0%) living below poverty.
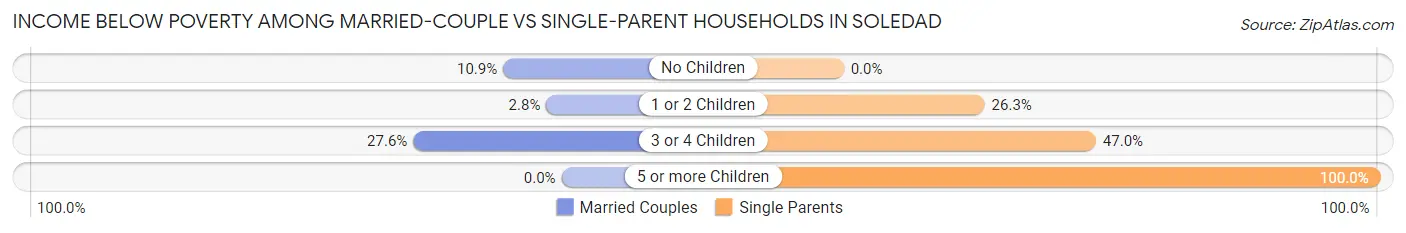
| Children | Married-Couple Families | Single-Parent Households |
| No Children | 102 (10.9%) | 0 (0.0%) |
| 1 or 2 Children | 35 (2.8%) | 99 (26.3%) |
| 3 or 4 Children | 168 (27.6%) | 109 (47.0%) |
| 5 or more Children | 0 (0.0%) | 38 (100.0%) |
| Total | 305 (11.0%) | 246 (25.2%) |
Race in Soledad
The most populous races in Soledad are Hispanic or Latino (19,573 | 79.0%), Some other Race (14,845 | 59.9%), and White / Caucasian (5,257 | 21.2%).
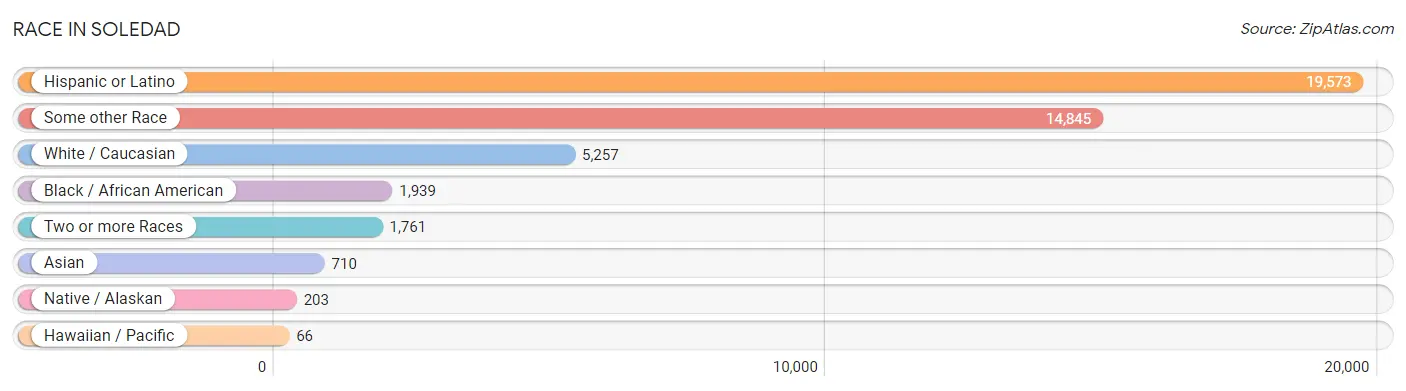
| Race | # Population | % Population |
| Asian | 710 | 2.9% |
| Black / African American | 1,939 | 7.8% |
| Hawaiian / Pacific | 66 | 0.3% |
| Hispanic or Latino | 19,573 | 79.0% |
| Native / Alaskan | 203 | 0.8% |
| White / Caucasian | 5,257 | 21.2% |
| Two or more Races | 1,761 | 7.1% |
| Some other Race | 14,845 | 59.9% |
| Total | 24,781 | 100.0% |
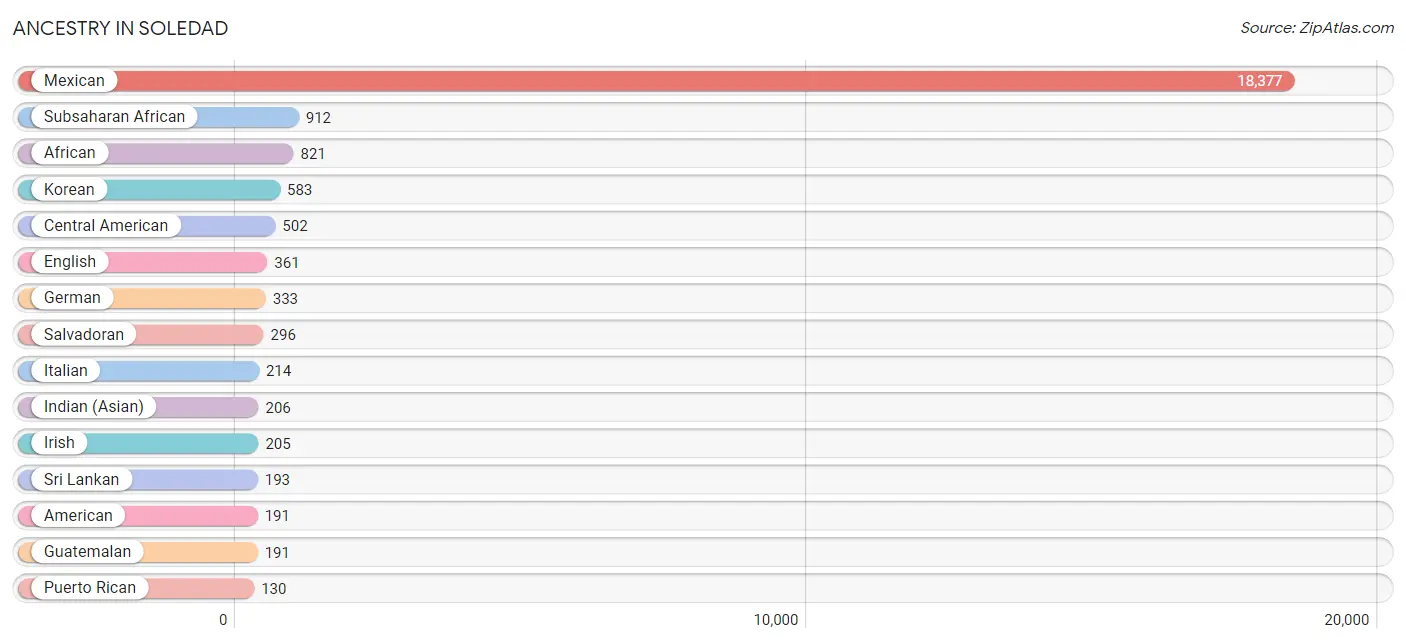
Ancestry in Soledad
The most populous ancestries reported in Soledad are Mexican (18,377 | 74.2%), Subsaharan African (912 | 3.7%), African (821 | 3.3%), Korean (583 | 2.4%), and Central American (502 | 2.0%), together accounting for 85.5% of all Soledad residents.
| Ancestry | # Population | % Population |
| African | 821 | 3.3% |
| Alaska Native | 18 | 0.1% |
| American | 191 | 0.8% |
| Arab | 45 | 0.2% |
| Argentinean | 22 | 0.1% |
| Armenian | 8 | 0.0% |
| Austrian | 12 | 0.1% |
| Belizean | 11 | 0.0% |
| Bhutanese | 9 | 0.0% |
| Blackfeet | 9 | 0.0% |
| British | 7 | 0.0% |
| Burmese | 74 | 0.3% |
| Cape Verdean | 28 | 0.1% |
| Central American | 502 | 2.0% |
| Cherokee | 73 | 0.3% |
| Cuban | 36 | 0.2% |
| Czech | 5 | 0.0% |
| Czechoslovakian | 8 | 0.0% |
| Danish | 12 | 0.1% |
| Dutch | 18 | 0.1% |
| Eastern European | 41 | 0.2% |
| Egyptian | 8 | 0.0% |
| English | 361 | 1.5% |
| European | 82 | 0.3% |
| French | 126 | 0.5% |
| German | 333 | 1.3% |
| Greek | 18 | 0.1% |
| Guamanian / Chamorro | 27 | 0.1% |
| Guatemalan | 191 | 0.8% |
| Haitian | 3 | 0.0% |
| Honduran | 8 | 0.0% |
| Hungarian | 15 | 0.1% |
| Indian (Asian) | 206 | 0.8% |
| Inupiat | 7 | 0.0% |
| Irish | 205 | 0.8% |
| Italian | 214 | 0.9% |
| Jamaican | 16 | 0.1% |
| Japanese | 43 | 0.2% |
| Jordanian | 6 | 0.0% |
| Korean | 583 | 2.4% |
| Laotian | 6 | 0.0% |
| Mexican | 18,377 | 74.2% |
| Mexican American Indian | 5 | 0.0% |
| Native Hawaiian | 78 | 0.3% |
| Navajo | 8 | 0.0% |
| Nigerian | 36 | 0.2% |
| Northern European | 6 | 0.0% |
| Norwegian | 30 | 0.1% |
| Palestinian | 26 | 0.1% |
| Peruvian | 10 | 0.0% |
| Polish | 62 | 0.3% |
| Portuguese | 59 | 0.2% |
| Puerto Rican | 130 | 0.5% |
| Russian | 23 | 0.1% |
| Salvadoran | 296 | 1.2% |
| Samoan | 6 | 0.0% |
| Scandinavian | 2 | 0.0% |
| Scotch-Irish | 27 | 0.1% |
| Scottish | 72 | 0.3% |
| Somali | 9 | 0.0% |
| South American | 72 | 0.3% |
| Spaniard | 53 | 0.2% |
| Spanish | 43 | 0.2% |
| Sri Lankan | 193 | 0.8% |
| Subsaharan African | 912 | 3.7% |
| Sudanese | 12 | 0.1% |
| Swedish | 29 | 0.1% |
| Swiss | 31 | 0.1% |
| Thai | 31 | 0.1% |
| Tongan | 6 | 0.0% |
| Ukrainian | 83 | 0.3% |
| Venezuelan | 40 | 0.2% |
| Yaqui | 78 | 0.3% | View All 73 Rows |
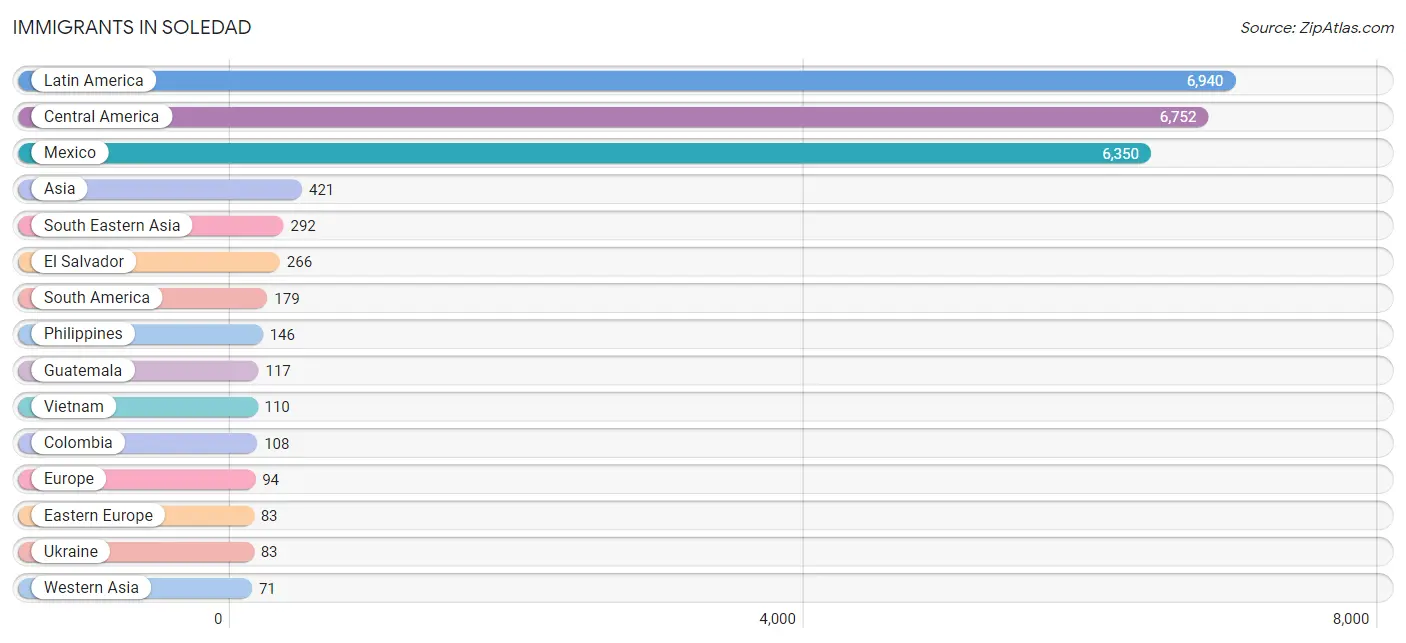
Immigrants in Soledad
The most numerous immigrant groups reported in Soledad came from Latin America (6,940 | 28.0%), Central America (6,752 | 27.3%), Mexico (6,350 | 25.6%), Asia (421 | 1.7%), and South Eastern Asia (292 | 1.2%), together accounting for 83.8% of all Soledad residents.
| Immigration Origin | # Population | % Population |
| Africa | 37 | 0.2% |
| Argentina | 10 | 0.0% |
| Armenia | 8 | 0.0% |
| Asia | 421 | 1.7% |
| Belize | 11 | 0.0% |
| Cambodia | 30 | 0.1% |
| Caribbean | 9 | 0.0% |
| Central America | 6,752 | 27.3% |
| China | 38 | 0.2% |
| Colombia | 108 | 0.4% |
| Cuba | 9 | 0.0% |
| Eastern Africa | 9 | 0.0% |
| Eastern Asia | 38 | 0.2% |
| Eastern Europe | 83 | 0.3% |
| Egypt | 16 | 0.1% |
| El Salvador | 266 | 1.1% |
| England | 11 | 0.0% |
| Ethiopia | 9 | 0.0% |
| Europe | 94 | 0.4% |
| Fiji | 9 | 0.0% |
| Guatemala | 117 | 0.5% |
| Honduras | 8 | 0.0% |
| India | 20 | 0.1% |
| Indonesia | 6 | 0.0% |
| Jordan | 28 | 0.1% |
| Kuwait | 35 | 0.1% |
| Latin America | 6,940 | 28.0% |
| Mexico | 6,350 | 25.6% |
| Northern Africa | 28 | 0.1% |
| Northern Europe | 11 | 0.0% |
| Oceania | 39 | 0.2% |
| Peru | 10 | 0.0% |
| Philippines | 146 | 0.6% |
| South America | 179 | 0.7% |
| South Central Asia | 20 | 0.1% |
| South Eastern Asia | 292 | 1.2% |
| Sudan | 12 | 0.1% |
| Ukraine | 83 | 0.3% |
| Venezuela | 40 | 0.2% |
| Vietnam | 110 | 0.4% |
| Western Asia | 71 | 0.3% | View All 41 Rows |
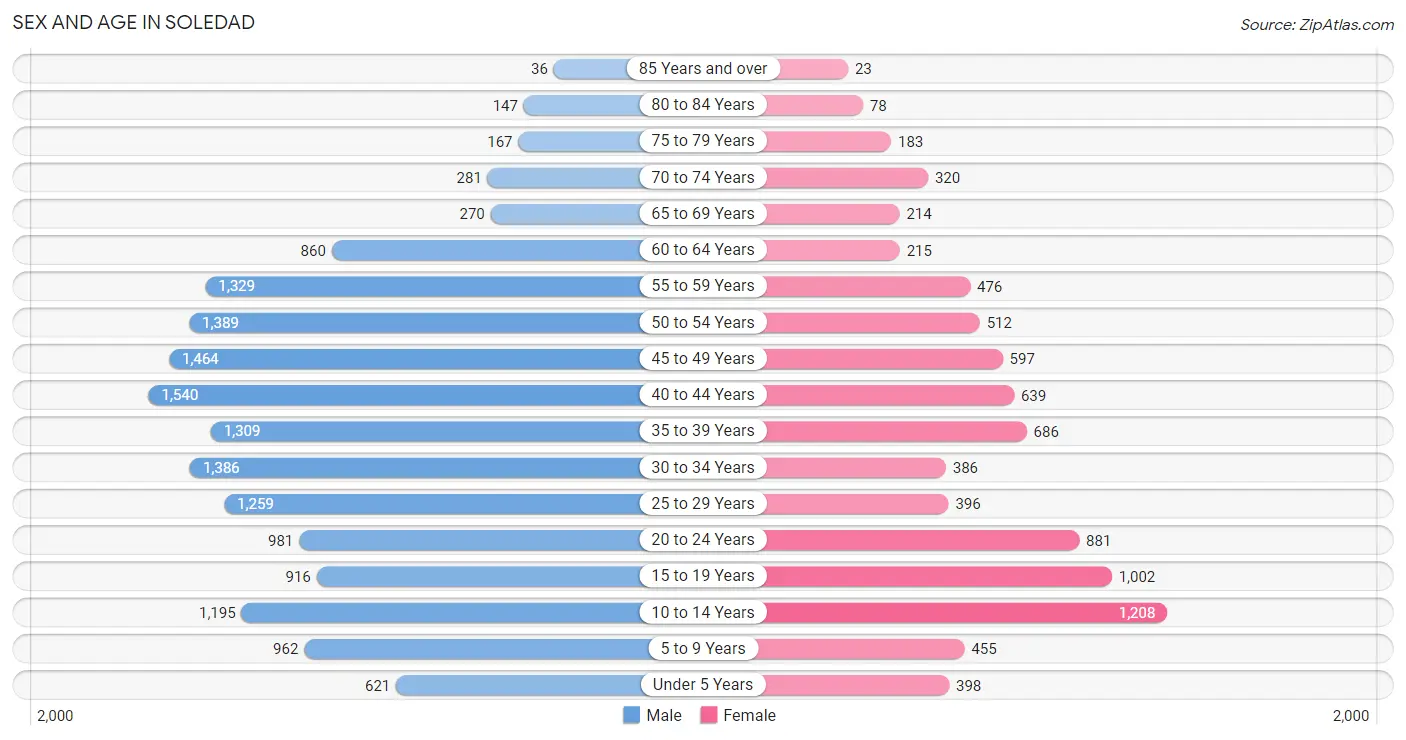
Sex and Age in Soledad
Sex and Age in Soledad
The most populous age groups in Soledad are 40 to 44 Years (1,540 | 9.6%) for men and 10 to 14 Years (1,208 | 13.9%) for women.
| Age Bracket | Male | Female |
| Under 5 Years | 621 (3.8%) | 398 (4.6%) |
| 5 to 9 Years | 962 (6.0%) | 455 (5.2%) |
| 10 to 14 Years | 1,195 (7.4%) | 1,208 (13.9%) |
| 15 to 19 Years | 916 (5.7%) | 1,002 (11.6%) |
| 20 to 24 Years | 981 (6.1%) | 881 (10.2%) |
| 25 to 29 Years | 1,259 (7.8%) | 396 (4.6%) |
| 30 to 34 Years | 1,386 (8.6%) | 386 (4.4%) |
| 35 to 39 Years | 1,309 (8.1%) | 686 (7.9%) |
| 40 to 44 Years | 1,540 (9.6%) | 639 (7.4%) |
| 45 to 49 Years | 1,464 (9.1%) | 597 (6.9%) |
| 50 to 54 Years | 1,389 (8.6%) | 512 (5.9%) |
| 55 to 59 Years | 1,329 (8.3%) | 476 (5.5%) |
| 60 to 64 Years | 860 (5.3%) | 215 (2.5%) |
| 65 to 69 Years | 270 (1.7%) | 214 (2.5%) |
| 70 to 74 Years | 281 (1.7%) | 320 (3.7%) |
| 75 to 79 Years | 167 (1.0%) | 183 (2.1%) |
| 80 to 84 Years | 147 (0.9%) | 78 (0.9%) |
| 85 Years and over | 36 (0.2%) | 23 (0.3%) |
| Total | 16,112 (100.0%) | 8,669 (100.0%) |
Families and Households in Soledad
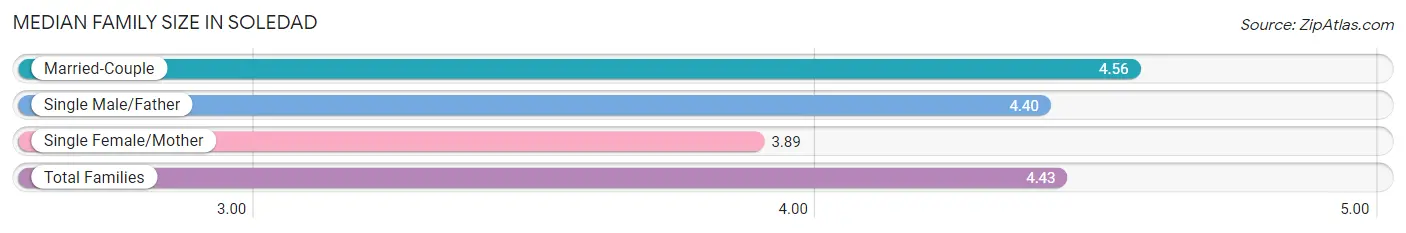
Median Family Size in Soledad
The median family size in Soledad is 4.43 persons per family, with married-couple families (2,779 | 74.0%) accounting for the largest median family size of 4.56 persons per family. On the other hand, single female/mother families (670 | 17.8%) represent the smallest median family size with 3.89 persons per family.
| Family Type | # Families | Family Size |
| Married-Couple | 2,779 (74.0%) | 4.56 |
| Single Male/Father | 306 (8.2%) | 4.40 |
| Single Female/Mother | 670 (17.8%) | 3.89 |
| Total Families | 3,755 (100.0%) | 4.43 |
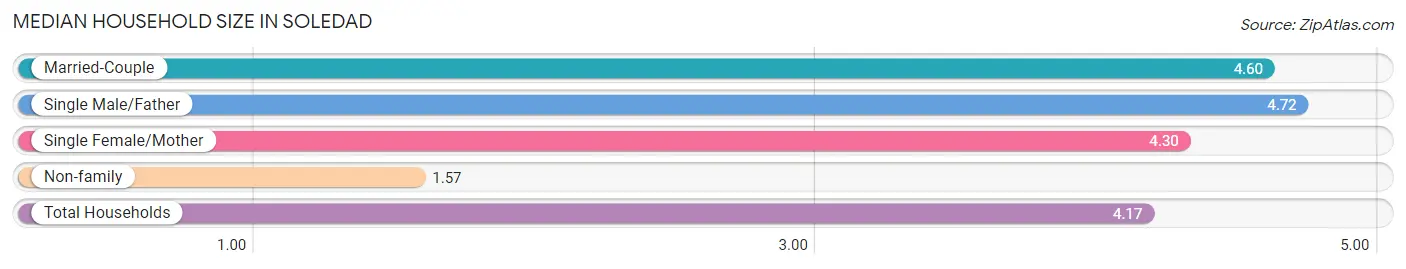
Median Household Size in Soledad
The median household size in Soledad is 4.17 persons per household, with single male/father households (306 | 7.1%) accounting for the largest median household size of 4.72 persons per household. non-family households (559 | 13.0%) represent the smallest median household size with 1.57 persons per household.
| Household Type | # Households | Household Size |
| Married-Couple | 2,779 (64.4%) | 4.60 |
| Single Male/Father | 306 (7.1%) | 4.72 |
| Single Female/Mother | 670 (15.5%) | 4.30 |
| Non-family | 559 (13.0%) | 1.57 |
| Total Households | 4,314 (100.0%) | 4.17 |
Household Size by Marriage Status in Soledad
Out of a total of 4,314 households in Soledad, 3,755 (87.0%) are family households, while 559 (13.0%) are nonfamily households. The most numerous type of family households are 5-person households, comprising 1,087, and the most common type of nonfamily households are 1-person households, comprising 453.
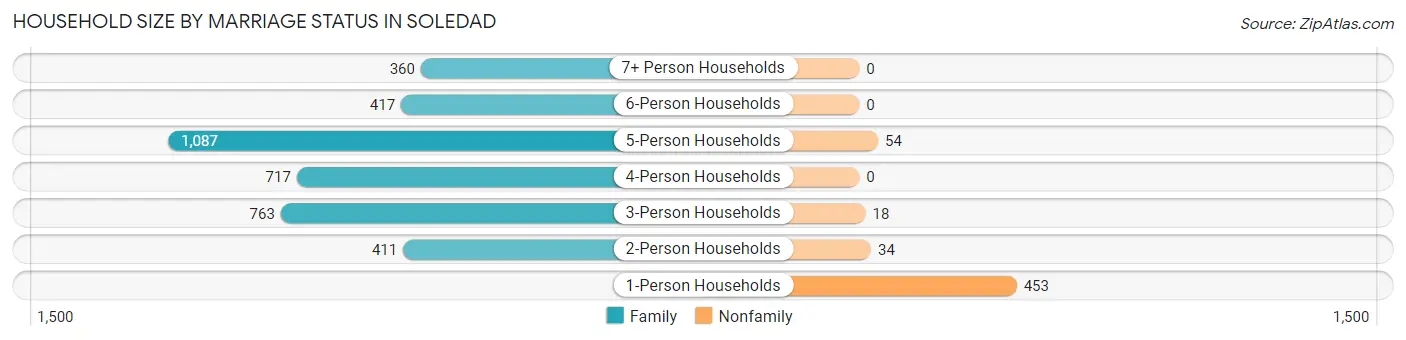
| Household Size | Family Households | Nonfamily Households |
| 1-Person Households | - | 453 (10.5%) |
| 2-Person Households | 411 (9.5%) | 34 (0.8%) |
| 3-Person Households | 763 (17.7%) | 18 (0.4%) |
| 4-Person Households | 717 (16.6%) | 0 (0.0%) |
| 5-Person Households | 1,087 (25.2%) | 54 (1.3%) |
| 6-Person Households | 417 (9.7%) | 0 (0.0%) |
| 7+ Person Households | 360 (8.3%) | 0 (0.0%) |
| Total | 3,755 (87.0%) | 559 (13.0%) |
Female Fertility in Soledad
Fertility by Age in Soledad
Average fertility rate in Soledad is 31.0 births per 1,000 women. Women in the age bracket of 35 to 50 years have the highest fertility rate with 42.0 births per 1,000 women. Women in the age bracket of 35 to 50 years acount for 59.6% of all women with births.
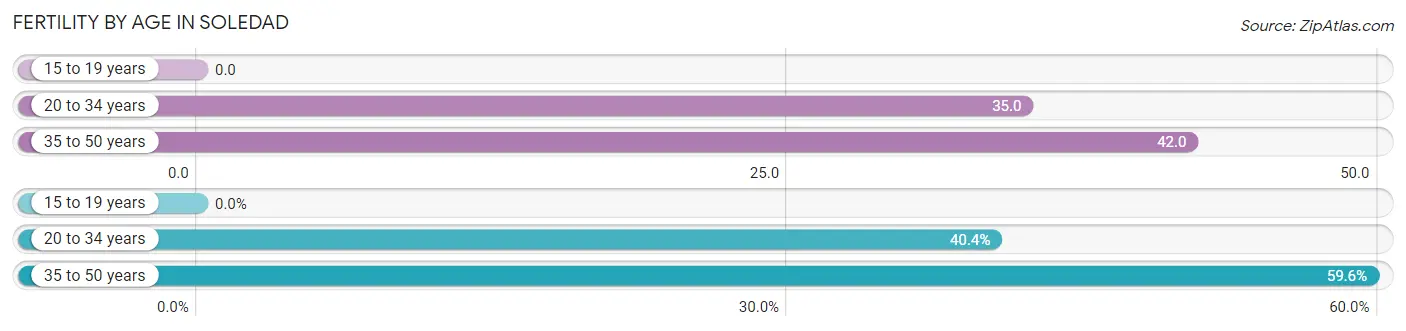
| Age Bracket | Women with Births | Births / 1,000 Women |
| 15 to 19 years | 0 (0.0%) | 0.0 |
| 20 to 34 years | 59 (40.4%) | 35.0 |
| 35 to 50 years | 87 (59.6%) | 42.0 |
| Total | 146 (100.0%) | 31.0 |
Fertility by Age by Marriage Status in Soledad
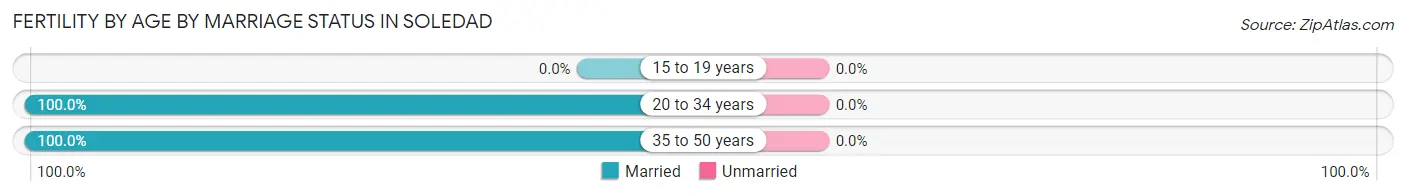
| Age Bracket | Married | Unmarried |
| 15 to 19 years | 0 (0.0%) | 0 (0.0%) |
| 20 to 34 years | 59 (100.0%) | 0 (0.0%) |
| 35 to 50 years | 87 (100.0%) | 0 (0.0%) |
| Total | 146 (100.0%) | 0 (0.0%) |
Fertility by Education in Soledad
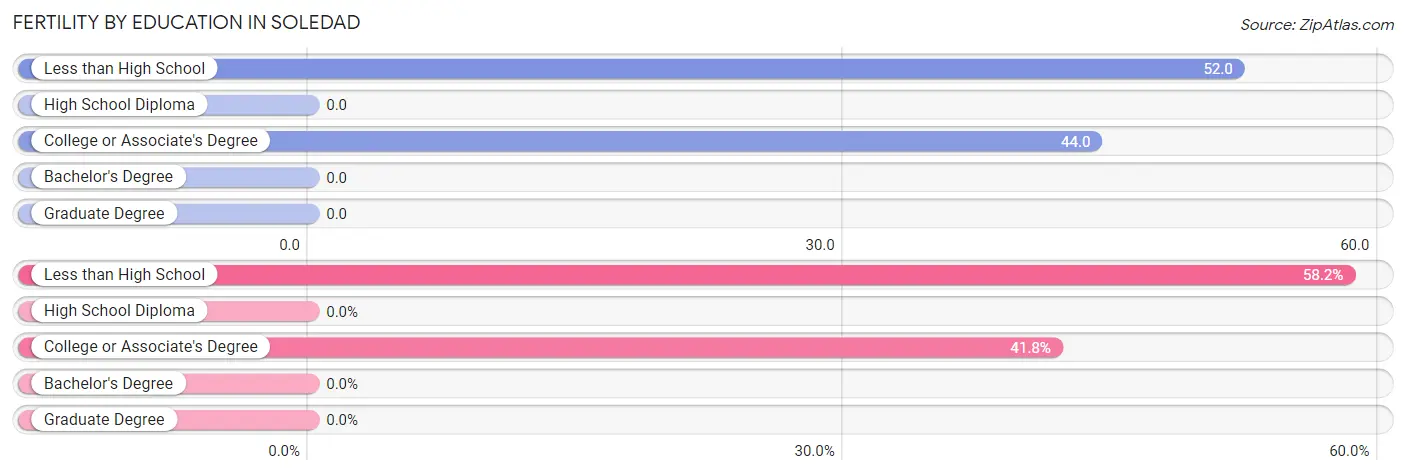
| Educational Attainment | Women with Births | Births / 1,000 Women |
| Less than High School | 85 (58.2%) | 52.0 |
| High School Diploma | 0 (0.0%) | 0.0 |
| College or Associate's Degree | 61 (41.8%) | 44.0 |
| Bachelor's Degree | 0 (0.0%) | 0.0 |
| Graduate Degree | 0 (0.0%) | 0.0 |
| Total | 146 (100.0%) | 31.0 |
Fertility by Education by Marriage Status in Soledad
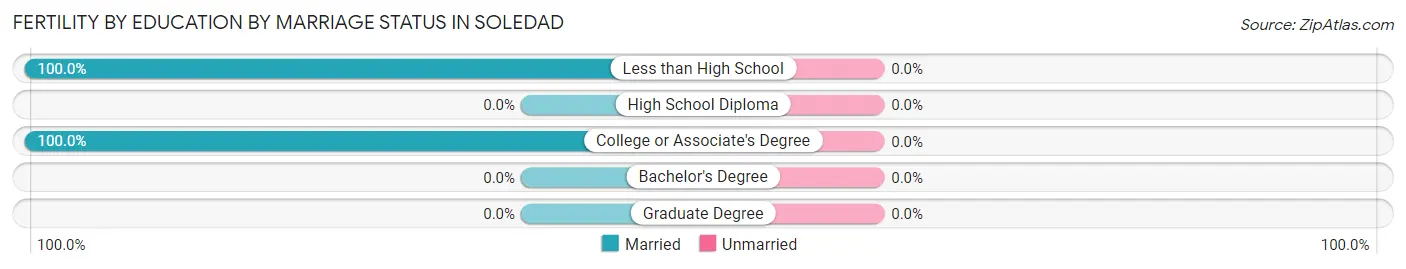
| Educational Attainment | Married | Unmarried |
| Less than High School | 85 (100.0%) | 0 (0.0%) |
| High School Diploma | 0 (0.0%) | 0 (0.0%) |
| College or Associate's Degree | 61 (100.0%) | 0 (0.0%) |
| Bachelor's Degree | 0 (0.0%) | 0 (0.0%) |
| Graduate Degree | 0 (0.0%) | 0 (0.0%) |
| Total | 146 (100.0%) | 0 (0.0%) |
Employment Characteristics in Soledad
Employment by Class of Employer in Soledad
Among the 7,225 employed individuals in Soledad, private company employees (5,567 | 77.0%), local government employees (658 | 9.1%), and state government employees (572 | 7.9%) make up the most common classes of employment.
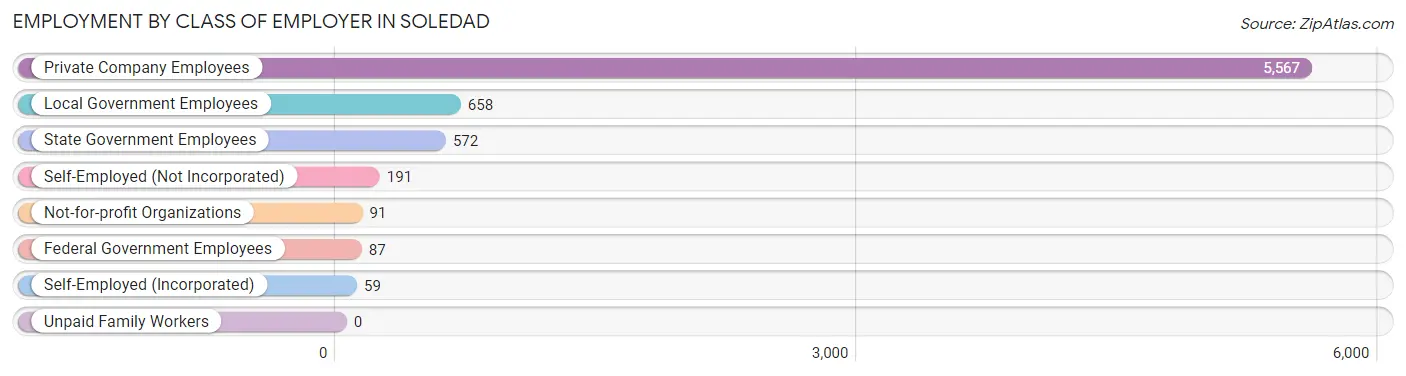
| Employer Class | # Employees | % Employees |
| Private Company Employees | 5,567 | 77.0% |
| Self-Employed (Incorporated) | 59 | 0.8% |
| Self-Employed (Not Incorporated) | 191 | 2.6% |
| Not-for-profit Organizations | 91 | 1.3% |
| Local Government Employees | 658 | 9.1% |
| State Government Employees | 572 | 7.9% |
| Federal Government Employees | 87 | 1.2% |
| Unpaid Family Workers | 0 | 0.0% |
| Total | 7,225 | 100.0% |
Employment Status by Age in Soledad
According to the labor force statistics for Soledad, out of the total population over 16 years of age (19,524), 39.1% or 7,634 individuals are in the labor force, with 2.9% or 221 of them unemployed. The age group with the highest labor force participation rate is 20 to 24 years, with 51.7% or 963 individuals in the labor force. Within the labor force, the 25 to 29 years age range has the highest percentage of unemployed individuals, with 10.0% or 51 of them being unemployed.
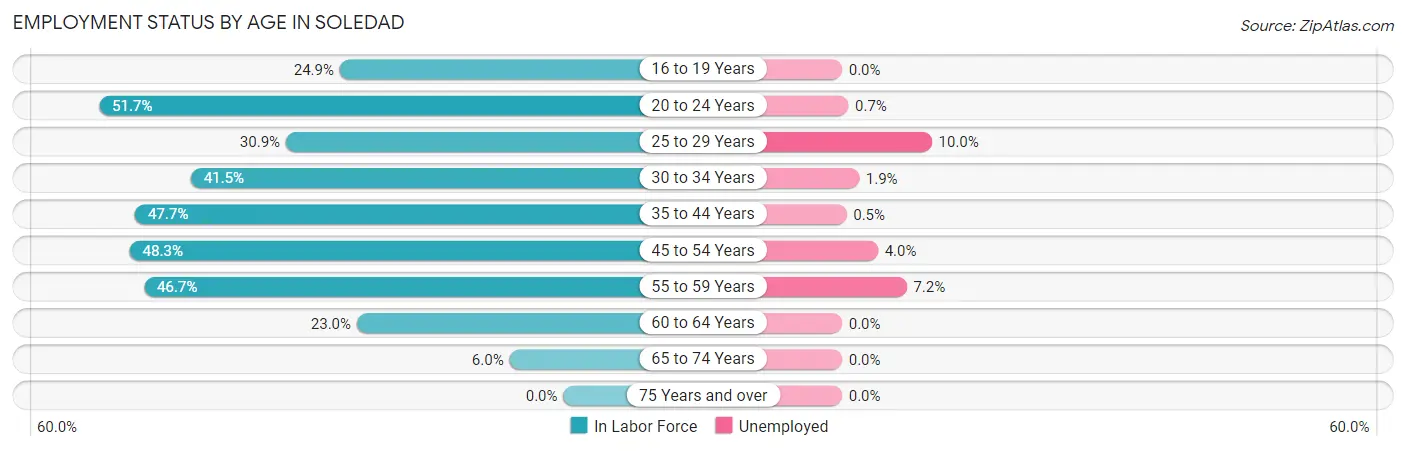
| Age Bracket | In Labor Force | Unemployed |
| 16 to 19 Years | 374 (24.9%) | 0 (0.0%) |
| 20 to 24 Years | 963 (51.7%) | 7 (0.7%) |
| 25 to 29 Years | 511 (30.9%) | 51 (10.0%) |
| 30 to 34 Years | 735 (41.5%) | 14 (1.9%) |
| 35 to 44 Years | 1,991 (47.7%) | 10 (0.5%) |
| 45 to 54 Years | 1,914 (48.3%) | 77 (4.0%) |
| 55 to 59 Years | 843 (46.7%) | 61 (7.2%) |
| 60 to 64 Years | 247 (23.0%) | 0 (0.0%) |
| 65 to 74 Years | 65 (6.0%) | 0 (0.0%) |
| 75 Years and over | 0 (0.0%) | 0 (0.0%) |
| Total | 7,634 (39.1%) | 221 (2.9%) |
Employment Status by Educational Attainment in Soledad
According to labor force statistics for Soledad, 43.2% of individuals (6,239) out of the total population between 25 and 64 years of age (14,443) are in the labor force, with 3.4% or 212 of them being unemployed. The group with the highest labor force participation rate are those with the educational attainment of bachelor's degree or higher, with 76.4% or 646 individuals in the labor force. Within the labor force, individuals with college / associate degree education have the highest percentage of unemployment, with 5.3% or 77 of them being unemployed.
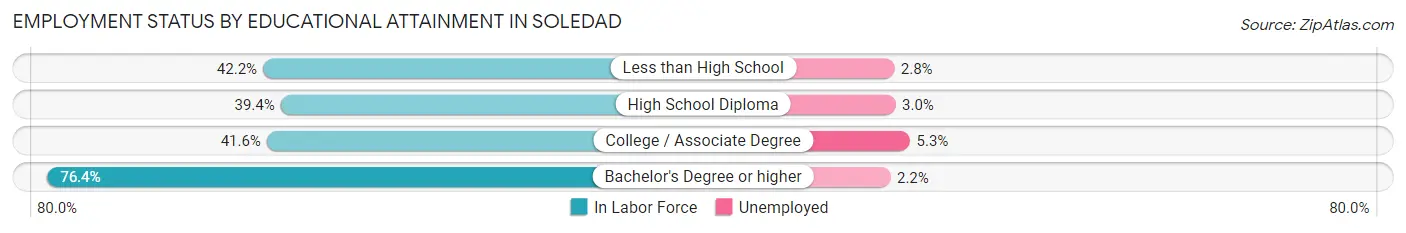
| Educational Attainment | In Labor Force | Unemployed |
| Less than High School | 2,476 (42.2%) | 164 (2.8%) |
| High School Diploma | 1,678 (39.4%) | 128 (3.0%) |
| College / Associate Degree | 1,444 (41.6%) | 184 (5.3%) |
| Bachelor's Degree or higher | 646 (76.4%) | 19 (2.2%) |
| Total | 6,239 (43.2%) | 491 (3.4%) |
Employment Occupations by Sex in Soledad
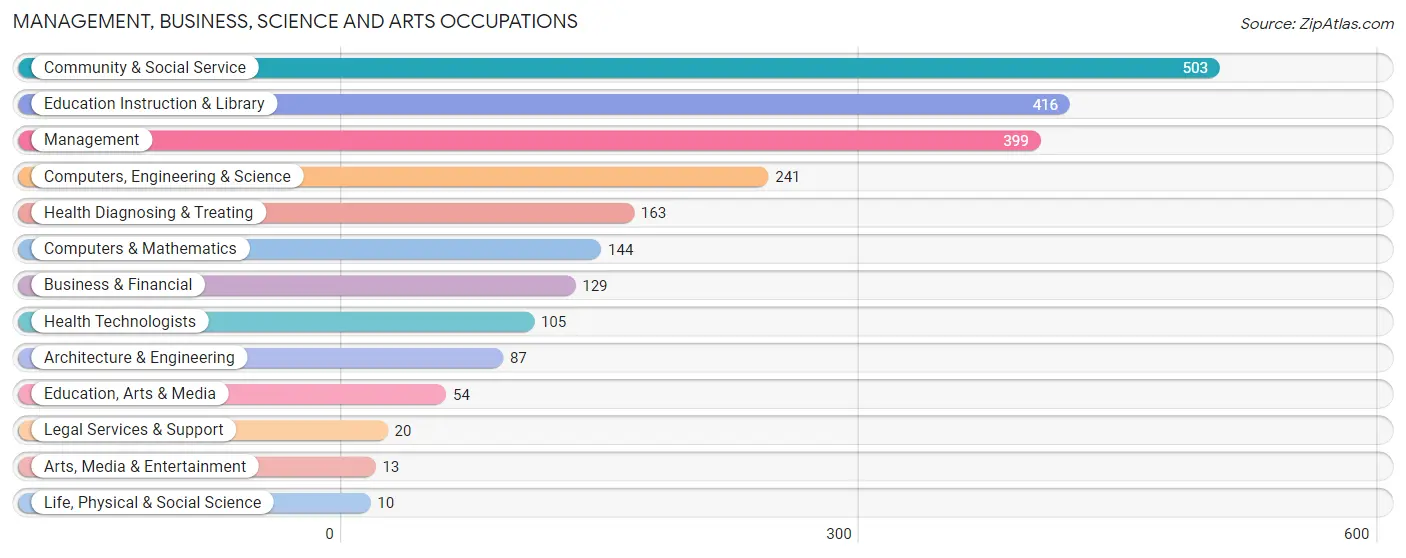
Management, Business, Science and Arts Occupations
The most common Management, Business, Science and Arts occupations in Soledad are Community & Social Service (503 | 6.8%), Education Instruction & Library (416 | 5.6%), Management (399 | 5.4%), Computers, Engineering & Science (241 | 3.3%), and Health Diagnosing & Treating (163 | 2.2%).
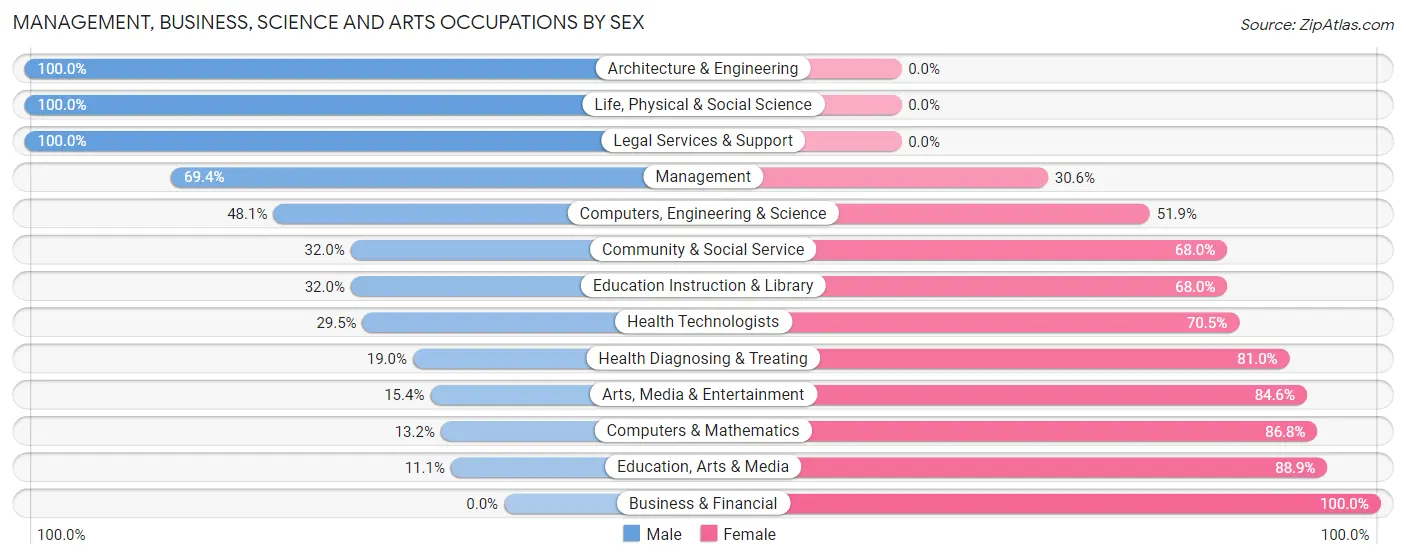
Management, Business, Science and Arts Occupations by Sex
Within the Management, Business, Science and Arts occupations in Soledad, the most male-oriented occupations are Architecture & Engineering (100.0%), Life, Physical & Social Science (100.0%), and Legal Services & Support (100.0%), while the most female-oriented occupations are Business & Financial (100.0%), Education, Arts & Media (88.9%), and Computers & Mathematics (86.8%).
| Occupation | Male | Female |
| Management | 277 (69.4%) | 122 (30.6%) |
| Business & Financial | 0 (0.0%) | 129 (100.0%) |
| Computers, Engineering & Science | 116 (48.1%) | 125 (51.9%) |
| Computers & Mathematics | 19 (13.2%) | 125 (86.8%) |
| Architecture & Engineering | 87 (100.0%) | 0 (0.0%) |
| Life, Physical & Social Science | 10 (100.0%) | 0 (0.0%) |
| Community & Social Service | 161 (32.0%) | 342 (68.0%) |
| Education, Arts & Media | 6 (11.1%) | 48 (88.9%) |
| Legal Services & Support | 20 (100.0%) | 0 (0.0%) |
| Education Instruction & Library | 133 (32.0%) | 283 (68.0%) |
| Arts, Media & Entertainment | 2 (15.4%) | 11 (84.6%) |
| Health Diagnosing & Treating | 31 (19.0%) | 132 (81.0%) |
| Health Technologists | 31 (29.5%) | 74 (70.5%) |
| Total (Category) | 585 (40.8%) | 850 (59.2%) |
| Total (Overall) | 4,371 (58.9%) | 3,053 (41.1%) |
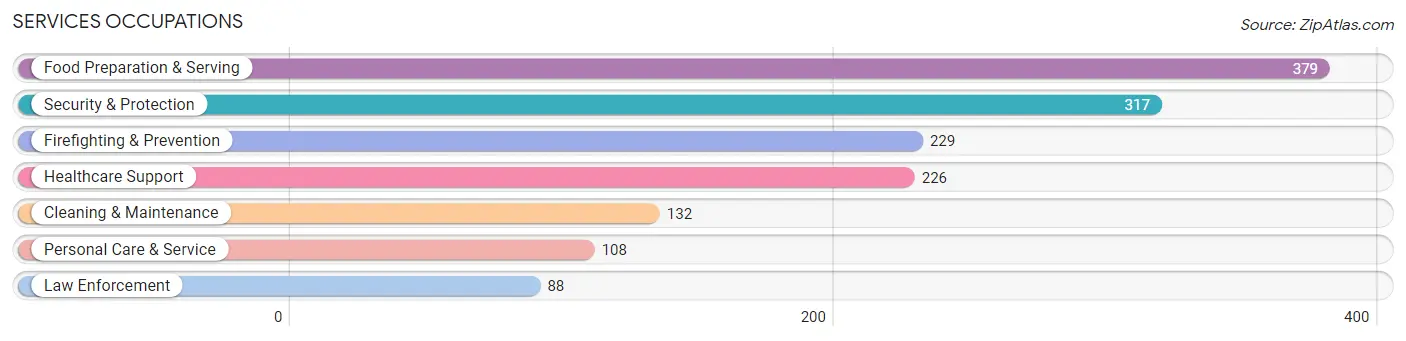
Services Occupations
The most common Services occupations in Soledad are Food Preparation & Serving (379 | 5.1%), Security & Protection (317 | 4.3%), Firefighting & Prevention (229 | 3.1%), Healthcare Support (226 | 3.0%), and Cleaning & Maintenance (132 | 1.8%).
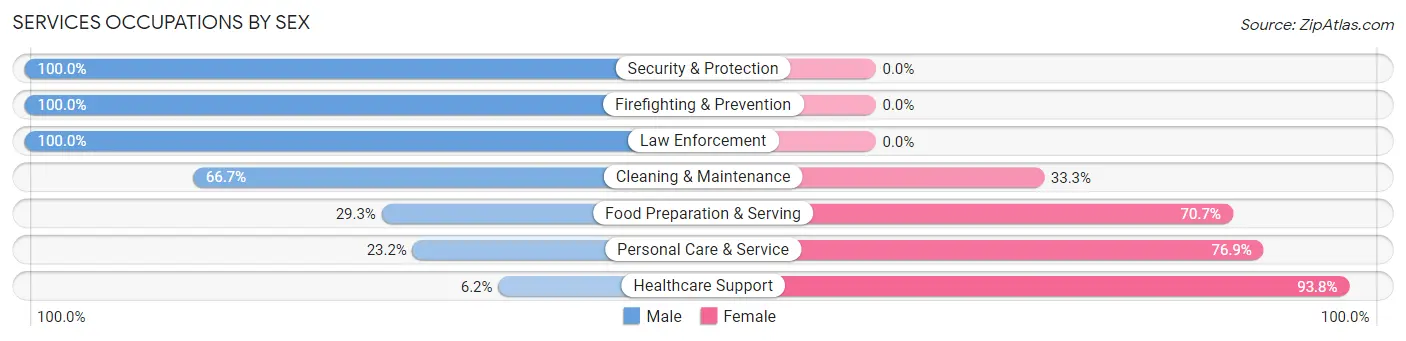
Services Occupations by Sex
Within the Services occupations in Soledad, the most male-oriented occupations are Security & Protection (100.0%), Firefighting & Prevention (100.0%), and Law Enforcement (100.0%), while the most female-oriented occupations are Healthcare Support (93.8%), Personal Care & Service (76.8%), and Food Preparation & Serving (70.7%).
| Occupation | Male | Female |
| Healthcare Support | 14 (6.2%) | 212 (93.8%) |
| Security & Protection | 317 (100.0%) | 0 (0.0%) |
| Firefighting & Prevention | 229 (100.0%) | 0 (0.0%) |
| Law Enforcement | 88 (100.0%) | 0 (0.0%) |
| Food Preparation & Serving | 111 (29.3%) | 268 (70.7%) |
| Cleaning & Maintenance | 88 (66.7%) | 44 (33.3%) |
| Personal Care & Service | 25 (23.2%) | 83 (76.8%) |
| Total (Category) | 555 (47.8%) | 607 (52.2%) |
| Total (Overall) | 4,371 (58.9%) | 3,053 (41.1%) |
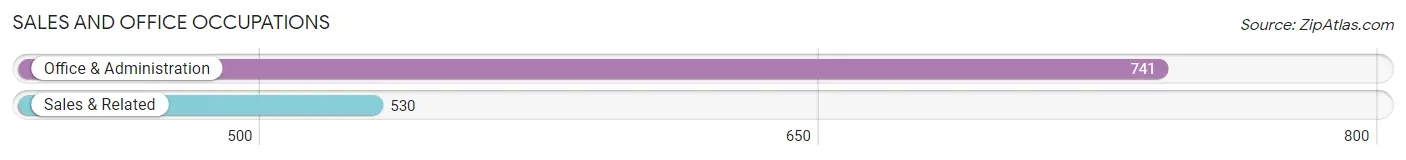
Sales and Office Occupations
The most common Sales and Office occupations in Soledad are Office & Administration (741 | 10.0%), and Sales & Related (530 | 7.1%).
Sales and Office Occupations by Sex
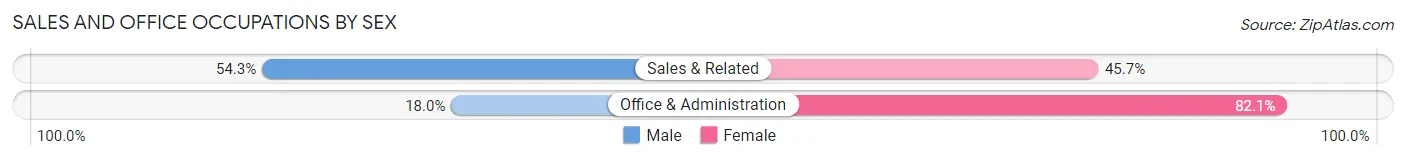
| Occupation | Male | Female |
| Sales & Related | 288 (54.3%) | 242 (45.7%) |
| Office & Administration | 133 (17.9%) | 608 (82.1%) |
| Total (Category) | 421 (33.1%) | 850 (66.9%) |
| Total (Overall) | 4,371 (58.9%) | 3,053 (41.1%) |
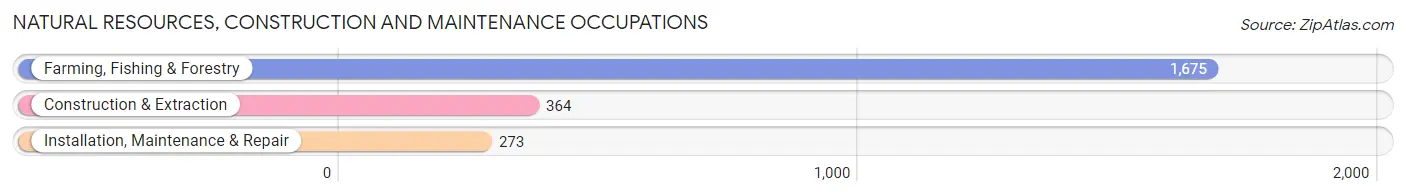
Natural Resources, Construction and Maintenance Occupations
The most common Natural Resources, Construction and Maintenance occupations in Soledad are Farming, Fishing & Forestry (1,675 | 22.6%), Construction & Extraction (364 | 4.9%), and Installation, Maintenance & Repair (273 | 3.7%).
Natural Resources, Construction and Maintenance Occupations by Sex
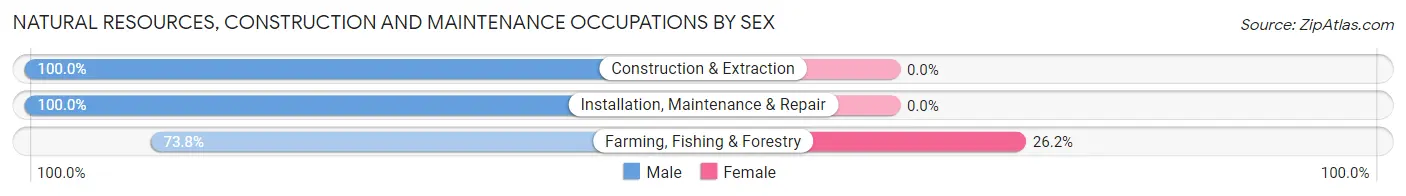
| Occupation | Male | Female |
| Farming, Fishing & Forestry | 1,236 (73.8%) | 439 (26.2%) |
| Construction & Extraction | 364 (100.0%) | 0 (0.0%) |
| Installation, Maintenance & Repair | 273 (100.0%) | 0 (0.0%) |
| Total (Category) | 1,873 (81.0%) | 439 (19.0%) |
| Total (Overall) | 4,371 (58.9%) | 3,053 (41.1%) |
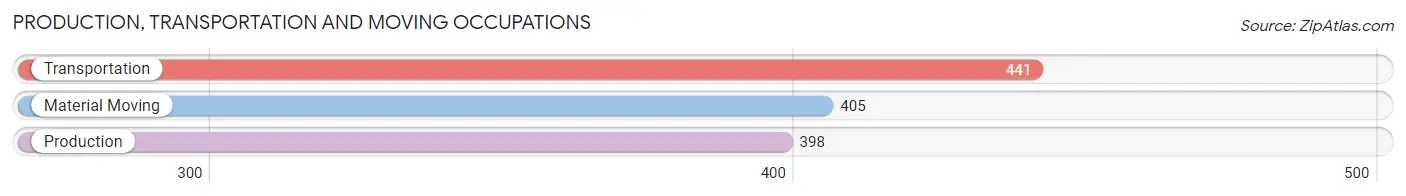
Production, Transportation and Moving Occupations
The most common Production, Transportation and Moving occupations in Soledad are Transportation (441 | 5.9%), Material Moving (405 | 5.5%), and Production (398 | 5.4%).
Production, Transportation and Moving Occupations by Sex
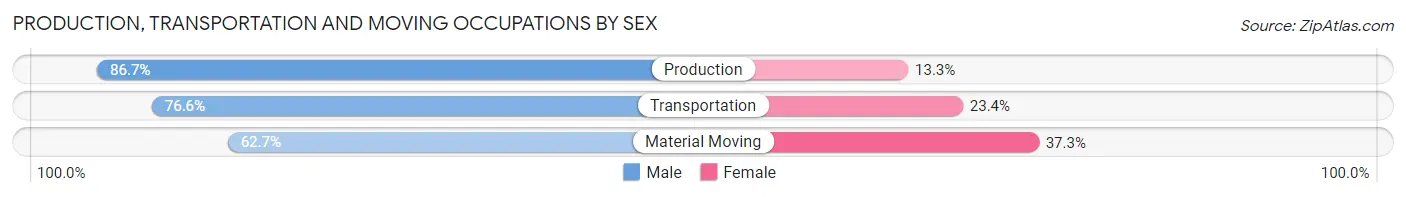
| Occupation | Male | Female |
| Production | 345 (86.7%) | 53 (13.3%) |
| Transportation | 338 (76.6%) | 103 (23.4%) |
| Material Moving | 254 (62.7%) | 151 (37.3%) |
| Total (Category) | 937 (75.3%) | 307 (24.7%) |
| Total (Overall) | 4,371 (58.9%) | 3,053 (41.1%) |
Employment Industries by Sex in Soledad
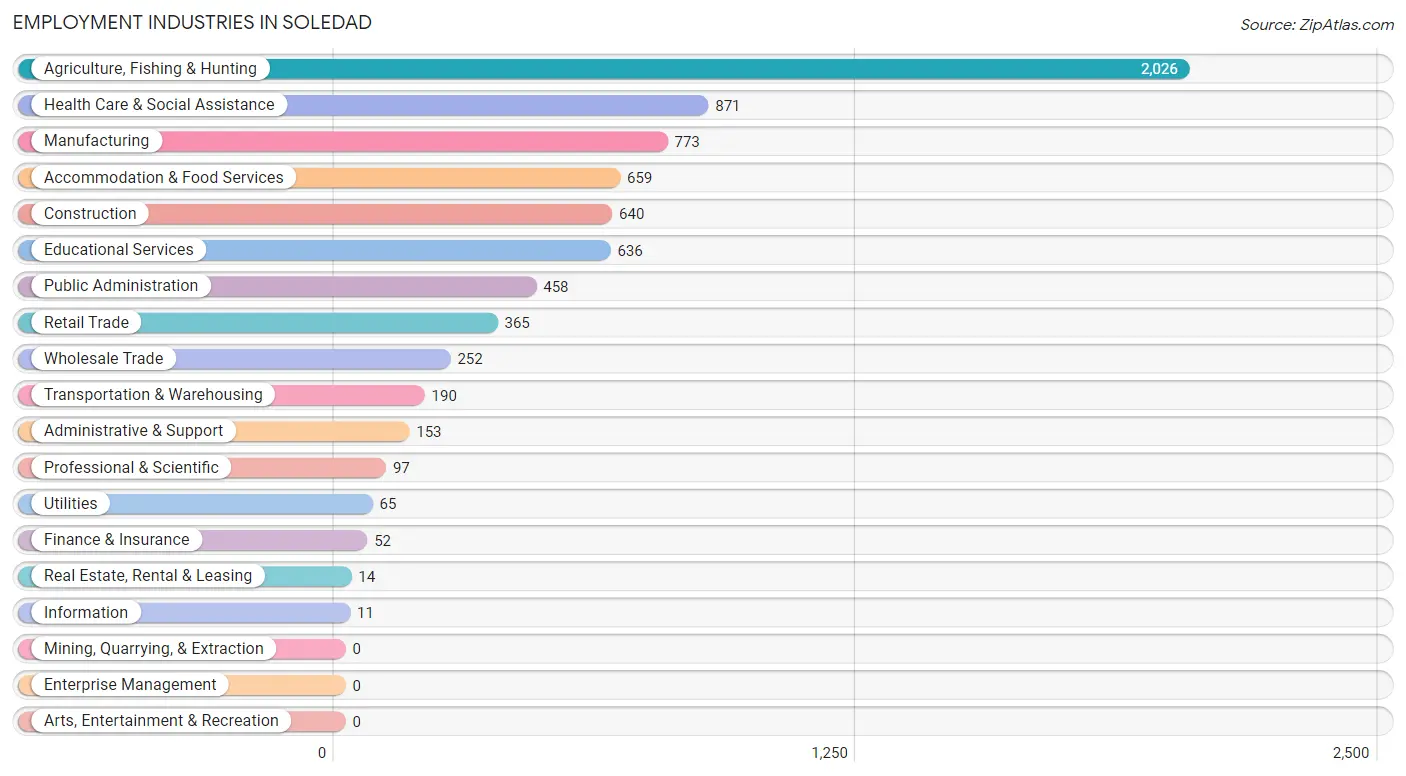
Employment Industries in Soledad
The major employment industries in Soledad include Agriculture, Fishing & Hunting (2,026 | 27.3%), Health Care & Social Assistance (871 | 11.7%), Manufacturing (773 | 10.4%), Accommodation & Food Services (659 | 8.9%), and Construction (640 | 8.6%).
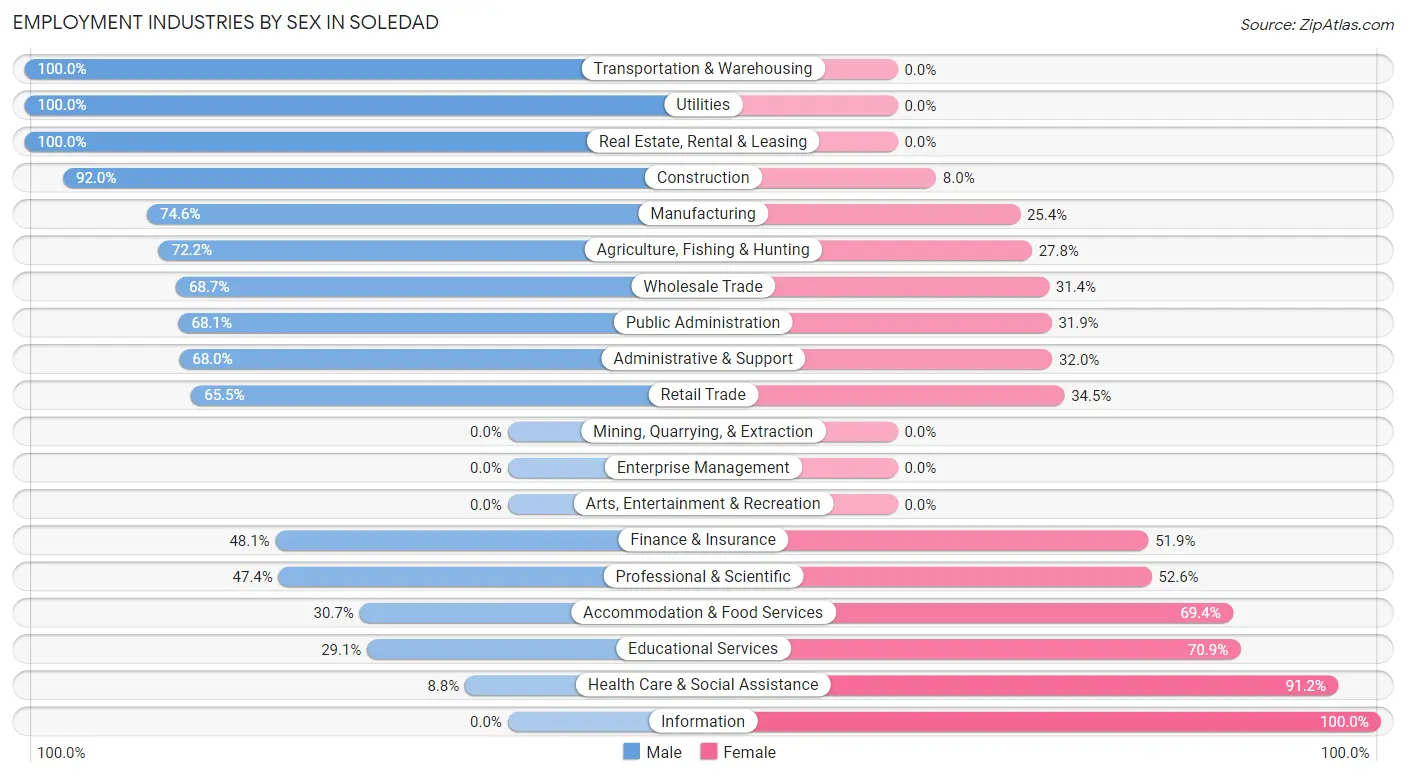
Employment Industries by Sex in Soledad
The Soledad industries that see more men than women are Transportation & Warehousing (100.0%), Utilities (100.0%), and Real Estate, Rental & Leasing (100.0%), whereas the industries that tend to have a higher number of women are Information (100.0%), Health Care & Social Assistance (91.2%), and Educational Services (70.9%).
| Industry | Male | Female |
| Agriculture, Fishing & Hunting | 1,463 (72.2%) | 563 (27.8%) |
| Mining, Quarrying, & Extraction | 0 (0.0%) | 0 (0.0%) |
| Construction | 589 (92.0%) | 51 (8.0%) |
| Manufacturing | 577 (74.6%) | 196 (25.4%) |
| Wholesale Trade | 173 (68.6%) | 79 (31.4%) |
| Retail Trade | 239 (65.5%) | 126 (34.5%) |
| Transportation & Warehousing | 190 (100.0%) | 0 (0.0%) |
| Utilities | 65 (100.0%) | 0 (0.0%) |
| Information | 0 (0.0%) | 11 (100.0%) |
| Finance & Insurance | 25 (48.1%) | 27 (51.9%) |
| Real Estate, Rental & Leasing | 14 (100.0%) | 0 (0.0%) |
| Professional & Scientific | 46 (47.4%) | 51 (52.6%) |
| Enterprise Management | 0 (0.0%) | 0 (0.0%) |
| Administrative & Support | 104 (68.0%) | 49 (32.0%) |
| Educational Services | 185 (29.1%) | 451 (70.9%) |
| Health Care & Social Assistance | 77 (8.8%) | 794 (91.2%) |
| Arts, Entertainment & Recreation | 0 (0.0%) | 0 (0.0%) |
| Accommodation & Food Services | 202 (30.6%) | 457 (69.4%) |
| Public Administration | 312 (68.1%) | 146 (31.9%) |
| Total | 4,371 (58.9%) | 3,053 (41.1%) |
Education in Soledad
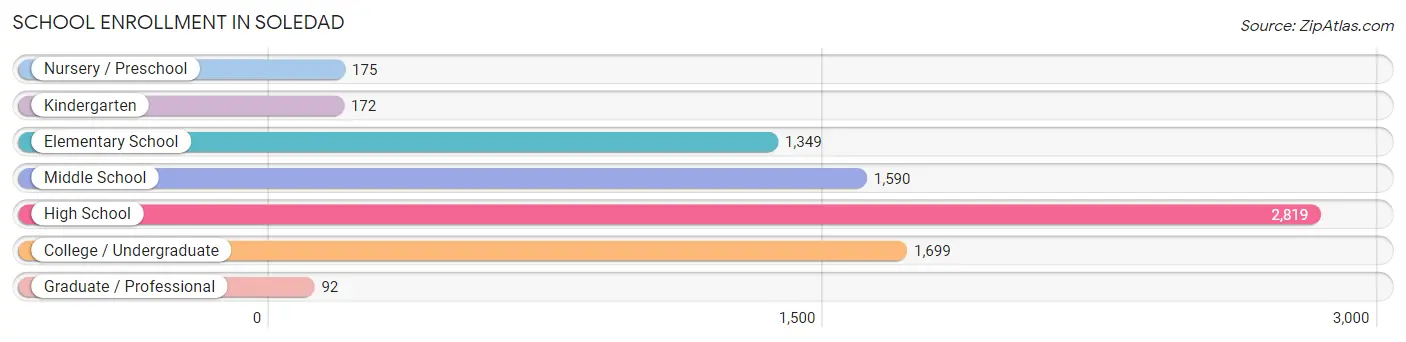
School Enrollment in Soledad
The most common levels of schooling among the 7,896 students in Soledad are high school (2,819 | 35.7%), college / undergraduate (1,699 | 21.5%), and middle school (1,590 | 20.1%).
| School Level | # Students | % Students |
| Nursery / Preschool | 175 | 2.2% |
| Kindergarten | 172 | 2.2% |
| Elementary School | 1,349 | 17.1% |
| Middle School | 1,590 | 20.1% |
| High School | 2,819 | 35.7% |
| College / Undergraduate | 1,699 | 21.5% |
| Graduate / Professional | 92 | 1.2% |
| Total | 7,896 | 100.0% |
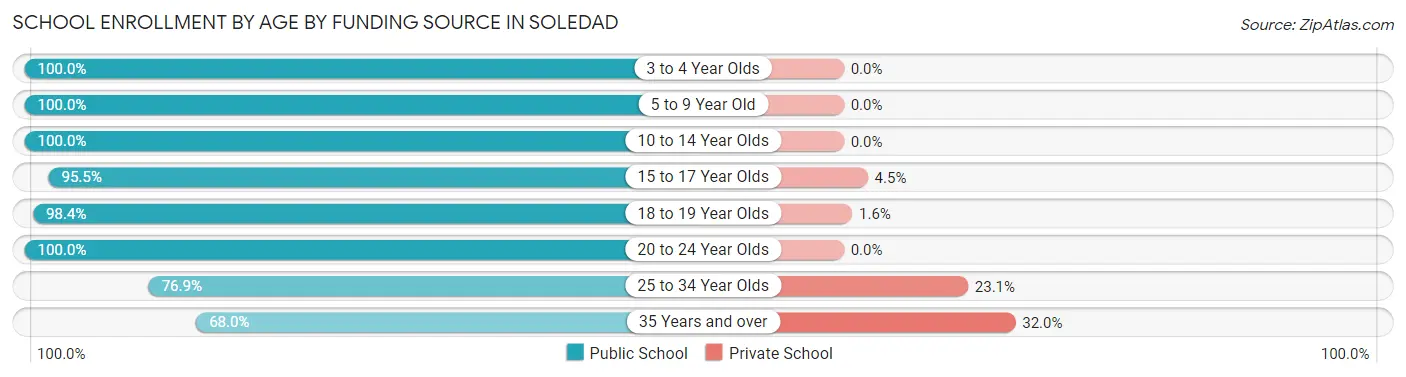
School Enrollment by Age by Funding Source in Soledad
Out of a total of 7,896 students who are enrolled in schools in Soledad, 537 (6.8%) attend a private institution, while the remaining 7,359 (93.2%) are enrolled in public schools. The age group of 35 years and over has the highest likelihood of being enrolled in private schools, with 360 (32.0% in the age bracket) enrolled. Conversely, the age group of 3 to 4 year olds has the lowest likelihood of being enrolled in a private school, with 69 (100.0% in the age bracket) attending a public institution.
| Age Bracket | Public School | Private School |
| 3 to 4 Year Olds | 69 (100.0%) | 0 (0.0%) |
| 5 to 9 Year Old | 1,393 (100.0%) | 0 (0.0%) |
| 10 to 14 Year Olds | 2,403 (100.0%) | 0 (0.0%) |
| 15 to 17 Year Olds | 962 (95.5%) | 45 (4.5%) |
| 18 to 19 Year Olds | 628 (98.4%) | 10 (1.6%) |
| 20 to 24 Year Olds | 724 (100.0%) | 0 (0.0%) |
| 25 to 34 Year Olds | 412 (76.9%) | 124 (23.1%) |
| 35 Years and over | 766 (68.0%) | 360 (32.0%) |
| Total | 7,359 (93.2%) | 537 (6.8%) |
Educational Attainment by Field of Study in Soledad
Liberal arts & history (193 | 20.4%), business (158 | 16.7%), science & technology (111 | 11.7%), bio, nature & agricultural (99 | 10.4%), and psychology (91 | 9.6%) are the most common fields of study among 948 individuals in Soledad who have obtained a bachelor's degree or higher.
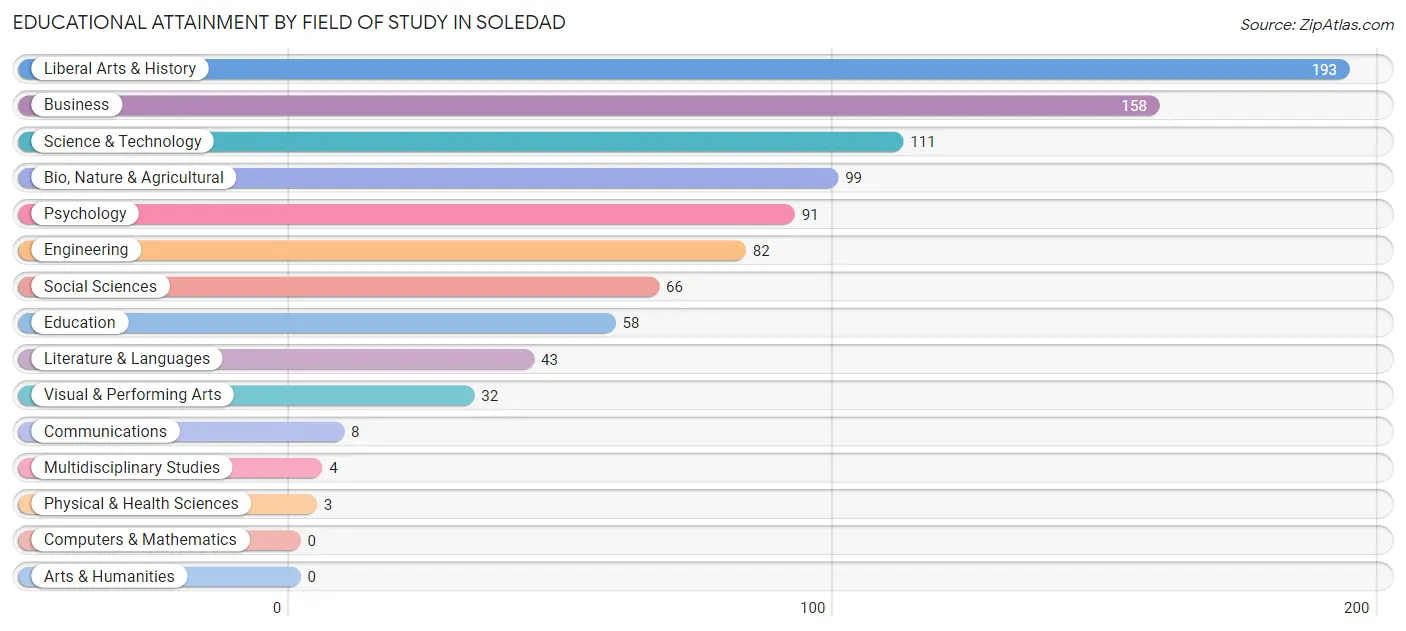
| Field of Study | # Graduates | % Graduates |
| Computers & Mathematics | 0 | 0.0% |
| Bio, Nature & Agricultural | 99 | 10.4% |
| Physical & Health Sciences | 3 | 0.3% |
| Psychology | 91 | 9.6% |
| Social Sciences | 66 | 7.0% |
| Engineering | 82 | 8.6% |
| Multidisciplinary Studies | 4 | 0.4% |
| Science & Technology | 111 | 11.7% |
| Business | 158 | 16.7% |
| Education | 58 | 6.1% |
| Literature & Languages | 43 | 4.5% |
| Liberal Arts & History | 193 | 20.4% |
| Visual & Performing Arts | 32 | 3.4% |
| Communications | 8 | 0.8% |
| Arts & Humanities | 0 | 0.0% |
| Total | 948 | 100.0% |
Transportation & Commute in Soledad
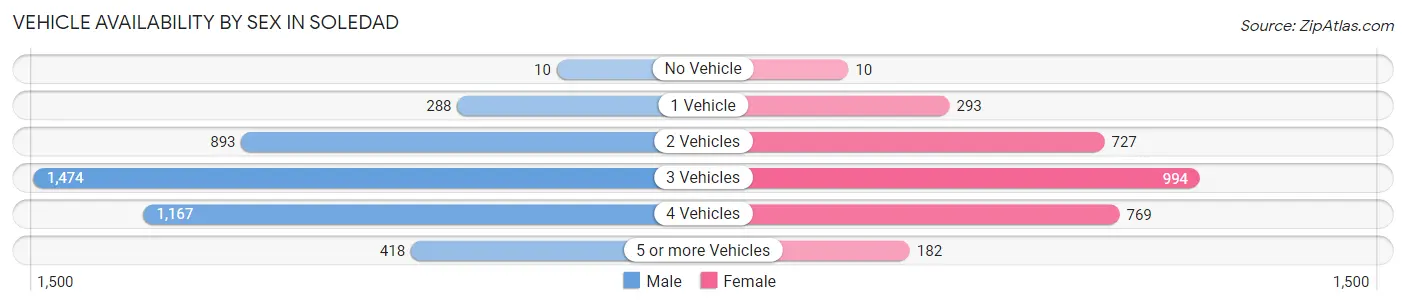
Vehicle Availability by Sex in Soledad
The most prevalent vehicle ownership categories in Soledad are males with 3 vehicles (1,474, accounting for 34.7%) and females with 3 vehicles (994, making up 49.5%).
| Vehicles Available | Male | Female |
| No Vehicle | 10 (0.2%) | 10 (0.3%) |
| 1 Vehicle | 288 (6.8%) | 293 (9.9%) |
| 2 Vehicles | 893 (21.0%) | 727 (24.4%) |
| 3 Vehicles | 1,474 (34.7%) | 994 (33.4%) |
| 4 Vehicles | 1,167 (27.5%) | 769 (25.9%) |
| 5 or more Vehicles | 418 (9.8%) | 182 (6.1%) |
| Total | 4,250 (100.0%) | 2,975 (100.0%) |
Commute Time in Soledad
The most frequently occuring commute durations in Soledad are 20 to 24 minutes (1,565 commuters, 22.0%), 15 to 19 minutes (1,302 commuters, 18.3%), and 30 to 34 minutes (1,186 commuters, 16.7%).
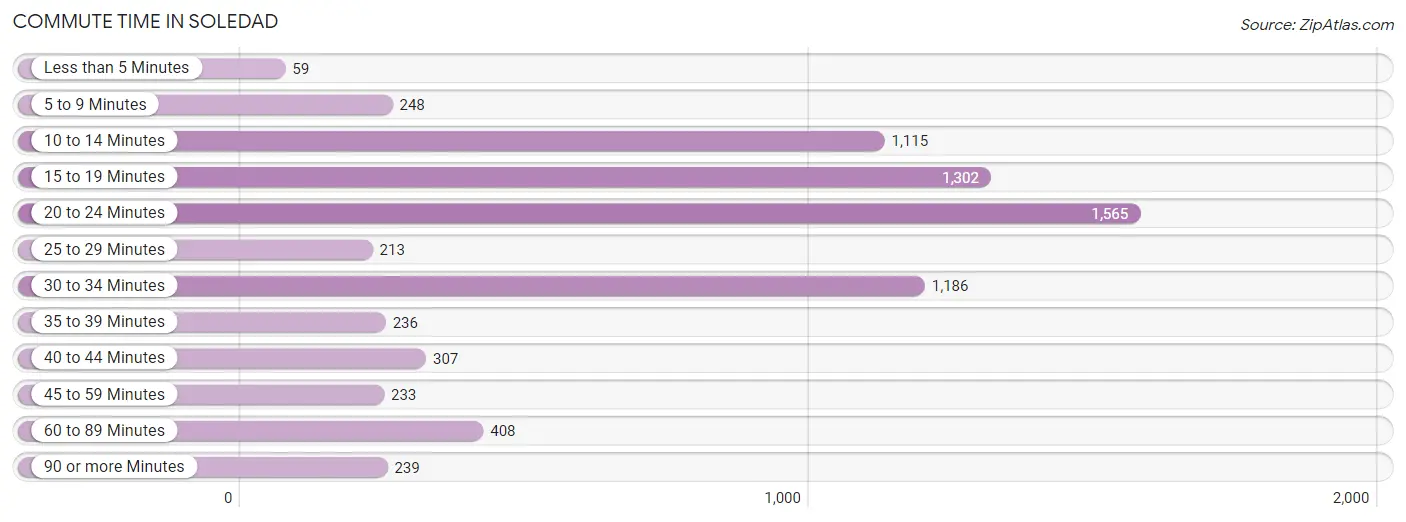
| Commute Time | # Commuters | % Commuters |
| Less than 5 Minutes | 59 | 0.8% |
| 5 to 9 Minutes | 248 | 3.5% |
| 10 to 14 Minutes | 1,115 | 15.7% |
| 15 to 19 Minutes | 1,302 | 18.3% |
| 20 to 24 Minutes | 1,565 | 22.0% |
| 25 to 29 Minutes | 213 | 3.0% |
| 30 to 34 Minutes | 1,186 | 16.7% |
| 35 to 39 Minutes | 236 | 3.3% |
| 40 to 44 Minutes | 307 | 4.3% |
| 45 to 59 Minutes | 233 | 3.3% |
| 60 to 89 Minutes | 408 | 5.7% |
| 90 or more Minutes | 239 | 3.4% |
Commute Time by Sex in Soledad
The most common commute times in Soledad are 20 to 24 minutes (1,252 commuters, 30.0%) for males and 10 to 14 minutes (802 commuters, 27.3%) for females.
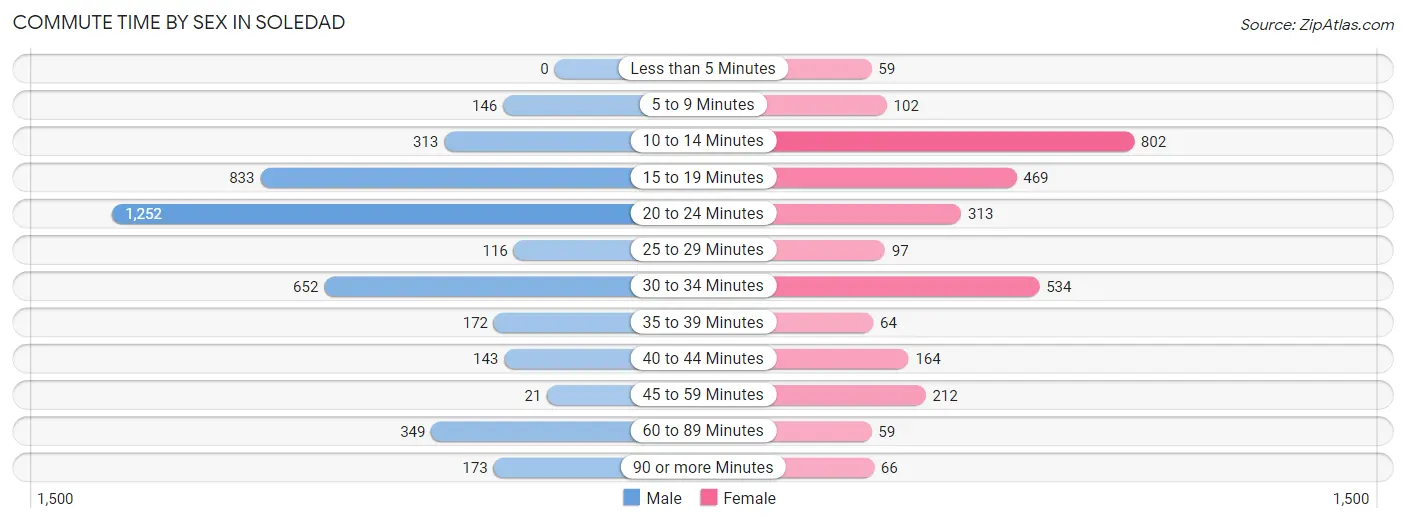
| Commute Time | Male | Female |
| Less than 5 Minutes | 0 (0.0%) | 59 (2.0%) |
| 5 to 9 Minutes | 146 (3.5%) | 102 (3.5%) |
| 10 to 14 Minutes | 313 (7.5%) | 802 (27.3%) |
| 15 to 19 Minutes | 833 (20.0%) | 469 (16.0%) |
| 20 to 24 Minutes | 1,252 (30.0%) | 313 (10.6%) |
| 25 to 29 Minutes | 116 (2.8%) | 97 (3.3%) |
| 30 to 34 Minutes | 652 (15.6%) | 534 (18.2%) |
| 35 to 39 Minutes | 172 (4.1%) | 64 (2.2%) |
| 40 to 44 Minutes | 143 (3.4%) | 164 (5.6%) |
| 45 to 59 Minutes | 21 (0.5%) | 212 (7.2%) |
| 60 to 89 Minutes | 349 (8.4%) | 59 (2.0%) |
| 90 or more Minutes | 173 (4.2%) | 66 (2.2%) |
Time of Departure to Work by Sex in Soledad
The most frequent times of departure to work in Soledad are 6:00 AM to 6:29 AM (845, 20.3%) for males and 7:00 AM to 7:29 AM (547, 18.6%) for females.
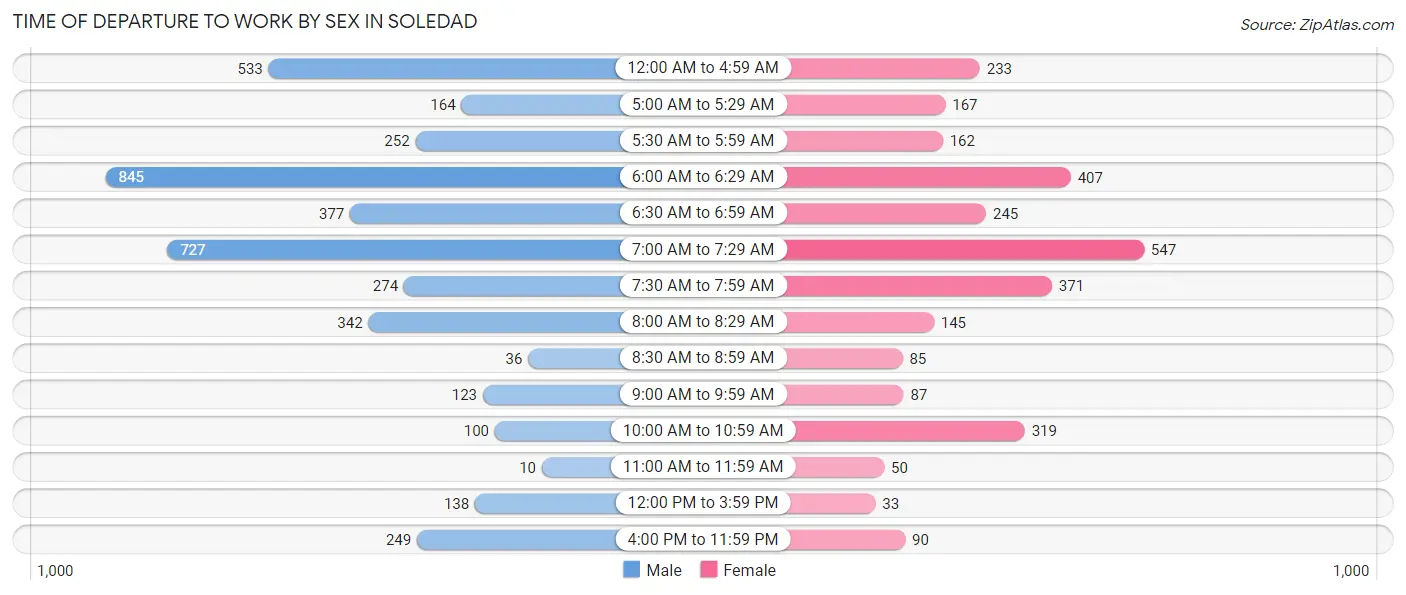
| Time of Departure | Male | Female |
| 12:00 AM to 4:59 AM | 533 (12.8%) | 233 (7.9%) |
| 5:00 AM to 5:29 AM | 164 (3.9%) | 167 (5.7%) |
| 5:30 AM to 5:59 AM | 252 (6.0%) | 162 (5.5%) |
| 6:00 AM to 6:29 AM | 845 (20.3%) | 407 (13.8%) |
| 6:30 AM to 6:59 AM | 377 (9.0%) | 245 (8.3%) |
| 7:00 AM to 7:29 AM | 727 (17.4%) | 547 (18.6%) |
| 7:30 AM to 7:59 AM | 274 (6.6%) | 371 (12.6%) |
| 8:00 AM to 8:29 AM | 342 (8.2%) | 145 (4.9%) |
| 8:30 AM to 8:59 AM | 36 (0.9%) | 85 (2.9%) |
| 9:00 AM to 9:59 AM | 123 (2.9%) | 87 (3.0%) |
| 10:00 AM to 10:59 AM | 100 (2.4%) | 319 (10.8%) |
| 11:00 AM to 11:59 AM | 10 (0.2%) | 50 (1.7%) |
| 12:00 PM to 3:59 PM | 138 (3.3%) | 33 (1.1%) |
| 4:00 PM to 11:59 PM | 249 (6.0%) | 90 (3.1%) |
| Total | 4,170 (100.0%) | 2,941 (100.0%) |
Housing Occupancy in Soledad
Occupancy by Ownership in Soledad
Of the total 4,314 dwellings in Soledad, owner-occupied units account for 2,585 (59.9%), while renter-occupied units make up 1,729 (40.1%).
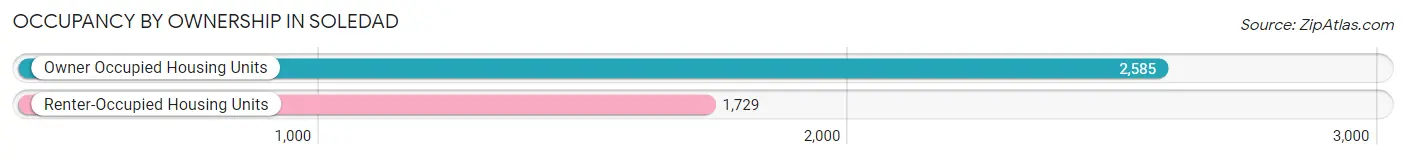
| Occupancy | # Housing Units | % Housing Units |
| Owner Occupied Housing Units | 2,585 | 59.9% |
| Renter-Occupied Housing Units | 1,729 | 40.1% |
| Total Occupied Housing Units | 4,314 | 100.0% |
Occupancy by Household Size in Soledad
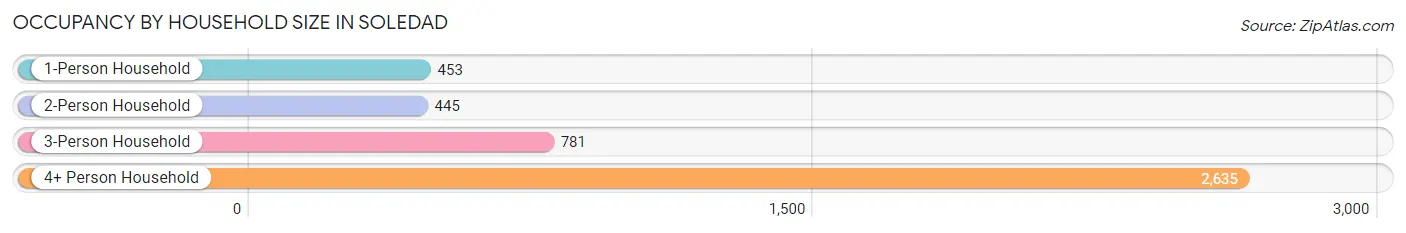
| Household Size | # Housing Units | % Housing Units |
| 1-Person Household | 453 | 10.5% |
| 2-Person Household | 445 | 10.3% |
| 3-Person Household | 781 | 18.1% |
| 4+ Person Household | 2,635 | 61.1% |
| Total Housing Units | 4,314 | 100.0% |
Occupancy by Ownership by Household Size in Soledad
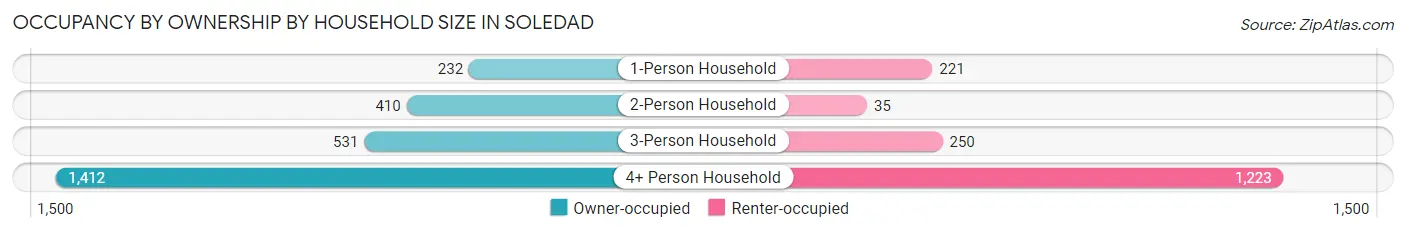
| Household Size | Owner-occupied | Renter-occupied |
| 1-Person Household | 232 (51.2%) | 221 (48.8%) |
| 2-Person Household | 410 (92.1%) | 35 (7.9%) |
| 3-Person Household | 531 (68.0%) | 250 (32.0%) |
| 4+ Person Household | 1,412 (53.6%) | 1,223 (46.4%) |
| Total Housing Units | 2,585 (59.9%) | 1,729 (40.1%) |
Occupancy by Educational Attainment in Soledad
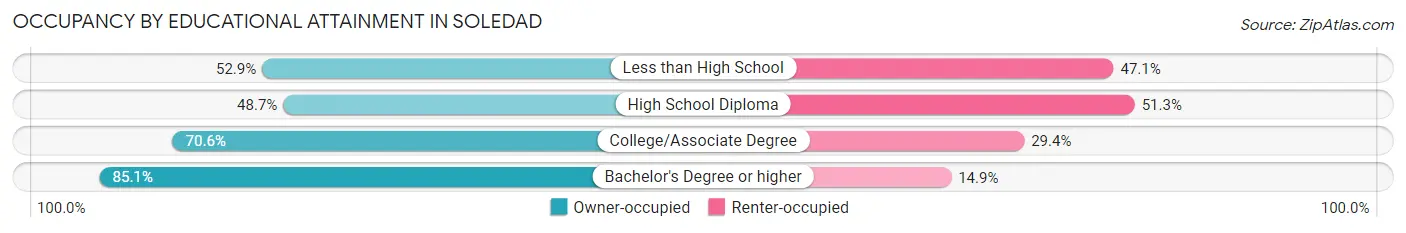
| Household Size | Owner-occupied | Renter-occupied |
| Less than High School | 929 (52.9%) | 826 (47.1%) |
| High School Diploma | 485 (48.7%) | 510 (51.3%) |
| College/Associate Degree | 782 (70.6%) | 325 (29.4%) |
| Bachelor's Degree or higher | 389 (85.1%) | 68 (14.9%) |
Occupancy by Age of Householder in Soledad
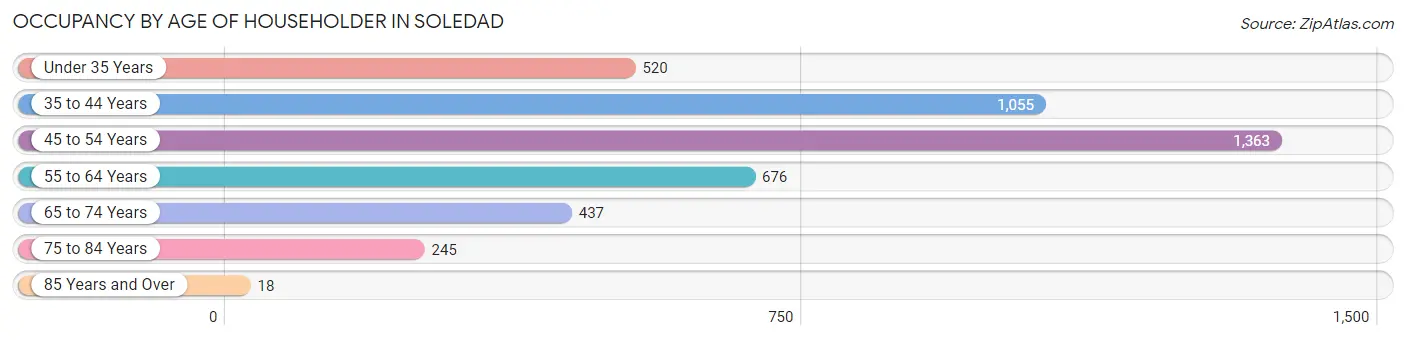
| Age Bracket | # Households | % Households |
| Under 35 Years | 520 | 12.0% |
| 35 to 44 Years | 1,055 | 24.5% |
| 45 to 54 Years | 1,363 | 31.6% |
| 55 to 64 Years | 676 | 15.7% |
| 65 to 74 Years | 437 | 10.1% |
| 75 to 84 Years | 245 | 5.7% |
| 85 Years and Over | 18 | 0.4% |
| Total | 4,314 | 100.0% |
Housing Finances in Soledad
Median Income by Occupancy in Soledad
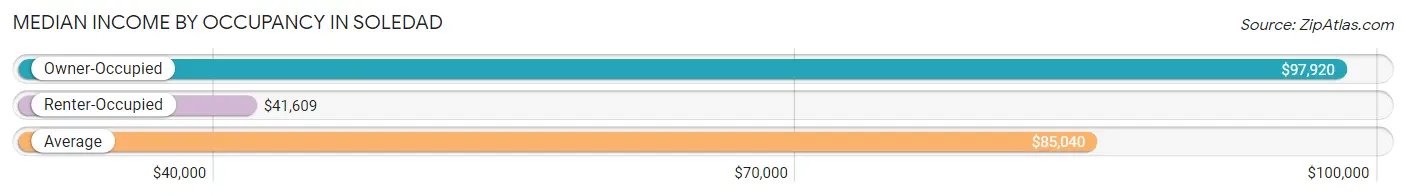
| Occupancy Type | # Households | Median Income |
| Owner-Occupied | 2,585 (59.9%) | $97,920 |
| Renter-Occupied | 1,729 (40.1%) | $41,609 |
| Average | 4,314 (100.0%) | $85,040 |
Occupancy by Householder Income Bracket in Soledad
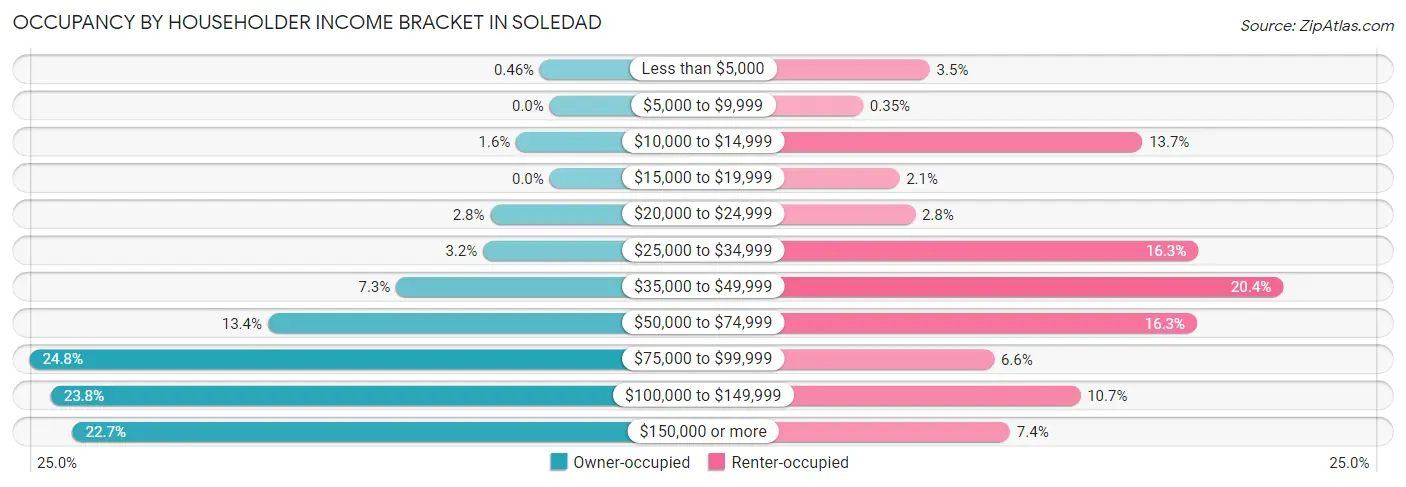
| Income Bracket | Owner-occupied | Renter-occupied |
| Less than $5,000 | 12 (0.5%) | 61 (3.5%) |
| $5,000 to $9,999 | 0 (0.0%) | 6 (0.4%) |
| $10,000 to $14,999 | 41 (1.6%) | 236 (13.7%) |
| $15,000 to $19,999 | 0 (0.0%) | 36 (2.1%) |
| $20,000 to $24,999 | 73 (2.8%) | 49 (2.8%) |
| $25,000 to $34,999 | 82 (3.2%) | 282 (16.3%) |
| $35,000 to $49,999 | 189 (7.3%) | 352 (20.4%) |
| $50,000 to $74,999 | 347 (13.4%) | 281 (16.3%) |
| $75,000 to $99,999 | 640 (24.8%) | 114 (6.6%) |
| $100,000 to $149,999 | 614 (23.7%) | 185 (10.7%) |
| $150,000 or more | 587 (22.7%) | 127 (7.3%) |
| Total | 2,585 (100.0%) | 1,729 (100.0%) |
Monthly Housing Cost Tiers in Soledad
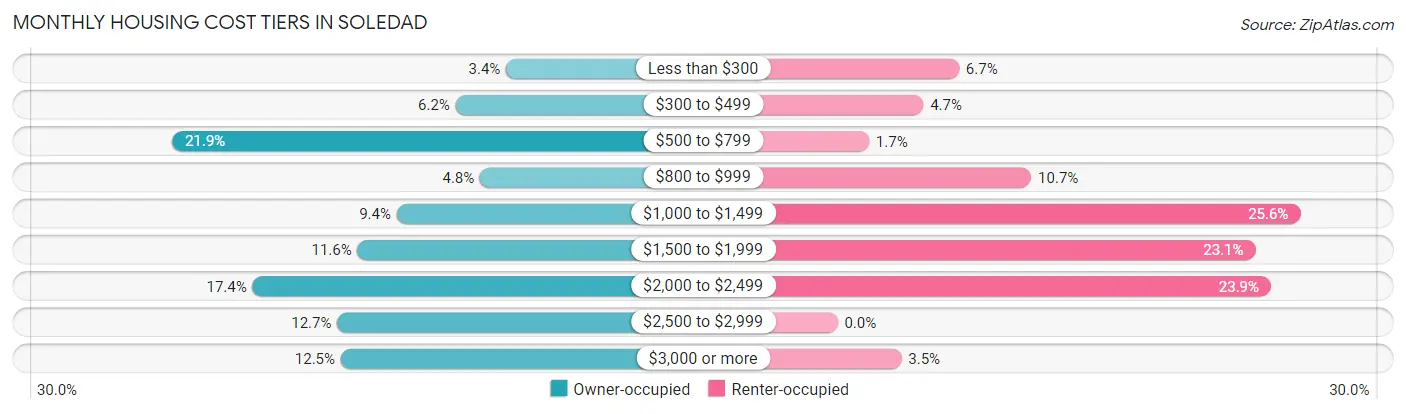
| Monthly Cost | Owner-occupied | Renter-occupied |
| Less than $300 | 88 (3.4%) | 116 (6.7%) |
| $300 to $499 | 160 (6.2%) | 82 (4.7%) |
| $500 to $799 | 565 (21.9%) | 30 (1.7%) |
| $800 to $999 | 125 (4.8%) | 185 (10.7%) |
| $1,000 to $1,499 | 244 (9.4%) | 442 (25.6%) |
| $1,500 to $1,999 | 300 (11.6%) | 399 (23.1%) |
| $2,000 to $2,499 | 450 (17.4%) | 414 (23.9%) |
| $2,500 to $2,999 | 329 (12.7%) | 0 (0.0%) |
| $3,000 or more | 324 (12.5%) | 61 (3.5%) |
| Total | 2,585 (100.0%) | 1,729 (100.0%) |
Physical Housing Characteristics in Soledad
Housing Structures in Soledad
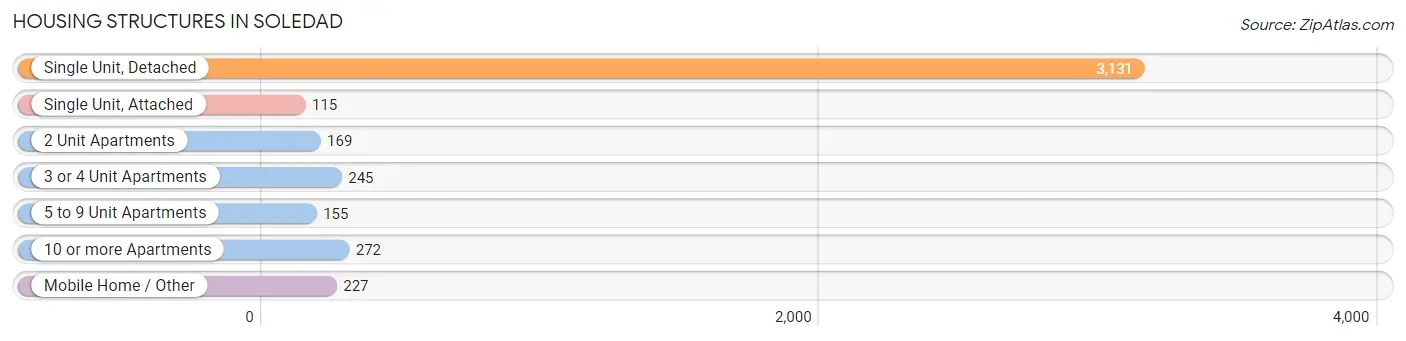
| Structure Type | # Housing Units | % Housing Units |
| Single Unit, Detached | 3,131 | 72.6% |
| Single Unit, Attached | 115 | 2.7% |
| 2 Unit Apartments | 169 | 3.9% |
| 3 or 4 Unit Apartments | 245 | 5.7% |
| 5 to 9 Unit Apartments | 155 | 3.6% |
| 10 or more Apartments | 272 | 6.3% |
| Mobile Home / Other | 227 | 5.3% |
| Total | 4,314 | 100.0% |
Housing Structures by Occupancy in Soledad
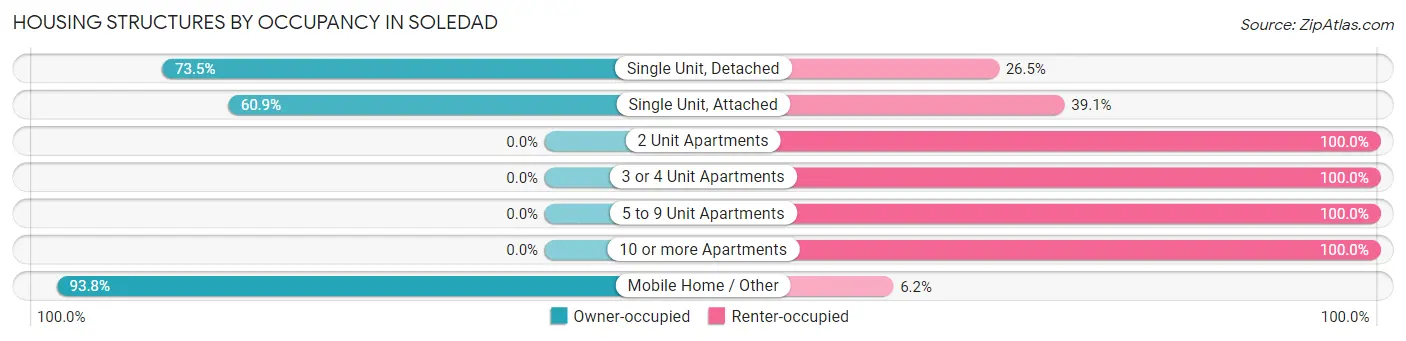
| Structure Type | Owner-occupied | Renter-occupied |
| Single Unit, Detached | 2,302 (73.5%) | 829 (26.5%) |
| Single Unit, Attached | 70 (60.9%) | 45 (39.1%) |
| 2 Unit Apartments | 0 (0.0%) | 169 (100.0%) |
| 3 or 4 Unit Apartments | 0 (0.0%) | 245 (100.0%) |
| 5 to 9 Unit Apartments | 0 (0.0%) | 155 (100.0%) |
| 10 or more Apartments | 0 (0.0%) | 272 (100.0%) |
| Mobile Home / Other | 213 (93.8%) | 14 (6.2%) |
| Total | 2,585 (59.9%) | 1,729 (40.1%) |
Housing Structures by Number of Rooms in Soledad
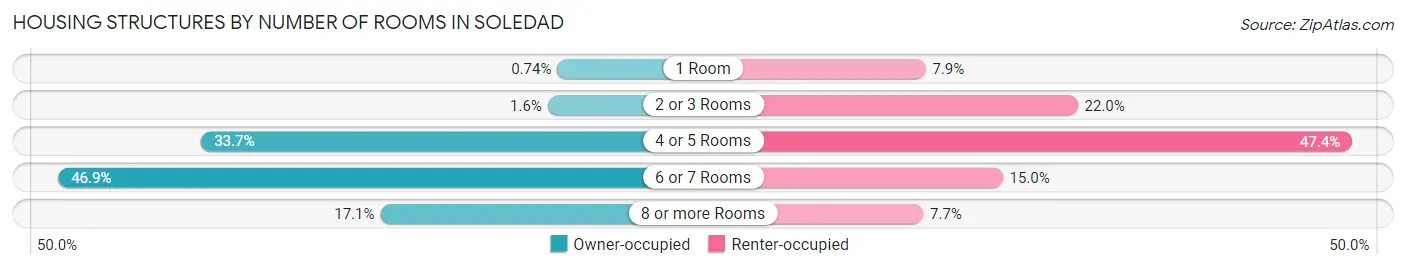
| Number of Rooms | Owner-occupied | Renter-occupied |
| 1 Room | 19 (0.7%) | 137 (7.9%) |
| 2 or 3 Rooms | 42 (1.6%) | 380 (22.0%) |
| 4 or 5 Rooms | 870 (33.7%) | 819 (47.4%) |
| 6 or 7 Rooms | 1,212 (46.9%) | 260 (15.0%) |
| 8 or more Rooms | 442 (17.1%) | 133 (7.7%) |
| Total | 2,585 (100.0%) | 1,729 (100.0%) |
Housing Structure by Heating Type in Soledad
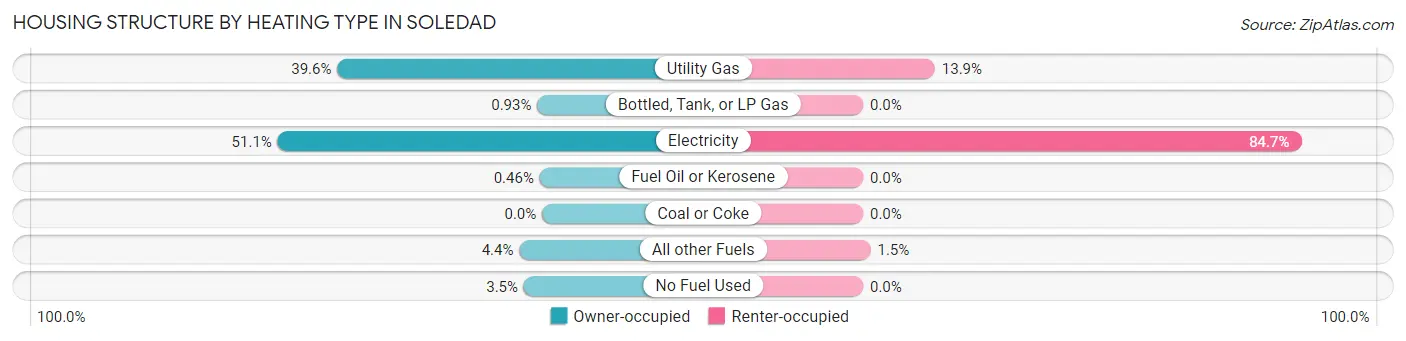
| Heating Type | Owner-occupied | Renter-occupied |
| Utility Gas | 1,023 (39.6%) | 240 (13.9%) |
| Bottled, Tank, or LP Gas | 24 (0.9%) | 0 (0.0%) |
| Electricity | 1,321 (51.1%) | 1,464 (84.7%) |
| Fuel Oil or Kerosene | 12 (0.5%) | 0 (0.0%) |
| Coal or Coke | 0 (0.0%) | 0 (0.0%) |
| All other Fuels | 114 (4.4%) | 25 (1.5%) |
| No Fuel Used | 91 (3.5%) | 0 (0.0%) |
| Total | 2,585 (100.0%) | 1,729 (100.0%) |
Household Vehicle Usage in Soledad
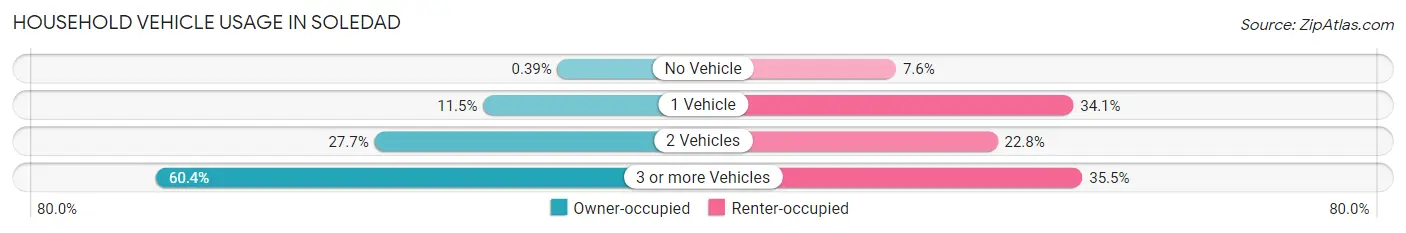
| Vehicles per Household | Owner-occupied | Renter-occupied |
| No Vehicle | 10 (0.4%) | 132 (7.6%) |
| 1 Vehicle | 297 (11.5%) | 590 (34.1%) |
| 2 Vehicles | 717 (27.7%) | 394 (22.8%) |
| 3 or more Vehicles | 1,561 (60.4%) | 613 (35.4%) |
| Total | 2,585 (100.0%) | 1,729 (100.0%) |
Real Estate & Mortgages in Soledad
Real Estate and Mortgage Overview in Soledad
| Characteristic | Without Mortgage | With Mortgage |
| Housing Units | 887 | 1,698 |
| Median Property Value | $430,400 | $578,700 |
| Median Household Income | $90,631 | $394 |
| Monthly Housing Costs | $589 | $324 |
| Real Estate Taxes | $2,568 | $31 |
Property Value by Mortgage Status in Soledad
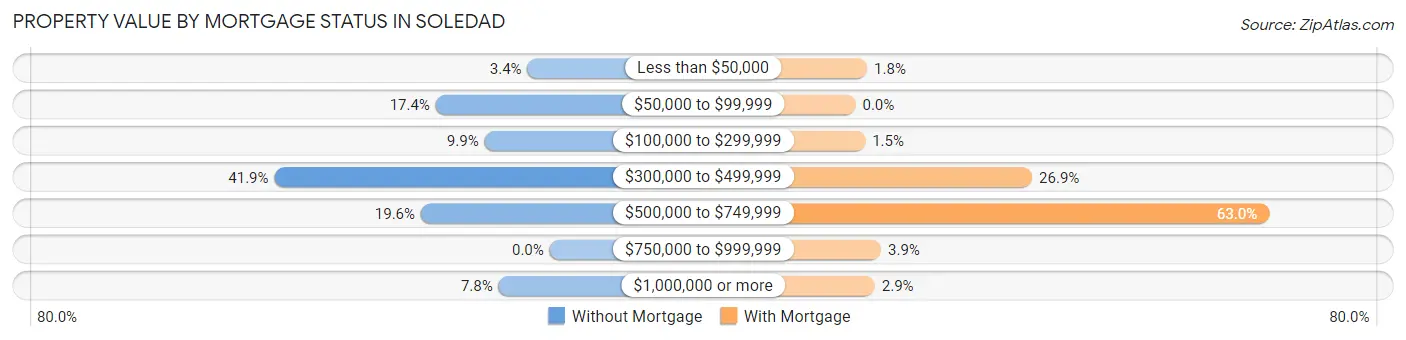
| Property Value | Without Mortgage | With Mortgage |
| Less than $50,000 | 30 (3.4%) | 30 (1.8%) |
| $50,000 to $99,999 | 154 (17.4%) | 0 (0.0%) |
| $100,000 to $299,999 | 88 (9.9%) | 25 (1.5%) |
| $300,000 to $499,999 | 372 (41.9%) | 457 (26.9%) |
| $500,000 to $749,999 | 174 (19.6%) | 1,070 (63.0%) |
| $750,000 to $999,999 | 0 (0.0%) | 66 (3.9%) |
| $1,000,000 or more | 69 (7.8%) | 50 (2.9%) |
| Total | 887 (100.0%) | 1,698 (100.0%) |
Household Income by Mortgage Status in Soledad
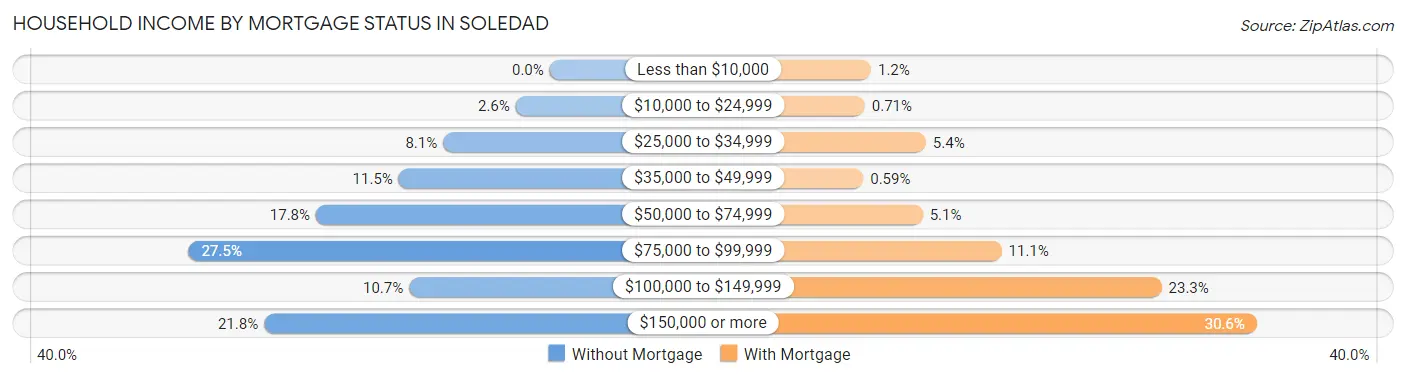
| Household Income | Without Mortgage | With Mortgage |
| Less than $10,000 | 0 (0.0%) | 20 (1.2%) |
| $10,000 to $24,999 | 23 (2.6%) | 12 (0.7%) |
| $25,000 to $34,999 | 72 (8.1%) | 91 (5.4%) |
| $35,000 to $49,999 | 102 (11.5%) | 10 (0.6%) |
| $50,000 to $74,999 | 158 (17.8%) | 87 (5.1%) |
| $75,000 to $99,999 | 244 (27.5%) | 189 (11.1%) |
| $100,000 to $149,999 | 95 (10.7%) | 396 (23.3%) |
| $150,000 or more | 193 (21.8%) | 519 (30.6%) |
| Total | 887 (100.0%) | 1,698 (100.0%) |
Property Value to Household Income Ratio in Soledad
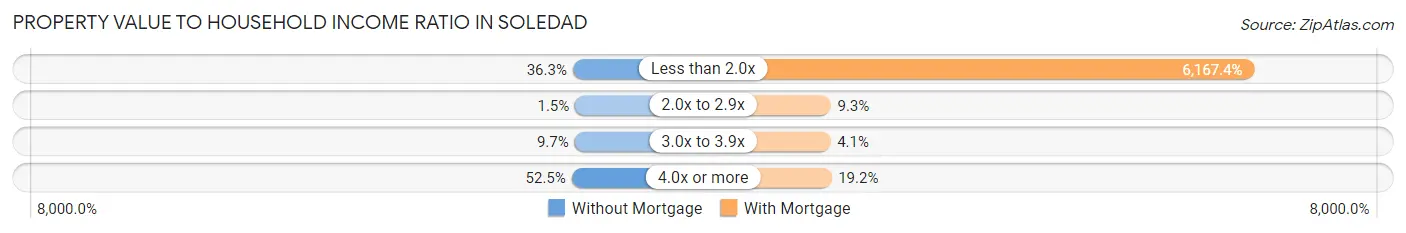
| Value-to-Income Ratio | Without Mortgage | With Mortgage |
| Less than 2.0x | 322 (36.3%) | 104,722 (6,167.4%) |
| 2.0x to 2.9x | 13 (1.5%) | 157 (9.2%) |
| 3.0x to 3.9x | 86 (9.7%) | 70 (4.1%) |
| 4.0x or more | 466 (52.5%) | 326 (19.2%) |
| Total | 887 (100.0%) | 1,698 (100.0%) |
Real Estate Taxes by Mortgage Status in Soledad
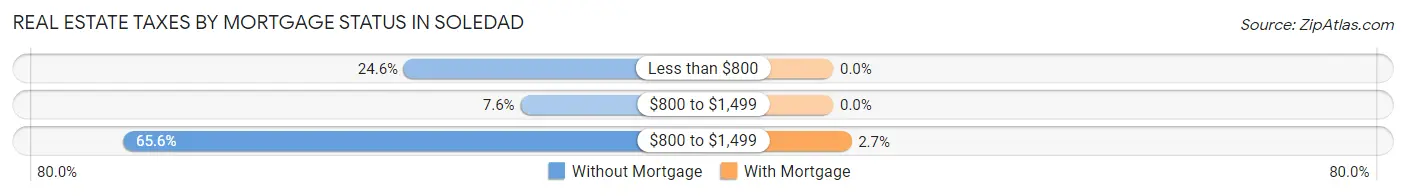
| Property Taxes | Without Mortgage | With Mortgage |
| Less than $800 | 218 (24.6%) | 0 (0.0%) |
| $800 to $1,499 | 67 (7.5%) | 0 (0.0%) |
| $800 to $1,499 | 582 (65.6%) | 45 (2.6%) |
| Total | 887 (100.0%) | 1,698 (100.0%) |
Health & Disability in Soledad
Health Insurance Coverage by Age in Soledad
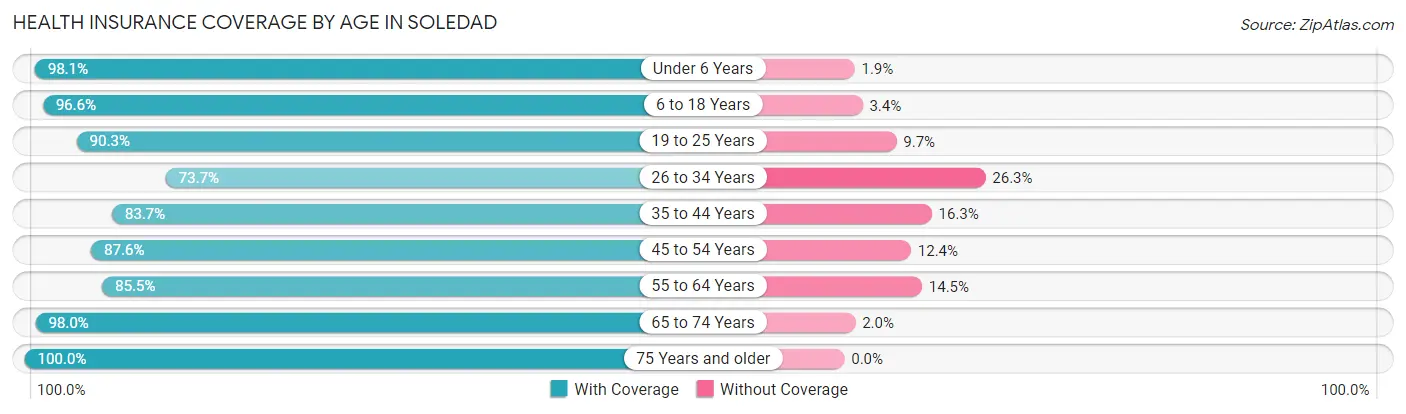
| Age Bracket | With Coverage | Without Coverage |
| Under 6 Years | 1,232 (98.1%) | 24 (1.9%) |
| 6 to 18 Years | 4,757 (96.6%) | 167 (3.4%) |
| 19 to 25 Years | 1,999 (90.3%) | 215 (9.7%) |
| 26 to 34 Years | 1,115 (73.7%) | 398 (26.3%) |
| 35 to 44 Years | 2,140 (83.7%) | 416 (16.3%) |
| 45 to 54 Years | 2,166 (87.6%) | 307 (12.4%) |
| 55 to 64 Years | 1,367 (85.5%) | 231 (14.5%) |
| 65 to 74 Years | 869 (98.0%) | 18 (2.0%) |
| 75 Years and older | 559 (100.0%) | 0 (0.0%) |
| Total | 16,204 (90.1%) | 1,776 (9.9%) |
Health Insurance Coverage by Citizenship Status in Soledad
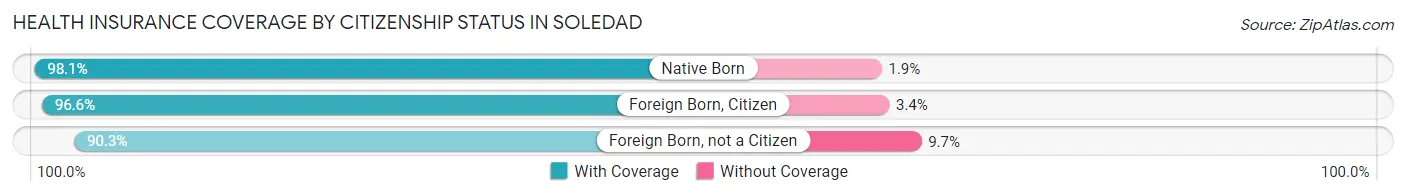
| Citizenship Status | With Coverage | Without Coverage |
| Native Born | 1,232 (98.1%) | 24 (1.9%) |
| Foreign Born, Citizen | 4,757 (96.6%) | 167 (3.4%) |
| Foreign Born, not a Citizen | 1,999 (90.3%) | 215 (9.7%) |
Health Insurance Coverage by Household Income in Soledad
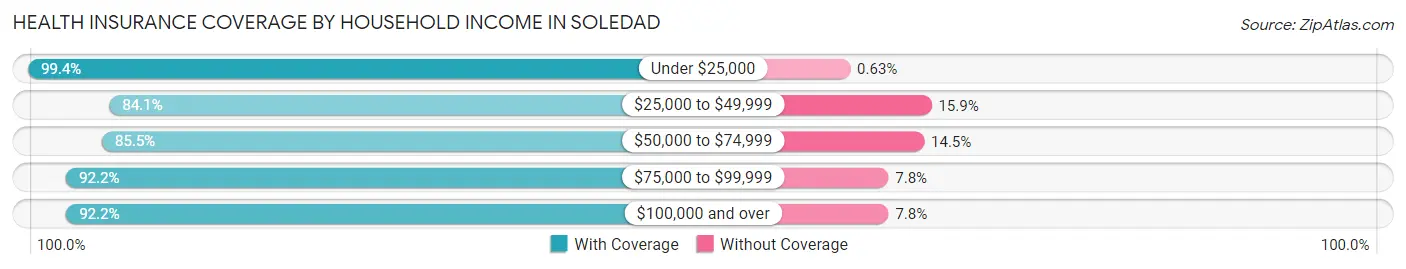
| Household Income | With Coverage | Without Coverage |
| Under $25,000 | 1,414 (99.4%) | 9 (0.6%) |
| $25,000 to $49,999 | 3,116 (84.1%) | 588 (15.9%) |
| $50,000 to $74,999 | 2,249 (85.5%) | 381 (14.5%) |
| $75,000 to $99,999 | 2,664 (92.2%) | 225 (7.8%) |
| $100,000 and over | 6,761 (92.2%) | 573 (7.8%) |
Public vs Private Health Insurance Coverage by Age in Soledad
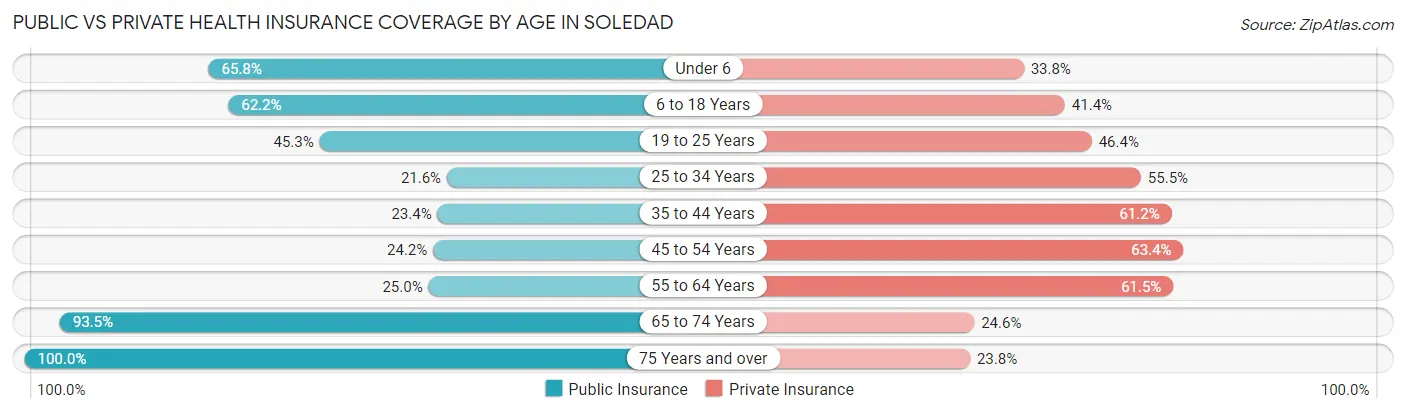
| Age Bracket | Public Insurance | Private Insurance |
| Under 6 | 827 (65.8%) | 424 (33.8%) |
| 6 to 18 Years | 3,062 (62.2%) | 2,039 (41.4%) |
| 19 to 25 Years | 1,002 (45.3%) | 1,027 (46.4%) |
| 25 to 34 Years | 327 (21.6%) | 840 (55.5%) |
| 35 to 44 Years | 597 (23.4%) | 1,564 (61.2%) |
| 45 to 54 Years | 598 (24.2%) | 1,568 (63.4%) |
| 55 to 64 Years | 400 (25.0%) | 983 (61.5%) |
| 65 to 74 Years | 829 (93.5%) | 218 (24.6%) |
| 75 Years and over | 559 (100.0%) | 133 (23.8%) |
| Total | 8,201 (45.6%) | 8,796 (48.9%) |
Disability Status by Sex by Age in Soledad
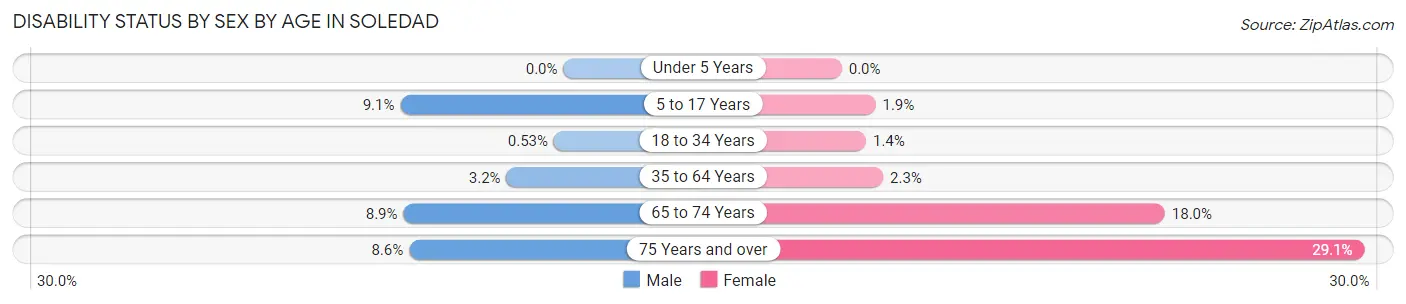
| Age Bracket | Male | Female |
| Under 5 Years | 0 (0.0%) | 0 (0.0%) |
| 5 to 17 Years | 242 (9.1%) | 41 (1.9%) |
| 18 to 34 Years | 10 (0.5%) | 29 (1.3%) |
| 35 to 64 Years | 111 (3.2%) | 72 (2.3%) |
| 65 to 74 Years | 32 (8.9%) | 95 (18.0%) |
| 75 Years and over | 25 (8.6%) | 78 (29.1%) |
Disability Class by Sex by Age in Soledad
Disability Class: Hearing Difficulty
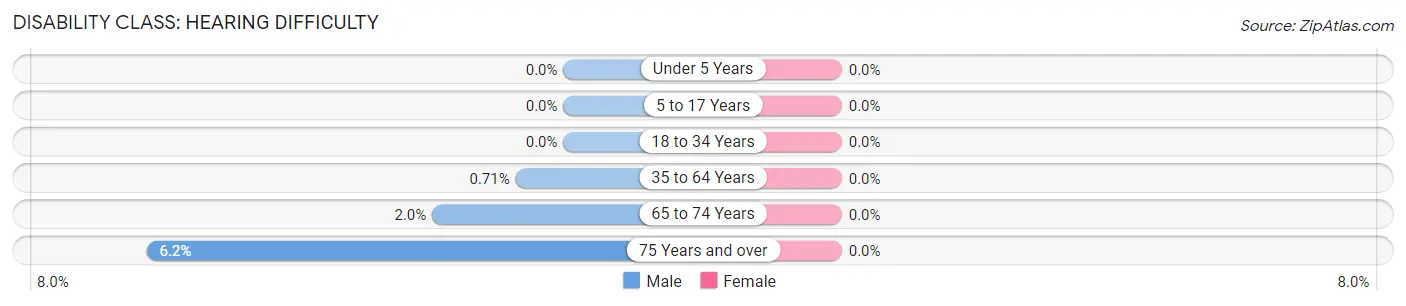
| Age Bracket | Male | Female |
| Under 5 Years | 0 (0.0%) | 0 (0.0%) |
| 5 to 17 Years | 0 (0.0%) | 0 (0.0%) |
| 18 to 34 Years | 0 (0.0%) | 0 (0.0%) |
| 35 to 64 Years | 25 (0.7%) | 0 (0.0%) |
| 65 to 74 Years | 7 (1.9%) | 0 (0.0%) |
| 75 Years and over | 18 (6.2%) | 0 (0.0%) |
Disability Class: Vision Difficulty
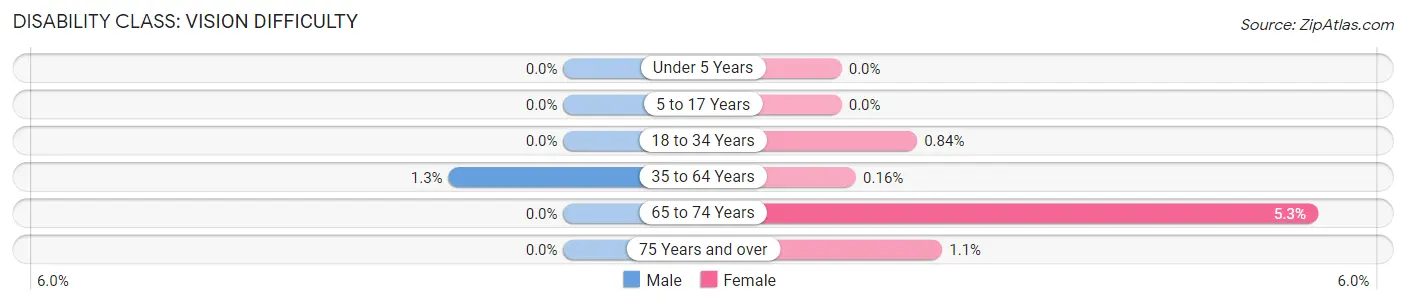
| Age Bracket | Male | Female |
| Under 5 Years | 0 (0.0%) | 0 (0.0%) |
| 5 to 17 Years | 0 (0.0%) | 0 (0.0%) |
| 18 to 34 Years | 0 (0.0%) | 18 (0.8%) |
| 35 to 64 Years | 45 (1.3%) | 5 (0.2%) |
| 65 to 74 Years | 0 (0.0%) | 28 (5.3%) |
| 75 Years and over | 0 (0.0%) | 3 (1.1%) |
Disability Class: Cognitive Difficulty
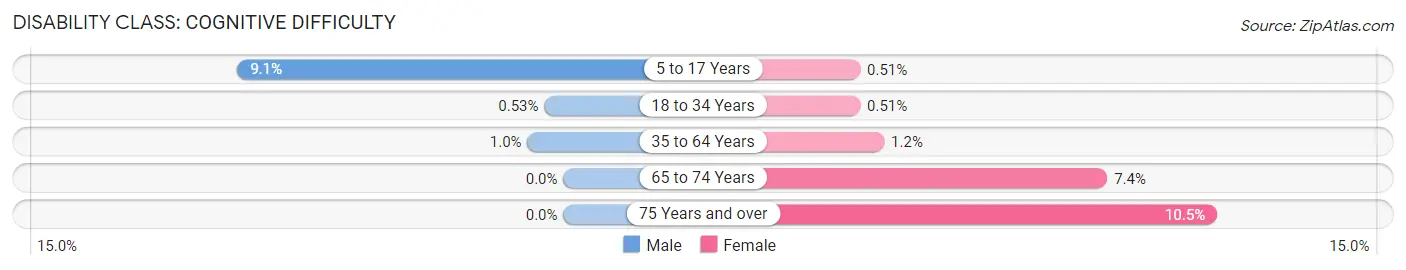
| Age Bracket | Male | Female |
| 5 to 17 Years | 242 (9.1%) | 11 (0.5%) |
| 18 to 34 Years | 10 (0.5%) | 11 (0.5%) |
| 35 to 64 Years | 35 (1.0%) | 37 (1.2%) |
| 65 to 74 Years | 0 (0.0%) | 39 (7.4%) |
| 75 Years and over | 0 (0.0%) | 28 (10.4%) |
Disability Class: Ambulatory Difficulty
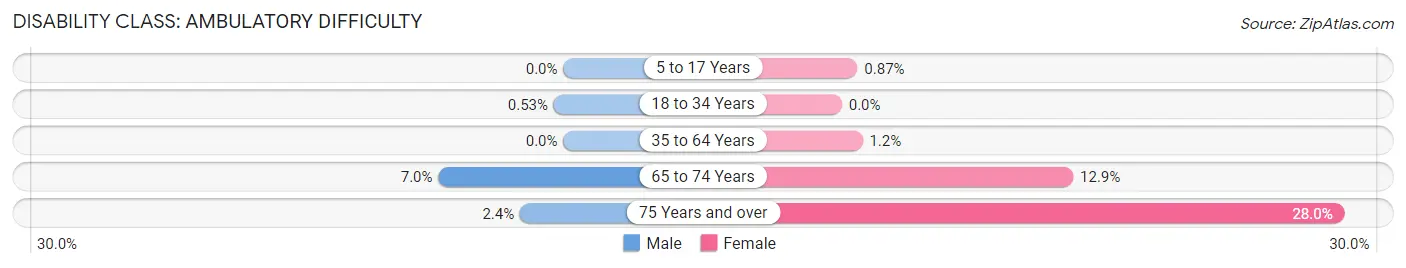
| Age Bracket | Male | Female |
| 5 to 17 Years | 0 (0.0%) | 19 (0.9%) |
| 18 to 34 Years | 10 (0.5%) | 0 (0.0%) |
| 35 to 64 Years | 0 (0.0%) | 36 (1.1%) |
| 65 to 74 Years | 25 (7.0%) | 68 (12.9%) |
| 75 Years and over | 7 (2.4%) | 75 (28.0%) |
Disability Class: Self-Care Difficulty
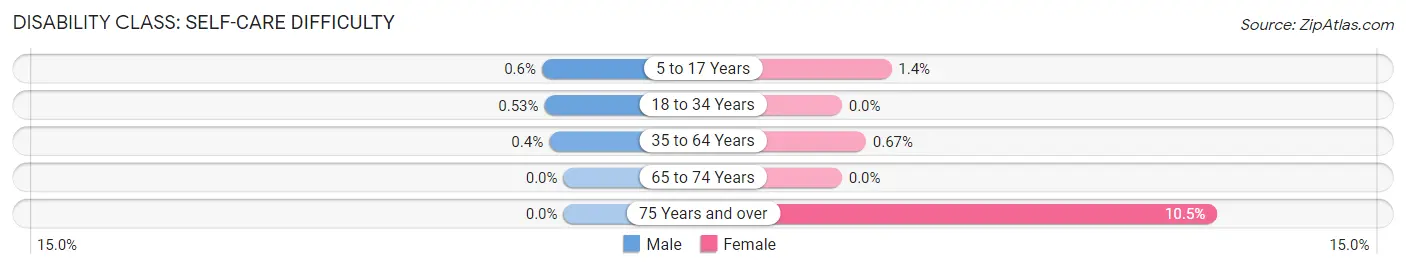
| Age Bracket | Male | Female |
| 5 to 17 Years | 16 (0.6%) | 30 (1.4%) |
| 18 to 34 Years | 10 (0.5%) | 0 (0.0%) |
| 35 to 64 Years | 14 (0.4%) | 21 (0.7%) |
| 65 to 74 Years | 0 (0.0%) | 0 (0.0%) |
| 75 Years and over | 0 (0.0%) | 28 (10.4%) |
Technology Access in Soledad
Computing Device Access in Soledad
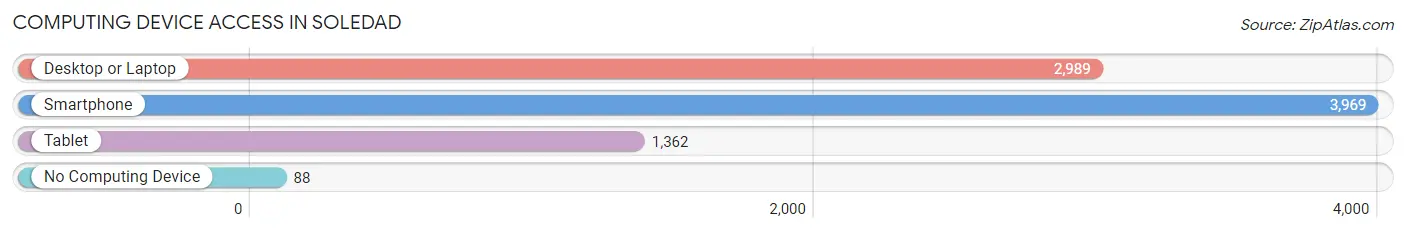
| Device Type | # Households | % Households |
| Desktop or Laptop | 2,989 | 69.3% |
| Smartphone | 3,969 | 92.0% |
| Tablet | 1,362 | 31.6% |
| No Computing Device | 88 | 2.0% |
| Total | 4,314 | 100.0% |
Internet Access in Soledad
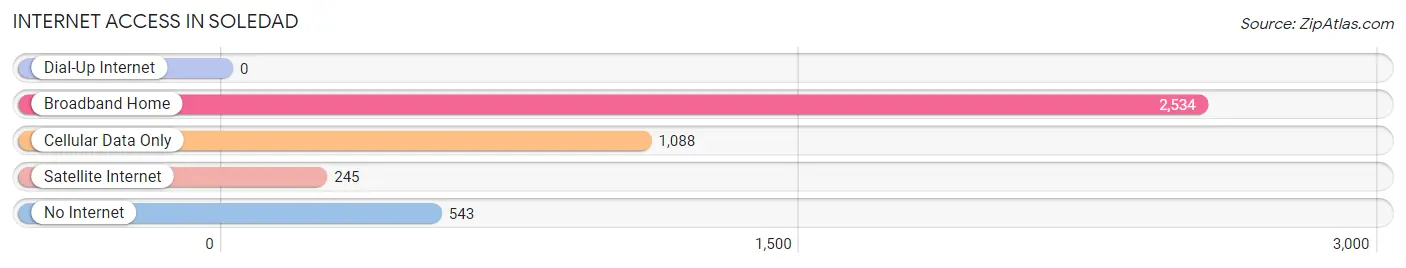
| Internet Type | # Households | % Households |
| Dial-Up Internet | 0 | 0.0% |
| Broadband Home | 2,534 | 58.7% |
| Cellular Data Only | 1,088 | 25.2% |
| Satellite Internet | 245 | 5.7% |
| No Internet | 543 | 12.6% |
| Total | 4,314 | 100.0% |
Soledad Summary
Soledad, California is a small city located in Monterey County, California. It is situated in the Salinas Valley, about 25 miles southeast of Salinas, the county seat. The city has a population of approximately 25,000 people and is part of the Salinas Metropolitan Statistical Area.
History
The area that is now Soledad was originally inhabited by the Ohlone people, who were hunter-gatherers. The first European settlers arrived in the area in the late 1700s, and the town was officially founded in 1834. The town was named after the Mission Nuestra Señora de la Soledad, which was established in 1791.
The town grew slowly until the arrival of the Southern Pacific Railroad in 1872. This brought an influx of settlers and businesses to the area, and the town began to grow rapidly. By the early 1900s, Soledad had become a thriving agricultural center, with many farms and ranches in the area.
In the 1950s, the town began to experience a population boom, as many people moved to the area to take advantage of the agricultural opportunities. This growth continued into the 1960s and 1970s, and the population of Soledad reached its peak in the 1980s.
Geography
Soledad is located in the Salinas Valley, which is part of the Central Coast region of California. The city is situated at an elevation of about 200 feet above sea level. The climate in the area is mild, with temperatures ranging from the mid-50s to the mid-80s throughout the year.
The city is bordered by the Salinas River to the north and the Gabilan Mountains to the east. The city is also located near the Pinnacles National Park, which is a popular destination for hikers and campers.
Economy
The economy of Soledad is largely based on agriculture. The city is home to many farms and ranches, and the surrounding area is known for its production of lettuce, broccoli, and other vegetables. The city is also home to several wineries, and the local wine industry is a major contributor to the economy.
In addition to agriculture, Soledad is home to several manufacturing and technology companies. The city is also home to a number of retail stores, restaurants, and other businesses.
Demographics
As of the 2010 census, the population of Soledad was 25,738. The racial makeup of the city was 57.3% White, 0.9% African American, 1.2% Native American, 1.3% Asian, 0.1% Pacific Islander, 36.2% from other races, and 3.0% from two or more races. Hispanic or Latino of any race were 63.2% of the population.
The median household income in Soledad was $45,845, and the median family income was $50,945. The per capita income was $19,845. About 17.2% of the population was below the poverty line.
Soledad is a small city with a diverse population and a strong agricultural economy. The city is home to many farms and ranches, and the local wine industry is a major contributor to the economy. The city is also home to several manufacturing and technology companies, as well as a number of retail stores, restaurants, and other businesses.
Common Questions
What is Per Capita Income in Soledad?
Per Capita income in Soledad is $18,573.
What is the Median Family Income in Soledad?
Median Family Income in Soledad is $86,956.
What is the Median Household income in Soledad?
Median Household Income in Soledad is $85,040.
What is Income or Wage Gap in Soledad?
Income or Wage Gap in Soledad is 8.9%.
Women in Soledad earn 91.1 cents for every dollar earned by a man.
What is Inequality or Gini Index in Soledad?
Inequality or Gini Index in Soledad is 0.39.
What is the Total Population of Soledad?
Total Population of Soledad is 24,781.
What is the Total Male Population of Soledad?
Total Male Population of Soledad is 16,112.
What is the Total Female Population of Soledad?
Total Female Population of Soledad is 8,669.
What is the Ratio of Males per 100 Females in Soledad?
There are 185.86 Males per 100 Females in Soledad.
What is the Ratio of Females per 100 Males in Soledad?
There are 53.80 Females per 100 Males in Soledad.
What is the Median Population Age in Soledad?
Median Population Age in Soledad is 35.6 Years.
What is the Average Family Size in Soledad
Average Family Size in Soledad is 4.4 People.
What is the Average Household Size in Soledad
Average Household Size in Soledad is 4.2 People.
How Large is the Labor Force in Soledad?
There are 7,634 People in the Labor Forcein in Soledad.
What is the Percentage of People in the Labor Force in Soledad?
39.1% of People are in the Labor Force in Soledad.
What is the Unemployment Rate in Soledad?
Unemployment Rate in Soledad is 2.9%.