Sierraville, CA Map & Demographics
Sierraville Map
Sierraville Overview
$16,111
PER CAPITA INCOME
$63,542
AVG FAMILY INCOME
0.33
INEQUALITY / GINI INDEX
227
TOTAL POPULATION
29
MALE POPULATION
198
FEMALE POPULATION
14.65
MALES / 100 FEMALES
682.76
FEMALES / 100 MALES
22.4
MEDIAN AGE
5.6
AVG FAMILY SIZE
3.2
AVG HOUSEHOLD SIZE
111
LABOR FORCE [ PEOPLE ]
59.7%
PERCENT IN LABOR FORCE
Sierraville Zip Codes
Sierraville Area Codes
Income in Sierraville
Income Overview in Sierraville
| Characteristic | Number | Measure |
| Per Capita Income | 227 | $16,111 |
| Median Family Income | 33 | $63,542 |
| Mean Family Income | 33 | $54,861 |
| Median Household Income | 69 | $0 |
| Mean Household Income | 69 | $34,786 |
| Income Deficit | 33 | $0 |
| Wage / Income Gap (%) | 227 | 0.00% |
| Wage / Income Gap ($) | 227 | 100.00¢ per $1 |
| Gini / Inequality Index | 227 | 0.33 |
Earnings by Sex in Sierraville
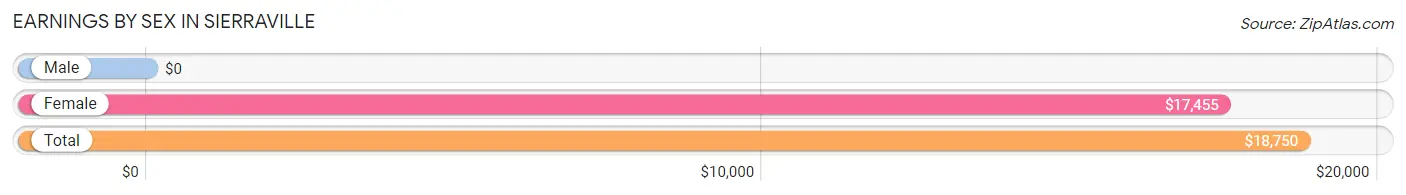
| Sex | Number | Average Earnings |
| Male | 2 (1.8%) | $0 |
| Female | 110 (98.2%) | $17,455 |
| Total | 112 (100.0%) | $18,750 |
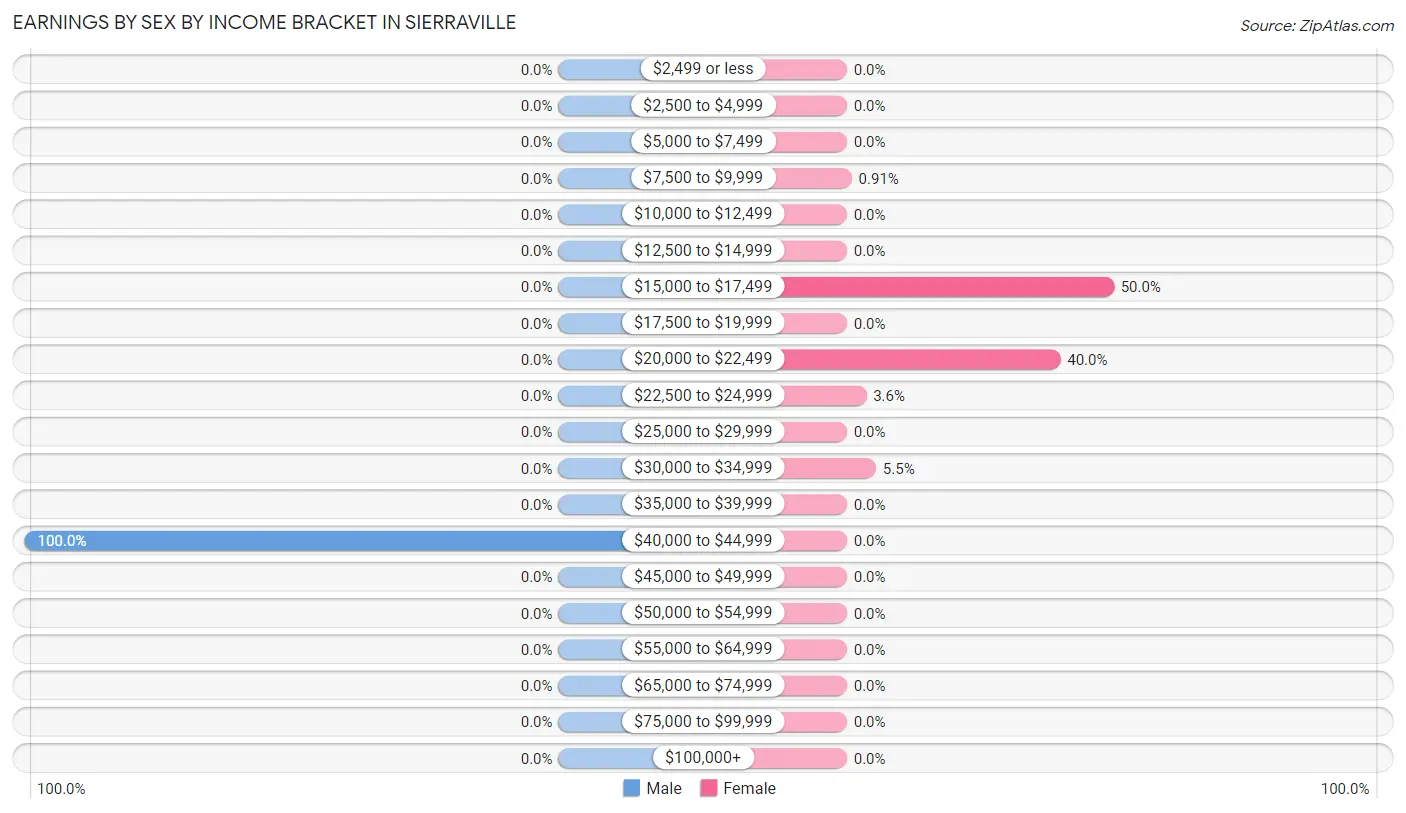
Earnings by Sex by Income Bracket in Sierraville
The most common earnings brackets in Sierraville are $40,000 to $44,999 for men (2 | 100.0%) and $15,000 to $17,499 for women (55 | 50.0%).
| Income | Male | Female |
| $2,499 or less | 0 (0.0%) | 0 (0.0%) |
| $2,500 to $4,999 | 0 (0.0%) | 0 (0.0%) |
| $5,000 to $7,499 | 0 (0.0%) | 0 (0.0%) |
| $7,500 to $9,999 | 0 (0.0%) | 1 (0.9%) |
| $10,000 to $12,499 | 0 (0.0%) | 0 (0.0%) |
| $12,500 to $14,999 | 0 (0.0%) | 0 (0.0%) |
| $15,000 to $17,499 | 0 (0.0%) | 55 (50.0%) |
| $17,500 to $19,999 | 0 (0.0%) | 0 (0.0%) |
| $20,000 to $22,499 | 0 (0.0%) | 44 (40.0%) |
| $22,500 to $24,999 | 0 (0.0%) | 4 (3.6%) |
| $25,000 to $29,999 | 0 (0.0%) | 0 (0.0%) |
| $30,000 to $34,999 | 0 (0.0%) | 6 (5.4%) |
| $35,000 to $39,999 | 0 (0.0%) | 0 (0.0%) |
| $40,000 to $44,999 | 2 (100.0%) | 0 (0.0%) |
| $45,000 to $49,999 | 0 (0.0%) | 0 (0.0%) |
| $50,000 to $54,999 | 0 (0.0%) | 0 (0.0%) |
| $55,000 to $64,999 | 0 (0.0%) | 0 (0.0%) |
| $65,000 to $74,999 | 0 (0.0%) | 0 (0.0%) |
| $75,000 to $99,999 | 0 (0.0%) | 0 (0.0%) |
| $100,000+ | 0 (0.0%) | 0 (0.0%) |
| Total | 2 (100.0%) | 110 (100.0%) |
Earnings by Sex by Educational Attainment in Sierraville
| Educational Attainment | Male Income | Female Income |
| Less than High School | - | - |
| High School Diploma | - | - |
| College or Associate's Degree | - | - |
| Bachelor's Degree | - | - |
| Graduate Degree | - | - |
| Total | - | - |
Family Income in Sierraville
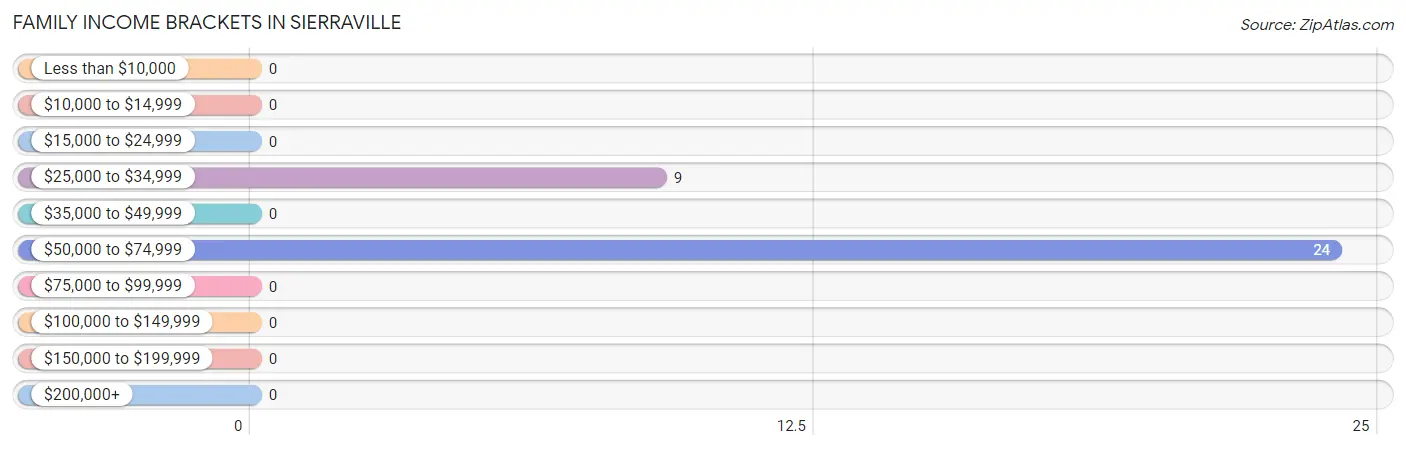
Family Income Brackets in Sierraville
According to the Sierraville family income data, there are 24 families falling into the $50,000 to $74,999 income range, which is the most common income bracket and makes up 72.7% of all families.
| Income Bracket | # Families | % Families |
| Less than $10,000 | 0 | 0.0% |
| $10,000 to $14,999 | 0 | 0.0% |
| $15,000 to $24,999 | 0 | 0.0% |
| $25,000 to $34,999 | 9 | 27.3% |
| $35,000 to $49,999 | 0 | 0.0% |
| $50,000 to $74,999 | 24 | 72.7% |
| $75,000 to $99,999 | 0 | 0.0% |
| $100,000 to $149,999 | 0 | 0.0% |
| $150,000 to $199,999 | 0 | 0.0% |
| $200,000+ | 0 | 0.0% |
Family Income by Famaliy Size in Sierraville
| Income Bracket | # Families | Median Income |
| 2-Person Families | 27 (81.8%) | $0 |
| 3-Person Families | 0 (0.0%) | $0 |
| 4-Person Families | 6 (18.2%) | $0 |
| 5-Person Families | 0 (0.0%) | $0 |
| 6-Person Families | 0 (0.0%) | $0 |
| 7+ Person Families | 0 (0.0%) | $0 |
| Total | 33 (100.0%) | $63,542 |
Family Income by Number of Earners in Sierraville
| Number of Earners | # Families | Median Income |
| No Earners | 9 (27.3%) | $0 |
| 1 Earner | 18 (54.5%) | $0 |
| 2 Earners | 0 (0.0%) | $0 |
| 3+ Earners | 6 (18.2%) | $0 |
| Total | 33 (100.0%) | $63,542 |
Household Income in Sierraville
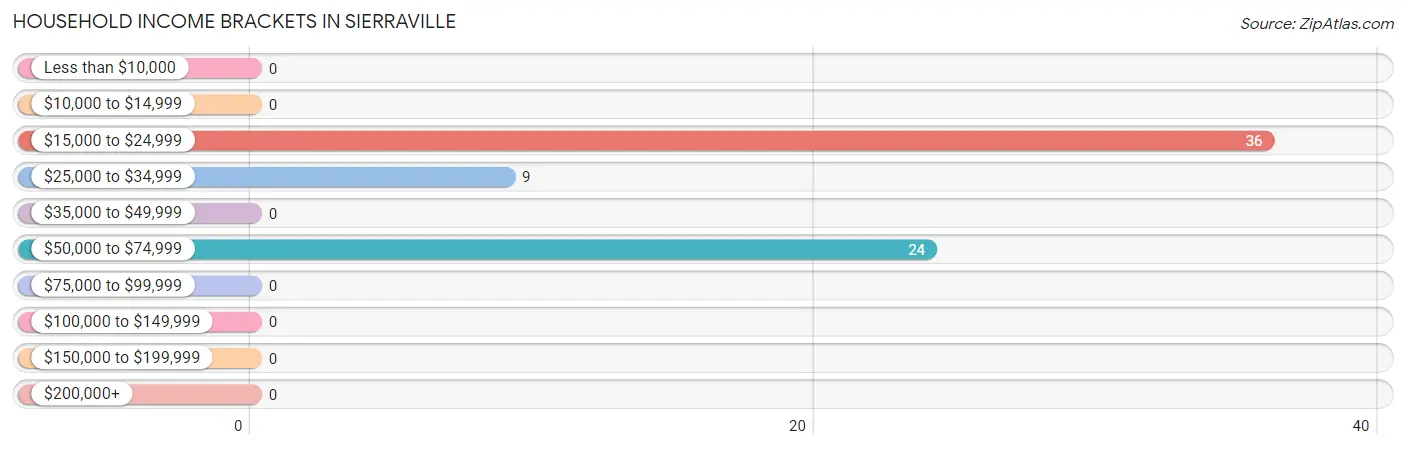
Household Income Brackets in Sierraville
With 36 households falling in the category, the $15,000 to $24,999 income range is the most frequent in Sierraville, accounting for 52.2% of all households.
| Income Bracket | # Households | % Households |
| Less than $10,000 | 0 | 0.0% |
| $10,000 to $14,999 | 0 | 0.0% |
| $15,000 to $24,999 | 36 | 52.2% |
| $25,000 to $34,999 | 9 | 13.0% |
| $35,000 to $49,999 | 0 | 0.0% |
| $50,000 to $74,999 | 24 | 34.8% |
| $75,000 to $99,999 | 0 | 0.0% |
| $100,000 to $149,999 | 0 | 0.0% |
| $150,000 to $199,999 | 0 | 0.0% |
| $200,000+ | 0 | 0.0% |
Household Income by Householder Age in Sierraville
| Income Bracket | # Households | Median Income |
| 15 to 24 Years | 0 (0.0%) | $0 |
| 25 to 44 Years | 6 (8.7%) | $0 |
| 45 to 64 Years | 18 (26.1%) | $0 |
| 65+ Years | 45 (65.2%) | $0 |
| Total | 69 (100.0%) | $0 |
Poverty in Sierraville
Income Below Poverty by Sex and Age in Sierraville
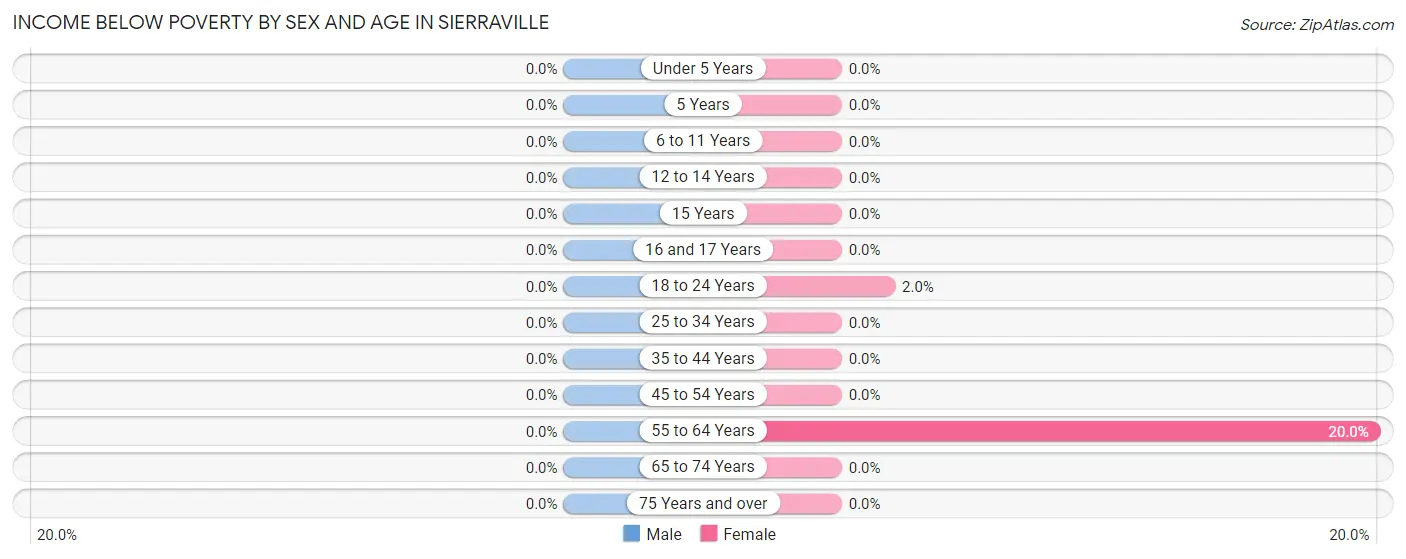
| Age Bracket | Male | Female |
| Under 5 Years | 0 (0.0%) | 0 (0.0%) |
| 5 Years | 0 (0.0%) | 0 (0.0%) |
| 6 to 11 Years | 0 (0.0%) | 0 (0.0%) |
| 12 to 14 Years | 0 (0.0%) | 0 (0.0%) |
| 15 Years | 0 (0.0%) | 0 (0.0%) |
| 16 and 17 Years | 0 (0.0%) | 0 (0.0%) |
| 18 to 24 Years | 0 (0.0%) | 2 (2.0%) |
| 25 to 34 Years | 0 (0.0%) | 0 (0.0%) |
| 35 to 44 Years | 0 (0.0%) | 0 (0.0%) |
| 45 to 54 Years | 0 (0.0%) | 0 (0.0%) |
| 55 to 64 Years | 0 (0.0%) | 1 (20.0%) |
| 65 to 74 Years | 0 (0.0%) | 0 (0.0%) |
| 75 Years and over | 0 (0.0%) | 0 (0.0%) |
| Total | 0 (0.0%) | 3 (1.5%) |
Income Above Poverty by Sex and Age in Sierraville
According to the poverty statistics in Sierraville, males aged 25 to 34 years and females aged 12 to 14 years are the age groups that are most secure financially, with 100.0% of males and 100.0% of females in these age groups living above the poverty line.
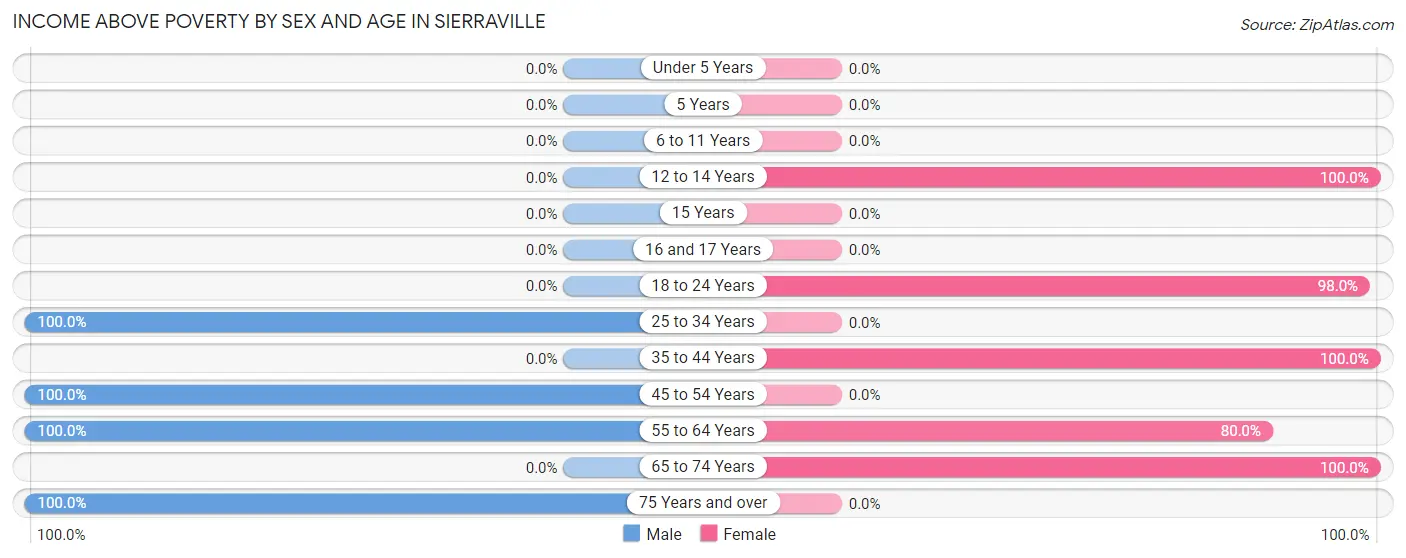
| Age Bracket | Male | Female |
| Under 5 Years | 0 (0.0%) | 0 (0.0%) |
| 5 Years | 0 (0.0%) | 0 (0.0%) |
| 6 to 11 Years | 0 (0.0%) | 0 (0.0%) |
| 12 to 14 Years | 0 (0.0%) | 41 (100.0%) |
| 15 Years | 0 (0.0%) | 0 (0.0%) |
| 16 and 17 Years | 0 (0.0%) | 0 (0.0%) |
| 18 to 24 Years | 0 (0.0%) | 99 (98.0%) |
| 25 to 34 Years | 1 (100.0%) | 0 (0.0%) |
| 35 to 44 Years | 0 (0.0%) | 6 (100.0%) |
| 45 to 54 Years | 1 (100.0%) | 0 (0.0%) |
| 55 to 64 Years | 18 (100.0%) | 4 (80.0%) |
| 65 to 74 Years | 0 (0.0%) | 45 (100.0%) |
| 75 Years and over | 9 (100.0%) | 0 (0.0%) |
| Total | 29 (100.0%) | 195 (98.5%) |
Income Below Poverty Among Married-Couple Families in Sierraville
| Children | Above Poverty | Below Poverty |
| No Children | 27 (100.0%) | 0 (0.0%) |
| 1 or 2 Children | 0 (0.0%) | 0 (0.0%) |
| 3 or 4 Children | 0 (0.0%) | 0 (0.0%) |
| 5 or more Children | 0 (0.0%) | 0 (0.0%) |
| Total | 27 (100.0%) | 0 (0.0%) |
Income Below Poverty Among Single-Parent Households in Sierraville
| Children | Single Father | Single Mother |
| No Children | 0 (0.0%) | 0 (0.0%) |
| 1 or 2 Children | 0 (0.0%) | 0 (0.0%) |
| 3 or 4 Children | 0 (0.0%) | 0 (0.0%) |
| 5 or more Children | 0 (0.0%) | 0 (0.0%) |
| Total | 0 (0.0%) | 0 (0.0%) |
Income Below Poverty Among Married-Couple vs Single-Parent Households in Sierraville
| Children | Married-Couple Families | Single-Parent Households |
| No Children | 0 (0.0%) | 0 (0.0%) |
| 1 or 2 Children | 0 (0.0%) | 0 (0.0%) |
| 3 or 4 Children | 0 (0.0%) | 0 (0.0%) |
| 5 or more Children | 0 (0.0%) | 0 (0.0%) |
| Total | 0 (0.0%) | 0 (0.0%) |
Race in Sierraville
The most populous races in Sierraville are Hispanic or Latino (168 | 74.0%), Some other Race (147 | 64.8%), and White / Caucasian (76 | 33.5%).
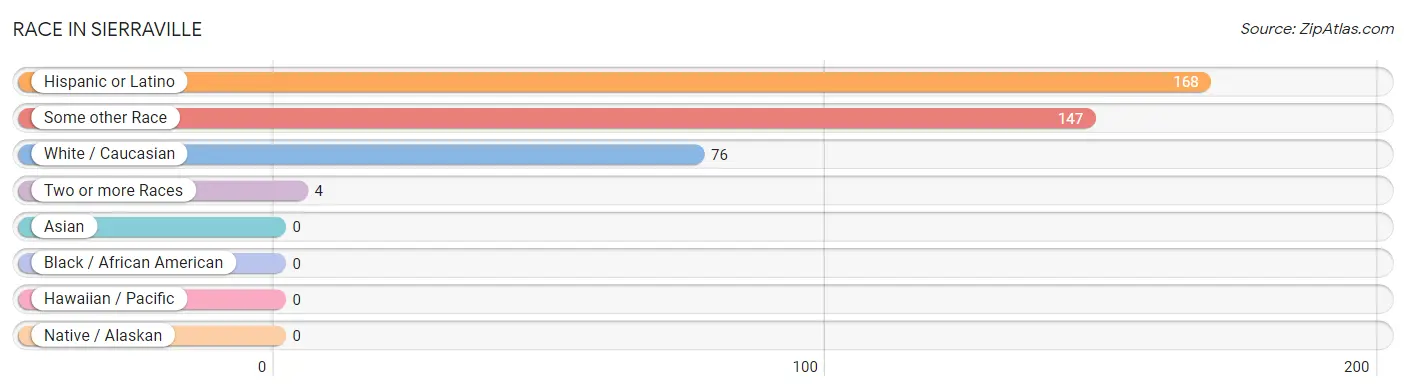
| Race | # Population | % Population |
| Asian | 0 | 0.0% |
| Black / African American | 0 | 0.0% |
| Hawaiian / Pacific | 0 | 0.0% |
| Hispanic or Latino | 168 | 74.0% |
| Native / Alaskan | 0 | 0.0% |
| White / Caucasian | 76 | 33.5% |
| Two or more Races | 4 | 1.8% |
| Some other Race | 147 | 64.8% |
| Total | 227 | 100.0% |
Ancestry in Sierraville
The most populous ancestries reported in Sierraville are Mexican (150 | 66.1%), Spanish (18 | 7.9%), German (10 | 4.4%), Norwegian (9 | 4.0%), and Potawatomi (4 | 1.8%), together accounting for 84.1% of all Sierraville residents.
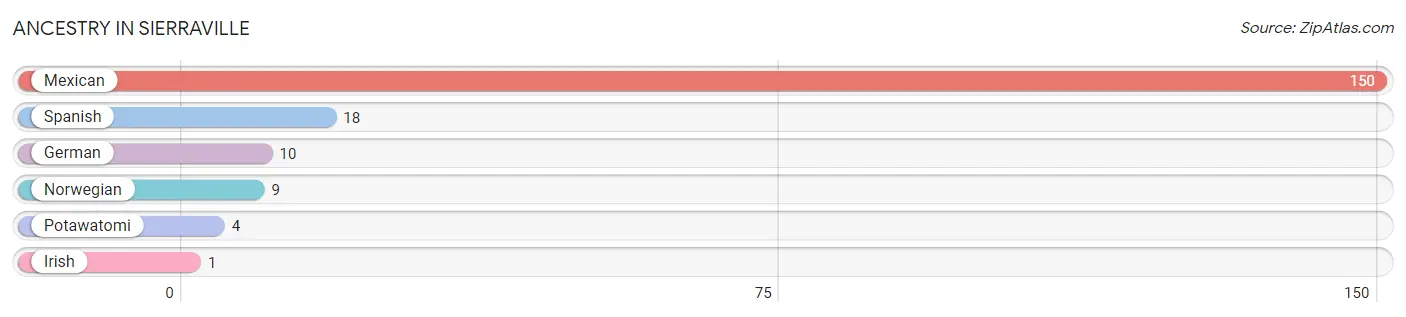
| Ancestry | # Population | % Population |
| German | 10 | 4.4% |
| Irish | 1 | 0.4% |
| Mexican | 150 | 66.1% |
| Norwegian | 9 | 4.0% |
| Potawatomi | 4 | 1.8% |
| Spanish | 18 | 7.9% | View All 6 Rows |
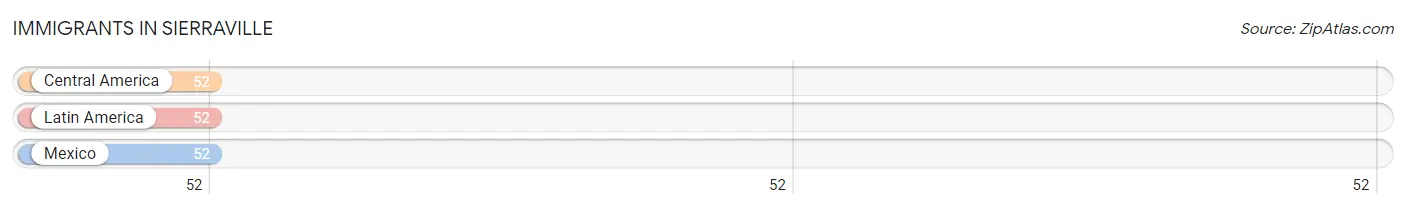
Immigrants in Sierraville
The most numerous immigrant groups reported in Sierraville came from Central America (52 | 22.9%), Latin America (52 | 22.9%), and Mexico (52 | 22.9%), together accounting for 68.7% of all Sierraville residents.
| Immigration Origin | # Population | % Population |
| Central America | 52 | 22.9% |
| Latin America | 52 | 22.9% |
| Mexico | 52 | 22.9% | View All 3 Rows |
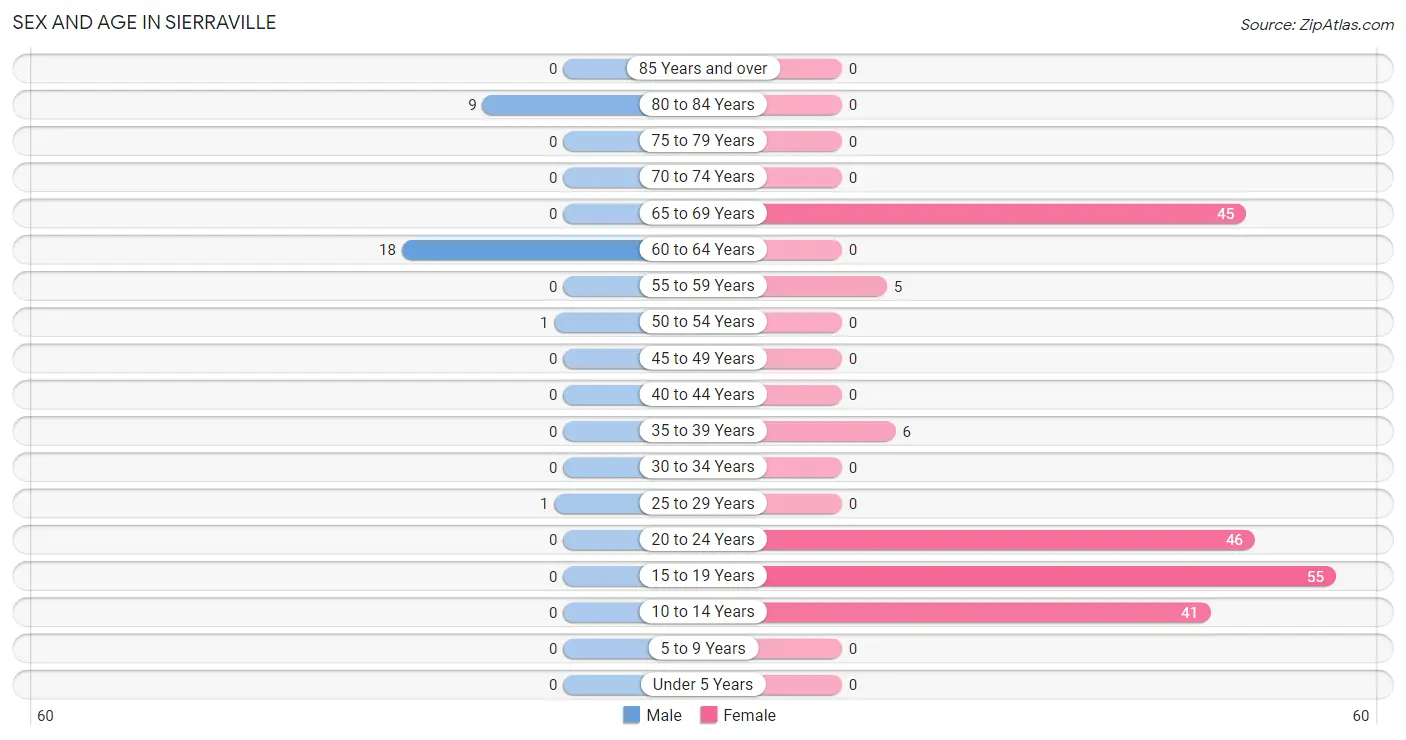
Sex and Age in Sierraville
Sex and Age in Sierraville
The most populous age groups in Sierraville are 60 to 64 Years (18 | 62.1%) for men and 15 to 19 Years (55 | 27.8%) for women.
| Age Bracket | Male | Female |
| Under 5 Years | 0 (0.0%) | 0 (0.0%) |
| 5 to 9 Years | 0 (0.0%) | 0 (0.0%) |
| 10 to 14 Years | 0 (0.0%) | 41 (20.7%) |
| 15 to 19 Years | 0 (0.0%) | 55 (27.8%) |
| 20 to 24 Years | 0 (0.0%) | 46 (23.2%) |
| 25 to 29 Years | 1 (3.5%) | 0 (0.0%) |
| 30 to 34 Years | 0 (0.0%) | 0 (0.0%) |
| 35 to 39 Years | 0 (0.0%) | 6 (3.0%) |
| 40 to 44 Years | 0 (0.0%) | 0 (0.0%) |
| 45 to 49 Years | 0 (0.0%) | 0 (0.0%) |
| 50 to 54 Years | 1 (3.5%) | 0 (0.0%) |
| 55 to 59 Years | 0 (0.0%) | 5 (2.5%) |
| 60 to 64 Years | 18 (62.1%) | 0 (0.0%) |
| 65 to 69 Years | 0 (0.0%) | 45 (22.7%) |
| 70 to 74 Years | 0 (0.0%) | 0 (0.0%) |
| 75 to 79 Years | 0 (0.0%) | 0 (0.0%) |
| 80 to 84 Years | 9 (31.0%) | 0 (0.0%) |
| 85 Years and over | 0 (0.0%) | 0 (0.0%) |
| Total | 29 (100.0%) | 198 (100.0%) |
Families and Households in Sierraville
Median Family Size in Sierraville
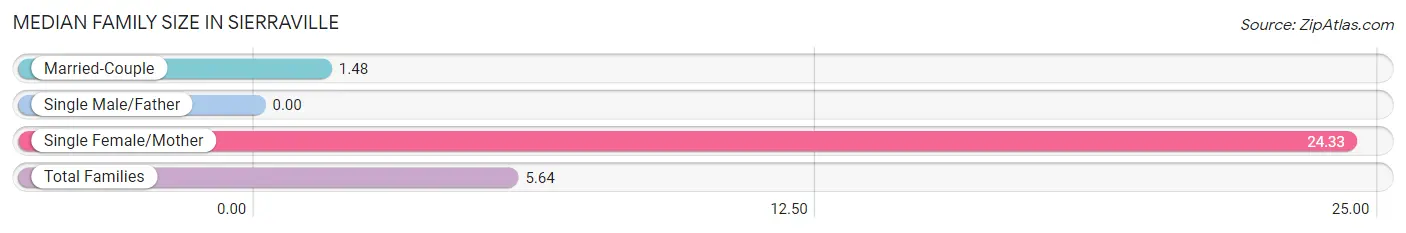
| Family Type | # Families | Family Size |
| Married-Couple | 27 (81.8%) | 1.48 |
| Single Male/Father | 0 (0.0%) | - |
| Single Female/Mother | 6 (18.2%) | 24.33 |
| Total Families | 33 (100.0%) | 5.64 |
Median Household Size in Sierraville
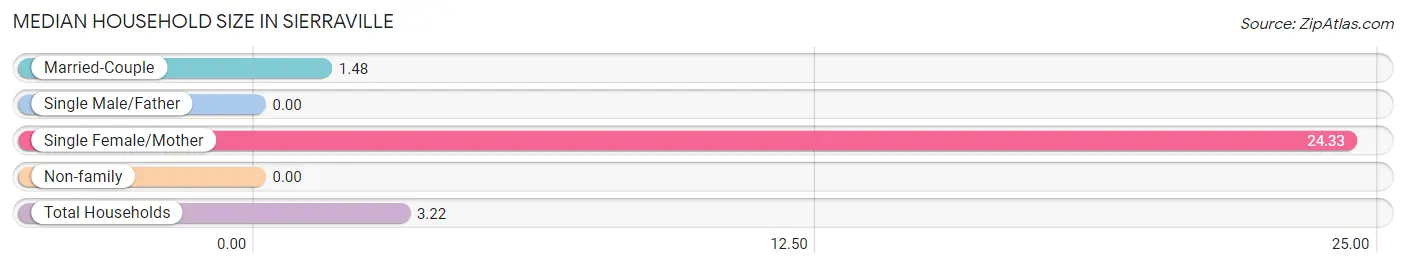
| Household Type | # Households | Household Size |
| Married-Couple | 27 (39.1%) | 1.48 |
| Single Male/Father | 0 (0.0%) | - |
| Single Female/Mother | 6 (8.7%) | 24.33 |
| Non-family | 36 (52.2%) | - |
| Total Households | 69 (100.0%) | 3.22 |
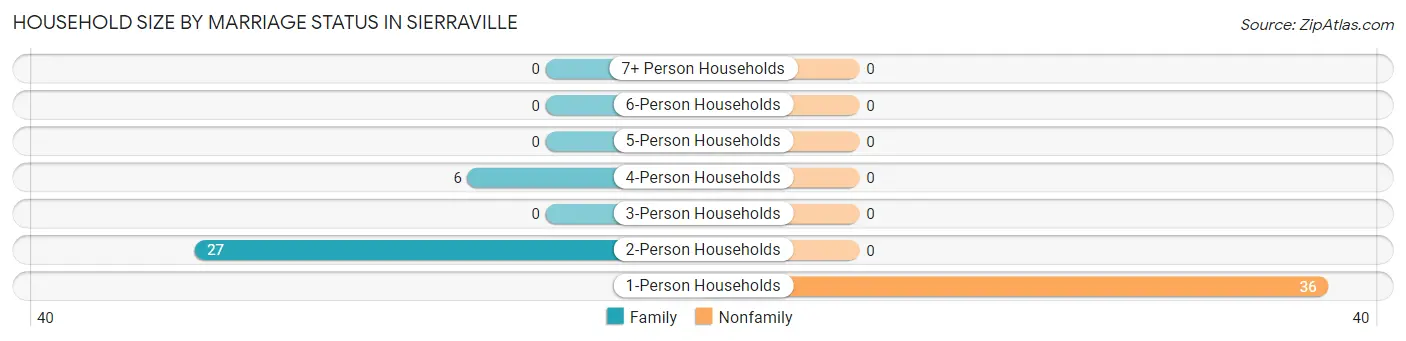
Household Size by Marriage Status in Sierraville
Out of a total of 69 households in Sierraville, 33 (47.8%) are family households, while 36 (52.2%) are nonfamily households. The most numerous type of family households are 2-person households, comprising 27, and the most common type of nonfamily households are 1-person households, comprising 36.
| Household Size | Family Households | Nonfamily Households |
| 1-Person Households | - | 36 (52.2%) |
| 2-Person Households | 27 (39.1%) | 0 (0.0%) |
| 3-Person Households | 0 (0.0%) | 0 (0.0%) |
| 4-Person Households | 6 (8.7%) | 0 (0.0%) |
| 5-Person Households | 0 (0.0%) | 0 (0.0%) |
| 6-Person Households | 0 (0.0%) | 0 (0.0%) |
| 7+ Person Households | 0 (0.0%) | 0 (0.0%) |
| Total | 33 (47.8%) | 36 (52.2%) |
Female Fertility in Sierraville
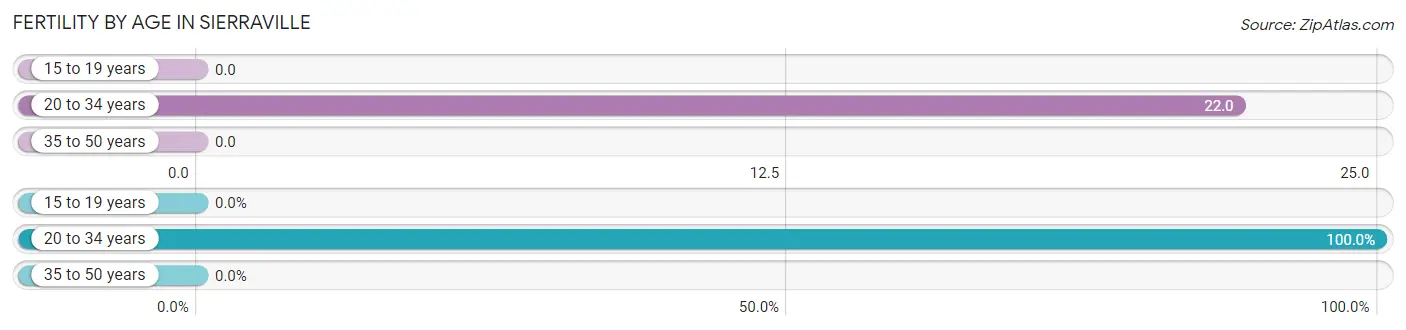
Fertility by Age in Sierraville
Average fertility rate in Sierraville is 9.0 births per 1,000 women. Women in the age bracket of 20 to 34 years have the highest fertility rate with 22.0 births per 1,000 women. Women in the age bracket of 20 to 34 years acount for 100.0% of all women with births.
| Age Bracket | Women with Births | Births / 1,000 Women |
| 15 to 19 years | 0 (0.0%) | 0.0 |
| 20 to 34 years | 1 (100.0%) | 22.0 |
| 35 to 50 years | 0 (0.0%) | 0.0 |
| Total | 1 (100.0%) | 9.0 |
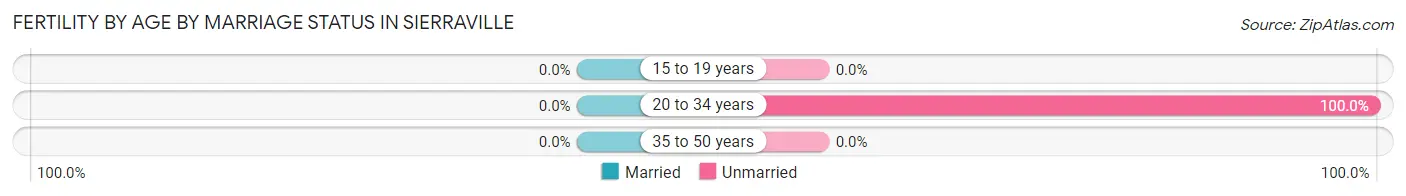
Fertility by Age by Marriage Status in Sierraville
| Age Bracket | Married | Unmarried |
| 15 to 19 years | 0 (0.0%) | 0 (0.0%) |
| 20 to 34 years | 0 (0.0%) | 1 (100.0%) |
| 35 to 50 years | 0 (0.0%) | 0 (0.0%) |
| Total | 0 (0.0%) | 1 (100.0%) |
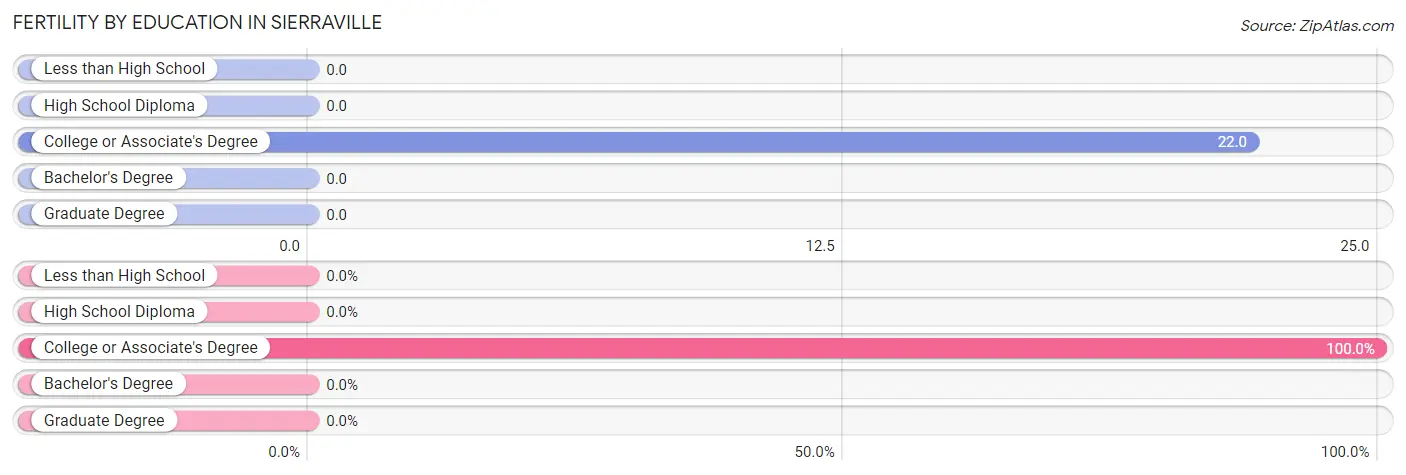
Fertility by Education in Sierraville
| Educational Attainment | Women with Births | Births / 1,000 Women |
| Less than High School | 0 (0.0%) | 0.0 |
| High School Diploma | 0 (0.0%) | 0.0 |
| College or Associate's Degree | 1 (100.0%) | 22.0 |
| Bachelor's Degree | 0 (0.0%) | 0.0 |
| Graduate Degree | 0 (0.0%) | 0.0 |
| Total | 1 (100.0%) | 9.0 |
Fertility by Education by Marriage Status in Sierraville
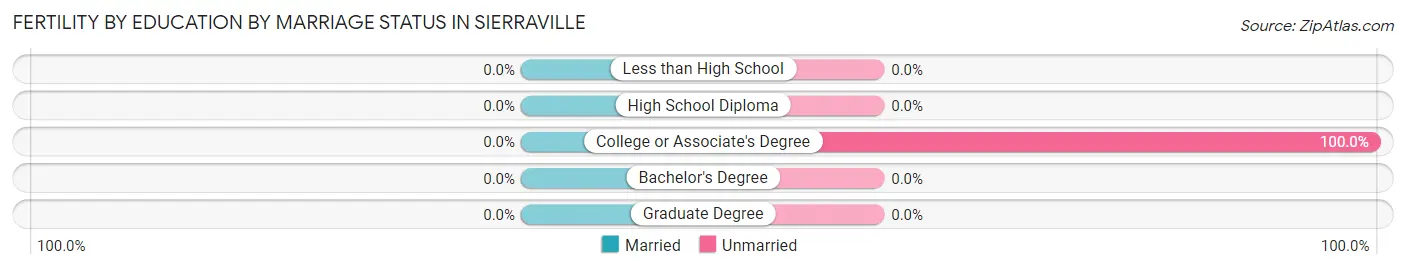
| Educational Attainment | Married | Unmarried |
| Less than High School | 0 (0.0%) | 0 (0.0%) |
| High School Diploma | 0 (0.0%) | 0 (0.0%) |
| College or Associate's Degree | 0 (0.0%) | 1 (100.0%) |
| Bachelor's Degree | 0 (0.0%) | 0 (0.0%) |
| Graduate Degree | 0 (0.0%) | 0 (0.0%) |
| Total | 0 (0.0%) | 1 (100.0%) |
Employment Characteristics in Sierraville
Employment by Class of Employer in Sierraville
Among the 111 employed individuals in Sierraville, private company employees (110 | 99.1%), and federal government employees (1 | 0.9%) make up the most common classes of employment.
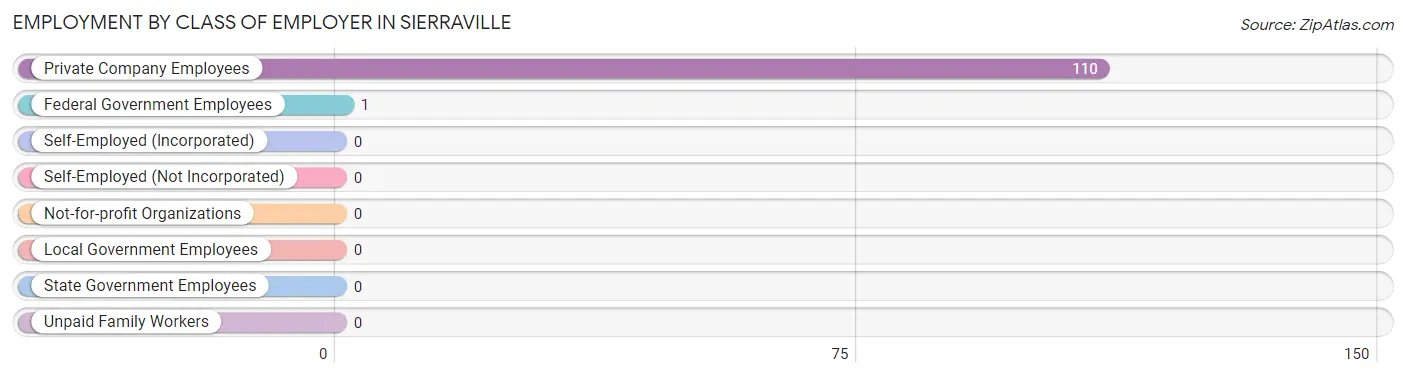
| Employer Class | # Employees | % Employees |
| Private Company Employees | 110 | 99.1% |
| Self-Employed (Incorporated) | 0 | 0.0% |
| Self-Employed (Not Incorporated) | 0 | 0.0% |
| Not-for-profit Organizations | 0 | 0.0% |
| Local Government Employees | 0 | 0.0% |
| State Government Employees | 0 | 0.0% |
| Federal Government Employees | 1 | 0.9% |
| Unpaid Family Workers | 0 | 0.0% |
| Total | 111 | 100.0% |
Employment Status by Age in Sierraville
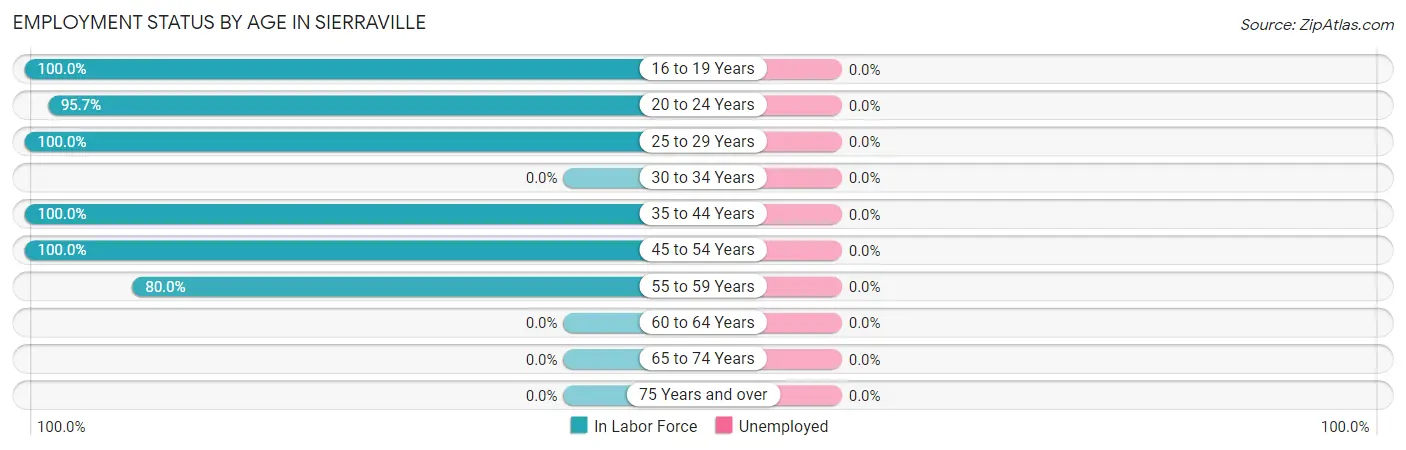
| Age Bracket | In Labor Force | Unemployed |
| 16 to 19 Years | 55 (100.0%) | 0 (0.0%) |
| 20 to 24 Years | 44 (95.7%) | 0 (0.0%) |
| 25 to 29 Years | 1 (100.0%) | 0 (0.0%) |
| 30 to 34 Years | 0 (0.0%) | 0 (0.0%) |
| 35 to 44 Years | 6 (100.0%) | 0 (0.0%) |
| 45 to 54 Years | 1 (100.0%) | 0 (0.0%) |
| 55 to 59 Years | 4 (80.0%) | 0 (0.0%) |
| 60 to 64 Years | 0 (0.0%) | 0 (0.0%) |
| 65 to 74 Years | 0 (0.0%) | 0 (0.0%) |
| 75 Years and over | 0 (0.0%) | 0 (0.0%) |
| Total | 111 (59.7%) | 0 (0.0%) |
Employment Status by Educational Attainment in Sierraville
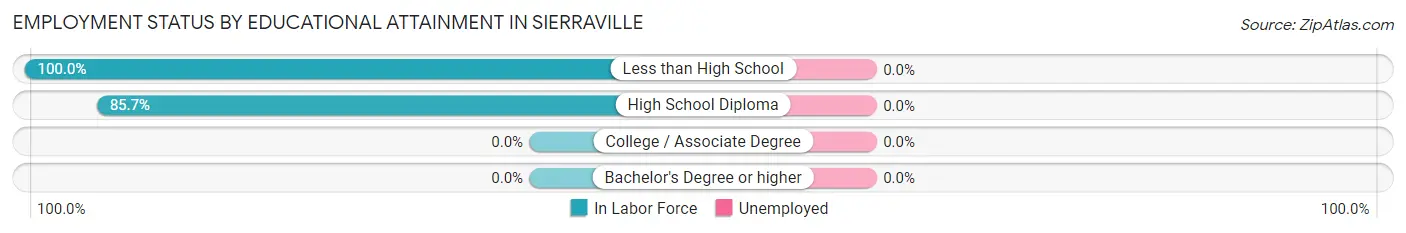
| Educational Attainment | In Labor Force | Unemployed |
| Less than High School | 6 (100.0%) | 0 (0.0%) |
| High School Diploma | 6 (85.7%) | 0 (0.0%) |
| College / Associate Degree | 0 (0.0%) | 0 (0.0%) |
| Bachelor's Degree or higher | 0 (0.0%) | 0 (0.0%) |
| Total | 12 (38.7%) | 0 (0.0%) |
Employment Occupations by Sex in Sierraville
Management, Business, Science and Arts Occupations
The most common Management, Business, Science and Arts occupations in Sierraville are , and Management (4 | 3.6%).
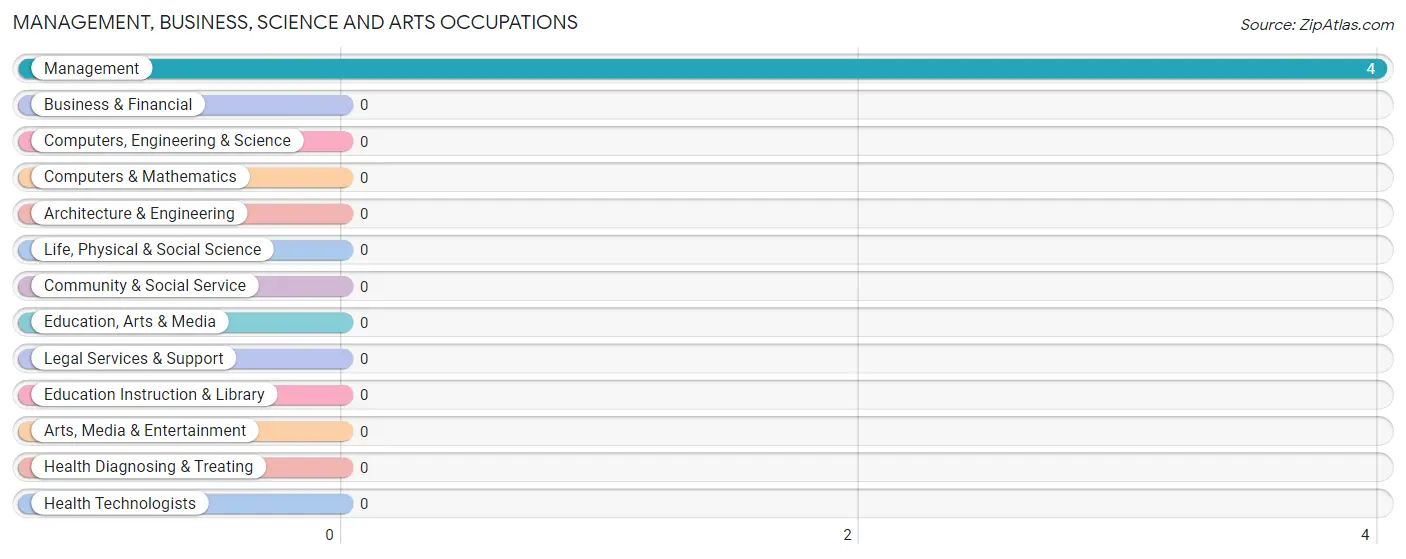
Management, Business, Science and Arts Occupations by Sex
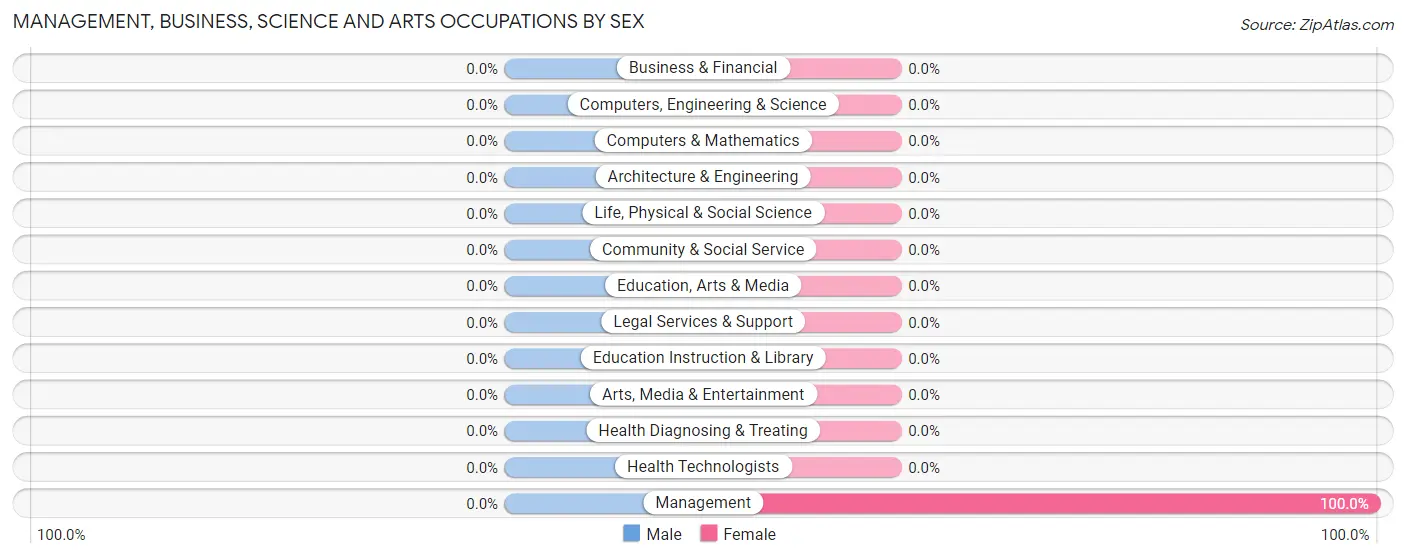
| Occupation | Male | Female |
| Management | 0 (0.0%) | 4 (100.0%) |
| Business & Financial | 0 (0.0%) | 0 (0.0%) |
| Computers, Engineering & Science | 0 (0.0%) | 0 (0.0%) |
| Computers & Mathematics | 0 (0.0%) | 0 (0.0%) |
| Architecture & Engineering | 0 (0.0%) | 0 (0.0%) |
| Life, Physical & Social Science | 0 (0.0%) | 0 (0.0%) |
| Community & Social Service | 0 (0.0%) | 0 (0.0%) |
| Education, Arts & Media | 0 (0.0%) | 0 (0.0%) |
| Legal Services & Support | 0 (0.0%) | 0 (0.0%) |
| Education Instruction & Library | 0 (0.0%) | 0 (0.0%) |
| Arts, Media & Entertainment | 0 (0.0%) | 0 (0.0%) |
| Health Diagnosing & Treating | 0 (0.0%) | 0 (0.0%) |
| Health Technologists | 0 (0.0%) | 0 (0.0%) |
| Total (Category) | 0 (0.0%) | 4 (100.0%) |
| Total (Overall) | 2 (1.8%) | 109 (98.2%) |
Services Occupations
The most common Services occupations in Sierraville are , and Food Preparation & Serving (61 | 54.9%).
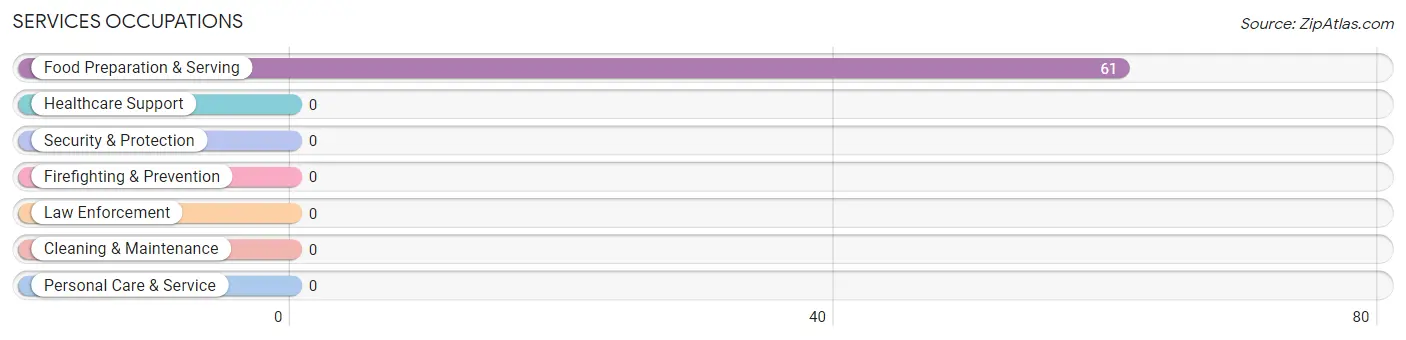
Services Occupations by Sex
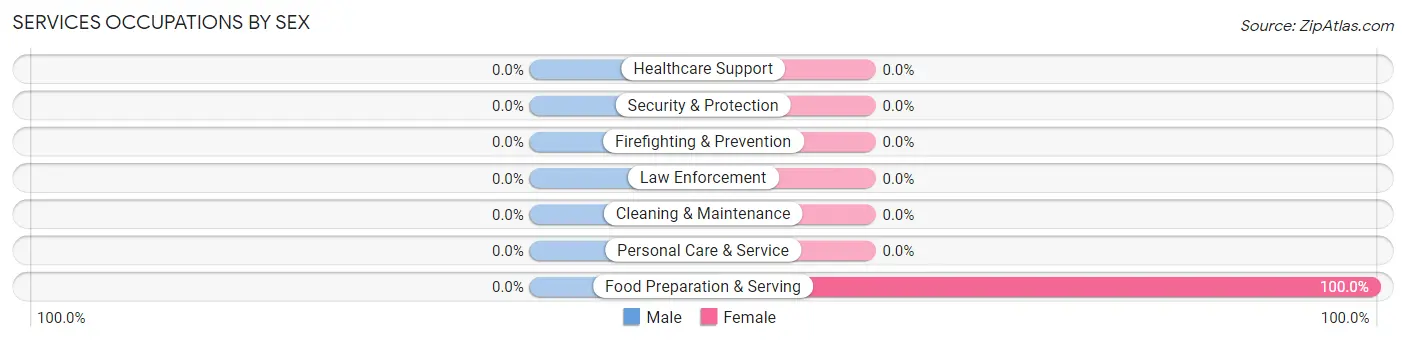
| Occupation | Male | Female |
| Healthcare Support | 0 (0.0%) | 0 (0.0%) |
| Security & Protection | 0 (0.0%) | 0 (0.0%) |
| Firefighting & Prevention | 0 (0.0%) | 0 (0.0%) |
| Law Enforcement | 0 (0.0%) | 0 (0.0%) |
| Food Preparation & Serving | 0 (0.0%) | 61 (100.0%) |
| Cleaning & Maintenance | 0 (0.0%) | 0 (0.0%) |
| Personal Care & Service | 0 (0.0%) | 0 (0.0%) |
| Total (Category) | 0 (0.0%) | 61 (100.0%) |
| Total (Overall) | 2 (1.8%) | 109 (98.2%) |
Sales and Office Occupations
The most common Sales and Office occupations in Sierraville are , and Sales & Related (44 | 39.6%).

Sales and Office Occupations by Sex

| Occupation | Male | Female |
| Sales & Related | 0 (0.0%) | 44 (100.0%) |
| Office & Administration | 0 (0.0%) | 0 (0.0%) |
| Total (Category) | 0 (0.0%) | 44 (100.0%) |
| Total (Overall) | 2 (1.8%) | 109 (98.2%) |
Natural Resources, Construction and Maintenance Occupations
The most common Natural Resources, Construction and Maintenance occupations in Sierraville are , and Farming, Fishing & Forestry (2 | 1.8%).

Natural Resources, Construction and Maintenance Occupations by Sex

| Occupation | Male | Female |
| Farming, Fishing & Forestry | 2 (100.0%) | 0 (0.0%) |
| Construction & Extraction | 0 (0.0%) | 0 (0.0%) |
| Installation, Maintenance & Repair | 0 (0.0%) | 0 (0.0%) |
| Total (Category) | 2 (100.0%) | 0 (0.0%) |
| Total (Overall) | 2 (1.8%) | 109 (98.2%) |
Production, Transportation and Moving Occupations
Production, Transportation and Moving Occupations by Sex
| Occupation | Male | Female |
| Production | 0 (0.0%) | 0 (0.0%) |
| Transportation | 0 (0.0%) | 0 (0.0%) |
| Material Moving | 0 (0.0%) | 0 (0.0%) |
| Total (Category) | 0 (0.0%) | 0 (0.0%) |
| Total (Overall) | 2 (1.8%) | 109 (98.2%) |
Employment Industries by Sex in Sierraville
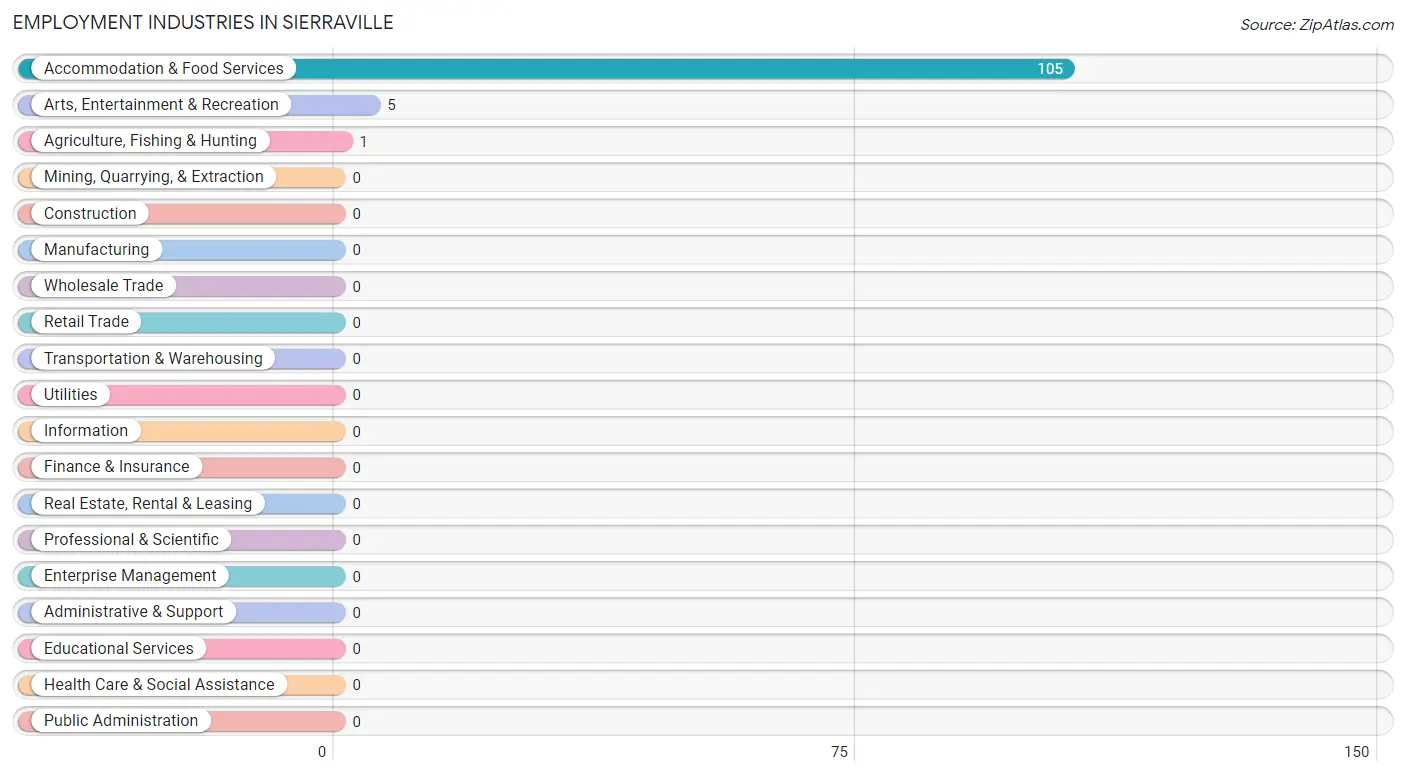
Employment Industries in Sierraville
The major employment industries in Sierraville include Accommodation & Food Services (105 | 94.6%), Arts, Entertainment & Recreation (5 | 4.5%), and Agriculture, Fishing & Hunting (1 | 0.9%).
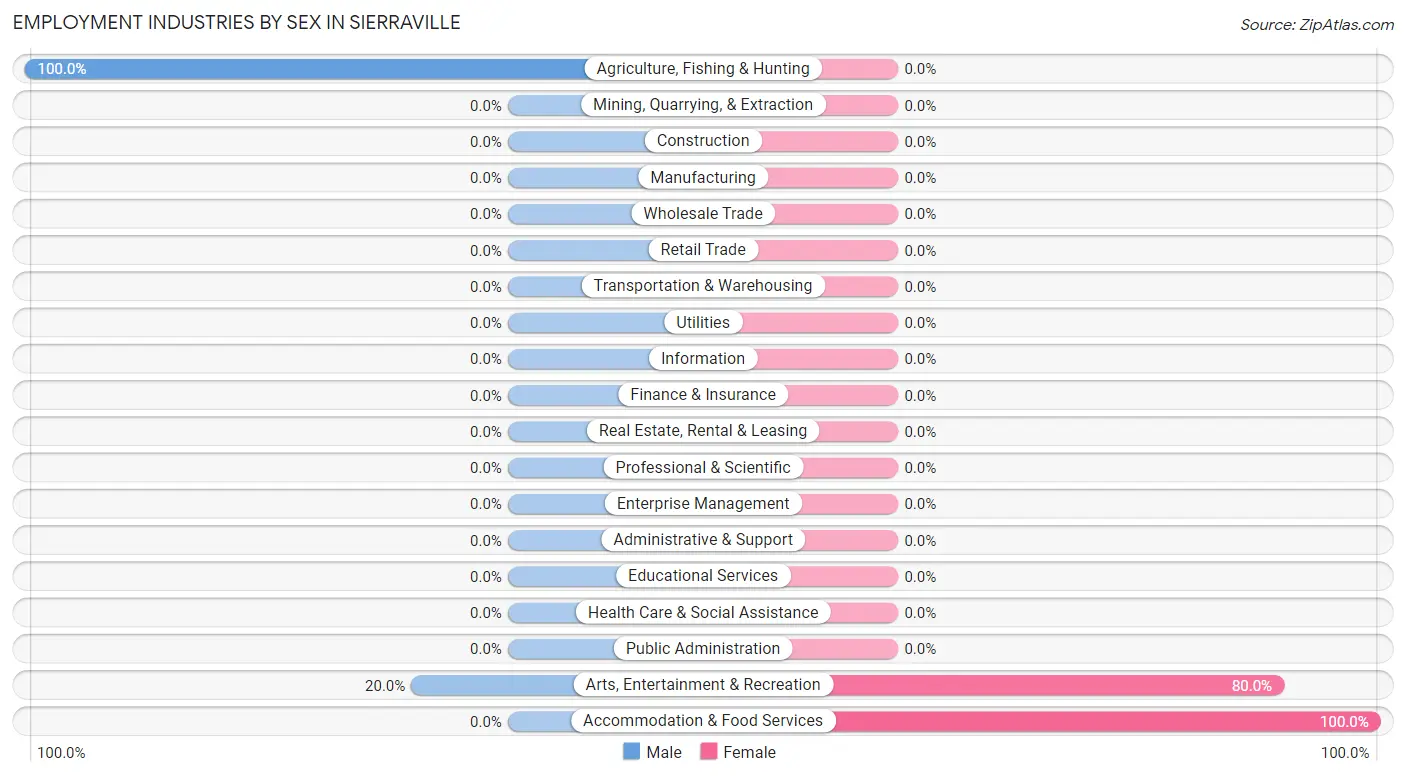
Employment Industries by Sex in Sierraville
The Sierraville industries that see more men than women are Agriculture, Fishing & Hunting (100.0%), and Arts, Entertainment & Recreation (20.0%), whereas the industries that tend to have a higher number of women are Accommodation & Food Services (100.0%), and Arts, Entertainment & Recreation (80.0%).
| Industry | Male | Female |
| Agriculture, Fishing & Hunting | 1 (100.0%) | 0 (0.0%) |
| Mining, Quarrying, & Extraction | 0 (0.0%) | 0 (0.0%) |
| Construction | 0 (0.0%) | 0 (0.0%) |
| Manufacturing | 0 (0.0%) | 0 (0.0%) |
| Wholesale Trade | 0 (0.0%) | 0 (0.0%) |
| Retail Trade | 0 (0.0%) | 0 (0.0%) |
| Transportation & Warehousing | 0 (0.0%) | 0 (0.0%) |
| Utilities | 0 (0.0%) | 0 (0.0%) |
| Information | 0 (0.0%) | 0 (0.0%) |
| Finance & Insurance | 0 (0.0%) | 0 (0.0%) |
| Real Estate, Rental & Leasing | 0 (0.0%) | 0 (0.0%) |
| Professional & Scientific | 0 (0.0%) | 0 (0.0%) |
| Enterprise Management | 0 (0.0%) | 0 (0.0%) |
| Administrative & Support | 0 (0.0%) | 0 (0.0%) |
| Educational Services | 0 (0.0%) | 0 (0.0%) |
| Health Care & Social Assistance | 0 (0.0%) | 0 (0.0%) |
| Arts, Entertainment & Recreation | 1 (20.0%) | 4 (80.0%) |
| Accommodation & Food Services | 0 (0.0%) | 105 (100.0%) |
| Public Administration | 0 (0.0%) | 0 (0.0%) |
| Total | 2 (1.8%) | 109 (98.2%) |
Education in Sierraville
School Enrollment in Sierraville
The most common levels of schooling among the 140 students in Sierraville are college / undergraduate (99 | 70.7%), and middle school (41 | 29.3%).
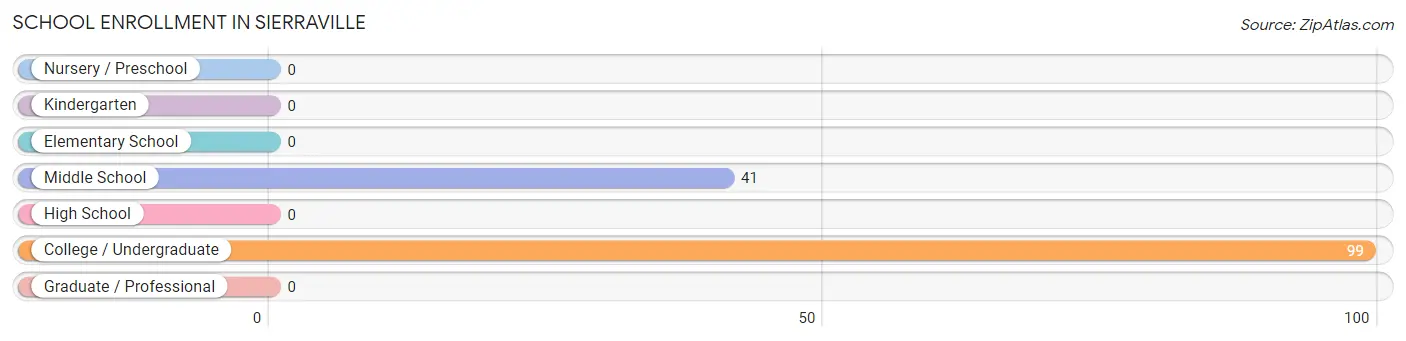
| School Level | # Students | % Students |
| Nursery / Preschool | 0 | 0.0% |
| Kindergarten | 0 | 0.0% |
| Elementary School | 0 | 0.0% |
| Middle School | 41 | 29.3% |
| High School | 0 | 0.0% |
| College / Undergraduate | 99 | 70.7% |
| Graduate / Professional | 0 | 0.0% |
| Total | 140 | 100.0% |
School Enrollment by Age by Funding Source in Sierraville
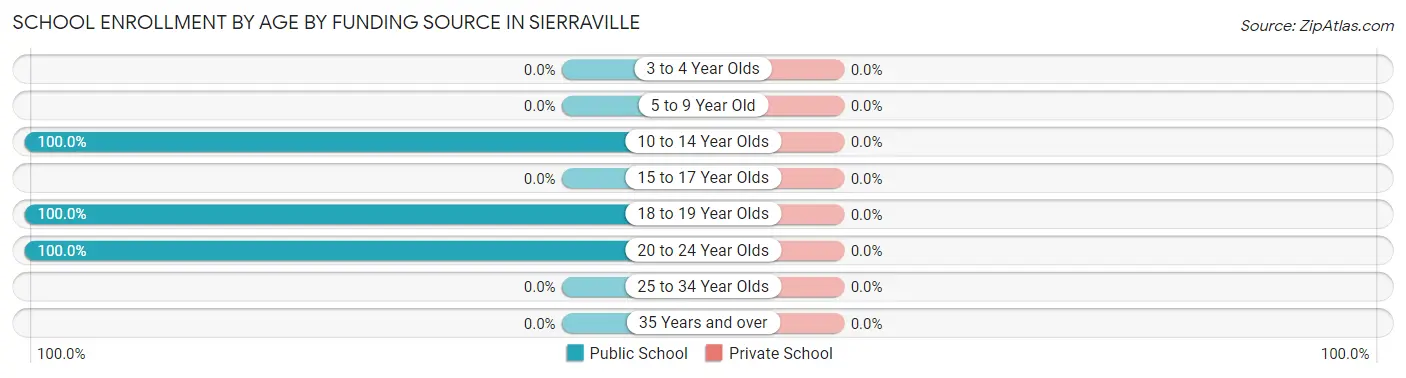
| Age Bracket | Public School | Private School |
| 3 to 4 Year Olds | 0 (0.0%) | 0 (0.0%) |
| 5 to 9 Year Old | 0 (0.0%) | 0 (0.0%) |
| 10 to 14 Year Olds | 41 (100.0%) | 0 (0.0%) |
| 15 to 17 Year Olds | 0 (0.0%) | 0 (0.0%) |
| 18 to 19 Year Olds | 55 (100.0%) | 0 (0.0%) |
| 20 to 24 Year Olds | 44 (100.0%) | 0 (0.0%) |
| 25 to 34 Year Olds | 0 (0.0%) | 0 (0.0%) |
| 35 Years and over | 0 (0.0%) | 0 (0.0%) |
| Total | 140 (100.0%) | 0 (0.0%) |
Educational Attainment by Field of Study in Sierraville
, and education (36 | 100.0%) are the most common fields of study among 36 individuals in Sierraville who have obtained a bachelor's degree or higher.
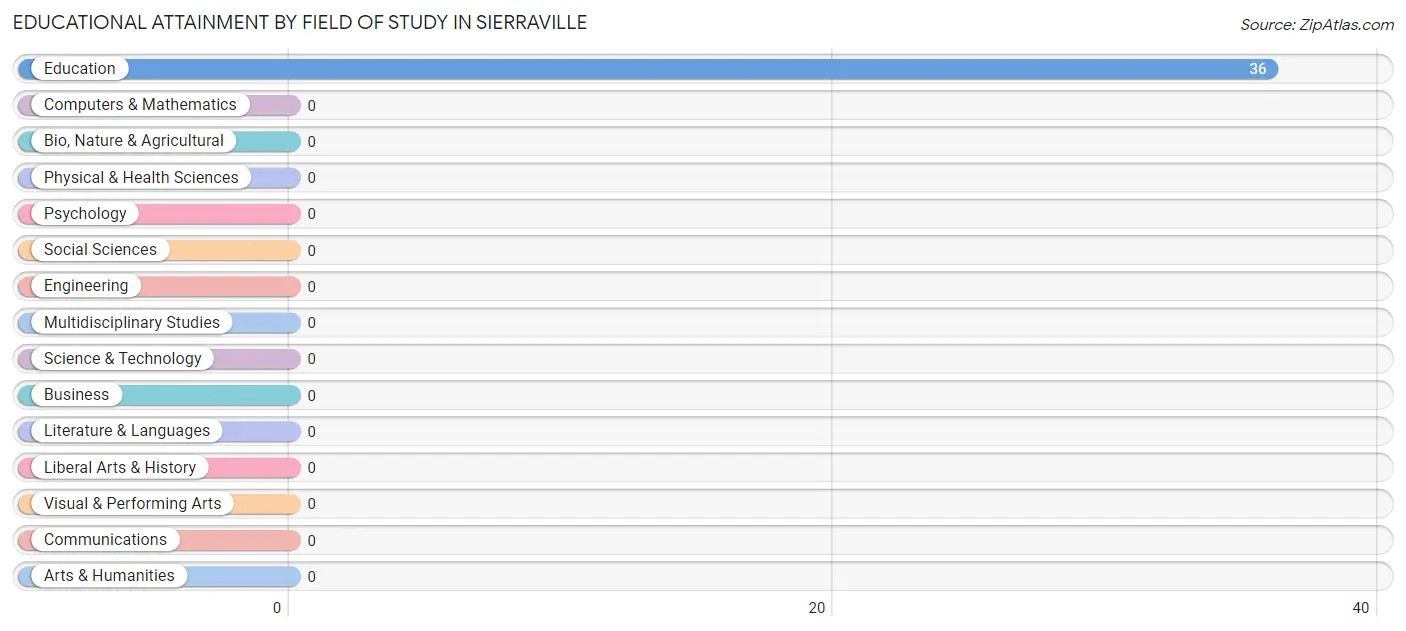
| Field of Study | # Graduates | % Graduates |
| Computers & Mathematics | 0 | 0.0% |
| Bio, Nature & Agricultural | 0 | 0.0% |
| Physical & Health Sciences | 0 | 0.0% |
| Psychology | 0 | 0.0% |
| Social Sciences | 0 | 0.0% |
| Engineering | 0 | 0.0% |
| Multidisciplinary Studies | 0 | 0.0% |
| Science & Technology | 0 | 0.0% |
| Business | 0 | 0.0% |
| Education | 36 | 100.0% |
| Literature & Languages | 0 | 0.0% |
| Liberal Arts & History | 0 | 0.0% |
| Visual & Performing Arts | 0 | 0.0% |
| Communications | 0 | 0.0% |
| Arts & Humanities | 0 | 0.0% |
| Total | 36 | 100.0% |
Transportation & Commute in Sierraville
Vehicle Availability by Sex in Sierraville
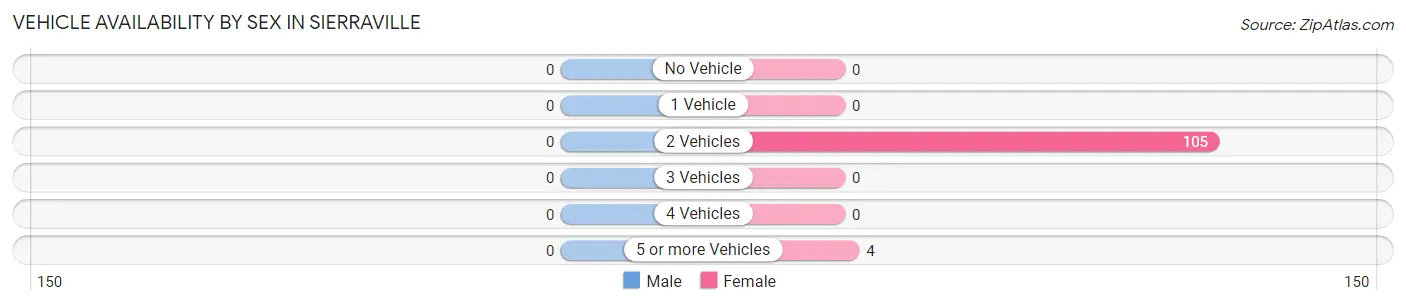
| Vehicles Available | Male | Female |
| No Vehicle | 0 (0.0%) | 0 (0.0%) |
| 1 Vehicle | 0 (0.0%) | 0 (0.0%) |
| 2 Vehicles | 0 (0.0%) | 105 (96.3%) |
| 3 Vehicles | 0 (0.0%) | 0 (0.0%) |
| 4 Vehicles | 0 (0.0%) | 0 (0.0%) |
| 5 or more Vehicles | 0 (0.0%) | 4 (3.7%) |
| Total | 0 (0.0%) | 109 (100.0%) |
Commute Time in Sierraville
The most frequently occuring commute durations in Sierraville are 35 to 39 minutes (48 commuters, 85.7%), 90 or more minutes (6 commuters, 10.7%), and 10 to 14 minutes (1 commuters, 1.8%).
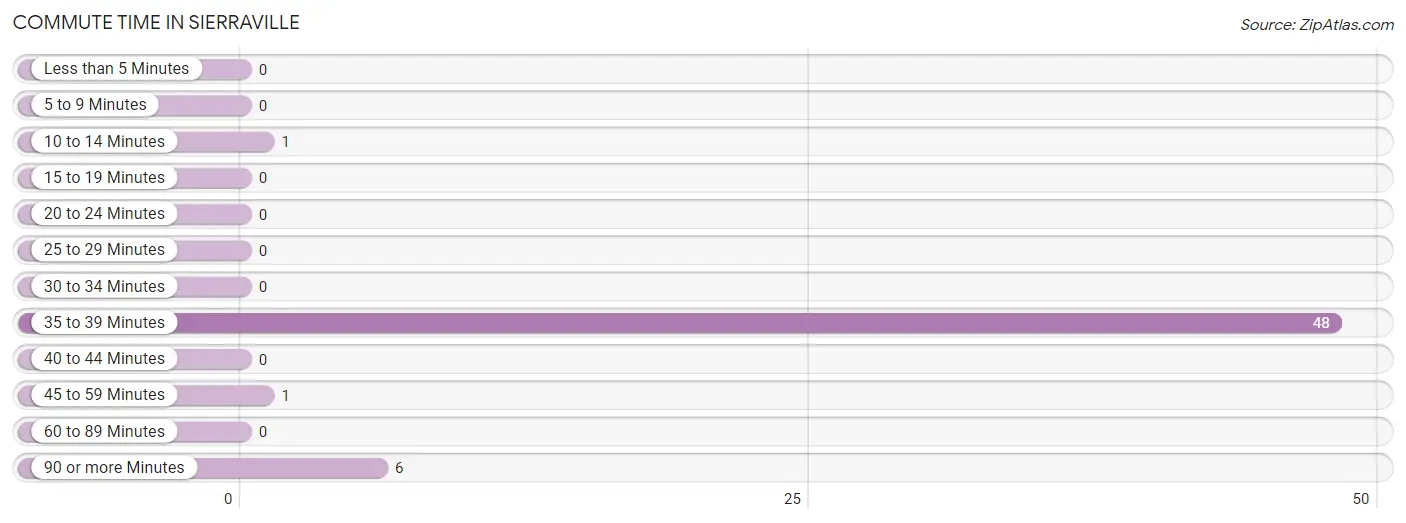
| Commute Time | # Commuters | % Commuters |
| Less than 5 Minutes | 0 | 0.0% |
| 5 to 9 Minutes | 0 | 0.0% |
| 10 to 14 Minutes | 1 | 1.8% |
| 15 to 19 Minutes | 0 | 0.0% |
| 20 to 24 Minutes | 0 | 0.0% |
| 25 to 29 Minutes | 0 | 0.0% |
| 30 to 34 Minutes | 0 | 0.0% |
| 35 to 39 Minutes | 48 | 85.7% |
| 40 to 44 Minutes | 0 | 0.0% |
| 45 to 59 Minutes | 1 | 1.8% |
| 60 to 89 Minutes | 0 | 0.0% |
| 90 or more Minutes | 6 | 10.7% |
Commute Time by Sex in Sierraville
The most common commute times in Sierraville are 10 to 14 minutes (1 commuters, 50.0%) for males and 35 to 39 minutes (48 commuters, 88.9%) for females.
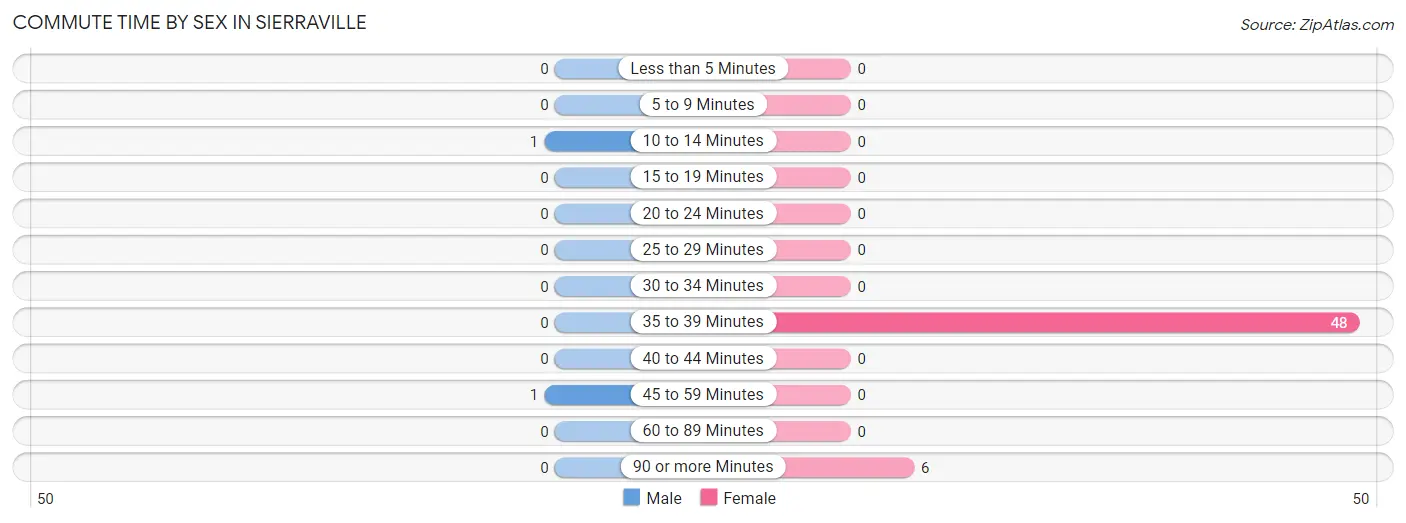
| Commute Time | Male | Female |
| Less than 5 Minutes | 0 (0.0%) | 0 (0.0%) |
| 5 to 9 Minutes | 0 (0.0%) | 0 (0.0%) |
| 10 to 14 Minutes | 1 (50.0%) | 0 (0.0%) |
| 15 to 19 Minutes | 0 (0.0%) | 0 (0.0%) |
| 20 to 24 Minutes | 0 (0.0%) | 0 (0.0%) |
| 25 to 29 Minutes | 0 (0.0%) | 0 (0.0%) |
| 30 to 34 Minutes | 0 (0.0%) | 0 (0.0%) |
| 35 to 39 Minutes | 0 (0.0%) | 48 (88.9%) |
| 40 to 44 Minutes | 0 (0.0%) | 0 (0.0%) |
| 45 to 59 Minutes | 1 (50.0%) | 0 (0.0%) |
| 60 to 89 Minutes | 0 (0.0%) | 0 (0.0%) |
| 90 or more Minutes | 0 (0.0%) | 6 (11.1%) |
Time of Departure to Work by Sex in Sierraville
The most frequent times of departure to work in Sierraville are 6:30 AM to 6:59 AM (1, 50.0%) for males and 5:00 AM to 5:29 AM (44, 81.5%) for females.
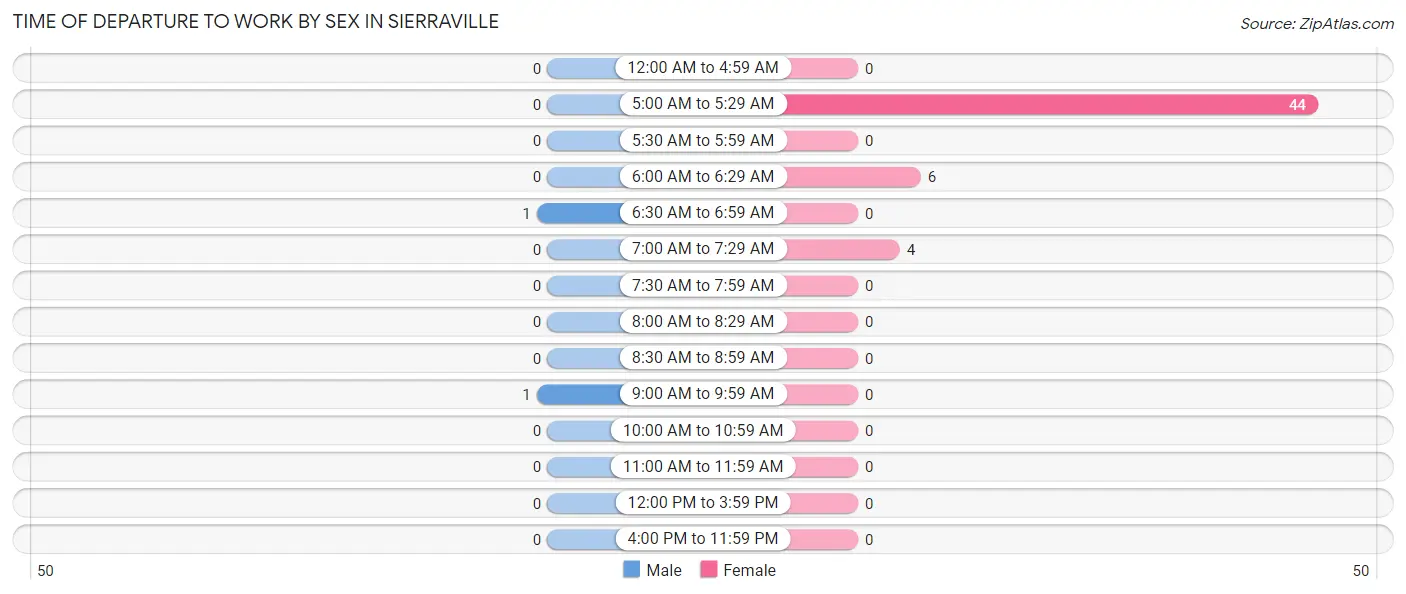
| Time of Departure | Male | Female |
| 12:00 AM to 4:59 AM | 0 (0.0%) | 0 (0.0%) |
| 5:00 AM to 5:29 AM | 0 (0.0%) | 44 (81.5%) |
| 5:30 AM to 5:59 AM | 0 (0.0%) | 0 (0.0%) |
| 6:00 AM to 6:29 AM | 0 (0.0%) | 6 (11.1%) |
| 6:30 AM to 6:59 AM | 1 (50.0%) | 0 (0.0%) |
| 7:00 AM to 7:29 AM | 0 (0.0%) | 4 (7.4%) |
| 7:30 AM to 7:59 AM | 0 (0.0%) | 0 (0.0%) |
| 8:00 AM to 8:29 AM | 0 (0.0%) | 0 (0.0%) |
| 8:30 AM to 8:59 AM | 0 (0.0%) | 0 (0.0%) |
| 9:00 AM to 9:59 AM | 1 (50.0%) | 0 (0.0%) |
| 10:00 AM to 10:59 AM | 0 (0.0%) | 0 (0.0%) |
| 11:00 AM to 11:59 AM | 0 (0.0%) | 0 (0.0%) |
| 12:00 PM to 3:59 PM | 0 (0.0%) | 0 (0.0%) |
| 4:00 PM to 11:59 PM | 0 (0.0%) | 0 (0.0%) |
| Total | 2 (100.0%) | 54 (100.0%) |
Housing Occupancy in Sierraville
Occupancy by Ownership in Sierraville
Of the total 69 dwellings in Sierraville, owner-occupied units account for 63 (91.3%), while renter-occupied units make up 6 (8.7%).
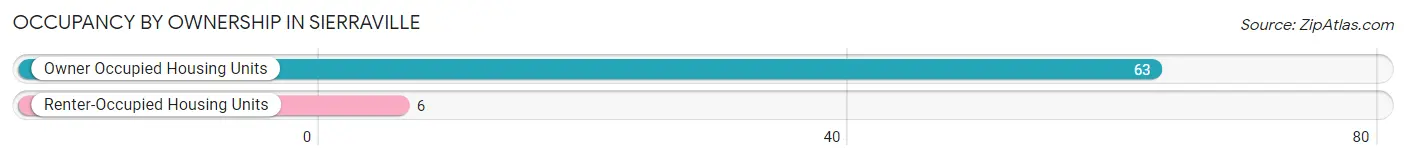
| Occupancy | # Housing Units | % Housing Units |
| Owner Occupied Housing Units | 63 | 91.3% |
| Renter-Occupied Housing Units | 6 | 8.7% |
| Total Occupied Housing Units | 69 | 100.0% |
Occupancy by Household Size in Sierraville
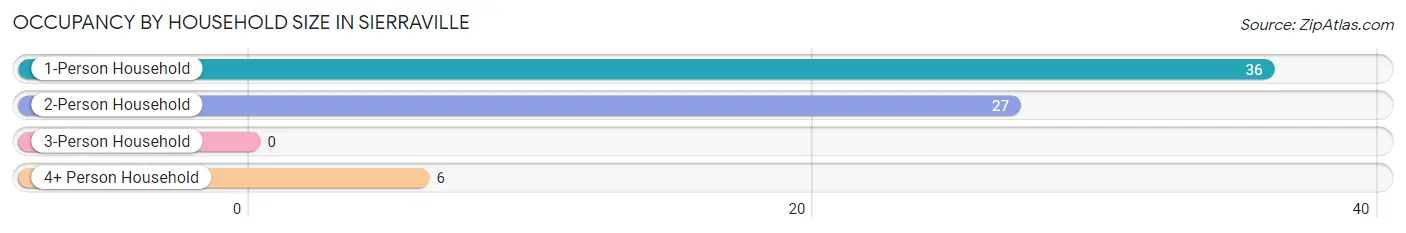
| Household Size | # Housing Units | % Housing Units |
| 1-Person Household | 36 | 52.2% |
| 2-Person Household | 27 | 39.1% |
| 3-Person Household | 0 | 0.0% |
| 4+ Person Household | 6 | 8.7% |
| Total Housing Units | 69 | 100.0% |
Occupancy by Ownership by Household Size in Sierraville
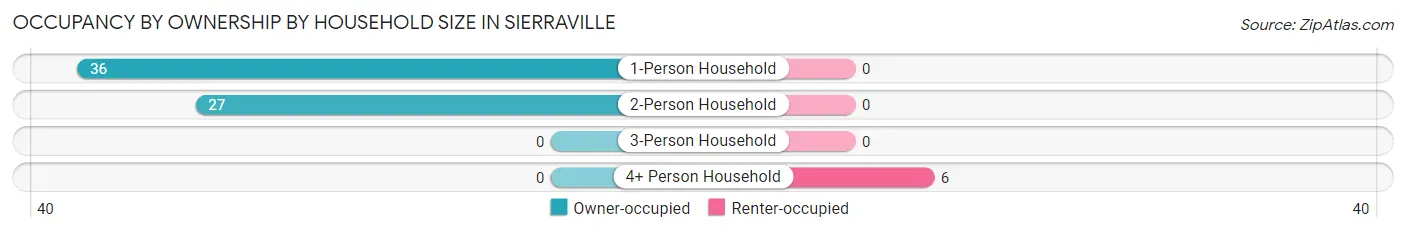
| Household Size | Owner-occupied | Renter-occupied |
| 1-Person Household | 36 (100.0%) | 0 (0.0%) |
| 2-Person Household | 27 (100.0%) | 0 (0.0%) |
| 3-Person Household | 0 (0.0%) | 0 (0.0%) |
| 4+ Person Household | 0 (0.0%) | 6 (100.0%) |
| Total Housing Units | 63 (91.3%) | 6 (8.7%) |
Occupancy by Educational Attainment in Sierraville
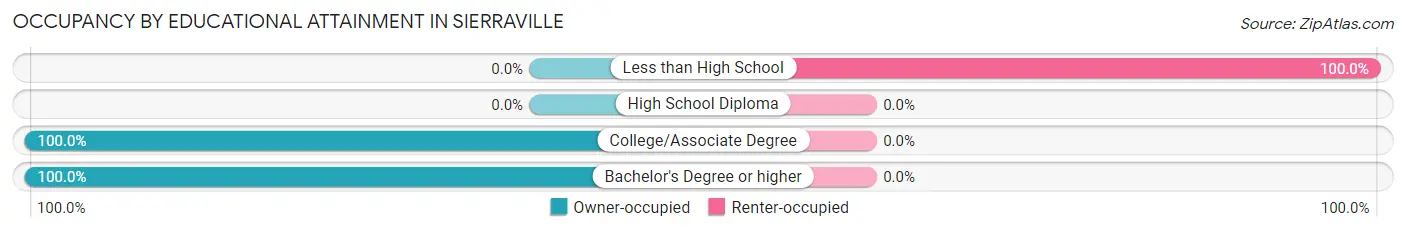
| Household Size | Owner-occupied | Renter-occupied |
| Less than High School | 0 (0.0%) | 6 (100.0%) |
| High School Diploma | 0 (0.0%) | 0 (0.0%) |
| College/Associate Degree | 36 (100.0%) | 0 (0.0%) |
| Bachelor's Degree or higher | 27 (100.0%) | 0 (0.0%) |
Occupancy by Age of Householder in Sierraville
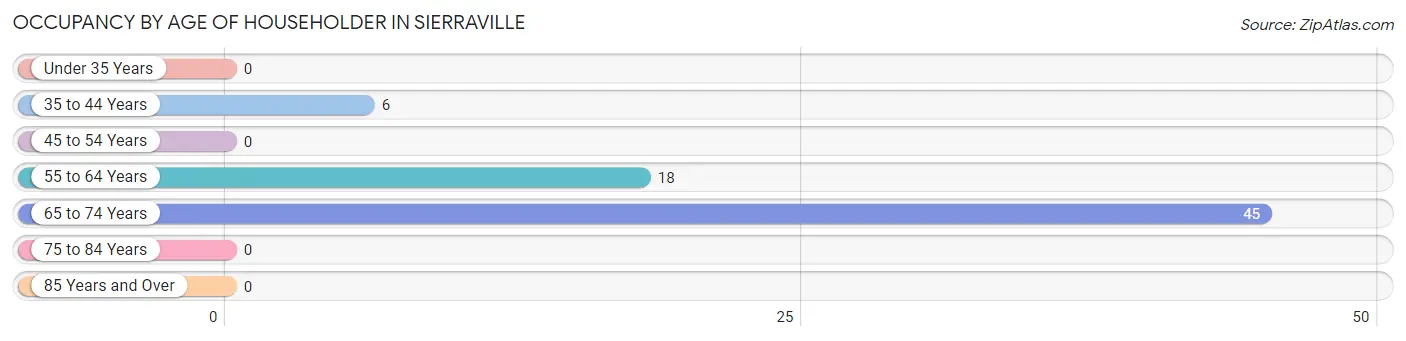
| Age Bracket | # Households | % Households |
| Under 35 Years | 0 | 0.0% |
| 35 to 44 Years | 6 | 8.7% |
| 45 to 54 Years | 0 | 0.0% |
| 55 to 64 Years | 18 | 26.1% |
| 65 to 74 Years | 45 | 65.2% |
| 75 to 84 Years | 0 | 0.0% |
| 85 Years and Over | 0 | 0.0% |
| Total | 69 | 100.0% |
Housing Finances in Sierraville
Median Income by Occupancy in Sierraville
| Occupancy Type | # Households | Median Income |
| Owner-Occupied | 63 (91.3%) | $0 |
| Renter-Occupied | 6 (8.7%) | $0 |
| Average | 69 (100.0%) | $0 |
Occupancy by Householder Income Bracket in Sierraville
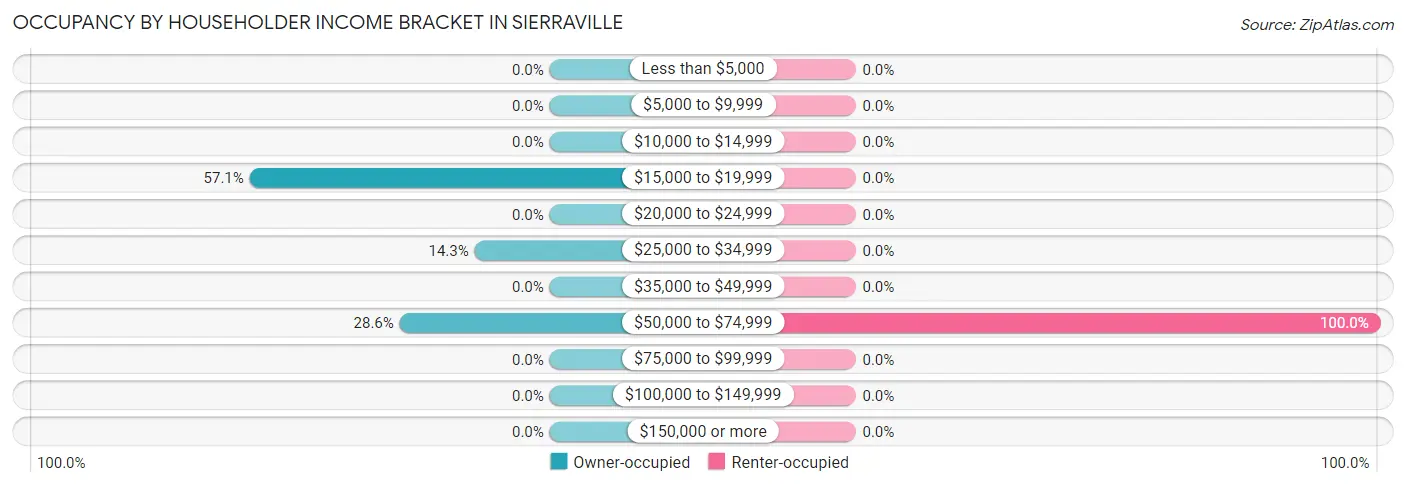
| Income Bracket | Owner-occupied | Renter-occupied |
| Less than $5,000 | 0 (0.0%) | 0 (0.0%) |
| $5,000 to $9,999 | 0 (0.0%) | 0 (0.0%) |
| $10,000 to $14,999 | 0 (0.0%) | 0 (0.0%) |
| $15,000 to $19,999 | 36 (57.1%) | 0 (0.0%) |
| $20,000 to $24,999 | 0 (0.0%) | 0 (0.0%) |
| $25,000 to $34,999 | 9 (14.3%) | 0 (0.0%) |
| $35,000 to $49,999 | 0 (0.0%) | 0 (0.0%) |
| $50,000 to $74,999 | 18 (28.6%) | 6 (100.0%) |
| $75,000 to $99,999 | 0 (0.0%) | 0 (0.0%) |
| $100,000 to $149,999 | 0 (0.0%) | 0 (0.0%) |
| $150,000 or more | 0 (0.0%) | 0 (0.0%) |
| Total | 63 (100.0%) | 6 (100.0%) |
Monthly Housing Cost Tiers in Sierraville
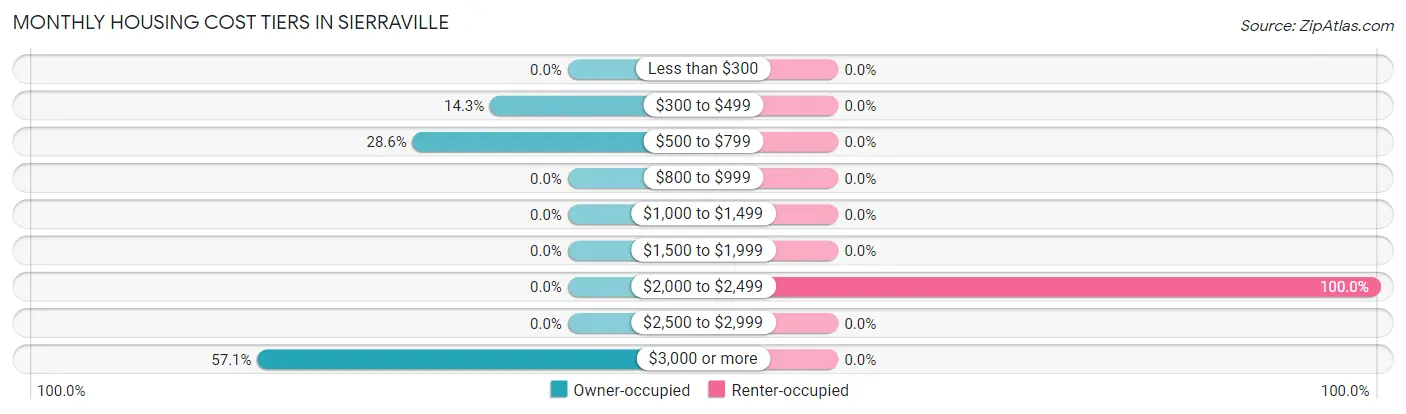
| Monthly Cost | Owner-occupied | Renter-occupied |
| Less than $300 | 0 (0.0%) | 0 (0.0%) |
| $300 to $499 | 9 (14.3%) | 0 (0.0%) |
| $500 to $799 | 18 (28.6%) | 0 (0.0%) |
| $800 to $999 | 0 (0.0%) | 0 (0.0%) |
| $1,000 to $1,499 | 0 (0.0%) | 0 (0.0%) |
| $1,500 to $1,999 | 0 (0.0%) | 0 (0.0%) |
| $2,000 to $2,499 | 0 (0.0%) | 6 (100.0%) |
| $2,500 to $2,999 | 0 (0.0%) | 0 (0.0%) |
| $3,000 or more | 36 (57.1%) | 0 (0.0%) |
| Total | 63 (100.0%) | 6 (100.0%) |
Physical Housing Characteristics in Sierraville
Housing Structures in Sierraville
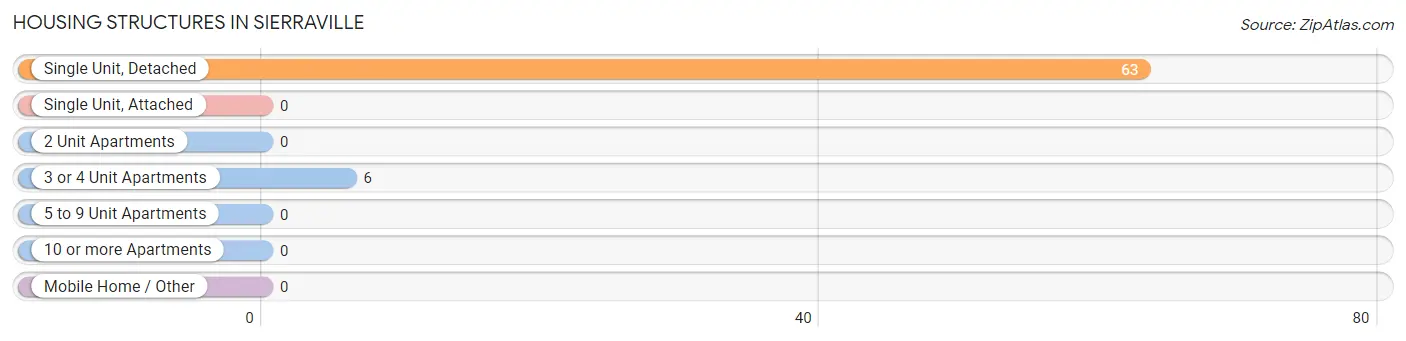
| Structure Type | # Housing Units | % Housing Units |
| Single Unit, Detached | 63 | 91.3% |
| Single Unit, Attached | 0 | 0.0% |
| 2 Unit Apartments | 0 | 0.0% |
| 3 or 4 Unit Apartments | 6 | 8.7% |
| 5 to 9 Unit Apartments | 0 | 0.0% |
| 10 or more Apartments | 0 | 0.0% |
| Mobile Home / Other | 0 | 0.0% |
| Total | 69 | 100.0% |
Housing Structures by Occupancy in Sierraville
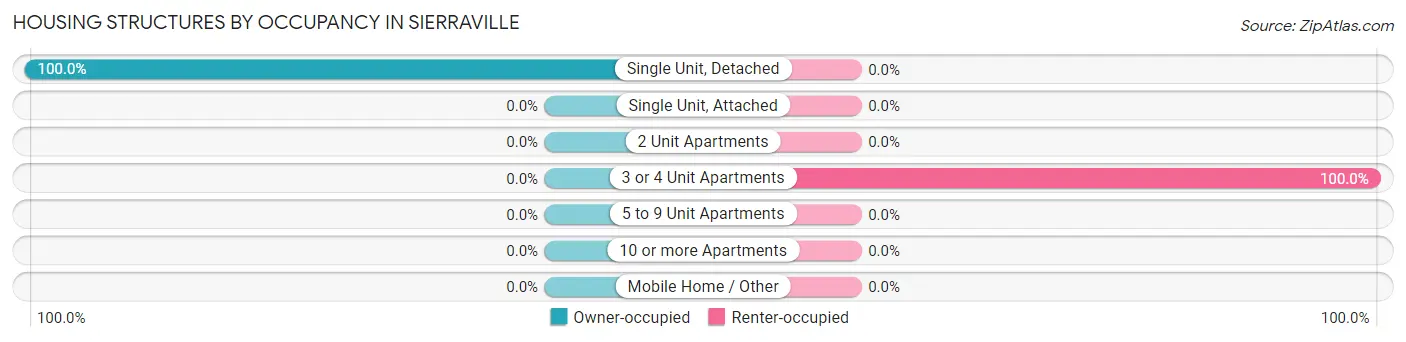
| Structure Type | Owner-occupied | Renter-occupied |
| Single Unit, Detached | 63 (100.0%) | 0 (0.0%) |
| Single Unit, Attached | 0 (0.0%) | 0 (0.0%) |
| 2 Unit Apartments | 0 (0.0%) | 0 (0.0%) |
| 3 or 4 Unit Apartments | 0 (0.0%) | 6 (100.0%) |
| 5 to 9 Unit Apartments | 0 (0.0%) | 0 (0.0%) |
| 10 or more Apartments | 0 (0.0%) | 0 (0.0%) |
| Mobile Home / Other | 0 (0.0%) | 0 (0.0%) |
| Total | 63 (91.3%) | 6 (8.7%) |
Housing Structures by Number of Rooms in Sierraville
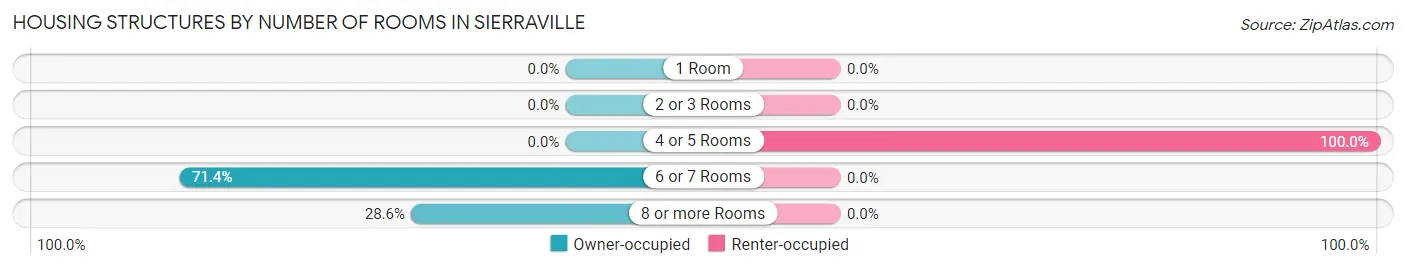
| Number of Rooms | Owner-occupied | Renter-occupied |
| 1 Room | 0 (0.0%) | 0 (0.0%) |
| 2 or 3 Rooms | 0 (0.0%) | 0 (0.0%) |
| 4 or 5 Rooms | 0 (0.0%) | 6 (100.0%) |
| 6 or 7 Rooms | 45 (71.4%) | 0 (0.0%) |
| 8 or more Rooms | 18 (28.6%) | 0 (0.0%) |
| Total | 63 (100.0%) | 6 (100.0%) |
Housing Structure by Heating Type in Sierraville
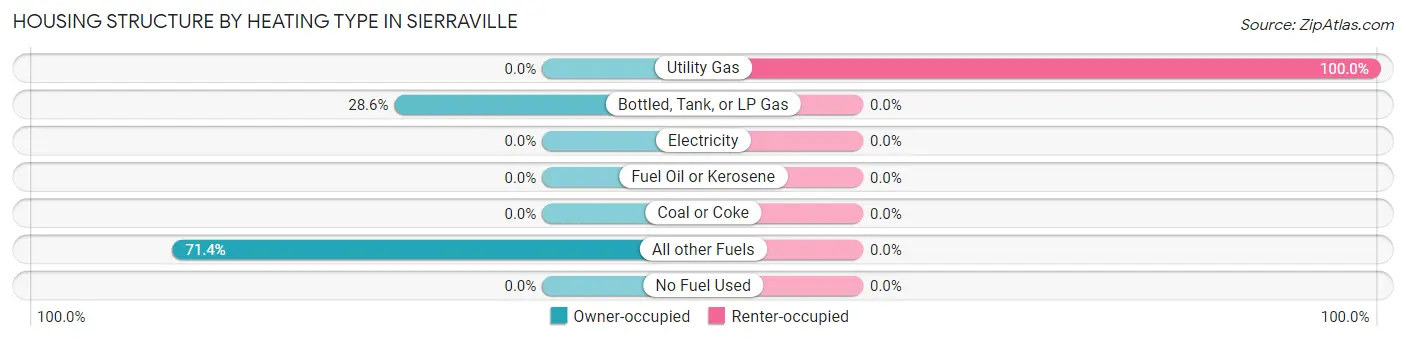
| Heating Type | Owner-occupied | Renter-occupied |
| Utility Gas | 0 (0.0%) | 6 (100.0%) |
| Bottled, Tank, or LP Gas | 18 (28.6%) | 0 (0.0%) |
| Electricity | 0 (0.0%) | 0 (0.0%) |
| Fuel Oil or Kerosene | 0 (0.0%) | 0 (0.0%) |
| Coal or Coke | 0 (0.0%) | 0 (0.0%) |
| All other Fuels | 45 (71.4%) | 0 (0.0%) |
| No Fuel Used | 0 (0.0%) | 0 (0.0%) |
| Total | 63 (100.0%) | 6 (100.0%) |
Household Vehicle Usage in Sierraville
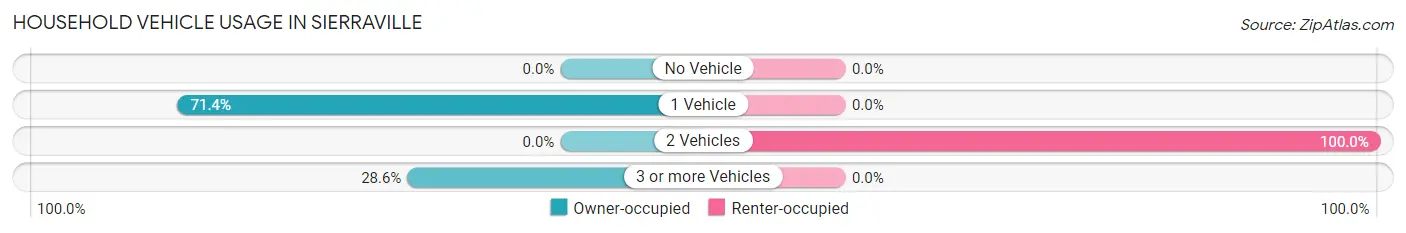
| Vehicles per Household | Owner-occupied | Renter-occupied |
| No Vehicle | 0 (0.0%) | 0 (0.0%) |
| 1 Vehicle | 45 (71.4%) | 0 (0.0%) |
| 2 Vehicles | 0 (0.0%) | 6 (100.0%) |
| 3 or more Vehicles | 18 (28.6%) | 0 (0.0%) |
| Total | 63 (100.0%) | 6 (100.0%) |
Real Estate & Mortgages in Sierraville
Real Estate and Mortgage Overview in Sierraville
| Characteristic | Without Mortgage | With Mortgage |
| Housing Units | 27 | 36 |
| Median Property Value | - | - |
| Median Household Income | - | - |
| Monthly Housing Costs | - | - |
| Real Estate Taxes | - | - |
Property Value by Mortgage Status in Sierraville
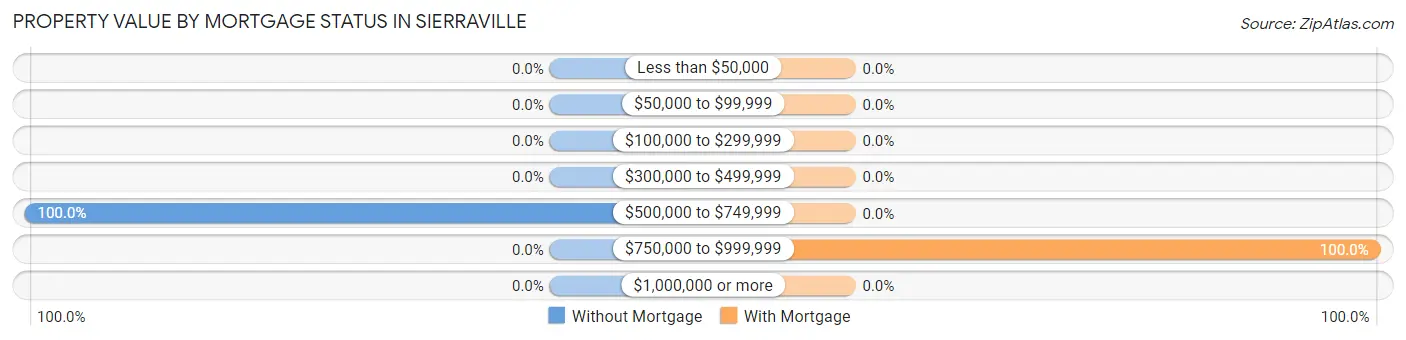
| Property Value | Without Mortgage | With Mortgage |
| Less than $50,000 | 0 (0.0%) | 0 (0.0%) |
| $50,000 to $99,999 | 0 (0.0%) | 0 (0.0%) |
| $100,000 to $299,999 | 0 (0.0%) | 0 (0.0%) |
| $300,000 to $499,999 | 0 (0.0%) | 0 (0.0%) |
| $500,000 to $749,999 | 27 (100.0%) | 0 (0.0%) |
| $750,000 to $999,999 | 0 (0.0%) | 36 (100.0%) |
| $1,000,000 or more | 0 (0.0%) | 0 (0.0%) |
| Total | 27 (100.0%) | 36 (100.0%) |
Household Income by Mortgage Status in Sierraville
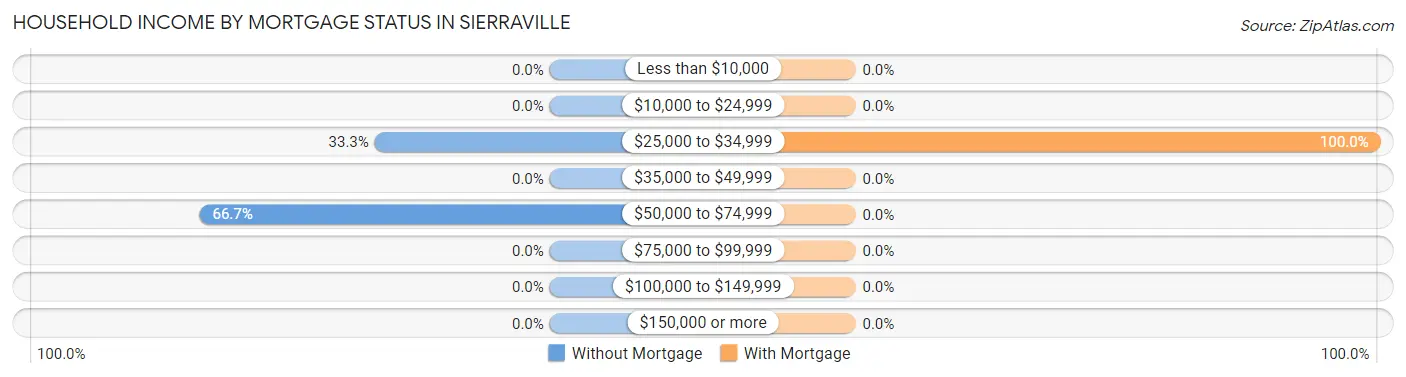
| Household Income | Without Mortgage | With Mortgage |
| Less than $10,000 | 0 (0.0%) | 0 (0.0%) |
| $10,000 to $24,999 | 0 (0.0%) | 0 (0.0%) |
| $25,000 to $34,999 | 9 (33.3%) | 36 (100.0%) |
| $35,000 to $49,999 | 0 (0.0%) | 0 (0.0%) |
| $50,000 to $74,999 | 18 (66.7%) | 0 (0.0%) |
| $75,000 to $99,999 | 0 (0.0%) | 0 (0.0%) |
| $100,000 to $149,999 | 0 (0.0%) | 0 (0.0%) |
| $150,000 or more | 0 (0.0%) | 0 (0.0%) |
| Total | 27 (100.0%) | 36 (100.0%) |
Property Value to Household Income Ratio in Sierraville
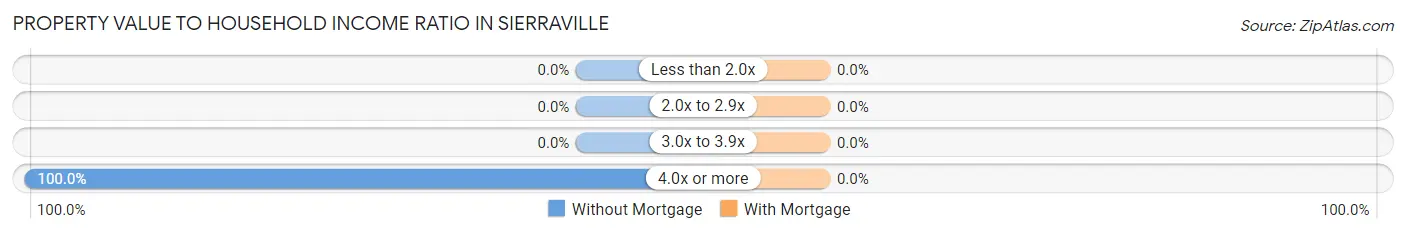
| Value-to-Income Ratio | Without Mortgage | With Mortgage |
| Less than 2.0x | 0 (0.0%) | 0 (0.0%) |
| 2.0x to 2.9x | 0 (0.0%) | 0 (0.0%) |
| 3.0x to 3.9x | 0 (0.0%) | 0 (0.0%) |
| 4.0x or more | 27 (100.0%) | 0 (0.0%) |
| Total | 27 (100.0%) | 36 (100.0%) |
Real Estate Taxes by Mortgage Status in Sierraville
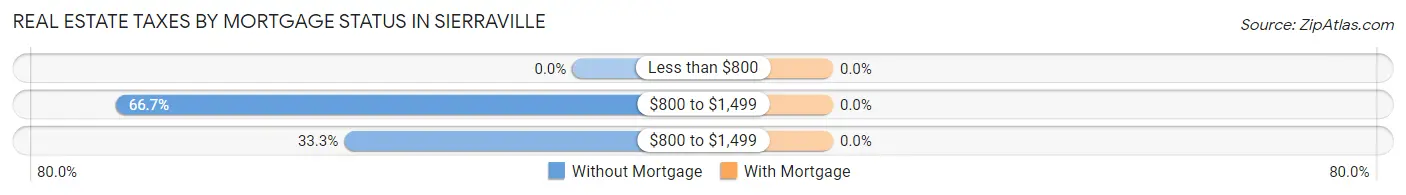
| Property Taxes | Without Mortgage | With Mortgage |
| Less than $800 | 0 (0.0%) | 0 (0.0%) |
| $800 to $1,499 | 18 (66.7%) | 0 (0.0%) |
| $800 to $1,499 | 9 (33.3%) | 0 (0.0%) |
| Total | 27 (100.0%) | 36 (100.0%) |
Health & Disability in Sierraville
Health Insurance Coverage by Age in Sierraville
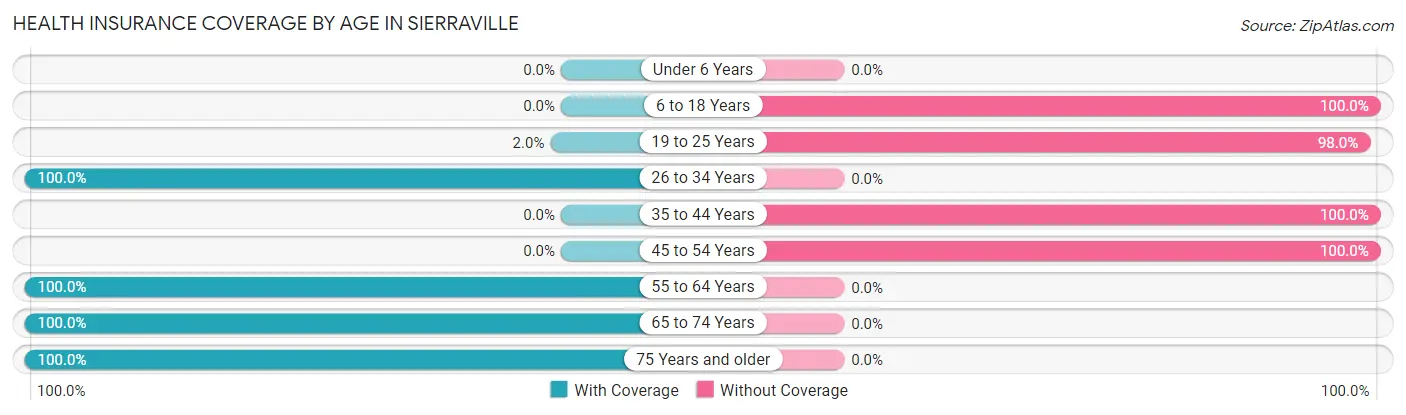
| Age Bracket | With Coverage | Without Coverage |
| Under 6 Years | 0 (0.0%) | 0 (0.0%) |
| 6 to 18 Years | 0 (0.0%) | 41 (100.0%) |
| 19 to 25 Years | 2 (2.0%) | 99 (98.0%) |
| 26 to 34 Years | 1 (100.0%) | 0 (0.0%) |
| 35 to 44 Years | 0 (0.0%) | 6 (100.0%) |
| 45 to 54 Years | 0 (0.0%) | 1 (100.0%) |
| 55 to 64 Years | 23 (100.0%) | 0 (0.0%) |
| 65 to 74 Years | 45 (100.0%) | 0 (0.0%) |
| 75 Years and older | 9 (100.0%) | 0 (0.0%) |
| Total | 80 (35.2%) | 147 (64.8%) |
Health Insurance Coverage by Citizenship Status in Sierraville

| Citizenship Status | With Coverage | Without Coverage |
| Native Born | 0 (0.0%) | 0 (0.0%) |
| Foreign Born, Citizen | 0 (0.0%) | 41 (100.0%) |
| Foreign Born, not a Citizen | 2 (2.0%) | 99 (98.0%) |
Health Insurance Coverage by Household Income in Sierraville
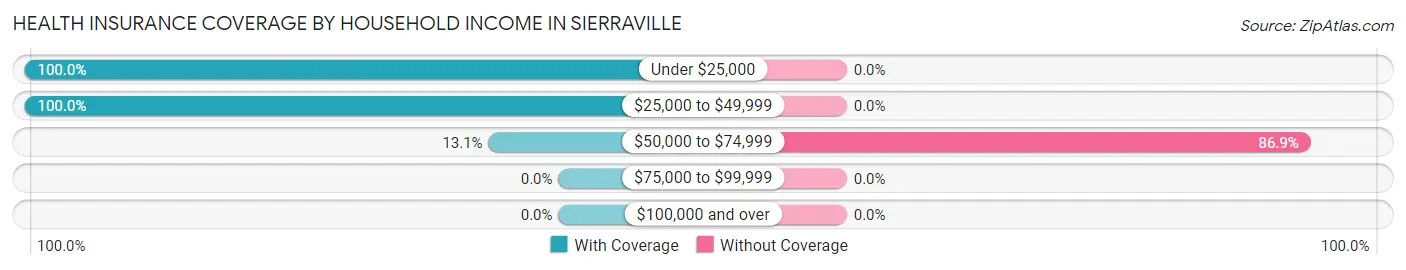
| Household Income | With Coverage | Without Coverage |
| Under $25,000 | 36 (100.0%) | 0 (0.0%) |
| $25,000 to $49,999 | 18 (100.0%) | 0 (0.0%) |
| $50,000 to $74,999 | 22 (13.1%) | 146 (86.9%) |
| $75,000 to $99,999 | 0 (0.0%) | 0 (0.0%) |
| $100,000 and over | 0 (0.0%) | 0 (0.0%) |
Public vs Private Health Insurance Coverage by Age in Sierraville

| Age Bracket | Public Insurance | Private Insurance |
| Under 6 | 0 (0.0%) | 0 (0.0%) |
| 6 to 18 Years | 0 (0.0%) | 0 (0.0%) |
| 19 to 25 Years | 2 (2.0%) | 0 (0.0%) |
| 25 to 34 Years | 1 (100.0%) | 0 (0.0%) |
| 35 to 44 Years | 0 (0.0%) | 0 (0.0%) |
| 45 to 54 Years | 0 (0.0%) | 0 (0.0%) |
| 55 to 64 Years | 19 (82.6%) | 4 (17.4%) |
| 65 to 74 Years | 45 (100.0%) | 0 (0.0%) |
| 75 Years and over | 9 (100.0%) | 0 (0.0%) |
| Total | 76 (33.5%) | 4 (1.8%) |
Disability Status by Sex by Age in Sierraville
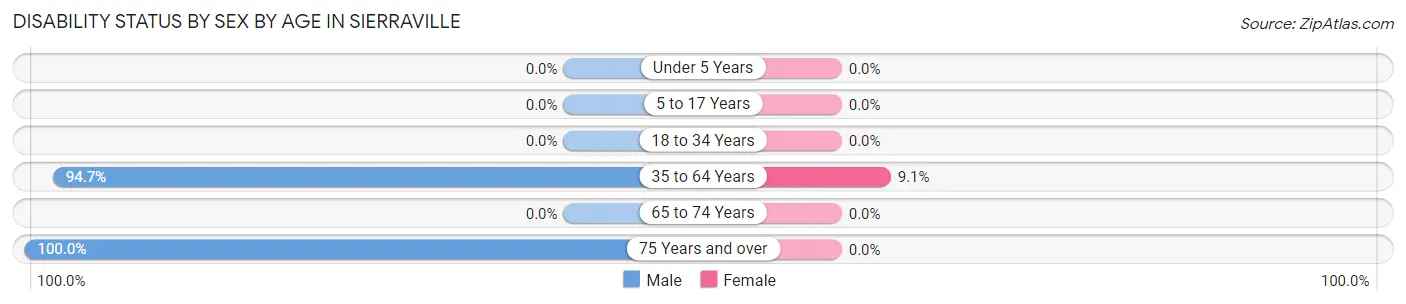
| Age Bracket | Male | Female |
| Under 5 Years | 0 (0.0%) | 0 (0.0%) |
| 5 to 17 Years | 0 (0.0%) | 0 (0.0%) |
| 18 to 34 Years | 0 (0.0%) | 0 (0.0%) |
| 35 to 64 Years | 18 (94.7%) | 1 (9.1%) |
| 65 to 74 Years | 0 (0.0%) | 0 (0.0%) |
| 75 Years and over | 9 (100.0%) | 0 (0.0%) |
Disability Class by Sex by Age in Sierraville
Disability Class: Hearing Difficulty
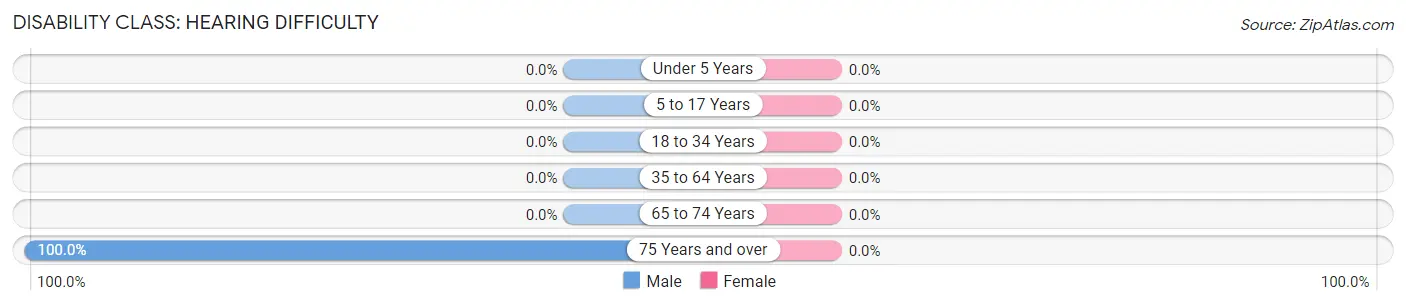
| Age Bracket | Male | Female |
| Under 5 Years | 0 (0.0%) | 0 (0.0%) |
| 5 to 17 Years | 0 (0.0%) | 0 (0.0%) |
| 18 to 34 Years | 0 (0.0%) | 0 (0.0%) |
| 35 to 64 Years | 0 (0.0%) | 0 (0.0%) |
| 65 to 74 Years | 0 (0.0%) | 0 (0.0%) |
| 75 Years and over | 9 (100.0%) | 0 (0.0%) |
Disability Class: Vision Difficulty
| Age Bracket | Male | Female |
| Under 5 Years | 0 (0.0%) | 0 (0.0%) |
| 5 to 17 Years | 0 (0.0%) | 0 (0.0%) |
| 18 to 34 Years | 0 (0.0%) | 0 (0.0%) |
| 35 to 64 Years | 0 (0.0%) | 0 (0.0%) |
| 65 to 74 Years | 0 (0.0%) | 0 (0.0%) |
| 75 Years and over | 0 (0.0%) | 0 (0.0%) |
Disability Class: Cognitive Difficulty
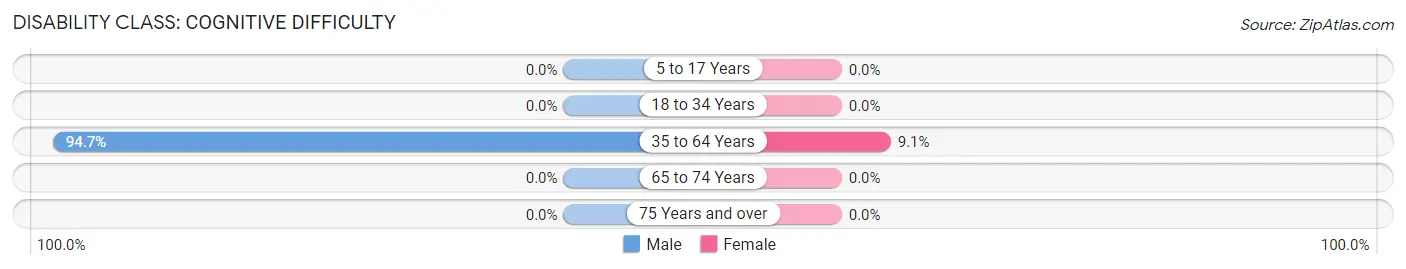
| Age Bracket | Male | Female |
| 5 to 17 Years | 0 (0.0%) | 0 (0.0%) |
| 18 to 34 Years | 0 (0.0%) | 0 (0.0%) |
| 35 to 64 Years | 18 (94.7%) | 1 (9.1%) |
| 65 to 74 Years | 0 (0.0%) | 0 (0.0%) |
| 75 Years and over | 0 (0.0%) | 0 (0.0%) |
Disability Class: Ambulatory Difficulty
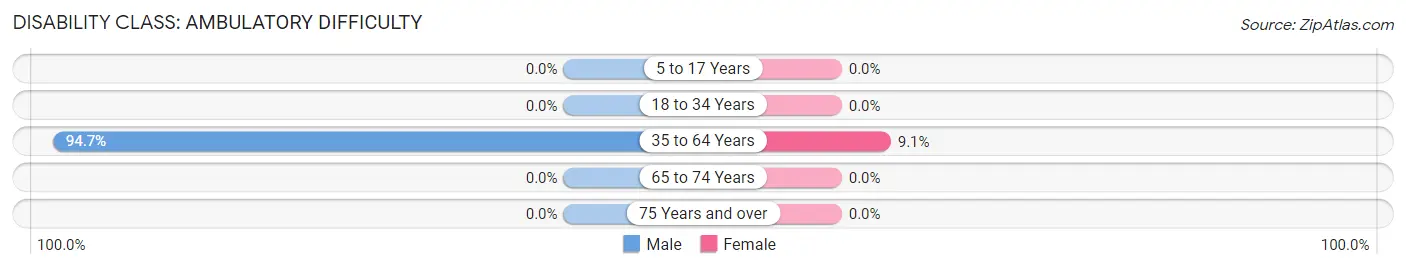
| Age Bracket | Male | Female |
| 5 to 17 Years | 0 (0.0%) | 0 (0.0%) |
| 18 to 34 Years | 0 (0.0%) | 0 (0.0%) |
| 35 to 64 Years | 18 (94.7%) | 1 (9.1%) |
| 65 to 74 Years | 0 (0.0%) | 0 (0.0%) |
| 75 Years and over | 0 (0.0%) | 0 (0.0%) |
Disability Class: Self-Care Difficulty
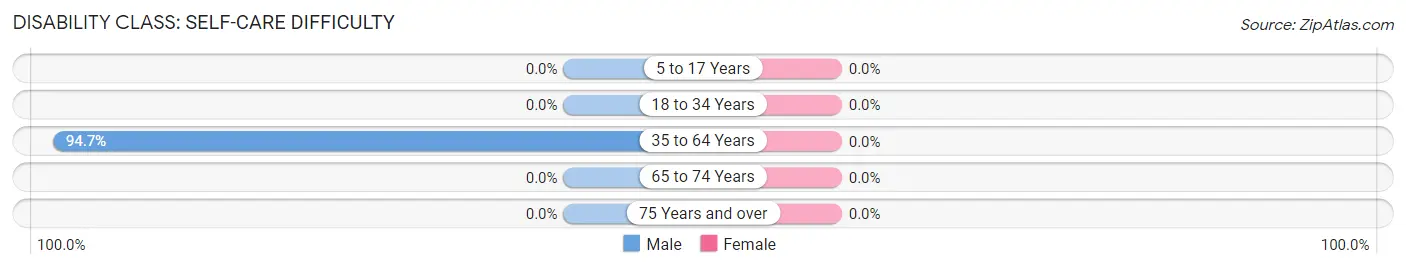
| Age Bracket | Male | Female |
| 5 to 17 Years | 0 (0.0%) | 0 (0.0%) |
| 18 to 34 Years | 0 (0.0%) | 0 (0.0%) |
| 35 to 64 Years | 18 (94.7%) | 0 (0.0%) |
| 65 to 74 Years | 0 (0.0%) | 0 (0.0%) |
| 75 Years and over | 0 (0.0%) | 0 (0.0%) |
Technology Access in Sierraville
Computing Device Access in Sierraville
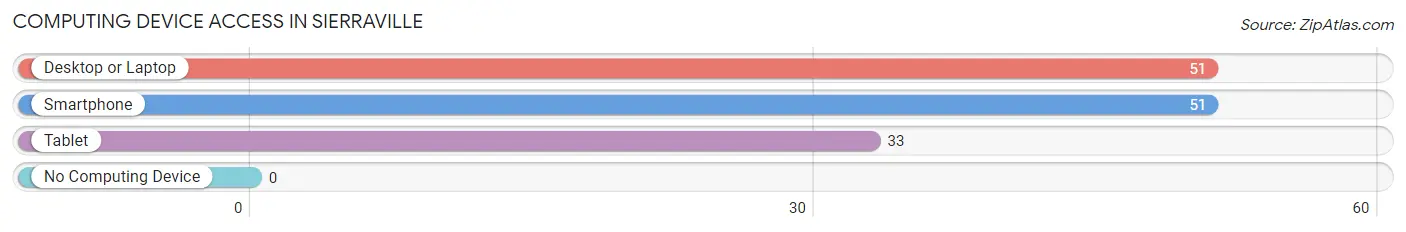
| Device Type | # Households | % Households |
| Desktop or Laptop | 51 | 73.9% |
| Smartphone | 51 | 73.9% |
| Tablet | 33 | 47.8% |
| No Computing Device | 0 | 0.0% |
| Total | 69 | 100.0% |
Internet Access in Sierraville
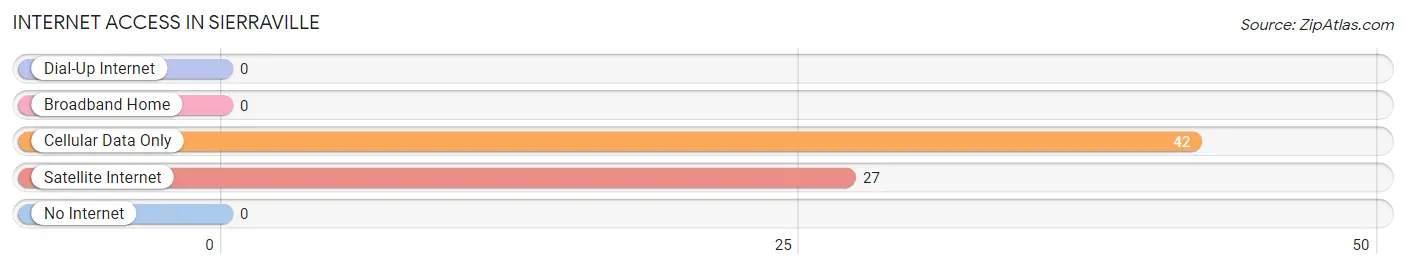
| Internet Type | # Households | % Households |
| Dial-Up Internet | 0 | 0.0% |
| Broadband Home | 0 | 0.0% |
| Cellular Data Only | 42 | 60.9% |
| Satellite Internet | 27 | 39.1% |
| No Internet | 0 | 0.0% |
| Total | 69 | 100.0% |
Sierraville Summary
Sierraville is a small unincorporated community located in Sierra County, California, United States. It is situated in the Sierra Valley, at an elevation of 4,945 feet (1,507 m). The population was estimated to be around 200 in 2020.
History
Sierraville was founded in 1852 by a group of miners who were searching for gold in the Sierra Nevada Mountains. The town was originally called “Sierra City”, but the name was changed to Sierraville in 1854. The town was a popular stop for travelers on the California Trail, and it was also a major supply center for the mining camps in the area.
In the late 1800s, Sierraville was a bustling town with several stores, saloons, and hotels. It was also home to a post office, a school, and a stagecoach station. The town was a popular destination for tourists, and it was known for its beautiful scenery and outdoor activities.
In the early 1900s, the town began to decline as the mining industry in the area declined. The population decreased, and many of the businesses closed. In the 1950s, the town was revitalized when the Sierra Valley was designated as a National Forest. This brought new visitors to the area, and the town began to grow again.
Geography
Sierraville is located in the Sierra Valley, which is part of the Sierra Nevada mountain range. The valley is surrounded by the Sierra Buttes to the east, the Sierra Nevada Mountains to the west, and the Cascade Range to the north. The town is situated at an elevation of 4,945 feet (1,507 m).
The climate in Sierraville is semi-arid, with hot summers and cold winters. The average annual temperature is around 50°F (10°C). The average annual precipitation is around 20 inches (51 cm).
Economy
Sierraville’s economy is largely based on tourism. The town is a popular destination for outdoor activities such as fishing, camping, hiking, and skiing. There are also several restaurants, stores, and lodging options in the area.
The town is also home to several small businesses, including a sawmill, a woodworking shop, and a general store. The town is also home to a small airport, which serves as a base for private aircraft.
Demographics
As of the 2010 census, the population of Sierraville was estimated to be around 200. The racial makeup of the town was 95.0% White, 0.5% African American, 0.5% Native American, 0.5% Asian, 0.5% Pacific Islander, and 2.5% from other races. The median household income was $37,500, and the median family income was $41,250.
Conclusion
Sierraville is a small unincorporated community located in Sierra County, California. It was founded in 1852 by a group of miners, and it was a popular stop for travelers on the California Trail. The town has a semi-arid climate, and its economy is largely based on tourism. The population of Sierraville was estimated to be around 200 in 2020.
Common Questions
What is Per Capita Income in Sierraville?
Per Capita income in Sierraville is $16,111.
What is the Median Family Income in Sierraville?
Median Family Income in Sierraville is $63,542.
What is Inequality or Gini Index in Sierraville?
Inequality or Gini Index in Sierraville is 0.33.
What is the Total Population of Sierraville?
Total Population of Sierraville is 227.
What is the Total Male Population of Sierraville?
Total Male Population of Sierraville is 29.
What is the Total Female Population of Sierraville?
Total Female Population of Sierraville is 198.
What is the Ratio of Males per 100 Females in Sierraville?
There are 14.65 Males per 100 Females in Sierraville.
What is the Ratio of Females per 100 Males in Sierraville?
There are 682.76 Females per 100 Males in Sierraville.
What is the Median Population Age in Sierraville?
Median Population Age in Sierraville is 22.4 Years.
What is the Average Family Size in Sierraville
Average Family Size in Sierraville is 5.6 People.
What is the Average Household Size in Sierraville
Average Household Size in Sierraville is 3.2 People.
How Large is the Labor Force in Sierraville?
There are 111 People in the Labor Forcein in Sierraville.
What is the Percentage of People in the Labor Force in Sierraville?
59.7% of People are in the Labor Force in Sierraville.