Shingle Springs, CA Map & Demographics
Shingle Springs Map
Shingle Springs Overview
$58,085
PER CAPITA INCOME
$124,766
AVG FAMILY INCOME
$105,789
AVG HOUSEHOLD INCOME
34.9%
WAGE / INCOME GAP [ % ]
65.1¢/ $1
WAGE / INCOME GAP [ $ ]
0.47
INEQUALITY / GINI INDEX
3,703
TOTAL POPULATION
1,836
MALE POPULATION
1,867
FEMALE POPULATION
98.34
MALES / 100 FEMALES
101.69
FEMALES / 100 MALES
47.6
MEDIAN AGE
3.0
AVG FAMILY SIZE
2.5
AVG HOUSEHOLD SIZE
1,651
LABOR FORCE [ PEOPLE ]
54.3%
PERCENT IN LABOR FORCE
5.9%
UNEMPLOYMENT RATE
Shingle Springs Zip Codes
Shingle Springs Area Codes
Income in Shingle Springs
Income Overview in Shingle Springs
Per Capita Income in Shingle Springs is $58,085, while median incomes of families and households are $124,766 and $105,789 respectively.
| Characteristic | Number | Measure |
| Per Capita Income | 3,703 | $58,085 |
| Median Family Income | 971 | $124,766 |
| Mean Family Income | 971 | $173,193 |
| Median Household Income | 1,482 | $105,789 |
| Mean Household Income | 1,482 | $143,093 |
| Income Deficit | 971 | $0 |
| Wage / Income Gap (%) | 3,703 | 34.94% |
| Wage / Income Gap ($) | 3,703 | 65.06¢ per $1 |
| Gini / Inequality Index | 3,703 | 0.47 |
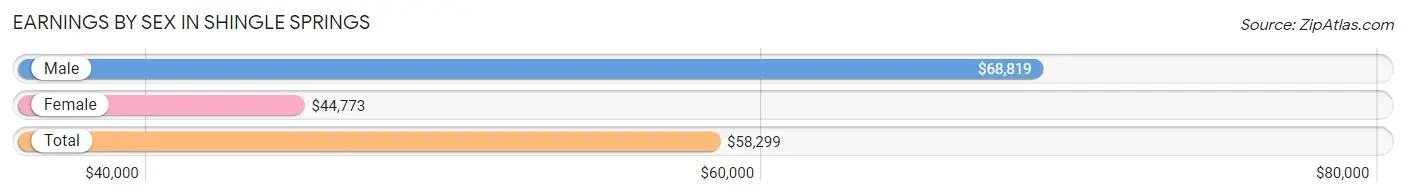
Earnings by Sex in Shingle Springs
Average Earnings in Shingle Springs are $58,299, $68,819 for men and $44,773 for women, a difference of 34.9%.
| Sex | Number | Average Earnings |
| Male | 837 (47.9%) | $68,819 |
| Female | 912 (52.1%) | $44,773 |
| Total | 1,749 (100.0%) | $58,299 |
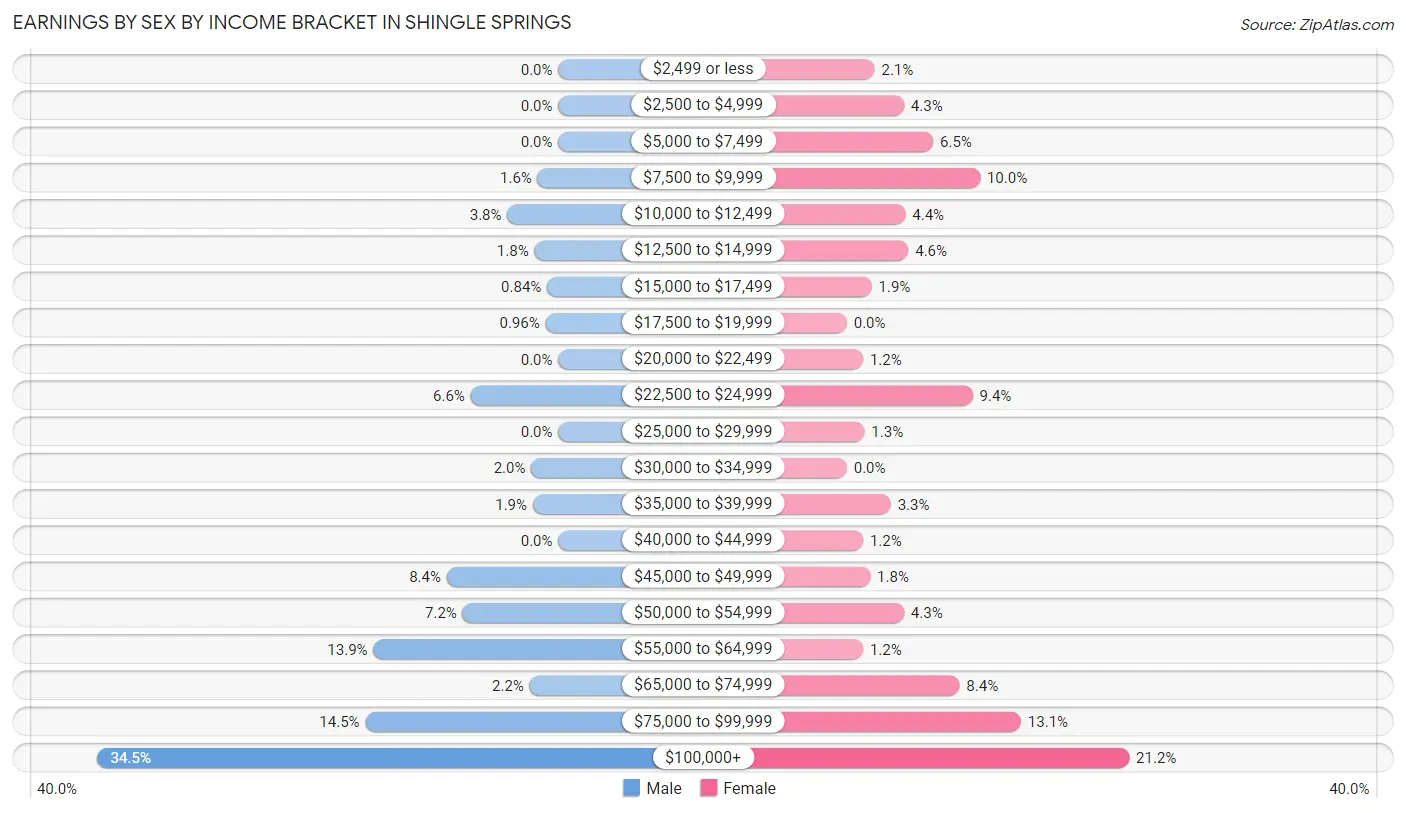
Earnings by Sex by Income Bracket in Shingle Springs
The most common earnings brackets in Shingle Springs are $100,000+ for men (289 | 34.5%) and $100,000+ for women (193 | 21.2%).
| Income | Male | Female |
| $2,499 or less | 0 (0.0%) | 19 (2.1%) |
| $2,500 to $4,999 | 0 (0.0%) | 39 (4.3%) |
| $5,000 to $7,499 | 0 (0.0%) | 59 (6.5%) |
| $7,500 to $9,999 | 13 (1.5%) | 91 (10.0%) |
| $10,000 to $12,499 | 32 (3.8%) | 40 (4.4%) |
| $12,500 to $14,999 | 15 (1.8%) | 42 (4.6%) |
| $15,000 to $17,499 | 7 (0.8%) | 17 (1.9%) |
| $17,500 to $19,999 | 8 (1.0%) | 0 (0.0%) |
| $20,000 to $22,499 | 0 (0.0%) | 11 (1.2%) |
| $22,500 to $24,999 | 55 (6.6%) | 86 (9.4%) |
| $25,000 to $29,999 | 0 (0.0%) | 12 (1.3%) |
| $30,000 to $34,999 | 17 (2.0%) | 0 (0.0%) |
| $35,000 to $39,999 | 16 (1.9%) | 30 (3.3%) |
| $40,000 to $44,999 | 0 (0.0%) | 11 (1.2%) |
| $45,000 to $49,999 | 70 (8.4%) | 16 (1.8%) |
| $50,000 to $54,999 | 60 (7.2%) | 39 (4.3%) |
| $55,000 to $64,999 | 116 (13.9%) | 11 (1.2%) |
| $65,000 to $74,999 | 18 (2.1%) | 77 (8.4%) |
| $75,000 to $99,999 | 121 (14.5%) | 119 (13.1%) |
| $100,000+ | 289 (34.5%) | 193 (21.2%) |
| Total | 837 (100.0%) | 912 (100.0%) |
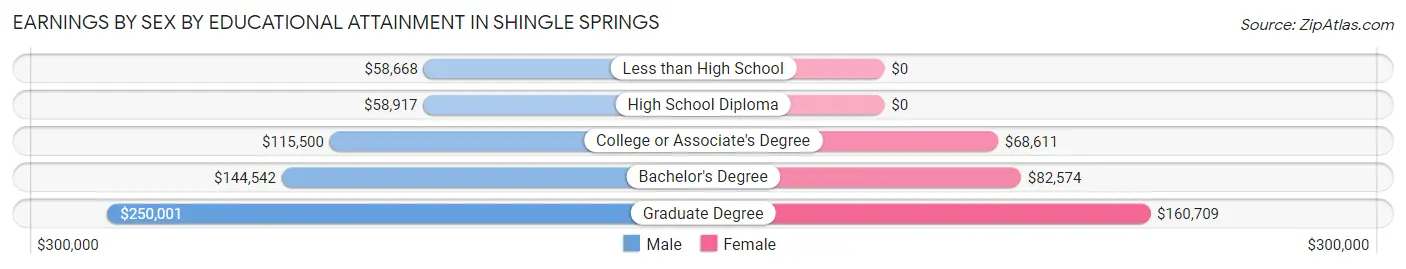
Earnings by Sex by Educational Attainment in Shingle Springs
Average earnings in Shingle Springs are $93,553 for men and $67,878 for women, a difference of 27.4%. Men with an educational attainment of graduate degree enjoy the highest average annual earnings of $250,001, while those with less than high school education earn the least with $58,668. Women with an educational attainment of graduate degree earn the most with the average annual earnings of $160,709, while those with college or associate's degree education have the smallest earnings of $68,611.
| Educational Attainment | Male Income | Female Income |
| Less than High School | $58,668 | $0 |
| High School Diploma | $58,917 | $0 |
| College or Associate's Degree | $115,500 | $68,611 |
| Bachelor's Degree | $144,542 | $82,574 |
| Graduate Degree | $250,001 | $160,709 |
| Total | $93,553 | $67,878 |
Family Income in Shingle Springs
Family Income Brackets in Shingle Springs
According to the Shingle Springs family income data, there are 316 families falling into the $200,000+ income range, which is the most common income bracket and makes up 32.5% of all families.
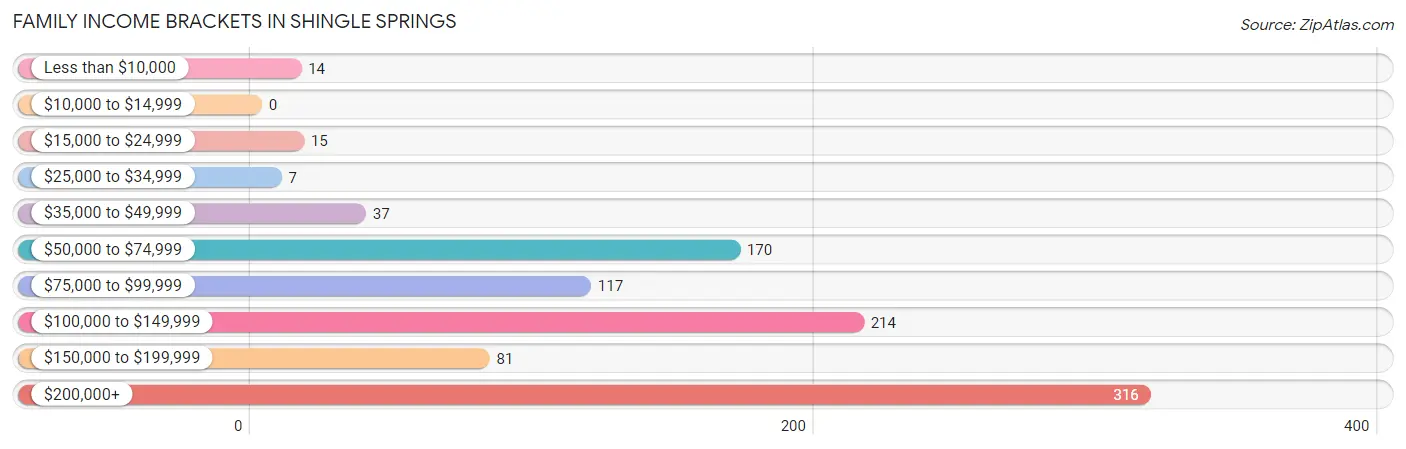
| Income Bracket | # Families | % Families |
| Less than $10,000 | 14 | 1.4% |
| $10,000 to $14,999 | 0 | 0.0% |
| $15,000 to $24,999 | 15 | 1.5% |
| $25,000 to $34,999 | 7 | 0.7% |
| $35,000 to $49,999 | 37 | 3.8% |
| $50,000 to $74,999 | 170 | 17.5% |
| $75,000 to $99,999 | 117 | 12.0% |
| $100,000 to $149,999 | 214 | 22.0% |
| $150,000 to $199,999 | 81 | 8.3% |
| $200,000+ | 316 | 32.5% |
Family Income by Famaliy Size in Shingle Springs
3-person families (211 | 21.7%) account for the highest median family income in Shingle Springs with $210,765 per family, while 3-person families (211 | 21.7%) have the highest median income of $70,255 per family member.
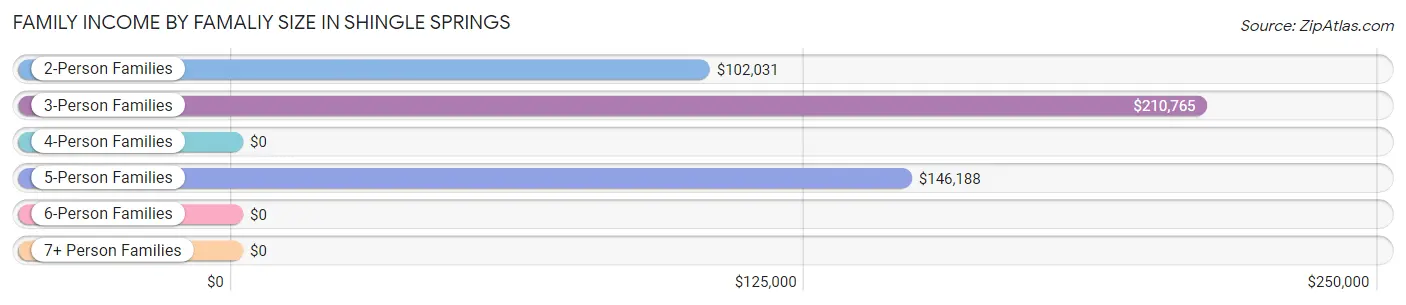
| Income Bracket | # Families | Median Income |
| 2-Person Families | 538 (55.4%) | $102,031 |
| 3-Person Families | 211 (21.7%) | $210,765 |
| 4-Person Families | 133 (13.7%) | $0 |
| 5-Person Families | 51 (5.2%) | $146,188 |
| 6-Person Families | 12 (1.2%) | $0 |
| 7+ Person Families | 26 (2.7%) | $0 |
| Total | 971 (100.0%) | $124,766 |
Family Income by Number of Earners in Shingle Springs
The median family income in Shingle Springs is $124,766, with families comprising 1 earner (352) having the highest median family income of $210,187, while families with no earners (266) have the lowest median family income of $86,404, accounting for 36.2% and 27.4% of families, respectively.
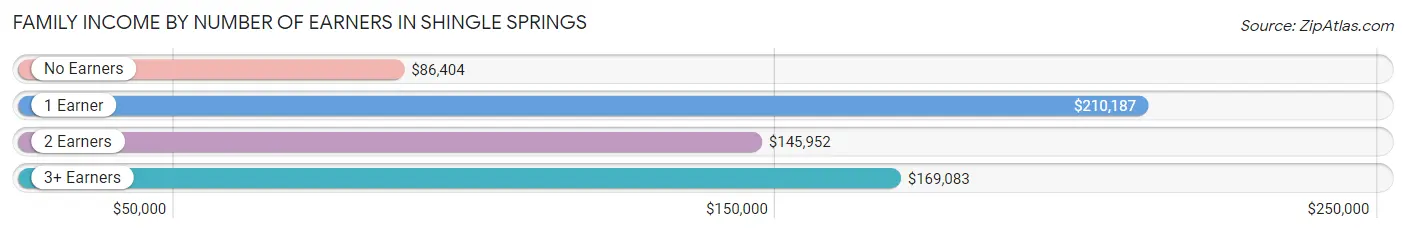
| Number of Earners | # Families | Median Income |
| No Earners | 266 (27.4%) | $86,404 |
| 1 Earner | 352 (36.2%) | $210,187 |
| 2 Earners | 228 (23.5%) | $145,952 |
| 3+ Earners | 125 (12.9%) | $169,083 |
| Total | 971 (100.0%) | $124,766 |
Household Income in Shingle Springs
Household Income Brackets in Shingle Springs
With 359 households falling in the category, the $200,000+ income range is the most frequent in Shingle Springs, accounting for 24.2% of all households. In contrast, only 33 households (2.2%) fall into the $15,000 to $24,999 income bracket, making it the least populous group.
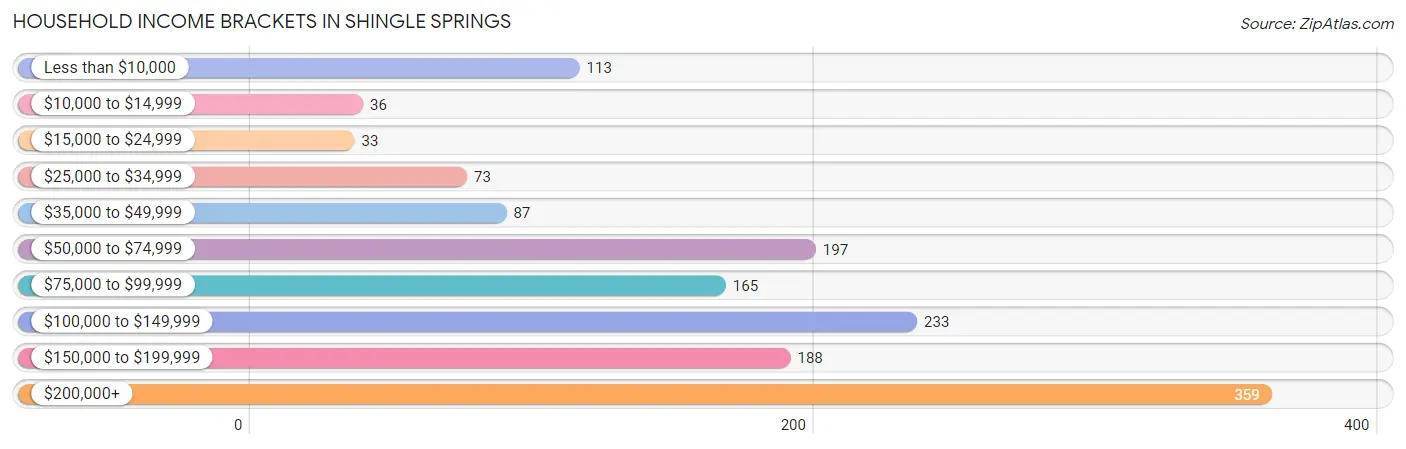
| Income Bracket | # Households | % Households |
| Less than $10,000 | 113 | 7.6% |
| $10,000 to $14,999 | 36 | 2.4% |
| $15,000 to $24,999 | 33 | 2.2% |
| $25,000 to $34,999 | 73 | 4.9% |
| $35,000 to $49,999 | 87 | 5.9% |
| $50,000 to $74,999 | 197 | 13.3% |
| $75,000 to $99,999 | 165 | 11.1% |
| $100,000 to $149,999 | 233 | 15.7% |
| $150,000 to $199,999 | 188 | 12.7% |
| $200,000+ | 359 | 24.2% |
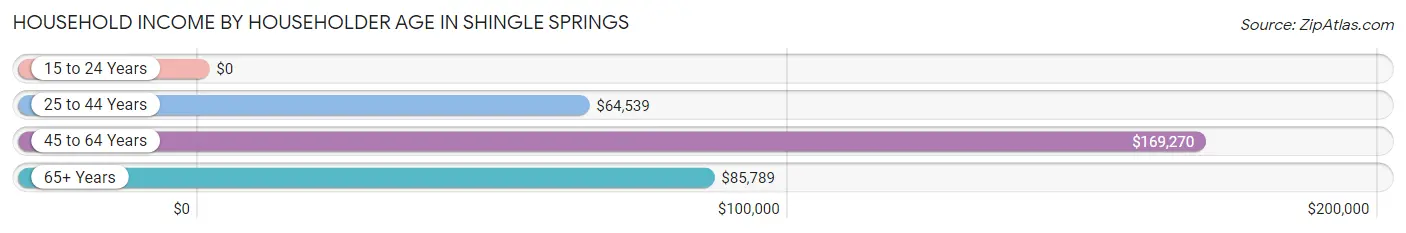
Household Income by Householder Age in Shingle Springs
The median household income in Shingle Springs is $105,789, with the highest median household income of $169,270 found in the 45 to 64 years age bracket for the primary householder. A total of 682 households (46.0%) fall into this category. Meanwhile, the 15 to 24 years age bracket for the primary householder has the lowest median household income of $0, with 98 households (6.6%) in this group.
| Income Bracket | # Households | Median Income |
| 15 to 24 Years | 98 (6.6%) | $0 |
| 25 to 44 Years | 154 (10.4%) | $64,539 |
| 45 to 64 Years | 682 (46.0%) | $169,270 |
| 65+ Years | 548 (37.0%) | $85,789 |
| Total | 1,482 (100.0%) | $105,789 |
Poverty in Shingle Springs
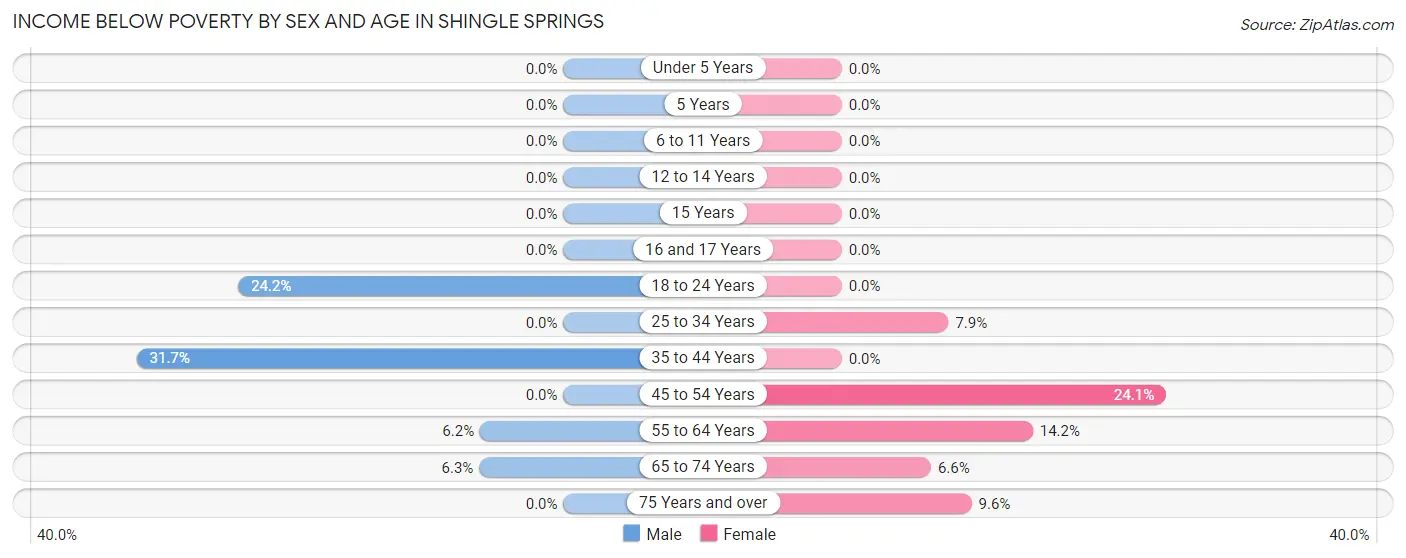
Income Below Poverty by Sex and Age in Shingle Springs
With 6.3% poverty level for males and 8.9% for females among the residents of Shingle Springs, 35 to 44 year old males and 45 to 54 year old females are the most vulnerable to poverty, with 32 males (31.7%) and 84 females (24.1%) in their respective age groups living below the poverty level.
| Age Bracket | Male | Female |
| Under 5 Years | 0 (0.0%) | 0 (0.0%) |
| 5 Years | 0 (0.0%) | 0 (0.0%) |
| 6 to 11 Years | 0 (0.0%) | 0 (0.0%) |
| 12 to 14 Years | 0 (0.0%) | 0 (0.0%) |
| 15 Years | 0 (0.0%) | 0 (0.0%) |
| 16 and 17 Years | 0 (0.0%) | 0 (0.0%) |
| 18 to 24 Years | 50 (24.1%) | 0 (0.0%) |
| 25 to 34 Years | 0 (0.0%) | 16 (7.9%) |
| 35 to 44 Years | 32 (31.7%) | 0 (0.0%) |
| 45 to 54 Years | 0 (0.0%) | 84 (24.1%) |
| 55 to 64 Years | 18 (6.2%) | 20 (14.2%) |
| 65 to 74 Years | 16 (6.2%) | 29 (6.6%) |
| 75 Years and over | 0 (0.0%) | 16 (9.6%) |
| Total | 116 (6.3%) | 165 (8.9%) |
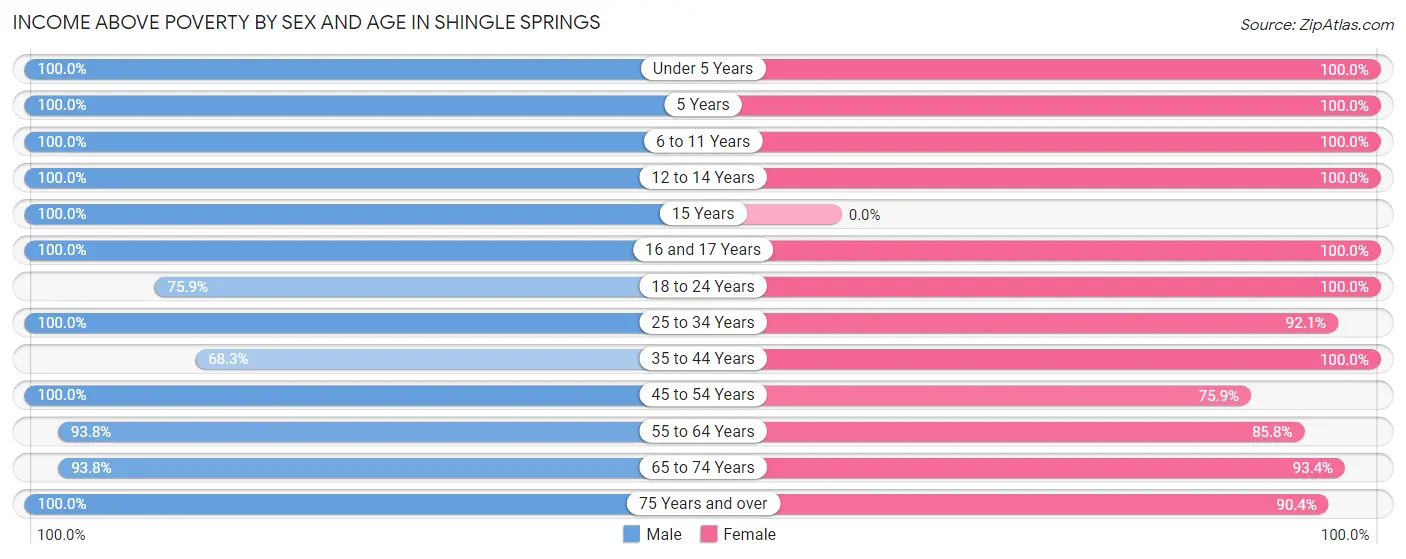
Income Above Poverty by Sex and Age in Shingle Springs
According to the poverty statistics in Shingle Springs, males aged under 5 years and females aged under 5 years are the age groups that are most secure financially, with 100.0% of males and 100.0% of females in these age groups living above the poverty line.
| Age Bracket | Male | Female |
| Under 5 Years | 49 (100.0%) | 52 (100.0%) |
| 5 Years | 49 (100.0%) | 55 (100.0%) |
| 6 to 11 Years | 119 (100.0%) | 173 (100.0%) |
| 12 to 14 Years | 115 (100.0%) | 8 (100.0%) |
| 15 Years | 24 (100.0%) | 0 (0.0%) |
| 16 and 17 Years | 25 (100.0%) | 40 (100.0%) |
| 18 to 24 Years | 157 (75.8%) | 135 (100.0%) |
| 25 to 34 Years | 126 (100.0%) | 186 (92.1%) |
| 35 to 44 Years | 69 (68.3%) | 89 (100.0%) |
| 45 to 54 Years | 316 (100.0%) | 265 (75.9%) |
| 55 to 64 Years | 273 (93.8%) | 121 (85.8%) |
| 65 to 74 Years | 240 (93.8%) | 409 (93.4%) |
| 75 Years and over | 158 (100.0%) | 150 (90.4%) |
| Total | 1,720 (93.7%) | 1,683 (91.1%) |
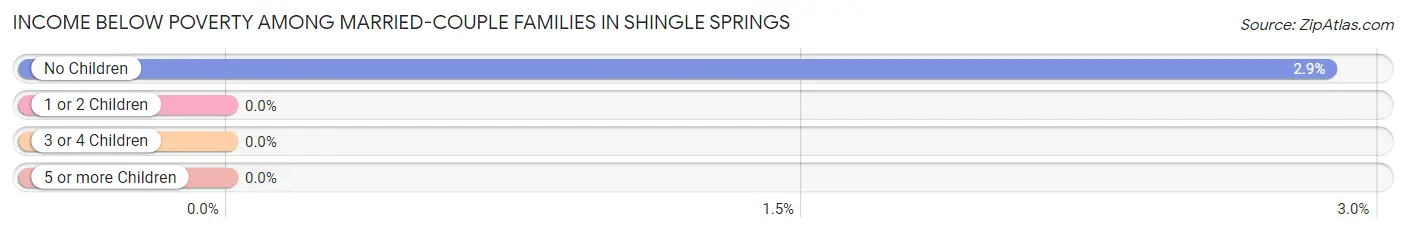
Income Below Poverty Among Married-Couple Families in Shingle Springs
The poverty statistics for married-couple families in Shingle Springs show that 1.8% or 14 of the total 772 families live below the poverty line. Families with no children have the highest poverty rate of 2.9%, comprising of 14 families. On the other hand, families with 1 or 2 children have the lowest poverty rate of 0.0%, which includes 0 families.
| Children | Above Poverty | Below Poverty |
| No Children | 473 (97.1%) | 14 (2.9%) |
| 1 or 2 Children | 228 (100.0%) | 0 (0.0%) |
| 3 or 4 Children | 49 (100.0%) | 0 (0.0%) |
| 5 or more Children | 8 (100.0%) | 0 (0.0%) |
| Total | 758 (98.2%) | 14 (1.8%) |
Income Below Poverty Among Single-Parent Households in Shingle Springs
| Children | Single Father | Single Mother |
| No Children | 0 (0.0%) | 0 (0.0%) |
| 1 or 2 Children | 0 (0.0%) | 0 (0.0%) |
| 3 or 4 Children | 0 (0.0%) | 0 (0.0%) |
| 5 or more Children | 0 (0.0%) | 0 (0.0%) |
| Total | 0 (0.0%) | 0 (0.0%) |
Income Below Poverty Among Married-Couple vs Single-Parent Households in Shingle Springs
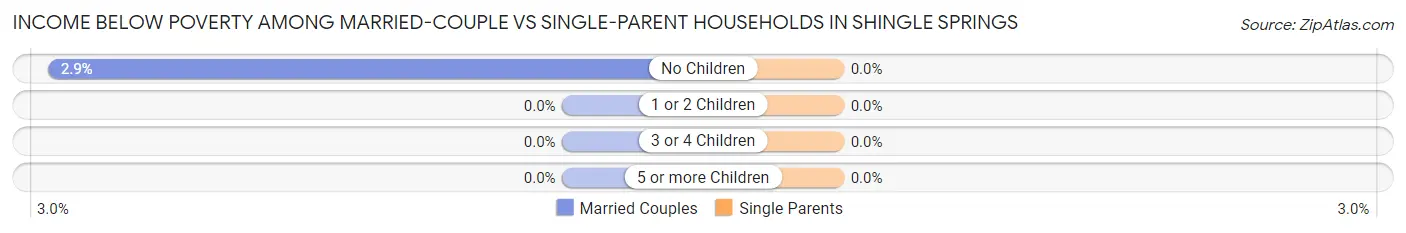
| Children | Married-Couple Families | Single-Parent Households |
| No Children | 14 (2.9%) | 0 (0.0%) |
| 1 or 2 Children | 0 (0.0%) | 0 (0.0%) |
| 3 or 4 Children | 0 (0.0%) | 0 (0.0%) |
| 5 or more Children | 0 (0.0%) | 0 (0.0%) |
| Total | 14 (1.8%) | 0 (0.0%) |
Race in Shingle Springs
The most populous races in Shingle Springs are White / Caucasian (3,164 | 85.4%), Hispanic or Latino (355 | 9.6%), and Two or more Races (322 | 8.7%).
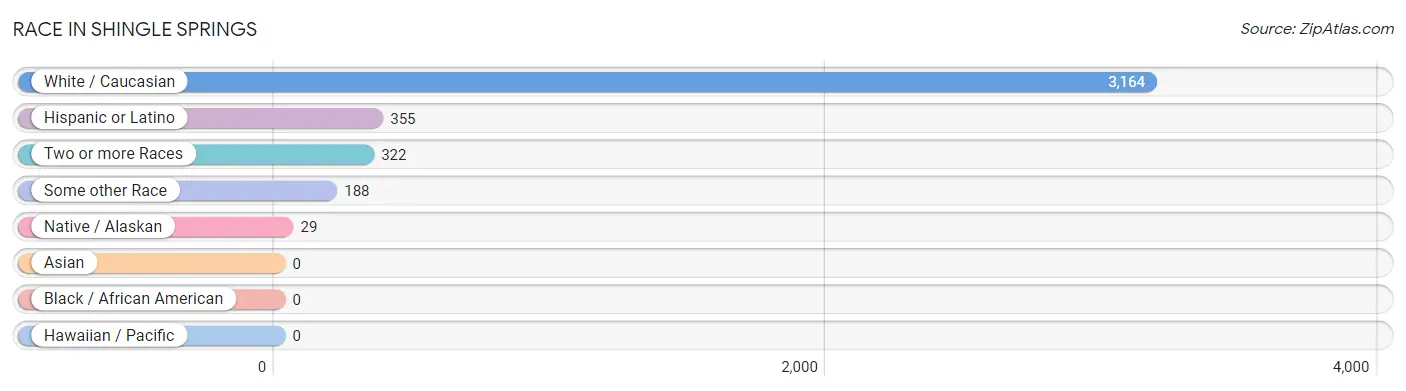
| Race | # Population | % Population |
| Asian | 0 | 0.0% |
| Black / African American | 0 | 0.0% |
| Hawaiian / Pacific | 0 | 0.0% |
| Hispanic or Latino | 355 | 9.6% |
| Native / Alaskan | 29 | 0.8% |
| White / Caucasian | 3,164 | 85.4% |
| Two or more Races | 322 | 8.7% |
| Some other Race | 188 | 5.1% |
| Total | 3,703 | 100.0% |
Ancestry in Shingle Springs
The most populous ancestries reported in Shingle Springs are German (751 | 20.3%), Irish (393 | 10.6%), English (345 | 9.3%), Mexican (297 | 8.0%), and Italian (258 | 7.0%), together accounting for 55.2% of all Shingle Springs residents.
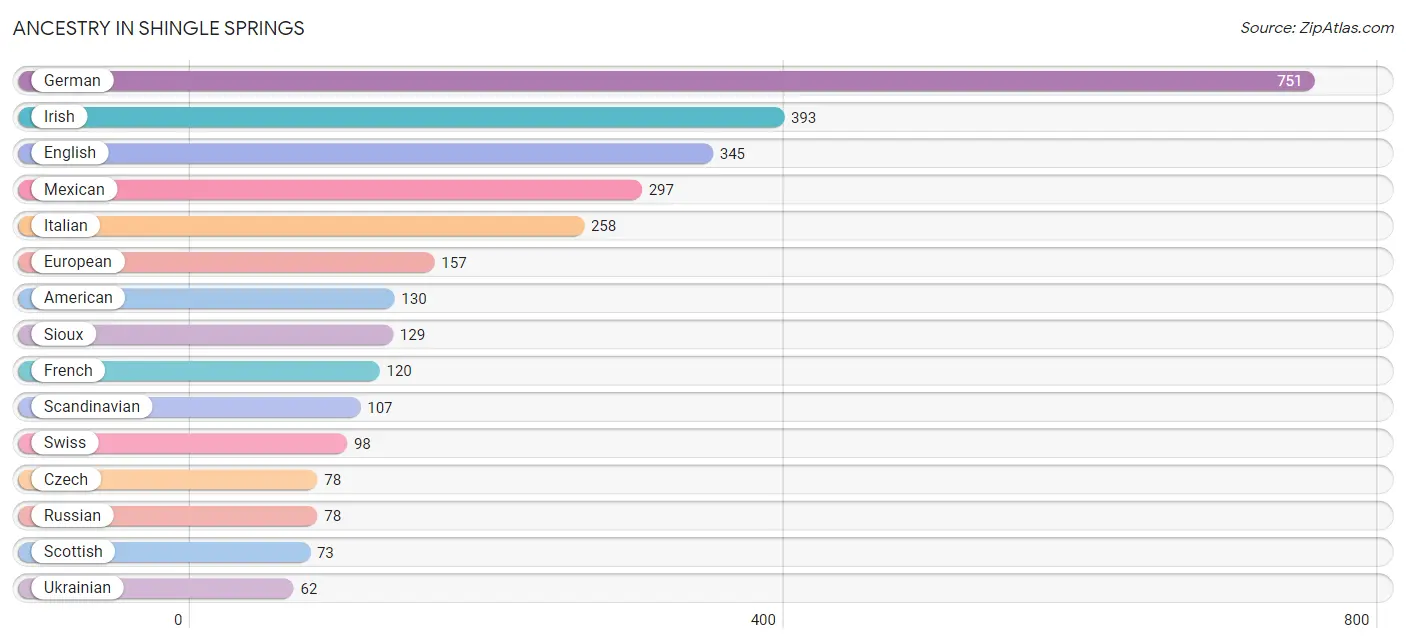
| Ancestry | # Population | % Population |
| American | 130 | 3.5% |
| Apache | 20 | 0.5% |
| Belgian | 32 | 0.9% |
| British | 28 | 0.8% |
| Canadian | 10 | 0.3% |
| Central American | 21 | 0.6% |
| Choctaw | 32 | 0.9% |
| Czech | 78 | 2.1% |
| Dutch | 13 | 0.4% |
| English | 345 | 9.3% |
| European | 157 | 4.2% |
| Finnish | 21 | 0.6% |
| French | 120 | 3.2% |
| French Canadian | 17 | 0.5% |
| German | 751 | 20.3% |
| Hungarian | 11 | 0.3% |
| Irish | 393 | 10.6% |
| Italian | 258 | 7.0% |
| Korean | 14 | 0.4% |
| Mexican | 297 | 8.0% |
| Mexican American Indian | 7 | 0.2% |
| Navajo | 20 | 0.5% |
| Nicaraguan | 21 | 0.6% |
| Northern European | 21 | 0.6% |
| Norwegian | 49 | 1.3% |
| Polish | 25 | 0.7% |
| Portuguese | 32 | 0.9% |
| Potawatomi | 32 | 0.9% |
| Romanian | 14 | 0.4% |
| Russian | 78 | 2.1% |
| Scandinavian | 107 | 2.9% |
| Scotch-Irish | 26 | 0.7% |
| Scottish | 73 | 2.0% |
| Sioux | 129 | 3.5% |
| Swedish | 48 | 1.3% |
| Swiss | 98 | 2.6% |
| Ukrainian | 62 | 1.7% |
| Welsh | 31 | 0.8% | View All 38 Rows |
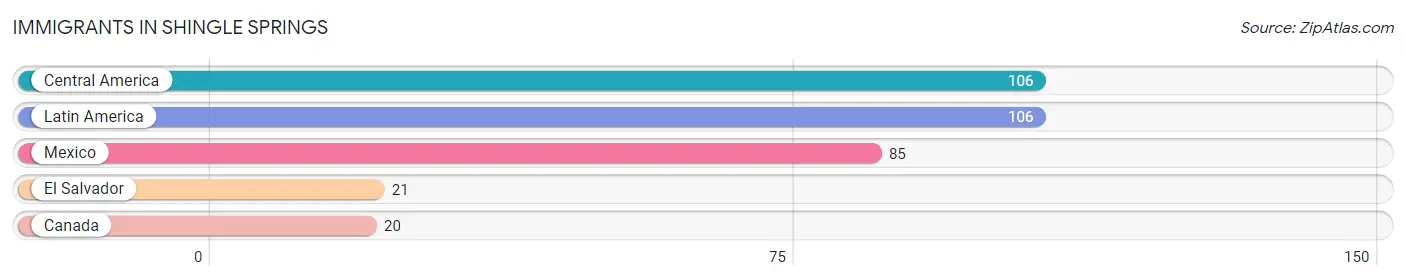
Immigrants in Shingle Springs
The most numerous immigrant groups reported in Shingle Springs came from Central America (106 | 2.9%), Latin America (106 | 2.9%), Mexico (85 | 2.3%), El Salvador (21 | 0.6%), and Canada (20 | 0.5%), together accounting for 9.1% of all Shingle Springs residents.
| Immigration Origin | # Population | % Population |
| Canada | 20 | 0.5% |
| Central America | 106 | 2.9% |
| El Salvador | 21 | 0.6% |
| Latin America | 106 | 2.9% |
| Mexico | 85 | 2.3% | View All 5 Rows |
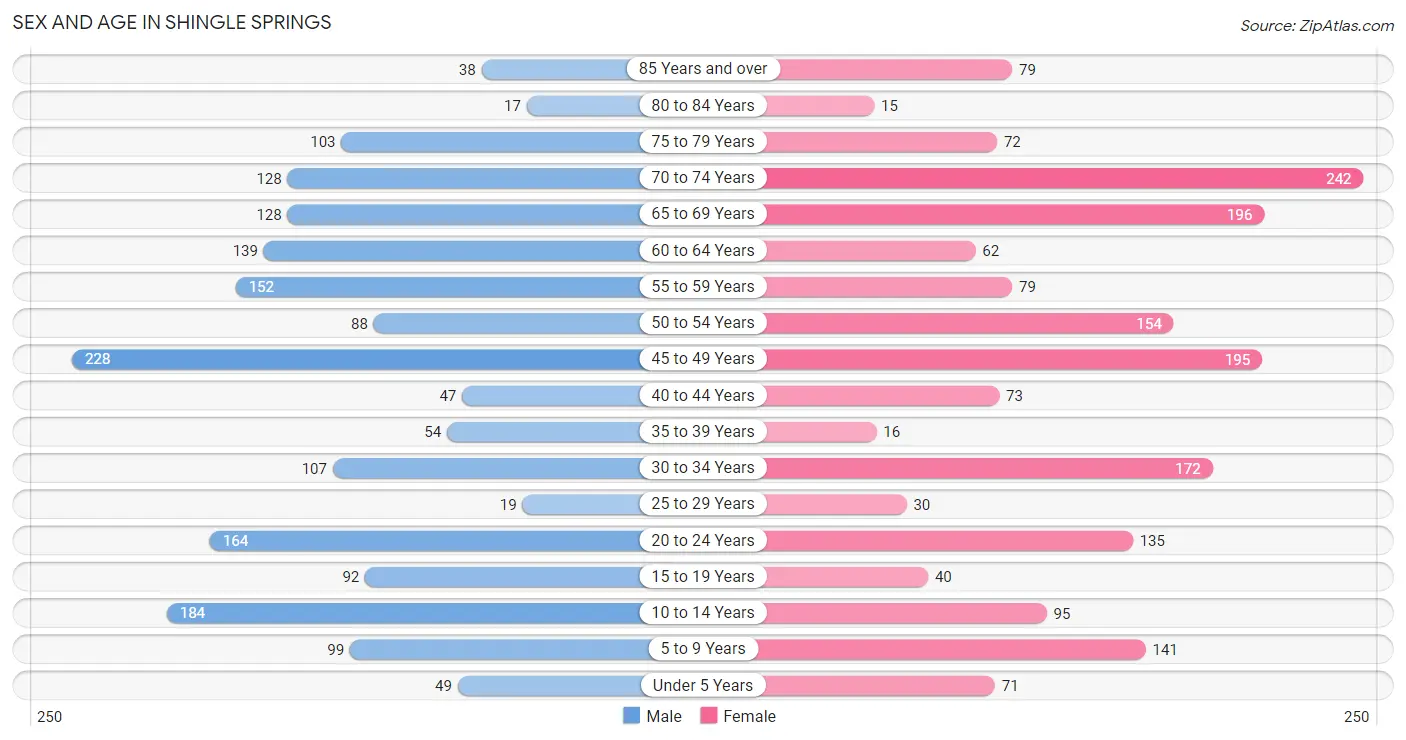
Sex and Age in Shingle Springs
Sex and Age in Shingle Springs
The most populous age groups in Shingle Springs are 45 to 49 Years (228 | 12.4%) for men and 70 to 74 Years (242 | 13.0%) for women.
| Age Bracket | Male | Female |
| Under 5 Years | 49 (2.7%) | 71 (3.8%) |
| 5 to 9 Years | 99 (5.4%) | 141 (7.5%) |
| 10 to 14 Years | 184 (10.0%) | 95 (5.1%) |
| 15 to 19 Years | 92 (5.0%) | 40 (2.1%) |
| 20 to 24 Years | 164 (8.9%) | 135 (7.2%) |
| 25 to 29 Years | 19 (1.0%) | 30 (1.6%) |
| 30 to 34 Years | 107 (5.8%) | 172 (9.2%) |
| 35 to 39 Years | 54 (2.9%) | 16 (0.9%) |
| 40 to 44 Years | 47 (2.6%) | 73 (3.9%) |
| 45 to 49 Years | 228 (12.4%) | 195 (10.4%) |
| 50 to 54 Years | 88 (4.8%) | 154 (8.3%) |
| 55 to 59 Years | 152 (8.3%) | 79 (4.2%) |
| 60 to 64 Years | 139 (7.6%) | 62 (3.3%) |
| 65 to 69 Years | 128 (7.0%) | 196 (10.5%) |
| 70 to 74 Years | 128 (7.0%) | 242 (13.0%) |
| 75 to 79 Years | 103 (5.6%) | 72 (3.9%) |
| 80 to 84 Years | 17 (0.9%) | 15 (0.8%) |
| 85 Years and over | 38 (2.1%) | 79 (4.2%) |
| Total | 1,836 (100.0%) | 1,867 (100.0%) |
Families and Households in Shingle Springs
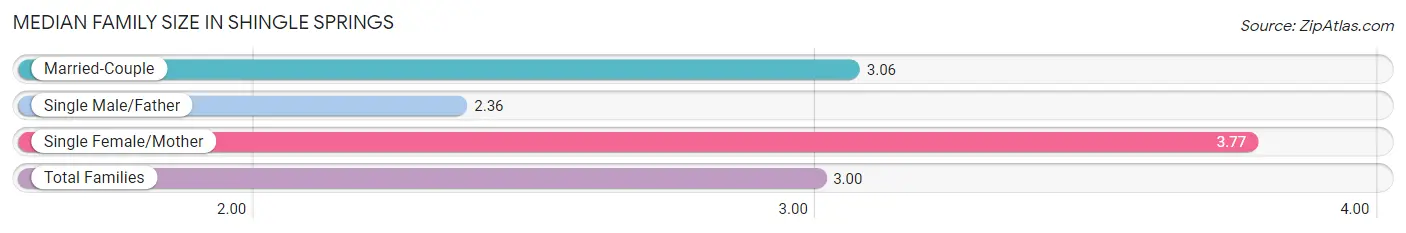
Median Family Size in Shingle Springs
The median family size in Shingle Springs is 3.00 persons per family, with single female/mother families (61 | 6.3%) accounting for the largest median family size of 3.77 persons per family. On the other hand, single male/father families (138 | 14.2%) represent the smallest median family size with 2.36 persons per family.
| Family Type | # Families | Family Size |
| Married-Couple | 772 (79.5%) | 3.06 |
| Single Male/Father | 138 (14.2%) | 2.36 |
| Single Female/Mother | 61 (6.3%) | 3.77 |
| Total Families | 971 (100.0%) | 3.00 |
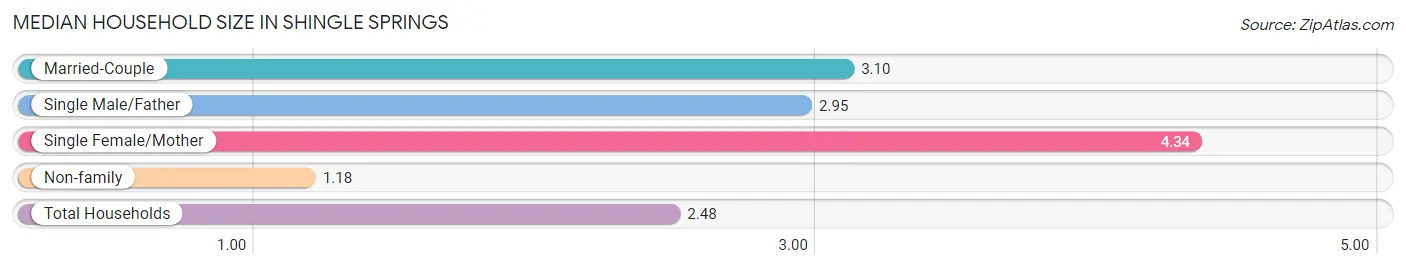
Median Household Size in Shingle Springs
The median household size in Shingle Springs is 2.48 persons per household, with single female/mother households (61 | 4.1%) accounting for the largest median household size of 4.34 persons per household. non-family households (511 | 34.5%) represent the smallest median household size with 1.18 persons per household.
| Household Type | # Households | Household Size |
| Married-Couple | 772 (52.1%) | 3.10 |
| Single Male/Father | 138 (9.3%) | 2.95 |
| Single Female/Mother | 61 (4.1%) | 4.34 |
| Non-family | 511 (34.5%) | 1.18 |
| Total Households | 1,482 (100.0%) | 2.48 |
Household Size by Marriage Status in Shingle Springs
Out of a total of 1,482 households in Shingle Springs, 971 (65.5%) are family households, while 511 (34.5%) are nonfamily households. The most numerous type of family households are 2-person households, comprising 475, and the most common type of nonfamily households are 1-person households, comprising 392.
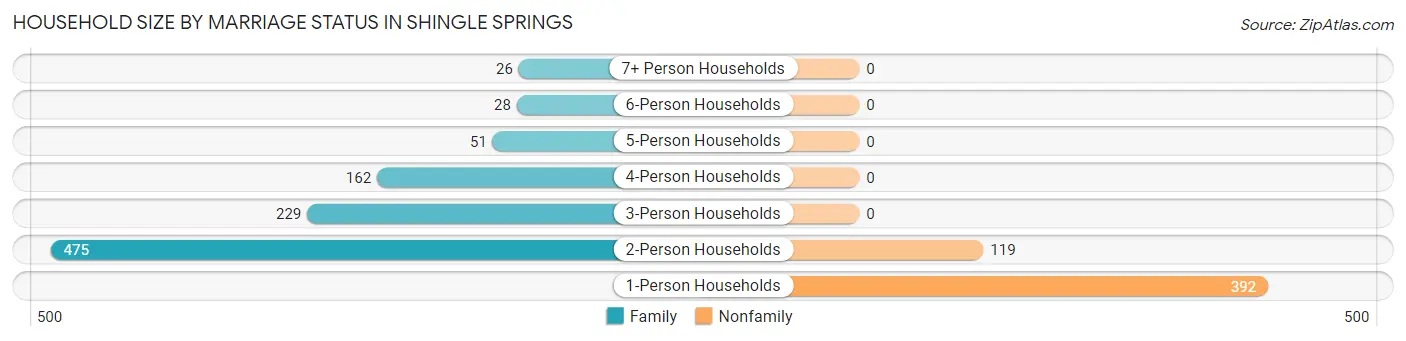
| Household Size | Family Households | Nonfamily Households |
| 1-Person Households | - | 392 (26.5%) |
| 2-Person Households | 475 (32.1%) | 119 (8.0%) |
| 3-Person Households | 229 (15.4%) | 0 (0.0%) |
| 4-Person Households | 162 (10.9%) | 0 (0.0%) |
| 5-Person Households | 51 (3.4%) | 0 (0.0%) |
| 6-Person Households | 28 (1.9%) | 0 (0.0%) |
| 7+ Person Households | 26 (1.8%) | 0 (0.0%) |
| Total | 971 (65.5%) | 511 (34.5%) |
Female Fertility in Shingle Springs
Fertility by Age in Shingle Springs
Average fertility rate in Shingle Springs is 9.0 births per 1,000 women. Women in the age bracket of 35 to 50 years have the highest fertility rate with 19.0 births per 1,000 women. Women in the age bracket of 35 to 50 years acount for 100.0% of all women with births.
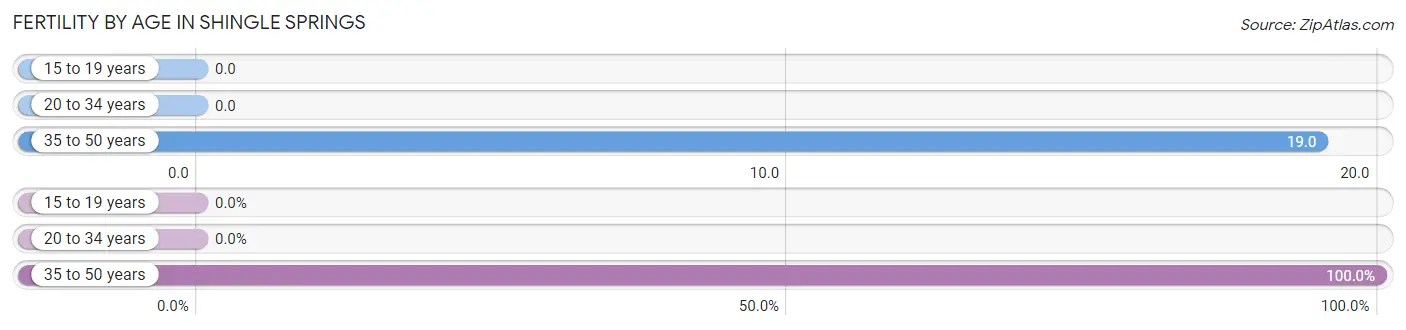
| Age Bracket | Women with Births | Births / 1,000 Women |
| 15 to 19 years | 0 (0.0%) | 0.0 |
| 20 to 34 years | 0 (0.0%) | 0.0 |
| 35 to 50 years | 6 (100.0%) | 19.0 |
| Total | 6 (100.0%) | 9.0 |
Fertility by Age by Marriage Status in Shingle Springs
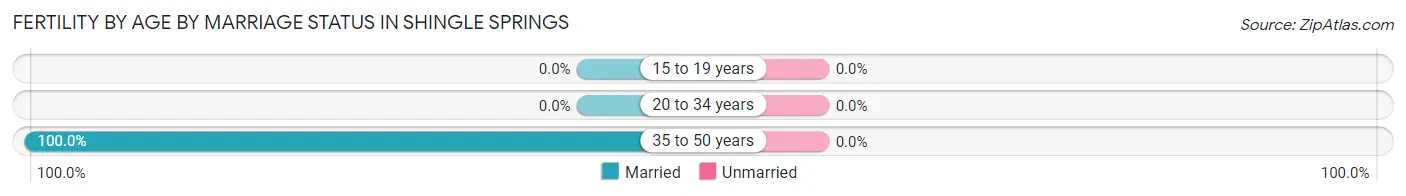
| Age Bracket | Married | Unmarried |
| 15 to 19 years | 0 (0.0%) | 0 (0.0%) |
| 20 to 34 years | 0 (0.0%) | 0 (0.0%) |
| 35 to 50 years | 6 (100.0%) | 0 (0.0%) |
| Total | 6 (100.0%) | 0 (0.0%) |
Fertility by Education in Shingle Springs
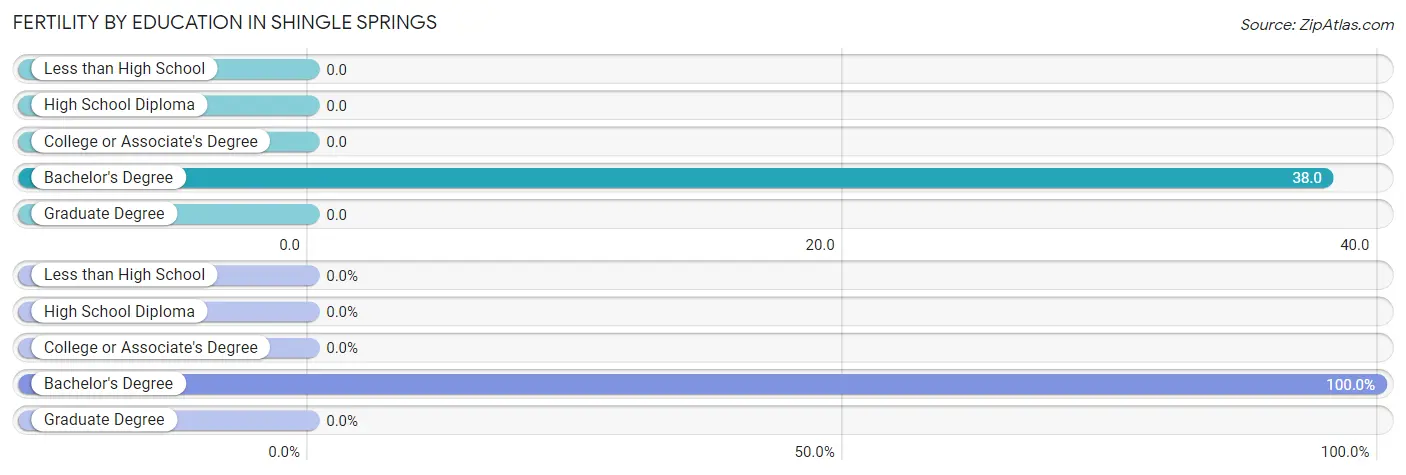
| Educational Attainment | Women with Births | Births / 1,000 Women |
| Less than High School | 0 (0.0%) | 0.0 |
| High School Diploma | 0 (0.0%) | 0.0 |
| College or Associate's Degree | 0 (0.0%) | 0.0 |
| Bachelor's Degree | 6 (100.0%) | 38.0 |
| Graduate Degree | 0 (0.0%) | 0.0 |
| Total | 6 (100.0%) | 9.0 |
Fertility by Education by Marriage Status in Shingle Springs
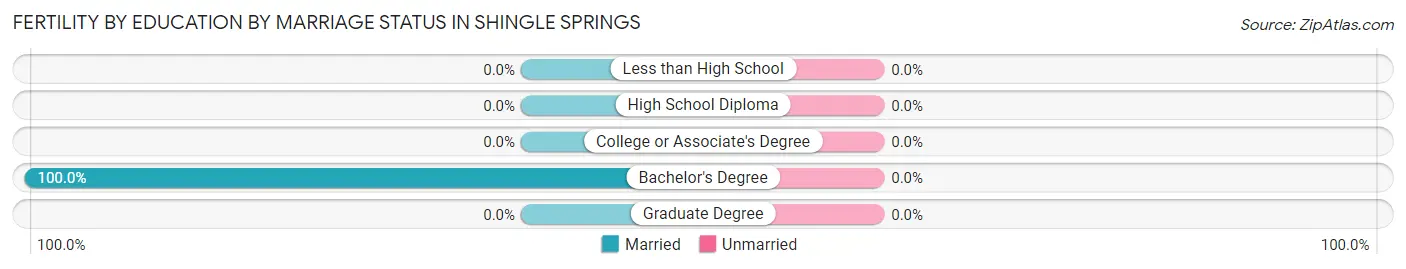
| Educational Attainment | Married | Unmarried |
| Less than High School | 0 (0.0%) | 0 (0.0%) |
| High School Diploma | 0 (0.0%) | 0 (0.0%) |
| College or Associate's Degree | 0 (0.0%) | 0 (0.0%) |
| Bachelor's Degree | 6 (100.0%) | 0 (0.0%) |
| Graduate Degree | 0 (0.0%) | 0 (0.0%) |
| Total | 6 (100.0%) | 0 (0.0%) |
Employment Characteristics in Shingle Springs
Employment by Class of Employer in Shingle Springs
Among the 1,556 employed individuals in Shingle Springs, private company employees (932 | 59.9%), local government employees (191 | 12.3%), and state government employees (171 | 11.0%) make up the most common classes of employment.
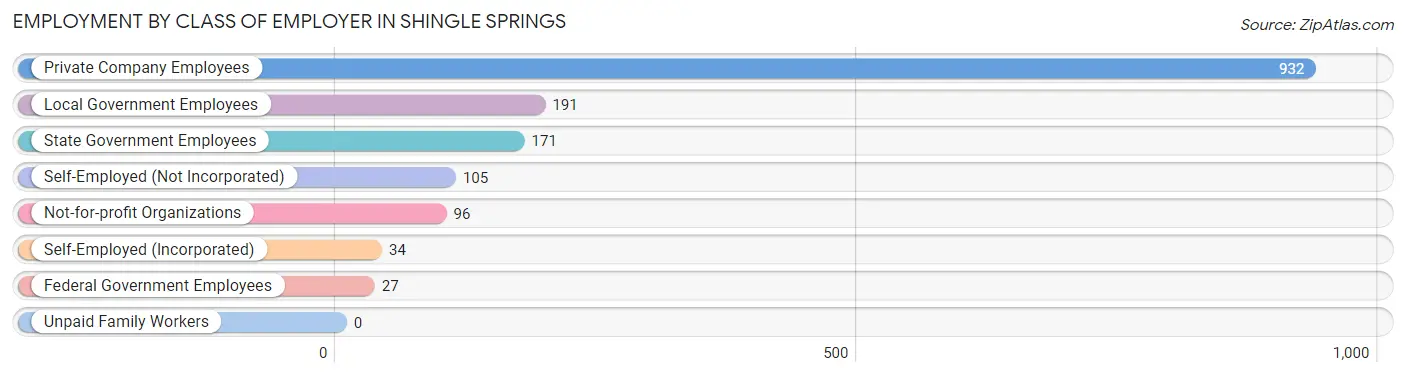
| Employer Class | # Employees | % Employees |
| Private Company Employees | 932 | 59.9% |
| Self-Employed (Incorporated) | 34 | 2.2% |
| Self-Employed (Not Incorporated) | 105 | 6.8% |
| Not-for-profit Organizations | 96 | 6.2% |
| Local Government Employees | 191 | 12.3% |
| State Government Employees | 171 | 11.0% |
| Federal Government Employees | 27 | 1.7% |
| Unpaid Family Workers | 0 | 0.0% |
| Total | 1,556 | 100.0% |
Employment Status by Age in Shingle Springs
According to the labor force statistics for Shingle Springs, out of the total population over 16 years of age (3,040), 54.3% or 1,651 individuals are in the labor force, with 5.9% or 97 of them unemployed. The age group with the highest labor force participation rate is 45 to 54 years, with 98.0% or 652 individuals in the labor force. Within the labor force, the 45 to 54 years age range has the highest percentage of unemployed individuals, with 12.6% or 82 of them being unemployed.
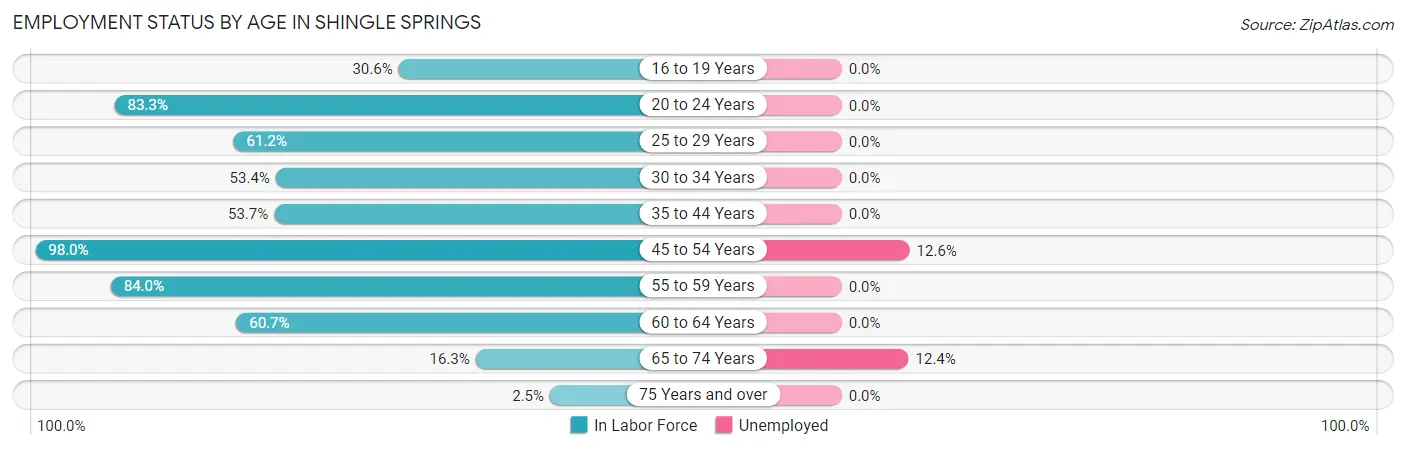
| Age Bracket | In Labor Force | Unemployed |
| 16 to 19 Years | 33 (30.6%) | 0 (0.0%) |
| 20 to 24 Years | 249 (83.3%) | 0 (0.0%) |
| 25 to 29 Years | 30 (61.2%) | 0 (0.0%) |
| 30 to 34 Years | 149 (53.4%) | 0 (0.0%) |
| 35 to 44 Years | 102 (53.7%) | 0 (0.0%) |
| 45 to 54 Years | 652 (98.0%) | 82 (12.6%) |
| 55 to 59 Years | 194 (84.0%) | 0 (0.0%) |
| 60 to 64 Years | 122 (60.7%) | 0 (0.0%) |
| 65 to 74 Years | 113 (16.3%) | 14 (12.4%) |
| 75 Years and over | 8 (2.5%) | 0 (0.0%) |
| Total | 1,651 (54.3%) | 97 (5.9%) |
Employment Status by Educational Attainment in Shingle Springs
According to labor force statistics for Shingle Springs, 77.3% of individuals (1,248) out of the total population between 25 and 64 years of age (1,615) are in the labor force, with 6.6% or 82 of them being unemployed. The group with the highest labor force participation rate are those with the educational attainment of bachelor's degree or higher, with 93.5% or 472 individuals in the labor force. Within the labor force, individuals with college / associate degree education have the highest percentage of unemployment, with 15.5% or 69 of them being unemployed.
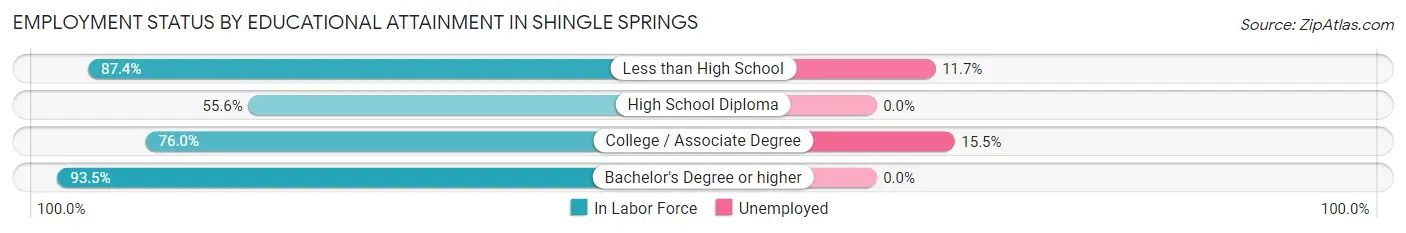
| Educational Attainment | In Labor Force | Unemployed |
| Less than High School | 111 (87.4%) | 15 (11.7%) |
| High School Diploma | 220 (55.6%) | 0 (0.0%) |
| College / Associate Degree | 446 (76.0%) | 91 (15.5%) |
| Bachelor's Degree or higher | 472 (93.5%) | 0 (0.0%) |
| Total | 1,248 (77.3%) | 107 (6.6%) |
Employment Occupations by Sex in Shingle Springs
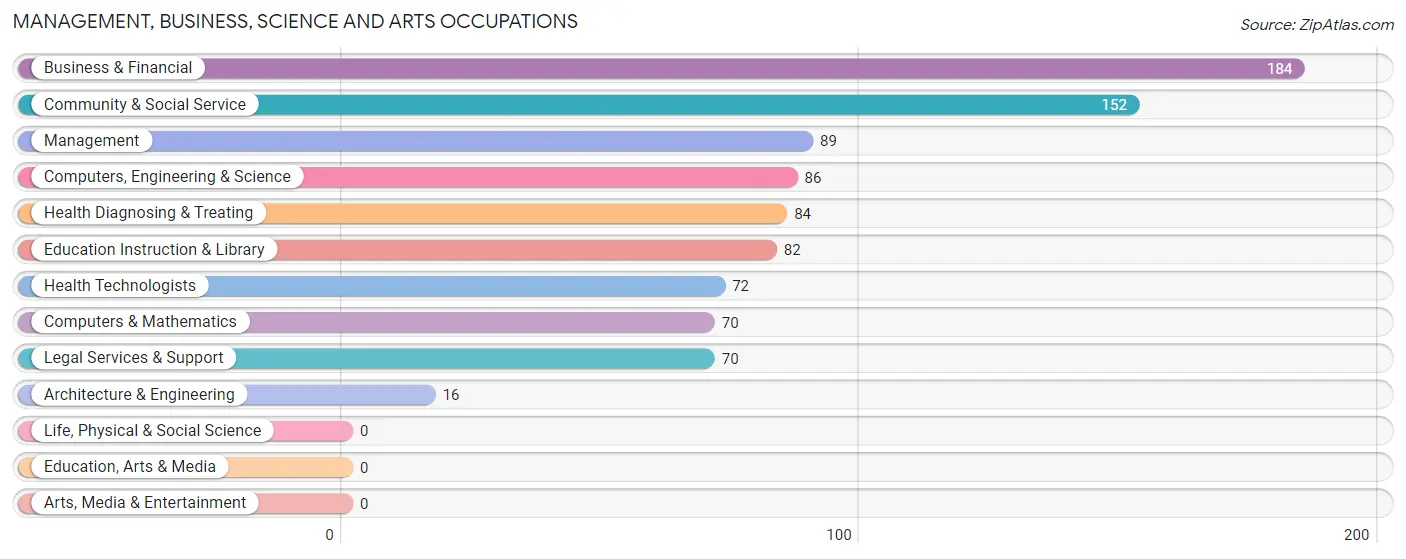
Management, Business, Science and Arts Occupations
The most common Management, Business, Science and Arts occupations in Shingle Springs are Business & Financial (184 | 12.1%), Community & Social Service (152 | 10.0%), Management (89 | 5.8%), Computers, Engineering & Science (86 | 5.6%), and Health Diagnosing & Treating (84 | 5.5%).
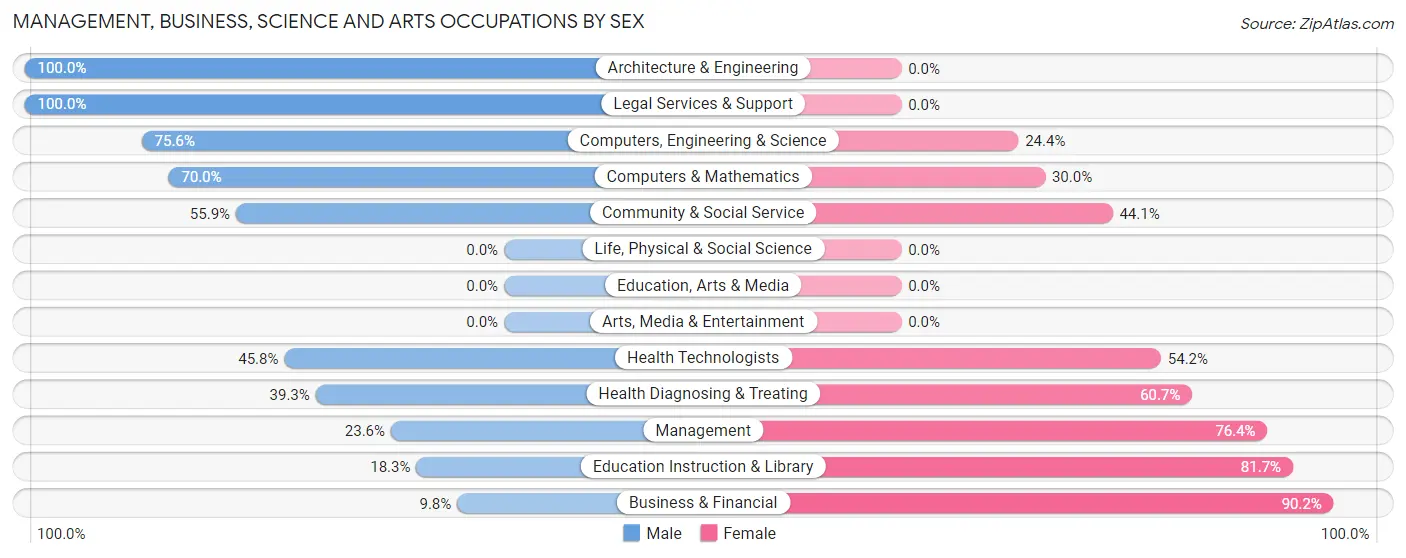
Management, Business, Science and Arts Occupations by Sex
Within the Management, Business, Science and Arts occupations in Shingle Springs, the most male-oriented occupations are Architecture & Engineering (100.0%), Legal Services & Support (100.0%), and Computers, Engineering & Science (75.6%), while the most female-oriented occupations are Business & Financial (90.2%), Education Instruction & Library (81.7%), and Management (76.4%).
| Occupation | Male | Female |
| Management | 21 (23.6%) | 68 (76.4%) |
| Business & Financial | 18 (9.8%) | 166 (90.2%) |
| Computers, Engineering & Science | 65 (75.6%) | 21 (24.4%) |
| Computers & Mathematics | 49 (70.0%) | 21 (30.0%) |
| Architecture & Engineering | 16 (100.0%) | 0 (0.0%) |
| Life, Physical & Social Science | 0 (0.0%) | 0 (0.0%) |
| Community & Social Service | 85 (55.9%) | 67 (44.1%) |
| Education, Arts & Media | 0 (0.0%) | 0 (0.0%) |
| Legal Services & Support | 70 (100.0%) | 0 (0.0%) |
| Education Instruction & Library | 15 (18.3%) | 67 (81.7%) |
| Arts, Media & Entertainment | 0 (0.0%) | 0 (0.0%) |
| Health Diagnosing & Treating | 33 (39.3%) | 51 (60.7%) |
| Health Technologists | 33 (45.8%) | 39 (54.2%) |
| Total (Category) | 222 (37.3%) | 373 (62.7%) |
| Total (Overall) | 755 (49.5%) | 771 (50.5%) |
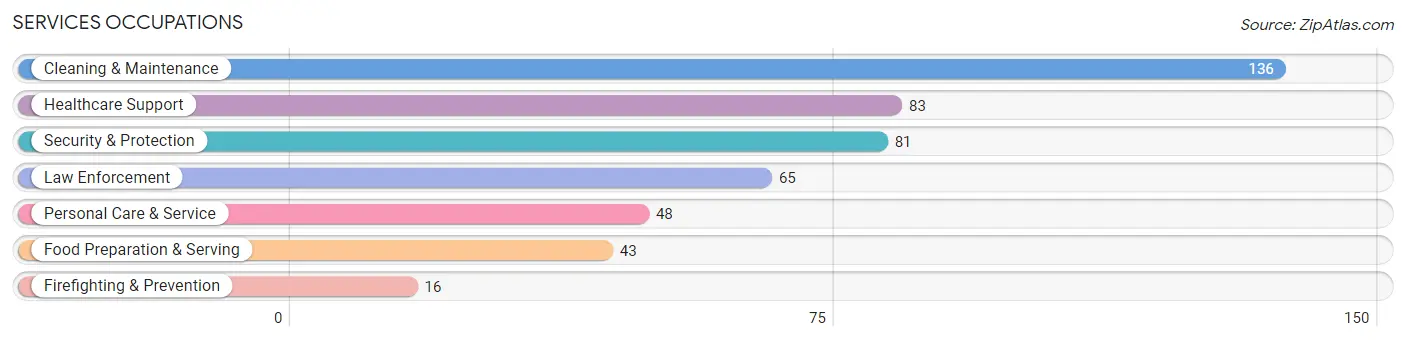
Services Occupations
The most common Services occupations in Shingle Springs are Cleaning & Maintenance (136 | 8.9%), Healthcare Support (83 | 5.4%), Security & Protection (81 | 5.3%), Law Enforcement (65 | 4.3%), and Personal Care & Service (48 | 3.2%).
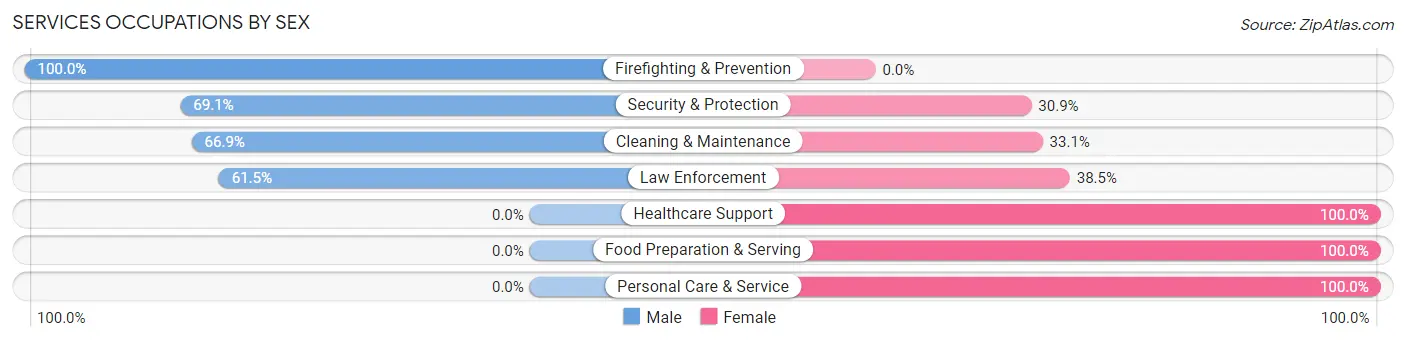
Services Occupations by Sex
Within the Services occupations in Shingle Springs, the most male-oriented occupations are Firefighting & Prevention (100.0%), Security & Protection (69.1%), and Cleaning & Maintenance (66.9%), while the most female-oriented occupations are Healthcare Support (100.0%), Food Preparation & Serving (100.0%), and Personal Care & Service (100.0%).
| Occupation | Male | Female |
| Healthcare Support | 0 (0.0%) | 83 (100.0%) |
| Security & Protection | 56 (69.1%) | 25 (30.9%) |
| Firefighting & Prevention | 16 (100.0%) | 0 (0.0%) |
| Law Enforcement | 40 (61.5%) | 25 (38.5%) |
| Food Preparation & Serving | 0 (0.0%) | 43 (100.0%) |
| Cleaning & Maintenance | 91 (66.9%) | 45 (33.1%) |
| Personal Care & Service | 0 (0.0%) | 48 (100.0%) |
| Total (Category) | 147 (37.6%) | 244 (62.4%) |
| Total (Overall) | 755 (49.5%) | 771 (50.5%) |
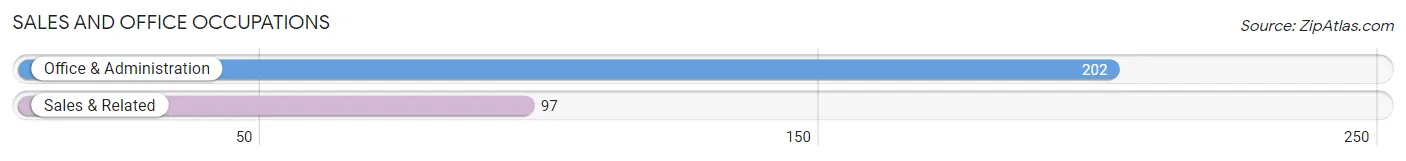
Sales and Office Occupations
The most common Sales and Office occupations in Shingle Springs are Office & Administration (202 | 13.2%), and Sales & Related (97 | 6.4%).
Sales and Office Occupations by Sex
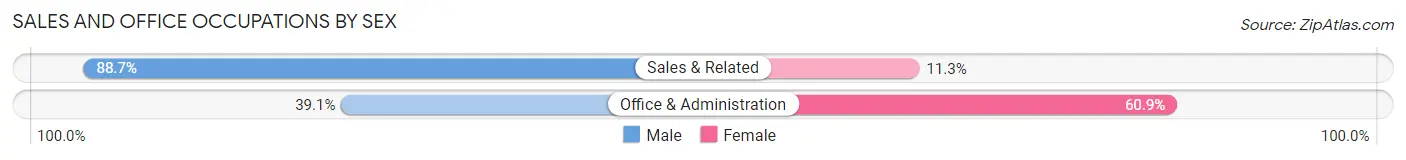
| Occupation | Male | Female |
| Sales & Related | 86 (88.7%) | 11 (11.3%) |
| Office & Administration | 79 (39.1%) | 123 (60.9%) |
| Total (Category) | 165 (55.2%) | 134 (44.8%) |
| Total (Overall) | 755 (49.5%) | 771 (50.5%) |
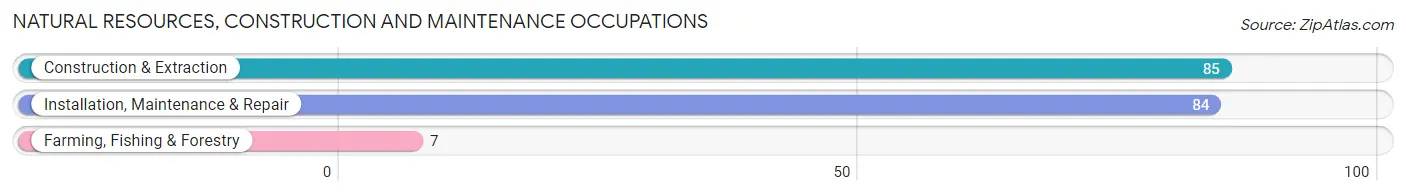
Natural Resources, Construction and Maintenance Occupations
The most common Natural Resources, Construction and Maintenance occupations in Shingle Springs are Construction & Extraction (85 | 5.6%), Installation, Maintenance & Repair (84 | 5.5%), and Farming, Fishing & Forestry (7 | 0.5%).
Natural Resources, Construction and Maintenance Occupations by Sex
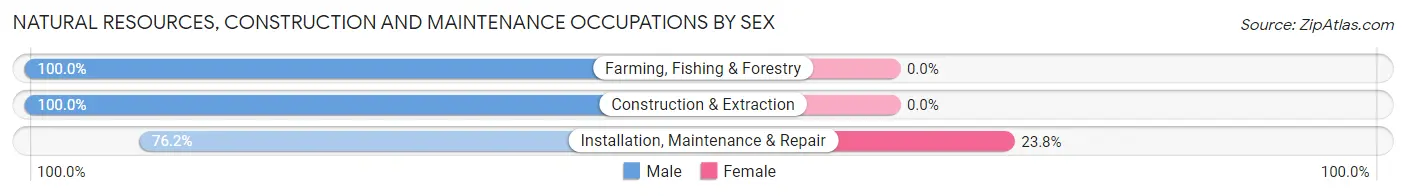
| Occupation | Male | Female |
| Farming, Fishing & Forestry | 7 (100.0%) | 0 (0.0%) |
| Construction & Extraction | 85 (100.0%) | 0 (0.0%) |
| Installation, Maintenance & Repair | 64 (76.2%) | 20 (23.8%) |
| Total (Category) | 156 (88.6%) | 20 (11.4%) |
| Total (Overall) | 755 (49.5%) | 771 (50.5%) |
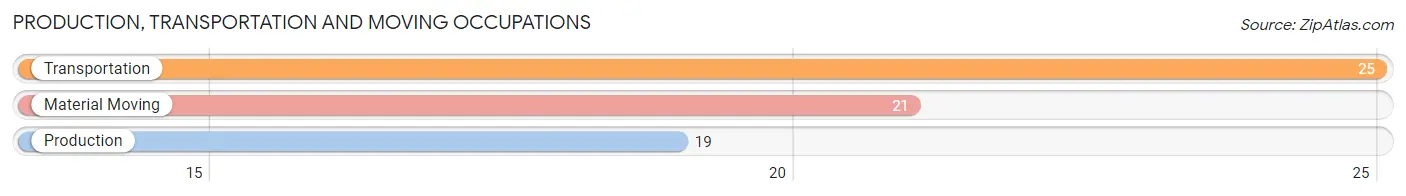
Production, Transportation and Moving Occupations
The most common Production, Transportation and Moving occupations in Shingle Springs are Transportation (25 | 1.6%), Material Moving (21 | 1.4%), and Production (19 | 1.3%).
Production, Transportation and Moving Occupations by Sex
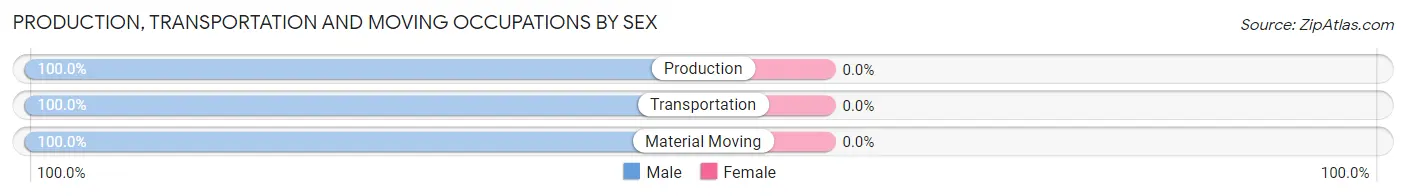
| Occupation | Male | Female |
| Production | 19 (100.0%) | 0 (0.0%) |
| Transportation | 25 (100.0%) | 0 (0.0%) |
| Material Moving | 21 (100.0%) | 0 (0.0%) |
| Total (Category) | 65 (100.0%) | 0 (0.0%) |
| Total (Overall) | 755 (49.5%) | 771 (50.5%) |
Employment Industries by Sex in Shingle Springs
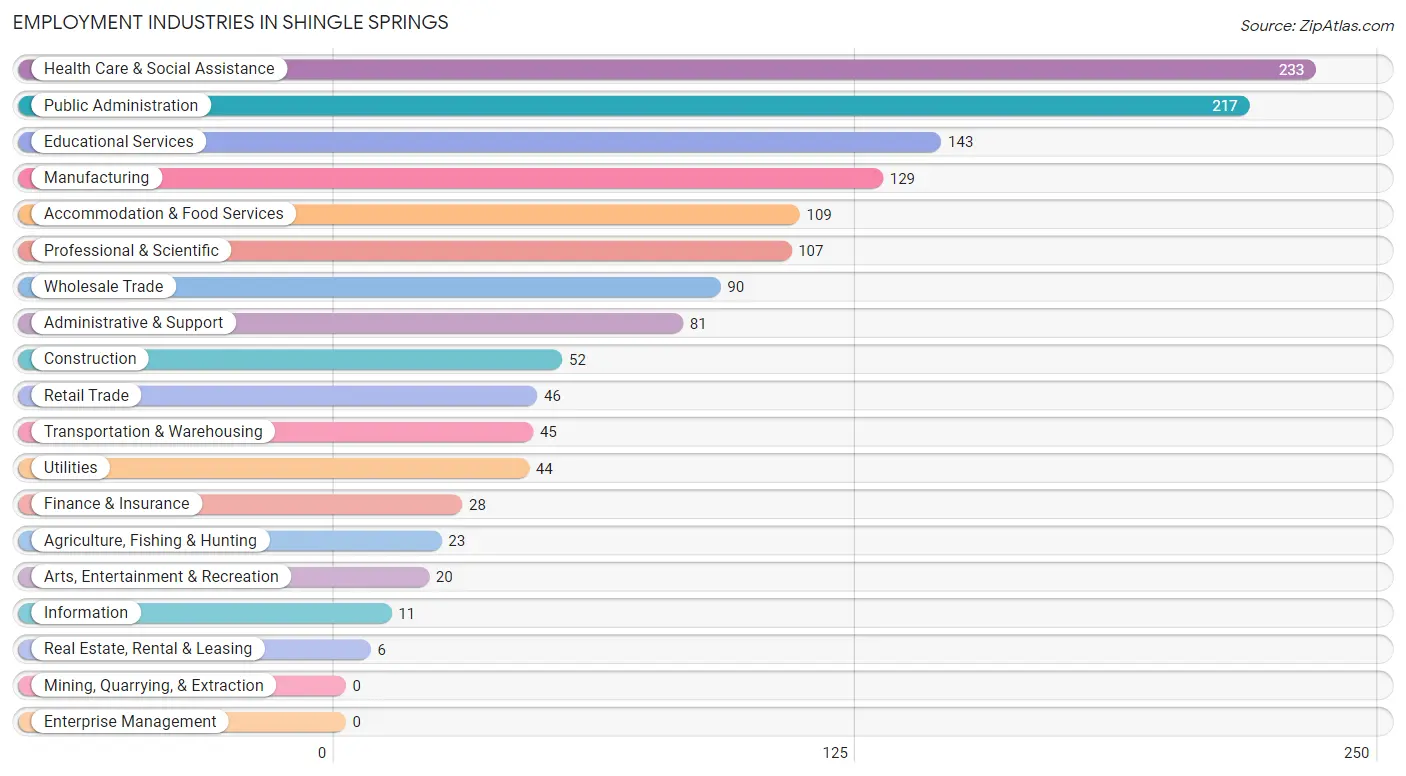
Employment Industries in Shingle Springs
The major employment industries in Shingle Springs include Health Care & Social Assistance (233 | 15.3%), Public Administration (217 | 14.2%), Educational Services (143 | 9.4%), Manufacturing (129 | 8.5%), and Accommodation & Food Services (109 | 7.1%).
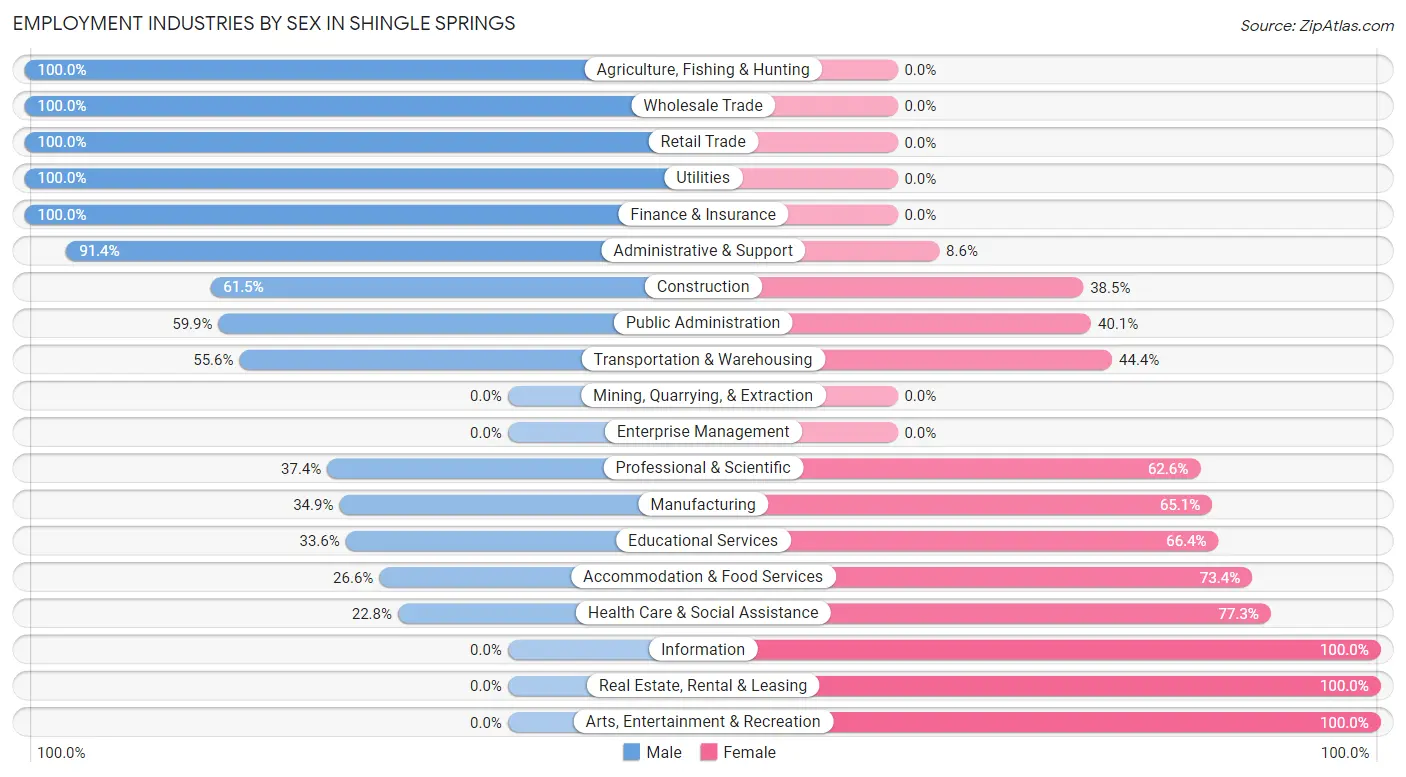
Employment Industries by Sex in Shingle Springs
The Shingle Springs industries that see more men than women are Agriculture, Fishing & Hunting (100.0%), Wholesale Trade (100.0%), and Retail Trade (100.0%), whereas the industries that tend to have a higher number of women are Information (100.0%), Real Estate, Rental & Leasing (100.0%), and Arts, Entertainment & Recreation (100.0%).
| Industry | Male | Female |
| Agriculture, Fishing & Hunting | 23 (100.0%) | 0 (0.0%) |
| Mining, Quarrying, & Extraction | 0 (0.0%) | 0 (0.0%) |
| Construction | 32 (61.5%) | 20 (38.5%) |
| Manufacturing | 45 (34.9%) | 84 (65.1%) |
| Wholesale Trade | 90 (100.0%) | 0 (0.0%) |
| Retail Trade | 46 (100.0%) | 0 (0.0%) |
| Transportation & Warehousing | 25 (55.6%) | 20 (44.4%) |
| Utilities | 44 (100.0%) | 0 (0.0%) |
| Information | 0 (0.0%) | 11 (100.0%) |
| Finance & Insurance | 28 (100.0%) | 0 (0.0%) |
| Real Estate, Rental & Leasing | 0 (0.0%) | 6 (100.0%) |
| Professional & Scientific | 40 (37.4%) | 67 (62.6%) |
| Enterprise Management | 0 (0.0%) | 0 (0.0%) |
| Administrative & Support | 74 (91.4%) | 7 (8.6%) |
| Educational Services | 48 (33.6%) | 95 (66.4%) |
| Health Care & Social Assistance | 53 (22.8%) | 180 (77.2%) |
| Arts, Entertainment & Recreation | 0 (0.0%) | 20 (100.0%) |
| Accommodation & Food Services | 29 (26.6%) | 80 (73.4%) |
| Public Administration | 130 (59.9%) | 87 (40.1%) |
| Total | 755 (49.5%) | 771 (50.5%) |
Education in Shingle Springs
School Enrollment in Shingle Springs
The most common levels of schooling among the 771 students in Shingle Springs are elementary school (169 | 21.9%), middle school (168 | 21.8%), and high school (161 | 20.9%).
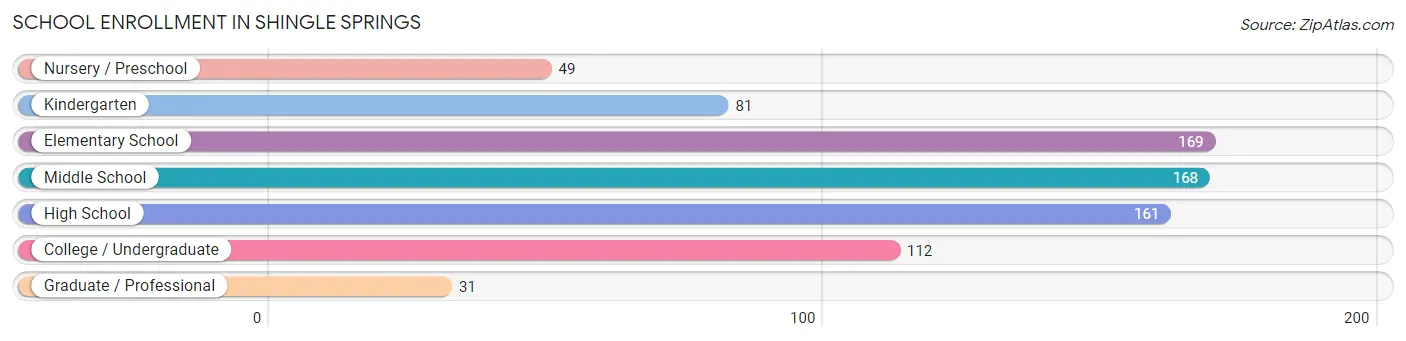
| School Level | # Students | % Students |
| Nursery / Preschool | 49 | 6.4% |
| Kindergarten | 81 | 10.5% |
| Elementary School | 169 | 21.9% |
| Middle School | 168 | 21.8% |
| High School | 161 | 20.9% |
| College / Undergraduate | 112 | 14.5% |
| Graduate / Professional | 31 | 4.0% |
| Total | 771 | 100.0% |
School Enrollment by Age by Funding Source in Shingle Springs
Out of a total of 771 students who are enrolled in schools in Shingle Springs, 108 (14.0%) attend a private institution, while the remaining 663 (86.0%) are enrolled in public schools. The age group of 35 years and over has the highest likelihood of being enrolled in private schools, with 14 (100.0% in the age bracket) enrolled. Conversely, the age group of 5 to 9 year old has the lowest likelihood of being enrolled in a private school, with 217 (100.0% in the age bracket) attending a public institution.
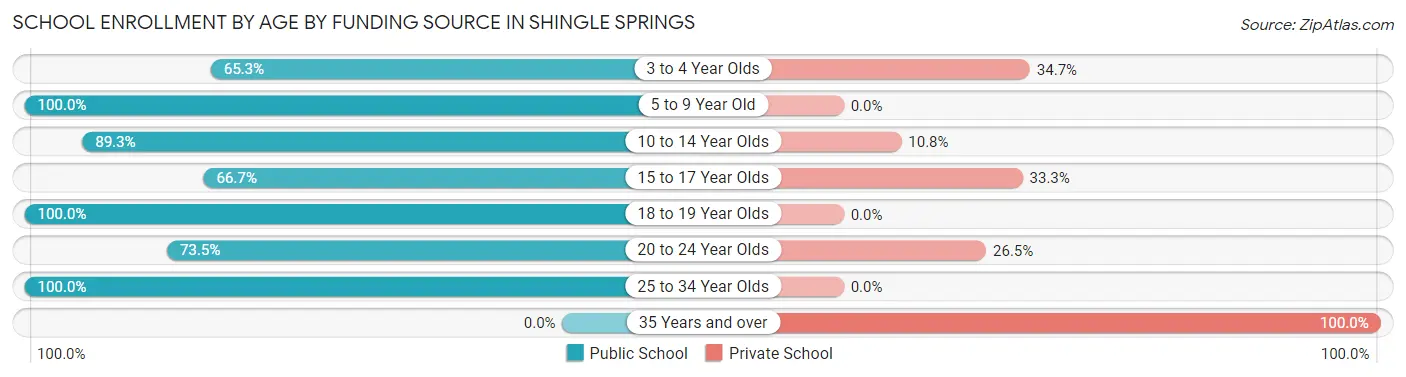
| Age Bracket | Public School | Private School |
| 3 to 4 Year Olds | 32 (65.3%) | 17 (34.7%) |
| 5 to 9 Year Old | 217 (100.0%) | 0 (0.0%) |
| 10 to 14 Year Olds | 249 (89.2%) | 30 (10.7%) |
| 15 to 17 Year Olds | 42 (66.7%) | 21 (33.3%) |
| 18 to 19 Year Olds | 20 (100.0%) | 0 (0.0%) |
| 20 to 24 Year Olds | 72 (73.5%) | 26 (26.5%) |
| 25 to 34 Year Olds | 31 (100.0%) | 0 (0.0%) |
| 35 Years and over | 0 (0.0%) | 14 (100.0%) |
| Total | 663 (86.0%) | 108 (14.0%) |
Educational Attainment by Field of Study in Shingle Springs
Business (203 | 19.1%), science & technology (130 | 12.2%), education (128 | 12.0%), psychology (107 | 10.1%), and social sciences (91 | 8.6%) are the most common fields of study among 1,063 individuals in Shingle Springs who have obtained a bachelor's degree or higher.
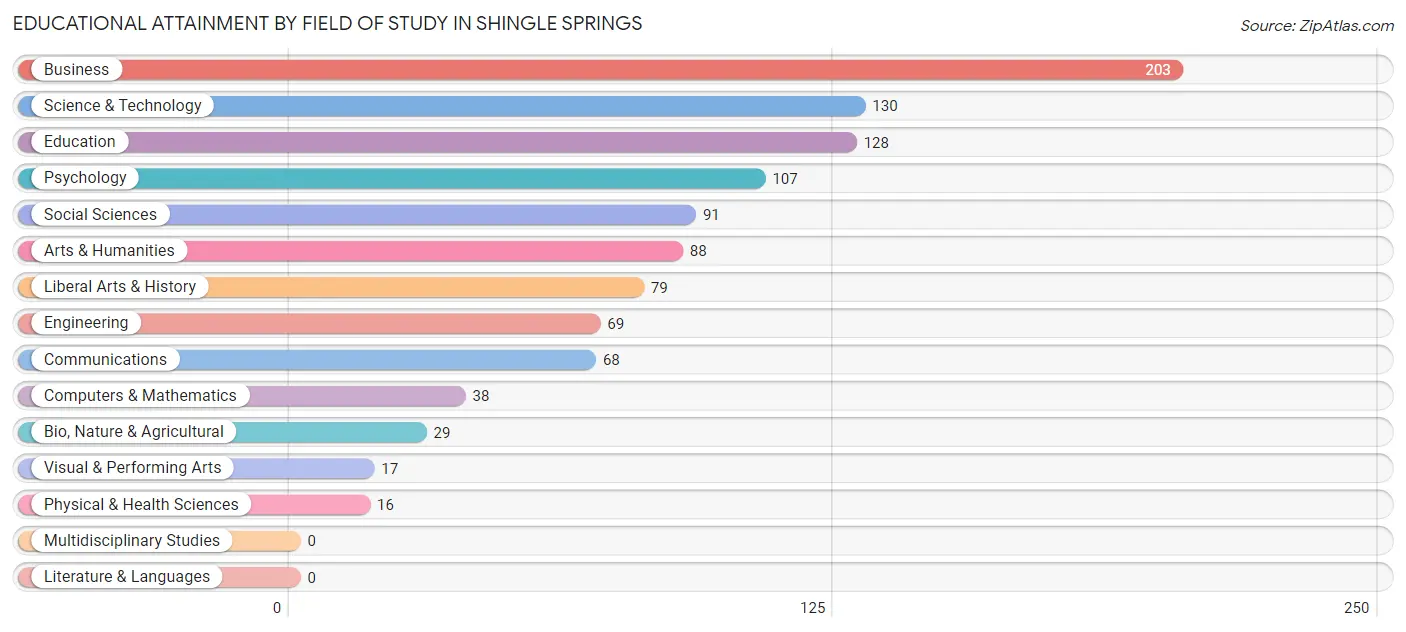
| Field of Study | # Graduates | % Graduates |
| Computers & Mathematics | 38 | 3.6% |
| Bio, Nature & Agricultural | 29 | 2.7% |
| Physical & Health Sciences | 16 | 1.5% |
| Psychology | 107 | 10.1% |
| Social Sciences | 91 | 8.6% |
| Engineering | 69 | 6.5% |
| Multidisciplinary Studies | 0 | 0.0% |
| Science & Technology | 130 | 12.2% |
| Business | 203 | 19.1% |
| Education | 128 | 12.0% |
| Literature & Languages | 0 | 0.0% |
| Liberal Arts & History | 79 | 7.4% |
| Visual & Performing Arts | 17 | 1.6% |
| Communications | 68 | 6.4% |
| Arts & Humanities | 88 | 8.3% |
| Total | 1,063 | 100.0% |
Transportation & Commute in Shingle Springs
Vehicle Availability by Sex in Shingle Springs
The most prevalent vehicle ownership categories in Shingle Springs are males with 3 vehicles (342, accounting for 45.3%) and females with 3 vehicles (312, making up 42.7%).
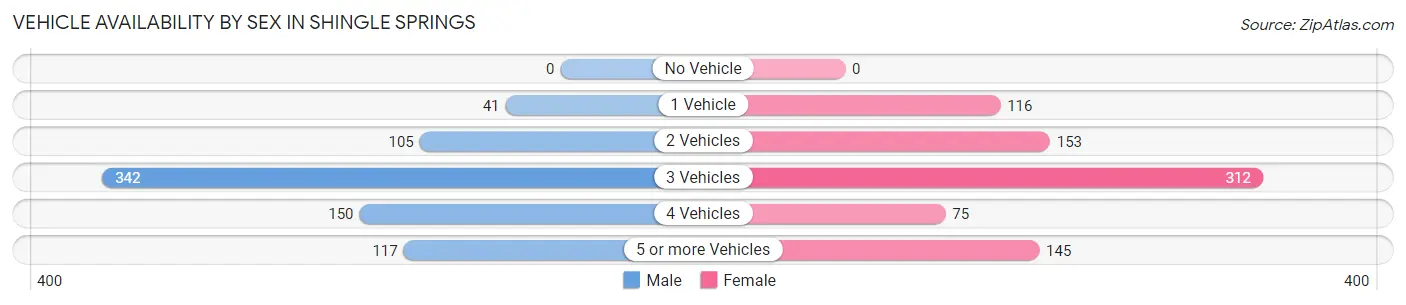
| Vehicles Available | Male | Female |
| No Vehicle | 0 (0.0%) | 0 (0.0%) |
| 1 Vehicle | 41 (5.4%) | 116 (14.5%) |
| 2 Vehicles | 105 (13.9%) | 153 (19.1%) |
| 3 Vehicles | 342 (45.3%) | 312 (39.0%) |
| 4 Vehicles | 150 (19.9%) | 75 (9.4%) |
| 5 or more Vehicles | 117 (15.5%) | 145 (18.1%) |
| Total | 755 (100.0%) | 801 (100.0%) |
Commute Time in Shingle Springs
The most frequently occuring commute durations in Shingle Springs are 20 to 24 minutes (309 commuters, 22.9%), 10 to 14 minutes (189 commuters, 14.0%), and 35 to 39 minutes (151 commuters, 11.2%).
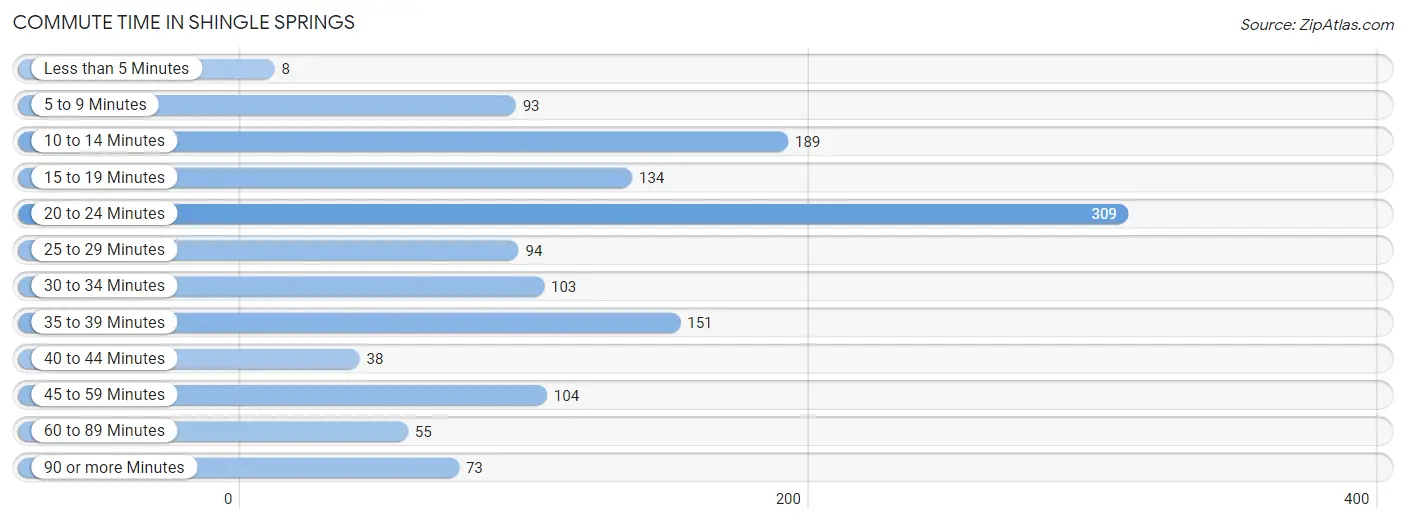
| Commute Time | # Commuters | % Commuters |
| Less than 5 Minutes | 8 | 0.6% |
| 5 to 9 Minutes | 93 | 6.9% |
| 10 to 14 Minutes | 189 | 14.0% |
| 15 to 19 Minutes | 134 | 9.9% |
| 20 to 24 Minutes | 309 | 22.9% |
| 25 to 29 Minutes | 94 | 7.0% |
| 30 to 34 Minutes | 103 | 7.6% |
| 35 to 39 Minutes | 151 | 11.2% |
| 40 to 44 Minutes | 38 | 2.8% |
| 45 to 59 Minutes | 104 | 7.7% |
| 60 to 89 Minutes | 55 | 4.1% |
| 90 or more Minutes | 73 | 5.4% |
Commute Time by Sex in Shingle Springs
The most common commute times in Shingle Springs are 10 to 14 minutes (94 commuters, 16.0%) for males and 20 to 24 minutes (272 commuters, 35.6%) for females.
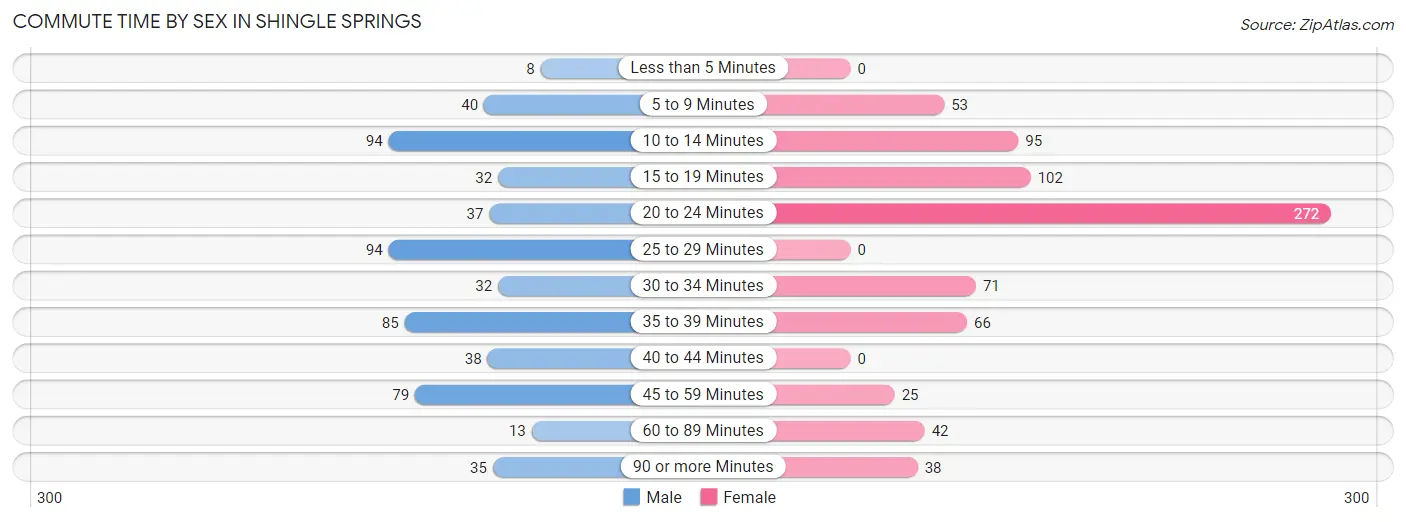
| Commute Time | Male | Female |
| Less than 5 Minutes | 8 (1.4%) | 0 (0.0%) |
| 5 to 9 Minutes | 40 (6.8%) | 53 (6.9%) |
| 10 to 14 Minutes | 94 (16.0%) | 95 (12.4%) |
| 15 to 19 Minutes | 32 (5.4%) | 102 (13.4%) |
| 20 to 24 Minutes | 37 (6.3%) | 272 (35.6%) |
| 25 to 29 Minutes | 94 (16.0%) | 0 (0.0%) |
| 30 to 34 Minutes | 32 (5.4%) | 71 (9.3%) |
| 35 to 39 Minutes | 85 (14.5%) | 66 (8.6%) |
| 40 to 44 Minutes | 38 (6.5%) | 0 (0.0%) |
| 45 to 59 Minutes | 79 (13.5%) | 25 (3.3%) |
| 60 to 89 Minutes | 13 (2.2%) | 42 (5.5%) |
| 90 or more Minutes | 35 (6.0%) | 38 (5.0%) |
Time of Departure to Work by Sex in Shingle Springs
The most frequent times of departure to work in Shingle Springs are 6:00 AM to 6:29 AM (224, 38.2%) for males and 6:00 AM to 6:29 AM (144, 18.9%) for females.
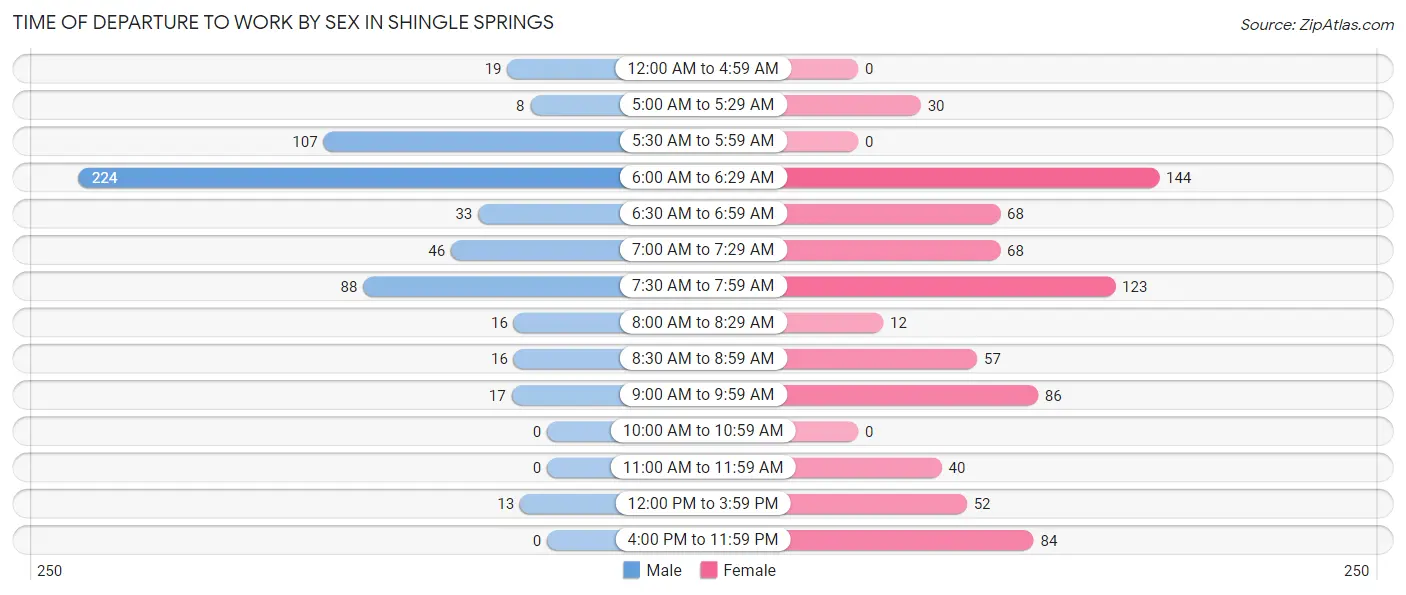
| Time of Departure | Male | Female |
| 12:00 AM to 4:59 AM | 19 (3.2%) | 0 (0.0%) |
| 5:00 AM to 5:29 AM | 8 (1.4%) | 30 (3.9%) |
| 5:30 AM to 5:59 AM | 107 (18.2%) | 0 (0.0%) |
| 6:00 AM to 6:29 AM | 224 (38.2%) | 144 (18.9%) |
| 6:30 AM to 6:59 AM | 33 (5.6%) | 68 (8.9%) |
| 7:00 AM to 7:29 AM | 46 (7.8%) | 68 (8.9%) |
| 7:30 AM to 7:59 AM | 88 (15.0%) | 123 (16.1%) |
| 8:00 AM to 8:29 AM | 16 (2.7%) | 12 (1.6%) |
| 8:30 AM to 8:59 AM | 16 (2.7%) | 57 (7.5%) |
| 9:00 AM to 9:59 AM | 17 (2.9%) | 86 (11.3%) |
| 10:00 AM to 10:59 AM | 0 (0.0%) | 0 (0.0%) |
| 11:00 AM to 11:59 AM | 0 (0.0%) | 40 (5.2%) |
| 12:00 PM to 3:59 PM | 13 (2.2%) | 52 (6.8%) |
| 4:00 PM to 11:59 PM | 0 (0.0%) | 84 (11.0%) |
| Total | 587 (100.0%) | 764 (100.0%) |
Housing Occupancy in Shingle Springs
Occupancy by Ownership in Shingle Springs
Of the total 1,482 dwellings in Shingle Springs, owner-occupied units account for 1,125 (75.9%), while renter-occupied units make up 357 (24.1%).
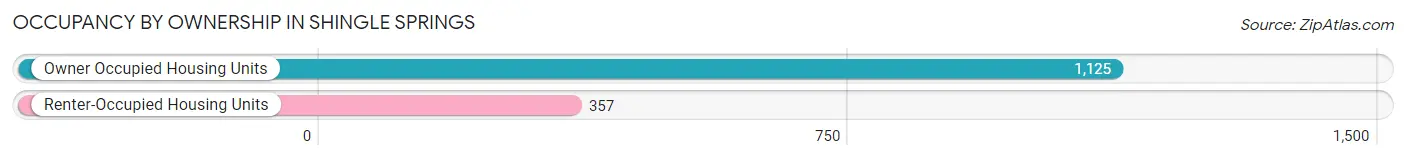
| Occupancy | # Housing Units | % Housing Units |
| Owner Occupied Housing Units | 1,125 | 75.9% |
| Renter-Occupied Housing Units | 357 | 24.1% |
| Total Occupied Housing Units | 1,482 | 100.0% |
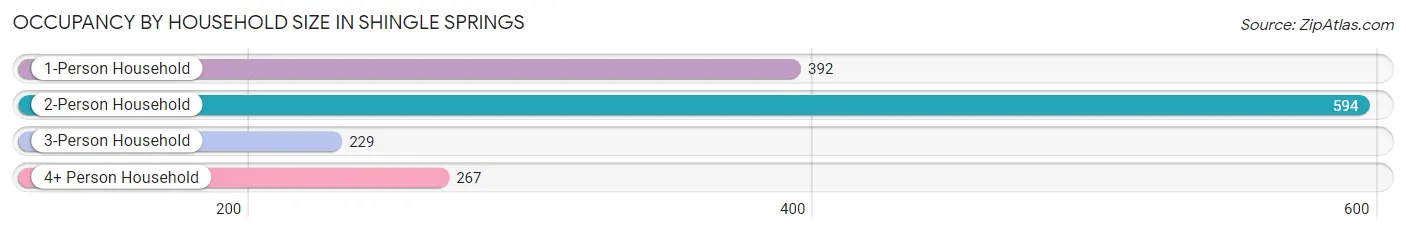
Occupancy by Household Size in Shingle Springs
| Household Size | # Housing Units | % Housing Units |
| 1-Person Household | 392 | 26.5% |
| 2-Person Household | 594 | 40.1% |
| 3-Person Household | 229 | 15.4% |
| 4+ Person Household | 267 | 18.0% |
| Total Housing Units | 1,482 | 100.0% |
Occupancy by Ownership by Household Size in Shingle Springs
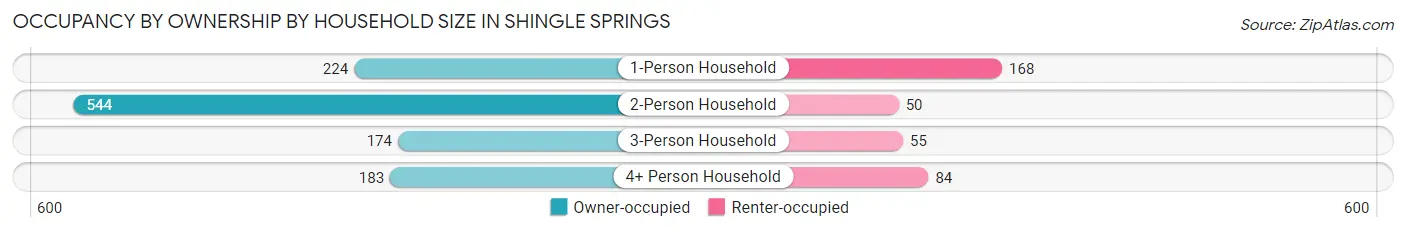
| Household Size | Owner-occupied | Renter-occupied |
| 1-Person Household | 224 (57.1%) | 168 (42.9%) |
| 2-Person Household | 544 (91.6%) | 50 (8.4%) |
| 3-Person Household | 174 (76.0%) | 55 (24.0%) |
| 4+ Person Household | 183 (68.5%) | 84 (31.5%) |
| Total Housing Units | 1,125 (75.9%) | 357 (24.1%) |
Occupancy by Educational Attainment in Shingle Springs
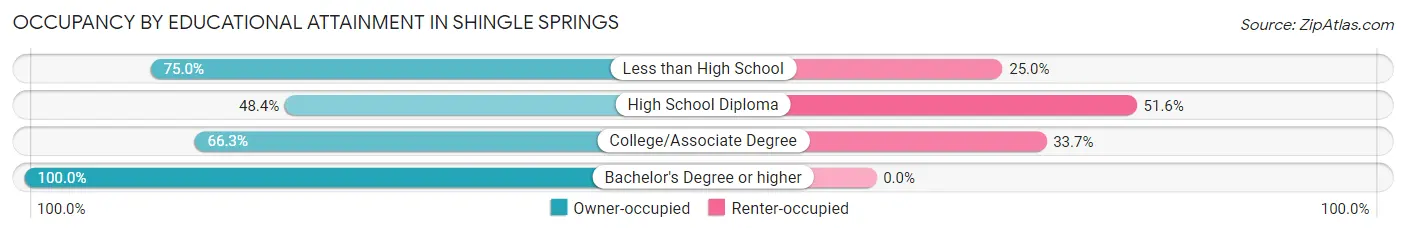
| Household Size | Owner-occupied | Renter-occupied |
| Less than High School | 36 (75.0%) | 12 (25.0%) |
| High School Diploma | 133 (48.4%) | 142 (51.6%) |
| College/Associate Degree | 399 (66.3%) | 203 (33.7%) |
| Bachelor's Degree or higher | 557 (100.0%) | 0 (0.0%) |
Occupancy by Age of Householder in Shingle Springs
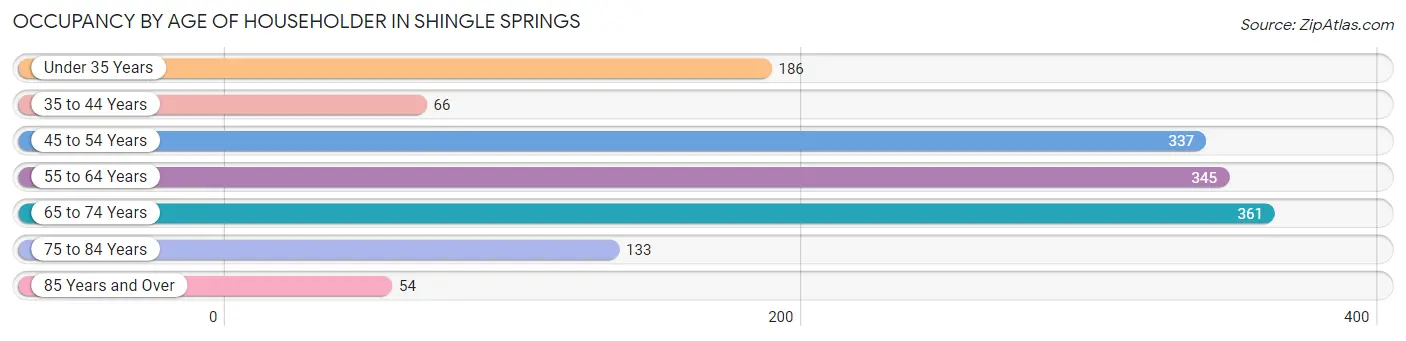
| Age Bracket | # Households | % Households |
| Under 35 Years | 186 | 12.6% |
| 35 to 44 Years | 66 | 4.4% |
| 45 to 54 Years | 337 | 22.7% |
| 55 to 64 Years | 345 | 23.3% |
| 65 to 74 Years | 361 | 24.4% |
| 75 to 84 Years | 133 | 9.0% |
| 85 Years and Over | 54 | 3.6% |
| Total | 1,482 | 100.0% |
Housing Finances in Shingle Springs
Median Income by Occupancy in Shingle Springs
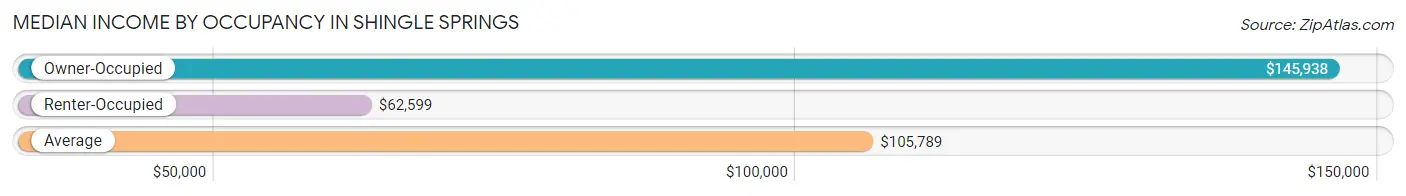
| Occupancy Type | # Households | Median Income |
| Owner-Occupied | 1,125 (75.9%) | $145,938 |
| Renter-Occupied | 357 (24.1%) | $62,599 |
| Average | 1,482 (100.0%) | $105,789 |
Occupancy by Householder Income Bracket in Shingle Springs
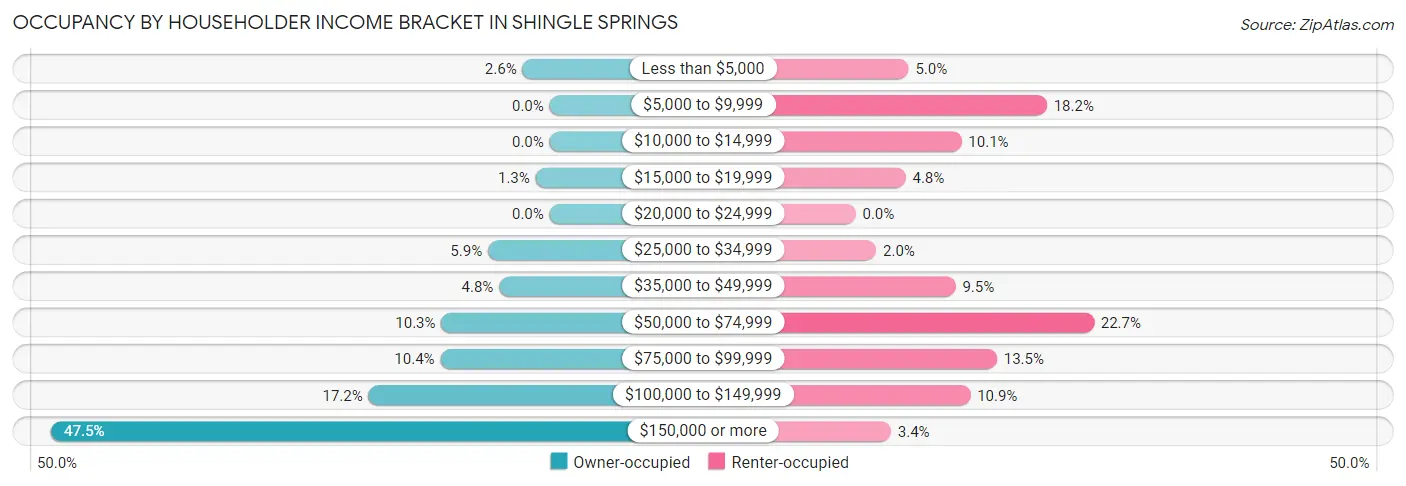
| Income Bracket | Owner-occupied | Renter-occupied |
| Less than $5,000 | 29 (2.6%) | 18 (5.0%) |
| $5,000 to $9,999 | 0 (0.0%) | 65 (18.2%) |
| $10,000 to $14,999 | 0 (0.0%) | 36 (10.1%) |
| $15,000 to $19,999 | 15 (1.3%) | 17 (4.8%) |
| $20,000 to $24,999 | 0 (0.0%) | 0 (0.0%) |
| $25,000 to $34,999 | 66 (5.9%) | 7 (2.0%) |
| $35,000 to $49,999 | 54 (4.8%) | 34 (9.5%) |
| $50,000 to $74,999 | 116 (10.3%) | 81 (22.7%) |
| $75,000 to $99,999 | 117 (10.4%) | 48 (13.5%) |
| $100,000 to $149,999 | 194 (17.2%) | 39 (10.9%) |
| $150,000 or more | 534 (47.5%) | 12 (3.4%) |
| Total | 1,125 (100.0%) | 357 (100.0%) |
Monthly Housing Cost Tiers in Shingle Springs
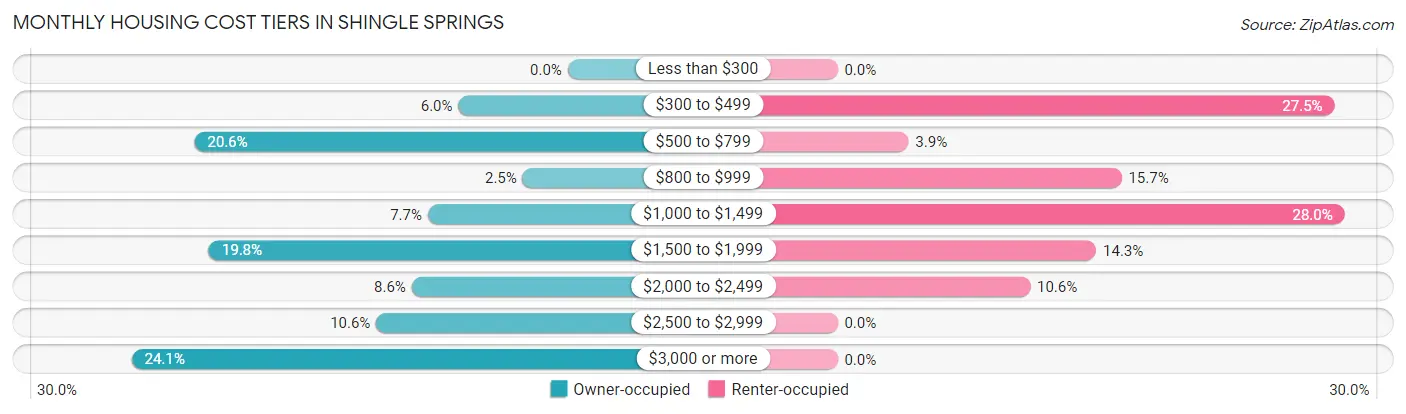
| Monthly Cost | Owner-occupied | Renter-occupied |
| Less than $300 | 0 (0.0%) | 0 (0.0%) |
| $300 to $499 | 68 (6.0%) | 98 (27.5%) |
| $500 to $799 | 232 (20.6%) | 14 (3.9%) |
| $800 to $999 | 28 (2.5%) | 56 (15.7%) |
| $1,000 to $1,499 | 87 (7.7%) | 100 (28.0%) |
| $1,500 to $1,999 | 223 (19.8%) | 51 (14.3%) |
| $2,000 to $2,499 | 97 (8.6%) | 38 (10.6%) |
| $2,500 to $2,999 | 119 (10.6%) | 0 (0.0%) |
| $3,000 or more | 271 (24.1%) | 0 (0.0%) |
| Total | 1,125 (100.0%) | 357 (100.0%) |
Physical Housing Characteristics in Shingle Springs
Housing Structures in Shingle Springs
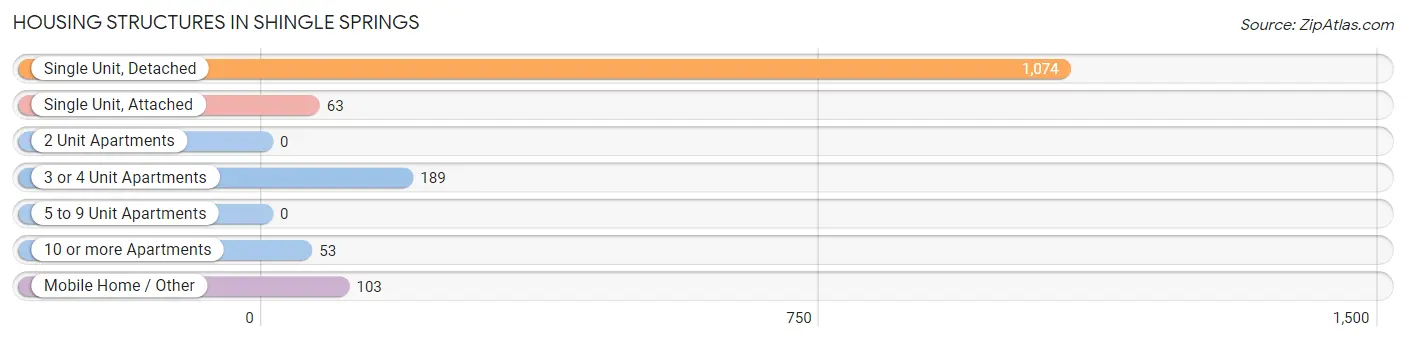
| Structure Type | # Housing Units | % Housing Units |
| Single Unit, Detached | 1,074 | 72.5% |
| Single Unit, Attached | 63 | 4.3% |
| 2 Unit Apartments | 0 | 0.0% |
| 3 or 4 Unit Apartments | 189 | 12.8% |
| 5 to 9 Unit Apartments | 0 | 0.0% |
| 10 or more Apartments | 53 | 3.6% |
| Mobile Home / Other | 103 | 7.0% |
| Total | 1,482 | 100.0% |
Housing Structures by Occupancy in Shingle Springs
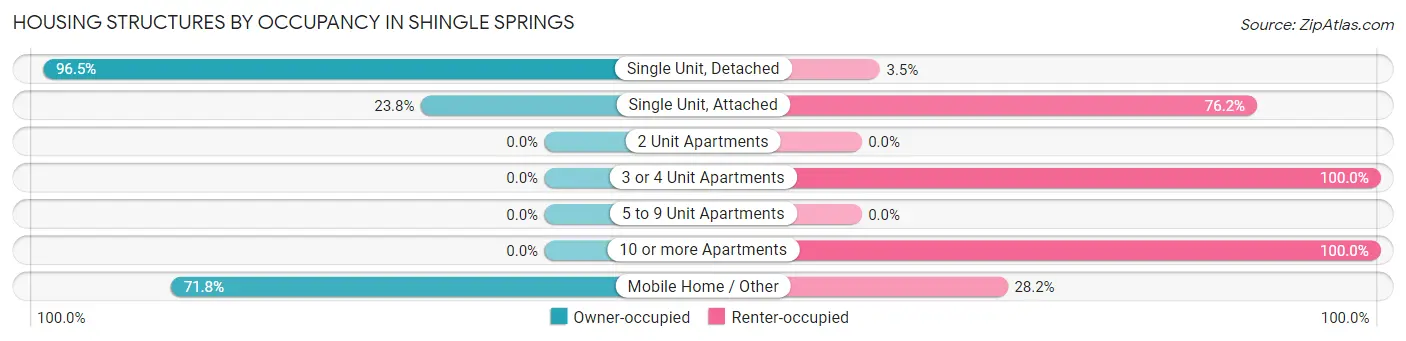
| Structure Type | Owner-occupied | Renter-occupied |
| Single Unit, Detached | 1,036 (96.5%) | 38 (3.5%) |
| Single Unit, Attached | 15 (23.8%) | 48 (76.2%) |
| 2 Unit Apartments | 0 (0.0%) | 0 (0.0%) |
| 3 or 4 Unit Apartments | 0 (0.0%) | 189 (100.0%) |
| 5 to 9 Unit Apartments | 0 (0.0%) | 0 (0.0%) |
| 10 or more Apartments | 0 (0.0%) | 53 (100.0%) |
| Mobile Home / Other | 74 (71.8%) | 29 (28.2%) |
| Total | 1,125 (75.9%) | 357 (24.1%) |
Housing Structures by Number of Rooms in Shingle Springs
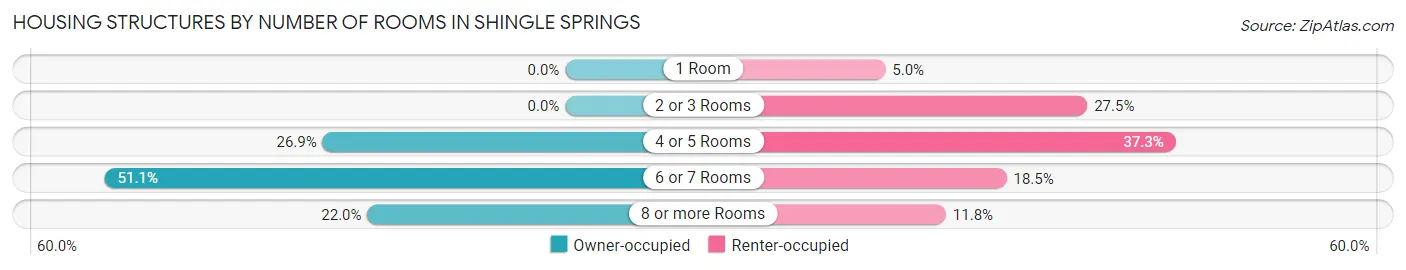
| Number of Rooms | Owner-occupied | Renter-occupied |
| 1 Room | 0 (0.0%) | 18 (5.0%) |
| 2 or 3 Rooms | 0 (0.0%) | 98 (27.5%) |
| 4 or 5 Rooms | 303 (26.9%) | 133 (37.2%) |
| 6 or 7 Rooms | 575 (51.1%) | 66 (18.5%) |
| 8 or more Rooms | 247 (22.0%) | 42 (11.8%) |
| Total | 1,125 (100.0%) | 357 (100.0%) |
Housing Structure by Heating Type in Shingle Springs
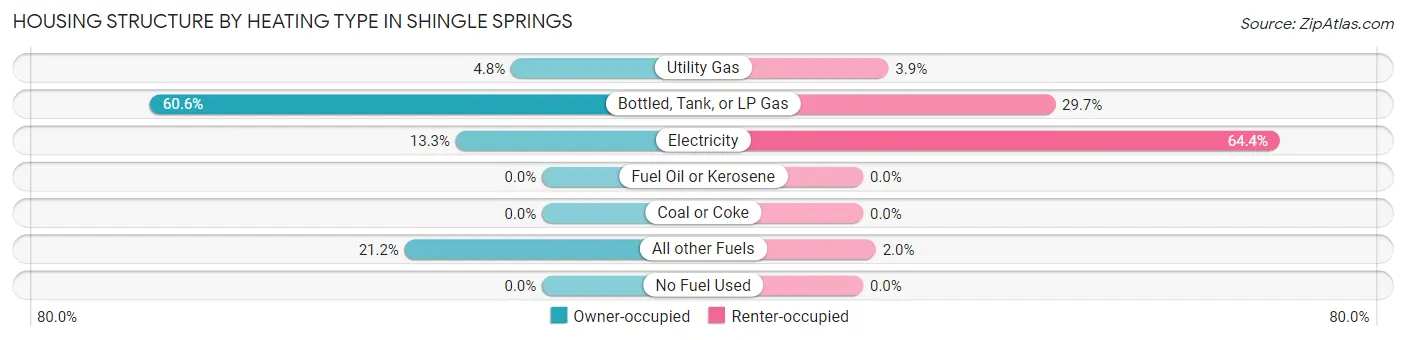
| Heating Type | Owner-occupied | Renter-occupied |
| Utility Gas | 54 (4.8%) | 14 (3.9%) |
| Bottled, Tank, or LP Gas | 682 (60.6%) | 106 (29.7%) |
| Electricity | 150 (13.3%) | 230 (64.4%) |
| Fuel Oil or Kerosene | 0 (0.0%) | 0 (0.0%) |
| Coal or Coke | 0 (0.0%) | 0 (0.0%) |
| All other Fuels | 239 (21.2%) | 7 (2.0%) |
| No Fuel Used | 0 (0.0%) | 0 (0.0%) |
| Total | 1,125 (100.0%) | 357 (100.0%) |
Household Vehicle Usage in Shingle Springs
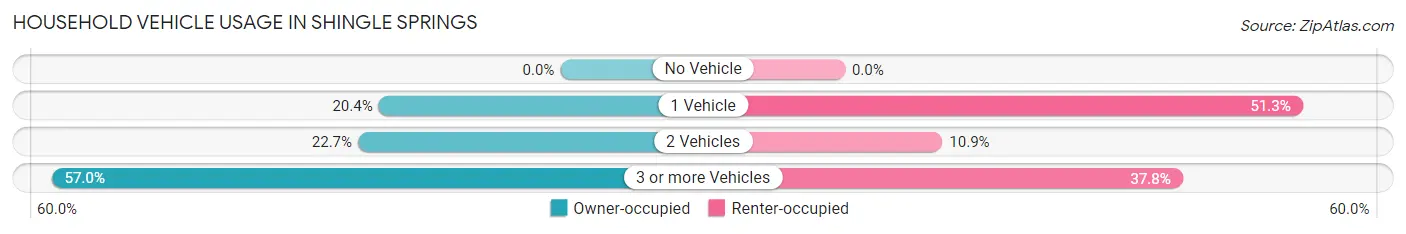
| Vehicles per Household | Owner-occupied | Renter-occupied |
| No Vehicle | 0 (0.0%) | 0 (0.0%) |
| 1 Vehicle | 229 (20.4%) | 183 (51.3%) |
| 2 Vehicles | 255 (22.7%) | 39 (10.9%) |
| 3 or more Vehicles | 641 (57.0%) | 135 (37.8%) |
| Total | 1,125 (100.0%) | 357 (100.0%) |
Real Estate & Mortgages in Shingle Springs
Real Estate and Mortgage Overview in Shingle Springs
| Characteristic | Without Mortgage | With Mortgage |
| Housing Units | 399 | 726 |
| Median Property Value | $587,600 | $690,900 |
| Median Household Income | $87,127 | $473 |
| Monthly Housing Costs | $659 | $271 |
| Real Estate Taxes | $2,948 | $11 |
Property Value by Mortgage Status in Shingle Springs
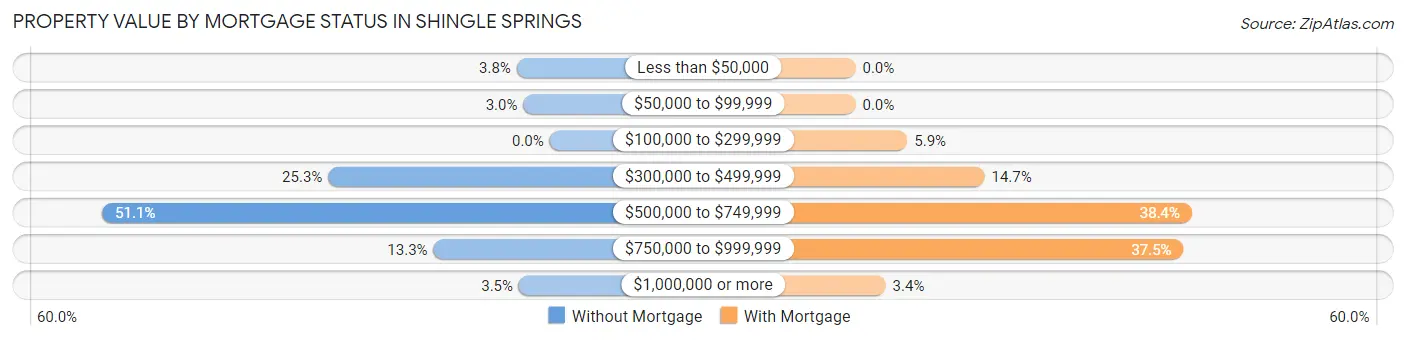
| Property Value | Without Mortgage | With Mortgage |
| Less than $50,000 | 15 (3.8%) | 0 (0.0%) |
| $50,000 to $99,999 | 12 (3.0%) | 0 (0.0%) |
| $100,000 to $299,999 | 0 (0.0%) | 43 (5.9%) |
| $300,000 to $499,999 | 101 (25.3%) | 107 (14.7%) |
| $500,000 to $749,999 | 204 (51.1%) | 279 (38.4%) |
| $750,000 to $999,999 | 53 (13.3%) | 272 (37.5%) |
| $1,000,000 or more | 14 (3.5%) | 25 (3.4%) |
| Total | 399 (100.0%) | 726 (100.0%) |
Household Income by Mortgage Status in Shingle Springs
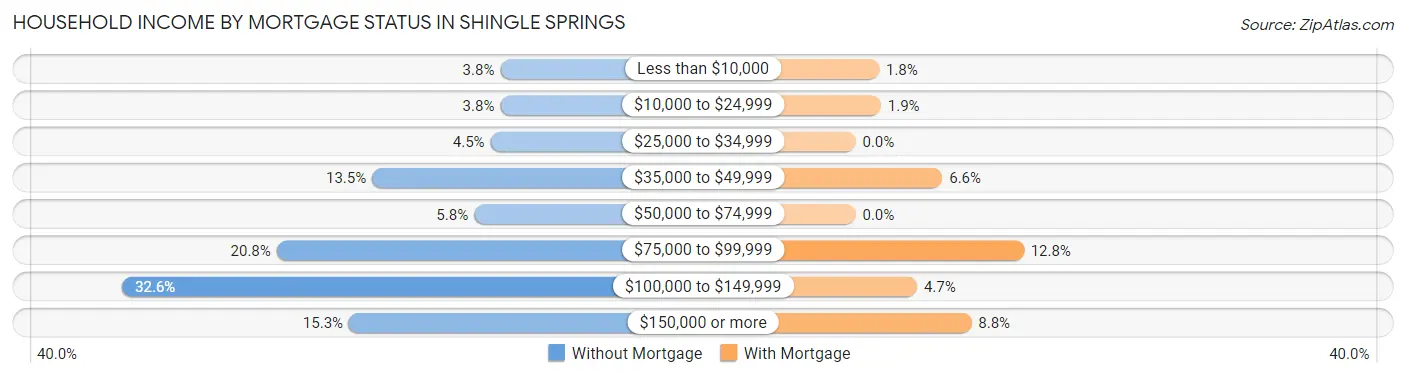
| Household Income | Without Mortgage | With Mortgage |
| Less than $10,000 | 15 (3.8%) | 13 (1.8%) |
| $10,000 to $24,999 | 15 (3.8%) | 14 (1.9%) |
| $25,000 to $34,999 | 18 (4.5%) | 0 (0.0%) |
| $35,000 to $49,999 | 54 (13.5%) | 48 (6.6%) |
| $50,000 to $74,999 | 23 (5.8%) | 0 (0.0%) |
| $75,000 to $99,999 | 83 (20.8%) | 93 (12.8%) |
| $100,000 to $149,999 | 130 (32.6%) | 34 (4.7%) |
| $150,000 or more | 61 (15.3%) | 64 (8.8%) |
| Total | 399 (100.0%) | 726 (100.0%) |
Property Value to Household Income Ratio in Shingle Springs
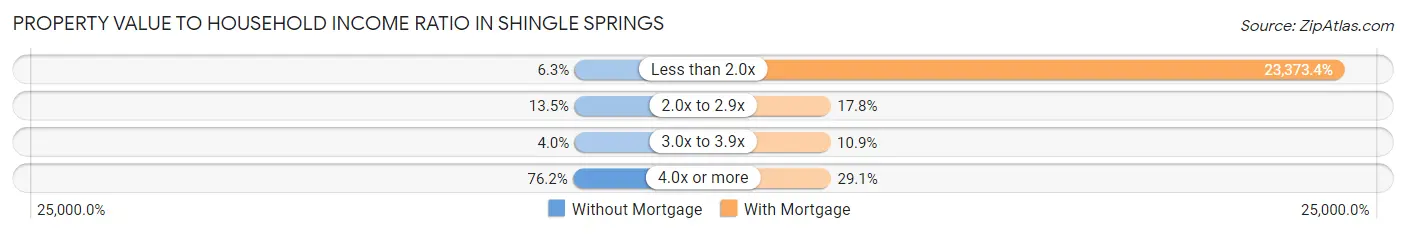
| Value-to-Income Ratio | Without Mortgage | With Mortgage |
| Less than 2.0x | 25 (6.3%) | 169,691 (23,373.4%) |
| 2.0x to 2.9x | 54 (13.5%) | 129 (17.8%) |
| 3.0x to 3.9x | 16 (4.0%) | 79 (10.9%) |
| 4.0x or more | 304 (76.2%) | 211 (29.1%) |
| Total | 399 (100.0%) | 726 (100.0%) |
Real Estate Taxes by Mortgage Status in Shingle Springs
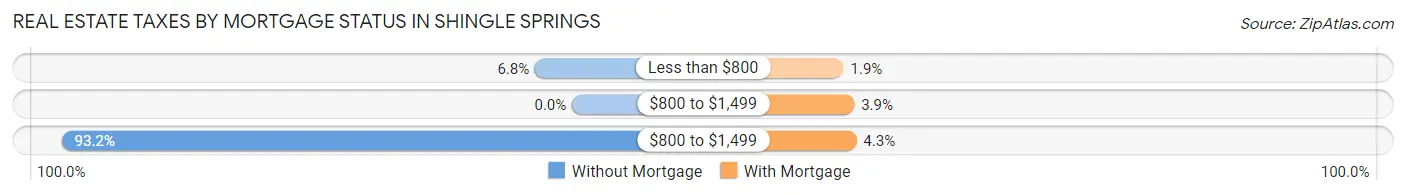
| Property Taxes | Without Mortgage | With Mortgage |
| Less than $800 | 27 (6.8%) | 14 (1.9%) |
| $800 to $1,499 | 0 (0.0%) | 28 (3.9%) |
| $800 to $1,499 | 372 (93.2%) | 31 (4.3%) |
| Total | 399 (100.0%) | 726 (100.0%) |
Health & Disability in Shingle Springs
Health Insurance Coverage by Age in Shingle Springs
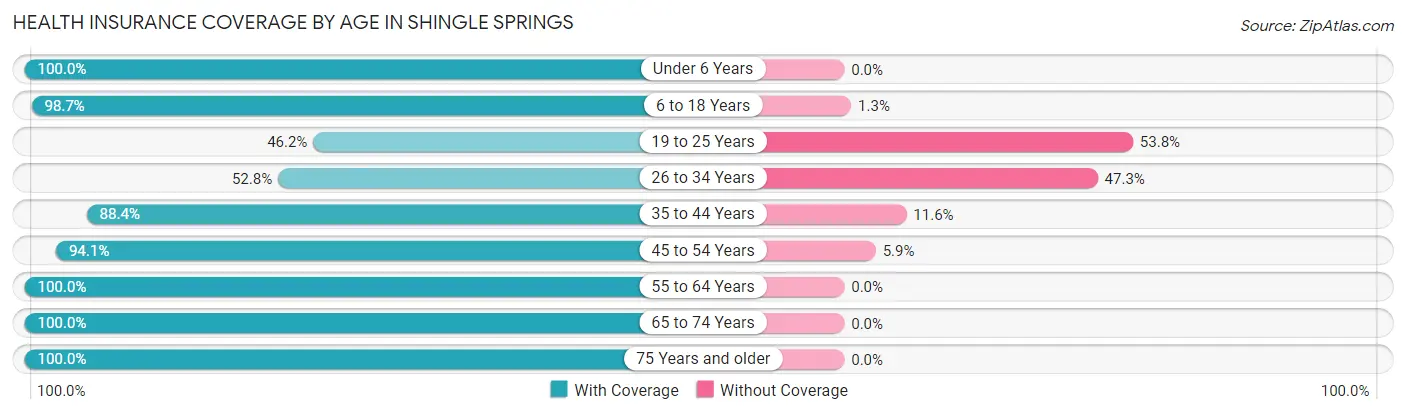
| Age Bracket | With Coverage | Without Coverage |
| Under 6 Years | 224 (100.0%) | 0 (0.0%) |
| 6 to 18 Years | 540 (98.7%) | 7 (1.3%) |
| 19 to 25 Years | 133 (46.2%) | 155 (53.8%) |
| 26 to 34 Years | 163 (52.7%) | 146 (47.2%) |
| 35 to 44 Years | 168 (88.4%) | 22 (11.6%) |
| 45 to 54 Years | 626 (94.1%) | 39 (5.9%) |
| 55 to 64 Years | 432 (100.0%) | 0 (0.0%) |
| 65 to 74 Years | 694 (100.0%) | 0 (0.0%) |
| 75 Years and older | 324 (100.0%) | 0 (0.0%) |
| Total | 3,304 (89.9%) | 369 (10.1%) |
Health Insurance Coverage by Citizenship Status in Shingle Springs
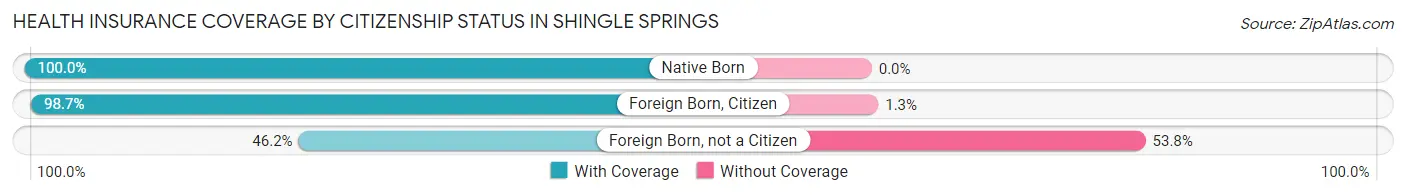
| Citizenship Status | With Coverage | Without Coverage |
| Native Born | 224 (100.0%) | 0 (0.0%) |
| Foreign Born, Citizen | 540 (98.7%) | 7 (1.3%) |
| Foreign Born, not a Citizen | 133 (46.2%) | 155 (53.8%) |
Health Insurance Coverage by Household Income in Shingle Springs
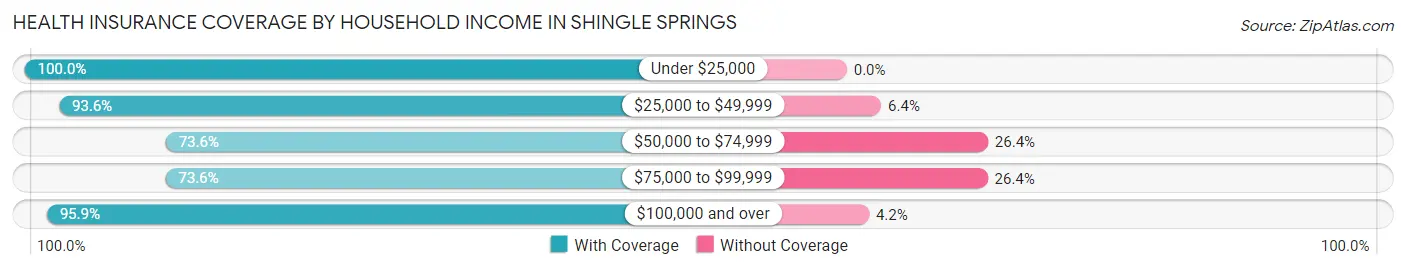
| Household Income | With Coverage | Without Coverage |
| Under $25,000 | 213 (100.0%) | 0 (0.0%) |
| $25,000 to $49,999 | 276 (93.6%) | 19 (6.4%) |
| $50,000 to $74,999 | 434 (73.6%) | 156 (26.4%) |
| $75,000 to $99,999 | 293 (73.6%) | 105 (26.4%) |
| $100,000 and over | 2,056 (95.9%) | 89 (4.2%) |
Public vs Private Health Insurance Coverage by Age in Shingle Springs
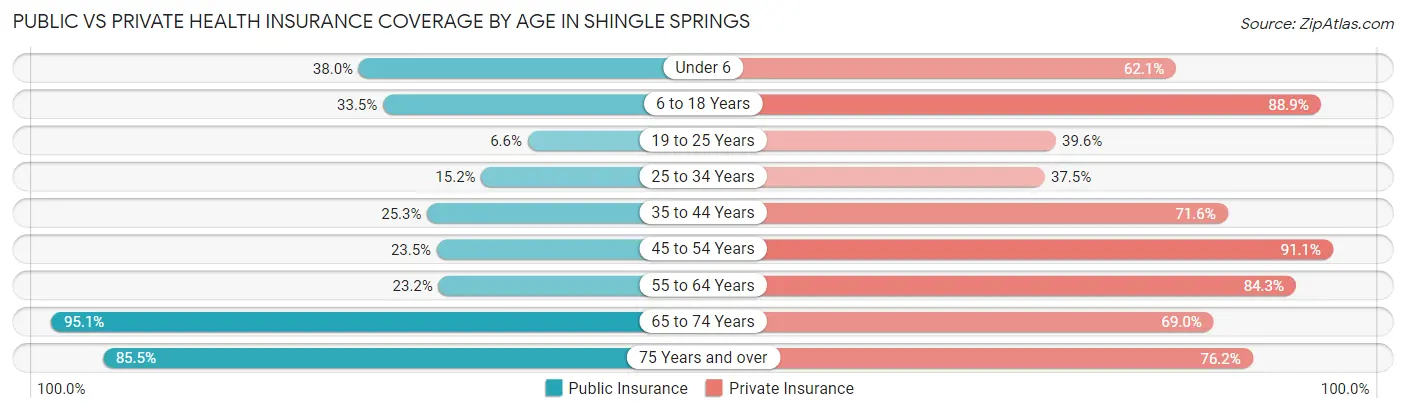
| Age Bracket | Public Insurance | Private Insurance |
| Under 6 | 85 (38.0%) | 139 (62.1%) |
| 6 to 18 Years | 183 (33.5%) | 486 (88.8%) |
| 19 to 25 Years | 19 (6.6%) | 114 (39.6%) |
| 25 to 34 Years | 47 (15.2%) | 116 (37.5%) |
| 35 to 44 Years | 48 (25.3%) | 136 (71.6%) |
| 45 to 54 Years | 156 (23.5%) | 606 (91.1%) |
| 55 to 64 Years | 100 (23.2%) | 364 (84.3%) |
| 65 to 74 Years | 660 (95.1%) | 479 (69.0%) |
| 75 Years and over | 277 (85.5%) | 247 (76.2%) |
| Total | 1,575 (42.9%) | 2,687 (73.2%) |
Disability Status by Sex by Age in Shingle Springs
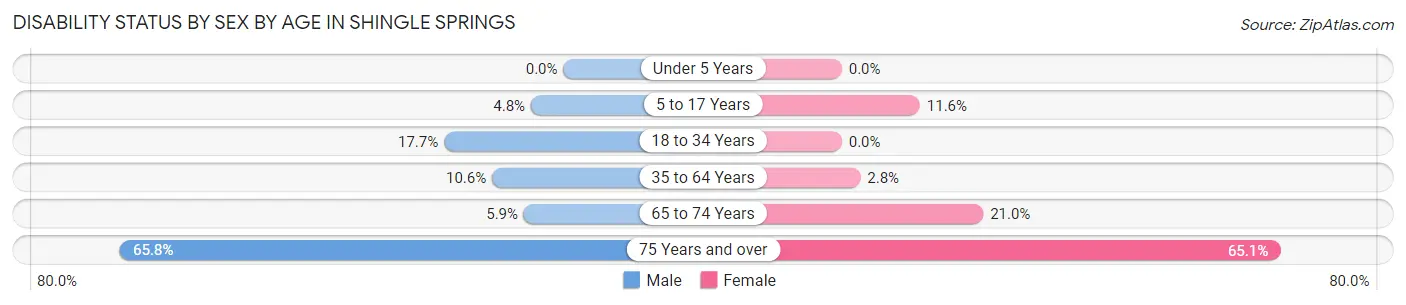
| Age Bracket | Male | Female |
| Under 5 Years | 0 (0.0%) | 0 (0.0%) |
| 5 to 17 Years | 16 (4.8%) | 32 (11.6%) |
| 18 to 34 Years | 59 (17.7%) | 0 (0.0%) |
| 35 to 64 Years | 75 (10.6%) | 16 (2.8%) |
| 65 to 74 Years | 15 (5.9%) | 92 (21.0%) |
| 75 Years and over | 104 (65.8%) | 108 (65.1%) |
Disability Class by Sex by Age in Shingle Springs
Disability Class: Hearing Difficulty
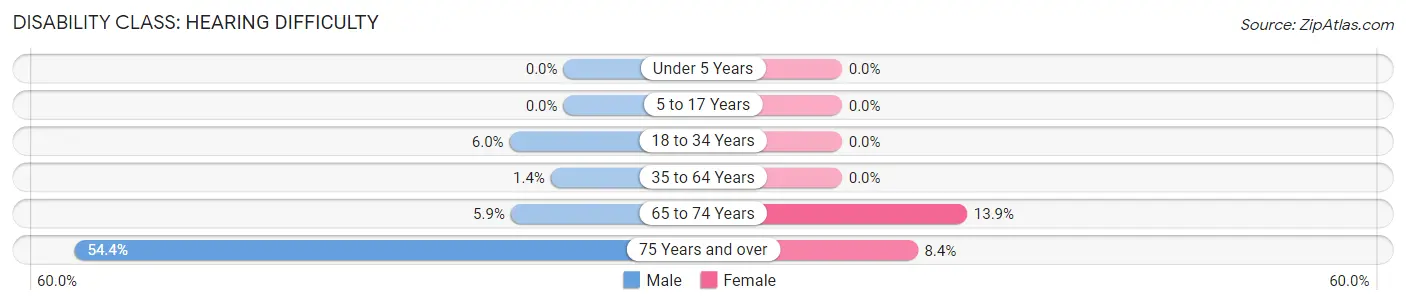
| Age Bracket | Male | Female |
| Under 5 Years | 0 (0.0%) | 0 (0.0%) |
| 5 to 17 Years | 0 (0.0%) | 0 (0.0%) |
| 18 to 34 Years | 20 (6.0%) | 0 (0.0%) |
| 35 to 64 Years | 10 (1.4%) | 0 (0.0%) |
| 65 to 74 Years | 15 (5.9%) | 61 (13.9%) |
| 75 Years and over | 86 (54.4%) | 14 (8.4%) |
Disability Class: Vision Difficulty
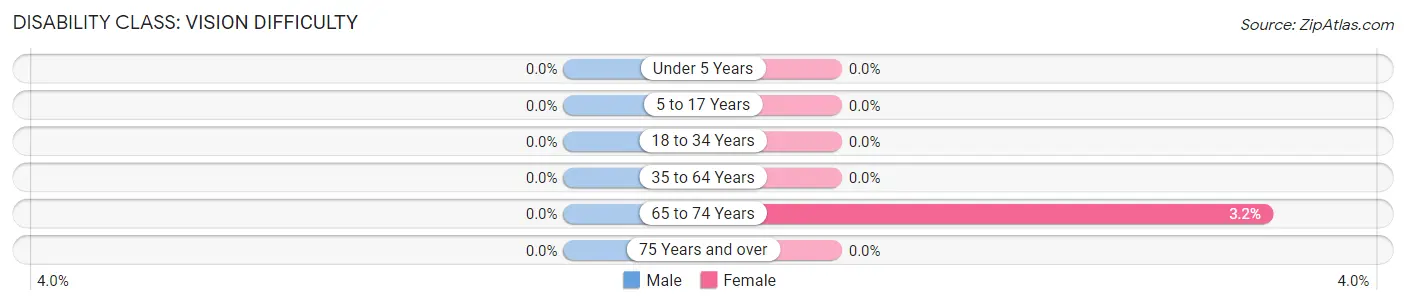
| Age Bracket | Male | Female |
| Under 5 Years | 0 (0.0%) | 0 (0.0%) |
| 5 to 17 Years | 0 (0.0%) | 0 (0.0%) |
| 18 to 34 Years | 0 (0.0%) | 0 (0.0%) |
| 35 to 64 Years | 0 (0.0%) | 0 (0.0%) |
| 65 to 74 Years | 0 (0.0%) | 14 (3.2%) |
| 75 Years and over | 0 (0.0%) | 0 (0.0%) |
Disability Class: Cognitive Difficulty
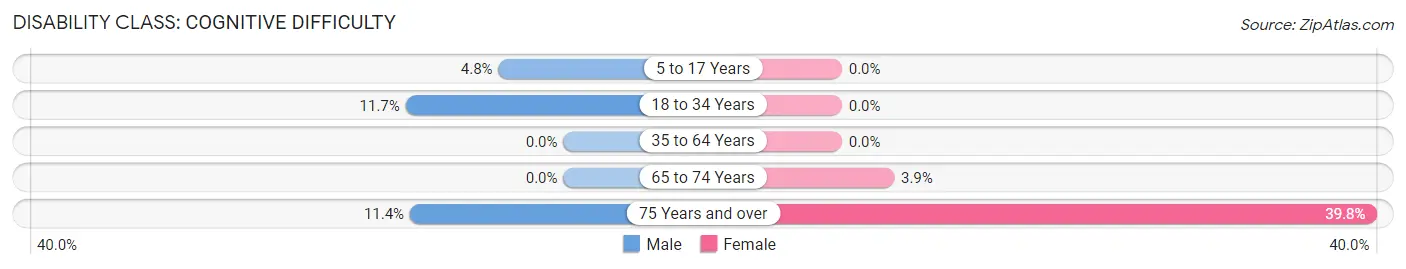
| Age Bracket | Male | Female |
| 5 to 17 Years | 16 (4.8%) | 0 (0.0%) |
| 18 to 34 Years | 39 (11.7%) | 0 (0.0%) |
| 35 to 64 Years | 0 (0.0%) | 0 (0.0%) |
| 65 to 74 Years | 0 (0.0%) | 17 (3.9%) |
| 75 Years and over | 18 (11.4%) | 66 (39.8%) |
Disability Class: Ambulatory Difficulty
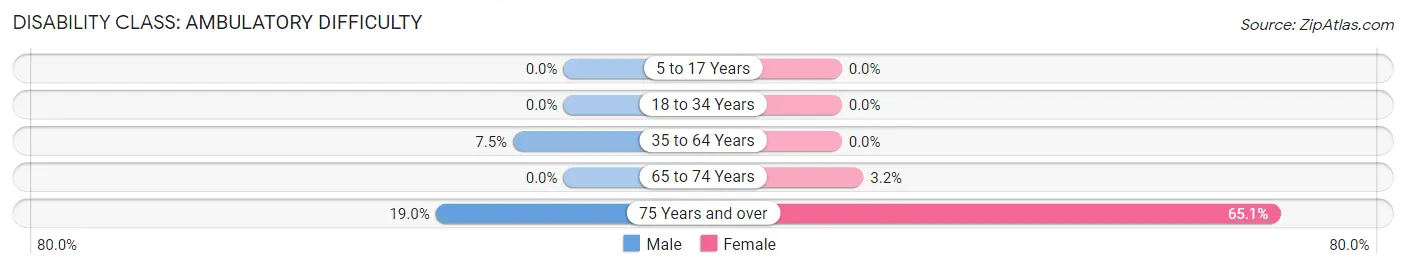
| Age Bracket | Male | Female |
| 5 to 17 Years | 0 (0.0%) | 0 (0.0%) |
| 18 to 34 Years | 0 (0.0%) | 0 (0.0%) |
| 35 to 64 Years | 53 (7.5%) | 0 (0.0%) |
| 65 to 74 Years | 0 (0.0%) | 14 (3.2%) |
| 75 Years and over | 30 (19.0%) | 108 (65.1%) |
Disability Class: Self-Care Difficulty
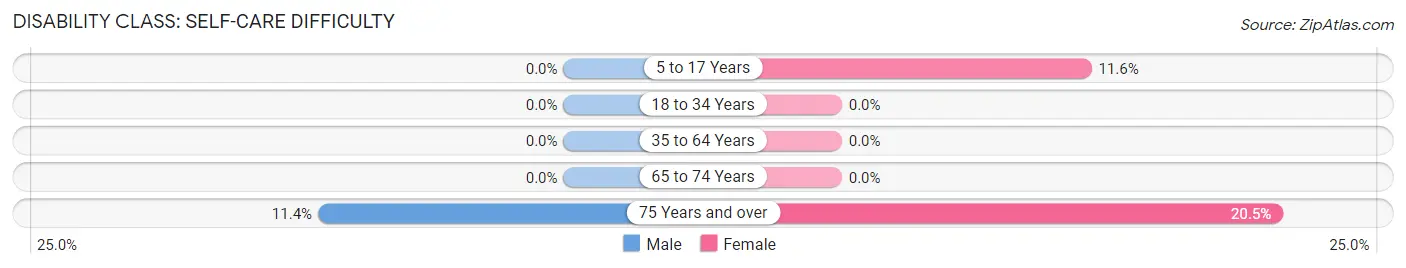
| Age Bracket | Male | Female |
| 5 to 17 Years | 0 (0.0%) | 32 (11.6%) |
| 18 to 34 Years | 0 (0.0%) | 0 (0.0%) |
| 35 to 64 Years | 0 (0.0%) | 0 (0.0%) |
| 65 to 74 Years | 0 (0.0%) | 0 (0.0%) |
| 75 Years and over | 18 (11.4%) | 34 (20.5%) |
Technology Access in Shingle Springs
Computing Device Access in Shingle Springs
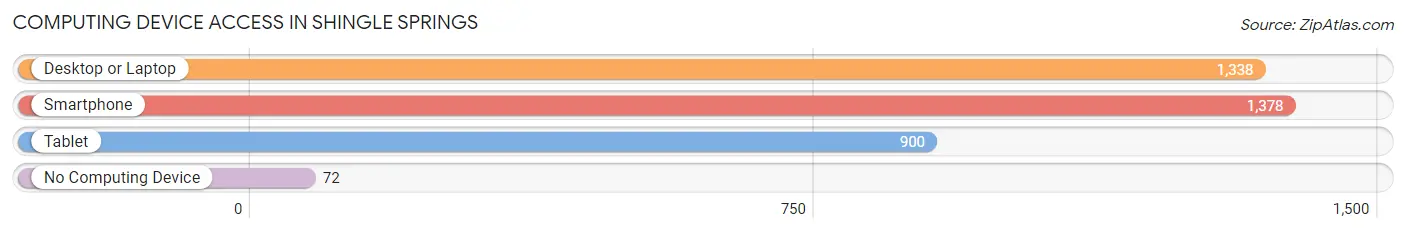
| Device Type | # Households | % Households |
| Desktop or Laptop | 1,338 | 90.3% |
| Smartphone | 1,378 | 93.0% |
| Tablet | 900 | 60.7% |
| No Computing Device | 72 | 4.9% |
| Total | 1,482 | 100.0% |
Internet Access in Shingle Springs
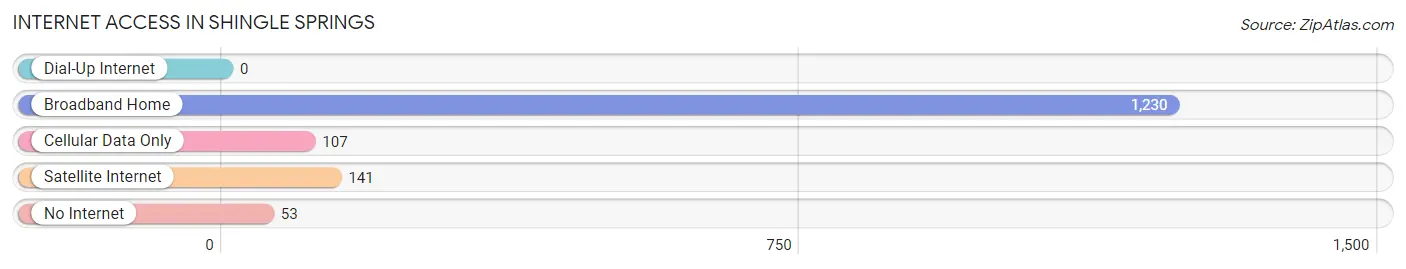
| Internet Type | # Households | % Households |
| Dial-Up Internet | 0 | 0.0% |
| Broadband Home | 1,230 | 83.0% |
| Cellular Data Only | 107 | 7.2% |
| Satellite Internet | 141 | 9.5% |
| No Internet | 53 | 3.6% |
| Total | 1,482 | 100.0% |
Shingle Springs Summary
Shingle Springs is a small unincorporated community located in El Dorado County, California. It is situated in the foothills of the Sierra Nevada Mountains, approximately 30 miles east of Sacramento. The population of Shingle Springs was 4,432 at the 2010 census.
History
The area now known as Shingle Springs was originally inhabited by the Miwok and Maidu Native American tribes. The first non-native settlers arrived in the area in the early 1850s. The town was named after the nearby Shingle Springs, which were used by the Native Americans to make roofing shingles.
In 1853, the town was officially established and the first post office was opened. The town grew slowly over the next few decades, and by the early 1900s, it had become a popular destination for tourists.
Geography
Shingle Springs is located in the foothills of the Sierra Nevada Mountains, approximately 30 miles east of Sacramento. The town is situated at an elevation of 1,400 feet above sea level. The area is characterized by rolling hills and oak woodlands.
The climate in Shingle Springs is mild and temperate. Summers are hot and dry, while winters are cool and wet. The average annual precipitation is approximately 25 inches.
Economy
The economy of Shingle Springs is largely based on tourism and agriculture. The town is home to several wineries, as well as a number of small businesses. The area is also popular with outdoor enthusiasts, who come to enjoy the nearby hiking trails and other recreational activities.
Demographics
As of the 2010 census, the population of Shingle Springs was 4,432. The racial makeup of the town was 79.3% White, 0.7% African American, 1.2% Native American, 0.7% Asian, 0.2% Pacific Islander, and 16.1% from other races. Hispanic or Latino of any race were 24.3% of the population.
The median household income in Shingle Springs was $60,938, and the median family income was $68,958. The per capita income was $27,945. About 8.3% of families and 11.2% of the population were below the poverty line.
Shingle Springs is served by the El Dorado Union High School District. The town is also home to several private schools, including Shingle Springs Christian Academy and Shingle Springs Montessori School.
Common Questions
What is Per Capita Income in Shingle Springs?
Per Capita income in Shingle Springs is $58,085.
What is the Median Family Income in Shingle Springs?
Median Family Income in Shingle Springs is $124,766.
What is the Median Household income in Shingle Springs?
Median Household Income in Shingle Springs is $105,789.
What is Income or Wage Gap in Shingle Springs?
Income or Wage Gap in Shingle Springs is 34.9%.
Women in Shingle Springs earn 65.1 cents for every dollar earned by a man.
What is Inequality or Gini Index in Shingle Springs?
Inequality or Gini Index in Shingle Springs is 0.47.
What is the Total Population of Shingle Springs?
Total Population of Shingle Springs is 3,703.
What is the Total Male Population of Shingle Springs?
Total Male Population of Shingle Springs is 1,836.
What is the Total Female Population of Shingle Springs?
Total Female Population of Shingle Springs is 1,867.
What is the Ratio of Males per 100 Females in Shingle Springs?
There are 98.34 Males per 100 Females in Shingle Springs.
What is the Ratio of Females per 100 Males in Shingle Springs?
There are 101.69 Females per 100 Males in Shingle Springs.
What is the Median Population Age in Shingle Springs?
Median Population Age in Shingle Springs is 47.6 Years.
What is the Average Family Size in Shingle Springs
Average Family Size in Shingle Springs is 3.0 People.
What is the Average Household Size in Shingle Springs
Average Household Size in Shingle Springs is 2.5 People.
How Large is the Labor Force in Shingle Springs?
There are 1,651 People in the Labor Forcein in Shingle Springs.
What is the Percentage of People in the Labor Force in Shingle Springs?
54.3% of People are in the Labor Force in Shingle Springs.
What is the Unemployment Rate in Shingle Springs?
Unemployment Rate in Shingle Springs is 5.9%.