Shasta Lake, CA Map & Demographics
Shasta Lake Map
Shasta Lake Overview
$26,355
PER CAPITA INCOME
$63,700
AVG FAMILY INCOME
$54,490
AVG HOUSEHOLD INCOME
23.7%
WAGE / INCOME GAP [ % ]
76.3¢/ $1
WAGE / INCOME GAP [ $ ]
0.44
INEQUALITY / GINI INDEX
10,361
TOTAL POPULATION
5,089
MALE POPULATION
5,272
FEMALE POPULATION
96.53
MALES / 100 FEMALES
103.60
FEMALES / 100 MALES
38.8
MEDIAN AGE
3.0
AVG FAMILY SIZE
2.6
AVG HOUSEHOLD SIZE
4,506
LABOR FORCE [ PEOPLE ]
54.3%
PERCENT IN LABOR FORCE
8.2%
UNEMPLOYMENT RATE
Shasta Lake Zip Codes
Shasta Lake Area Codes
Income in Shasta Lake
Income Overview in Shasta Lake
Per Capita Income in Shasta Lake is $26,355, while median incomes of families and households are $63,700 and $54,490 respectively.
| Characteristic | Number | Measure |
| Per Capita Income | 10,361 | $26,355 |
| Median Family Income | 2,738 | $63,700 |
| Mean Family Income | 2,738 | $77,314 |
| Median Household Income | 3,908 | $54,490 |
| Mean Household Income | 3,908 | $67,557 |
| Income Deficit | 2,738 | $0 |
| Wage / Income Gap (%) | 10,361 | 23.71% |
| Wage / Income Gap ($) | 10,361 | 76.29¢ per $1 |
| Gini / Inequality Index | 10,361 | 0.44 |
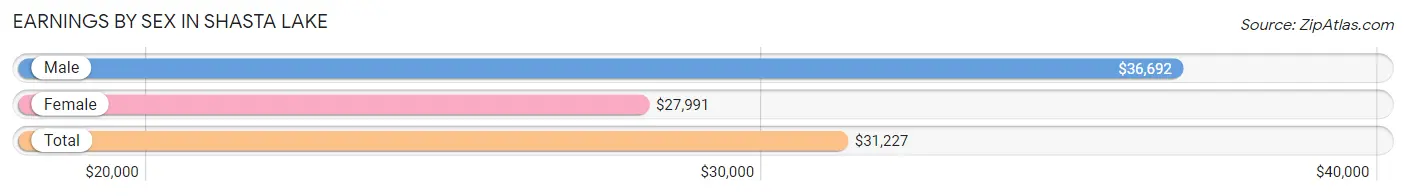
Earnings by Sex in Shasta Lake
Average Earnings in Shasta Lake are $31,227, $36,692 for men and $27,991 for women, a difference of 23.7%.
| Sex | Number | Average Earnings |
| Male | 2,512 (53.7%) | $36,692 |
| Female | 2,162 (46.3%) | $27,991 |
| Total | 4,674 (100.0%) | $31,227 |
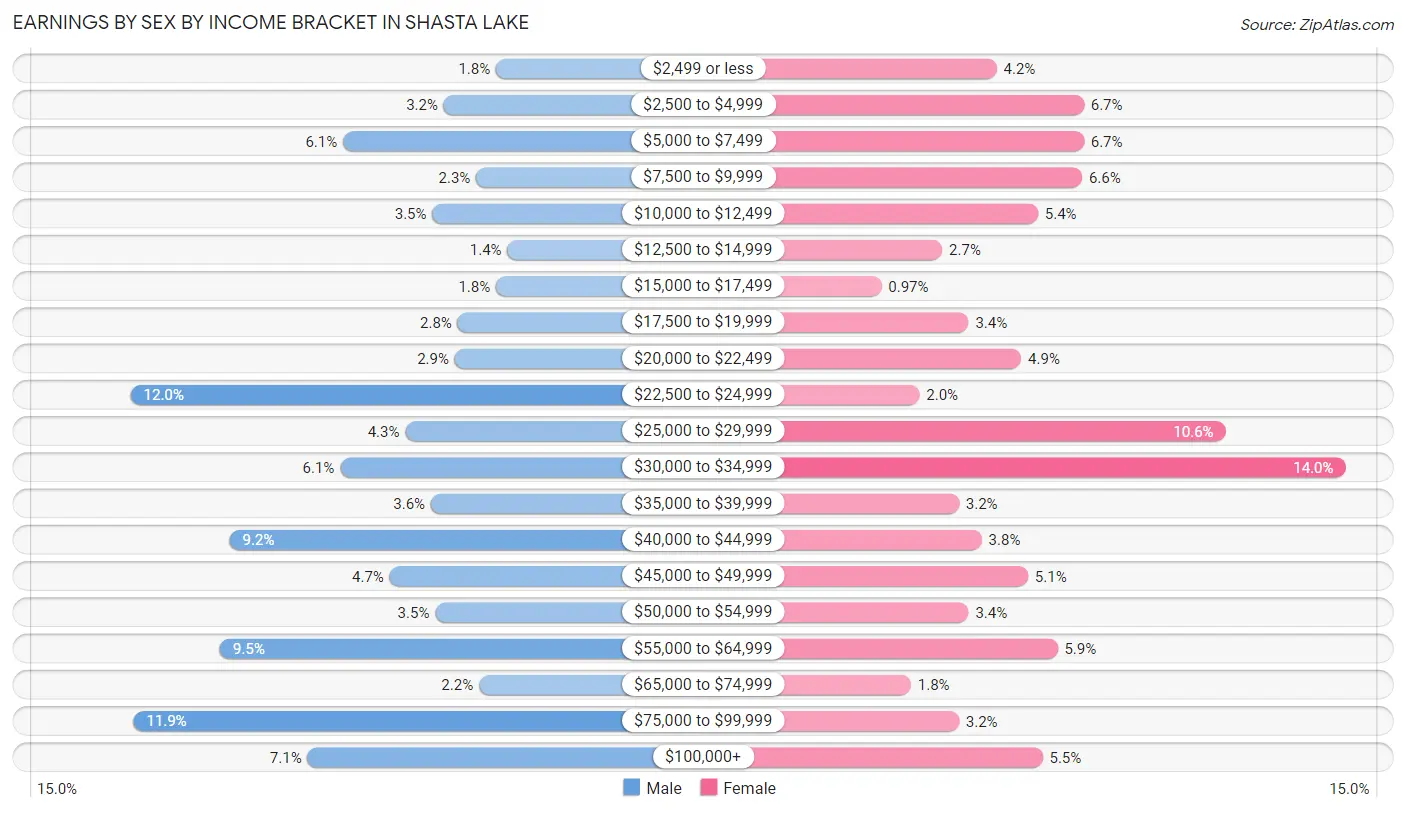
Earnings by Sex by Income Bracket in Shasta Lake
The most common earnings brackets in Shasta Lake are $22,500 to $24,999 for men (302 | 12.0%) and $30,000 to $34,999 for women (303 | 14.0%).
| Income | Male | Female |
| $2,499 or less | 44 (1.8%) | 91 (4.2%) |
| $2,500 to $4,999 | 81 (3.2%) | 144 (6.7%) |
| $5,000 to $7,499 | 152 (6.0%) | 144 (6.7%) |
| $7,500 to $9,999 | 58 (2.3%) | 143 (6.6%) |
| $10,000 to $12,499 | 89 (3.5%) | 116 (5.4%) |
| $12,500 to $14,999 | 36 (1.4%) | 58 (2.7%) |
| $15,000 to $17,499 | 44 (1.8%) | 21 (1.0%) |
| $17,500 to $19,999 | 71 (2.8%) | 74 (3.4%) |
| $20,000 to $22,499 | 73 (2.9%) | 106 (4.9%) |
| $22,500 to $24,999 | 302 (12.0%) | 44 (2.0%) |
| $25,000 to $29,999 | 108 (4.3%) | 230 (10.6%) |
| $30,000 to $34,999 | 154 (6.1%) | 303 (14.0%) |
| $35,000 to $39,999 | 90 (3.6%) | 68 (3.2%) |
| $40,000 to $44,999 | 232 (9.2%) | 82 (3.8%) |
| $45,000 to $49,999 | 119 (4.7%) | 110 (5.1%) |
| $50,000 to $54,999 | 87 (3.5%) | 74 (3.4%) |
| $55,000 to $64,999 | 239 (9.5%) | 128 (5.9%) |
| $65,000 to $74,999 | 56 (2.2%) | 39 (1.8%) |
| $75,000 to $99,999 | 300 (11.9%) | 68 (3.2%) |
| $100,000+ | 177 (7.0%) | 119 (5.5%) |
| Total | 2,512 (100.0%) | 2,162 (100.0%) |
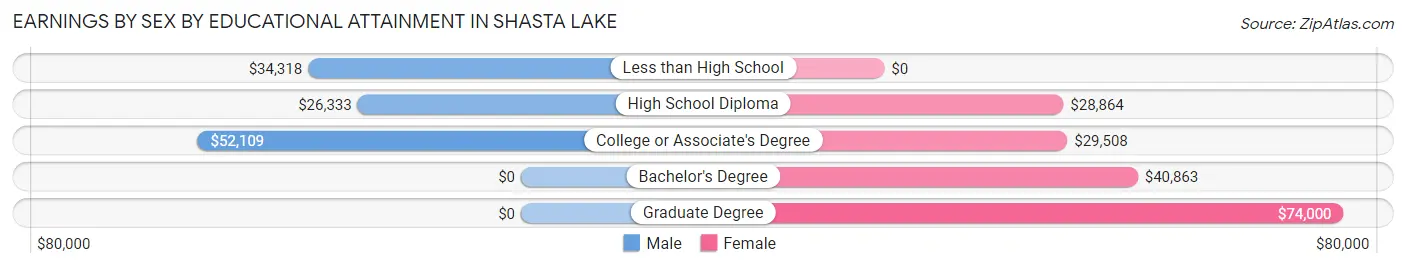
Earnings by Sex by Educational Attainment in Shasta Lake
Average earnings in Shasta Lake are $40,967 for men and $31,201 for women, a difference of 23.8%. Men with an educational attainment of college or associate's degree enjoy the highest average annual earnings of $52,109, while those with high school diploma education earn the least with $26,333. Women with an educational attainment of graduate degree earn the most with the average annual earnings of $74,000, while those with high school diploma education have the smallest earnings of $28,864.
| Educational Attainment | Male Income | Female Income |
| Less than High School | $34,318 | $0 |
| High School Diploma | $26,333 | $28,864 |
| College or Associate's Degree | $52,109 | $29,508 |
| Bachelor's Degree | - | - |
| Graduate Degree | - | - |
| Total | $40,967 | $31,201 |
Family Income in Shasta Lake
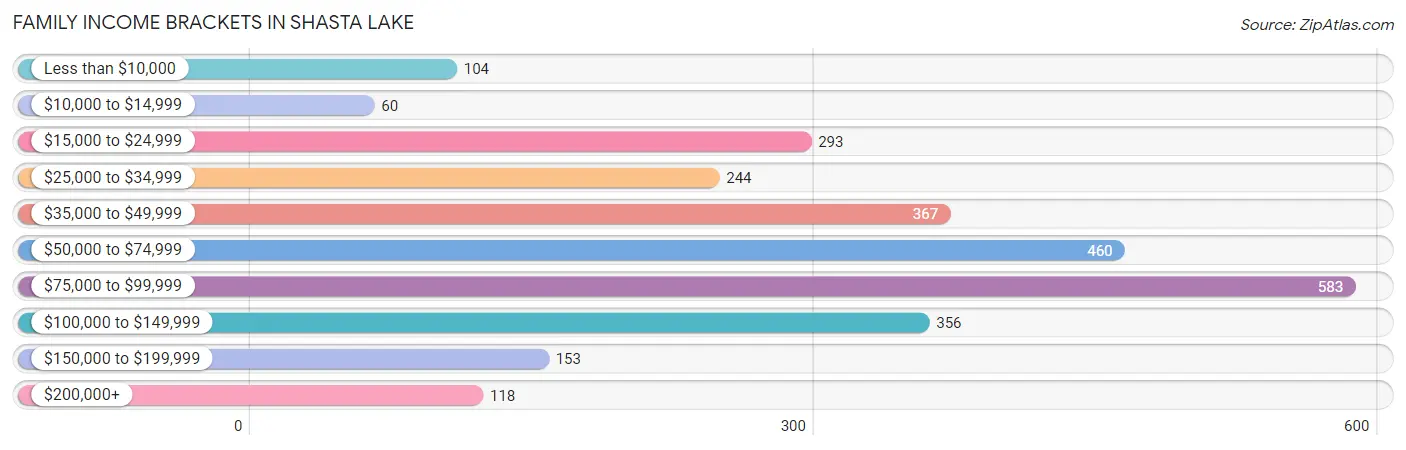
Family Income Brackets in Shasta Lake
According to the Shasta Lake family income data, there are 583 families falling into the $75,000 to $99,999 income range, which is the most common income bracket and makes up 21.3% of all families. Conversely, the $10,000 to $14,999 income bracket is the least frequent group with only 60 families (2.2%) belonging to this category.
| Income Bracket | # Families | % Families |
| Less than $10,000 | 104 | 3.8% |
| $10,000 to $14,999 | 60 | 2.2% |
| $15,000 to $24,999 | 293 | 10.7% |
| $25,000 to $34,999 | 244 | 8.9% |
| $35,000 to $49,999 | 367 | 13.4% |
| $50,000 to $74,999 | 460 | 16.8% |
| $75,000 to $99,999 | 583 | 21.3% |
| $100,000 to $149,999 | 356 | 13.0% |
| $150,000 to $199,999 | 153 | 5.6% |
| $200,000+ | 118 | 4.3% |
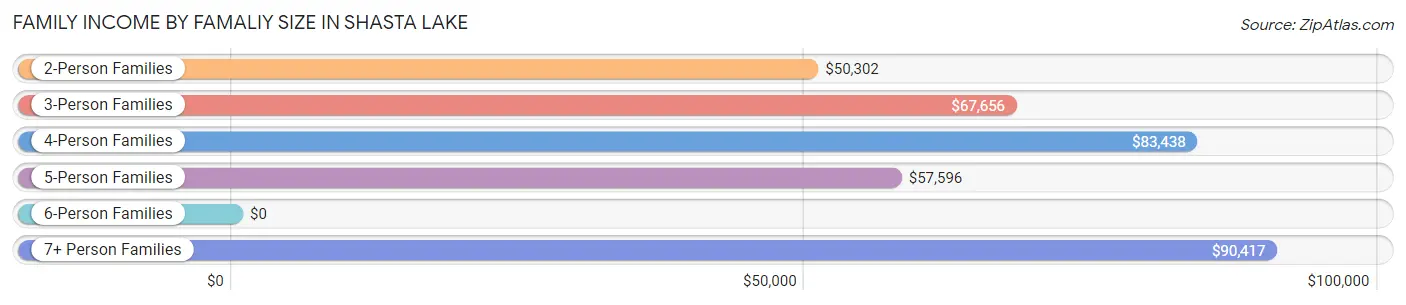
Family Income by Famaliy Size in Shasta Lake
7+ person families (75 | 2.7%) account for the highest median family income in Shasta Lake with $90,417 per family, while 2-person families (1,335 | 48.8%) have the highest median income of $25,151 per family member.
| Income Bracket | # Families | Median Income |
| 2-Person Families | 1,335 (48.8%) | $50,302 |
| 3-Person Families | 700 (25.6%) | $67,656 |
| 4-Person Families | 337 (12.3%) | $83,438 |
| 5-Person Families | 267 (9.8%) | $57,596 |
| 6-Person Families | 24 (0.9%) | $0 |
| 7+ Person Families | 75 (2.7%) | $90,417 |
| Total | 2,738 (100.0%) | $63,700 |
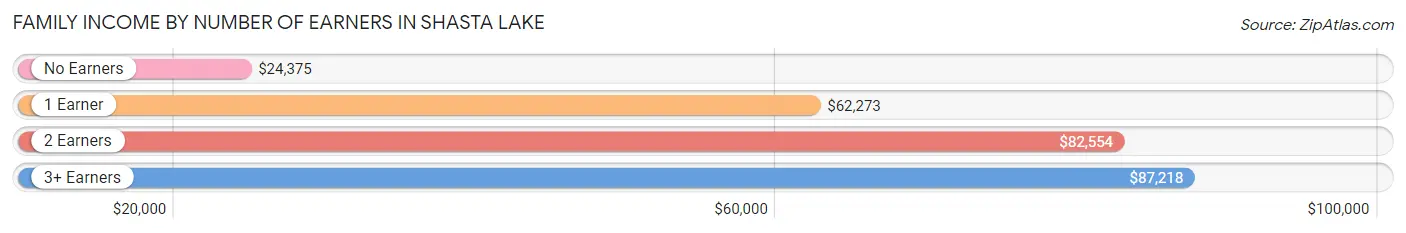
Family Income by Number of Earners in Shasta Lake
The median family income in Shasta Lake is $63,700, with families comprising 3+ earners (131) having the highest median family income of $87,218, while families with no earners (546) have the lowest median family income of $24,375, accounting for 4.8% and 19.9% of families, respectively.
| Number of Earners | # Families | Median Income |
| No Earners | 546 (19.9%) | $24,375 |
| 1 Earner | 1,020 (37.2%) | $62,273 |
| 2 Earners | 1,041 (38.0%) | $82,554 |
| 3+ Earners | 131 (4.8%) | $87,218 |
| Total | 2,738 (100.0%) | $63,700 |
Household Income in Shasta Lake
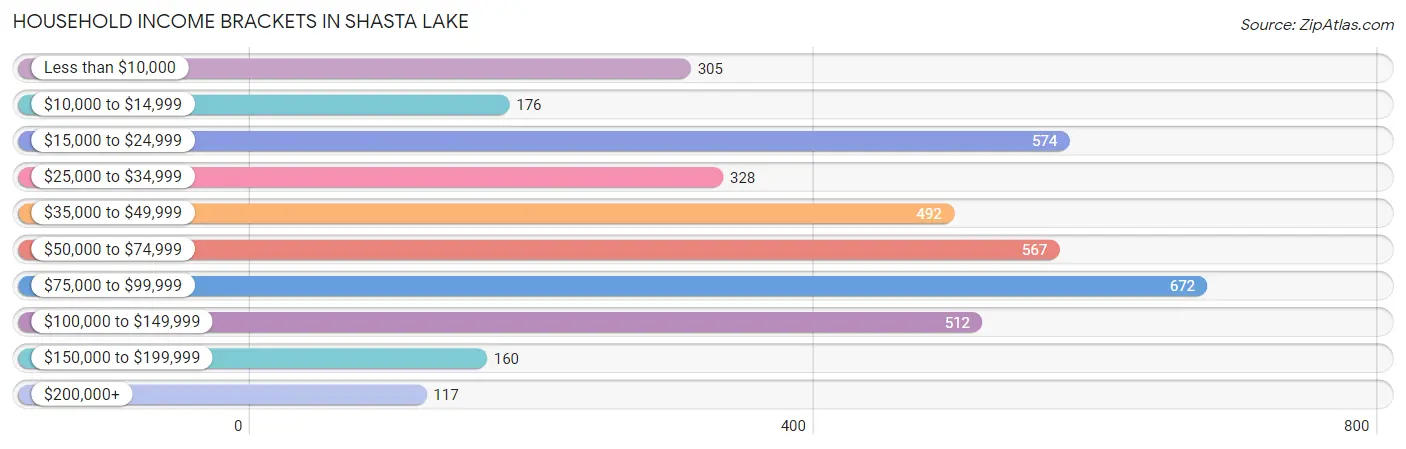
Household Income Brackets in Shasta Lake
With 672 households falling in the category, the $75,000 to $99,999 income range is the most frequent in Shasta Lake, accounting for 17.2% of all households. In contrast, only 117 households (3.0%) fall into the $200,000+ income bracket, making it the least populous group.
| Income Bracket | # Households | % Households |
| Less than $10,000 | 305 | 7.8% |
| $10,000 to $14,999 | 176 | 4.5% |
| $15,000 to $24,999 | 574 | 14.7% |
| $25,000 to $34,999 | 328 | 8.4% |
| $35,000 to $49,999 | 492 | 12.6% |
| $50,000 to $74,999 | 567 | 14.5% |
| $75,000 to $99,999 | 672 | 17.2% |
| $100,000 to $149,999 | 512 | 13.1% |
| $150,000 to $199,999 | 160 | 4.1% |
| $200,000+ | 117 | 3.0% |
Household Income by Householder Age in Shasta Lake
The median household income in Shasta Lake is $54,490, with the highest median household income of $66,080 found in the 45 to 64 years age bracket for the primary householder. A total of 1,311 households (33.6%) fall into this category. Meanwhile, the 65+ years age bracket for the primary householder has the lowest median household income of $35,915, with 1,242 households (31.8%) in this group.
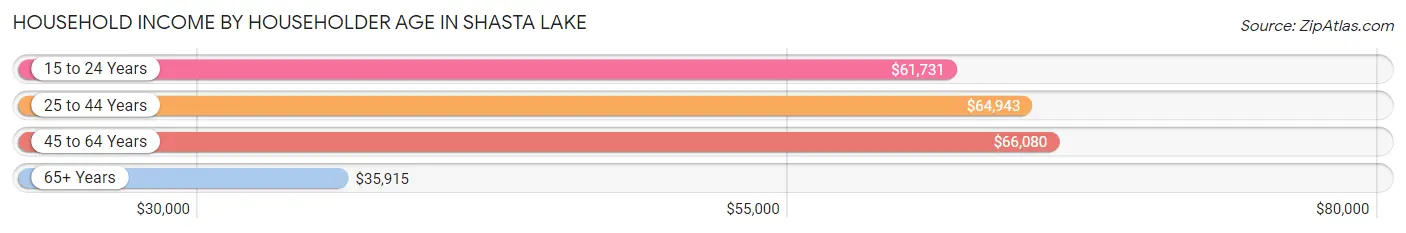
| Income Bracket | # Households | Median Income |
| 15 to 24 Years | 146 (3.7%) | $61,731 |
| 25 to 44 Years | 1,209 (30.9%) | $64,943 |
| 45 to 64 Years | 1,311 (33.6%) | $66,080 |
| 65+ Years | 1,242 (31.8%) | $35,915 |
| Total | 3,908 (100.0%) | $54,490 |
Poverty in Shasta Lake
Income Below Poverty by Sex and Age in Shasta Lake
With 15.0% poverty level for males and 21.1% for females among the residents of Shasta Lake, 12 to 14 year old males and 15 year old females are the most vulnerable to poverty, with 79 males (26.7%) and 82 females (52.2%) in their respective age groups living below the poverty level.
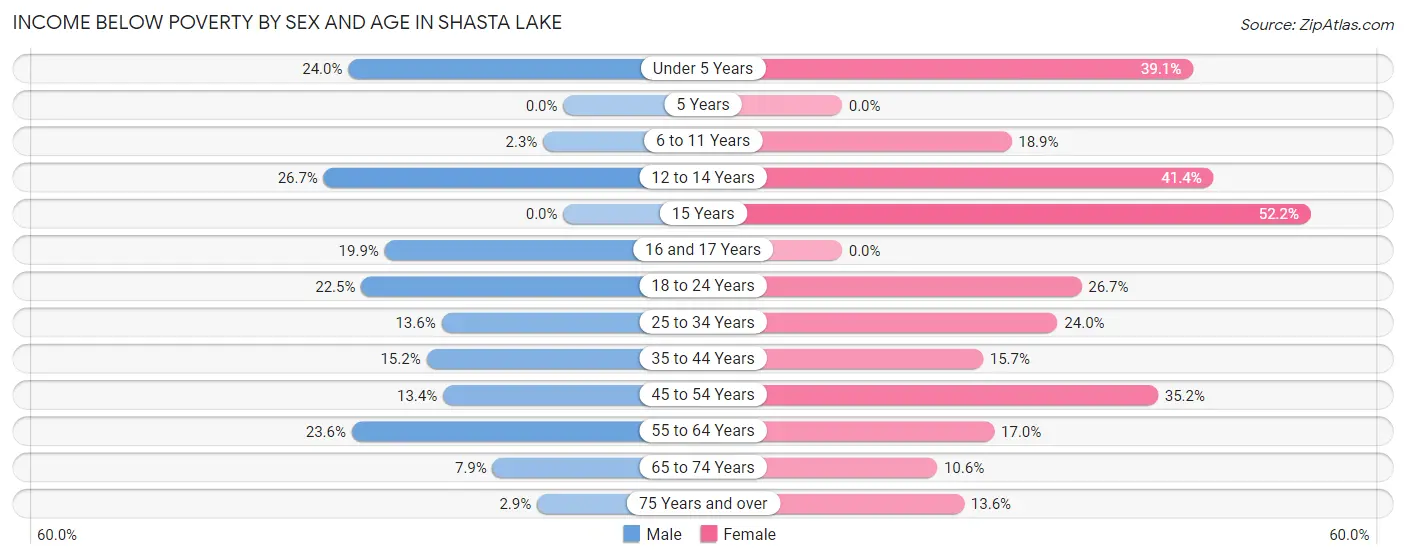
| Age Bracket | Male | Female |
| Under 5 Years | 40 (23.9%) | 124 (39.1%) |
| 5 Years | 0 (0.0%) | 0 (0.0%) |
| 6 to 11 Years | 11 (2.2%) | 64 (18.9%) |
| 12 to 14 Years | 79 (26.7%) | 41 (41.4%) |
| 15 Years | 0 (0.0%) | 82 (52.2%) |
| 16 and 17 Years | 38 (19.9%) | 0 (0.0%) |
| 18 to 24 Years | 119 (22.5%) | 112 (26.7%) |
| 25 to 34 Years | 89 (13.6%) | 133 (24.0%) |
| 35 to 44 Years | 105 (15.2%) | 111 (15.7%) |
| 45 to 54 Years | 76 (13.4%) | 209 (35.2%) |
| 55 to 64 Years | 159 (23.6%) | 107 (17.0%) |
| 65 to 74 Years | 42 (7.9%) | 95 (10.6%) |
| 75 Years and over | 6 (2.9%) | 37 (13.6%) |
| Total | 764 (15.0%) | 1,115 (21.1%) |
Income Above Poverty by Sex and Age in Shasta Lake
According to the poverty statistics in Shasta Lake, males aged 5 years and females aged 5 years are the age groups that are most secure financially, with 100.0% of males and 100.0% of females in these age groups living above the poverty line.
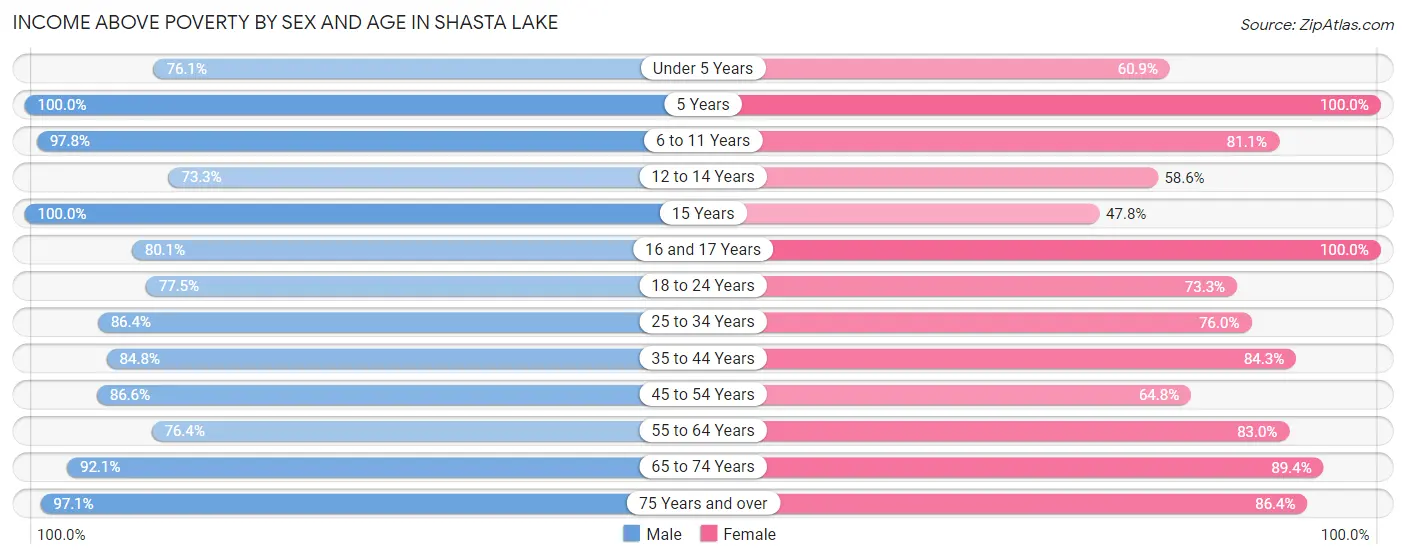
| Age Bracket | Male | Female |
| Under 5 Years | 127 (76.0%) | 193 (60.9%) |
| 5 Years | 65 (100.0%) | 107 (100.0%) |
| 6 to 11 Years | 478 (97.8%) | 275 (81.1%) |
| 12 to 14 Years | 217 (73.3%) | 58 (58.6%) |
| 15 Years | 27 (100.0%) | 75 (47.8%) |
| 16 and 17 Years | 153 (80.1%) | 179 (100.0%) |
| 18 to 24 Years | 410 (77.5%) | 308 (73.3%) |
| 25 to 34 Years | 567 (86.4%) | 421 (76.0%) |
| 35 to 44 Years | 584 (84.8%) | 596 (84.3%) |
| 45 to 54 Years | 491 (86.6%) | 385 (64.8%) |
| 55 to 64 Years | 516 (76.4%) | 524 (83.0%) |
| 65 to 74 Years | 491 (92.1%) | 801 (89.4%) |
| 75 Years and over | 199 (97.1%) | 235 (86.4%) |
| Total | 4,325 (85.0%) | 4,157 (78.8%) |
Income Below Poverty Among Married-Couple Families in Shasta Lake
The poverty statistics for married-couple families in Shasta Lake show that 6.1% or 111 of the total 1,818 families live below the poverty line. Families with 1 or 2 children have the highest poverty rate of 15.4%, comprising of 83 families. On the other hand, families with 5 or more children have the lowest poverty rate of 0.0%, which includes 0 families.
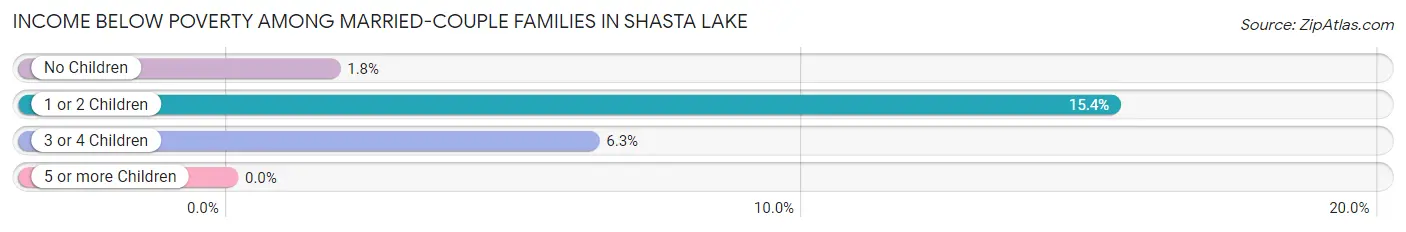
| Children | Above Poverty | Below Poverty |
| No Children | 1,051 (98.2%) | 19 (1.8%) |
| 1 or 2 Children | 457 (84.6%) | 83 (15.4%) |
| 3 or 4 Children | 134 (93.7%) | 9 (6.3%) |
| 5 or more Children | 65 (100.0%) | 0 (0.0%) |
| Total | 1,707 (93.9%) | 111 (6.1%) |
Income Below Poverty Among Single-Parent Households in Shasta Lake
According to the poverty data in Shasta Lake, 14.7% or 43 single-father households and 27.6% or 173 single-mother households are living below the poverty line. Among single-father households, those with 1 or 2 children have the highest poverty rate, with 43 households (22.1%) experiencing poverty. Likewise, among single-mother households, those with 3 or 4 children have the highest poverty rate, with 87 households (79.8%) falling below the poverty line.
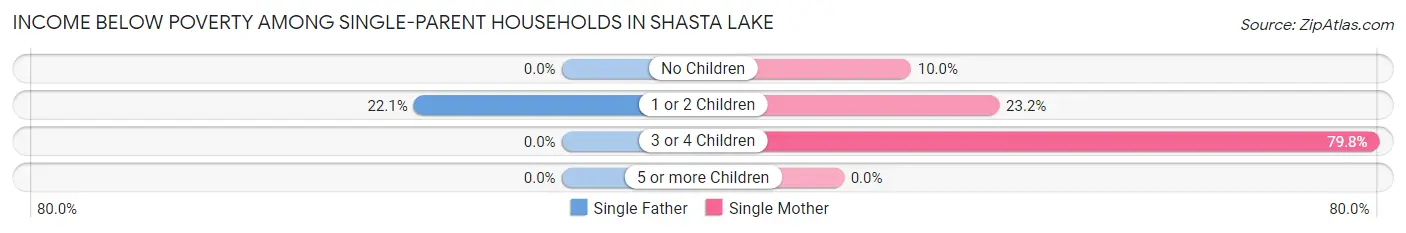
| Children | Single Father | Single Mother |
| No Children | 0 (0.0%) | 26 (10.0%) |
| 1 or 2 Children | 43 (22.1%) | 60 (23.2%) |
| 3 or 4 Children | 0 (0.0%) | 87 (79.8%) |
| 5 or more Children | 0 (0.0%) | 0 (0.0%) |
| Total | 43 (14.7%) | 173 (27.6%) |
Income Below Poverty Among Married-Couple vs Single-Parent Households in Shasta Lake
The poverty data for Shasta Lake shows that 111 of the married-couple family households (6.1%) and 216 of the single-parent households (23.5%) are living below the poverty level. Within the married-couple family households, those with 1 or 2 children have the highest poverty rate, with 83 households (15.4%) falling below the poverty line. Among the single-parent households, those with 3 or 4 children have the highest poverty rate, with 87 household (75.6%) living below poverty.
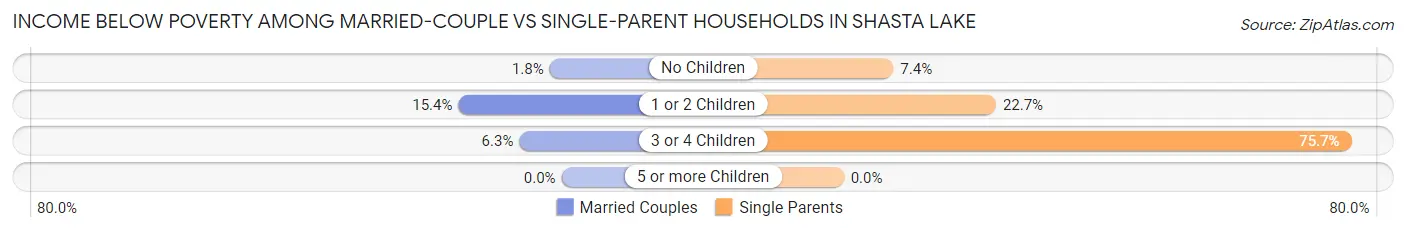
| Children | Married-Couple Families | Single-Parent Households |
| No Children | 19 (1.8%) | 26 (7.4%) |
| 1 or 2 Children | 83 (15.4%) | 103 (22.7%) |
| 3 or 4 Children | 9 (6.3%) | 87 (75.6%) |
| 5 or more Children | 0 (0.0%) | 0 (0.0%) |
| Total | 111 (6.1%) | 216 (23.5%) |
Race in Shasta Lake
The most populous races in Shasta Lake are White / Caucasian (8,696 | 83.9%), Hispanic or Latino (1,217 | 11.7%), and Two or more Races (1,087 | 10.5%).
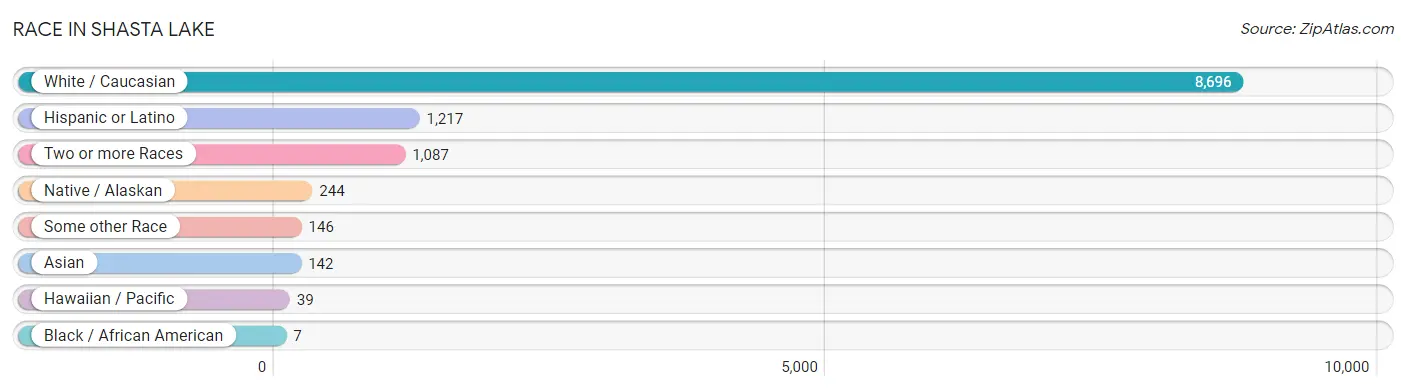
| Race | # Population | % Population |
| Asian | 142 | 1.4% |
| Black / African American | 7 | 0.1% |
| Hawaiian / Pacific | 39 | 0.4% |
| Hispanic or Latino | 1,217 | 11.7% |
| Native / Alaskan | 244 | 2.4% |
| White / Caucasian | 8,696 | 83.9% |
| Two or more Races | 1,087 | 10.5% |
| Some other Race | 146 | 1.4% |
| Total | 10,361 | 100.0% |
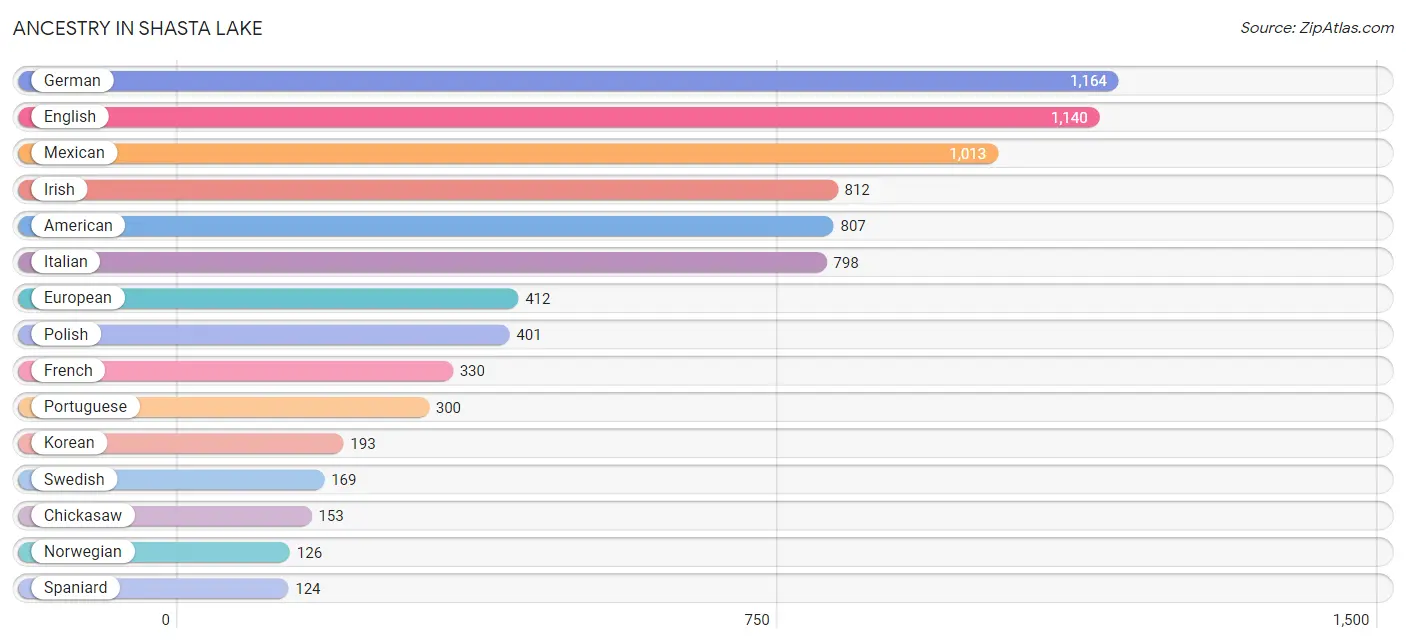
Ancestry in Shasta Lake
The most populous ancestries reported in Shasta Lake are German (1,164 | 11.2%), English (1,140 | 11.0%), Mexican (1,013 | 9.8%), Irish (812 | 7.8%), and American (807 | 7.8%), together accounting for 47.6% of all Shasta Lake residents.
| Ancestry | # Population | % Population |
| American | 807 | 7.8% |
| Apache | 45 | 0.4% |
| Arab | 38 | 0.4% |
| Armenian | 8 | 0.1% |
| Assyrian / Chaldean / Syriac | 59 | 0.6% |
| Australian | 11 | 0.1% |
| Bhutanese | 39 | 0.4% |
| British | 91 | 0.9% |
| Cherokee | 60 | 0.6% |
| Chickasaw | 153 | 1.5% |
| Chippewa | 6 | 0.1% |
| Choctaw | 21 | 0.2% |
| Colombian | 13 | 0.1% |
| Croatian | 11 | 0.1% |
| Cuban | 3 | 0.0% |
| Czech | 17 | 0.2% |
| Danish | 49 | 0.5% |
| Dutch | 109 | 1.1% |
| Eastern European | 57 | 0.5% |
| English | 1,140 | 11.0% |
| European | 412 | 4.0% |
| Finnish | 45 | 0.4% |
| French | 330 | 3.2% |
| French Canadian | 103 | 1.0% |
| German | 1,164 | 11.2% |
| Greek | 14 | 0.1% |
| Guamanian / Chamorro | 39 | 0.4% |
| Hungarian | 22 | 0.2% |
| Icelander | 14 | 0.1% |
| Indian (Asian) | 6 | 0.1% |
| Irish | 812 | 7.8% |
| Italian | 798 | 7.7% |
| Jamaican | 22 | 0.2% |
| Korean | 193 | 1.9% |
| Lebanese | 7 | 0.1% |
| Lithuanian | 4 | 0.0% |
| Malaysian | 11 | 0.1% |
| Mexican | 1,013 | 9.8% |
| Mexican American Indian | 41 | 0.4% |
| Native Hawaiian | 32 | 0.3% |
| Navajo | 22 | 0.2% |
| Nepalese | 98 | 0.9% |
| Northern European | 40 | 0.4% |
| Norwegian | 126 | 1.2% |
| Paiute | 17 | 0.2% |
| Polish | 401 | 3.9% |
| Portuguese | 300 | 2.9% |
| Potawatomi | 8 | 0.1% |
| Pueblo | 16 | 0.2% |
| Puerto Rican | 29 | 0.3% |
| Russian | 20 | 0.2% |
| Scandinavian | 61 | 0.6% |
| Scotch-Irish | 53 | 0.5% |
| Scottish | 68 | 0.7% |
| South American | 13 | 0.1% |
| Spaniard | 124 | 1.2% |
| Spanish | 12 | 0.1% |
| Swedish | 169 | 1.6% |
| Swiss | 41 | 0.4% |
| Ukrainian | 36 | 0.4% |
| Welsh | 122 | 1.2% |
| Yakama | 17 | 0.2% |
| Yaqui | 8 | 0.1% |
| Yugoslavian | 22 | 0.2% | View All 64 Rows |
Immigrants in Shasta Lake
The most numerous immigrant groups reported in Shasta Lake came from Central America (103 | 1.0%), Latin America (103 | 1.0%), Mexico (103 | 1.0%), Asia (81 | 0.8%), and South Eastern Asia (67 | 0.6%), together accounting for 4.4% of all Shasta Lake residents.
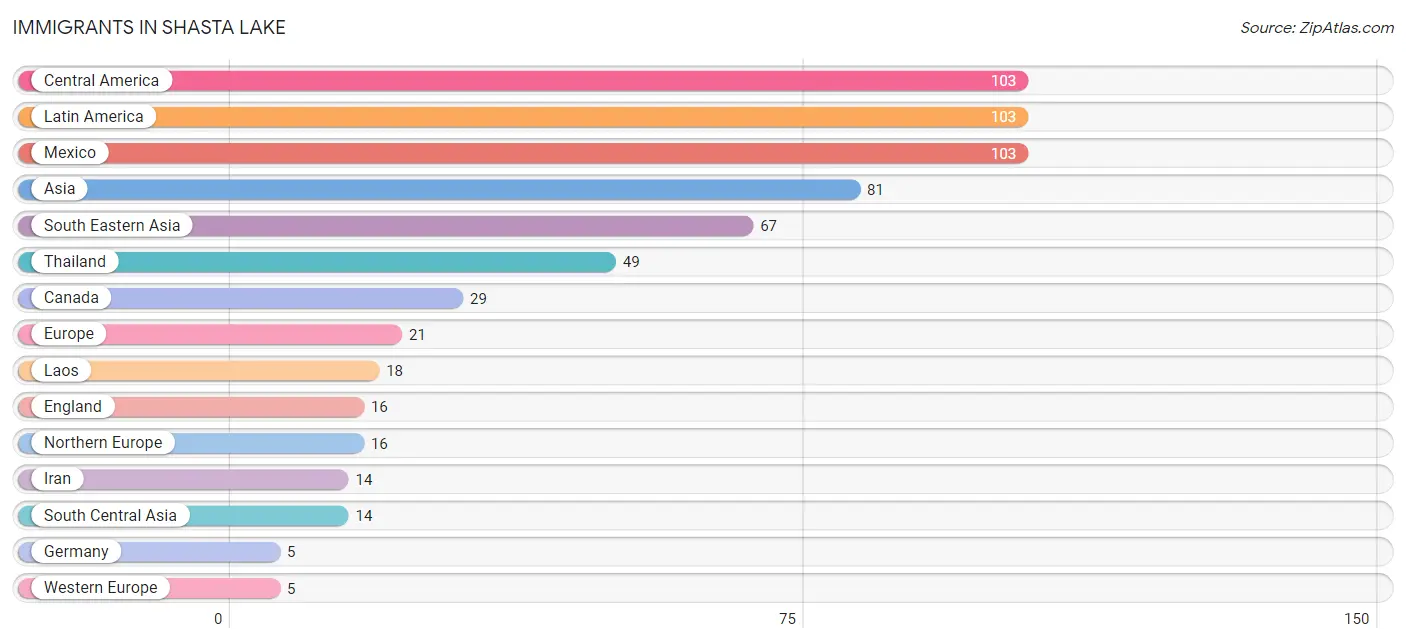
| Immigration Origin | # Population | % Population |
| Asia | 81 | 0.8% |
| Canada | 29 | 0.3% |
| Central America | 103 | 1.0% |
| England | 16 | 0.2% |
| Europe | 21 | 0.2% |
| Germany | 5 | 0.1% |
| Iran | 14 | 0.1% |
| Laos | 18 | 0.2% |
| Latin America | 103 | 1.0% |
| Mexico | 103 | 1.0% |
| Northern Europe | 16 | 0.2% |
| South Central Asia | 14 | 0.1% |
| South Eastern Asia | 67 | 0.6% |
| Thailand | 49 | 0.5% |
| Western Europe | 5 | 0.1% | View All 15 Rows |
Sex and Age in Shasta Lake
Sex and Age in Shasta Lake
The most populous age groups in Shasta Lake are 10 to 14 Years (428 | 8.4%) for men and 65 to 69 Years (563 | 10.7%) for women.
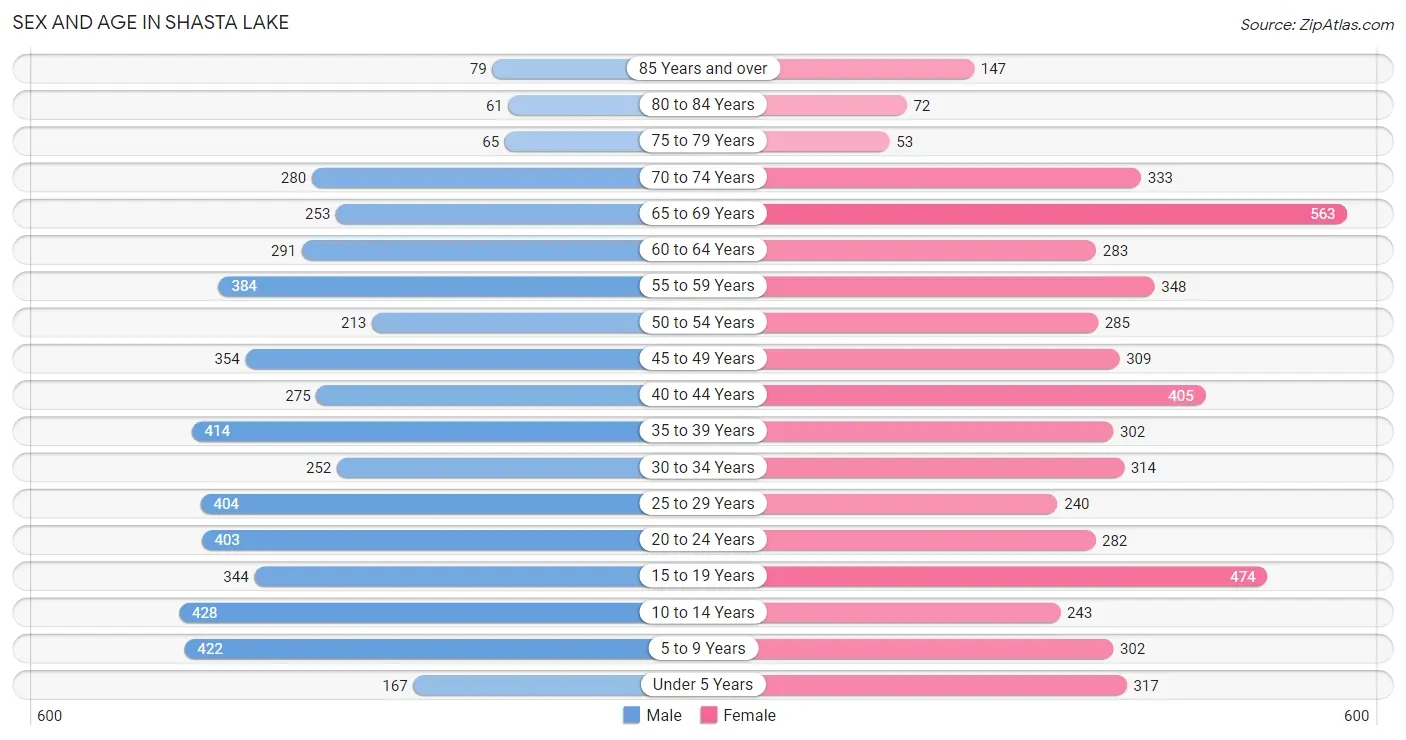
| Age Bracket | Male | Female |
| Under 5 Years | 167 (3.3%) | 317 (6.0%) |
| 5 to 9 Years | 422 (8.3%) | 302 (5.7%) |
| 10 to 14 Years | 428 (8.4%) | 243 (4.6%) |
| 15 to 19 Years | 344 (6.8%) | 474 (9.0%) |
| 20 to 24 Years | 403 (7.9%) | 282 (5.3%) |
| 25 to 29 Years | 404 (7.9%) | 240 (4.5%) |
| 30 to 34 Years | 252 (5.0%) | 314 (6.0%) |
| 35 to 39 Years | 414 (8.1%) | 302 (5.7%) |
| 40 to 44 Years | 275 (5.4%) | 405 (7.7%) |
| 45 to 49 Years | 354 (7.0%) | 309 (5.9%) |
| 50 to 54 Years | 213 (4.2%) | 285 (5.4%) |
| 55 to 59 Years | 384 (7.5%) | 348 (6.6%) |
| 60 to 64 Years | 291 (5.7%) | 283 (5.4%) |
| 65 to 69 Years | 253 (5.0%) | 563 (10.7%) |
| 70 to 74 Years | 280 (5.5%) | 333 (6.3%) |
| 75 to 79 Years | 65 (1.3%) | 53 (1.0%) |
| 80 to 84 Years | 61 (1.2%) | 72 (1.4%) |
| 85 Years and over | 79 (1.5%) | 147 (2.8%) |
| Total | 5,089 (100.0%) | 5,272 (100.0%) |
Families and Households in Shasta Lake
Median Family Size in Shasta Lake
The median family size in Shasta Lake is 2.99 persons per family, with married-couple families (1,818 | 66.4%) accounting for the largest median family size of 3.11 persons per family. On the other hand, single male/father families (292 | 10.7%) represent the smallest median family size with 2.39 persons per family.
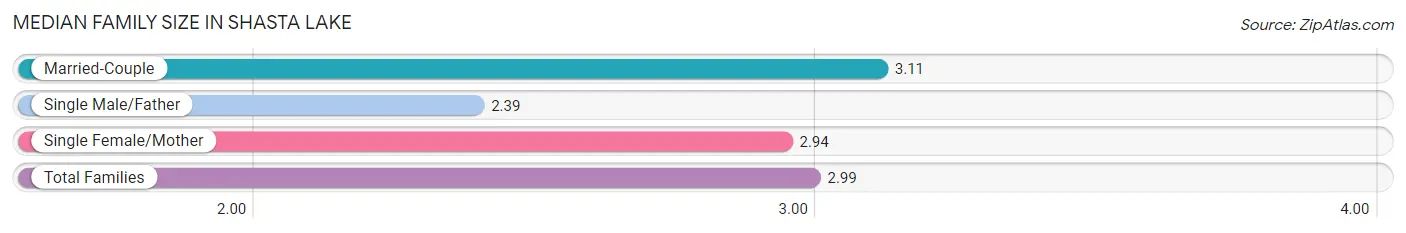
| Family Type | # Families | Family Size |
| Married-Couple | 1,818 (66.4%) | 3.11 |
| Single Male/Father | 292 (10.7%) | 2.39 |
| Single Female/Mother | 628 (22.9%) | 2.94 |
| Total Families | 2,738 (100.0%) | 2.99 |
Median Household Size in Shasta Lake
The median household size in Shasta Lake is 2.64 persons per household, with single male/father households (292 | 7.5%) accounting for the largest median household size of 3.5 persons per household. non-family households (1,170 | 29.9%) represent the smallest median household size with 1.32 persons per household.
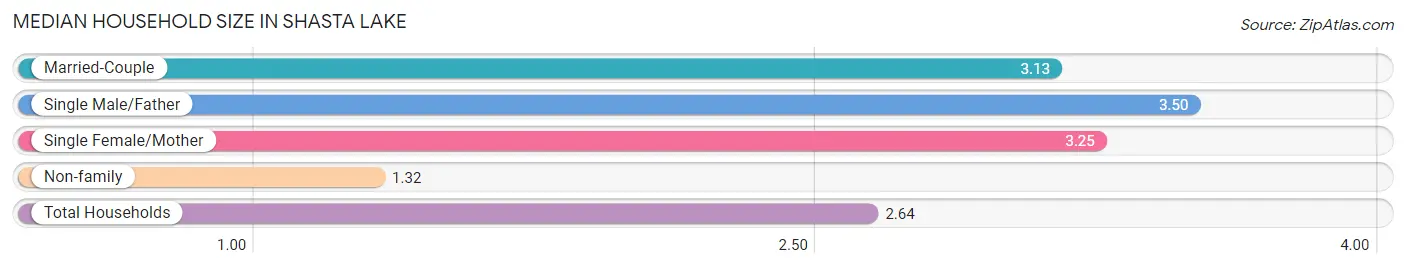
| Household Type | # Households | Household Size |
| Married-Couple | 1,818 (46.5%) | 3.13 |
| Single Male/Father | 292 (7.5%) | 3.50 |
| Single Female/Mother | 628 (16.1%) | 3.25 |
| Non-family | 1,170 (29.9%) | 1.32 |
| Total Households | 3,908 (100.0%) | 2.64 |
Household Size by Marriage Status in Shasta Lake
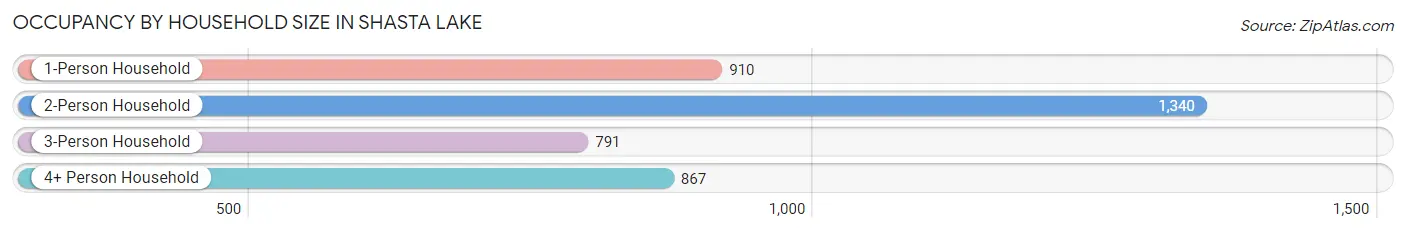
Out of a total of 3,908 households in Shasta Lake, 2,738 (70.1%) are family households, while 1,170 (29.9%) are nonfamily households. The most numerous type of family households are 2-person households, comprising 1,178, and the most common type of nonfamily households are 1-person households, comprising 910.
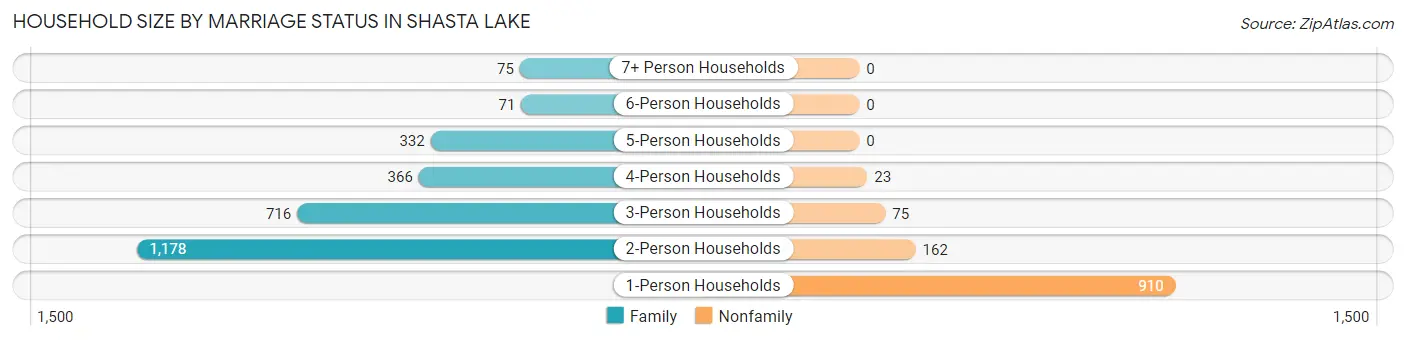
| Household Size | Family Households | Nonfamily Households |
| 1-Person Households | - | 910 (23.3%) |
| 2-Person Households | 1,178 (30.1%) | 162 (4.2%) |
| 3-Person Households | 716 (18.3%) | 75 (1.9%) |
| 4-Person Households | 366 (9.4%) | 23 (0.6%) |
| 5-Person Households | 332 (8.5%) | 0 (0.0%) |
| 6-Person Households | 71 (1.8%) | 0 (0.0%) |
| 7+ Person Households | 75 (1.9%) | 0 (0.0%) |
| Total | 2,738 (70.1%) | 1,170 (29.9%) |
Female Fertility in Shasta Lake
Fertility by Age in Shasta Lake
Average fertility rate in Shasta Lake is 17.0 births per 1,000 women. Women in the age bracket of 20 to 34 years have the highest fertility rate with 25.0 births per 1,000 women. Women in the age bracket of 20 to 34 years acount for 51.2% of all women with births.
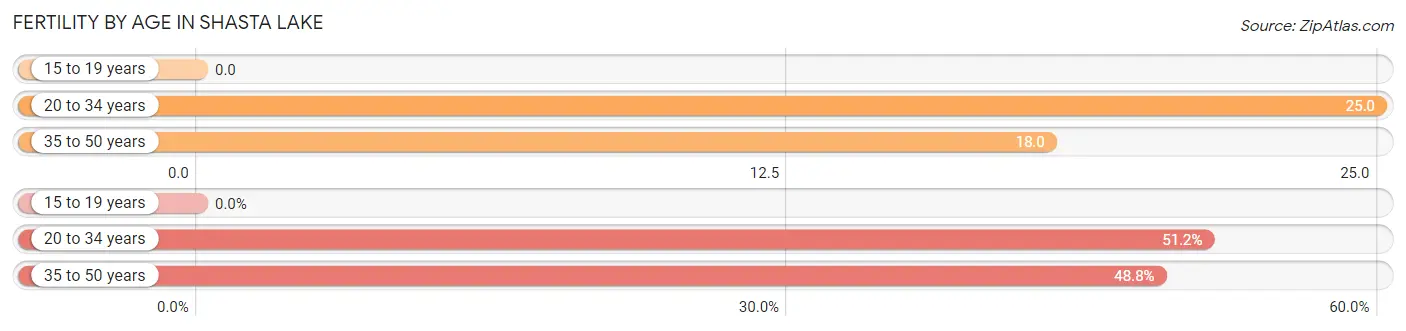
| Age Bracket | Women with Births | Births / 1,000 Women |
| 15 to 19 years | 0 (0.0%) | 0.0 |
| 20 to 34 years | 21 (51.2%) | 25.0 |
| 35 to 50 years | 20 (48.8%) | 18.0 |
| Total | 41 (100.0%) | 17.0 |
Fertility by Age by Marriage Status in Shasta Lake
75.6% of women with births (41) in Shasta Lake are married. The highest percentage of unmarried women with births falls into 20 to 34 years age bracket with 47.6% of them unmarried at the time of birth, while the lowest percentage of unmarried women with births belong to 35 to 50 years age bracket with 0.0% of them unmarried.
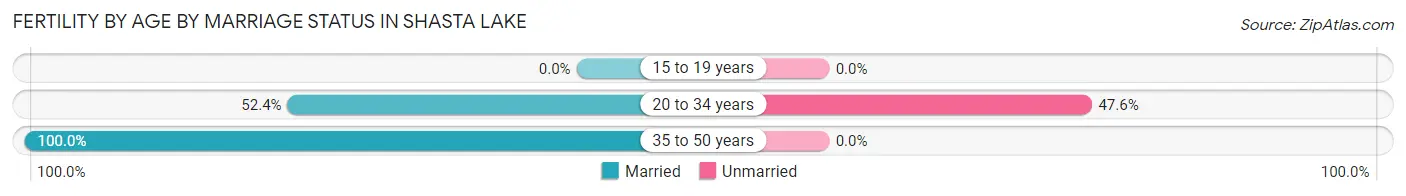
| Age Bracket | Married | Unmarried |
| 15 to 19 years | 0 (0.0%) | 0 (0.0%) |
| 20 to 34 years | 11 (52.4%) | 10 (47.6%) |
| 35 to 50 years | 20 (100.0%) | 0 (0.0%) |
| Total | 31 (75.6%) | 10 (24.4%) |
Fertility by Education in Shasta Lake
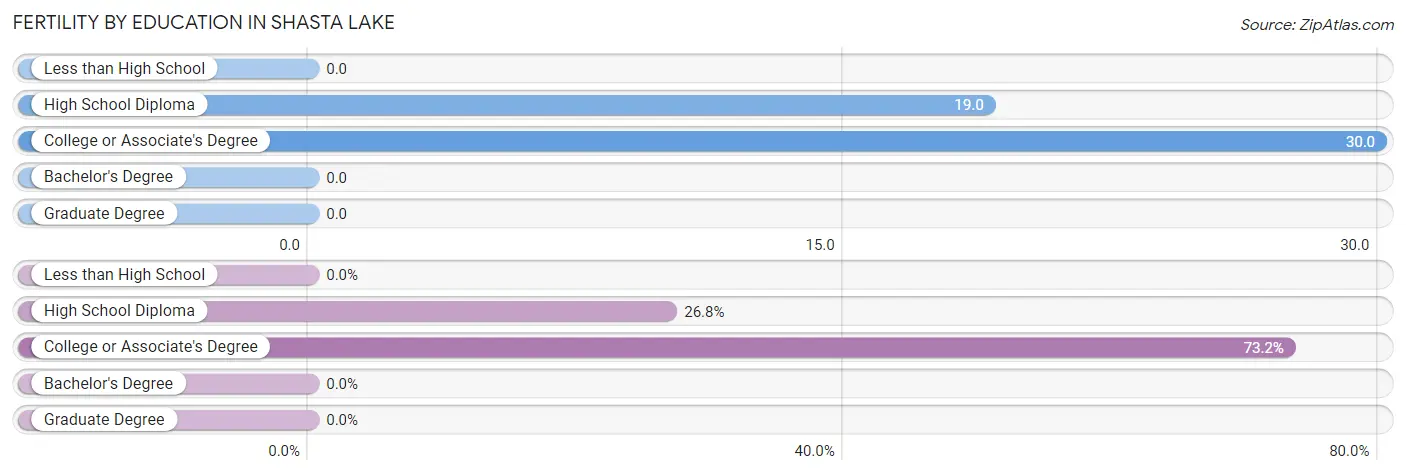
| Educational Attainment | Women with Births | Births / 1,000 Women |
| Less than High School | 0 (0.0%) | 0.0 |
| High School Diploma | 11 (26.8%) | 19.0 |
| College or Associate's Degree | 30 (73.2%) | 30.0 |
| Bachelor's Degree | 0 (0.0%) | 0.0 |
| Graduate Degree | 0 (0.0%) | 0.0 |
| Total | 41 (100.0%) | 17.0 |
Fertility by Education by Marriage Status in Shasta Lake
24.4% of women with births in Shasta Lake are unmarried. Women with the educational attainment of high school diploma are most likely to be married with 100.0% of them married at childbirth, while women with the educational attainment of college or associate's degree are least likely to be married with 33.3% of them unmarried at childbirth.
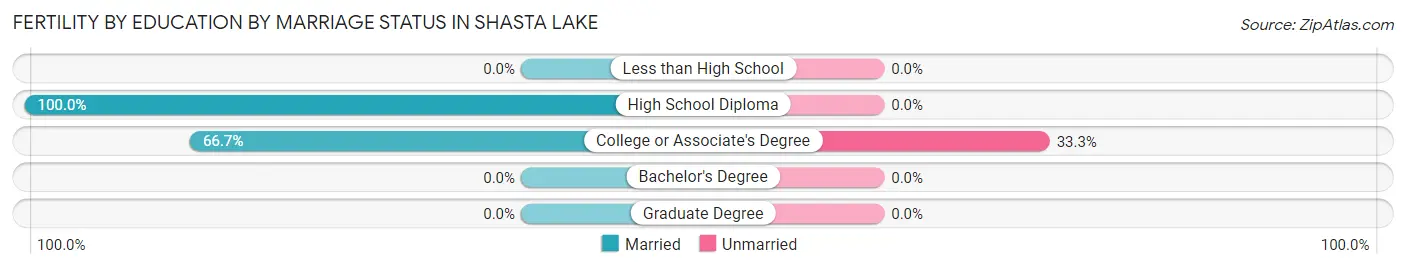
| Educational Attainment | Married | Unmarried |
| Less than High School | 0 (0.0%) | 0 (0.0%) |
| High School Diploma | 11 (100.0%) | 0 (0.0%) |
| College or Associate's Degree | 20 (66.7%) | 10 (33.3%) |
| Bachelor's Degree | 0 (0.0%) | 0 (0.0%) |
| Graduate Degree | 0 (0.0%) | 0 (0.0%) |
| Total | 31 (75.6%) | 10 (24.4%) |
Employment Characteristics in Shasta Lake
Employment by Class of Employer in Shasta Lake
Among the 4,089 employed individuals in Shasta Lake, private company employees (2,602 | 63.6%), local government employees (381 | 9.3%), and not-for-profit organizations (305 | 7.5%) make up the most common classes of employment.
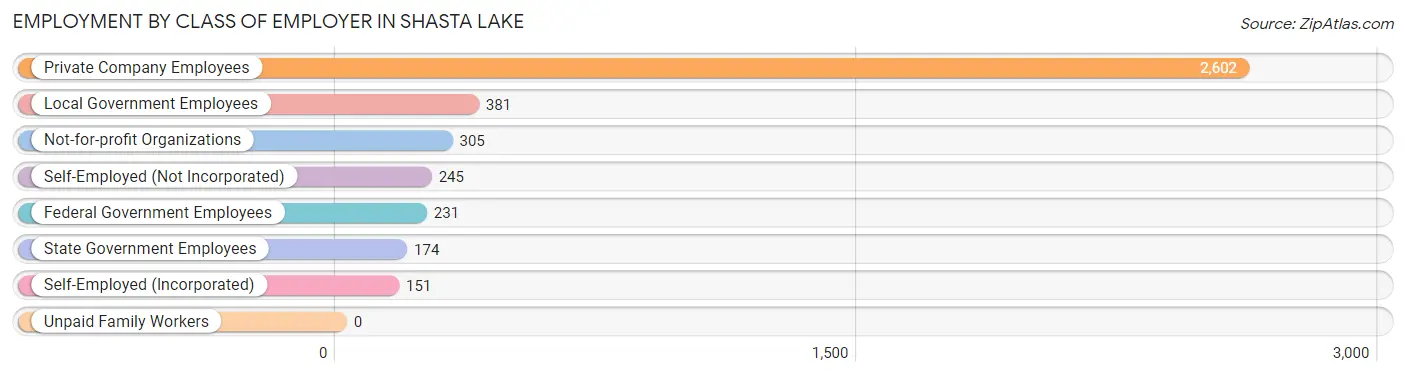
| Employer Class | # Employees | % Employees |
| Private Company Employees | 2,602 | 63.6% |
| Self-Employed (Incorporated) | 151 | 3.7% |
| Self-Employed (Not Incorporated) | 245 | 6.0% |
| Not-for-profit Organizations | 305 | 7.5% |
| Local Government Employees | 381 | 9.3% |
| State Government Employees | 174 | 4.3% |
| Federal Government Employees | 231 | 5.7% |
| Unpaid Family Workers | 0 | 0.0% |
| Total | 4,089 | 100.0% |
Employment Status by Age in Shasta Lake
According to the labor force statistics for Shasta Lake, out of the total population over 16 years of age (8,298), 54.3% or 4,506 individuals are in the labor force, with 8.2% or 369 of them unemployed. The age group with the highest labor force participation rate is 25 to 29 years, with 84.9% or 547 individuals in the labor force. Within the labor force, the 16 to 19 years age range has the highest percentage of unemployed individuals, with 17.5% or 40 of them being unemployed.
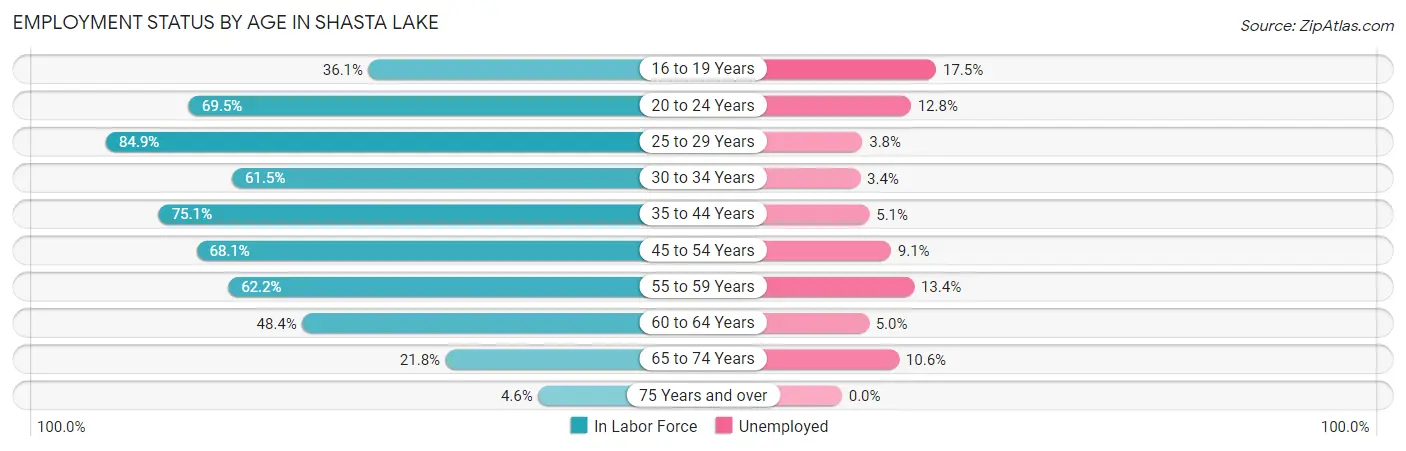
| Age Bracket | In Labor Force | Unemployed |
| 16 to 19 Years | 229 (36.1%) | 40 (17.5%) |
| 20 to 24 Years | 476 (69.5%) | 61 (12.8%) |
| 25 to 29 Years | 547 (84.9%) | 21 (3.8%) |
| 30 to 34 Years | 348 (61.5%) | 12 (3.4%) |
| 35 to 44 Years | 1,048 (75.1%) | 53 (5.1%) |
| 45 to 54 Years | 791 (68.1%) | 72 (9.1%) |
| 55 to 59 Years | 455 (62.2%) | 61 (13.4%) |
| 60 to 64 Years | 278 (48.4%) | 14 (5.0%) |
| 65 to 74 Years | 312 (21.8%) | 33 (10.6%) |
| 75 Years and over | 22 (4.6%) | 0 (0.0%) |
| Total | 4,506 (54.3%) | 369 (8.2%) |
Employment Status by Educational Attainment in Shasta Lake
According to labor force statistics for Shasta Lake, 68.4% of individuals (3,470) out of the total population between 25 and 64 years of age (5,073) are in the labor force, with 6.7% or 232 of them being unemployed. The group with the highest labor force participation rate are those with the educational attainment of bachelor's degree or higher, with 89.8% or 593 individuals in the labor force. Within the labor force, individuals with bachelor's degree or higher education have the highest percentage of unemployment, with 11.6% or 69 of them being unemployed.
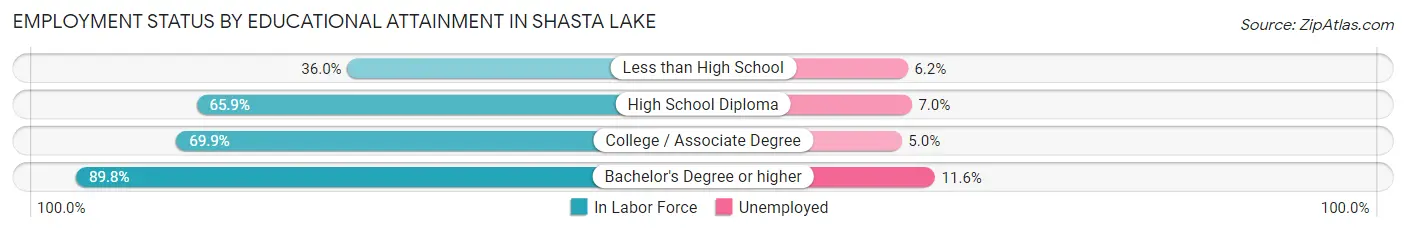
| Educational Attainment | In Labor Force | Unemployed |
| Less than High School | 161 (36.0%) | 28 (6.2%) |
| High School Diploma | 949 (65.9%) | 101 (7.0%) |
| College / Associate Degree | 1,766 (69.9%) | 126 (5.0%) |
| Bachelor's Degree or higher | 593 (89.8%) | 77 (11.6%) |
| Total | 3,470 (68.4%) | 340 (6.7%) |
Employment Occupations by Sex in Shasta Lake
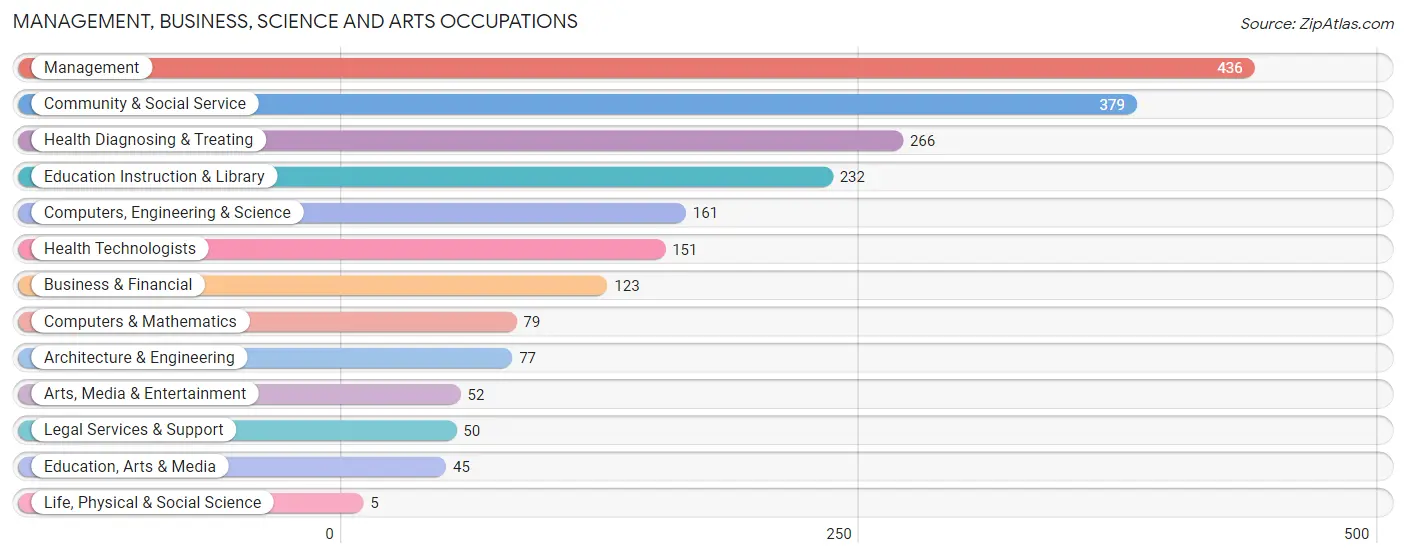
Management, Business, Science and Arts Occupations
The most common Management, Business, Science and Arts occupations in Shasta Lake are Management (436 | 10.5%), Community & Social Service (379 | 9.2%), Health Diagnosing & Treating (266 | 6.4%), Education Instruction & Library (232 | 5.6%), and Computers, Engineering & Science (161 | 3.9%).
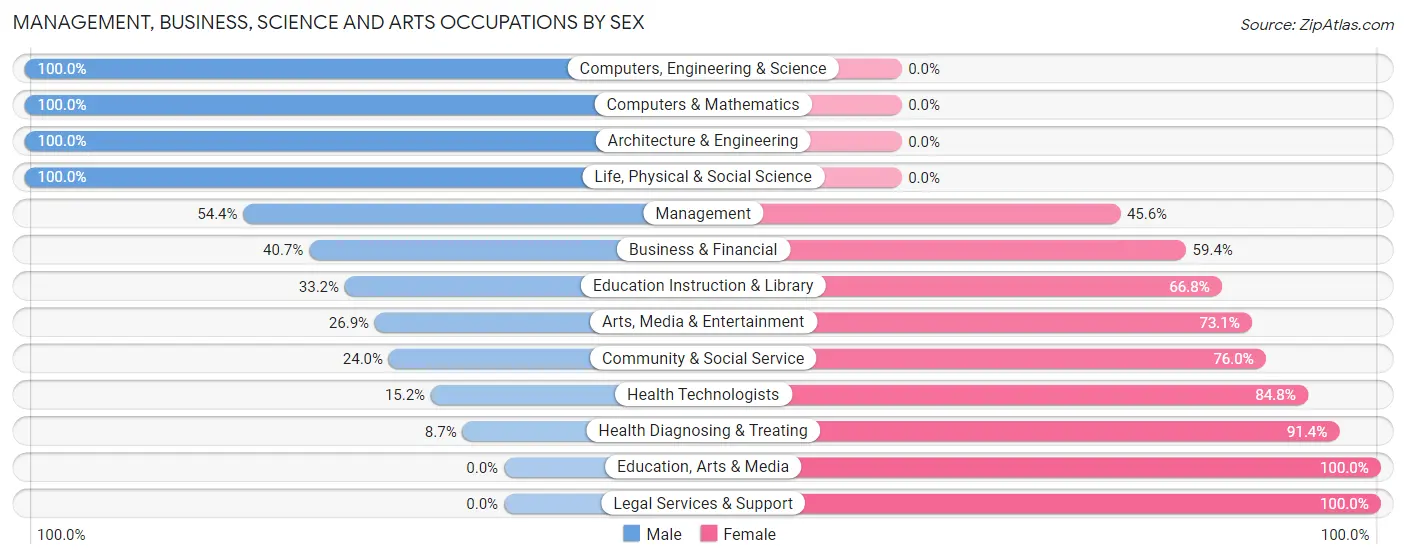
Management, Business, Science and Arts Occupations by Sex
Within the Management, Business, Science and Arts occupations in Shasta Lake, the most male-oriented occupations are Computers, Engineering & Science (100.0%), Computers & Mathematics (100.0%), and Architecture & Engineering (100.0%), while the most female-oriented occupations are Education, Arts & Media (100.0%), Legal Services & Support (100.0%), and Health Diagnosing & Treating (91.3%).
| Occupation | Male | Female |
| Management | 237 (54.4%) | 199 (45.6%) |
| Business & Financial | 50 (40.6%) | 73 (59.4%) |
| Computers, Engineering & Science | 161 (100.0%) | 0 (0.0%) |
| Computers & Mathematics | 79 (100.0%) | 0 (0.0%) |
| Architecture & Engineering | 77 (100.0%) | 0 (0.0%) |
| Life, Physical & Social Science | 5 (100.0%) | 0 (0.0%) |
| Community & Social Service | 91 (24.0%) | 288 (76.0%) |
| Education, Arts & Media | 0 (0.0%) | 45 (100.0%) |
| Legal Services & Support | 0 (0.0%) | 50 (100.0%) |
| Education Instruction & Library | 77 (33.2%) | 155 (66.8%) |
| Arts, Media & Entertainment | 14 (26.9%) | 38 (73.1%) |
| Health Diagnosing & Treating | 23 (8.6%) | 243 (91.3%) |
| Health Technologists | 23 (15.2%) | 128 (84.8%) |
| Total (Category) | 562 (41.2%) | 803 (58.8%) |
| Total (Overall) | 2,096 (50.6%) | 2,043 (49.4%) |
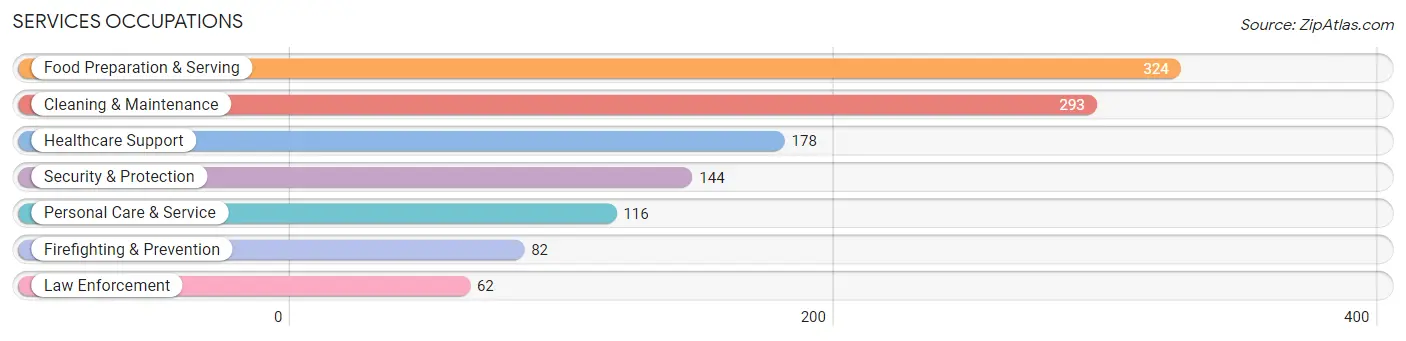
Services Occupations
The most common Services occupations in Shasta Lake are Food Preparation & Serving (324 | 7.8%), Cleaning & Maintenance (293 | 7.1%), Healthcare Support (178 | 4.3%), Security & Protection (144 | 3.5%), and Personal Care & Service (116 | 2.8%).
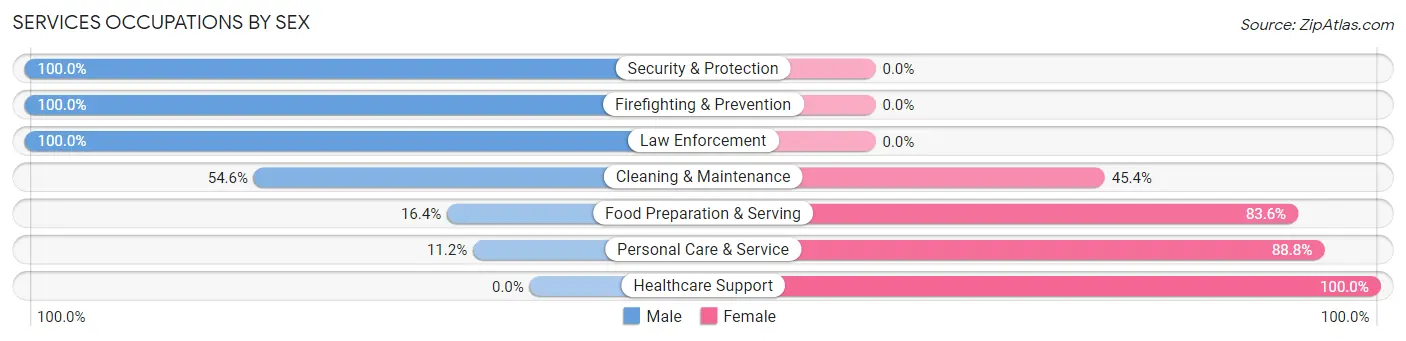
Services Occupations by Sex
Within the Services occupations in Shasta Lake, the most male-oriented occupations are Security & Protection (100.0%), Firefighting & Prevention (100.0%), and Law Enforcement (100.0%), while the most female-oriented occupations are Healthcare Support (100.0%), Personal Care & Service (88.8%), and Food Preparation & Serving (83.6%).
| Occupation | Male | Female |
| Healthcare Support | 0 (0.0%) | 178 (100.0%) |
| Security & Protection | 144 (100.0%) | 0 (0.0%) |
| Firefighting & Prevention | 82 (100.0%) | 0 (0.0%) |
| Law Enforcement | 62 (100.0%) | 0 (0.0%) |
| Food Preparation & Serving | 53 (16.4%) | 271 (83.6%) |
| Cleaning & Maintenance | 160 (54.6%) | 133 (45.4%) |
| Personal Care & Service | 13 (11.2%) | 103 (88.8%) |
| Total (Category) | 370 (35.1%) | 685 (64.9%) |
| Total (Overall) | 2,096 (50.6%) | 2,043 (49.4%) |
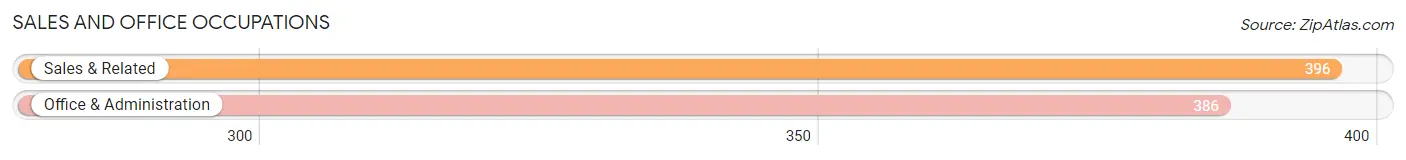
Sales and Office Occupations
The most common Sales and Office occupations in Shasta Lake are Sales & Related (396 | 9.6%), and Office & Administration (386 | 9.3%).
Sales and Office Occupations by Sex
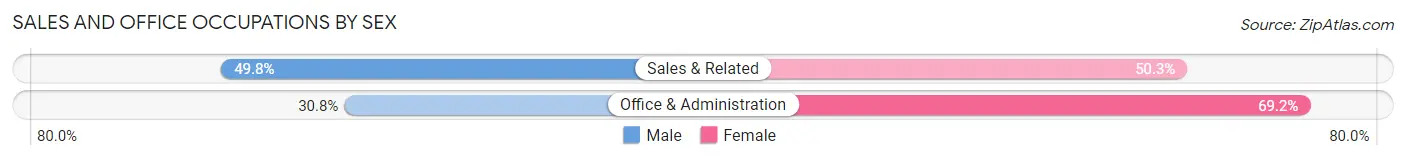
| Occupation | Male | Female |
| Sales & Related | 197 (49.7%) | 199 (50.2%) |
| Office & Administration | 119 (30.8%) | 267 (69.2%) |
| Total (Category) | 316 (40.4%) | 466 (59.6%) |
| Total (Overall) | 2,096 (50.6%) | 2,043 (49.4%) |
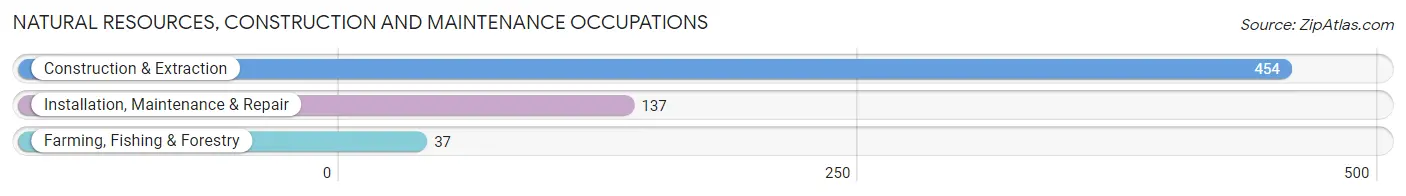
Natural Resources, Construction and Maintenance Occupations
The most common Natural Resources, Construction and Maintenance occupations in Shasta Lake are Construction & Extraction (454 | 11.0%), Installation, Maintenance & Repair (137 | 3.3%), and Farming, Fishing & Forestry (37 | 0.9%).
Natural Resources, Construction and Maintenance Occupations by Sex
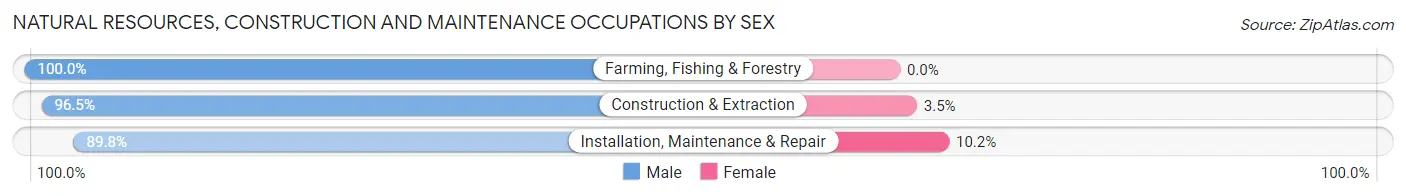
| Occupation | Male | Female |
| Farming, Fishing & Forestry | 37 (100.0%) | 0 (0.0%) |
| Construction & Extraction | 438 (96.5%) | 16 (3.5%) |
| Installation, Maintenance & Repair | 123 (89.8%) | 14 (10.2%) |
| Total (Category) | 598 (95.2%) | 30 (4.8%) |
| Total (Overall) | 2,096 (50.6%) | 2,043 (49.4%) |
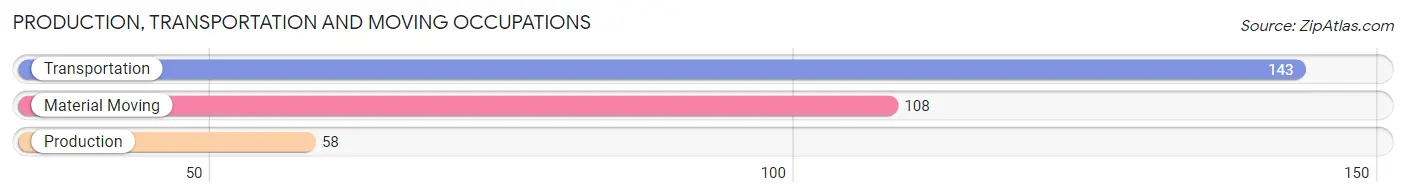
Production, Transportation and Moving Occupations
The most common Production, Transportation and Moving occupations in Shasta Lake are Transportation (143 | 3.5%), Material Moving (108 | 2.6%), and Production (58 | 1.4%).
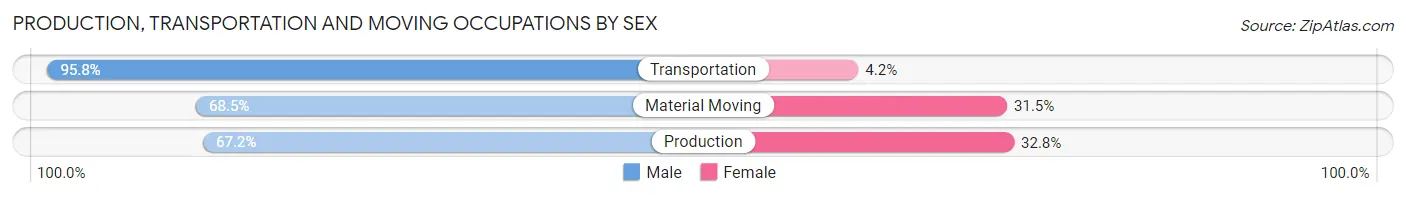
Production, Transportation and Moving Occupations by Sex
| Occupation | Male | Female |
| Production | 39 (67.2%) | 19 (32.8%) |
| Transportation | 137 (95.8%) | 6 (4.2%) |
| Material Moving | 74 (68.5%) | 34 (31.5%) |
| Total (Category) | 250 (80.9%) | 59 (19.1%) |
| Total (Overall) | 2,096 (50.6%) | 2,043 (49.4%) |
Employment Industries by Sex in Shasta Lake
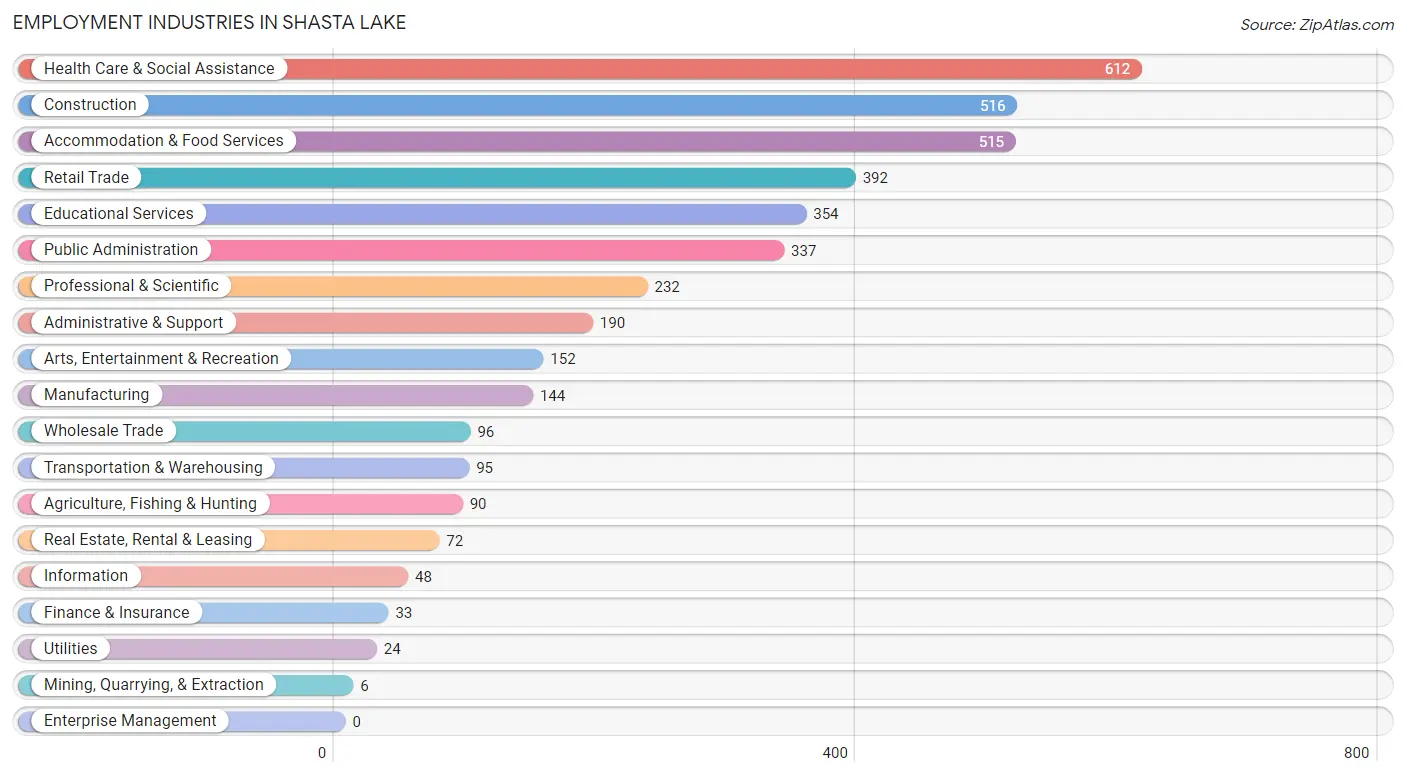
Employment Industries in Shasta Lake
The major employment industries in Shasta Lake include Health Care & Social Assistance (612 | 14.8%), Construction (516 | 12.5%), Accommodation & Food Services (515 | 12.4%), Retail Trade (392 | 9.5%), and Educational Services (354 | 8.6%).
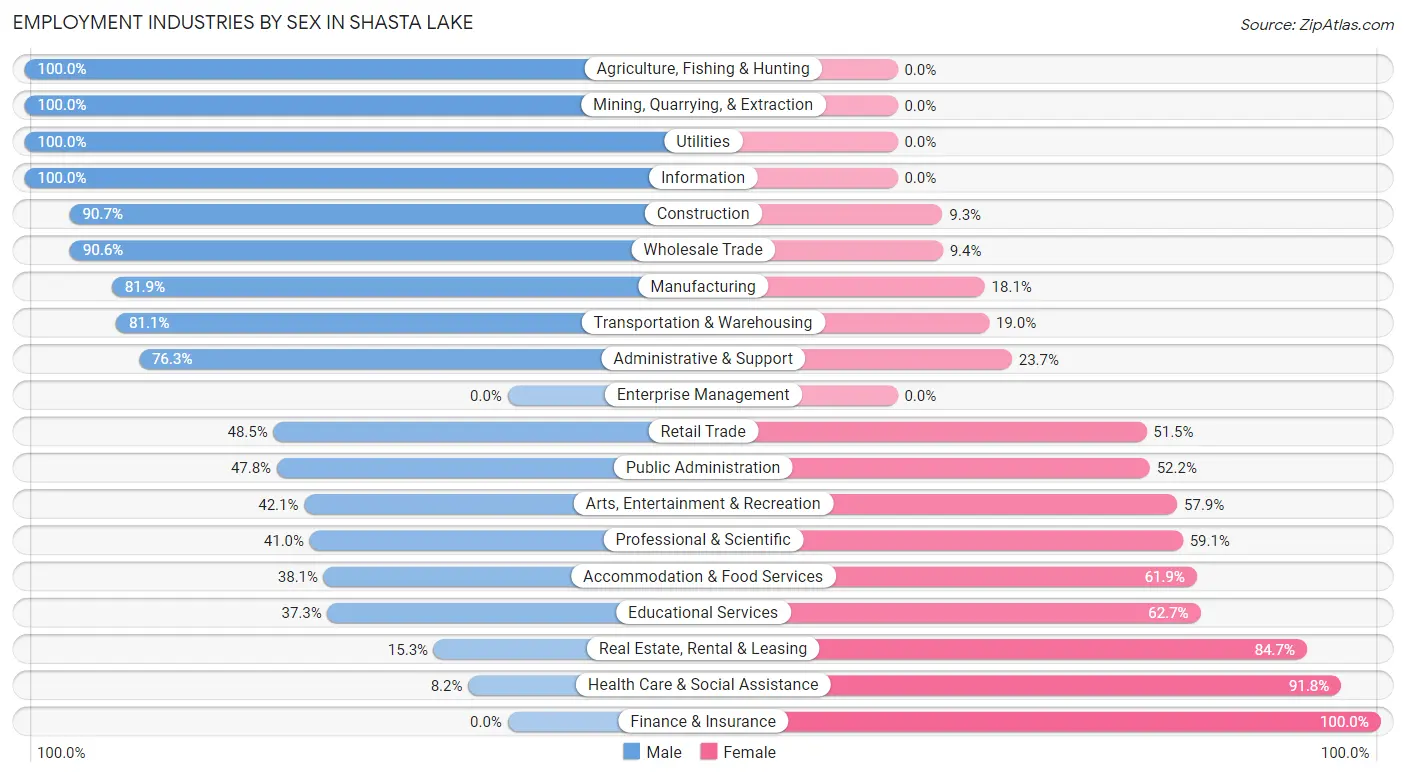
Employment Industries by Sex in Shasta Lake
The Shasta Lake industries that see more men than women are Agriculture, Fishing & Hunting (100.0%), Mining, Quarrying, & Extraction (100.0%), and Utilities (100.0%), whereas the industries that tend to have a higher number of women are Finance & Insurance (100.0%), Health Care & Social Assistance (91.8%), and Real Estate, Rental & Leasing (84.7%).
| Industry | Male | Female |
| Agriculture, Fishing & Hunting | 90 (100.0%) | 0 (0.0%) |
| Mining, Quarrying, & Extraction | 6 (100.0%) | 0 (0.0%) |
| Construction | 468 (90.7%) | 48 (9.3%) |
| Manufacturing | 118 (81.9%) | 26 (18.1%) |
| Wholesale Trade | 87 (90.6%) | 9 (9.4%) |
| Retail Trade | 190 (48.5%) | 202 (51.5%) |
| Transportation & Warehousing | 77 (81.0%) | 18 (19.0%) |
| Utilities | 24 (100.0%) | 0 (0.0%) |
| Information | 48 (100.0%) | 0 (0.0%) |
| Finance & Insurance | 0 (0.0%) | 33 (100.0%) |
| Real Estate, Rental & Leasing | 11 (15.3%) | 61 (84.7%) |
| Professional & Scientific | 95 (40.9%) | 137 (59.1%) |
| Enterprise Management | 0 (0.0%) | 0 (0.0%) |
| Administrative & Support | 145 (76.3%) | 45 (23.7%) |
| Educational Services | 132 (37.3%) | 222 (62.7%) |
| Health Care & Social Assistance | 50 (8.2%) | 562 (91.8%) |
| Arts, Entertainment & Recreation | 64 (42.1%) | 88 (57.9%) |
| Accommodation & Food Services | 196 (38.1%) | 319 (61.9%) |
| Public Administration | 161 (47.8%) | 176 (52.2%) |
| Total | 2,096 (50.6%) | 2,043 (49.4%) |
Education in Shasta Lake
School Enrollment in Shasta Lake
The most common levels of schooling among the 2,760 students in Shasta Lake are high school (677 | 24.5%), college / undergraduate (611 | 22.1%), and elementary school (610 | 22.1%).
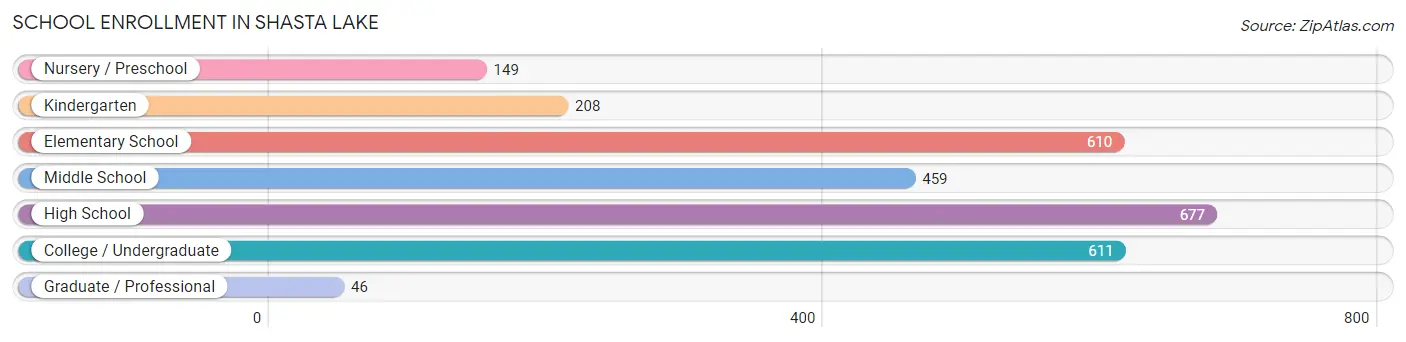
| School Level | # Students | % Students |
| Nursery / Preschool | 149 | 5.4% |
| Kindergarten | 208 | 7.5% |
| Elementary School | 610 | 22.1% |
| Middle School | 459 | 16.6% |
| High School | 677 | 24.5% |
| College / Undergraduate | 611 | 22.1% |
| Graduate / Professional | 46 | 1.7% |
| Total | 2,760 | 100.0% |
School Enrollment by Age by Funding Source in Shasta Lake
Out of a total of 2,760 students who are enrolled in schools in Shasta Lake, 312 (11.3%) attend a private institution, while the remaining 2,448 (88.7%) are enrolled in public schools. The age group of 3 to 4 year olds has the highest likelihood of being enrolled in private schools, with 66 (38.4% in the age bracket) enrolled. Conversely, the age group of 15 to 17 year olds has the lowest likelihood of being enrolled in a private school, with 549 (99.1% in the age bracket) attending a public institution.
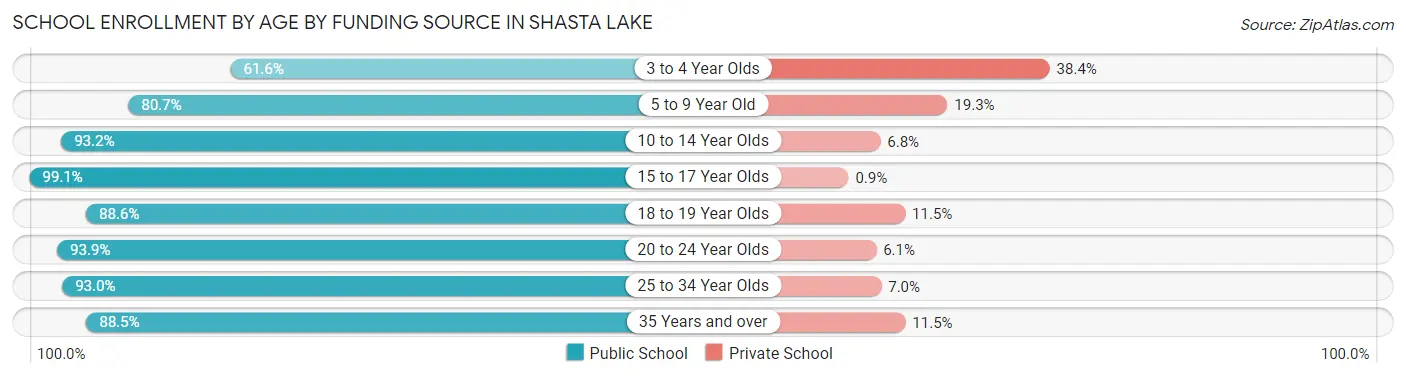
| Age Bracket | Public School | Private School |
| 3 to 4 Year Olds | 106 (61.6%) | 66 (38.4%) |
| 5 to 9 Year Old | 568 (80.7%) | 136 (19.3%) |
| 10 to 14 Year Olds | 600 (93.2%) | 44 (6.8%) |
| 15 to 17 Year Olds | 549 (99.1%) | 5 (0.9%) |
| 18 to 19 Year Olds | 116 (88.5%) | 15 (11.5%) |
| 20 to 24 Year Olds | 186 (93.9%) | 12 (6.1%) |
| 25 to 34 Year Olds | 146 (93.0%) | 11 (7.0%) |
| 35 Years and over | 177 (88.5%) | 23 (11.5%) |
| Total | 2,448 (88.7%) | 312 (11.3%) |
Educational Attainment by Field of Study in Shasta Lake
Business (261 | 25.1%), arts & humanities (141 | 13.6%), science & technology (130 | 12.5%), social sciences (122 | 11.7%), and liberal arts & history (118 | 11.4%) are the most common fields of study among 1,038 individuals in Shasta Lake who have obtained a bachelor's degree or higher.
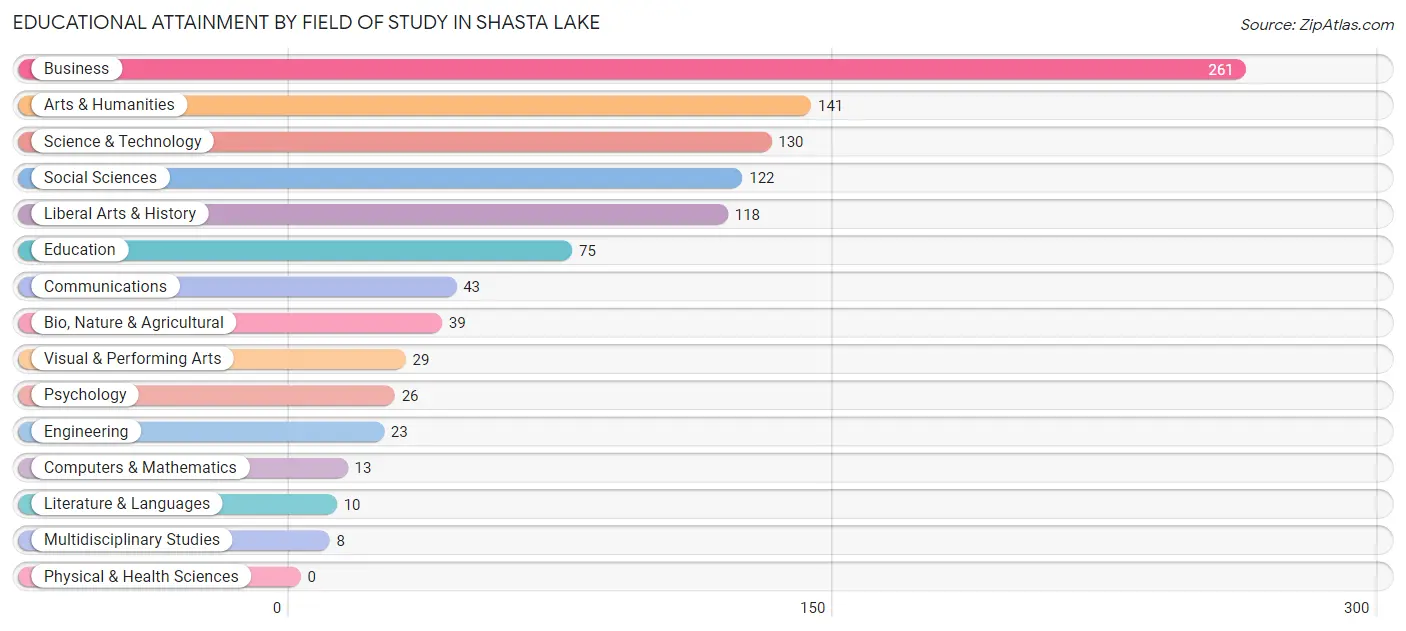
| Field of Study | # Graduates | % Graduates |
| Computers & Mathematics | 13 | 1.3% |
| Bio, Nature & Agricultural | 39 | 3.8% |
| Physical & Health Sciences | 0 | 0.0% |
| Psychology | 26 | 2.5% |
| Social Sciences | 122 | 11.7% |
| Engineering | 23 | 2.2% |
| Multidisciplinary Studies | 8 | 0.8% |
| Science & Technology | 130 | 12.5% |
| Business | 261 | 25.1% |
| Education | 75 | 7.2% |
| Literature & Languages | 10 | 1.0% |
| Liberal Arts & History | 118 | 11.4% |
| Visual & Performing Arts | 29 | 2.8% |
| Communications | 43 | 4.1% |
| Arts & Humanities | 141 | 13.6% |
| Total | 1,038 | 100.0% |
Transportation & Commute in Shasta Lake
Vehicle Availability by Sex in Shasta Lake
The most prevalent vehicle ownership categories in Shasta Lake are males with 2 vehicles (973, accounting for 47.8%) and females with 2 vehicles (658, making up 47.9%).
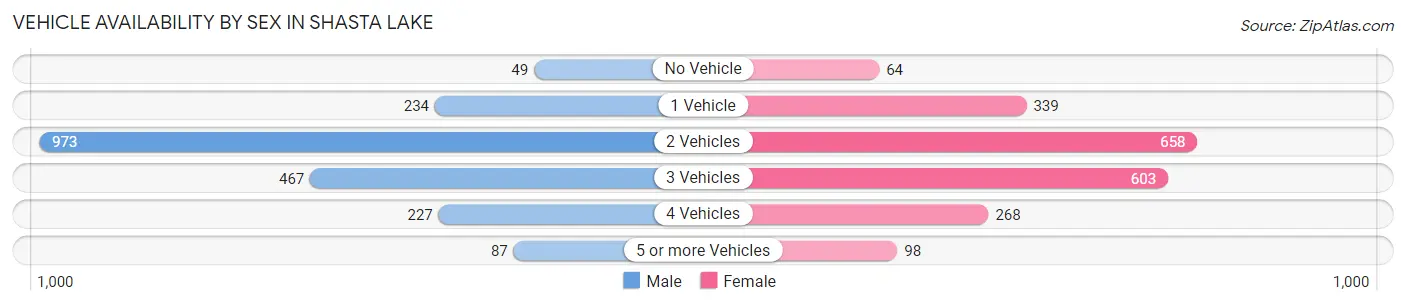
| Vehicles Available | Male | Female |
| No Vehicle | 49 (2.4%) | 64 (3.2%) |
| 1 Vehicle | 234 (11.5%) | 339 (16.7%) |
| 2 Vehicles | 973 (47.8%) | 658 (32.4%) |
| 3 Vehicles | 467 (22.9%) | 603 (29.7%) |
| 4 Vehicles | 227 (11.1%) | 268 (13.2%) |
| 5 or more Vehicles | 87 (4.3%) | 98 (4.8%) |
| Total | 2,037 (100.0%) | 2,030 (100.0%) |
Commute Time in Shasta Lake
The most frequently occuring commute durations in Shasta Lake are 15 to 19 minutes (1,230 commuters, 31.3%), 10 to 14 minutes (865 commuters, 22.0%), and 20 to 24 minutes (589 commuters, 15.0%).
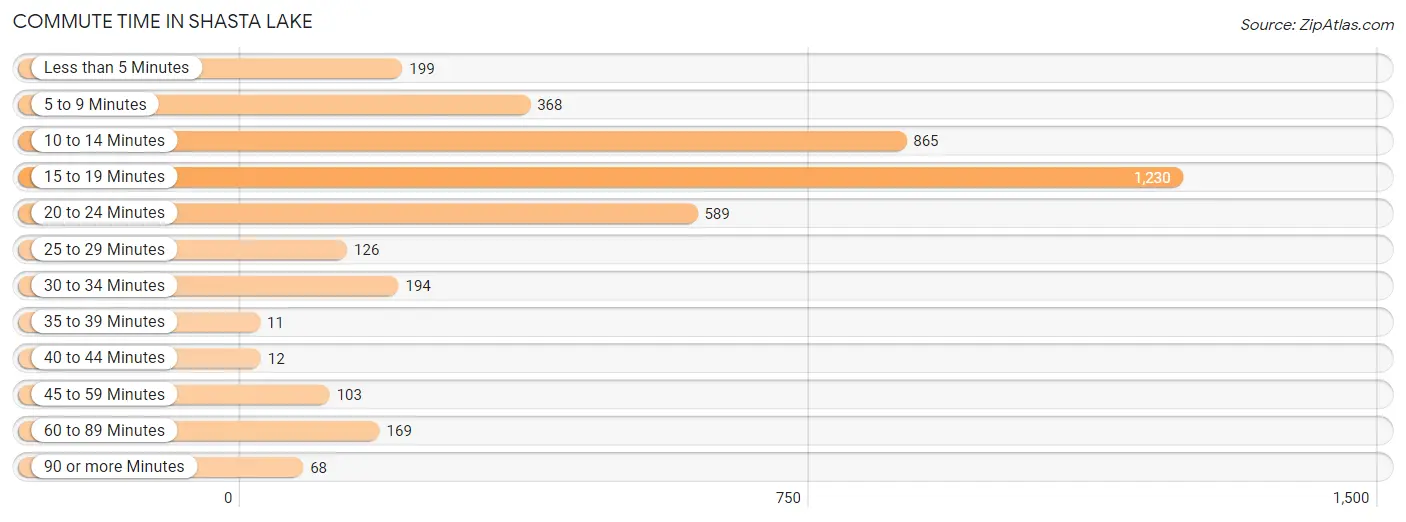
| Commute Time | # Commuters | % Commuters |
| Less than 5 Minutes | 199 | 5.1% |
| 5 to 9 Minutes | 368 | 9.3% |
| 10 to 14 Minutes | 865 | 22.0% |
| 15 to 19 Minutes | 1,230 | 31.3% |
| 20 to 24 Minutes | 589 | 15.0% |
| 25 to 29 Minutes | 126 | 3.2% |
| 30 to 34 Minutes | 194 | 4.9% |
| 35 to 39 Minutes | 11 | 0.3% |
| 40 to 44 Minutes | 12 | 0.3% |
| 45 to 59 Minutes | 103 | 2.6% |
| 60 to 89 Minutes | 169 | 4.3% |
| 90 or more Minutes | 68 | 1.7% |
Commute Time by Sex in Shasta Lake
The most common commute times in Shasta Lake are 10 to 14 minutes (574 commuters, 28.8%) for males and 15 to 19 minutes (831 commuters, 42.8%) for females.
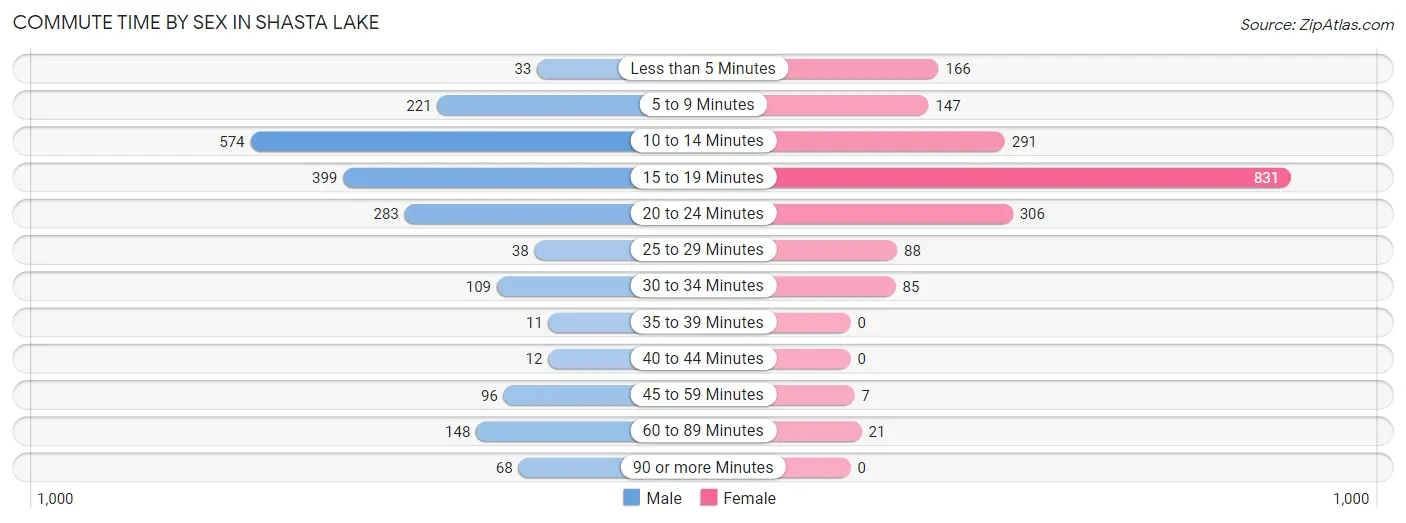
| Commute Time | Male | Female |
| Less than 5 Minutes | 33 (1.7%) | 166 (8.6%) |
| 5 to 9 Minutes | 221 (11.1%) | 147 (7.6%) |
| 10 to 14 Minutes | 574 (28.8%) | 291 (15.0%) |
| 15 to 19 Minutes | 399 (20.0%) | 831 (42.8%) |
| 20 to 24 Minutes | 283 (14.2%) | 306 (15.8%) |
| 25 to 29 Minutes | 38 (1.9%) | 88 (4.5%) |
| 30 to 34 Minutes | 109 (5.5%) | 85 (4.4%) |
| 35 to 39 Minutes | 11 (0.5%) | 0 (0.0%) |
| 40 to 44 Minutes | 12 (0.6%) | 0 (0.0%) |
| 45 to 59 Minutes | 96 (4.8%) | 7 (0.4%) |
| 60 to 89 Minutes | 148 (7.4%) | 21 (1.1%) |
| 90 or more Minutes | 68 (3.4%) | 0 (0.0%) |
Time of Departure to Work by Sex in Shasta Lake
The most frequent times of departure to work in Shasta Lake are 7:00 AM to 7:29 AM (331, 16.6%) for males and 7:30 AM to 7:59 AM (389, 20.0%) for females.
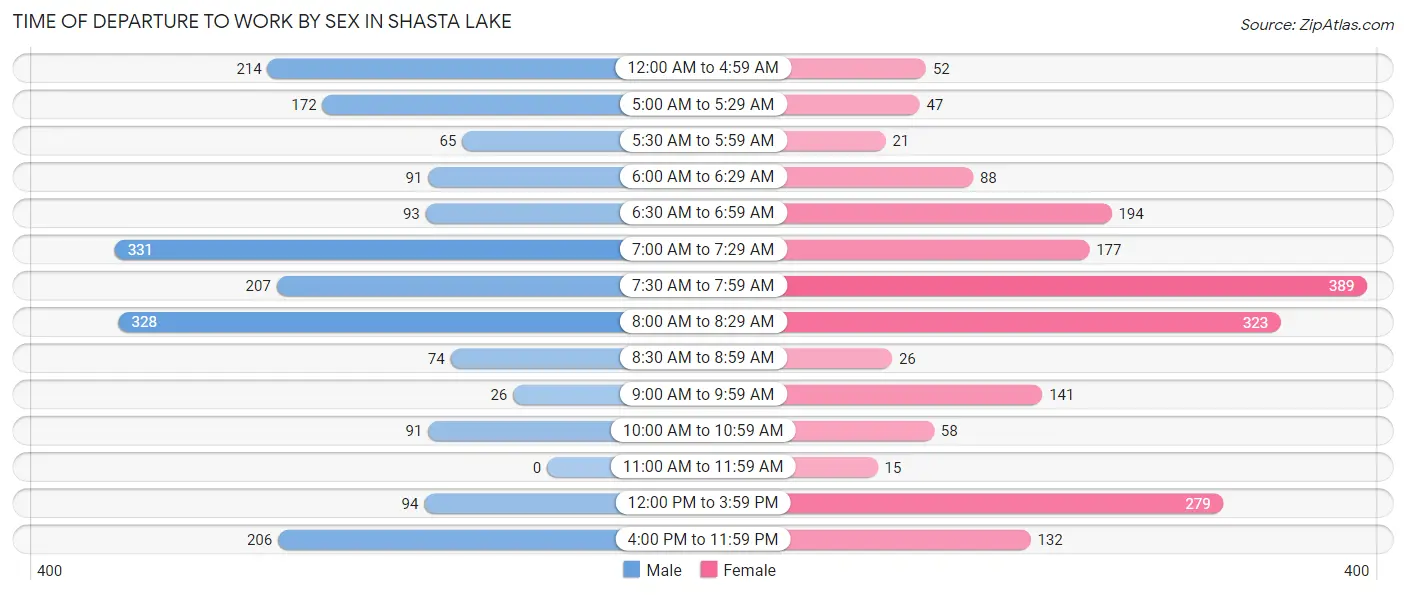
| Time of Departure | Male | Female |
| 12:00 AM to 4:59 AM | 214 (10.7%) | 52 (2.7%) |
| 5:00 AM to 5:29 AM | 172 (8.6%) | 47 (2.4%) |
| 5:30 AM to 5:59 AM | 65 (3.3%) | 21 (1.1%) |
| 6:00 AM to 6:29 AM | 91 (4.6%) | 88 (4.5%) |
| 6:30 AM to 6:59 AM | 93 (4.7%) | 194 (10.0%) |
| 7:00 AM to 7:29 AM | 331 (16.6%) | 177 (9.1%) |
| 7:30 AM to 7:59 AM | 207 (10.4%) | 389 (20.0%) |
| 8:00 AM to 8:29 AM | 328 (16.5%) | 323 (16.6%) |
| 8:30 AM to 8:59 AM | 74 (3.7%) | 26 (1.3%) |
| 9:00 AM to 9:59 AM | 26 (1.3%) | 141 (7.3%) |
| 10:00 AM to 10:59 AM | 91 (4.6%) | 58 (3.0%) |
| 11:00 AM to 11:59 AM | 0 (0.0%) | 15 (0.8%) |
| 12:00 PM to 3:59 PM | 94 (4.7%) | 279 (14.4%) |
| 4:00 PM to 11:59 PM | 206 (10.3%) | 132 (6.8%) |
| Total | 1,992 (100.0%) | 1,942 (100.0%) |
Housing Occupancy in Shasta Lake
Occupancy by Ownership in Shasta Lake
Of the total 3,908 dwellings in Shasta Lake, owner-occupied units account for 2,410 (61.7%), while renter-occupied units make up 1,498 (38.3%).
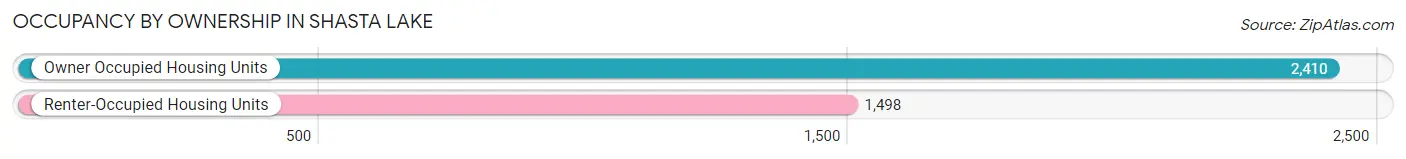
| Occupancy | # Housing Units | % Housing Units |
| Owner Occupied Housing Units | 2,410 | 61.7% |
| Renter-Occupied Housing Units | 1,498 | 38.3% |
| Total Occupied Housing Units | 3,908 | 100.0% |
Occupancy by Household Size in Shasta Lake
| Household Size | # Housing Units | % Housing Units |
| 1-Person Household | 910 | 23.3% |
| 2-Person Household | 1,340 | 34.3% |
| 3-Person Household | 791 | 20.2% |
| 4+ Person Household | 867 | 22.2% |
| Total Housing Units | 3,908 | 100.0% |
Occupancy by Ownership by Household Size in Shasta Lake
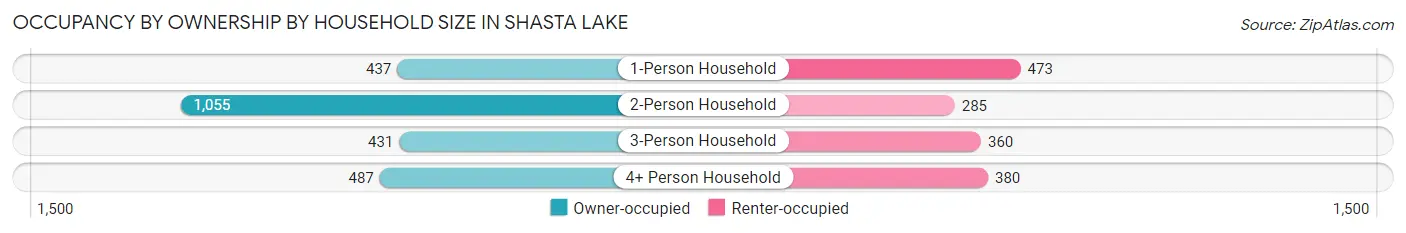
| Household Size | Owner-occupied | Renter-occupied |
| 1-Person Household | 437 (48.0%) | 473 (52.0%) |
| 2-Person Household | 1,055 (78.7%) | 285 (21.3%) |
| 3-Person Household | 431 (54.5%) | 360 (45.5%) |
| 4+ Person Household | 487 (56.2%) | 380 (43.8%) |
| Total Housing Units | 2,410 (61.7%) | 1,498 (38.3%) |
Occupancy by Educational Attainment in Shasta Lake
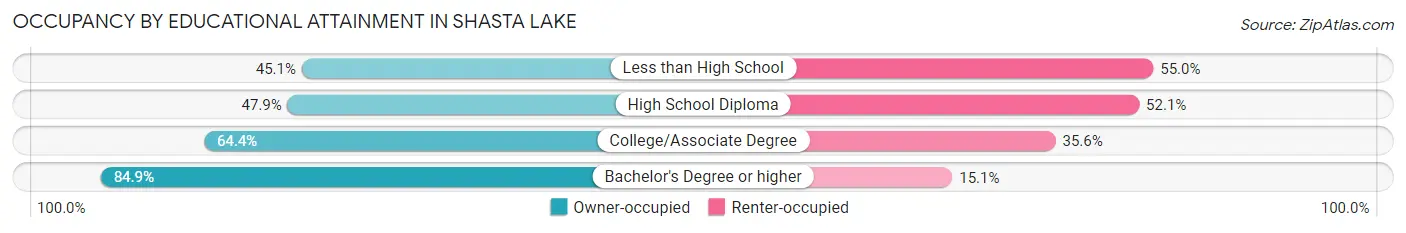
| Household Size | Owner-occupied | Renter-occupied |
| Less than High School | 132 (45.1%) | 161 (54.9%) |
| High School Diploma | 481 (47.9%) | 524 (52.1%) |
| College/Associate Degree | 1,319 (64.4%) | 728 (35.6%) |
| Bachelor's Degree or higher | 478 (84.9%) | 85 (15.1%) |
Occupancy by Age of Householder in Shasta Lake
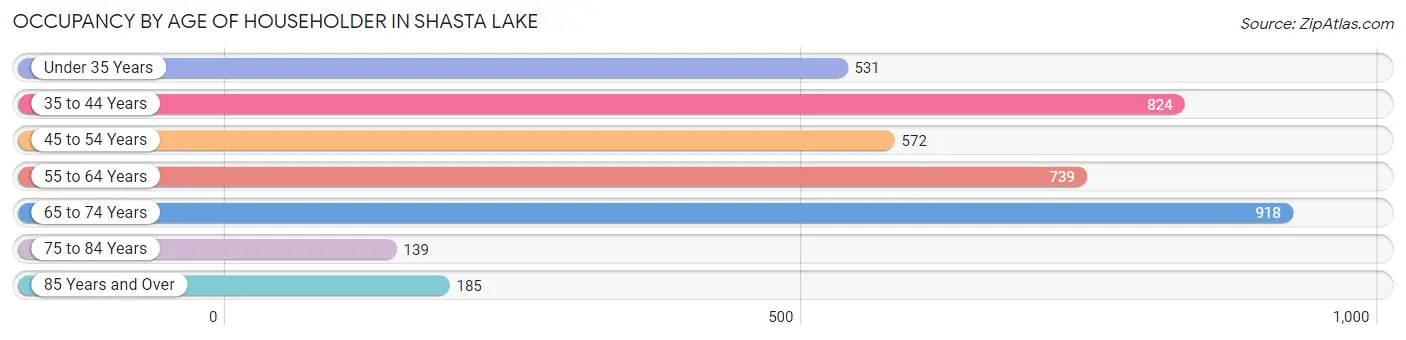
| Age Bracket | # Households | % Households |
| Under 35 Years | 531 | 13.6% |
| 35 to 44 Years | 824 | 21.1% |
| 45 to 54 Years | 572 | 14.6% |
| 55 to 64 Years | 739 | 18.9% |
| 65 to 74 Years | 918 | 23.5% |
| 75 to 84 Years | 139 | 3.6% |
| 85 Years and Over | 185 | 4.7% |
| Total | 3,908 | 100.0% |
Housing Finances in Shasta Lake
Median Income by Occupancy in Shasta Lake
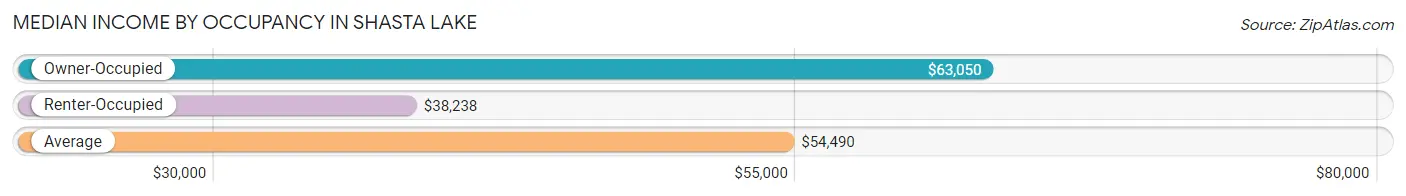
| Occupancy Type | # Households | Median Income |
| Owner-Occupied | 2,410 (61.7%) | $63,050 |
| Renter-Occupied | 1,498 (38.3%) | $38,238 |
| Average | 3,908 (100.0%) | $54,490 |
Occupancy by Householder Income Bracket in Shasta Lake
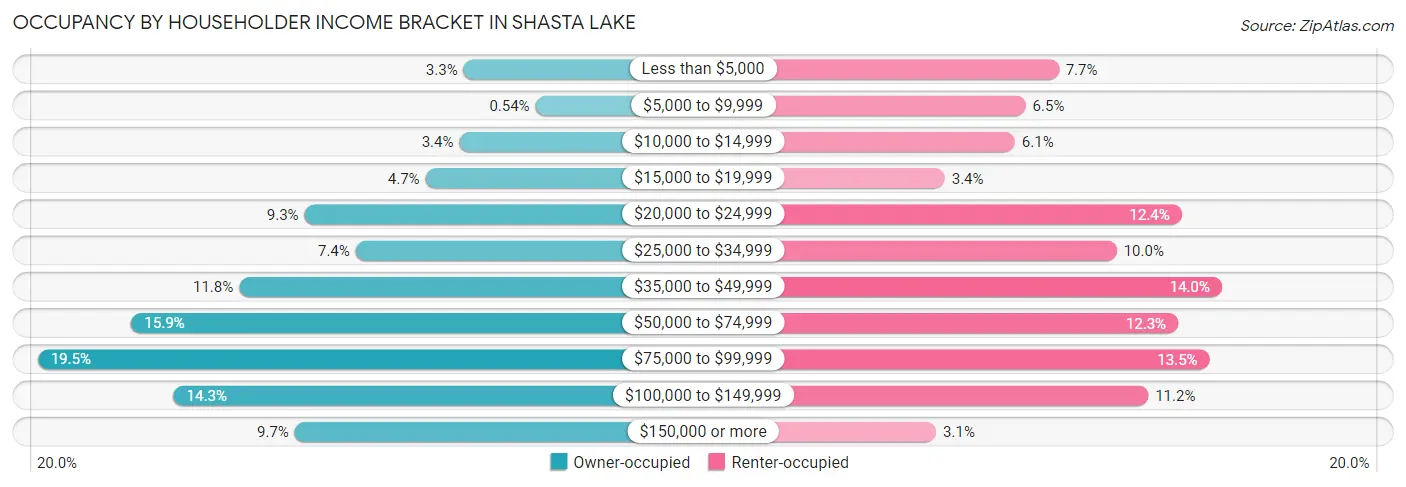
| Income Bracket | Owner-occupied | Renter-occupied |
| Less than $5,000 | 79 (3.3%) | 116 (7.7%) |
| $5,000 to $9,999 | 13 (0.5%) | 97 (6.5%) |
| $10,000 to $14,999 | 83 (3.4%) | 91 (6.1%) |
| $15,000 to $19,999 | 114 (4.7%) | 51 (3.4%) |
| $20,000 to $24,999 | 225 (9.3%) | 186 (12.4%) |
| $25,000 to $34,999 | 178 (7.4%) | 149 (10.0%) |
| $35,000 to $49,999 | 285 (11.8%) | 209 (14.0%) |
| $50,000 to $74,999 | 384 (15.9%) | 184 (12.3%) |
| $75,000 to $99,999 | 470 (19.5%) | 202 (13.5%) |
| $100,000 to $149,999 | 345 (14.3%) | 167 (11.2%) |
| $150,000 or more | 234 (9.7%) | 46 (3.1%) |
| Total | 2,410 (100.0%) | 1,498 (100.0%) |
Monthly Housing Cost Tiers in Shasta Lake
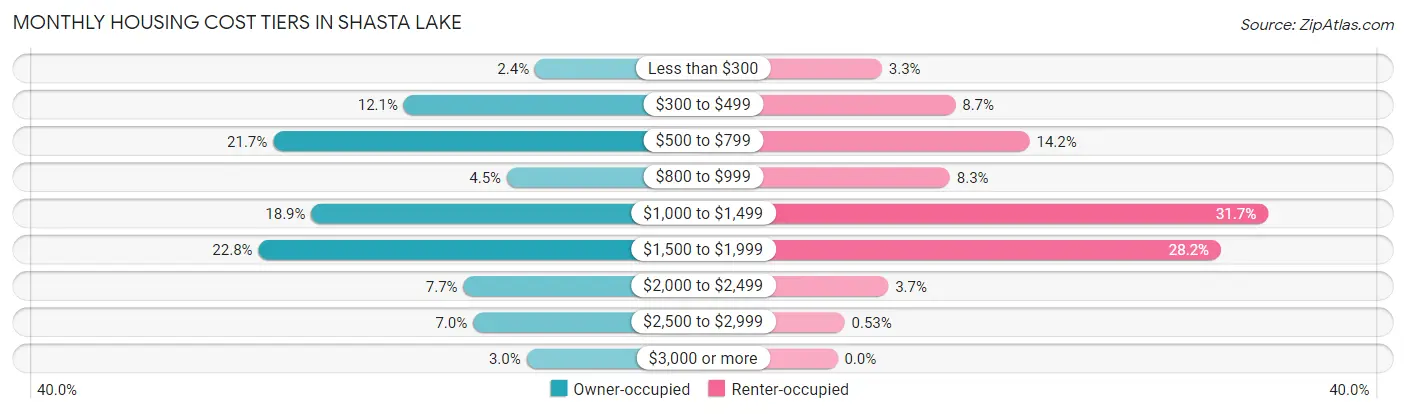
| Monthly Cost | Owner-occupied | Renter-occupied |
| Less than $300 | 58 (2.4%) | 49 (3.3%) |
| $300 to $499 | 291 (12.1%) | 130 (8.7%) |
| $500 to $799 | 523 (21.7%) | 212 (14.1%) |
| $800 to $999 | 108 (4.5%) | 124 (8.3%) |
| $1,000 to $1,499 | 455 (18.9%) | 475 (31.7%) |
| $1,500 to $1,999 | 549 (22.8%) | 423 (28.2%) |
| $2,000 to $2,499 | 185 (7.7%) | 56 (3.7%) |
| $2,500 to $2,999 | 168 (7.0%) | 8 (0.5%) |
| $3,000 or more | 73 (3.0%) | 0 (0.0%) |
| Total | 2,410 (100.0%) | 1,498 (100.0%) |
Physical Housing Characteristics in Shasta Lake
Housing Structures in Shasta Lake
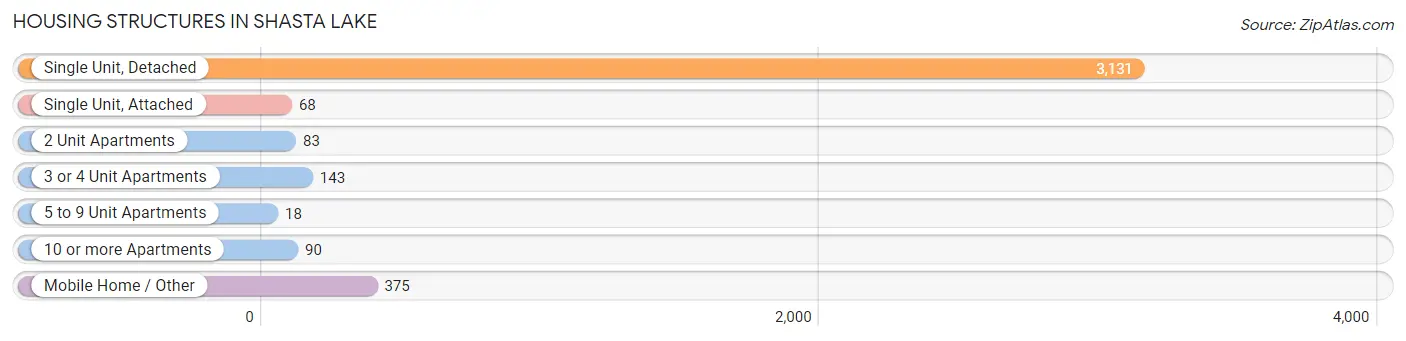
| Structure Type | # Housing Units | % Housing Units |
| Single Unit, Detached | 3,131 | 80.1% |
| Single Unit, Attached | 68 | 1.7% |
| 2 Unit Apartments | 83 | 2.1% |
| 3 or 4 Unit Apartments | 143 | 3.7% |
| 5 to 9 Unit Apartments | 18 | 0.5% |
| 10 or more Apartments | 90 | 2.3% |
| Mobile Home / Other | 375 | 9.6% |
| Total | 3,908 | 100.0% |
Housing Structures by Occupancy in Shasta Lake
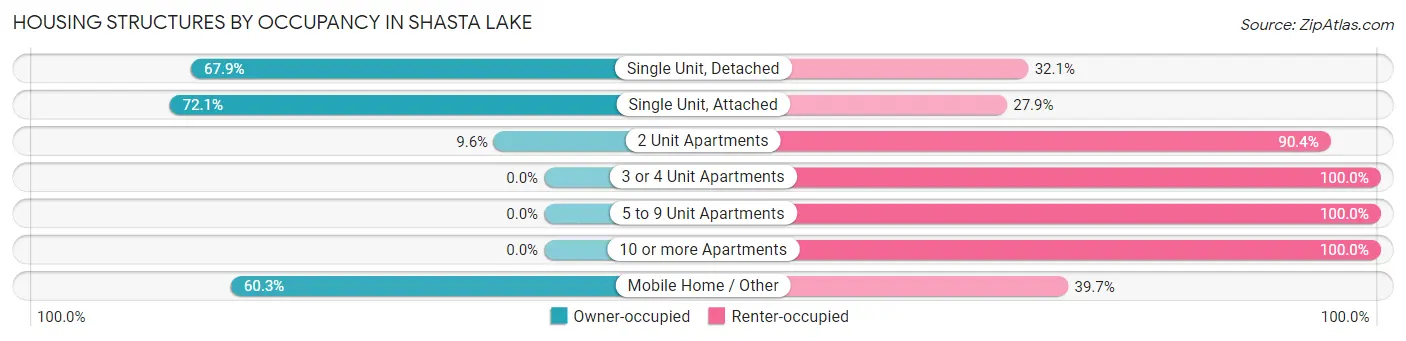
| Structure Type | Owner-occupied | Renter-occupied |
| Single Unit, Detached | 2,127 (67.9%) | 1,004 (32.1%) |
| Single Unit, Attached | 49 (72.1%) | 19 (27.9%) |
| 2 Unit Apartments | 8 (9.6%) | 75 (90.4%) |
| 3 or 4 Unit Apartments | 0 (0.0%) | 143 (100.0%) |
| 5 to 9 Unit Apartments | 0 (0.0%) | 18 (100.0%) |
| 10 or more Apartments | 0 (0.0%) | 90 (100.0%) |
| Mobile Home / Other | 226 (60.3%) | 149 (39.7%) |
| Total | 2,410 (61.7%) | 1,498 (38.3%) |
Housing Structures by Number of Rooms in Shasta Lake
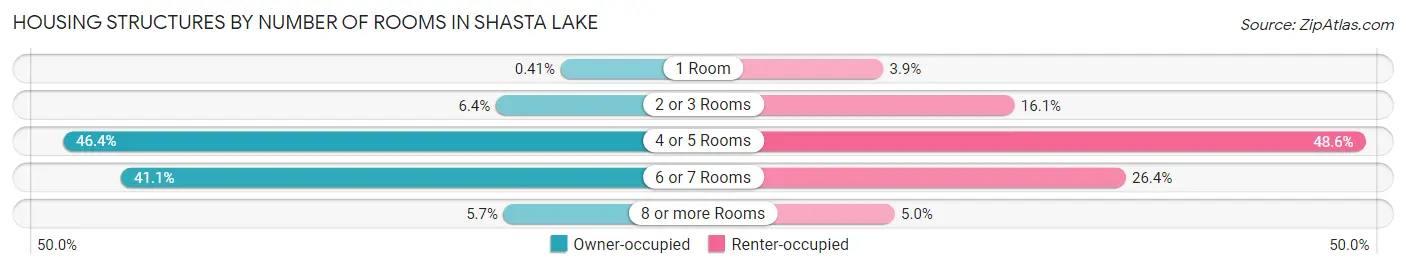
| Number of Rooms | Owner-occupied | Renter-occupied |
| 1 Room | 10 (0.4%) | 59 (3.9%) |
| 2 or 3 Rooms | 154 (6.4%) | 241 (16.1%) |
| 4 or 5 Rooms | 1,119 (46.4%) | 728 (48.6%) |
| 6 or 7 Rooms | 990 (41.1%) | 395 (26.4%) |
| 8 or more Rooms | 137 (5.7%) | 75 (5.0%) |
| Total | 2,410 (100.0%) | 1,498 (100.0%) |
Housing Structure by Heating Type in Shasta Lake
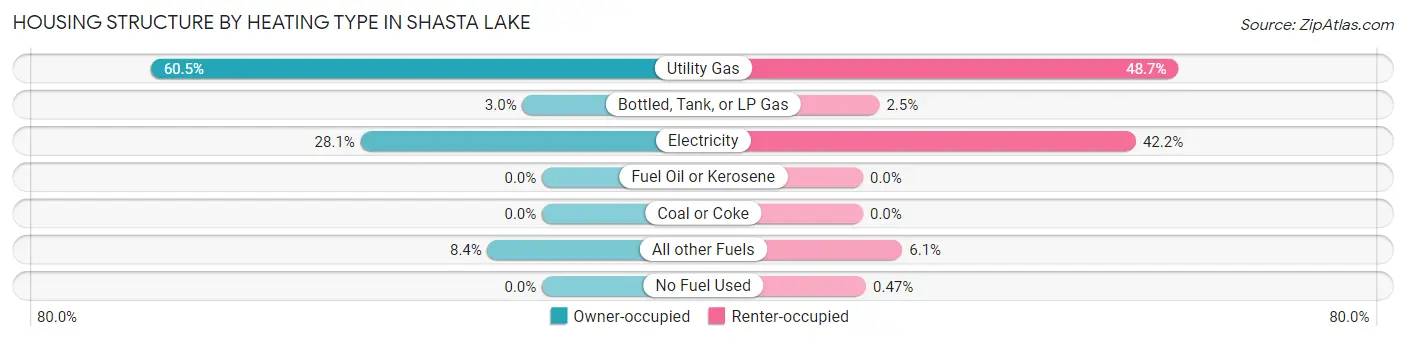
| Heating Type | Owner-occupied | Renter-occupied |
| Utility Gas | 1,458 (60.5%) | 730 (48.7%) |
| Bottled, Tank, or LP Gas | 73 (3.0%) | 38 (2.5%) |
| Electricity | 676 (28.1%) | 632 (42.2%) |
| Fuel Oil or Kerosene | 0 (0.0%) | 0 (0.0%) |
| Coal or Coke | 0 (0.0%) | 0 (0.0%) |
| All other Fuels | 203 (8.4%) | 91 (6.1%) |
| No Fuel Used | 0 (0.0%) | 7 (0.5%) |
| Total | 2,410 (100.0%) | 1,498 (100.0%) |
Household Vehicle Usage in Shasta Lake
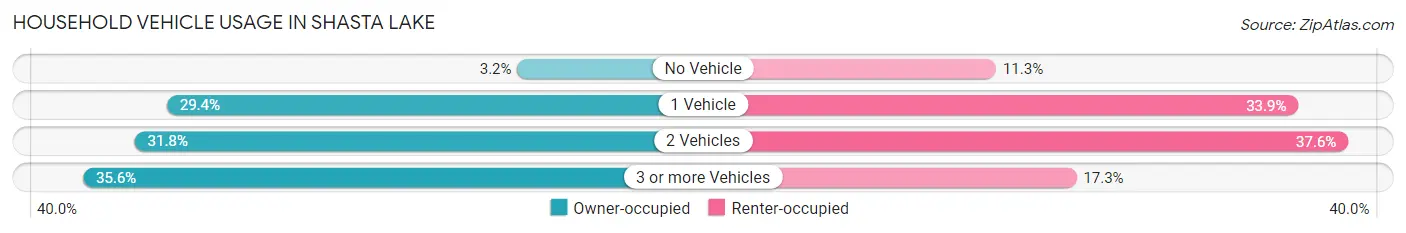
| Vehicles per Household | Owner-occupied | Renter-occupied |
| No Vehicle | 77 (3.2%) | 169 (11.3%) |
| 1 Vehicle | 708 (29.4%) | 507 (33.9%) |
| 2 Vehicles | 766 (31.8%) | 563 (37.6%) |
| 3 or more Vehicles | 859 (35.6%) | 259 (17.3%) |
| Total | 2,410 (100.0%) | 1,498 (100.0%) |
Real Estate & Mortgages in Shasta Lake
Real Estate and Mortgage Overview in Shasta Lake
| Characteristic | Without Mortgage | With Mortgage |
| Housing Units | 833 | 1,577 |
| Median Property Value | $222,000 | $263,500 |
| Median Household Income | $47,431 | $219 |
| Monthly Housing Costs | $553 | $73 |
| Real Estate Taxes | $1,126 | $28 |
Property Value by Mortgage Status in Shasta Lake
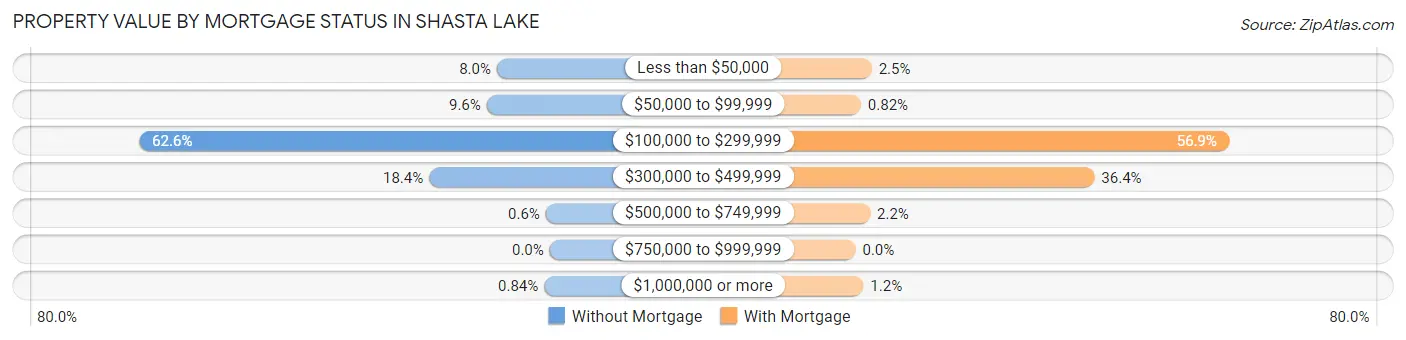
| Property Value | Without Mortgage | With Mortgage |
| Less than $50,000 | 67 (8.0%) | 39 (2.5%) |
| $50,000 to $99,999 | 80 (9.6%) | 13 (0.8%) |
| $100,000 to $299,999 | 521 (62.5%) | 897 (56.9%) |
| $300,000 to $499,999 | 153 (18.4%) | 574 (36.4%) |
| $500,000 to $749,999 | 5 (0.6%) | 35 (2.2%) |
| $750,000 to $999,999 | 0 (0.0%) | 0 (0.0%) |
| $1,000,000 or more | 7 (0.8%) | 19 (1.2%) |
| Total | 833 (100.0%) | 1,577 (100.0%) |
Household Income by Mortgage Status in Shasta Lake
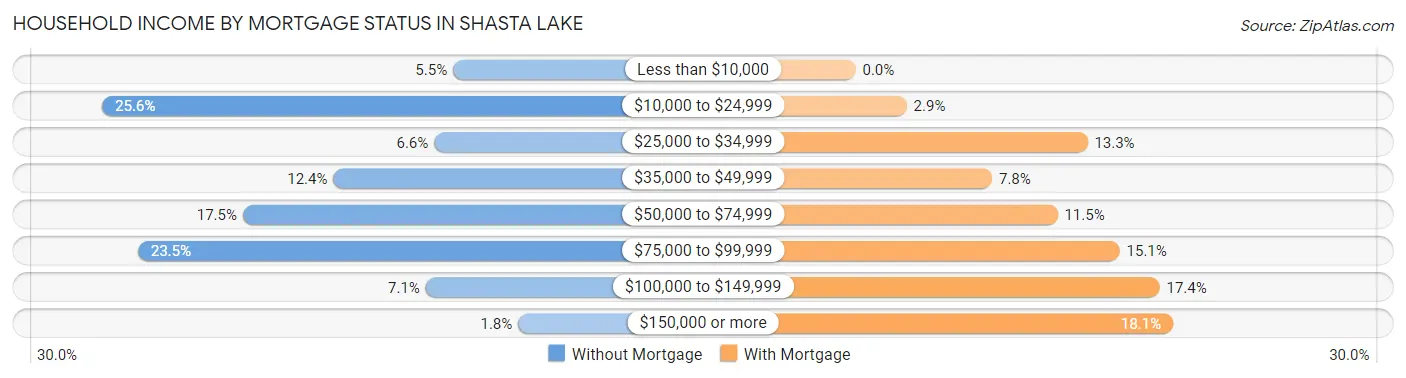
| Household Income | Without Mortgage | With Mortgage |
| Less than $10,000 | 46 (5.5%) | 0 (0.0%) |
| $10,000 to $24,999 | 213 (25.6%) | 46 (2.9%) |
| $25,000 to $34,999 | 55 (6.6%) | 209 (13.3%) |
| $35,000 to $49,999 | 103 (12.4%) | 123 (7.8%) |
| $50,000 to $74,999 | 146 (17.5%) | 182 (11.5%) |
| $75,000 to $99,999 | 196 (23.5%) | 238 (15.1%) |
| $100,000 to $149,999 | 59 (7.1%) | 274 (17.4%) |
| $150,000 or more | 15 (1.8%) | 286 (18.1%) |
| Total | 833 (100.0%) | 1,577 (100.0%) |
Property Value to Household Income Ratio in Shasta Lake
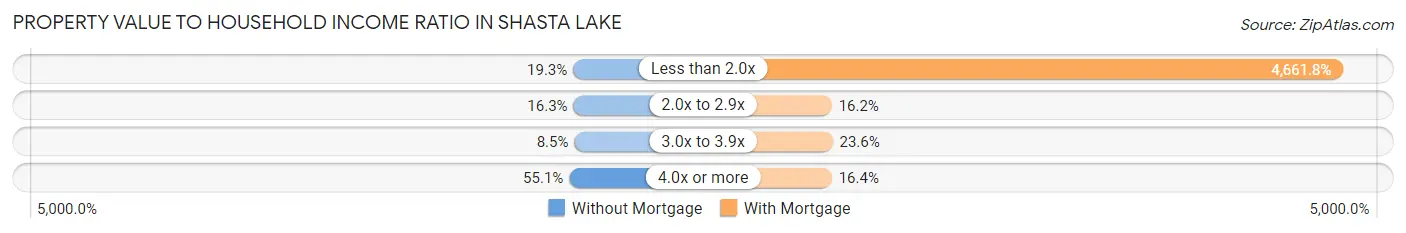
| Value-to-Income Ratio | Without Mortgage | With Mortgage |
| Less than 2.0x | 161 (19.3%) | 73,516 (4,661.8%) |
| 2.0x to 2.9x | 136 (16.3%) | 256 (16.2%) |
| 3.0x to 3.9x | 71 (8.5%) | 372 (23.6%) |
| 4.0x or more | 459 (55.1%) | 259 (16.4%) |
| Total | 833 (100.0%) | 1,577 (100.0%) |
Real Estate Taxes by Mortgage Status in Shasta Lake
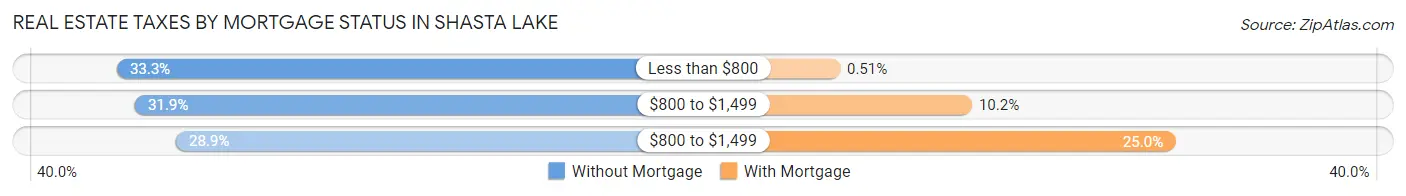
| Property Taxes | Without Mortgage | With Mortgage |
| Less than $800 | 277 (33.3%) | 8 (0.5%) |
| $800 to $1,499 | 266 (31.9%) | 160 (10.2%) |
| $800 to $1,499 | 241 (28.9%) | 394 (25.0%) |
| Total | 833 (100.0%) | 1,577 (100.0%) |
Health & Disability in Shasta Lake
Health Insurance Coverage by Age in Shasta Lake
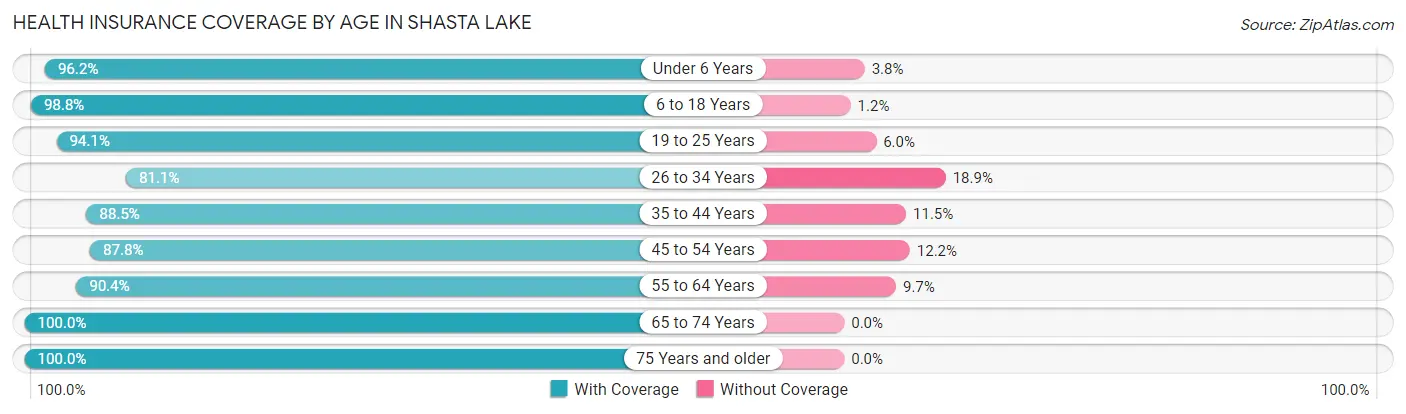
| Age Bracket | With Coverage | Without Coverage |
| Under 6 Years | 631 (96.2%) | 25 (3.8%) |
| 6 to 18 Years | 1,916 (98.8%) | 23 (1.2%) |
| 19 to 25 Years | 1,043 (94.1%) | 66 (5.9%) |
| 26 to 34 Years | 720 (81.1%) | 168 (18.9%) |
| 35 to 44 Years | 1,235 (88.5%) | 161 (11.5%) |
| 45 to 54 Years | 1,019 (87.8%) | 142 (12.2%) |
| 55 to 64 Years | 1,180 (90.3%) | 126 (9.7%) |
| 65 to 74 Years | 1,429 (100.0%) | 0 (0.0%) |
| 75 Years and older | 477 (100.0%) | 0 (0.0%) |
| Total | 9,650 (93.1%) | 711 (6.9%) |
Health Insurance Coverage by Citizenship Status in Shasta Lake
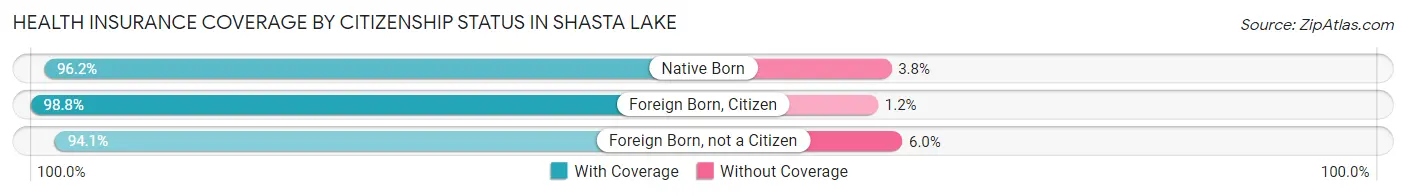
| Citizenship Status | With Coverage | Without Coverage |
| Native Born | 631 (96.2%) | 25 (3.8%) |
| Foreign Born, Citizen | 1,916 (98.8%) | 23 (1.2%) |
| Foreign Born, not a Citizen | 1,043 (94.1%) | 66 (5.9%) |
Health Insurance Coverage by Household Income in Shasta Lake
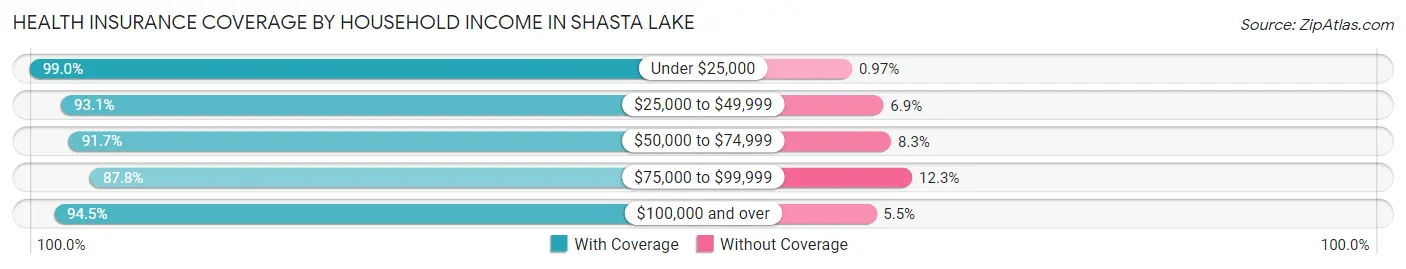
| Household Income | With Coverage | Without Coverage |
| Under $25,000 | 1,943 (99.0%) | 19 (1.0%) |
| $25,000 to $49,999 | 1,792 (93.1%) | 132 (6.9%) |
| $50,000 to $74,999 | 1,403 (91.7%) | 127 (8.3%) |
| $75,000 to $99,999 | 1,998 (87.7%) | 279 (12.2%) |
| $100,000 and over | 2,474 (94.5%) | 145 (5.5%) |
Public vs Private Health Insurance Coverage by Age in Shasta Lake
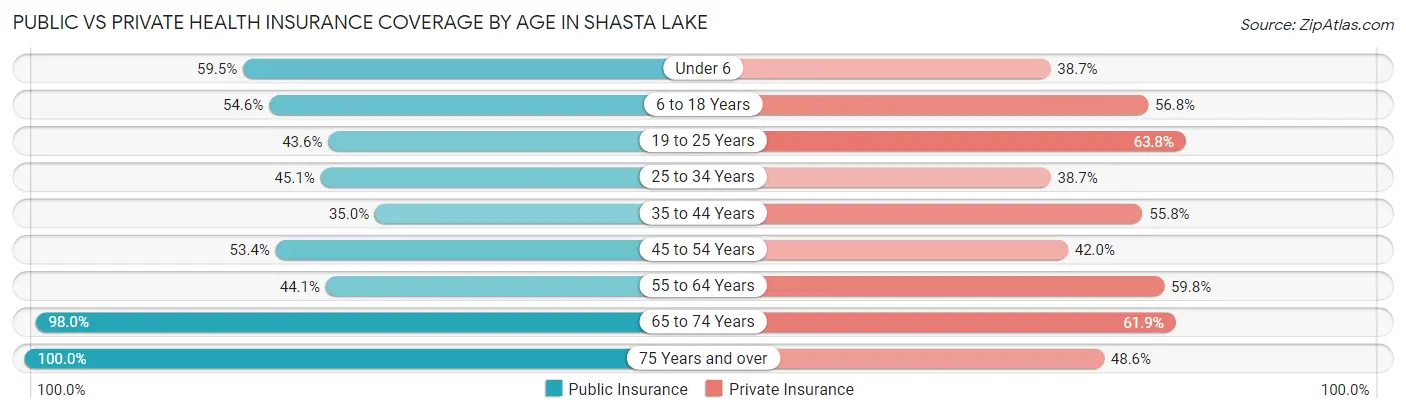
| Age Bracket | Public Insurance | Private Insurance |
| Under 6 | 390 (59.5%) | 254 (38.7%) |
| 6 to 18 Years | 1,059 (54.6%) | 1,102 (56.8%) |
| 19 to 25 Years | 484 (43.6%) | 708 (63.8%) |
| 25 to 34 Years | 400 (45.1%) | 344 (38.7%) |
| 35 to 44 Years | 488 (35.0%) | 779 (55.8%) |
| 45 to 54 Years | 620 (53.4%) | 487 (41.9%) |
| 55 to 64 Years | 576 (44.1%) | 781 (59.8%) |
| 65 to 74 Years | 1,400 (98.0%) | 885 (61.9%) |
| 75 Years and over | 477 (100.0%) | 232 (48.6%) |
| Total | 5,894 (56.9%) | 5,572 (53.8%) |
Disability Status by Sex by Age in Shasta Lake
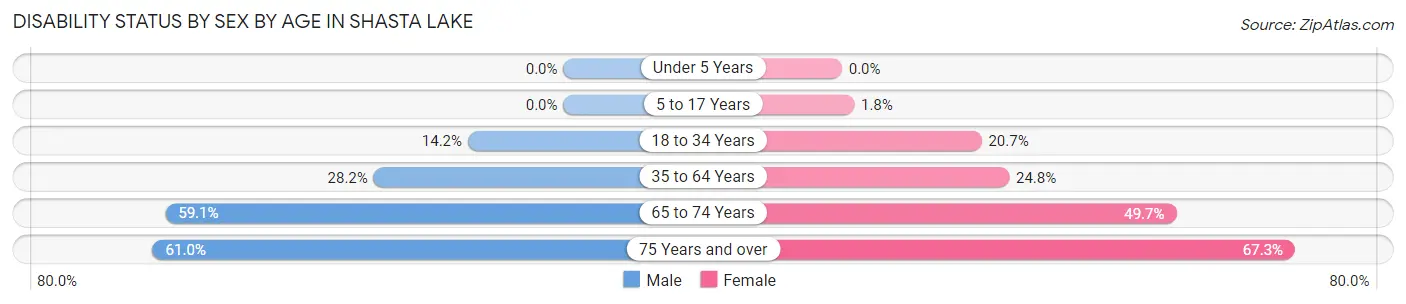
| Age Bracket | Male | Female |
| Under 5 Years | 0 (0.0%) | 0 (0.0%) |
| 5 to 17 Years | 0 (0.0%) | 16 (1.8%) |
| 18 to 34 Years | 168 (14.2%) | 202 (20.7%) |
| 35 to 64 Years | 544 (28.2%) | 480 (24.8%) |
| 65 to 74 Years | 315 (59.1%) | 445 (49.7%) |
| 75 Years and over | 125 (61.0%) | 183 (67.3%) |
Disability Class by Sex by Age in Shasta Lake
Disability Class: Hearing Difficulty
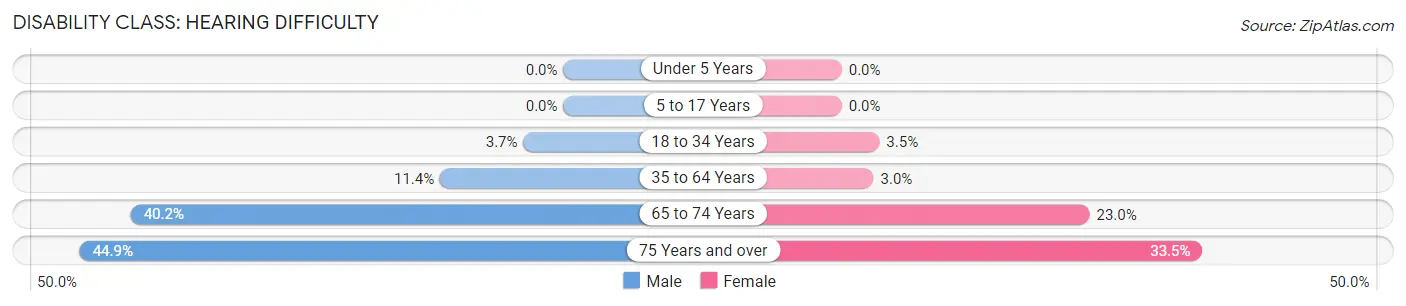
| Age Bracket | Male | Female |
| Under 5 Years | 0 (0.0%) | 0 (0.0%) |
| 5 to 17 Years | 0 (0.0%) | 0 (0.0%) |
| 18 to 34 Years | 44 (3.7%) | 34 (3.5%) |
| 35 to 64 Years | 221 (11.4%) | 57 (2.9%) |
| 65 to 74 Years | 214 (40.2%) | 206 (23.0%) |
| 75 Years and over | 92 (44.9%) | 91 (33.5%) |
Disability Class: Vision Difficulty
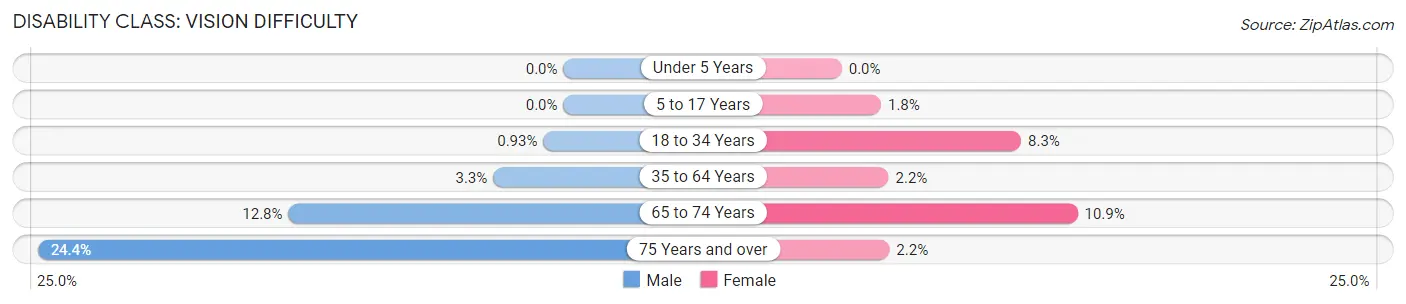
| Age Bracket | Male | Female |
| Under 5 Years | 0 (0.0%) | 0 (0.0%) |
| 5 to 17 Years | 0 (0.0%) | 16 (1.8%) |
| 18 to 34 Years | 11 (0.9%) | 81 (8.3%) |
| 35 to 64 Years | 63 (3.3%) | 42 (2.2%) |
| 65 to 74 Years | 68 (12.8%) | 98 (10.9%) |
| 75 Years and over | 50 (24.4%) | 6 (2.2%) |
Disability Class: Cognitive Difficulty
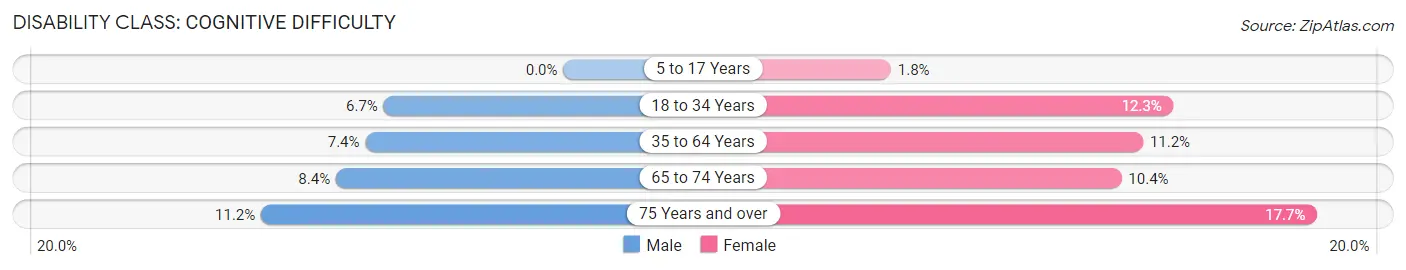
| Age Bracket | Male | Female |
| 5 to 17 Years | 0 (0.0%) | 16 (1.8%) |
| 18 to 34 Years | 79 (6.7%) | 120 (12.3%) |
| 35 to 64 Years | 142 (7.3%) | 216 (11.2%) |
| 65 to 74 Years | 45 (8.4%) | 93 (10.4%) |
| 75 Years and over | 23 (11.2%) | 48 (17.6%) |
Disability Class: Ambulatory Difficulty
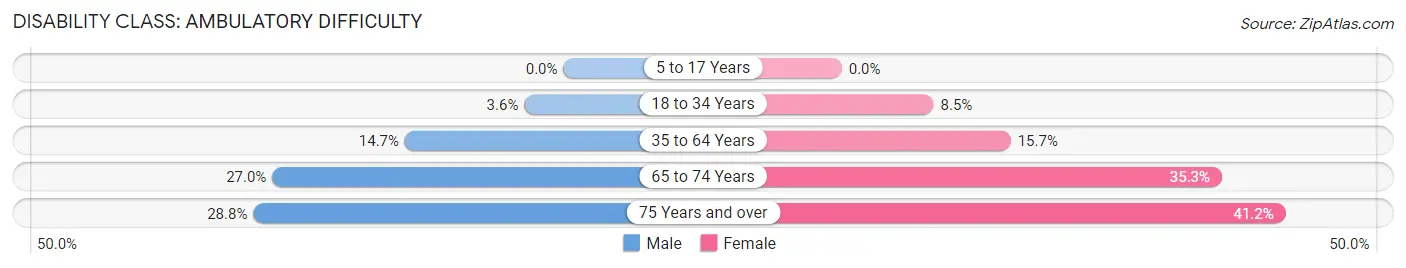
| Age Bracket | Male | Female |
| 5 to 17 Years | 0 (0.0%) | 0 (0.0%) |
| 18 to 34 Years | 43 (3.6%) | 83 (8.5%) |
| 35 to 64 Years | 284 (14.7%) | 303 (15.7%) |
| 65 to 74 Years | 144 (27.0%) | 316 (35.3%) |
| 75 Years and over | 59 (28.8%) | 112 (41.2%) |
Disability Class: Self-Care Difficulty
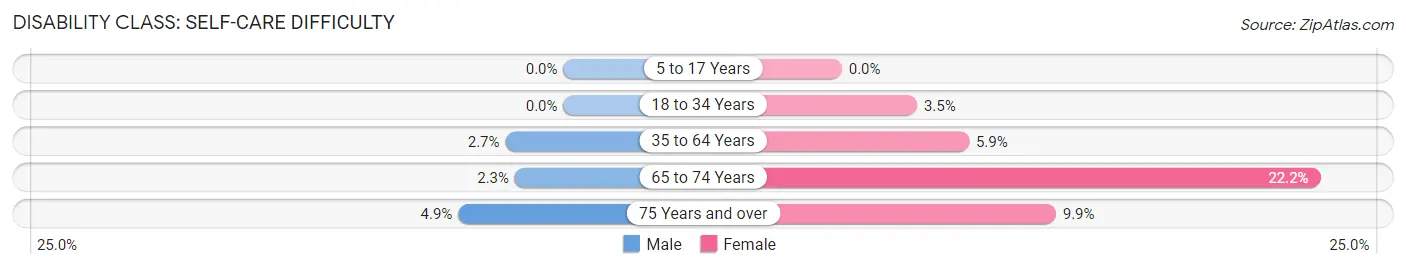
| Age Bracket | Male | Female |
| 5 to 17 Years | 0 (0.0%) | 0 (0.0%) |
| 18 to 34 Years | 0 (0.0%) | 34 (3.5%) |
| 35 to 64 Years | 52 (2.7%) | 114 (5.9%) |
| 65 to 74 Years | 12 (2.2%) | 199 (22.2%) |
| 75 Years and over | 10 (4.9%) | 27 (9.9%) |
Technology Access in Shasta Lake
Computing Device Access in Shasta Lake
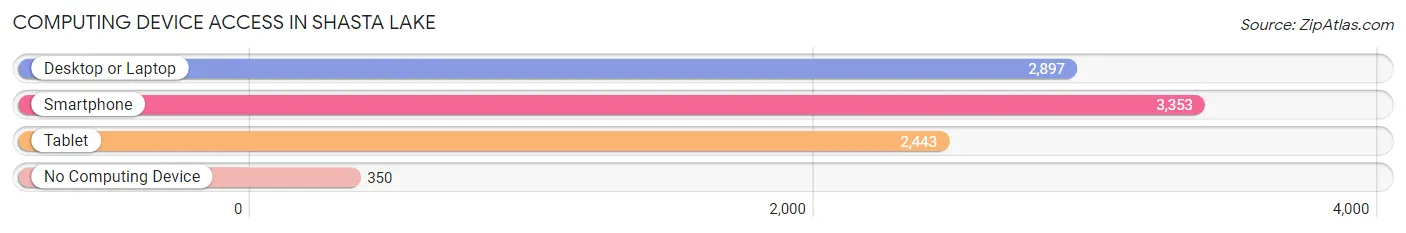
| Device Type | # Households | % Households |
| Desktop or Laptop | 2,897 | 74.1% |
| Smartphone | 3,353 | 85.8% |
| Tablet | 2,443 | 62.5% |
| No Computing Device | 350 | 9.0% |
| Total | 3,908 | 100.0% |
Internet Access in Shasta Lake
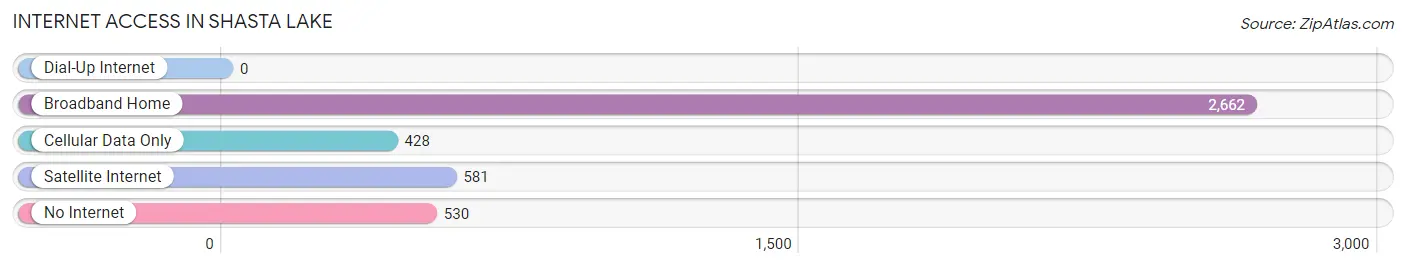
| Internet Type | # Households | % Households |
| Dial-Up Internet | 0 | 0.0% |
| Broadband Home | 2,662 | 68.1% |
| Cellular Data Only | 428 | 11.0% |
| Satellite Internet | 581 | 14.9% |
| No Internet | 530 | 13.6% |
| Total | 3,908 | 100.0% |
Shasta Lake Summary
Shasta Lake is a city located in Shasta County, California, United States. It is situated on the northern end of the Sacramento Valley, about 30 miles (48 km) northwest of Redding, the county seat. The city is named after nearby Shasta Lake, which is the largest man-made lake in California. The population of Shasta Lake was 10,164 at the 2010 census, up from 9,008 at the 2000 census.
History
The area around Shasta Lake has been inhabited for thousands of years by Native American tribes, including the Wintu, Modoc, and Yana. The first non-native settlers arrived in the area in the 1850s, and the city of Shasta Lake was officially incorporated in 1945.
The city was originally a lumber town, and the lumber industry was the main source of employment for many years. In the 1950s, the construction of Shasta Dam and Shasta Lake brought a new wave of economic growth to the area. The dam and lake provided a reliable source of water for the region, and the lake became a popular recreational destination.
Geography
Shasta Lake is located in the northern part of the Sacramento Valley, about 30 miles (48 km) northwest of Redding, the county seat. The city is situated at the northern end of Shasta Lake, the largest man-made lake in California. The lake is fed by the Sacramento River and is surrounded by the Shasta-Trinity National Forest.
The city has a total area of 8.3 square miles (21.5 km2), of which 8.2 square miles (21.3 km2) is land and 0.1 square miles (0.2 km2) is water.
Economy
The economy of Shasta Lake is largely based on tourism and recreation. The city is home to a number of marinas, campgrounds, and other recreational facilities, and the lake is a popular destination for fishing, boating, and other outdoor activities.
The city is also home to a number of businesses, including retail stores, restaurants, and other services. The city is also home to a number of manufacturing and industrial businesses, including a paper mill and a lumber mill.
Demographics
As of the 2010 census, there were 10,164 people, 3,945 households, and 2,717 families residing in the city. The population density was 1,228.3 people per square mile (474.2/km2). There were 4,093 housing units at an average density of 496.3 per square mile (191.6/km2). The racial makeup of the city was 87.2% White, 0.7% African American, 2.3% Native American, 0.9% Asian, 0.1% Pacific Islander, 5.3% from other races, and 3.5% from two or more races. Hispanic or Latino of any race were 11.2% of the population.
There were 3,945 households, out of which 33.2% had children under the age of 18 living with them, 48.2% were married couples living together, 13.7% had a female householder with no husband present, and 32.2% were non-families. 26.2% of all households were made up of individuals, and 10.2% had someone living alone who was 65 years of age or older. The average household size was 2.54 and the average family size was 3.05.
In the city, the population was spread out, with 26.2% under the age of 18, 8.2% from 18 to 24, 27.2% from 25 to 44, 24.2% from 45 to 64, and 14.2% who were 65 years of age or older. The median age was 37 years. For every 100 females, there were 97.2 males. For every 100 females age 18 and over, there were 94.2 males.
The median income for a household in the city was $35,938, and the median income for a family was $41,944. Males had a median income of $35,938 versus $25,938 for females. The per capita income for the city was $17,945. About 11.2% of families and 14.2% of the population were below the poverty line, including 19.2% of those under age 18 and 8.2% of those age 65 or over.
Common Questions
What is Per Capita Income in Shasta Lake?
Per Capita income in Shasta Lake is $26,355.
What is the Median Family Income in Shasta Lake?
Median Family Income in Shasta Lake is $63,700.
What is the Median Household income in Shasta Lake?
Median Household Income in Shasta Lake is $54,490.
What is Income or Wage Gap in Shasta Lake?
Income or Wage Gap in Shasta Lake is 23.7%.
Women in Shasta Lake earn 76.3 cents for every dollar earned by a man.
What is Inequality or Gini Index in Shasta Lake?
Inequality or Gini Index in Shasta Lake is 0.44.
What is the Total Population of Shasta Lake?
Total Population of Shasta Lake is 10,361.
What is the Total Male Population of Shasta Lake?
Total Male Population of Shasta Lake is 5,089.
What is the Total Female Population of Shasta Lake?
Total Female Population of Shasta Lake is 5,272.
What is the Ratio of Males per 100 Females in Shasta Lake?
There are 96.53 Males per 100 Females in Shasta Lake.
What is the Ratio of Females per 100 Males in Shasta Lake?
There are 103.60 Females per 100 Males in Shasta Lake.
What is the Median Population Age in Shasta Lake?
Median Population Age in Shasta Lake is 38.8 Years.
What is the Average Family Size in Shasta Lake
Average Family Size in Shasta Lake is 3.0 People.
What is the Average Household Size in Shasta Lake
Average Household Size in Shasta Lake is 2.6 People.
How Large is the Labor Force in Shasta Lake?
There are 4,506 People in the Labor Forcein in Shasta Lake.
What is the Percentage of People in the Labor Force in Shasta Lake?
54.3% of People are in the Labor Force in Shasta Lake.
What is the Unemployment Rate in Shasta Lake?
Unemployment Rate in Shasta Lake is 8.2%.