Shandon, CA Map & Demographics
Shandon Map
Shandon Overview
$27,376
PER CAPITA INCOME
$70,598
AVG FAMILY INCOME
$82,344
AVG HOUSEHOLD INCOME
22.6%
WAGE / INCOME GAP [ % ]
77.4¢/ $1
WAGE / INCOME GAP [ $ ]
0.34
INEQUALITY / GINI INDEX
1,031
TOTAL POPULATION
541
MALE POPULATION
490
FEMALE POPULATION
110.41
MALES / 100 FEMALES
90.57
FEMALES / 100 MALES
32.5
MEDIAN AGE
4.3
AVG FAMILY SIZE
3.2
AVG HOUSEHOLD SIZE
516
LABOR FORCE [ PEOPLE ]
65.4%
PERCENT IN LABOR FORCE
8.5%
UNEMPLOYMENT RATE
Shandon Zip Codes
Shandon Area Codes
Income in Shandon
Income Overview in Shandon
Per Capita Income in Shandon is $27,376, while median incomes of families and households are $70,598 and $82,344 respectively.
| Characteristic | Number | Measure |
| Per Capita Income | 1,031 | $27,376 |
| Median Family Income | 197 | $70,598 |
| Mean Family Income | 197 | $73,087 |
| Median Household Income | 323 | $82,344 |
| Mean Household Income | 323 | $82,290 |
| Income Deficit | 197 | $0 |
| Wage / Income Gap (%) | 1,031 | 22.59% |
| Wage / Income Gap ($) | 1,031 | 77.41¢ per $1 |
| Gini / Inequality Index | 1,031 | 0.34 |
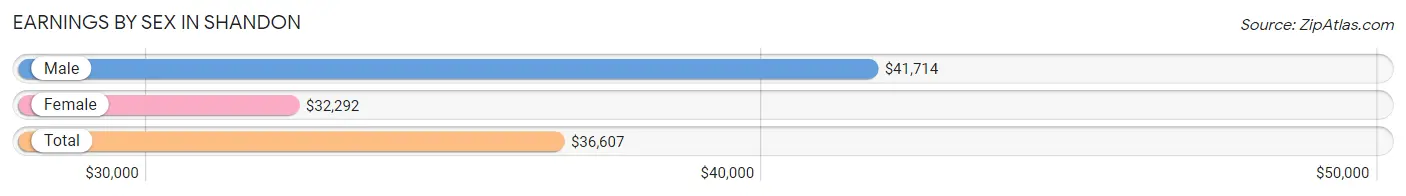
Earnings by Sex in Shandon
Average Earnings in Shandon are $36,607, $41,714 for men and $32,292 for women, a difference of 22.6%.
| Sex | Number | Average Earnings |
| Male | 338 (60.7%) | $41,714 |
| Female | 219 (39.3%) | $32,292 |
| Total | 557 (100.0%) | $36,607 |
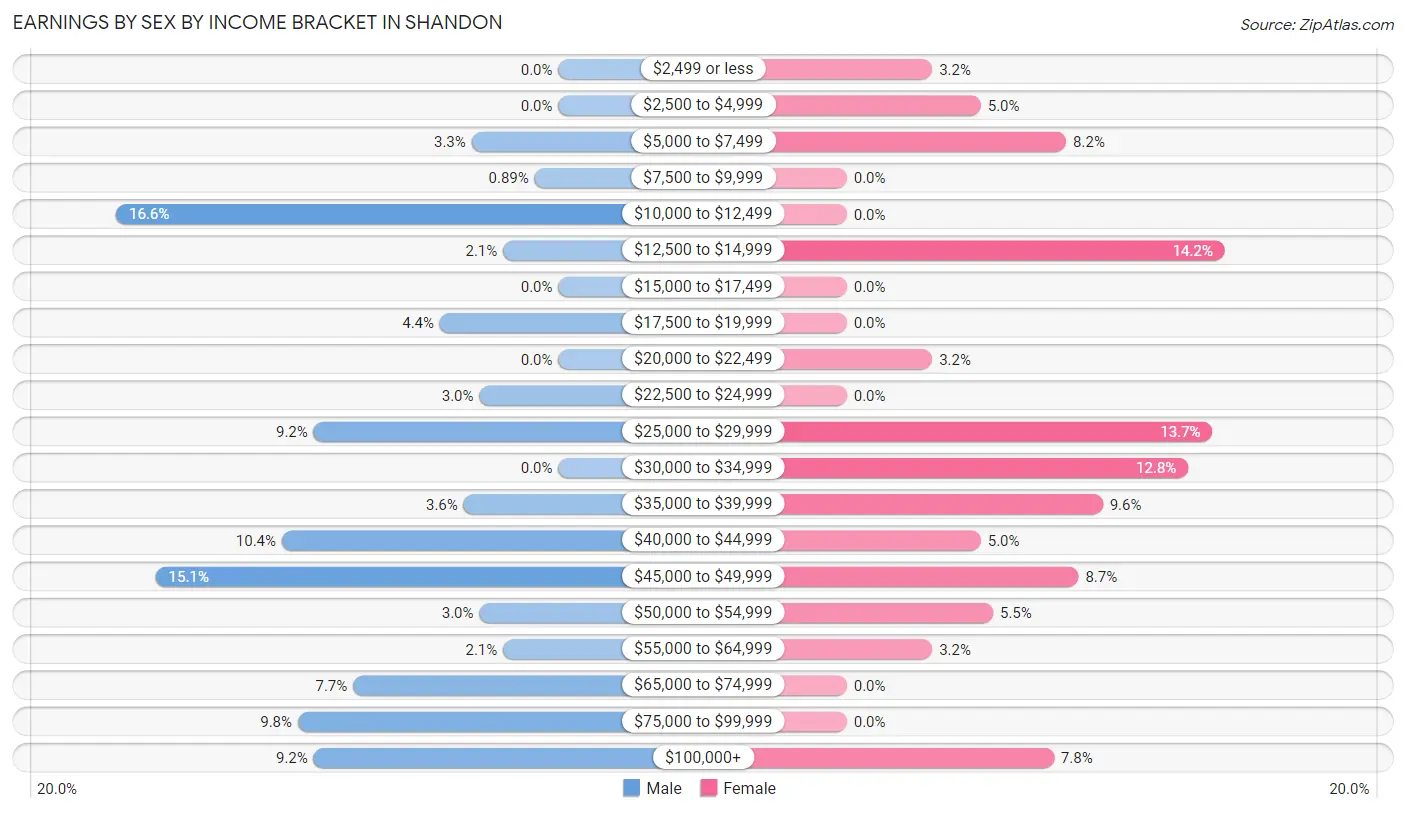
Earnings by Sex by Income Bracket in Shandon
The most common earnings brackets in Shandon are $10,000 to $12,499 for men (56 | 16.6%) and $12,500 to $14,999 for women (31 | 14.2%).
| Income | Male | Female |
| $2,499 or less | 0 (0.0%) | 7 (3.2%) |
| $2,500 to $4,999 | 0 (0.0%) | 11 (5.0%) |
| $5,000 to $7,499 | 11 (3.3%) | 18 (8.2%) |
| $7,500 to $9,999 | 3 (0.9%) | 0 (0.0%) |
| $10,000 to $12,499 | 56 (16.6%) | 0 (0.0%) |
| $12,500 to $14,999 | 7 (2.1%) | 31 (14.2%) |
| $15,000 to $17,499 | 0 (0.0%) | 0 (0.0%) |
| $17,500 to $19,999 | 15 (4.4%) | 0 (0.0%) |
| $20,000 to $22,499 | 0 (0.0%) | 7 (3.2%) |
| $22,500 to $24,999 | 10 (3.0%) | 0 (0.0%) |
| $25,000 to $29,999 | 31 (9.2%) | 30 (13.7%) |
| $30,000 to $34,999 | 0 (0.0%) | 28 (12.8%) |
| $35,000 to $39,999 | 12 (3.5%) | 21 (9.6%) |
| $40,000 to $44,999 | 35 (10.4%) | 11 (5.0%) |
| $45,000 to $49,999 | 51 (15.1%) | 19 (8.7%) |
| $50,000 to $54,999 | 10 (3.0%) | 12 (5.5%) |
| $55,000 to $64,999 | 7 (2.1%) | 7 (3.2%) |
| $65,000 to $74,999 | 26 (7.7%) | 0 (0.0%) |
| $75,000 to $99,999 | 33 (9.8%) | 0 (0.0%) |
| $100,000+ | 31 (9.2%) | 17 (7.8%) |
| Total | 338 (100.0%) | 219 (100.0%) |
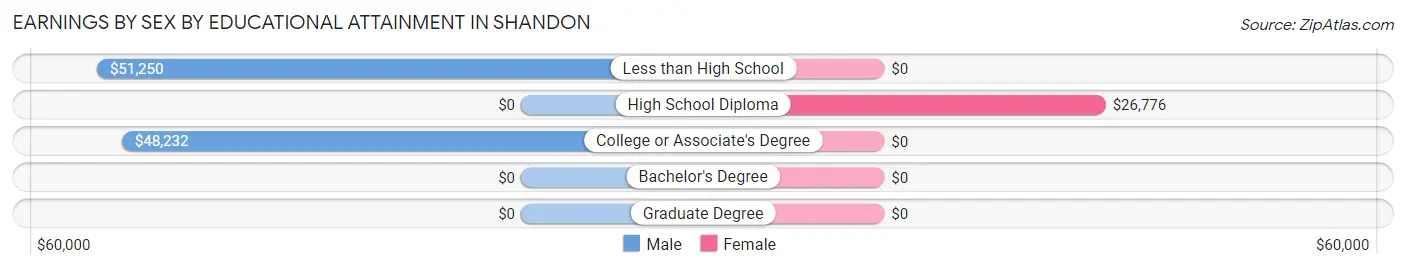
Earnings by Sex by Educational Attainment in Shandon
Average earnings in Shandon are $42,464 for men and $34,091 for women, a difference of 19.7%. Men with an educational attainment of less than high school enjoy the highest average annual earnings of $51,250, while those with college or associate's degree education earn the least with $48,232. Women with an educational attainment of high school diploma earn the most with the average annual earnings of $26,776, while those with high school diploma education have the smallest earnings of $26,776.
| Educational Attainment | Male Income | Female Income |
| Less than High School | $51,250 | $0 |
| High School Diploma | - | - |
| College or Associate's Degree | $48,232 | $0 |
| Bachelor's Degree | - | - |
| Graduate Degree | - | - |
| Total | $42,464 | $34,091 |
Family Income in Shandon
Family Income Brackets in Shandon
According to the Shandon family income data, there are 52 families falling into the $75,000 to $99,999 income range, which is the most common income bracket and makes up 26.4% of all families.
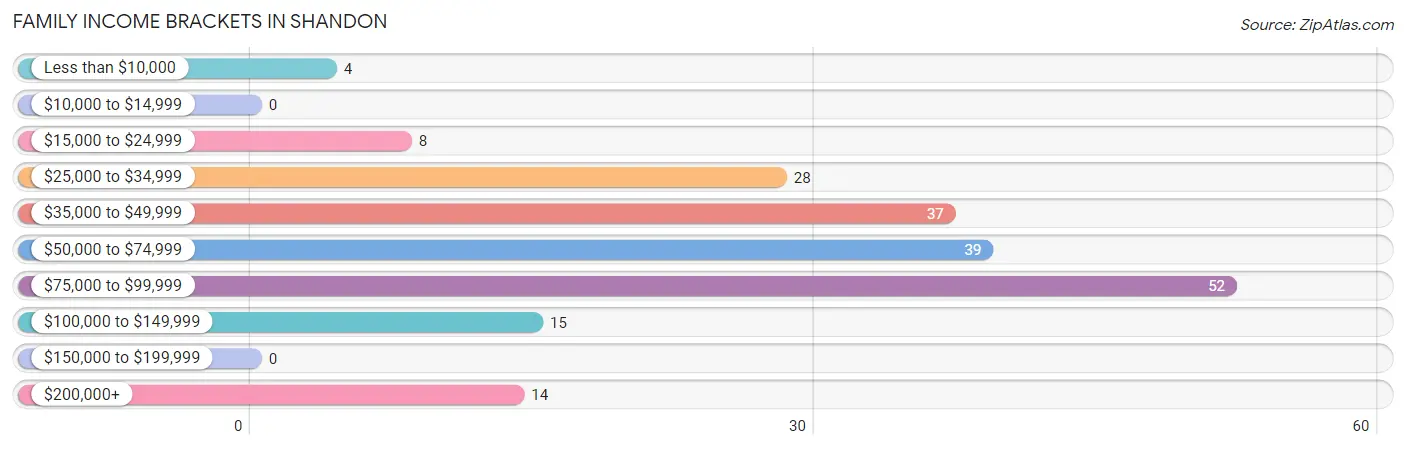
| Income Bracket | # Families | % Families |
| Less than $10,000 | 4 | 2.0% |
| $10,000 to $14,999 | 0 | 0.0% |
| $15,000 to $24,999 | 8 | 4.1% |
| $25,000 to $34,999 | 28 | 14.2% |
| $35,000 to $49,999 | 37 | 18.8% |
| $50,000 to $74,999 | 39 | 19.8% |
| $75,000 to $99,999 | 52 | 26.4% |
| $100,000 to $149,999 | 15 | 7.6% |
| $150,000 to $199,999 | 0 | 0.0% |
| $200,000+ | 14 | 7.1% |
Family Income by Famaliy Size in Shandon
4-person families (40 | 20.3%) account for the highest median family income in Shandon with $79,375 per family, while 2-person families (51 | 25.9%) have the highest median income of $35,042 per family member.
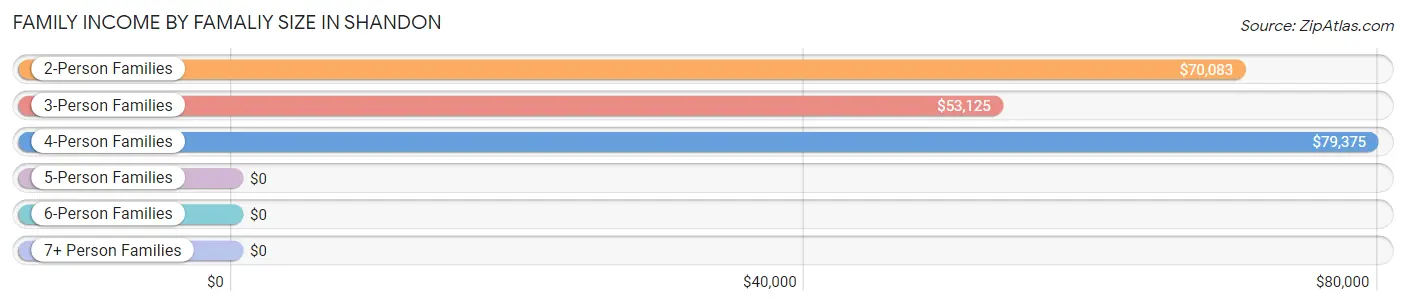
| Income Bracket | # Families | Median Income |
| 2-Person Families | 51 (25.9%) | $70,083 |
| 3-Person Families | 75 (38.1%) | $53,125 |
| 4-Person Families | 40 (20.3%) | $79,375 |
| 5-Person Families | 24 (12.2%) | $0 |
| 6-Person Families | 0 (0.0%) | $0 |
| 7+ Person Families | 7 (3.5%) | $0 |
| Total | 197 (100.0%) | $70,598 |
Family Income by Number of Earners in Shandon
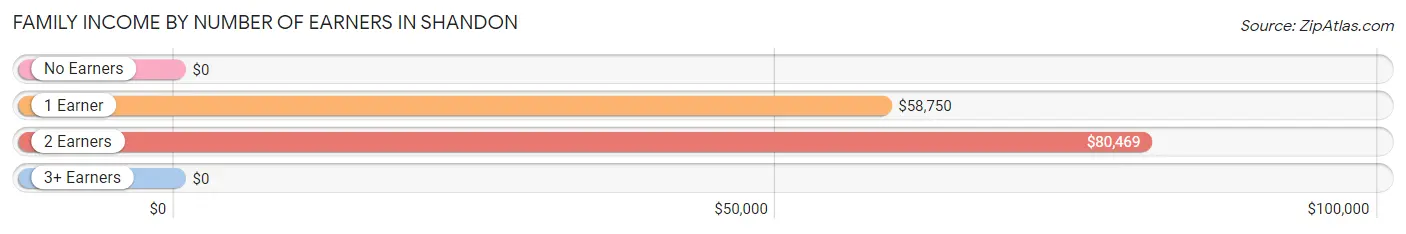
| Number of Earners | # Families | Median Income |
| No Earners | 7 (3.5%) | $0 |
| 1 Earner | 88 (44.7%) | $58,750 |
| 2 Earners | 87 (44.2%) | $80,469 |
| 3+ Earners | 15 (7.6%) | $0 |
| Total | 197 (100.0%) | $70,598 |
Household Income in Shandon
Household Income Brackets in Shandon
With 101 households falling in the category, the $75,000 to $99,999 income range is the most frequent in Shandon, accounting for 31.3% of all households.
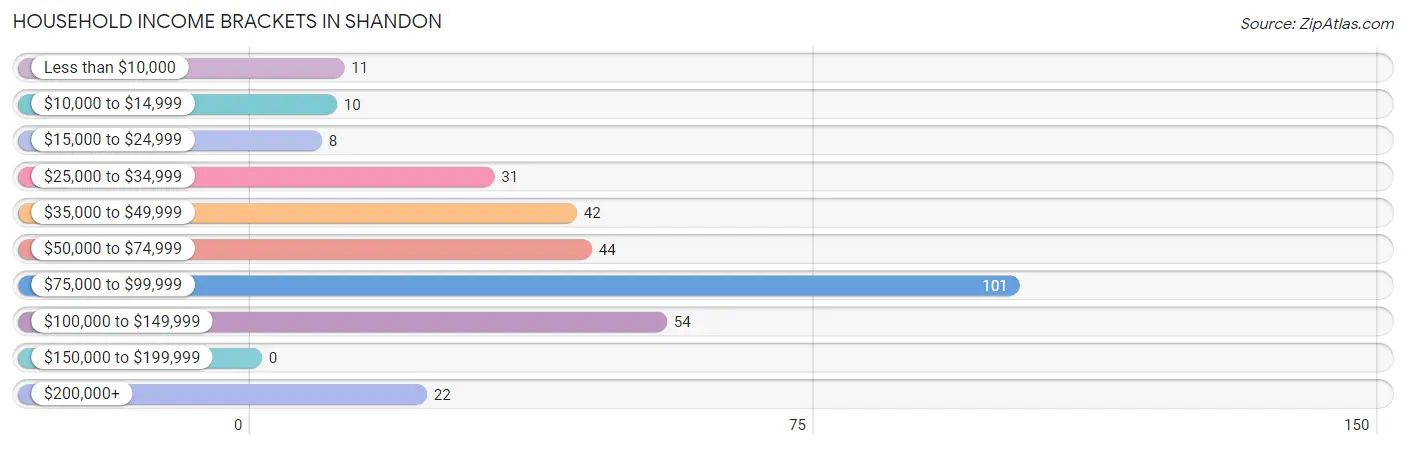
| Income Bracket | # Households | % Households |
| Less than $10,000 | 11 | 3.4% |
| $10,000 to $14,999 | 10 | 3.1% |
| $15,000 to $24,999 | 8 | 2.5% |
| $25,000 to $34,999 | 31 | 9.6% |
| $35,000 to $49,999 | 42 | 13.0% |
| $50,000 to $74,999 | 44 | 13.6% |
| $75,000 to $99,999 | 101 | 31.3% |
| $100,000 to $149,999 | 54 | 16.7% |
| $150,000 to $199,999 | 0 | 0.0% |
| $200,000+ | 22 | 6.8% |
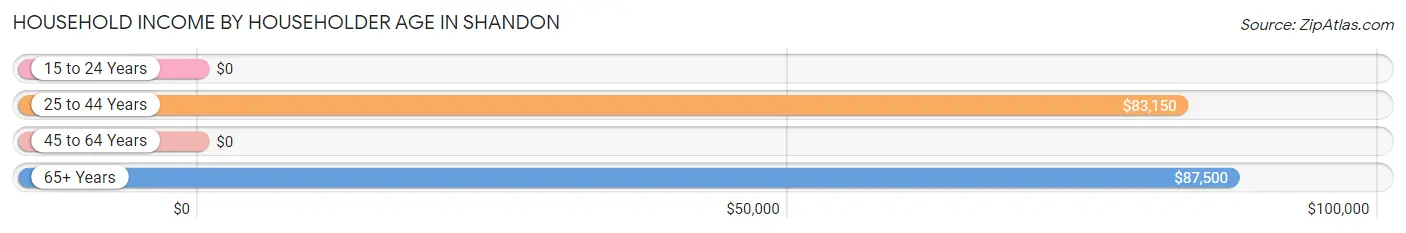
Household Income by Householder Age in Shandon
The median household income in Shandon is $82,344, with the highest median household income of $87,500 found in the 65+ years age bracket for the primary householder. A total of 44 households (13.6%) fall into this category. Meanwhile, the 15 to 24 years age bracket for the primary householder has the lowest median household income of $0, with 21 households (6.5%) in this group.
| Income Bracket | # Households | Median Income |
| 15 to 24 Years | 21 (6.5%) | $0 |
| 25 to 44 Years | 146 (45.2%) | $83,150 |
| 45 to 64 Years | 112 (34.7%) | $0 |
| 65+ Years | 44 (13.6%) | $87,500 |
| Total | 323 (100.0%) | $82,344 |
Poverty in Shandon
Income Below Poverty by Sex and Age in Shandon
With 4.6% poverty level for males and 9.0% for females among the residents of Shandon, 55 to 64 year old males and 16 and 17 year old females are the most vulnerable to poverty, with 14 males (28.0%) and 7 females (38.9%) in their respective age groups living below the poverty level.
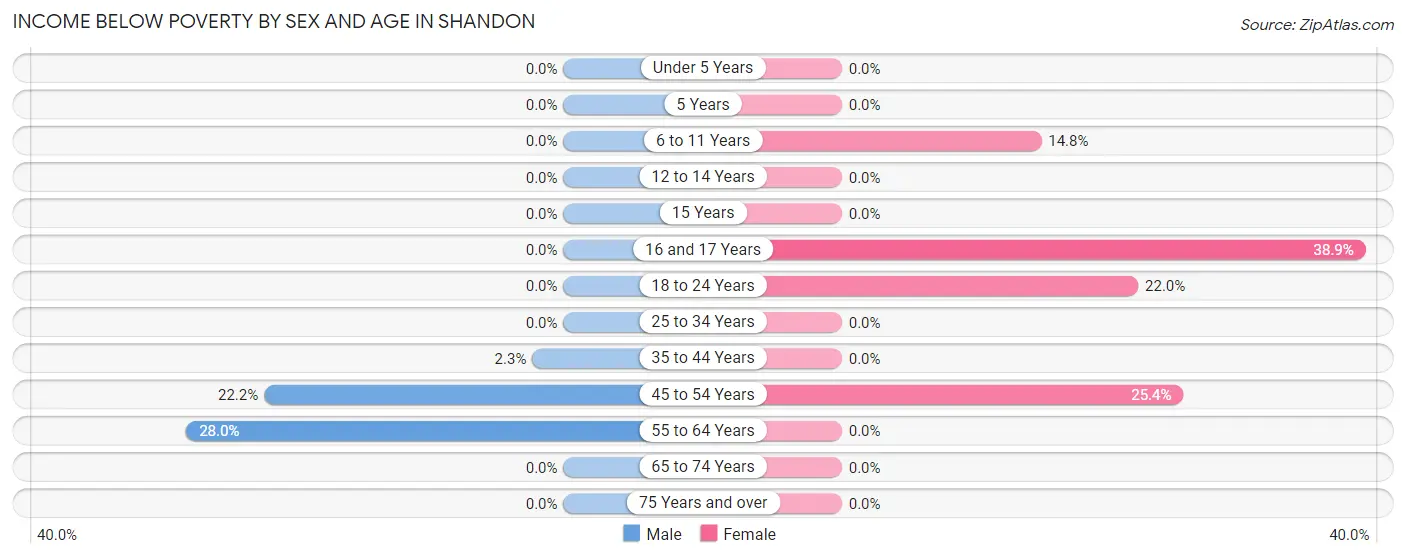
| Age Bracket | Male | Female |
| Under 5 Years | 0 (0.0%) | 0 (0.0%) |
| 5 Years | 0 (0.0%) | 0 (0.0%) |
| 6 to 11 Years | 0 (0.0%) | 8 (14.8%) |
| 12 to 14 Years | 0 (0.0%) | 0 (0.0%) |
| 15 Years | 0 (0.0%) | 0 (0.0%) |
| 16 and 17 Years | 0 (0.0%) | 7 (38.9%) |
| 18 to 24 Years | 0 (0.0%) | 11 (22.0%) |
| 25 to 34 Years | 0 (0.0%) | 0 (0.0%) |
| 35 to 44 Years | 3 (2.3%) | 0 (0.0%) |
| 45 to 54 Years | 8 (22.2%) | 18 (25.4%) |
| 55 to 64 Years | 14 (28.0%) | 0 (0.0%) |
| 65 to 74 Years | 0 (0.0%) | 0 (0.0%) |
| 75 Years and over | 0 (0.0%) | 0 (0.0%) |
| Total | 25 (4.6%) | 44 (9.0%) |
Income Above Poverty by Sex and Age in Shandon
According to the poverty statistics in Shandon, males aged under 5 years and females aged under 5 years are the age groups that are most secure financially, with 100.0% of males and 100.0% of females in these age groups living above the poverty line.

| Age Bracket | Male | Female |
| Under 5 Years | 15 (100.0%) | 24 (100.0%) |
| 5 Years | 0 (0.0%) | 0 (0.0%) |
| 6 to 11 Years | 62 (100.0%) | 46 (85.2%) |
| 12 to 14 Years | 38 (100.0%) | 11 (100.0%) |
| 15 Years | 13 (100.0%) | 25 (100.0%) |
| 16 and 17 Years | 22 (100.0%) | 11 (61.1%) |
| 18 to 24 Years | 32 (100.0%) | 39 (78.0%) |
| 25 to 34 Years | 111 (100.0%) | 75 (100.0%) |
| 35 to 44 Years | 127 (97.7%) | 95 (100.0%) |
| 45 to 54 Years | 28 (77.8%) | 53 (74.7%) |
| 55 to 64 Years | 36 (72.0%) | 31 (100.0%) |
| 65 to 74 Years | 24 (100.0%) | 20 (100.0%) |
| 75 Years and over | 8 (100.0%) | 16 (100.0%) |
| Total | 516 (95.4%) | 446 (91.0%) |
Income Below Poverty Among Married-Couple Families in Shandon
The poverty statistics for married-couple families in Shandon show that 7.9% or 12 of the total 152 families live below the poverty line. Families with 1 or 2 children have the highest poverty rate of 11.6%, comprising of 8 families. On the other hand, families with 3 or 4 children have the lowest poverty rate of 0.0%, which includes 0 families.
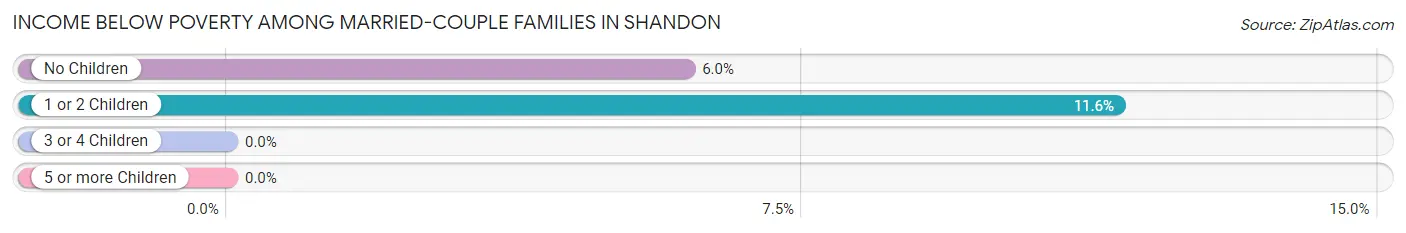
| Children | Above Poverty | Below Poverty |
| No Children | 63 (94.0%) | 4 (6.0%) |
| 1 or 2 Children | 61 (88.4%) | 8 (11.6%) |
| 3 or 4 Children | 9 (100.0%) | 0 (0.0%) |
| 5 or more Children | 7 (100.0%) | 0 (0.0%) |
| Total | 140 (92.1%) | 12 (7.9%) |
Income Below Poverty Among Single-Parent Households in Shandon
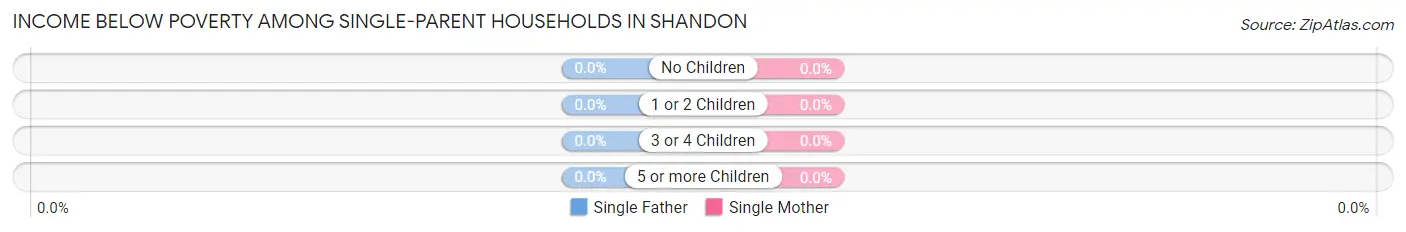
| Children | Single Father | Single Mother |
| No Children | 0 (0.0%) | 0 (0.0%) |
| 1 or 2 Children | 0 (0.0%) | 0 (0.0%) |
| 3 or 4 Children | 0 (0.0%) | 0 (0.0%) |
| 5 or more Children | 0 (0.0%) | 0 (0.0%) |
| Total | 0 (0.0%) | 0 (0.0%) |
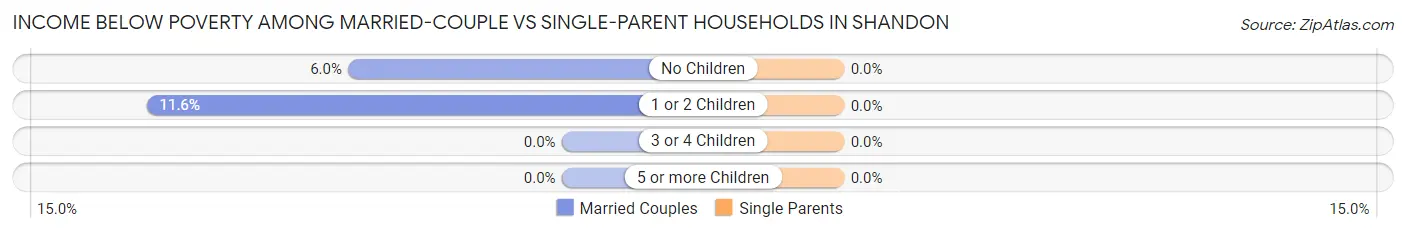
Income Below Poverty Among Married-Couple vs Single-Parent Households in Shandon
| Children | Married-Couple Families | Single-Parent Households |
| No Children | 4 (6.0%) | 0 (0.0%) |
| 1 or 2 Children | 8 (11.6%) | 0 (0.0%) |
| 3 or 4 Children | 0 (0.0%) | 0 (0.0%) |
| 5 or more Children | 0 (0.0%) | 0 (0.0%) |
| Total | 12 (7.9%) | 0 (0.0%) |
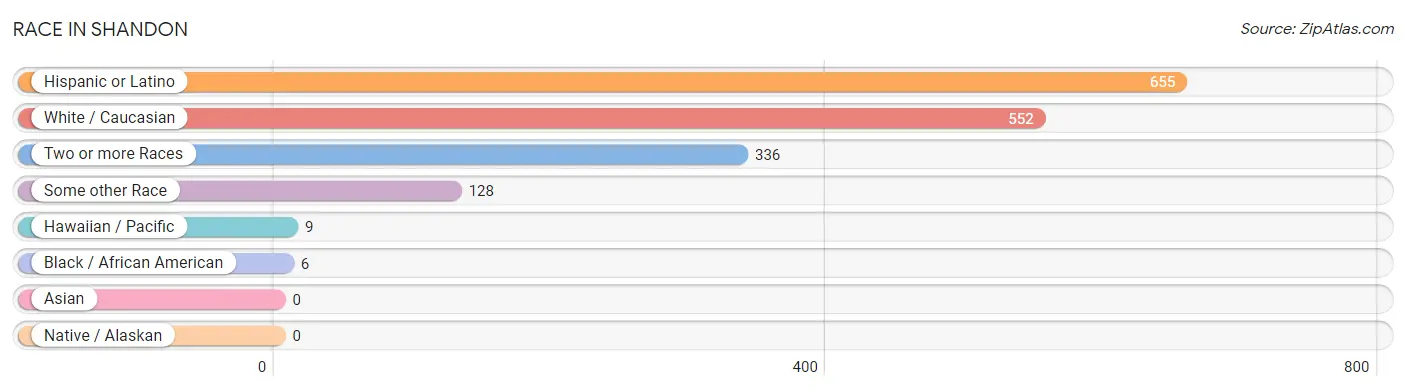
Race in Shandon
The most populous races in Shandon are Hispanic or Latino (655 | 63.5%), White / Caucasian (552 | 53.5%), and Two or more Races (336 | 32.6%).
| Race | # Population | % Population |
| Asian | 0 | 0.0% |
| Black / African American | 6 | 0.6% |
| Hawaiian / Pacific | 9 | 0.9% |
| Hispanic or Latino | 655 | 63.5% |
| Native / Alaskan | 0 | 0.0% |
| White / Caucasian | 552 | 53.5% |
| Two or more Races | 336 | 32.6% |
| Some other Race | 128 | 12.4% |
| Total | 1,031 | 100.0% |
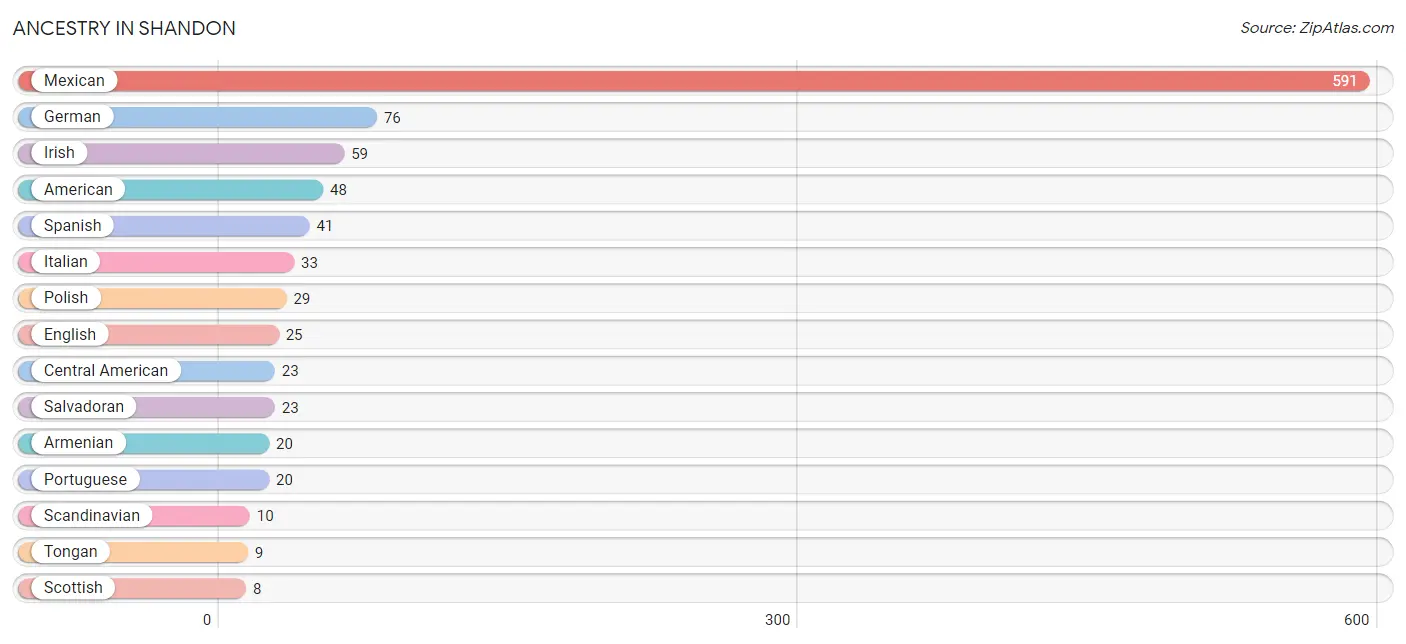
Ancestry in Shandon
The most populous ancestries reported in Shandon are Mexican (591 | 57.3%), German (76 | 7.4%), Irish (59 | 5.7%), American (48 | 4.7%), and Spanish (41 | 4.0%), together accounting for 79.0% of all Shandon residents.
| Ancestry | # Population | % Population |
| American | 48 | 4.7% |
| Armenian | 20 | 1.9% |
| Central American | 23 | 2.2% |
| English | 25 | 2.4% |
| German | 76 | 7.4% |
| Irish | 59 | 5.7% |
| Italian | 33 | 3.2% |
| Mexican | 591 | 57.3% |
| Polish | 29 | 2.8% |
| Portuguese | 20 | 1.9% |
| Salvadoran | 23 | 2.2% |
| Scandinavian | 10 | 1.0% |
| Scotch-Irish | 5 | 0.5% |
| Scottish | 8 | 0.8% |
| Spanish | 41 | 4.0% |
| Swiss | 8 | 0.8% |
| Tongan | 9 | 0.9% | View All 17 Rows |
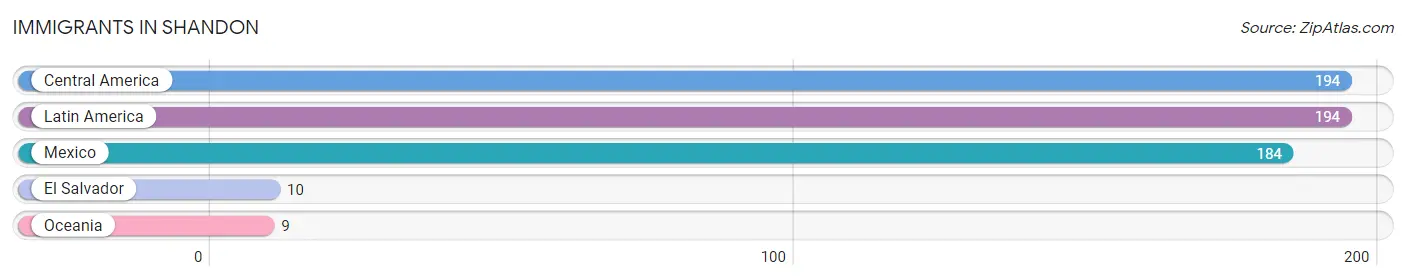
Immigrants in Shandon
The most numerous immigrant groups reported in Shandon came from Central America (194 | 18.8%), Latin America (194 | 18.8%), Mexico (184 | 17.8%), El Salvador (10 | 1.0%), and Oceania (9 | 0.9%), together accounting for 57.3% of all Shandon residents.
| Immigration Origin | # Population | % Population |
| Central America | 194 | 18.8% |
| El Salvador | 10 | 1.0% |
| Latin America | 194 | 18.8% |
| Mexico | 184 | 17.8% |
| Oceania | 9 | 0.9% | View All 5 Rows |
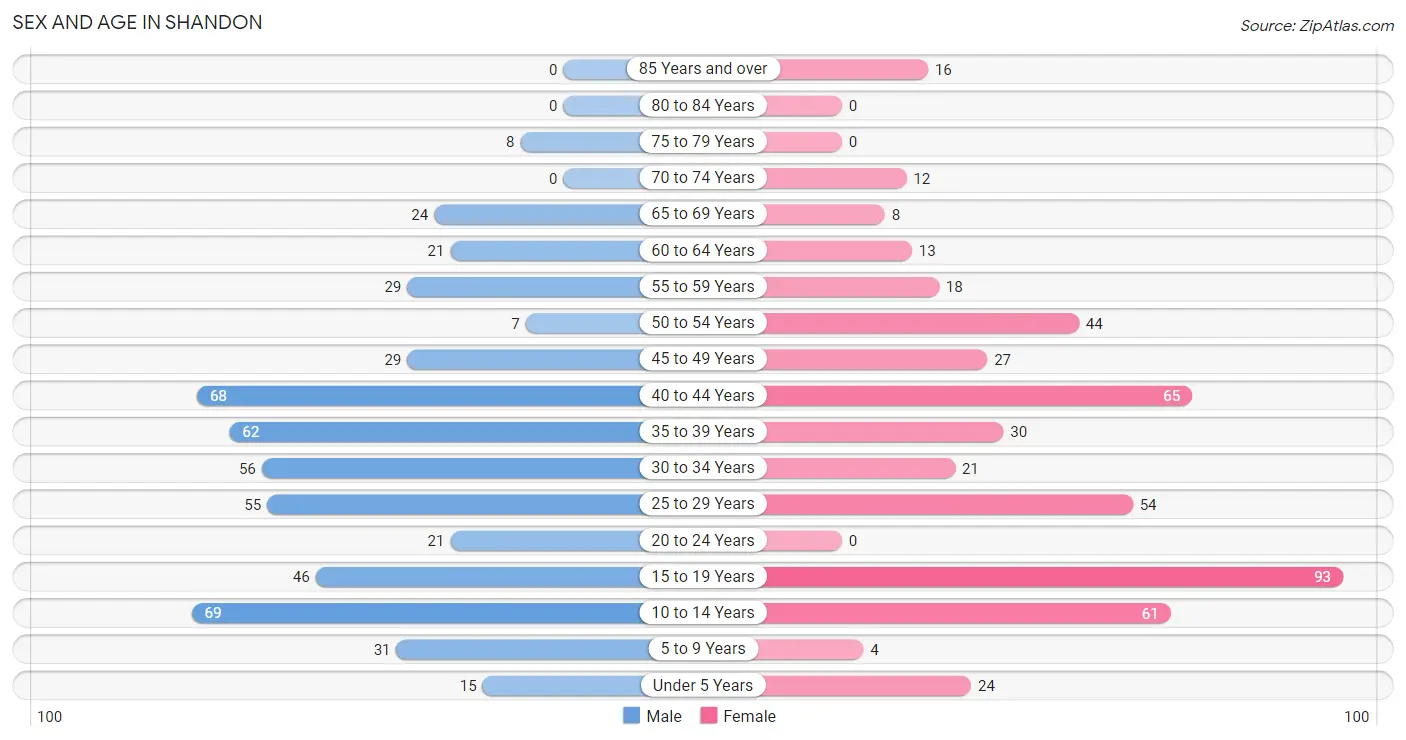
Sex and Age in Shandon
Sex and Age in Shandon
The most populous age groups in Shandon are 10 to 14 Years (69 | 12.8%) for men and 15 to 19 Years (93 | 19.0%) for women.
| Age Bracket | Male | Female |
| Under 5 Years | 15 (2.8%) | 24 (4.9%) |
| 5 to 9 Years | 31 (5.7%) | 4 (0.8%) |
| 10 to 14 Years | 69 (12.8%) | 61 (12.4%) |
| 15 to 19 Years | 46 (8.5%) | 93 (19.0%) |
| 20 to 24 Years | 21 (3.9%) | 0 (0.0%) |
| 25 to 29 Years | 55 (10.2%) | 54 (11.0%) |
| 30 to 34 Years | 56 (10.3%) | 21 (4.3%) |
| 35 to 39 Years | 62 (11.5%) | 30 (6.1%) |
| 40 to 44 Years | 68 (12.6%) | 65 (13.3%) |
| 45 to 49 Years | 29 (5.4%) | 27 (5.5%) |
| 50 to 54 Years | 7 (1.3%) | 44 (9.0%) |
| 55 to 59 Years | 29 (5.4%) | 18 (3.7%) |
| 60 to 64 Years | 21 (3.9%) | 13 (2.6%) |
| 65 to 69 Years | 24 (4.4%) | 8 (1.6%) |
| 70 to 74 Years | 0 (0.0%) | 12 (2.5%) |
| 75 to 79 Years | 8 (1.5%) | 0 (0.0%) |
| 80 to 84 Years | 0 (0.0%) | 0 (0.0%) |
| 85 Years and over | 0 (0.0%) | 16 (3.3%) |
| Total | 541 (100.0%) | 490 (100.0%) |
Families and Households in Shandon
Median Family Size in Shandon
The median family size in Shandon is 4.29 persons per family, with married-couple families (152 | 77.2%) accounting for the largest median family size of 4.72 persons per family. On the other hand, single male/father families (31 | 15.7%) represent the smallest median family size with 2.35 persons per family.
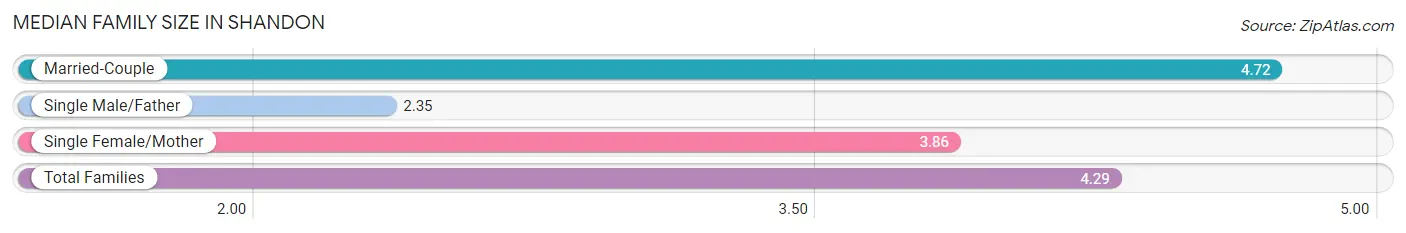
| Family Type | # Families | Family Size |
| Married-Couple | 152 (77.2%) | 4.72 |
| Single Male/Father | 31 (15.7%) | 2.35 |
| Single Female/Mother | 14 (7.1%) | 3.86 |
| Total Families | 197 (100.0%) | 4.29 |
Median Household Size in Shandon
The median household size in Shandon is 3.19 persons per household, with married-couple households (152 | 47.1%) accounting for the largest median household size of 4.72 persons per household. non-family households (126 | 39.0%) represent the smallest median household size with 1.43 persons per household.
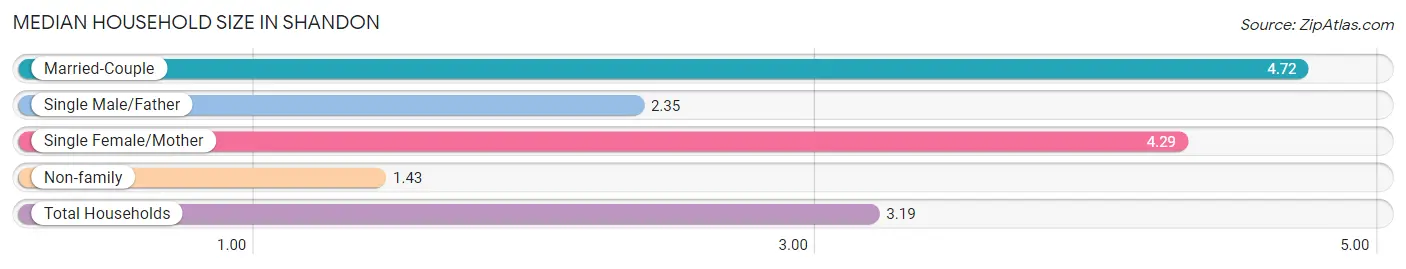
| Household Type | # Households | Household Size |
| Married-Couple | 152 (47.1%) | 4.72 |
| Single Male/Father | 31 (9.6%) | 2.35 |
| Single Female/Mother | 14 (4.3%) | 4.29 |
| Non-family | 126 (39.0%) | 1.43 |
| Total Households | 323 (100.0%) | 3.19 |
Household Size by Marriage Status in Shandon
Out of a total of 323 households in Shandon, 197 (61.0%) are family households, while 126 (39.0%) are nonfamily households. The most numerous type of family households are 3-person households, comprising 75, and the most common type of nonfamily households are 2-person households, comprising 77.
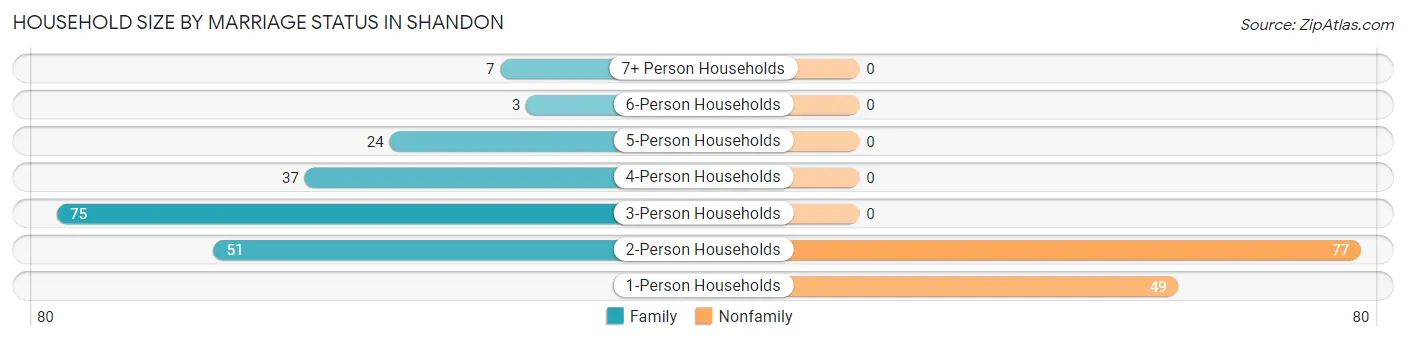
| Household Size | Family Households | Nonfamily Households |
| 1-Person Households | - | 49 (15.2%) |
| 2-Person Households | 51 (15.8%) | 77 (23.8%) |
| 3-Person Households | 75 (23.2%) | 0 (0.0%) |
| 4-Person Households | 37 (11.5%) | 0 (0.0%) |
| 5-Person Households | 24 (7.4%) | 0 (0.0%) |
| 6-Person Households | 3 (0.9%) | 0 (0.0%) |
| 7+ Person Households | 7 (2.2%) | 0 (0.0%) |
| Total | 197 (61.0%) | 126 (39.0%) |
Female Fertility in Shandon
Fertility by Age in Shandon
| Age Bracket | Women with Births | Births / 1,000 Women |
| 15 to 19 years | 0 (0.0%) | 0.0 |
| 20 to 34 years | 0 (0.0%) | 0.0 |
| 35 to 50 years | 0 (0.0%) | 0.0 |
| Total | 0 (0.0%) | 0.0 |
Fertility by Age by Marriage Status in Shandon
| Age Bracket | Married | Unmarried |
| 15 to 19 years | 0 (0.0%) | 0 (0.0%) |
| 20 to 34 years | 0 (0.0%) | 0 (0.0%) |
| 35 to 50 years | 0 (0.0%) | 0 (0.0%) |
| Total | 0 (0.0%) | 0 (0.0%) |
Fertility by Education in Shandon
| Educational Attainment | Women with Births | Births / 1,000 Women |
| Less than High School | 0 (0.0%) | 0.0 |
| High School Diploma | 0 (0.0%) | 0.0 |
| College or Associate's Degree | 0 (0.0%) | 0.0 |
| Bachelor's Degree | 0 (0.0%) | 0.0 |
| Graduate Degree | 0 (0.0%) | 0.0 |
| Total | 0 (0.0%) | 0.0 |
Fertility by Education by Marriage Status in Shandon
| Educational Attainment | Married | Unmarried |
| Less than High School | 0 (0.0%) | 0 (0.0%) |
| High School Diploma | 0 (0.0%) | 0 (0.0%) |
| College or Associate's Degree | 0 (0.0%) | 0 (0.0%) |
| Bachelor's Degree | 0 (0.0%) | 0 (0.0%) |
| Graduate Degree | 0 (0.0%) | 0 (0.0%) |
| Total | 0 (0.0%) | 0 (0.0%) |
Employment Characteristics in Shandon
Employment by Class of Employer in Shandon
Among the 472 employed individuals in Shandon, private company employees (371 | 78.6%), local government employees (35 | 7.4%), and federal government employees (30 | 6.4%) make up the most common classes of employment.
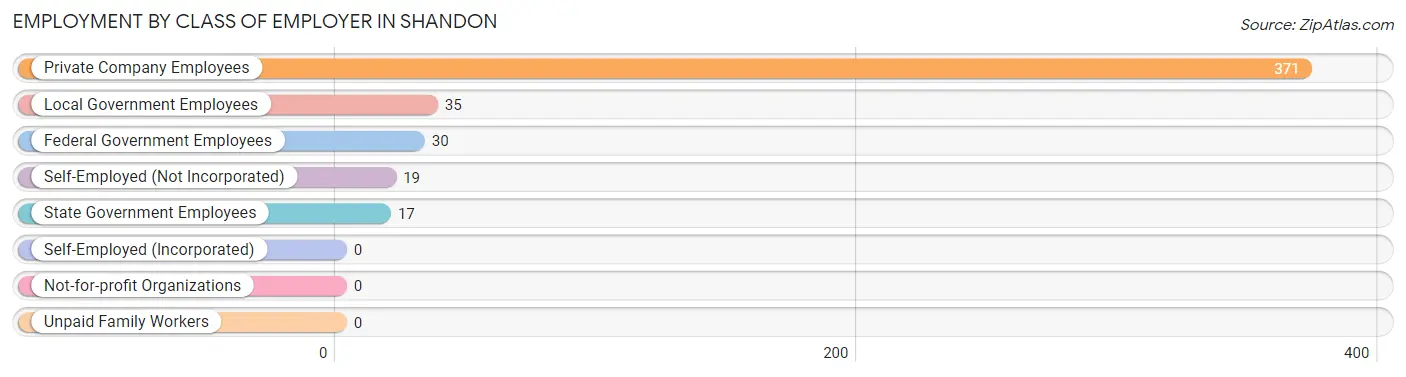
| Employer Class | # Employees | % Employees |
| Private Company Employees | 371 | 78.6% |
| Self-Employed (Incorporated) | 0 | 0.0% |
| Self-Employed (Not Incorporated) | 19 | 4.0% |
| Not-for-profit Organizations | 0 | 0.0% |
| Local Government Employees | 35 | 7.4% |
| State Government Employees | 17 | 3.6% |
| Federal Government Employees | 30 | 6.4% |
| Unpaid Family Workers | 0 | 0.0% |
| Total | 472 | 100.0% |
Employment Status by Age in Shandon
According to the labor force statistics for Shandon, out of the total population over 16 years of age (789), 65.4% or 516 individuals are in the labor force, with 8.5% or 44 of them unemployed. The age group with the highest labor force participation rate is 20 to 24 years, with 100.0% or 21 individuals in the labor force. Within the labor force, the 25 to 29 years age range has the highest percentage of unemployed individuals, with 43.6% or 41 of them being unemployed.
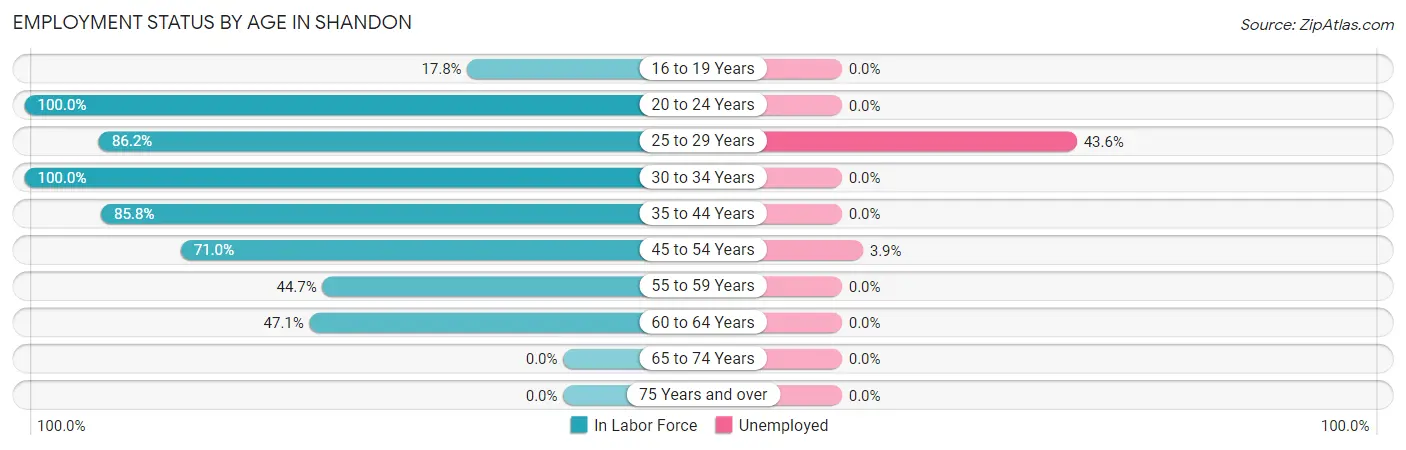
| Age Bracket | In Labor Force | Unemployed |
| 16 to 19 Years | 18 (17.8%) | 0 (0.0%) |
| 20 to 24 Years | 21 (100.0%) | 0 (0.0%) |
| 25 to 29 Years | 94 (86.2%) | 41 (43.6%) |
| 30 to 34 Years | 77 (100.0%) | 0 (0.0%) |
| 35 to 44 Years | 193 (85.8%) | 0 (0.0%) |
| 45 to 54 Years | 76 (71.0%) | 3 (3.9%) |
| 55 to 59 Years | 21 (44.7%) | 0 (0.0%) |
| 60 to 64 Years | 16 (47.1%) | 0 (0.0%) |
| 65 to 74 Years | 0 (0.0%) | 0 (0.0%) |
| 75 Years and over | 0 (0.0%) | 0 (0.0%) |
| Total | 516 (65.4%) | 44 (8.5%) |
Employment Status by Educational Attainment in Shandon
According to labor force statistics for Shandon, 79.6% of individuals (477) out of the total population between 25 and 64 years of age (599) are in the labor force, with 9.2% or 44 of them being unemployed. The group with the highest labor force participation rate are those with the educational attainment of bachelor's degree or higher, with 91.7% or 44 individuals in the labor force. Within the labor force, individuals with college / associate degree education have the highest percentage of unemployment, with 28.8% or 44 of them being unemployed.
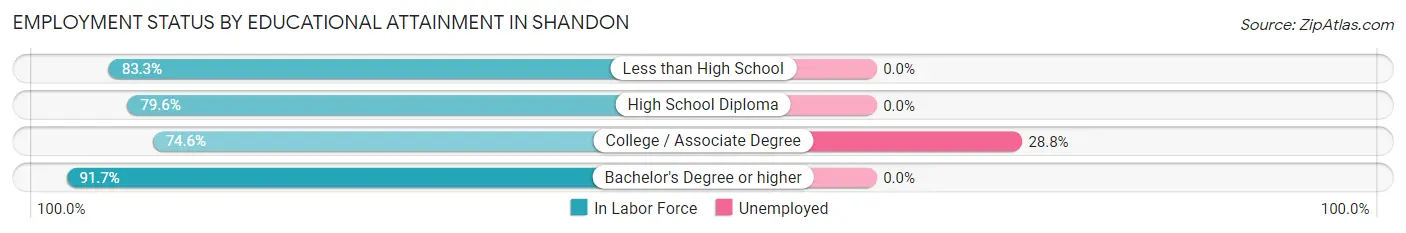
| Educational Attainment | In Labor Force | Unemployed |
| Less than High School | 100 (83.3%) | 0 (0.0%) |
| High School Diploma | 180 (79.6%) | 0 (0.0%) |
| College / Associate Degree | 153 (74.6%) | 59 (28.8%) |
| Bachelor's Degree or higher | 44 (91.7%) | 0 (0.0%) |
| Total | 477 (79.6%) | 55 (9.2%) |
Employment Occupations by Sex in Shandon
Management, Business, Science and Arts Occupations
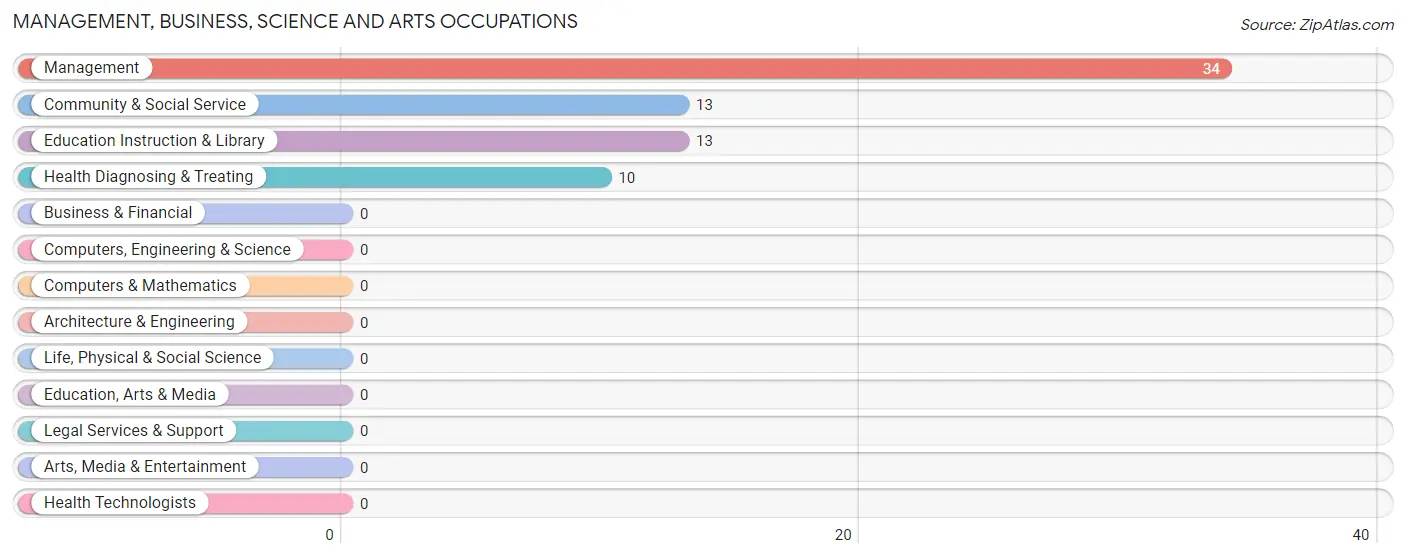
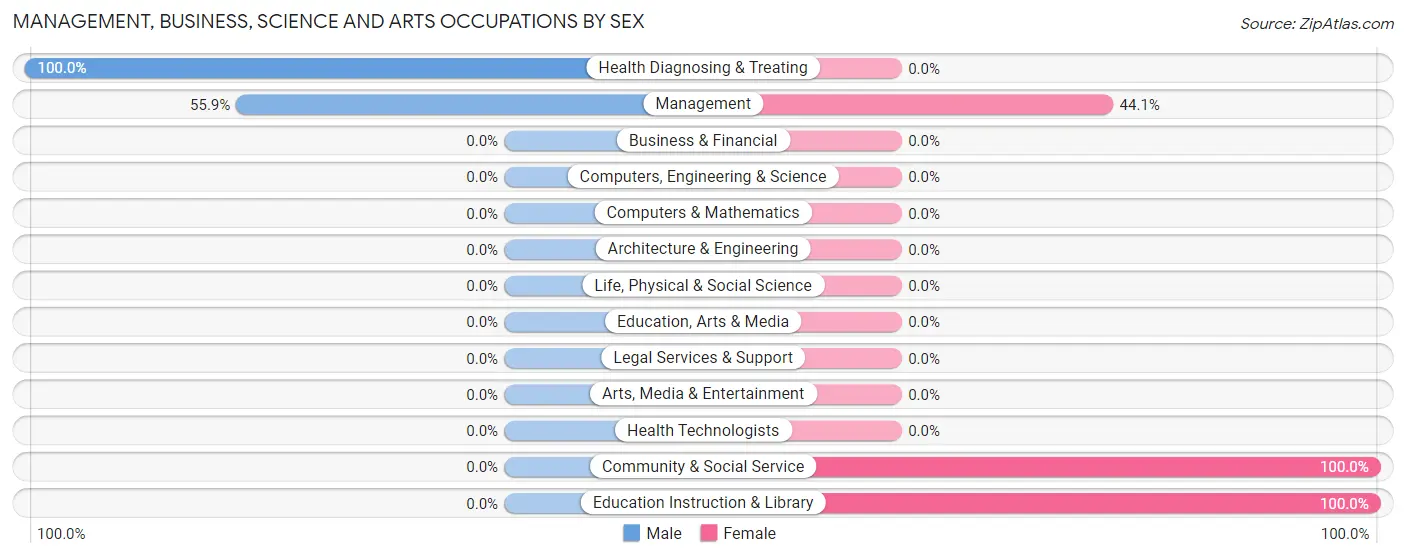
The most common Management, Business, Science and Arts occupations in Shandon are Management (34 | 7.2%), Community & Social Service (13 | 2.8%), Education Instruction & Library (13 | 2.8%), and Health Diagnosing & Treating (10 | 2.1%).
Management, Business, Science and Arts Occupations by Sex
Within the Management, Business, Science and Arts occupations in Shandon, the most male-oriented occupations are Health Diagnosing & Treating (100.0%), and Management (55.9%), while the most female-oriented occupations are Community & Social Service (100.0%), Education Instruction & Library (100.0%), and Management (44.1%).
| Occupation | Male | Female |
| Management | 19 (55.9%) | 15 (44.1%) |
| Business & Financial | 0 (0.0%) | 0 (0.0%) |
| Computers, Engineering & Science | 0 (0.0%) | 0 (0.0%) |
| Computers & Mathematics | 0 (0.0%) | 0 (0.0%) |
| Architecture & Engineering | 0 (0.0%) | 0 (0.0%) |
| Life, Physical & Social Science | 0 (0.0%) | 0 (0.0%) |
| Community & Social Service | 0 (0.0%) | 13 (100.0%) |
| Education, Arts & Media | 0 (0.0%) | 0 (0.0%) |
| Legal Services & Support | 0 (0.0%) | 0 (0.0%) |
| Education Instruction & Library | 0 (0.0%) | 13 (100.0%) |
| Arts, Media & Entertainment | 0 (0.0%) | 0 (0.0%) |
| Health Diagnosing & Treating | 10 (100.0%) | 0 (0.0%) |
| Health Technologists | 0 (0.0%) | 0 (0.0%) |
| Total (Category) | 29 (50.9%) | 28 (49.1%) |
| Total (Overall) | 282 (59.8%) | 190 (40.3%) |
Services Occupations
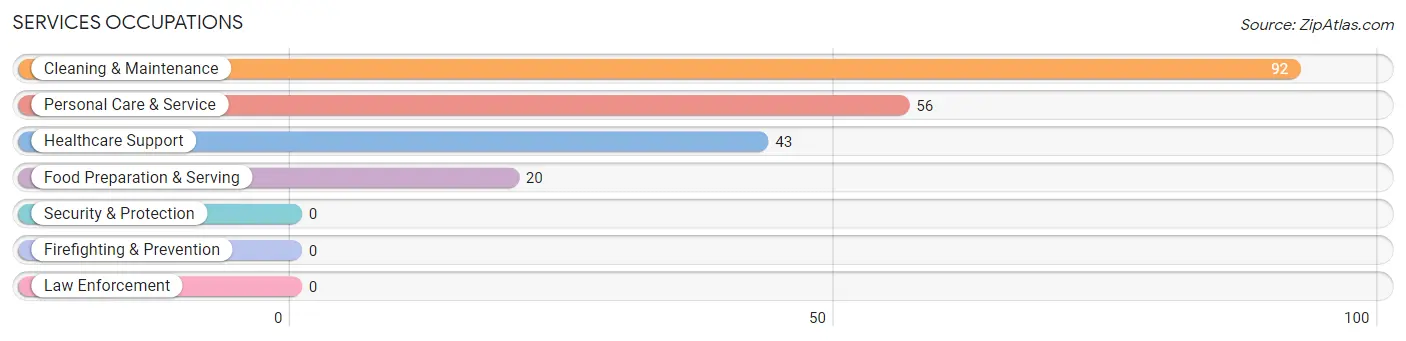
The most common Services occupations in Shandon are Cleaning & Maintenance (92 | 19.5%), Personal Care & Service (56 | 11.9%), Healthcare Support (43 | 9.1%), and Food Preparation & Serving (20 | 4.2%).
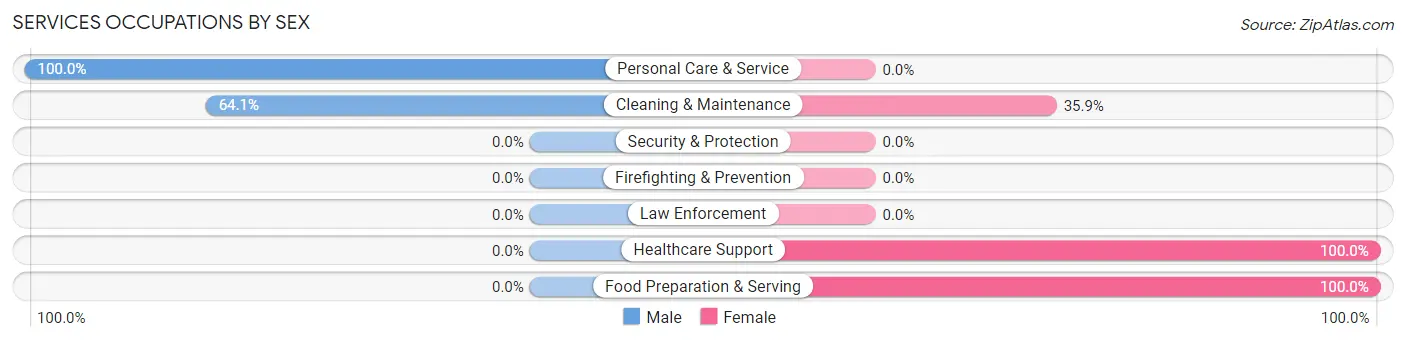
Services Occupations by Sex
Within the Services occupations in Shandon, the most male-oriented occupations are Personal Care & Service (100.0%), and Cleaning & Maintenance (64.1%), while the most female-oriented occupations are Healthcare Support (100.0%), Food Preparation & Serving (100.0%), and Cleaning & Maintenance (35.9%).
| Occupation | Male | Female |
| Healthcare Support | 0 (0.0%) | 43 (100.0%) |
| Security & Protection | 0 (0.0%) | 0 (0.0%) |
| Firefighting & Prevention | 0 (0.0%) | 0 (0.0%) |
| Law Enforcement | 0 (0.0%) | 0 (0.0%) |
| Food Preparation & Serving | 0 (0.0%) | 20 (100.0%) |
| Cleaning & Maintenance | 59 (64.1%) | 33 (35.9%) |
| Personal Care & Service | 56 (100.0%) | 0 (0.0%) |
| Total (Category) | 115 (54.5%) | 96 (45.5%) |
| Total (Overall) | 282 (59.8%) | 190 (40.3%) |
Sales and Office Occupations
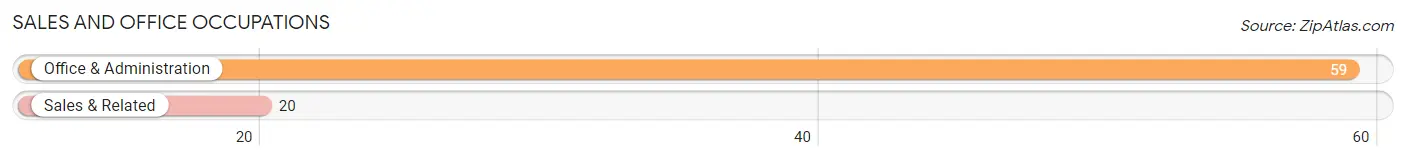
The most common Sales and Office occupations in Shandon are Office & Administration (59 | 12.5%), and Sales & Related (20 | 4.2%).
Sales and Office Occupations by Sex
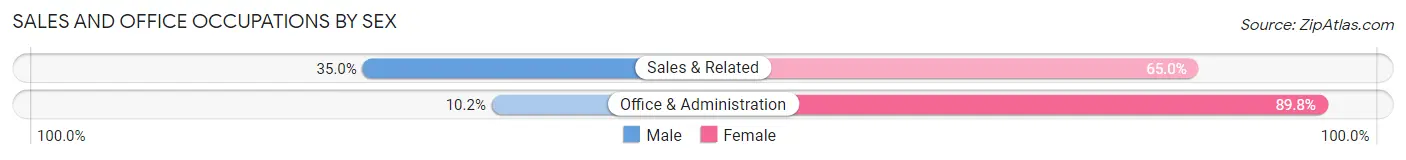
| Occupation | Male | Female |
| Sales & Related | 7 (35.0%) | 13 (65.0%) |
| Office & Administration | 6 (10.2%) | 53 (89.8%) |
| Total (Category) | 13 (16.5%) | 66 (83.5%) |
| Total (Overall) | 282 (59.8%) | 190 (40.3%) |
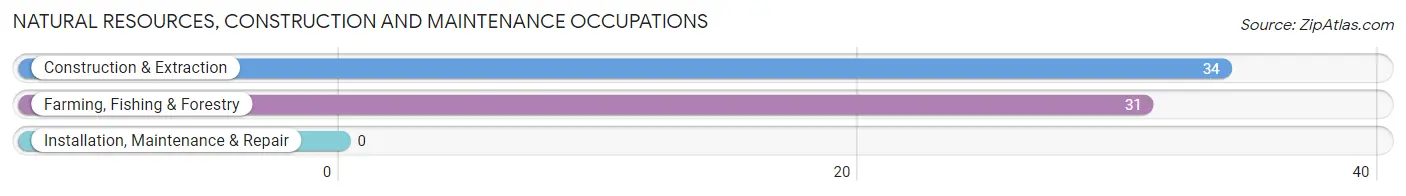
Natural Resources, Construction and Maintenance Occupations
The most common Natural Resources, Construction and Maintenance occupations in Shandon are Construction & Extraction (34 | 7.2%), and Farming, Fishing & Forestry (31 | 6.6%).
Natural Resources, Construction and Maintenance Occupations by Sex
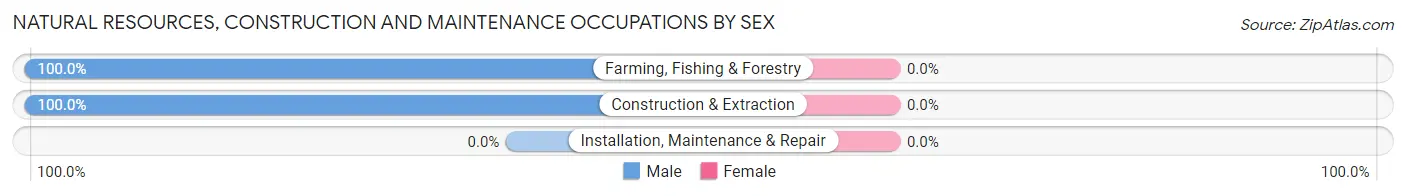
| Occupation | Male | Female |
| Farming, Fishing & Forestry | 31 (100.0%) | 0 (0.0%) |
| Construction & Extraction | 34 (100.0%) | 0 (0.0%) |
| Installation, Maintenance & Repair | 0 (0.0%) | 0 (0.0%) |
| Total (Category) | 65 (100.0%) | 0 (0.0%) |
| Total (Overall) | 282 (59.8%) | 190 (40.3%) |
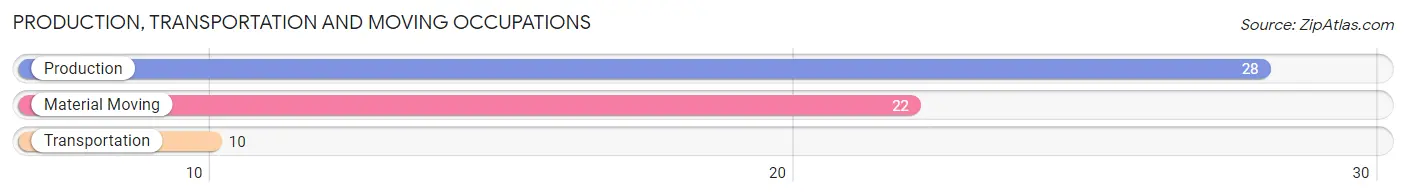
Production, Transportation and Moving Occupations
The most common Production, Transportation and Moving occupations in Shandon are Production (28 | 5.9%), Material Moving (22 | 4.7%), and Transportation (10 | 2.1%).
Production, Transportation and Moving Occupations by Sex
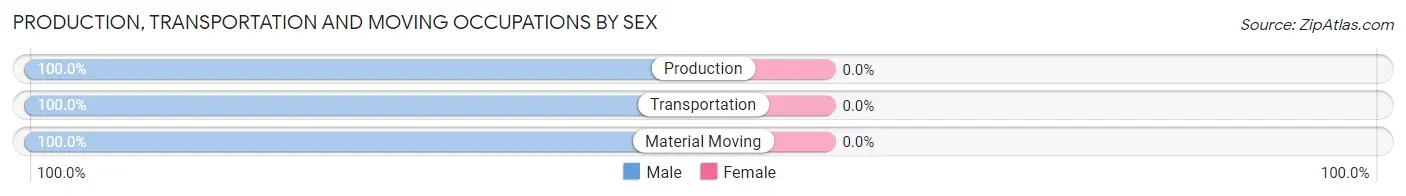
| Occupation | Male | Female |
| Production | 28 (100.0%) | 0 (0.0%) |
| Transportation | 10 (100.0%) | 0 (0.0%) |
| Material Moving | 22 (100.0%) | 0 (0.0%) |
| Total (Category) | 60 (100.0%) | 0 (0.0%) |
| Total (Overall) | 282 (59.8%) | 190 (40.3%) |
Employment Industries by Sex in Shandon
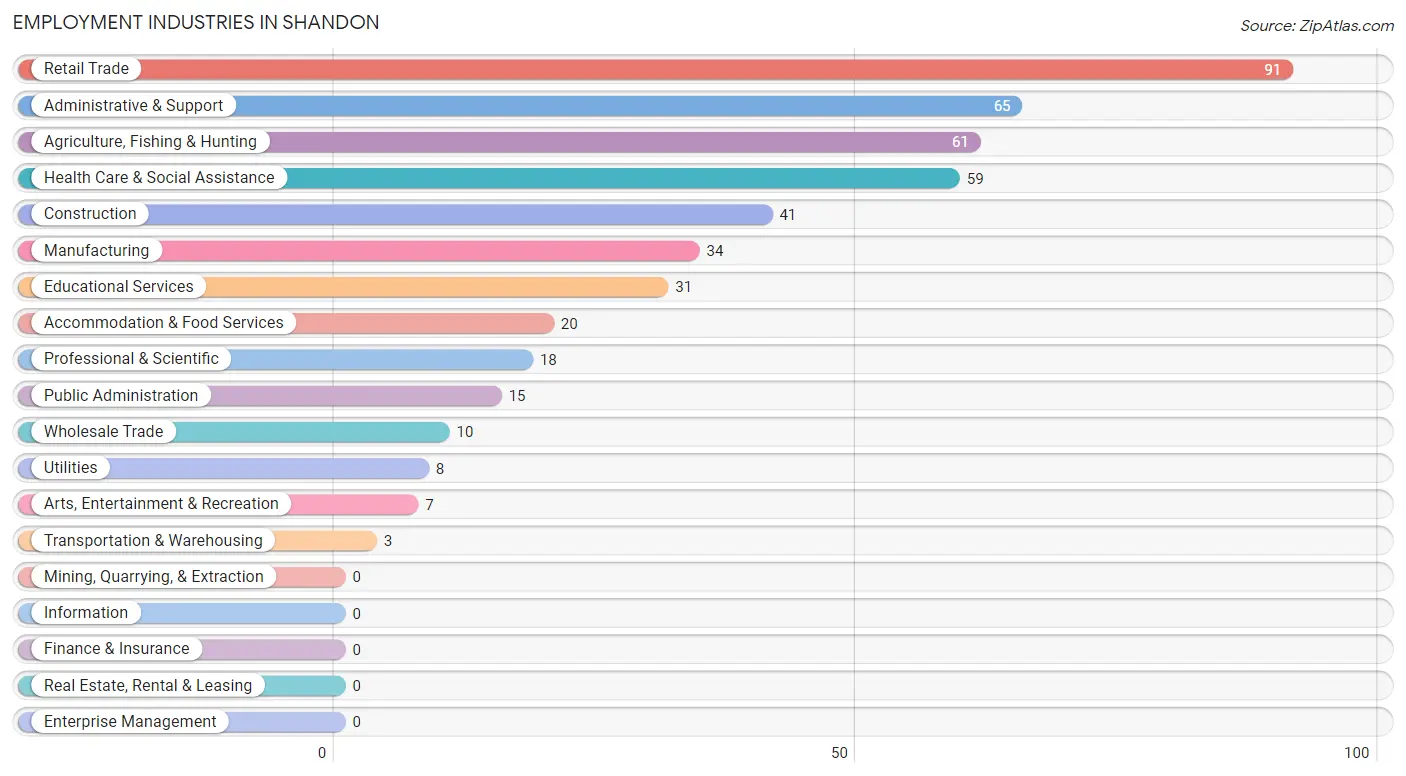
Employment Industries in Shandon
The major employment industries in Shandon include Retail Trade (91 | 19.3%), Administrative & Support (65 | 13.8%), Agriculture, Fishing & Hunting (61 | 12.9%), Health Care & Social Assistance (59 | 12.5%), and Construction (41 | 8.7%).
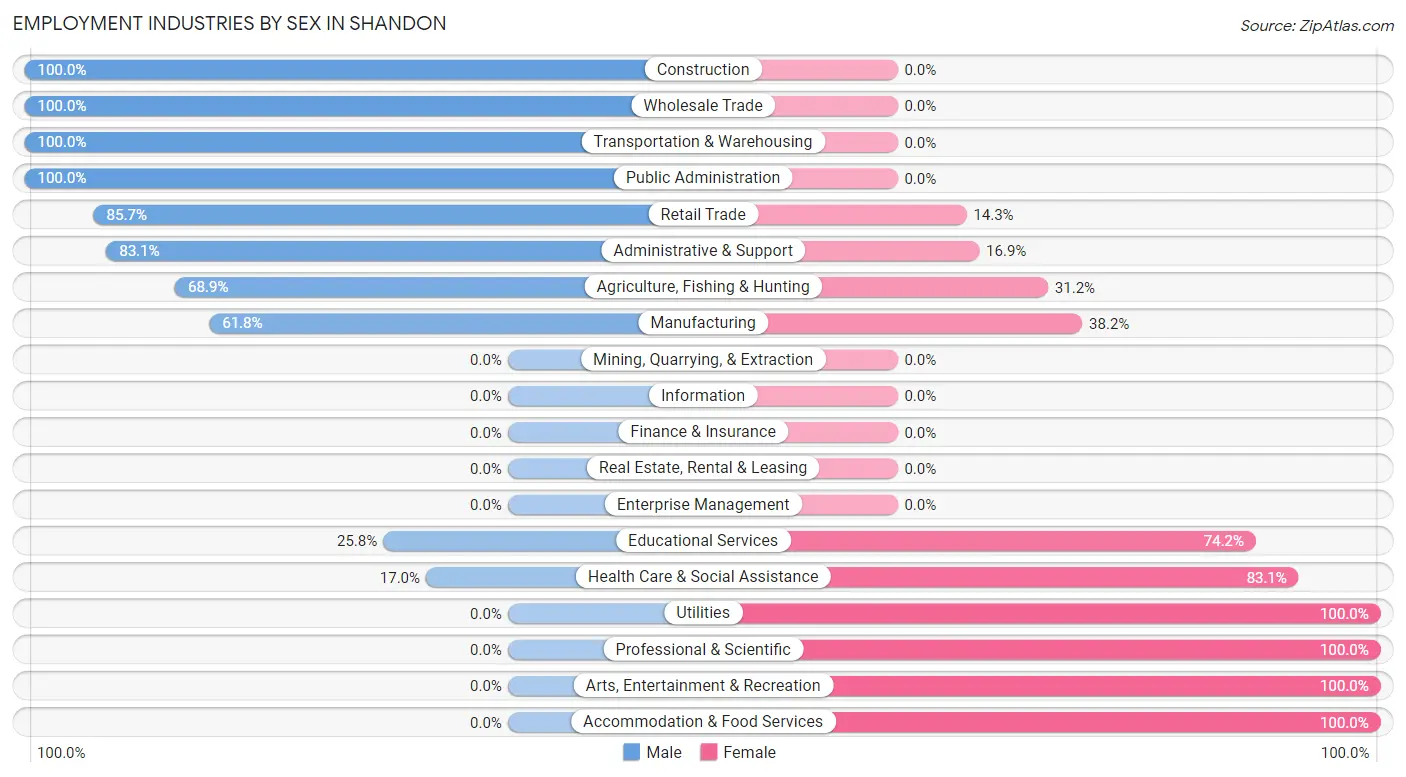
Employment Industries by Sex in Shandon
The Shandon industries that see more men than women are Construction (100.0%), Wholesale Trade (100.0%), and Transportation & Warehousing (100.0%), whereas the industries that tend to have a higher number of women are Utilities (100.0%), Professional & Scientific (100.0%), and Arts, Entertainment & Recreation (100.0%).
| Industry | Male | Female |
| Agriculture, Fishing & Hunting | 42 (68.9%) | 19 (31.1%) |
| Mining, Quarrying, & Extraction | 0 (0.0%) | 0 (0.0%) |
| Construction | 41 (100.0%) | 0 (0.0%) |
| Manufacturing | 21 (61.8%) | 13 (38.2%) |
| Wholesale Trade | 10 (100.0%) | 0 (0.0%) |
| Retail Trade | 78 (85.7%) | 13 (14.3%) |
| Transportation & Warehousing | 3 (100.0%) | 0 (0.0%) |
| Utilities | 0 (0.0%) | 8 (100.0%) |
| Information | 0 (0.0%) | 0 (0.0%) |
| Finance & Insurance | 0 (0.0%) | 0 (0.0%) |
| Real Estate, Rental & Leasing | 0 (0.0%) | 0 (0.0%) |
| Professional & Scientific | 0 (0.0%) | 18 (100.0%) |
| Enterprise Management | 0 (0.0%) | 0 (0.0%) |
| Administrative & Support | 54 (83.1%) | 11 (16.9%) |
| Educational Services | 8 (25.8%) | 23 (74.2%) |
| Health Care & Social Assistance | 10 (17.0%) | 49 (83.1%) |
| Arts, Entertainment & Recreation | 0 (0.0%) | 7 (100.0%) |
| Accommodation & Food Services | 0 (0.0%) | 20 (100.0%) |
| Public Administration | 15 (100.0%) | 0 (0.0%) |
| Total | 282 (59.8%) | 190 (40.3%) |
Education in Shandon
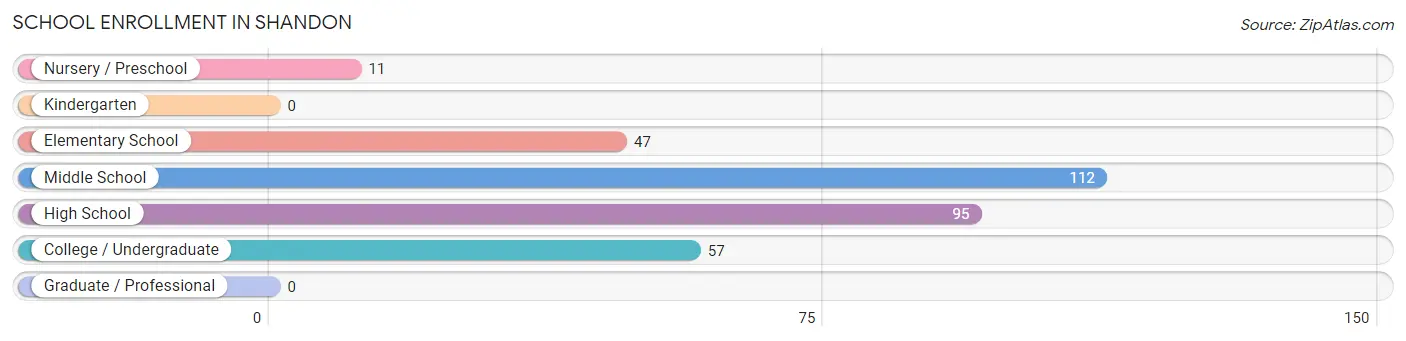
School Enrollment in Shandon
The most common levels of schooling among the 322 students in Shandon are middle school (112 | 34.8%), high school (95 | 29.5%), and college / undergraduate (57 | 17.7%).
| School Level | # Students | % Students |
| Nursery / Preschool | 11 | 3.4% |
| Kindergarten | 0 | 0.0% |
| Elementary School | 47 | 14.6% |
| Middle School | 112 | 34.8% |
| High School | 95 | 29.5% |
| College / Undergraduate | 57 | 17.7% |
| Graduate / Professional | 0 | 0.0% |
| Total | 322 | 100.0% |
School Enrollment by Age by Funding Source in Shandon
Out of a total of 322 students who are enrolled in schools in Shandon, 3 (0.9%) attend a private institution, while the remaining 319 (99.1%) are enrolled in public schools. The age group of 10 to 14 year olds has the highest likelihood of being enrolled in private schools, with 3 (2.3% in the age bracket) enrolled. Conversely, the age group of 3 to 4 year olds has the lowest likelihood of being enrolled in a private school, with 11 (100.0% in the age bracket) attending a public institution.
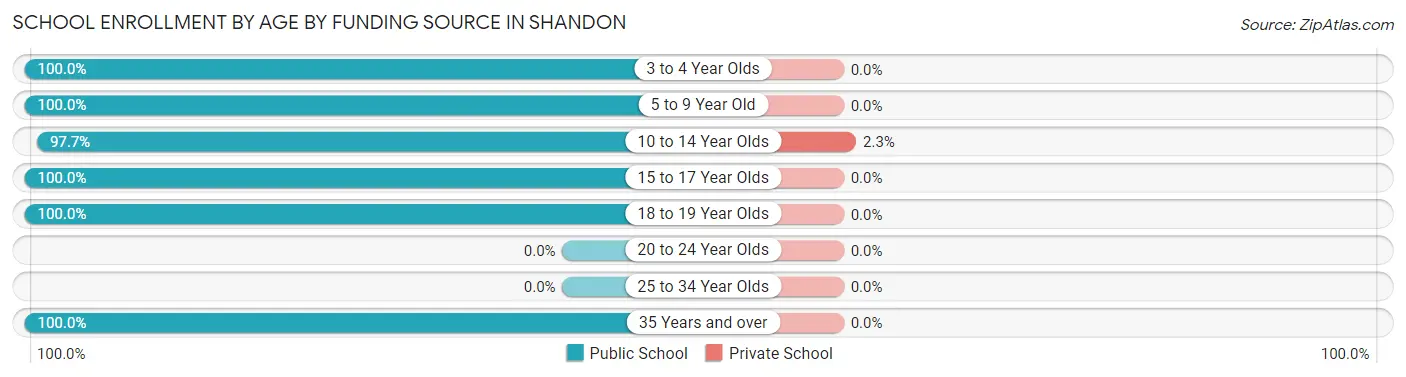
| Age Bracket | Public School | Private School |
| 3 to 4 Year Olds | 11 (100.0%) | 0 (0.0%) |
| 5 to 9 Year Old | 35 (100.0%) | 0 (0.0%) |
| 10 to 14 Year Olds | 127 (97.7%) | 3 (2.3%) |
| 15 to 17 Year Olds | 78 (100.0%) | 0 (0.0%) |
| 18 to 19 Year Olds | 61 (100.0%) | 0 (0.0%) |
| 20 to 24 Year Olds | 0 (0.0%) | 0 (0.0%) |
| 25 to 34 Year Olds | 0 (0.0%) | 0 (0.0%) |
| 35 Years and over | 7 (100.0%) | 0 (0.0%) |
| Total | 319 (99.1%) | 3 (0.9%) |
Educational Attainment by Field of Study in Shandon
Communications (20 | 30.8%), arts & humanities (12 | 18.5%), visual & performing arts (9 | 13.9%), science & technology (8 | 12.3%), and literature & languages (8 | 12.3%) are the most common fields of study among 65 individuals in Shandon who have obtained a bachelor's degree or higher.
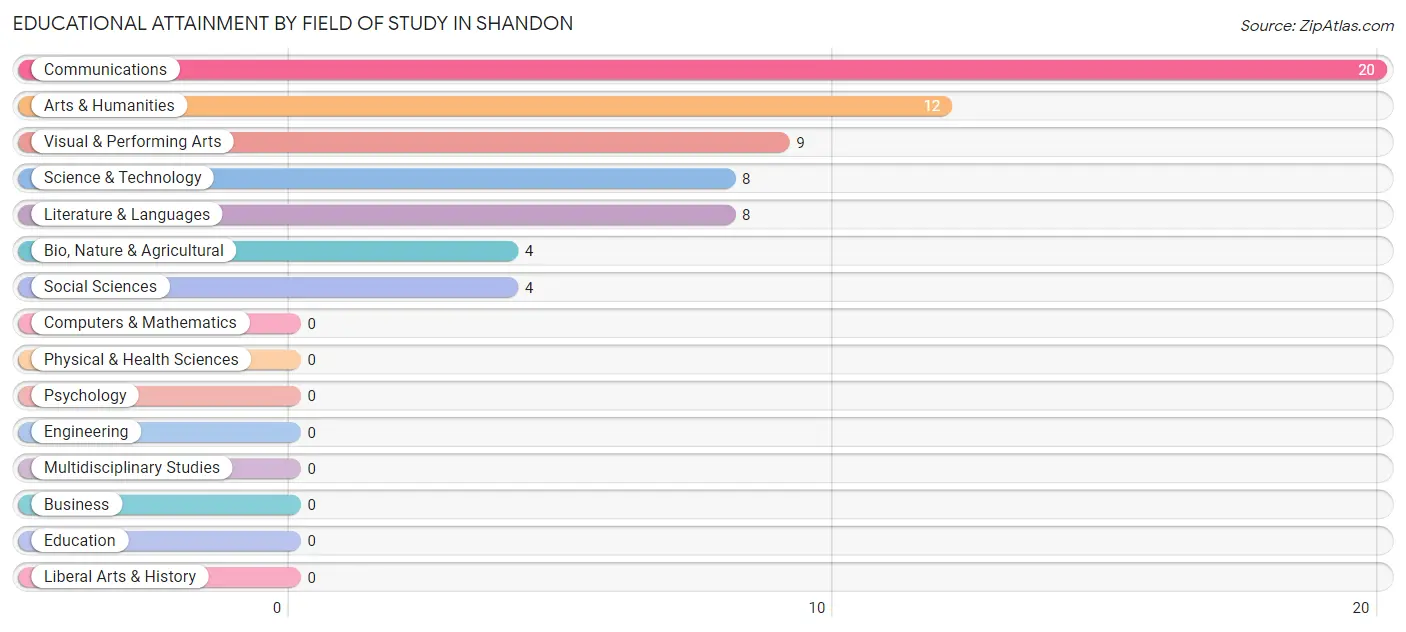
| Field of Study | # Graduates | % Graduates |
| Computers & Mathematics | 0 | 0.0% |
| Bio, Nature & Agricultural | 4 | 6.1% |
| Physical & Health Sciences | 0 | 0.0% |
| Psychology | 0 | 0.0% |
| Social Sciences | 4 | 6.1% |
| Engineering | 0 | 0.0% |
| Multidisciplinary Studies | 0 | 0.0% |
| Science & Technology | 8 | 12.3% |
| Business | 0 | 0.0% |
| Education | 0 | 0.0% |
| Literature & Languages | 8 | 12.3% |
| Liberal Arts & History | 0 | 0.0% |
| Visual & Performing Arts | 9 | 13.9% |
| Communications | 20 | 30.8% |
| Arts & Humanities | 12 | 18.5% |
| Total | 65 | 100.0% |
Transportation & Commute in Shandon
Vehicle Availability by Sex in Shandon
The most prevalent vehicle ownership categories in Shandon are males with 5 or more vehicles (88, accounting for 31.2%) and females with 5 or more vehicles (26, making up 46.3%).
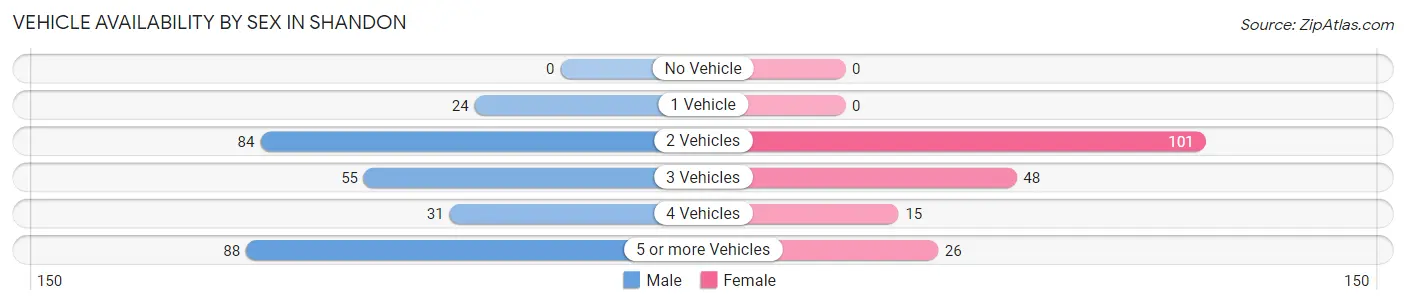
| Vehicles Available | Male | Female |
| No Vehicle | 0 (0.0%) | 0 (0.0%) |
| 1 Vehicle | 24 (8.5%) | 0 (0.0%) |
| 2 Vehicles | 84 (29.8%) | 101 (53.2%) |
| 3 Vehicles | 55 (19.5%) | 48 (25.3%) |
| 4 Vehicles | 31 (11.0%) | 15 (7.9%) |
| 5 or more Vehicles | 88 (31.2%) | 26 (13.7%) |
| Total | 282 (100.0%) | 190 (100.0%) |
Commute Time in Shandon
The most frequently occuring commute durations in Shandon are 30 to 34 minutes (83 commuters, 18.3%), 60 to 89 minutes (78 commuters, 17.2%), and 20 to 24 minutes (72 commuters, 15.9%).
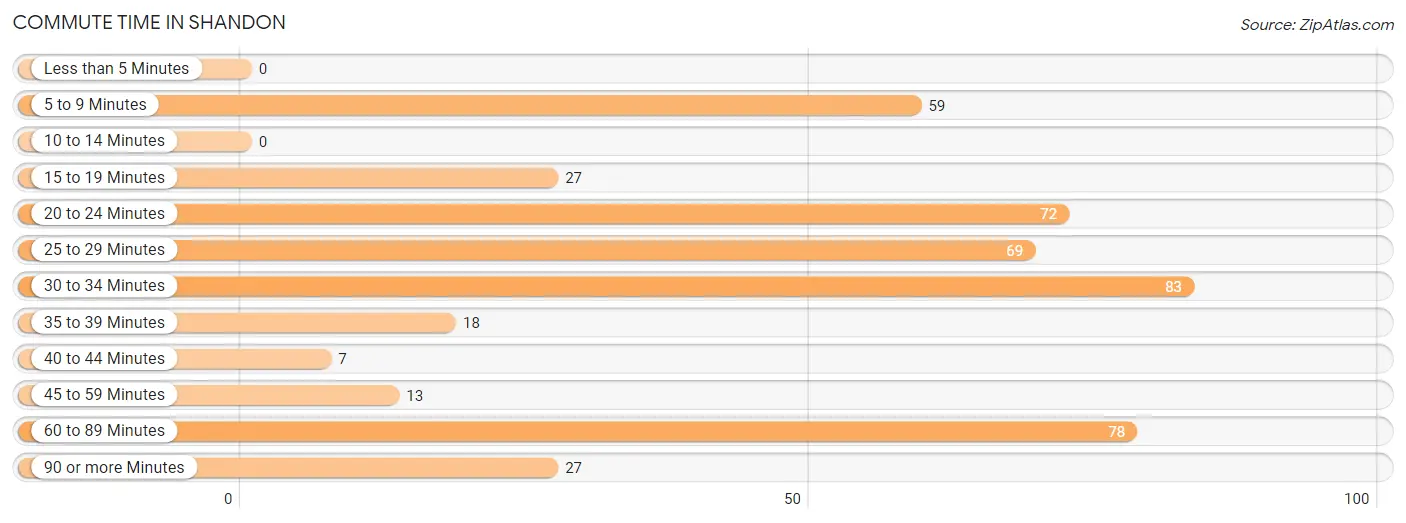
| Commute Time | # Commuters | % Commuters |
| Less than 5 Minutes | 0 | 0.0% |
| 5 to 9 Minutes | 59 | 13.0% |
| 10 to 14 Minutes | 0 | 0.0% |
| 15 to 19 Minutes | 27 | 6.0% |
| 20 to 24 Minutes | 72 | 15.9% |
| 25 to 29 Minutes | 69 | 15.2% |
| 30 to 34 Minutes | 83 | 18.3% |
| 35 to 39 Minutes | 18 | 4.0% |
| 40 to 44 Minutes | 7 | 1.5% |
| 45 to 59 Minutes | 13 | 2.9% |
| 60 to 89 Minutes | 78 | 17.2% |
| 90 or more Minutes | 27 | 6.0% |
Commute Time by Sex in Shandon
The most common commute times in Shandon are 60 to 89 minutes (69 commuters, 24.5%) for males and 25 to 29 minutes (39 commuters, 22.8%) for females.
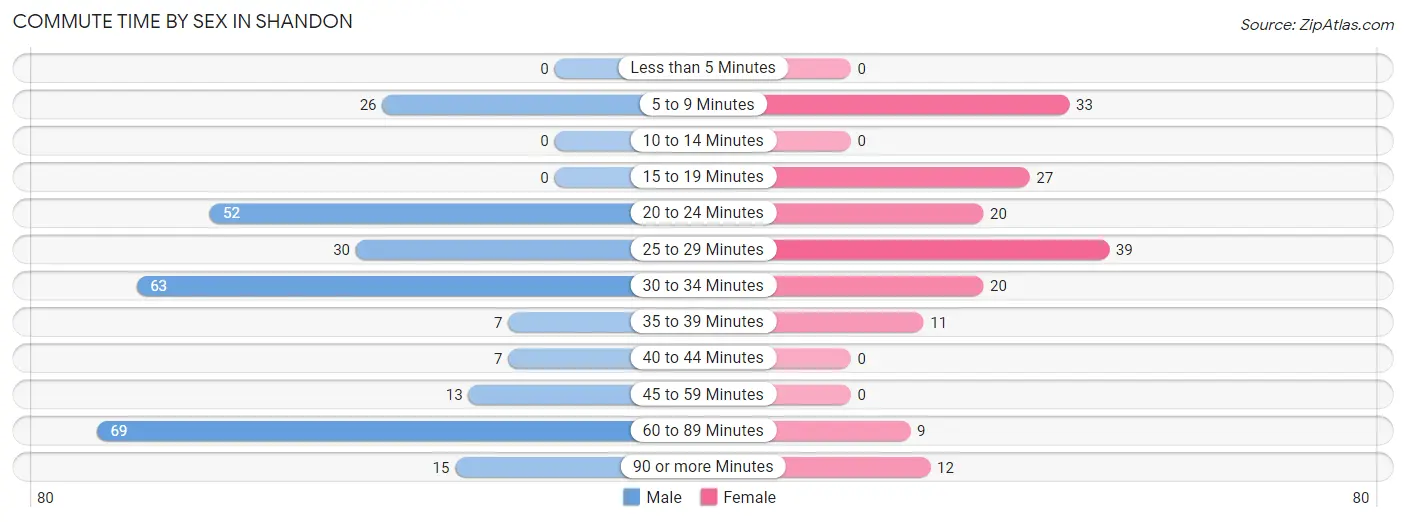
| Commute Time | Male | Female |
| Less than 5 Minutes | 0 (0.0%) | 0 (0.0%) |
| 5 to 9 Minutes | 26 (9.2%) | 33 (19.3%) |
| 10 to 14 Minutes | 0 (0.0%) | 0 (0.0%) |
| 15 to 19 Minutes | 0 (0.0%) | 27 (15.8%) |
| 20 to 24 Minutes | 52 (18.4%) | 20 (11.7%) |
| 25 to 29 Minutes | 30 (10.6%) | 39 (22.8%) |
| 30 to 34 Minutes | 63 (22.3%) | 20 (11.7%) |
| 35 to 39 Minutes | 7 (2.5%) | 11 (6.4%) |
| 40 to 44 Minutes | 7 (2.5%) | 0 (0.0%) |
| 45 to 59 Minutes | 13 (4.6%) | 0 (0.0%) |
| 60 to 89 Minutes | 69 (24.5%) | 9 (5.3%) |
| 90 or more Minutes | 15 (5.3%) | 12 (7.0%) |
Time of Departure to Work by Sex in Shandon
The most frequent times of departure to work in Shandon are 6:00 AM to 6:29 AM (68, 24.1%) for males and 10:00 AM to 10:59 AM (39, 22.8%) for females.
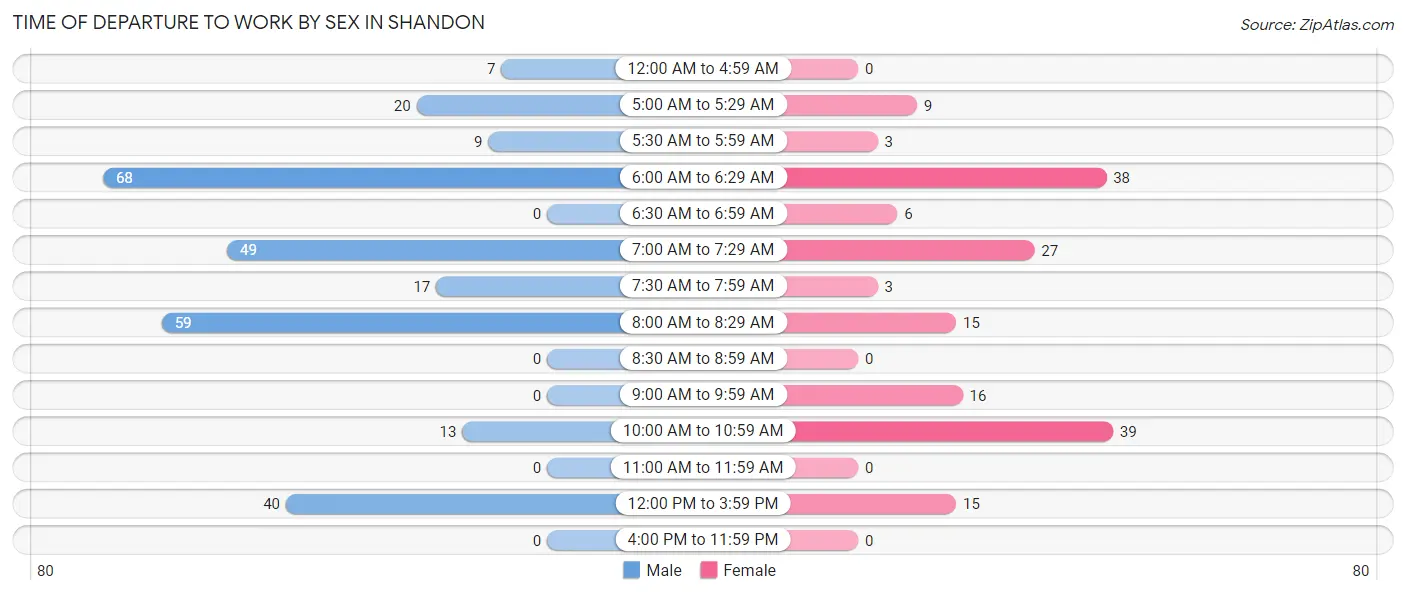
| Time of Departure | Male | Female |
| 12:00 AM to 4:59 AM | 7 (2.5%) | 0 (0.0%) |
| 5:00 AM to 5:29 AM | 20 (7.1%) | 9 (5.3%) |
| 5:30 AM to 5:59 AM | 9 (3.2%) | 3 (1.8%) |
| 6:00 AM to 6:29 AM | 68 (24.1%) | 38 (22.2%) |
| 6:30 AM to 6:59 AM | 0 (0.0%) | 6 (3.5%) |
| 7:00 AM to 7:29 AM | 49 (17.4%) | 27 (15.8%) |
| 7:30 AM to 7:59 AM | 17 (6.0%) | 3 (1.8%) |
| 8:00 AM to 8:29 AM | 59 (20.9%) | 15 (8.8%) |
| 8:30 AM to 8:59 AM | 0 (0.0%) | 0 (0.0%) |
| 9:00 AM to 9:59 AM | 0 (0.0%) | 16 (9.4%) |
| 10:00 AM to 10:59 AM | 13 (4.6%) | 39 (22.8%) |
| 11:00 AM to 11:59 AM | 0 (0.0%) | 0 (0.0%) |
| 12:00 PM to 3:59 PM | 40 (14.2%) | 15 (8.8%) |
| 4:00 PM to 11:59 PM | 0 (0.0%) | 0 (0.0%) |
| Total | 282 (100.0%) | 171 (100.0%) |
Housing Occupancy in Shandon
Occupancy by Ownership in Shandon
Of the total 323 dwellings in Shandon, owner-occupied units account for 243 (75.2%), while renter-occupied units make up 80 (24.8%).
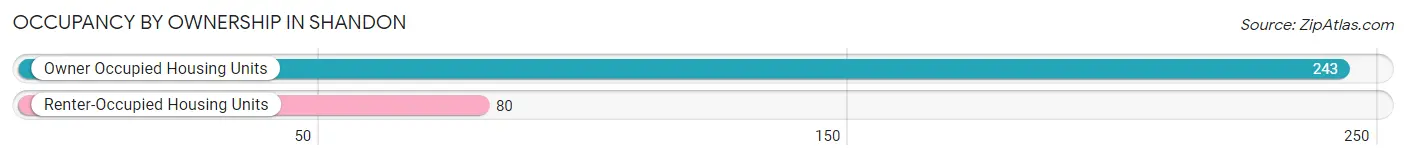
| Occupancy | # Housing Units | % Housing Units |
| Owner Occupied Housing Units | 243 | 75.2% |
| Renter-Occupied Housing Units | 80 | 24.8% |
| Total Occupied Housing Units | 323 | 100.0% |
Occupancy by Household Size in Shandon
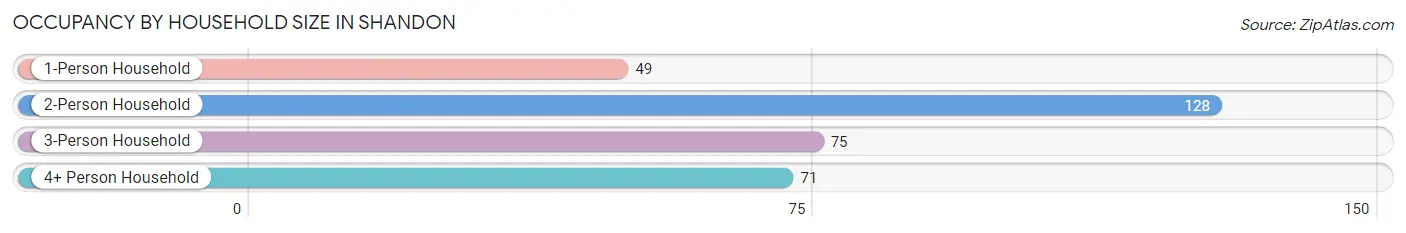
| Household Size | # Housing Units | % Housing Units |
| 1-Person Household | 49 | 15.2% |
| 2-Person Household | 128 | 39.6% |
| 3-Person Household | 75 | 23.2% |
| 4+ Person Household | 71 | 22.0% |
| Total Housing Units | 323 | 100.0% |
Occupancy by Ownership by Household Size in Shandon
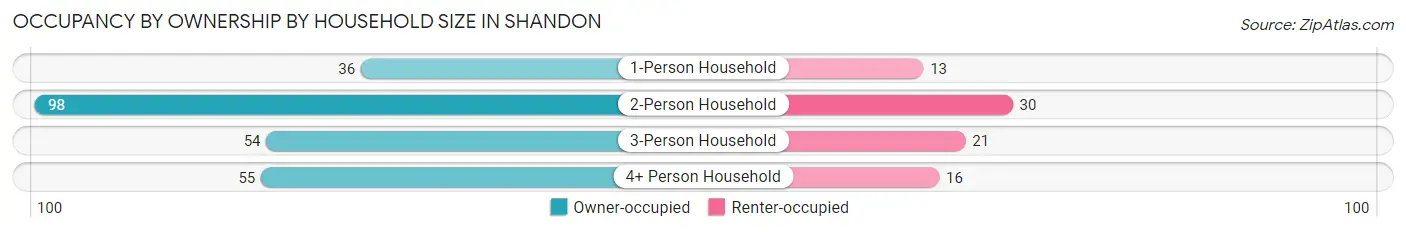
| Household Size | Owner-occupied | Renter-occupied |
| 1-Person Household | 36 (73.5%) | 13 (26.5%) |
| 2-Person Household | 98 (76.6%) | 30 (23.4%) |
| 3-Person Household | 54 (72.0%) | 21 (28.0%) |
| 4+ Person Household | 55 (77.5%) | 16 (22.5%) |
| Total Housing Units | 243 (75.2%) | 80 (24.8%) |
Occupancy by Educational Attainment in Shandon
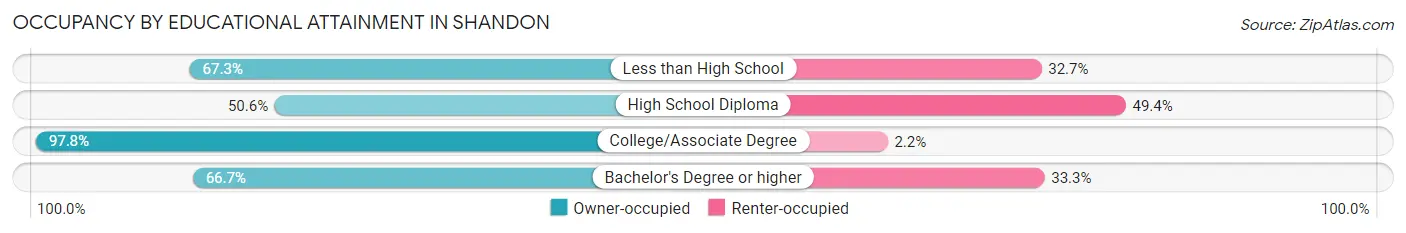
| Household Size | Owner-occupied | Renter-occupied |
| Less than High School | 37 (67.3%) | 18 (32.7%) |
| High School Diploma | 45 (50.6%) | 44 (49.4%) |
| College/Associate Degree | 131 (97.8%) | 3 (2.2%) |
| Bachelor's Degree or higher | 30 (66.7%) | 15 (33.3%) |
Occupancy by Age of Householder in Shandon
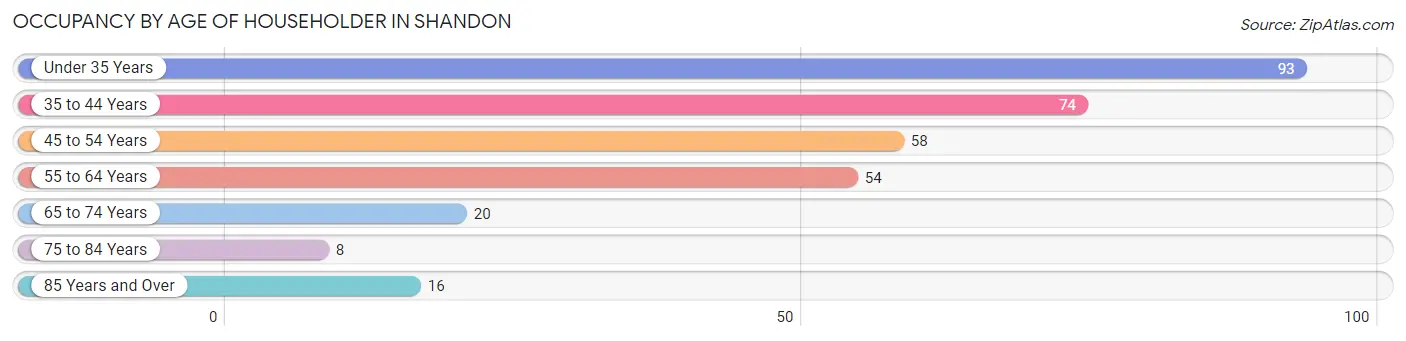
| Age Bracket | # Households | % Households |
| Under 35 Years | 93 | 28.8% |
| 35 to 44 Years | 74 | 22.9% |
| 45 to 54 Years | 58 | 18.0% |
| 55 to 64 Years | 54 | 16.7% |
| 65 to 74 Years | 20 | 6.2% |
| 75 to 84 Years | 8 | 2.5% |
| 85 Years and Over | 16 | 5.0% |
| Total | 323 | 100.0% |
Housing Finances in Shandon
Median Income by Occupancy in Shandon
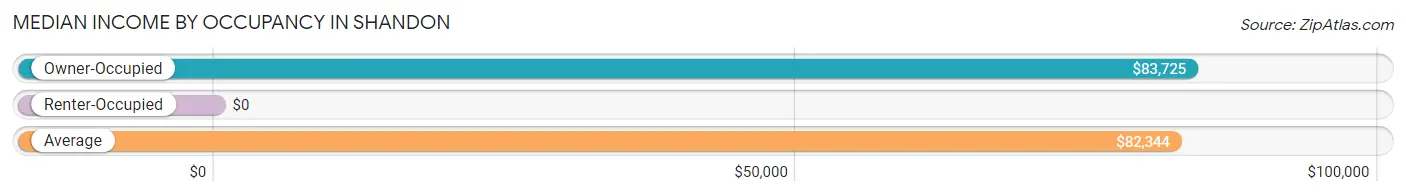
| Occupancy Type | # Households | Median Income |
| Owner-Occupied | 243 (75.2%) | $83,725 |
| Renter-Occupied | 80 (24.8%) | $0 |
| Average | 323 (100.0%) | $82,344 |
Occupancy by Householder Income Bracket in Shandon
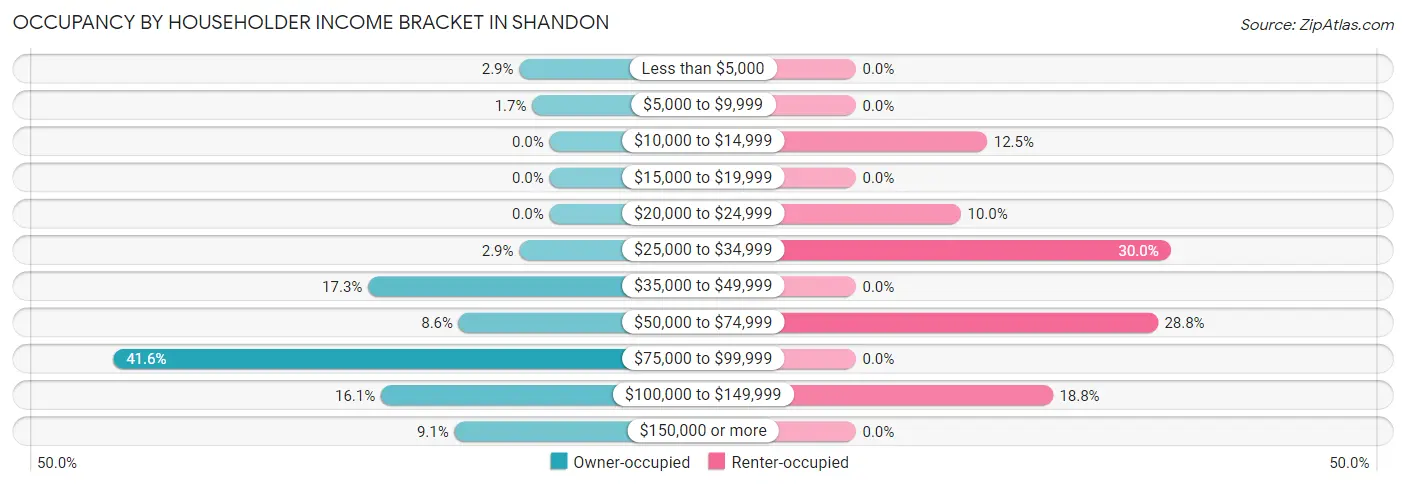
| Income Bracket | Owner-occupied | Renter-occupied |
| Less than $5,000 | 7 (2.9%) | 0 (0.0%) |
| $5,000 to $9,999 | 4 (1.7%) | 0 (0.0%) |
| $10,000 to $14,999 | 0 (0.0%) | 10 (12.5%) |
| $15,000 to $19,999 | 0 (0.0%) | 0 (0.0%) |
| $20,000 to $24,999 | 0 (0.0%) | 8 (10.0%) |
| $25,000 to $34,999 | 7 (2.9%) | 24 (30.0%) |
| $35,000 to $49,999 | 42 (17.3%) | 0 (0.0%) |
| $50,000 to $74,999 | 21 (8.6%) | 23 (28.7%) |
| $75,000 to $99,999 | 101 (41.6%) | 0 (0.0%) |
| $100,000 to $149,999 | 39 (16.1%) | 15 (18.8%) |
| $150,000 or more | 22 (9.0%) | 0 (0.0%) |
| Total | 243 (100.0%) | 80 (100.0%) |
Monthly Housing Cost Tiers in Shandon
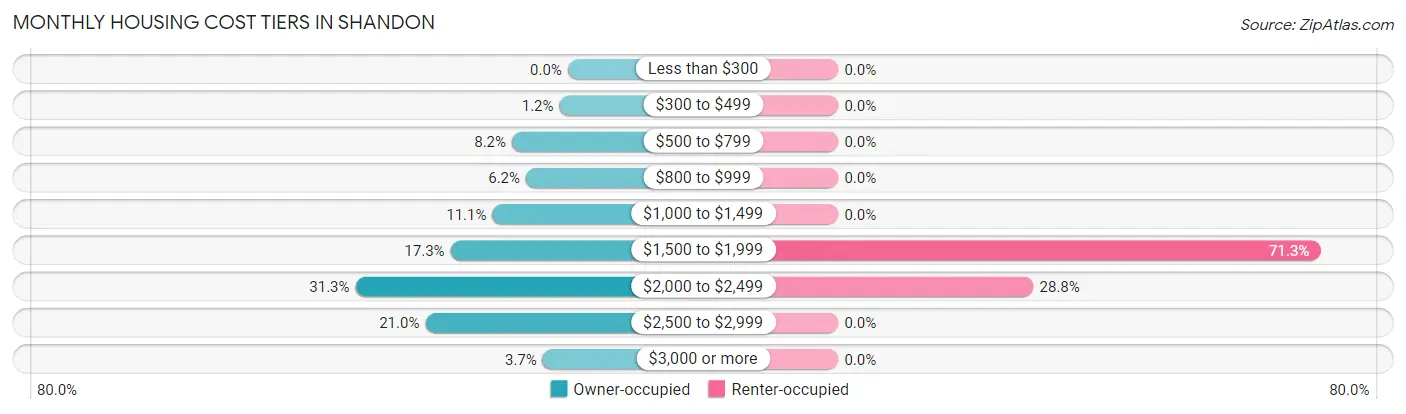
| Monthly Cost | Owner-occupied | Renter-occupied |
| Less than $300 | 0 (0.0%) | 0 (0.0%) |
| $300 to $499 | 3 (1.2%) | 0 (0.0%) |
| $500 to $799 | 20 (8.2%) | 0 (0.0%) |
| $800 to $999 | 15 (6.2%) | 0 (0.0%) |
| $1,000 to $1,499 | 27 (11.1%) | 0 (0.0%) |
| $1,500 to $1,999 | 42 (17.3%) | 57 (71.3%) |
| $2,000 to $2,499 | 76 (31.3%) | 23 (28.7%) |
| $2,500 to $2,999 | 51 (21.0%) | 0 (0.0%) |
| $3,000 or more | 9 (3.7%) | 0 (0.0%) |
| Total | 243 (100.0%) | 80 (100.0%) |
Physical Housing Characteristics in Shandon
Housing Structures in Shandon
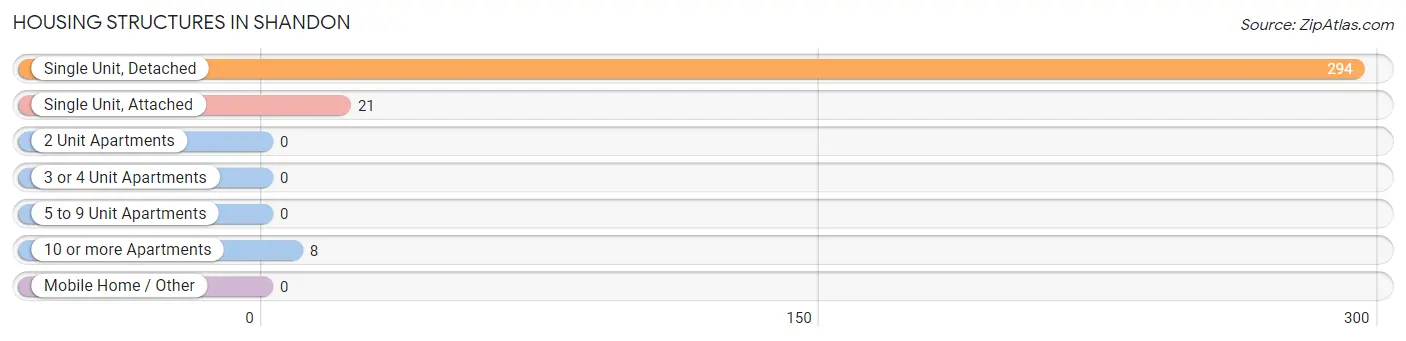
| Structure Type | # Housing Units | % Housing Units |
| Single Unit, Detached | 294 | 91.0% |
| Single Unit, Attached | 21 | 6.5% |
| 2 Unit Apartments | 0 | 0.0% |
| 3 or 4 Unit Apartments | 0 | 0.0% |
| 5 to 9 Unit Apartments | 0 | 0.0% |
| 10 or more Apartments | 8 | 2.5% |
| Mobile Home / Other | 0 | 0.0% |
| Total | 323 | 100.0% |
Housing Structures by Occupancy in Shandon
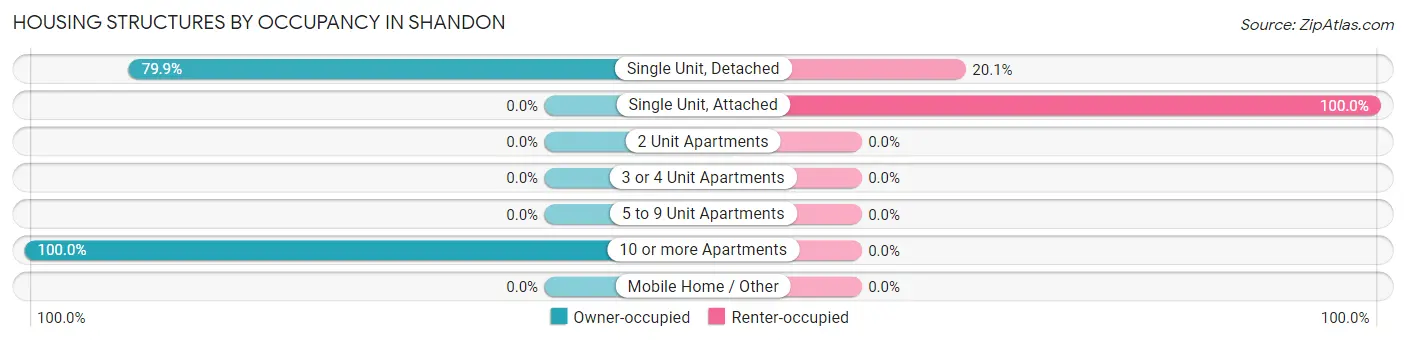
| Structure Type | Owner-occupied | Renter-occupied |
| Single Unit, Detached | 235 (79.9%) | 59 (20.1%) |
| Single Unit, Attached | 0 (0.0%) | 21 (100.0%) |
| 2 Unit Apartments | 0 (0.0%) | 0 (0.0%) |
| 3 or 4 Unit Apartments | 0 (0.0%) | 0 (0.0%) |
| 5 to 9 Unit Apartments | 0 (0.0%) | 0 (0.0%) |
| 10 or more Apartments | 8 (100.0%) | 0 (0.0%) |
| Mobile Home / Other | 0 (0.0%) | 0 (0.0%) |
| Total | 243 (75.2%) | 80 (24.8%) |
Housing Structures by Number of Rooms in Shandon
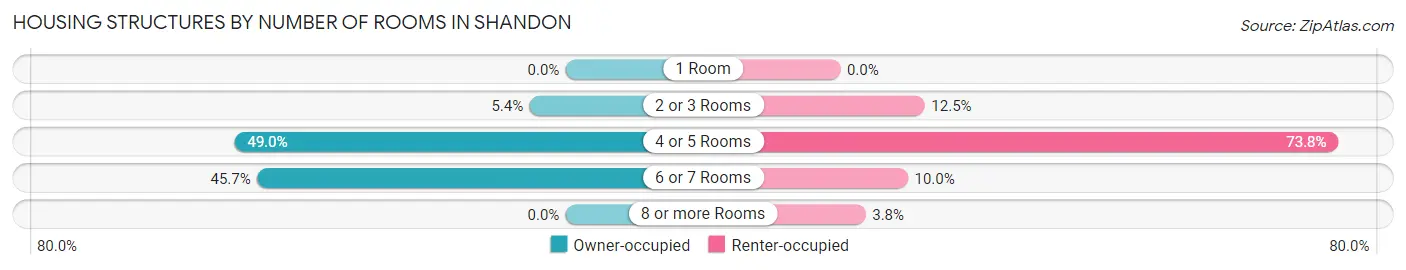
| Number of Rooms | Owner-occupied | Renter-occupied |
| 1 Room | 0 (0.0%) | 0 (0.0%) |
| 2 or 3 Rooms | 13 (5.3%) | 10 (12.5%) |
| 4 or 5 Rooms | 119 (49.0%) | 59 (73.8%) |
| 6 or 7 Rooms | 111 (45.7%) | 8 (10.0%) |
| 8 or more Rooms | 0 (0.0%) | 3 (3.7%) |
| Total | 243 (100.0%) | 80 (100.0%) |
Housing Structure by Heating Type in Shandon
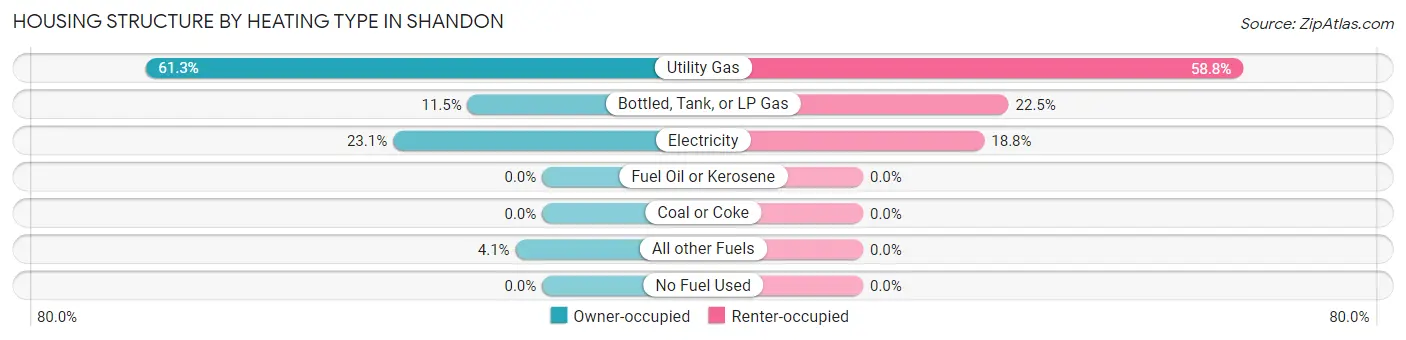
| Heating Type | Owner-occupied | Renter-occupied |
| Utility Gas | 149 (61.3%) | 47 (58.8%) |
| Bottled, Tank, or LP Gas | 28 (11.5%) | 18 (22.5%) |
| Electricity | 56 (23.1%) | 15 (18.8%) |
| Fuel Oil or Kerosene | 0 (0.0%) | 0 (0.0%) |
| Coal or Coke | 0 (0.0%) | 0 (0.0%) |
| All other Fuels | 10 (4.1%) | 0 (0.0%) |
| No Fuel Used | 0 (0.0%) | 0 (0.0%) |
| Total | 243 (100.0%) | 80 (100.0%) |
Household Vehicle Usage in Shandon
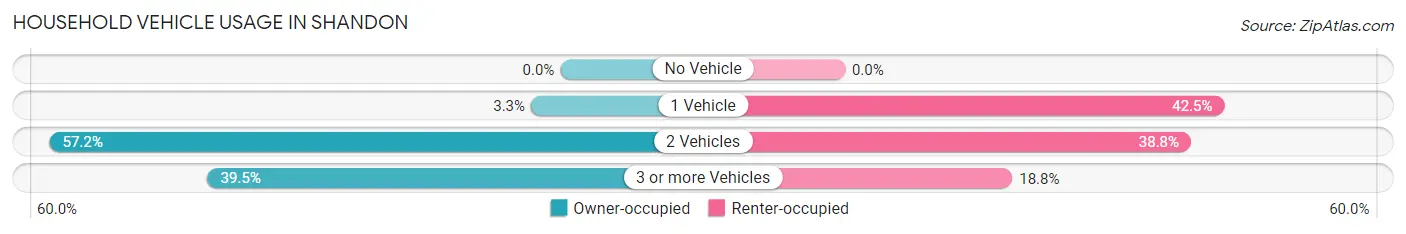
| Vehicles per Household | Owner-occupied | Renter-occupied |
| No Vehicle | 0 (0.0%) | 0 (0.0%) |
| 1 Vehicle | 8 (3.3%) | 34 (42.5%) |
| 2 Vehicles | 139 (57.2%) | 31 (38.8%) |
| 3 or more Vehicles | 96 (39.5%) | 15 (18.8%) |
| Total | 243 (100.0%) | 80 (100.0%) |
Real Estate & Mortgages in Shandon
Real Estate and Mortgage Overview in Shandon
| Characteristic | Without Mortgage | With Mortgage |
| Housing Units | 38 | 205 |
| Median Property Value | $352,200 | $407,100 |
| Median Household Income | - | - |
| Monthly Housing Costs | $580 | $9 |
| Real Estate Taxes | $1,455 | $0 |
Property Value by Mortgage Status in Shandon
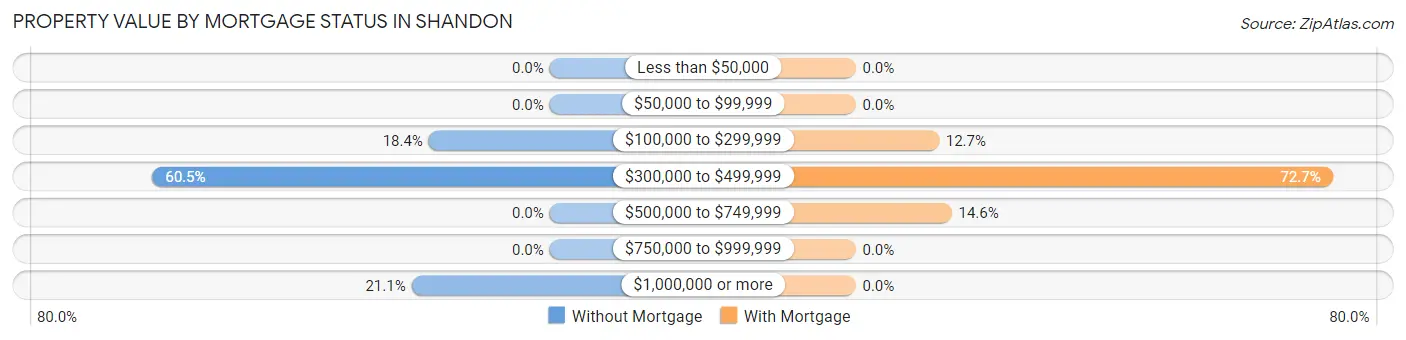
| Property Value | Without Mortgage | With Mortgage |
| Less than $50,000 | 0 (0.0%) | 0 (0.0%) |
| $50,000 to $99,999 | 0 (0.0%) | 0 (0.0%) |
| $100,000 to $299,999 | 7 (18.4%) | 26 (12.7%) |
| $300,000 to $499,999 | 23 (60.5%) | 149 (72.7%) |
| $500,000 to $749,999 | 0 (0.0%) | 30 (14.6%) |
| $750,000 to $999,999 | 0 (0.0%) | 0 (0.0%) |
| $1,000,000 or more | 8 (21.0%) | 0 (0.0%) |
| Total | 38 (100.0%) | 205 (100.0%) |
Household Income by Mortgage Status in Shandon
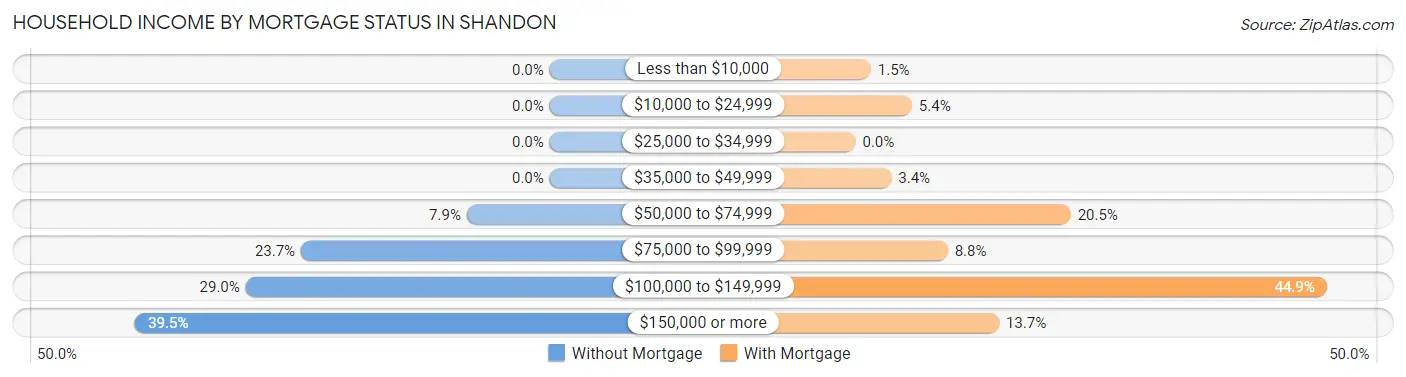
| Household Income | Without Mortgage | With Mortgage |
| Less than $10,000 | 0 (0.0%) | 3 (1.5%) |
| $10,000 to $24,999 | 0 (0.0%) | 11 (5.4%) |
| $25,000 to $34,999 | 0 (0.0%) | 0 (0.0%) |
| $35,000 to $49,999 | 0 (0.0%) | 7 (3.4%) |
| $50,000 to $74,999 | 3 (7.9%) | 42 (20.5%) |
| $75,000 to $99,999 | 9 (23.7%) | 18 (8.8%) |
| $100,000 to $149,999 | 11 (28.9%) | 92 (44.9%) |
| $150,000 or more | 15 (39.5%) | 28 (13.7%) |
| Total | 38 (100.0%) | 205 (100.0%) |
Property Value to Household Income Ratio in Shandon
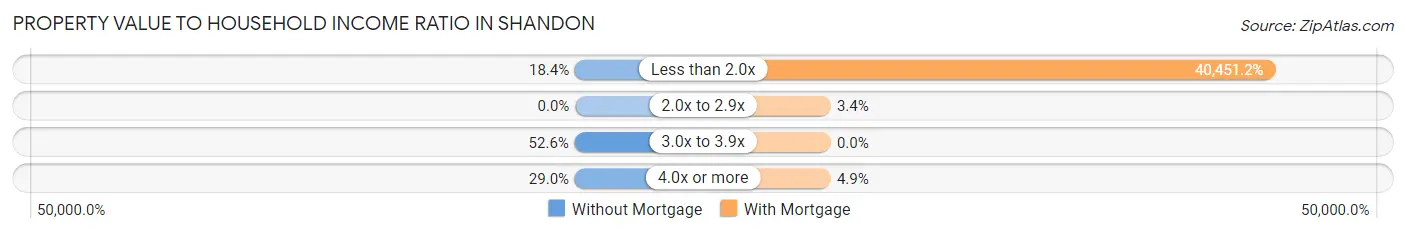
| Value-to-Income Ratio | Without Mortgage | With Mortgage |
| Less than 2.0x | 7 (18.4%) | 82,925 (40,451.2%) |
| 2.0x to 2.9x | 0 (0.0%) | 7 (3.4%) |
| 3.0x to 3.9x | 20 (52.6%) | 0 (0.0%) |
| 4.0x or more | 11 (28.9%) | 10 (4.9%) |
| Total | 38 (100.0%) | 205 (100.0%) |
Real Estate Taxes by Mortgage Status in Shandon
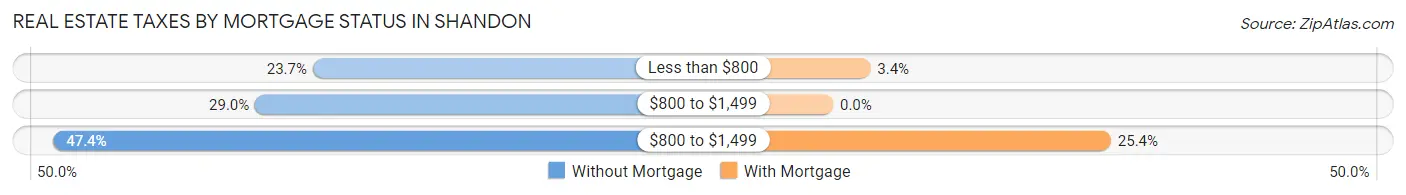
| Property Taxes | Without Mortgage | With Mortgage |
| Less than $800 | 9 (23.7%) | 7 (3.4%) |
| $800 to $1,499 | 11 (28.9%) | 0 (0.0%) |
| $800 to $1,499 | 18 (47.4%) | 52 (25.4%) |
| Total | 38 (100.0%) | 205 (100.0%) |
Health & Disability in Shandon
Health Insurance Coverage by Age in Shandon
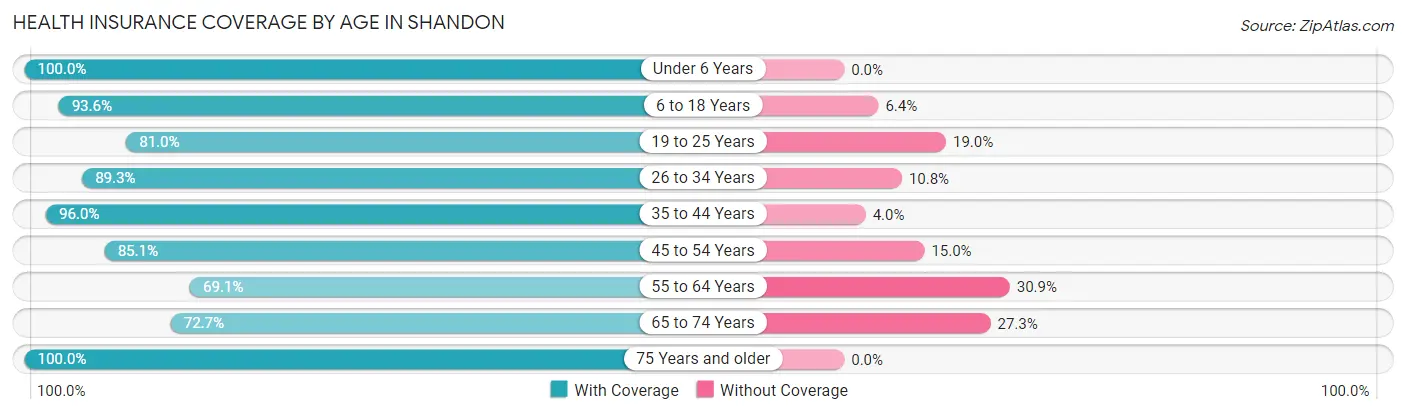
| Age Bracket | With Coverage | Without Coverage |
| Under 6 Years | 39 (100.0%) | 0 (0.0%) |
| 6 to 18 Years | 250 (93.6%) | 17 (6.4%) |
| 19 to 25 Years | 47 (81.0%) | 11 (19.0%) |
| 26 to 34 Years | 166 (89.2%) | 20 (10.7%) |
| 35 to 44 Years | 216 (96.0%) | 9 (4.0%) |
| 45 to 54 Years | 91 (85.1%) | 16 (14.9%) |
| 55 to 64 Years | 56 (69.1%) | 25 (30.9%) |
| 65 to 74 Years | 32 (72.7%) | 12 (27.3%) |
| 75 Years and older | 24 (100.0%) | 0 (0.0%) |
| Total | 921 (89.3%) | 110 (10.7%) |
Health Insurance Coverage by Citizenship Status in Shandon
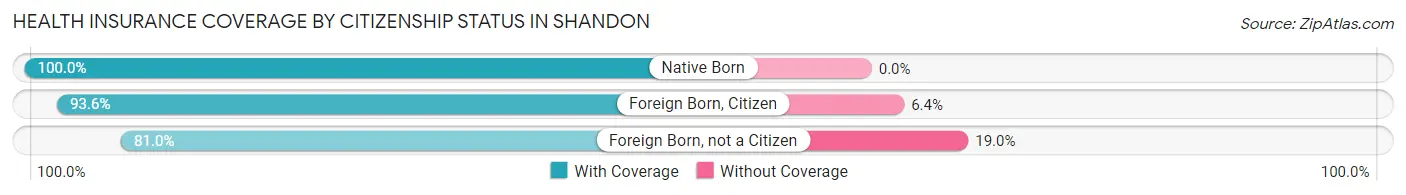
| Citizenship Status | With Coverage | Without Coverage |
| Native Born | 39 (100.0%) | 0 (0.0%) |
| Foreign Born, Citizen | 250 (93.6%) | 17 (6.4%) |
| Foreign Born, not a Citizen | 47 (81.0%) | 11 (19.0%) |
Health Insurance Coverage by Household Income in Shandon
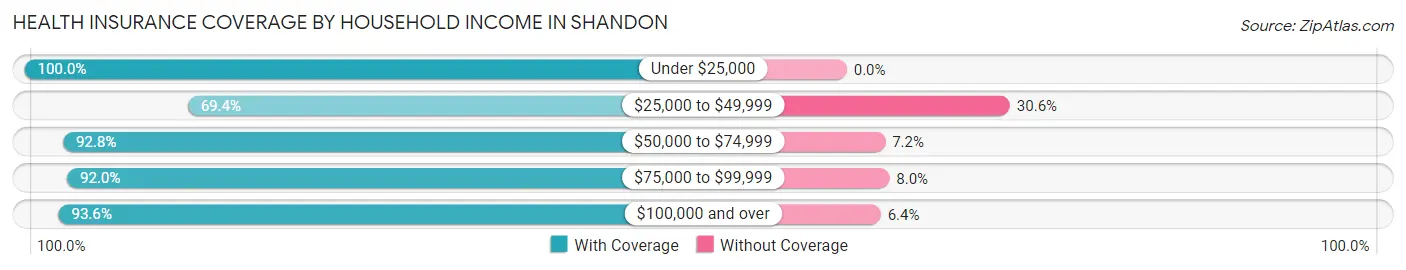
| Household Income | With Coverage | Without Coverage |
| Under $25,000 | 66 (100.0%) | 0 (0.0%) |
| $25,000 to $49,999 | 125 (69.4%) | 55 (30.6%) |
| $50,000 to $74,999 | 116 (92.8%) | 9 (7.2%) |
| $75,000 to $99,999 | 231 (92.0%) | 20 (8.0%) |
| $100,000 and over | 383 (93.6%) | 26 (6.4%) |
Public vs Private Health Insurance Coverage by Age in Shandon
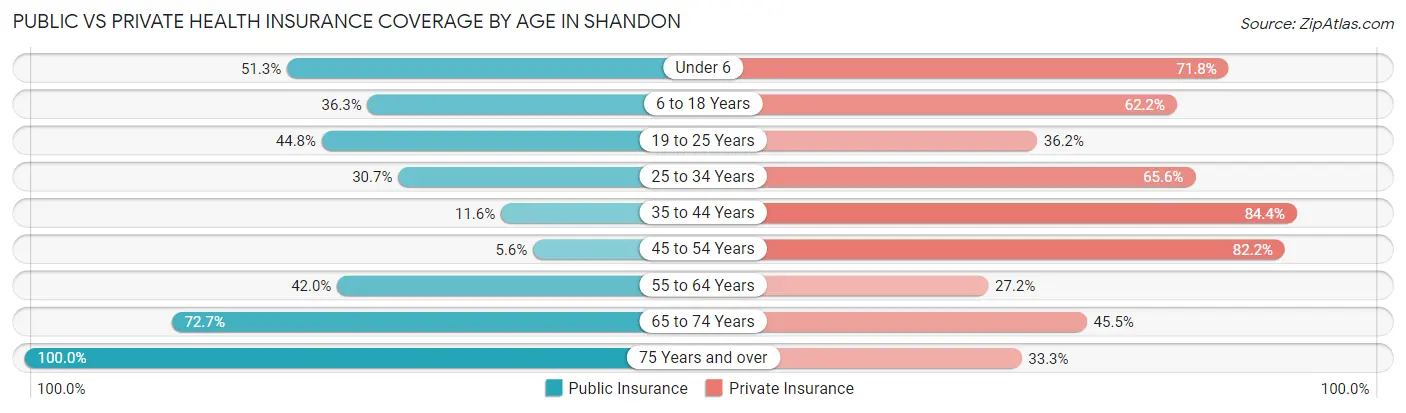
| Age Bracket | Public Insurance | Private Insurance |
| Under 6 | 20 (51.3%) | 28 (71.8%) |
| 6 to 18 Years | 97 (36.3%) | 166 (62.2%) |
| 19 to 25 Years | 26 (44.8%) | 21 (36.2%) |
| 25 to 34 Years | 57 (30.6%) | 122 (65.6%) |
| 35 to 44 Years | 26 (11.6%) | 190 (84.4%) |
| 45 to 54 Years | 6 (5.6%) | 88 (82.2%) |
| 55 to 64 Years | 34 (42.0%) | 22 (27.2%) |
| 65 to 74 Years | 32 (72.7%) | 20 (45.5%) |
| 75 Years and over | 24 (100.0%) | 8 (33.3%) |
| Total | 322 (31.2%) | 665 (64.5%) |
Disability Status by Sex by Age in Shandon
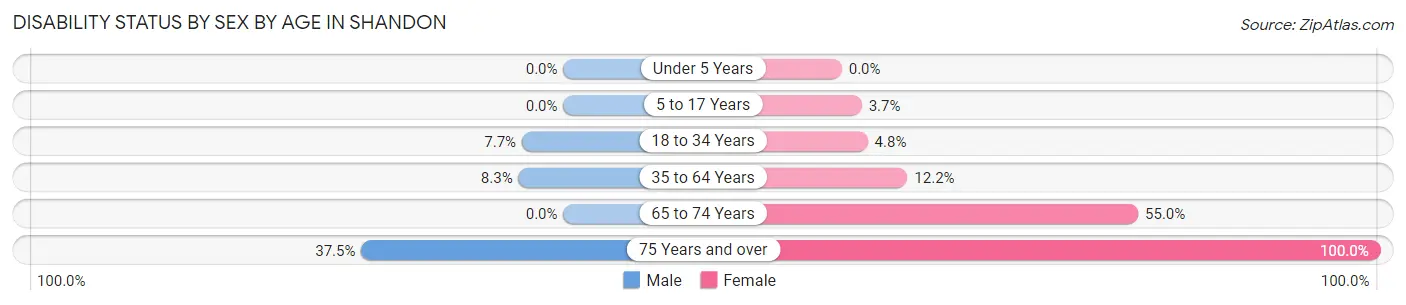
| Age Bracket | Male | Female |
| Under 5 Years | 0 (0.0%) | 0 (0.0%) |
| 5 to 17 Years | 0 (0.0%) | 4 (3.7%) |
| 18 to 34 Years | 11 (7.7%) | 6 (4.8%) |
| 35 to 64 Years | 18 (8.3%) | 24 (12.2%) |
| 65 to 74 Years | 0 (0.0%) | 11 (55.0%) |
| 75 Years and over | 3 (37.5%) | 16 (100.0%) |
Disability Class by Sex by Age in Shandon
Disability Class: Hearing Difficulty
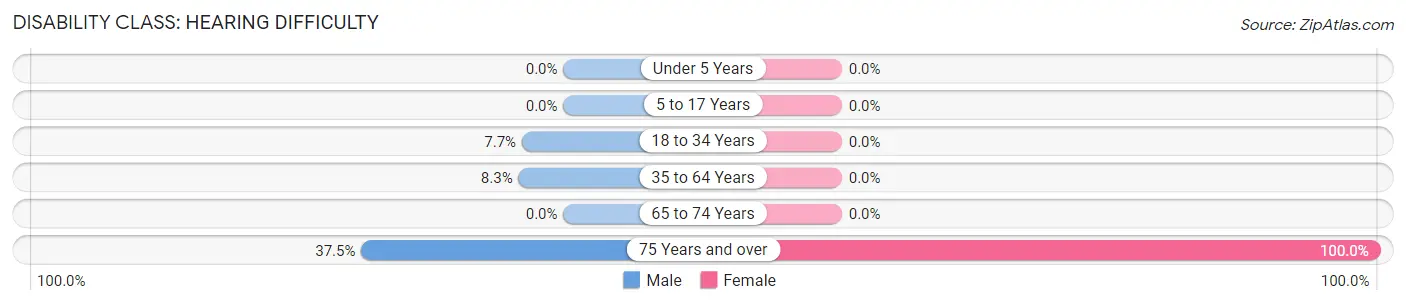
| Age Bracket | Male | Female |
| Under 5 Years | 0 (0.0%) | 0 (0.0%) |
| 5 to 17 Years | 0 (0.0%) | 0 (0.0%) |
| 18 to 34 Years | 11 (7.7%) | 0 (0.0%) |
| 35 to 64 Years | 18 (8.3%) | 0 (0.0%) |
| 65 to 74 Years | 0 (0.0%) | 0 (0.0%) |
| 75 Years and over | 3 (37.5%) | 16 (100.0%) |
Disability Class: Vision Difficulty
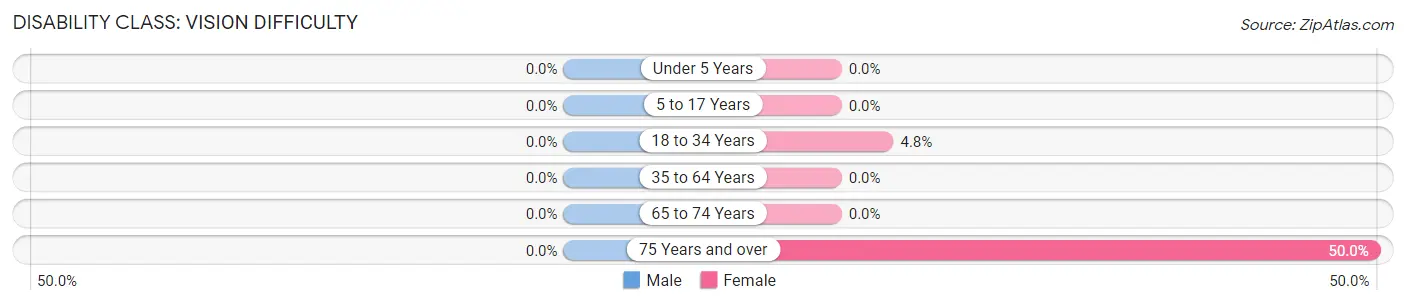
| Age Bracket | Male | Female |
| Under 5 Years | 0 (0.0%) | 0 (0.0%) |
| 5 to 17 Years | 0 (0.0%) | 0 (0.0%) |
| 18 to 34 Years | 0 (0.0%) | 6 (4.8%) |
| 35 to 64 Years | 0 (0.0%) | 0 (0.0%) |
| 65 to 74 Years | 0 (0.0%) | 0 (0.0%) |
| 75 Years and over | 0 (0.0%) | 8 (50.0%) |
Disability Class: Cognitive Difficulty
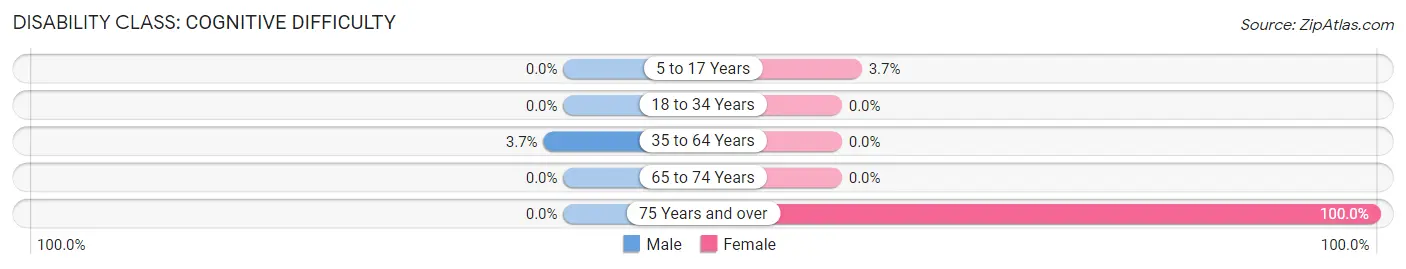
| Age Bracket | Male | Female |
| 5 to 17 Years | 0 (0.0%) | 4 (3.7%) |
| 18 to 34 Years | 0 (0.0%) | 0 (0.0%) |
| 35 to 64 Years | 8 (3.7%) | 0 (0.0%) |
| 65 to 74 Years | 0 (0.0%) | 0 (0.0%) |
| 75 Years and over | 0 (0.0%) | 16 (100.0%) |
Disability Class: Ambulatory Difficulty
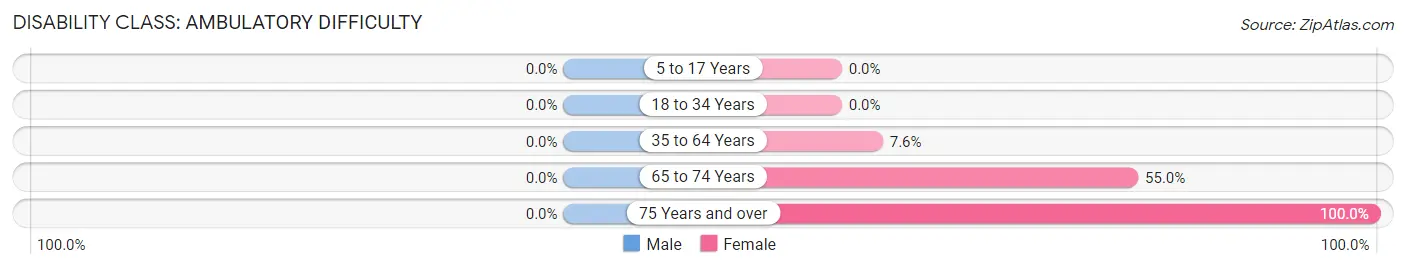
| Age Bracket | Male | Female |
| 5 to 17 Years | 0 (0.0%) | 0 (0.0%) |
| 18 to 34 Years | 0 (0.0%) | 0 (0.0%) |
| 35 to 64 Years | 0 (0.0%) | 15 (7.6%) |
| 65 to 74 Years | 0 (0.0%) | 11 (55.0%) |
| 75 Years and over | 0 (0.0%) | 16 (100.0%) |
Disability Class: Self-Care Difficulty
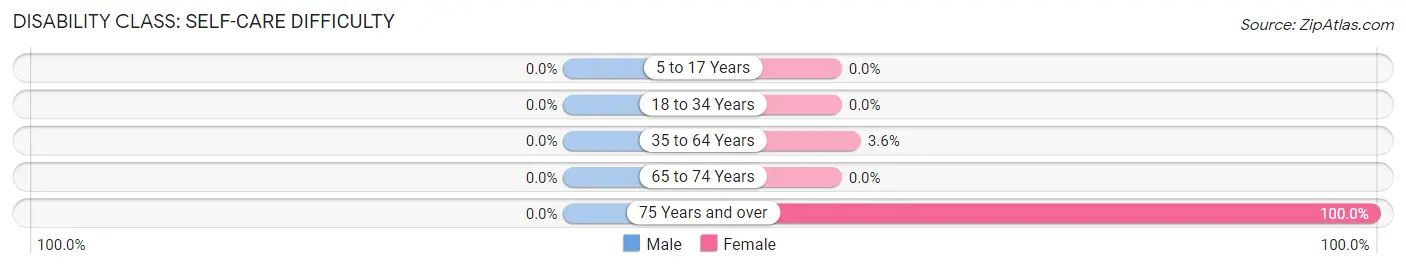
| Age Bracket | Male | Female |
| 5 to 17 Years | 0 (0.0%) | 0 (0.0%) |
| 18 to 34 Years | 0 (0.0%) | 0 (0.0%) |
| 35 to 64 Years | 0 (0.0%) | 7 (3.5%) |
| 65 to 74 Years | 0 (0.0%) | 0 (0.0%) |
| 75 Years and over | 0 (0.0%) | 16 (100.0%) |
Technology Access in Shandon
Computing Device Access in Shandon
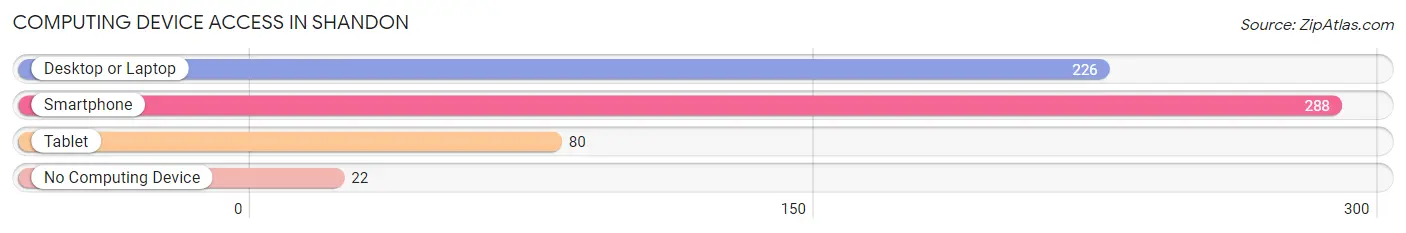
| Device Type | # Households | % Households |
| Desktop or Laptop | 226 | 70.0% |
| Smartphone | 288 | 89.2% |
| Tablet | 80 | 24.8% |
| No Computing Device | 22 | 6.8% |
| Total | 323 | 100.0% |
Internet Access in Shandon
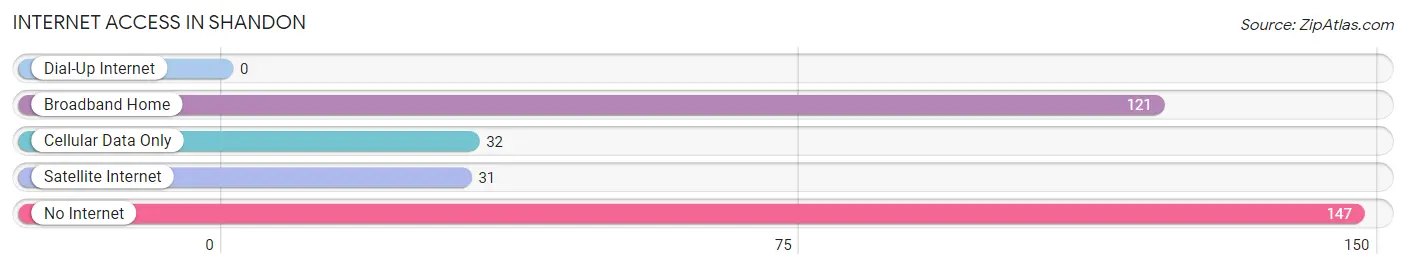
| Internet Type | # Households | % Households |
| Dial-Up Internet | 0 | 0.0% |
| Broadband Home | 121 | 37.5% |
| Cellular Data Only | 32 | 9.9% |
| Satellite Internet | 31 | 9.6% |
| No Internet | 147 | 45.5% |
| Total | 323 | 100.0% |
Shandon Summary
Shandon is a small unincorporated community located in San Luis Obispo County, California. It is situated in the rolling hills of the Central Coast, approximately 8 miles east of the city of San Luis Obispo. The population of Shandon was estimated to be 1,845 in 2019.
History
Shandon was originally inhabited by the Chumash people, who lived in the area for thousands of years before the arrival of Europeans. The first Europeans to settle in the area were Spanish missionaries, who established the Mission San Miguel Arcángel in 1797. The mission was abandoned in 1834, and the land was divided into large ranchos.
In 1868, the area was purchased by William H. Shandon, a rancher from Scotland. He named the area after himself and established a large cattle ranch. The town of Shandon was officially founded in 1872, and the first post office was established in 1873.
Geography
Shandon is located in the rolling hills of the Central Coast, approximately 8 miles east of the city of San Luis Obispo. The town is situated at an elevation of 830 feet above sea level. The climate is Mediterranean, with hot, dry summers and mild, wet winters.
The town is surrounded by agricultural land, including vineyards, orchards, and cattle ranches. The nearby Santa Lucia Mountains provide a scenic backdrop.
Economy
The economy of Shandon is largely based on agriculture. The town is home to several wineries, as well as a number of orchards and cattle ranches. Tourism is also an important part of the local economy, with many visitors coming to the area to enjoy the scenic beauty and the local wines.
Demographics
As of 2019, the population of Shandon was estimated to be 1,845. The racial makeup of the town was 79.3% White, 0.7% African American, 0.7% Native American, 0.7% Asian, 0.2% Pacific Islander, and 17.5% from other races. The median household income was $50,938, and the median age was 39.7 years.
Conclusion
Shandon is a small unincorporated community located in San Luis Obispo County, California. It has a long history, dating back to the Chumash people and the Spanish missionaries who established the Mission San Miguel Arcángel in 1797. The town is situated in the rolling hills of the Central Coast, and the economy is largely based on agriculture. The population of Shandon was estimated to be 1,845 in 2019, and the median household income was $50,938.
Common Questions
What is Per Capita Income in Shandon?
Per Capita income in Shandon is $27,376.
What is the Median Family Income in Shandon?
Median Family Income in Shandon is $70,598.
What is the Median Household income in Shandon?
Median Household Income in Shandon is $82,344.
What is Income or Wage Gap in Shandon?
Income or Wage Gap in Shandon is 22.6%.
Women in Shandon earn 77.4 cents for every dollar earned by a man.
What is Inequality or Gini Index in Shandon?
Inequality or Gini Index in Shandon is 0.34.
What is the Total Population of Shandon?
Total Population of Shandon is 1,031.
What is the Total Male Population of Shandon?
Total Male Population of Shandon is 541.
What is the Total Female Population of Shandon?
Total Female Population of Shandon is 490.
What is the Ratio of Males per 100 Females in Shandon?
There are 110.41 Males per 100 Females in Shandon.
What is the Ratio of Females per 100 Males in Shandon?
There are 90.57 Females per 100 Males in Shandon.
What is the Median Population Age in Shandon?
Median Population Age in Shandon is 32.5 Years.
What is the Average Family Size in Shandon
Average Family Size in Shandon is 4.3 People.
What is the Average Household Size in Shandon
Average Household Size in Shandon is 3.2 People.
How Large is the Labor Force in Shandon?
There are 516 People in the Labor Forcein in Shandon.
What is the Percentage of People in the Labor Force in Shandon?
65.4% of People are in the Labor Force in Shandon.
What is the Unemployment Rate in Shandon?
Unemployment Rate in Shandon is 8.5%.