Zip Codes with the Highest Percentage of Population Employed in Arts, Entertainment & Recreation in Santa Maria, CA
RELATED REPORTS & OPTIONS
Arts, Entertainment & Recreation
Santa Maria
Compare Zip Codes
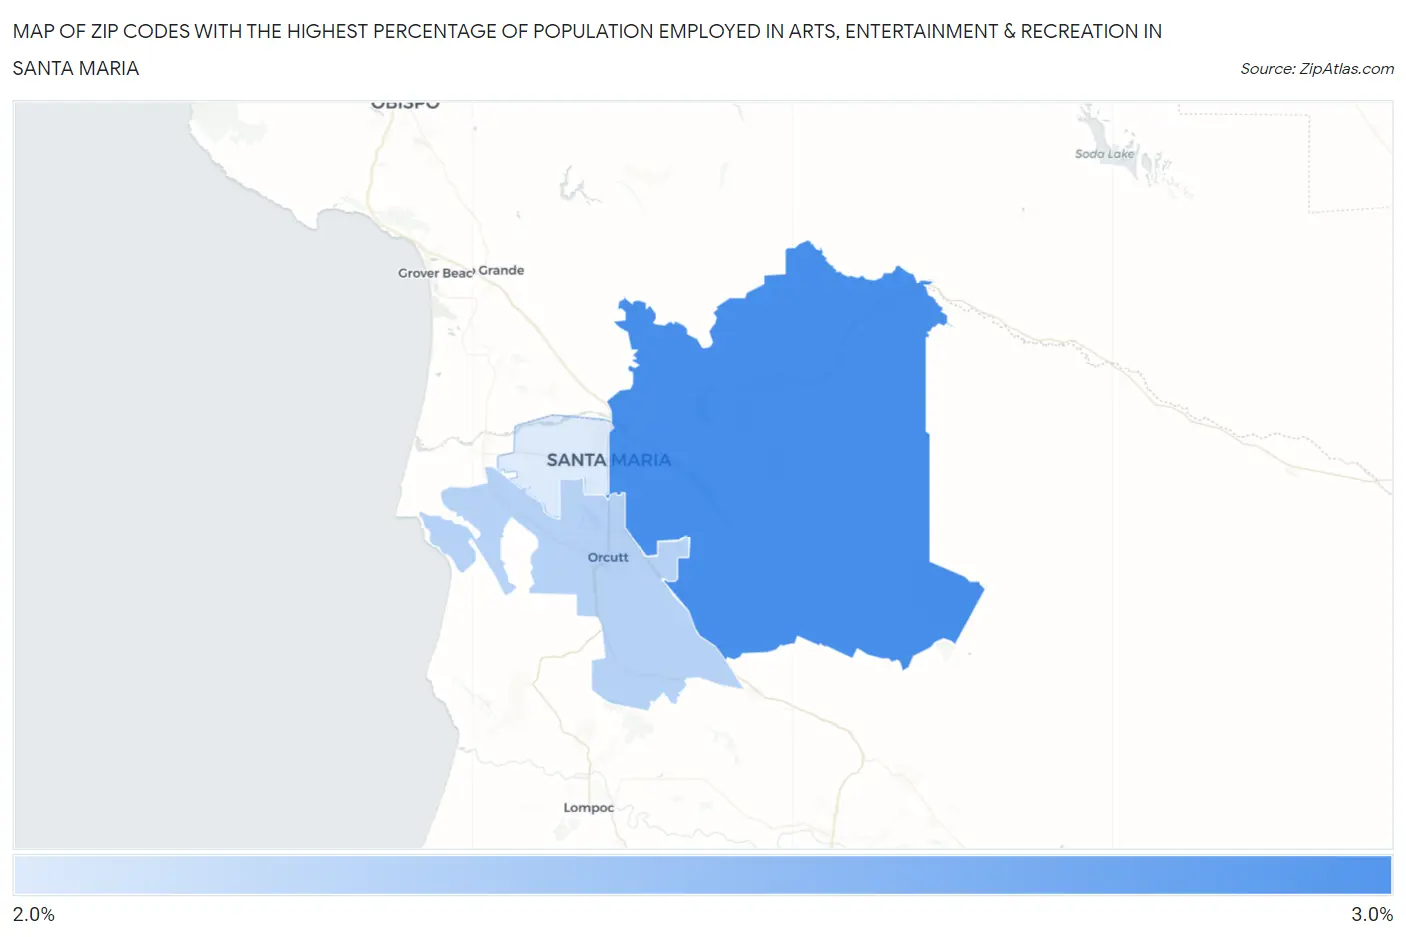
Map of Zip Codes with the Highest Percentage of Population Employed in Arts, Entertainment & Recreation in Santa Maria
0.0%
3.0%
Zip Codes with the Highest Percentage of Population Employed in Arts, Entertainment & Recreation in Santa Maria, CA
| Zip Code | % Employed | vs State | vs National | |
| 1. | 93454 | 2.7% | 2.6%(+0.127)#609 | 2.1%(+0.599)#6,430 |
| 2. | 93455 | 2.4% | 2.6%(-0.166)#735 | 2.1%(+0.305)#7,696 |
| 3. | 93458 | 2.3% | 2.6%(-0.266)#777 | 2.1%(+0.205)#8,184 |
1
Common Questions
What are the Top Zip Codes with the Highest Percentage of Population Employed in Arts, Entertainment & Recreation in Santa Maria, CA?
Top Zip Codes with the Highest Percentage of Population Employed in Arts, Entertainment & Recreation in Santa Maria, CA are:
What zip code has the Highest Percentage of Population Employed in Arts, Entertainment & Recreation in Santa Maria, CA?
93454 has the Highest Percentage of Population Employed in Arts, Entertainment & Recreation in Santa Maria, CA with 2.7%.
What is the Percentage of Population Employed in Arts, Entertainment & Recreation in Santa Maria, CA?
Percentage of Population Employed in Arts, Entertainment & Recreation in Santa Maria is 2.2%.
What is the Percentage of Population Employed in Arts, Entertainment & Recreation in California?
Percentage of Population Employed in Arts, Entertainment & Recreation in California is 2.6%.
What is the Percentage of Population Employed in Arts, Entertainment & Recreation in the United States?
Percentage of Population Employed in Arts, Entertainment & Recreation in the United States is 2.1%.