Santa Margarita, CA Map & Demographics
Santa Margarita Map
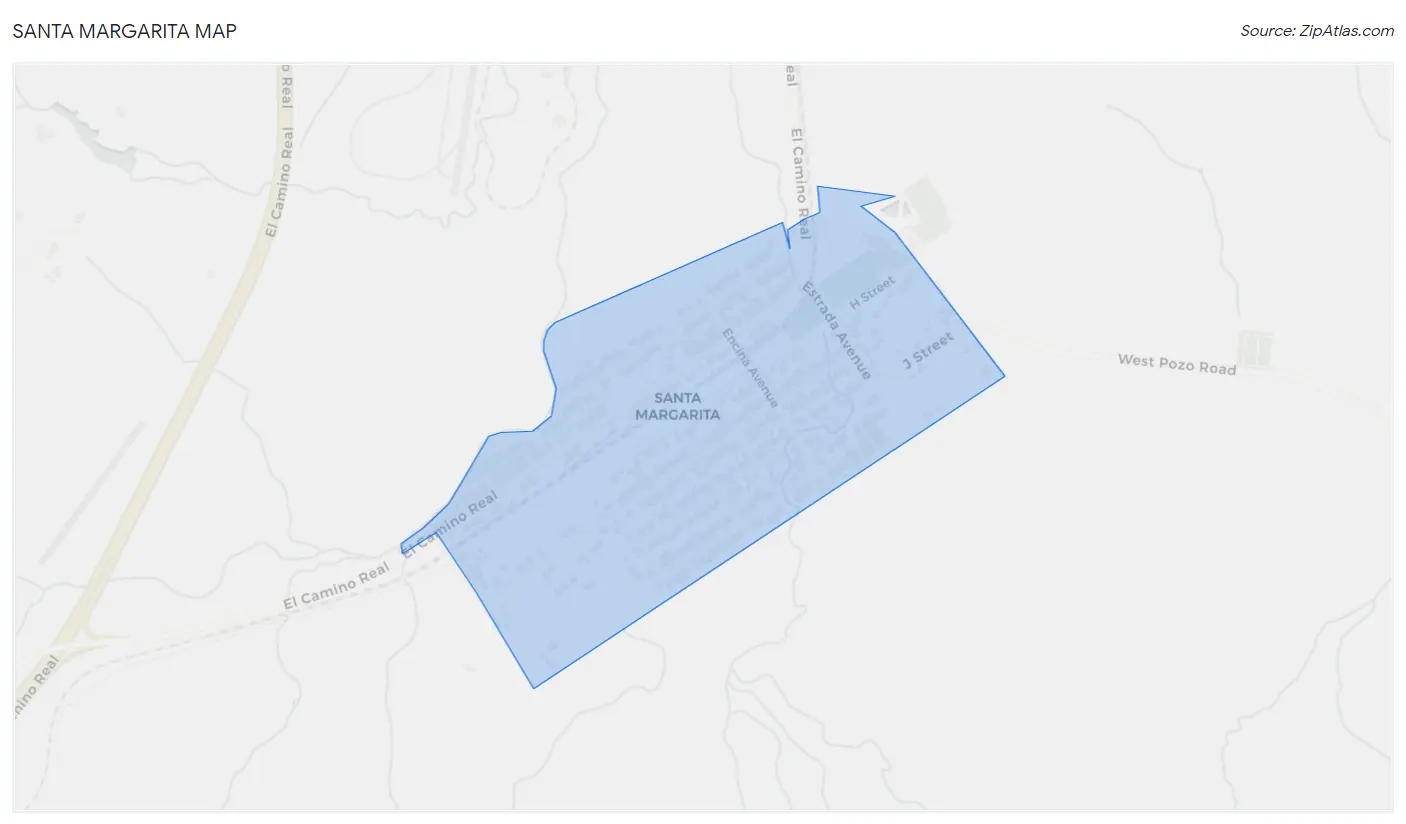
Santa Margarita Overview
$71,448
PER CAPITA INCOME
$150,987
AVG FAMILY INCOME
67.8%
WAGE / INCOME GAP [ % ]
32.2¢/ $1
WAGE / INCOME GAP [ $ ]
0.59
INEQUALITY / GINI INDEX
698
TOTAL POPULATION
264
MALE POPULATION
434
FEMALE POPULATION
60.83
MALES / 100 FEMALES
164.39
FEMALES / 100 MALES
63.0
MEDIAN AGE
2.0
AVG FAMILY SIZE
1.6
AVG HOUSEHOLD SIZE
447
LABOR FORCE [ PEOPLE ]
64.0%
PERCENT IN LABOR FORCE
Santa Margarita Zip Codes
Income in Santa Margarita
Income Overview in Santa Margarita
| Characteristic | Number | Measure |
| Per Capita Income | 698 | $71,448 |
| Median Family Income | 231 | $150,987 |
| Mean Family Income | 231 | $191,014 |
| Median Household Income | 451 | $0 |
| Mean Household Income | 451 | $108,169 |
| Income Deficit | 231 | $0 |
| Wage / Income Gap (%) | 698 | 67.76% |
| Wage / Income Gap ($) | 698 | 32.24¢ per $1 |
| Gini / Inequality Index | 698 | 0.59 |
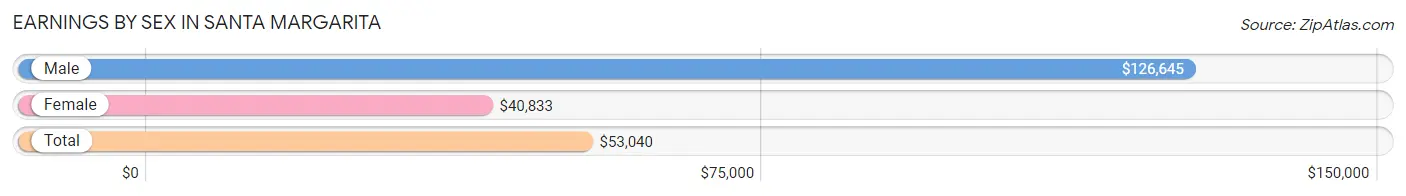
Earnings by Sex in Santa Margarita
Average Earnings in Santa Margarita are $53,040, $126,645 for men and $40,833 for women, a difference of 67.8%.
| Sex | Number | Average Earnings |
| Male | 213 (47.6%) | $126,645 |
| Female | 234 (52.3%) | $40,833 |
| Total | 447 (100.0%) | $53,040 |
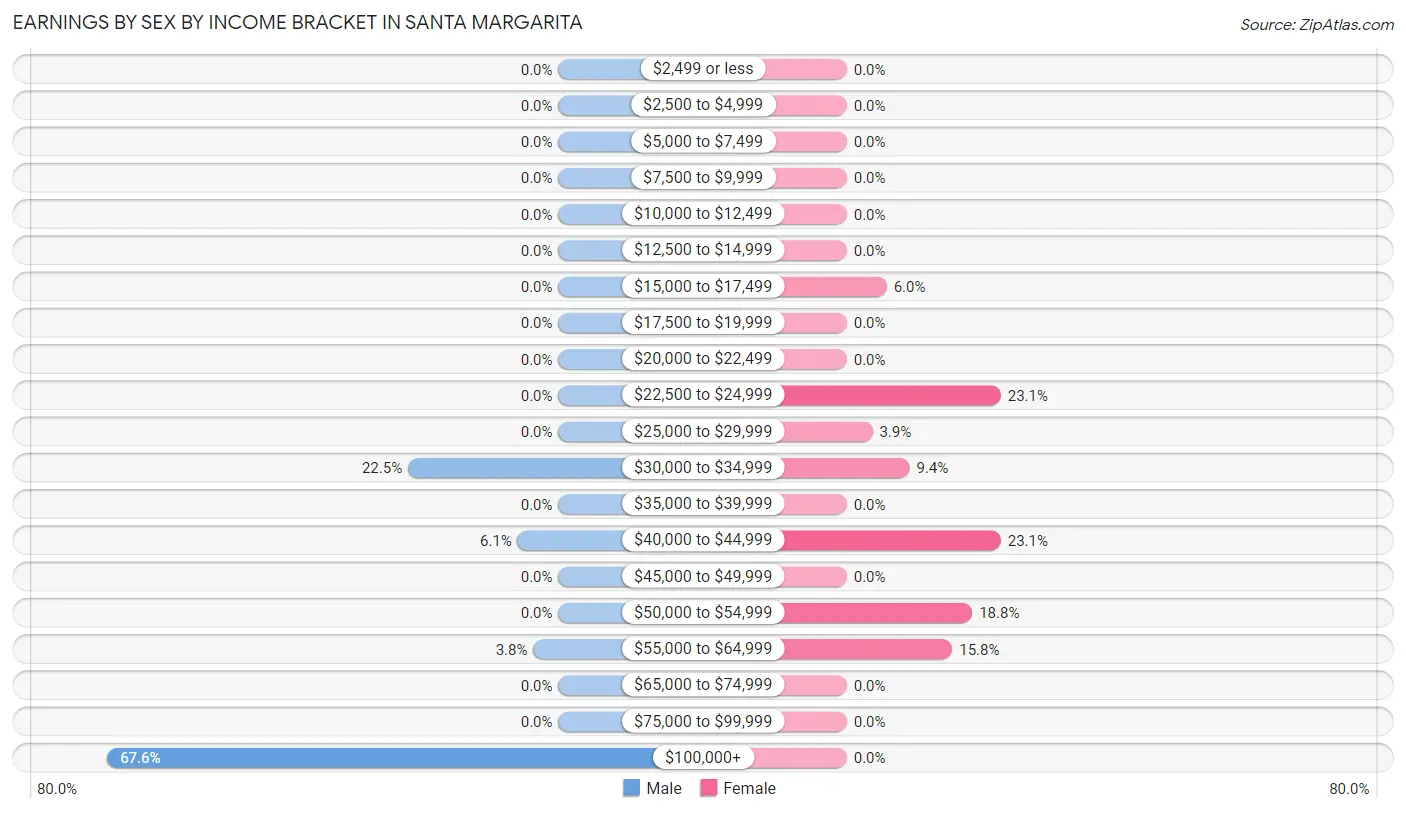
Earnings by Sex by Income Bracket in Santa Margarita
The most common earnings brackets in Santa Margarita are $100,000+ for men (144 | 67.6%) and $22,500 to $24,999 for women (54 | 23.1%).
| Income | Male | Female |
| $2,499 or less | 0 (0.0%) | 0 (0.0%) |
| $2,500 to $4,999 | 0 (0.0%) | 0 (0.0%) |
| $5,000 to $7,499 | 0 (0.0%) | 0 (0.0%) |
| $7,500 to $9,999 | 0 (0.0%) | 0 (0.0%) |
| $10,000 to $12,499 | 0 (0.0%) | 0 (0.0%) |
| $12,500 to $14,999 | 0 (0.0%) | 0 (0.0%) |
| $15,000 to $17,499 | 0 (0.0%) | 14 (6.0%) |
| $17,500 to $19,999 | 0 (0.0%) | 0 (0.0%) |
| $20,000 to $22,499 | 0 (0.0%) | 0 (0.0%) |
| $22,500 to $24,999 | 0 (0.0%) | 54 (23.1%) |
| $25,000 to $29,999 | 0 (0.0%) | 9 (3.8%) |
| $30,000 to $34,999 | 48 (22.5%) | 22 (9.4%) |
| $35,000 to $39,999 | 0 (0.0%) | 0 (0.0%) |
| $40,000 to $44,999 | 13 (6.1%) | 54 (23.1%) |
| $45,000 to $49,999 | 0 (0.0%) | 0 (0.0%) |
| $50,000 to $54,999 | 0 (0.0%) | 44 (18.8%) |
| $55,000 to $64,999 | 8 (3.8%) | 37 (15.8%) |
| $65,000 to $74,999 | 0 (0.0%) | 0 (0.0%) |
| $75,000 to $99,999 | 0 (0.0%) | 0 (0.0%) |
| $100,000+ | 144 (67.6%) | 0 (0.0%) |
| Total | 213 (100.0%) | 234 (100.0%) |
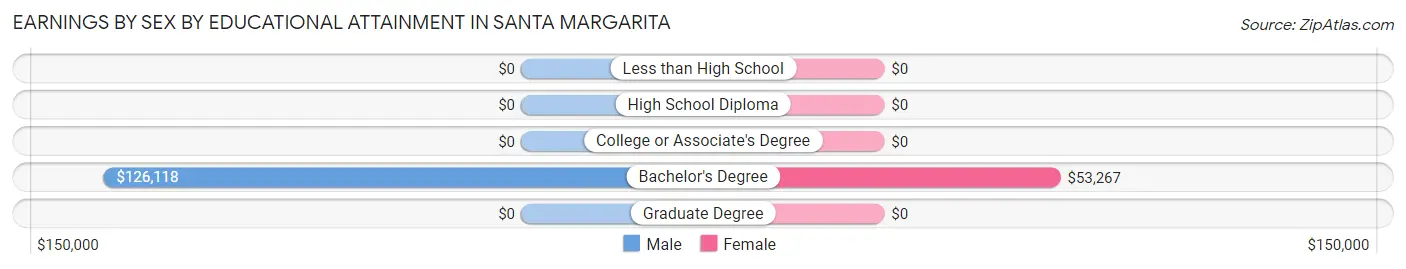
Earnings by Sex by Educational Attainment in Santa Margarita
Average earnings in Santa Margarita are $126,645 for men and $41,157 for women, a difference of 67.5%. Men with an educational attainment of bachelor's degree enjoy the highest average annual earnings of $126,118, while those with bachelor's degree education earn the least with $126,118. Women with an educational attainment of bachelor's degree earn the most with the average annual earnings of $53,267, while those with bachelor's degree education have the smallest earnings of $53,267.
| Educational Attainment | Male Income | Female Income |
| Less than High School | - | - |
| High School Diploma | - | - |
| College or Associate's Degree | - | - |
| Bachelor's Degree | $126,118 | $53,267 |
| Graduate Degree | - | - |
| Total | $126,645 | $41,157 |
Family Income in Santa Margarita
Family Income Brackets in Santa Margarita
According to the Santa Margarita family income data, there are 81 families falling into the $200,000+ income range, which is the most common income bracket and makes up 35.1% of all families.
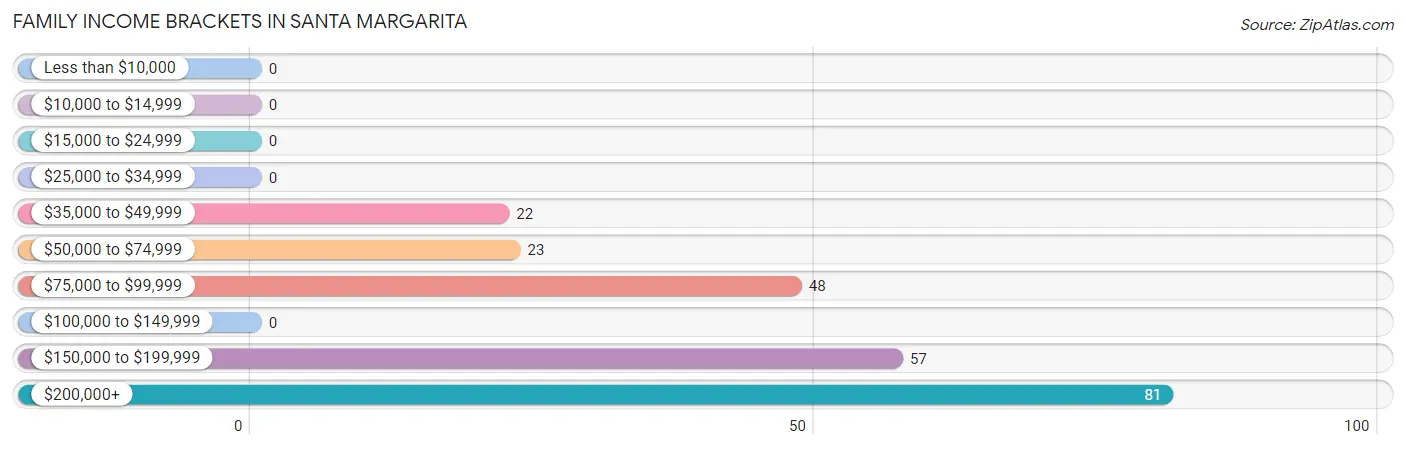
| Income Bracket | # Families | % Families |
| Less than $10,000 | 0 | 0.0% |
| $10,000 to $14,999 | 0 | 0.0% |
| $15,000 to $24,999 | 0 | 0.0% |
| $25,000 to $34,999 | 0 | 0.0% |
| $35,000 to $49,999 | 22 | 9.5% |
| $50,000 to $74,999 | 23 | 10.0% |
| $75,000 to $99,999 | 48 | 20.8% |
| $100,000 to $149,999 | 0 | 0.0% |
| $150,000 to $199,999 | 57 | 24.7% |
| $200,000+ | 81 | 35.1% |
Family Income by Famaliy Size in Santa Margarita
2-person families (231 | 100.0%) account for the highest median family income in Santa Margarita with $150,987 per family, while 2-person families (231 | 100.0%) have the highest median income of $75,494 per family member.
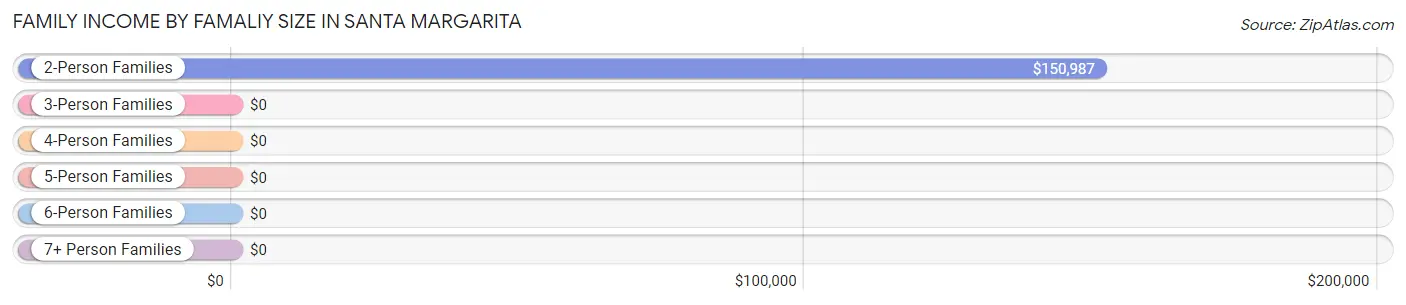
| Income Bracket | # Families | Median Income |
| 2-Person Families | 231 (100.0%) | $150,987 |
| 3-Person Families | 0 (0.0%) | $0 |
| 4-Person Families | 0 (0.0%) | $0 |
| 5-Person Families | 0 (0.0%) | $0 |
| 6-Person Families | 0 (0.0%) | $0 |
| 7+ Person Families | 0 (0.0%) | $0 |
| Total | 231 (100.0%) | $150,987 |
Family Income by Number of Earners in Santa Margarita
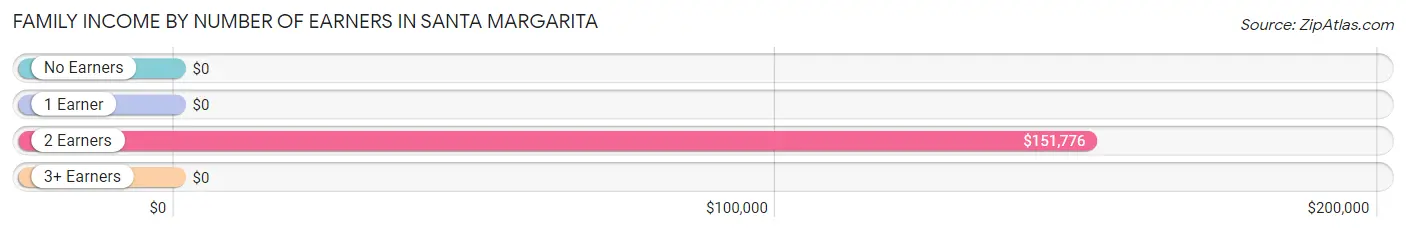
| Number of Earners | # Families | Median Income |
| No Earners | 0 (0.0%) | $0 |
| 1 Earner | 36 (15.6%) | $0 |
| 2 Earners | 195 (84.4%) | $151,776 |
| 3+ Earners | 0 (0.0%) | $0 |
| Total | 231 (100.0%) | $150,987 |
Household Income in Santa Margarita
Household Income Brackets in Santa Margarita
With 200 households falling in the category, the $15,000 to $24,999 income range is the most frequent in Santa Margarita, accounting for 44.4% of all households.
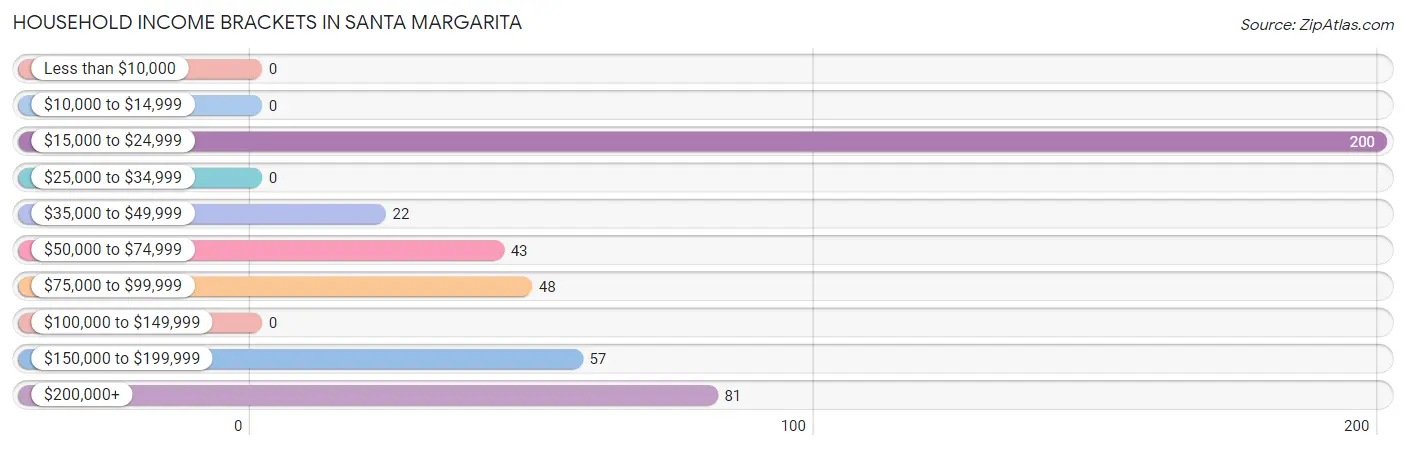
| Income Bracket | # Households | % Households |
| Less than $10,000 | 0 | 0.0% |
| $10,000 to $14,999 | 0 | 0.0% |
| $15,000 to $24,999 | 200 | 44.3% |
| $25,000 to $34,999 | 0 | 0.0% |
| $35,000 to $49,999 | 22 | 4.9% |
| $50,000 to $74,999 | 43 | 9.5% |
| $75,000 to $99,999 | 48 | 10.6% |
| $100,000 to $149,999 | 0 | 0.0% |
| $150,000 to $199,999 | 57 | 12.6% |
| $200,000+ | 81 | 18.0% |
Household Income by Householder Age in Santa Margarita
| Income Bracket | # Households | Median Income |
| 15 to 24 Years | 0 (0.0%) | $0 |
| 25 to 44 Years | 106 (23.5%) | $0 |
| 45 to 64 Years | 145 (32.2%) | $0 |
| 65+ Years | 200 (44.4%) | $0 |
| Total | 451 (100.0%) | $0 |
Poverty in Santa Margarita
Income Below Poverty by Sex and Age in Santa Margarita
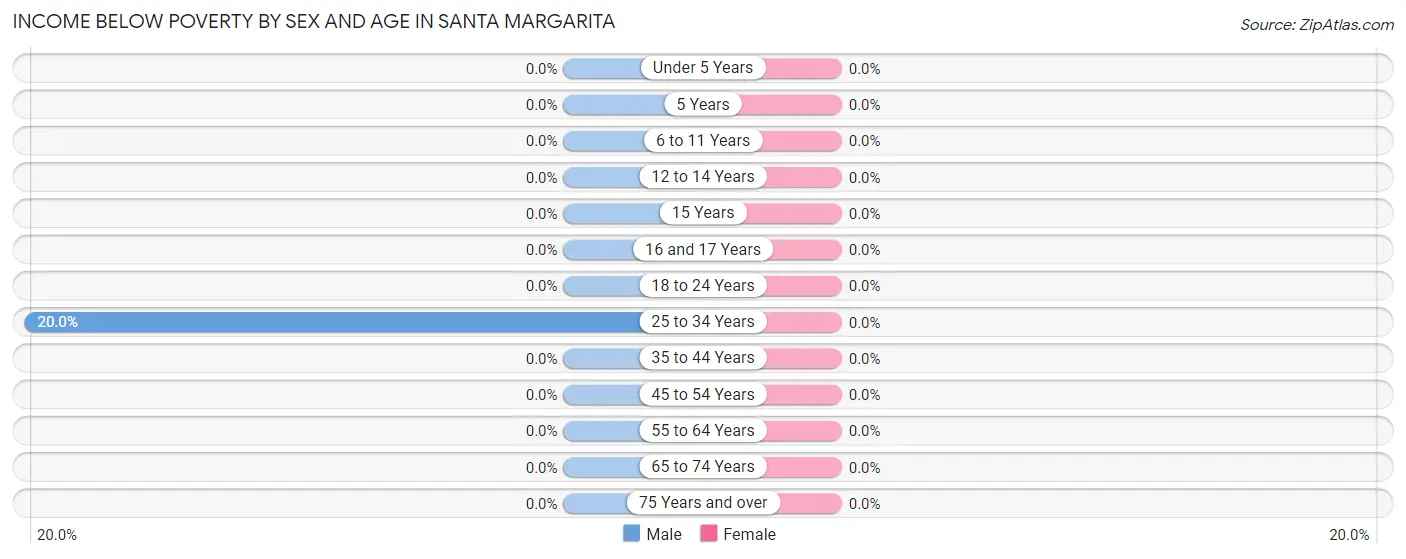
| Age Bracket | Male | Female |
| Under 5 Years | 0 (0.0%) | 0 (0.0%) |
| 5 Years | 0 (0.0%) | 0 (0.0%) |
| 6 to 11 Years | 0 (0.0%) | 0 (0.0%) |
| 12 to 14 Years | 0 (0.0%) | 0 (0.0%) |
| 15 Years | 0 (0.0%) | 0 (0.0%) |
| 16 and 17 Years | 0 (0.0%) | 0 (0.0%) |
| 18 to 24 Years | 0 (0.0%) | 0 (0.0%) |
| 25 to 34 Years | 12 (20.0%) | 0 (0.0%) |
| 35 to 44 Years | 0 (0.0%) | 0 (0.0%) |
| 45 to 54 Years | 0 (0.0%) | 0 (0.0%) |
| 55 to 64 Years | 0 (0.0%) | 0 (0.0%) |
| 65 to 74 Years | 0 (0.0%) | 0 (0.0%) |
| 75 Years and over | 0 (0.0%) | 0 (0.0%) |
| Total | 12 (4.5%) | 0 (0.0%) |
Income Above Poverty by Sex and Age in Santa Margarita
According to the poverty statistics in Santa Margarita, males aged 35 to 44 years and females aged 18 to 24 years are the age groups that are most secure financially, with 100.0% of males and 100.0% of females in these age groups living above the poverty line.
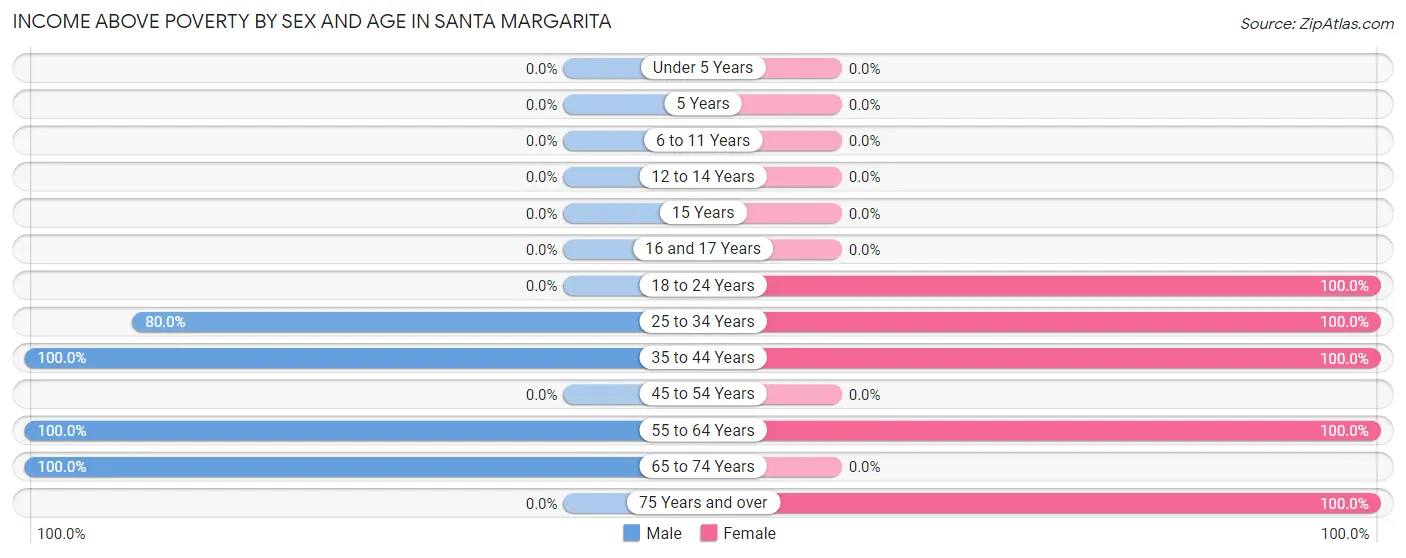
| Age Bracket | Male | Female |
| Under 5 Years | 0 (0.0%) | 0 (0.0%) |
| 5 Years | 0 (0.0%) | 0 (0.0%) |
| 6 to 11 Years | 0 (0.0%) | 0 (0.0%) |
| 12 to 14 Years | 0 (0.0%) | 0 (0.0%) |
| 15 Years | 0 (0.0%) | 0 (0.0%) |
| 16 and 17 Years | 0 (0.0%) | 0 (0.0%) |
| 18 to 24 Years | 0 (0.0%) | 14 (100.0%) |
| 25 to 34 Years | 48 (80.0%) | 77 (100.0%) |
| 35 to 44 Years | 71 (100.0%) | 9 (100.0%) |
| 45 to 54 Years | 0 (0.0%) | 0 (0.0%) |
| 55 to 64 Years | 88 (100.0%) | 134 (100.0%) |
| 65 to 74 Years | 45 (100.0%) | 0 (0.0%) |
| 75 Years and over | 0 (0.0%) | 200 (100.0%) |
| Total | 252 (95.5%) | 434 (100.0%) |
Income Below Poverty Among Married-Couple Families in Santa Margarita
| Children | Above Poverty | Below Poverty |
| No Children | 208 (100.0%) | 0 (0.0%) |
| 1 or 2 Children | 0 (0.0%) | 0 (0.0%) |
| 3 or 4 Children | 0 (0.0%) | 0 (0.0%) |
| 5 or more Children | 0 (0.0%) | 0 (0.0%) |
| Total | 208 (100.0%) | 0 (0.0%) |
Income Below Poverty Among Single-Parent Households in Santa Margarita
| Children | Single Father | Single Mother |
| No Children | 0 (0.0%) | 0 (0.0%) |
| 1 or 2 Children | 0 (0.0%) | 0 (0.0%) |
| 3 or 4 Children | 0 (0.0%) | 0 (0.0%) |
| 5 or more Children | 0 (0.0%) | 0 (0.0%) |
| Total | 0 (0.0%) | 0 (0.0%) |
Income Below Poverty Among Married-Couple vs Single-Parent Households in Santa Margarita
| Children | Married-Couple Families | Single-Parent Households |
| No Children | 0 (0.0%) | 0 (0.0%) |
| 1 or 2 Children | 0 (0.0%) | 0 (0.0%) |
| 3 or 4 Children | 0 (0.0%) | 0 (0.0%) |
| 5 or more Children | 0 (0.0%) | 0 (0.0%) |
| Total | 0 (0.0%) | 0 (0.0%) |
Race in Santa Margarita
The most populous races in Santa Margarita are White / Caucasian (594 | 85.1%), Two or more Races (104 | 14.9%), and Hispanic or Latino (50 | 7.2%).
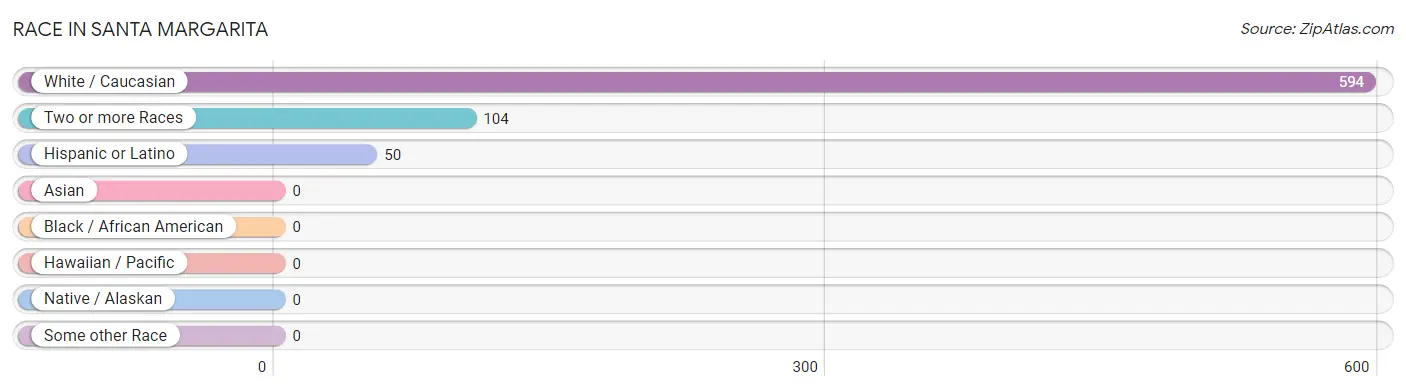
| Race | # Population | % Population |
| Asian | 0 | 0.0% |
| Black / African American | 0 | 0.0% |
| Hawaiian / Pacific | 0 | 0.0% |
| Hispanic or Latino | 50 | 7.2% |
| Native / Alaskan | 0 | 0.0% |
| White / Caucasian | 594 | 85.1% |
| Two or more Races | 104 | 14.9% |
| Some other Race | 0 | 0.0% |
| Total | 698 | 100.0% |
Ancestry in Santa Margarita
The most populous ancestries reported in Santa Margarita are Portuguese (200 | 28.6%), German (157 | 22.5%), Irish (145 | 20.8%), Dutch (54 | 7.7%), and Czech (48 | 6.9%), together accounting for 86.5% of all Santa Margarita residents.
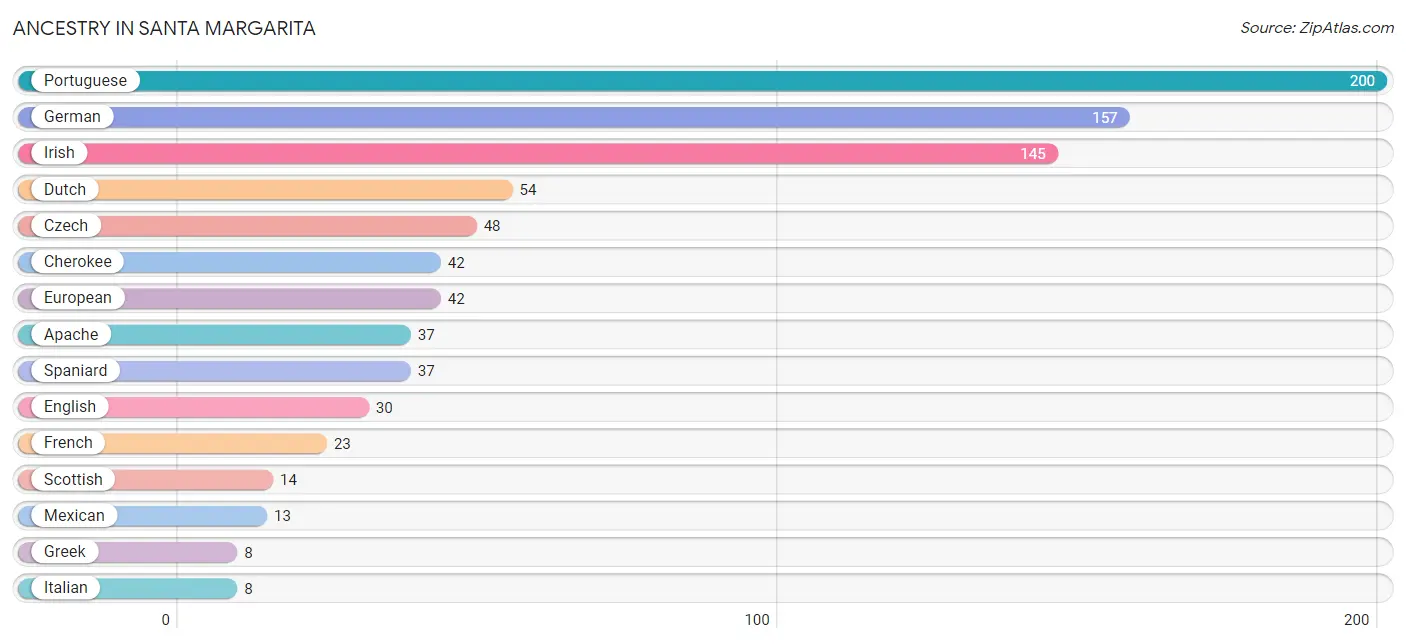
| Ancestry | # Population | % Population |
| Apache | 37 | 5.3% |
| Cherokee | 42 | 6.0% |
| Czech | 48 | 6.9% |
| Dutch | 54 | 7.7% |
| English | 30 | 4.3% |
| European | 42 | 6.0% |
| French | 23 | 3.3% |
| German | 157 | 22.5% |
| Greek | 8 | 1.1% |
| Irish | 145 | 20.8% |
| Italian | 8 | 1.1% |
| Mexican | 13 | 1.9% |
| Portuguese | 200 | 28.6% |
| Scottish | 14 | 2.0% |
| Spaniard | 37 | 5.3% | View All 15 Rows |
Immigrants in Santa Margarita

| Immigration Origin | # Population | % Population | View All 0 Rows |
Sex and Age in Santa Margarita
Sex and Age in Santa Margarita
The most populous age groups in Santa Margarita are 60 to 64 Years (88 | 33.3%) for men and 85 Years and over (200 | 46.1%) for women.
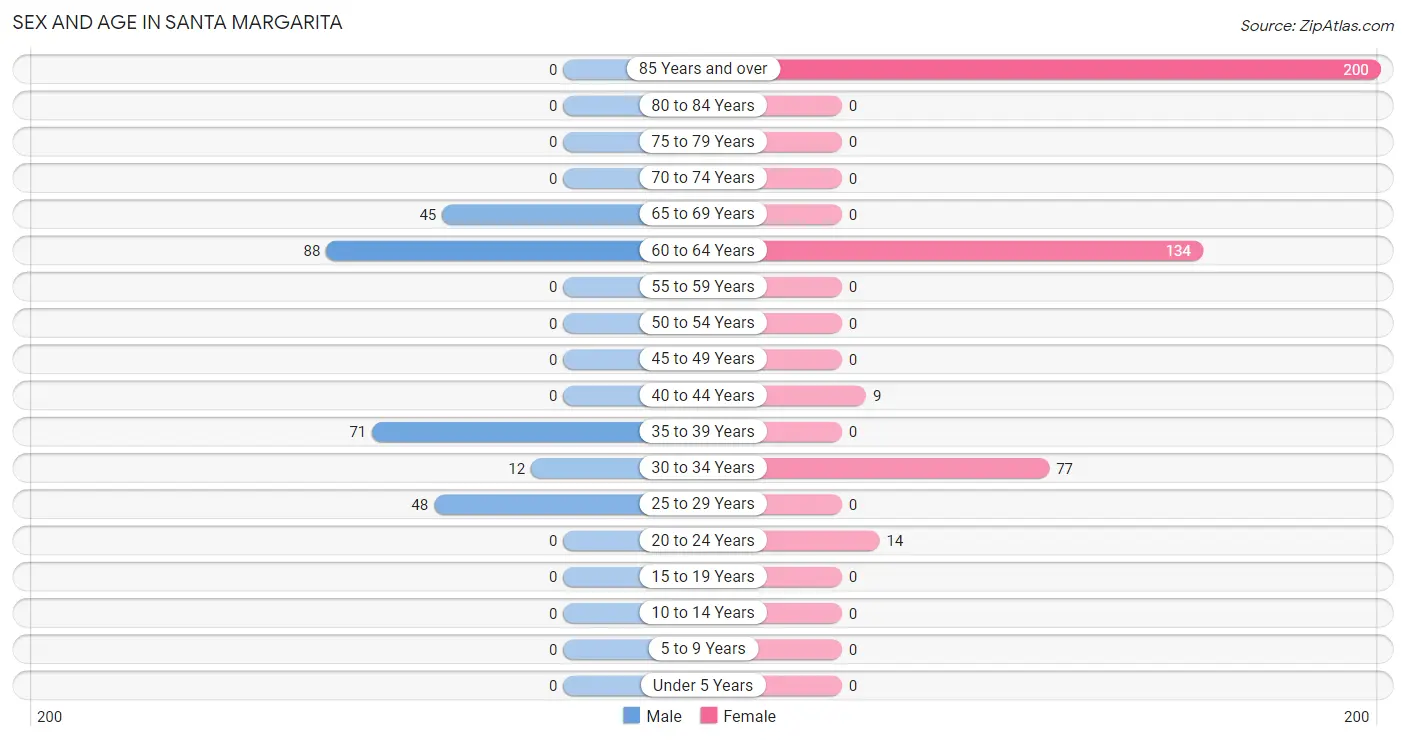
| Age Bracket | Male | Female |
| Under 5 Years | 0 (0.0%) | 0 (0.0%) |
| 5 to 9 Years | 0 (0.0%) | 0 (0.0%) |
| 10 to 14 Years | 0 (0.0%) | 0 (0.0%) |
| 15 to 19 Years | 0 (0.0%) | 0 (0.0%) |
| 20 to 24 Years | 0 (0.0%) | 14 (3.2%) |
| 25 to 29 Years | 48 (18.2%) | 0 (0.0%) |
| 30 to 34 Years | 12 (4.5%) | 77 (17.7%) |
| 35 to 39 Years | 71 (26.9%) | 0 (0.0%) |
| 40 to 44 Years | 0 (0.0%) | 9 (2.1%) |
| 45 to 49 Years | 0 (0.0%) | 0 (0.0%) |
| 50 to 54 Years | 0 (0.0%) | 0 (0.0%) |
| 55 to 59 Years | 0 (0.0%) | 0 (0.0%) |
| 60 to 64 Years | 88 (33.3%) | 134 (30.9%) |
| 65 to 69 Years | 45 (17.1%) | 0 (0.0%) |
| 70 to 74 Years | 0 (0.0%) | 0 (0.0%) |
| 75 to 79 Years | 0 (0.0%) | 0 (0.0%) |
| 80 to 84 Years | 0 (0.0%) | 0 (0.0%) |
| 85 Years and over | 0 (0.0%) | 200 (46.1%) |
| Total | 264 (100.0%) | 434 (100.0%) |
Families and Households in Santa Margarita
Median Family Size in Santa Margarita
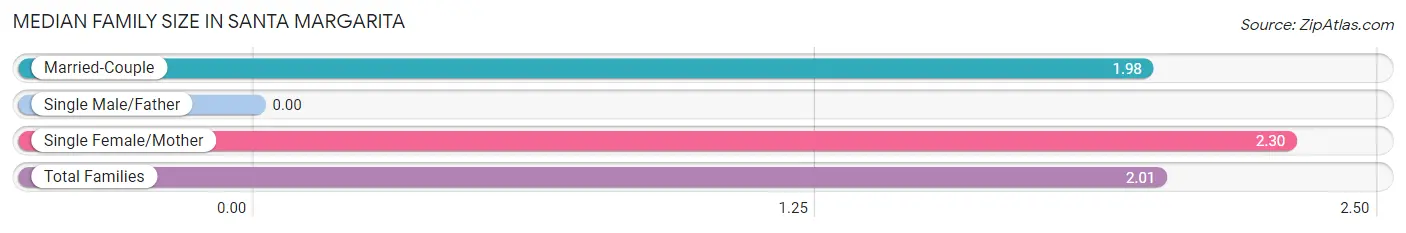
| Family Type | # Families | Family Size |
| Married-Couple | 208 (90.0%) | 1.98 |
| Single Male/Father | 0 (0.0%) | - |
| Single Female/Mother | 23 (10.0%) | 2.30 |
| Total Families | 231 (100.0%) | 2.01 |
Median Household Size in Santa Margarita
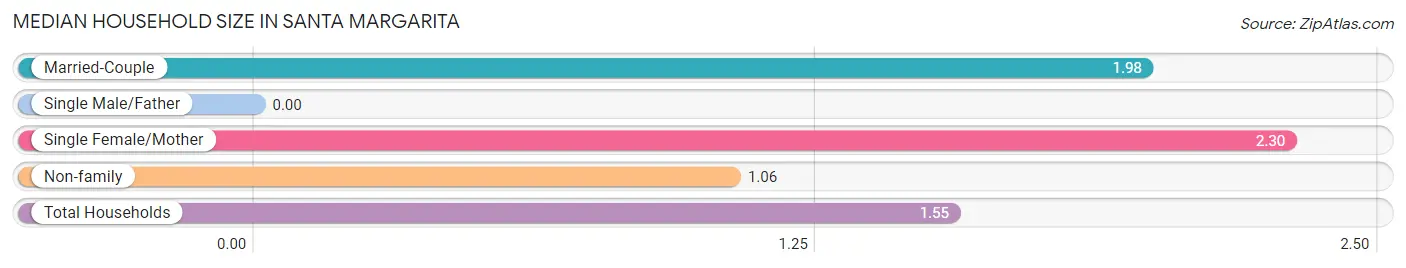
| Household Type | # Households | Household Size |
| Married-Couple | 208 (46.1%) | 1.98 |
| Single Male/Father | 0 (0.0%) | - |
| Single Female/Mother | 23 (5.1%) | 2.30 |
| Non-family | 220 (48.8%) | 1.06 |
| Total Households | 451 (100.0%) | 1.55 |
Household Size by Marriage Status in Santa Margarita
Out of a total of 451 households in Santa Margarita, 231 (51.2%) are family households, while 220 (48.8%) are nonfamily households. The most numerous type of family households are 2-person households, comprising 231, and the most common type of nonfamily households are 1-person households, comprising 208.
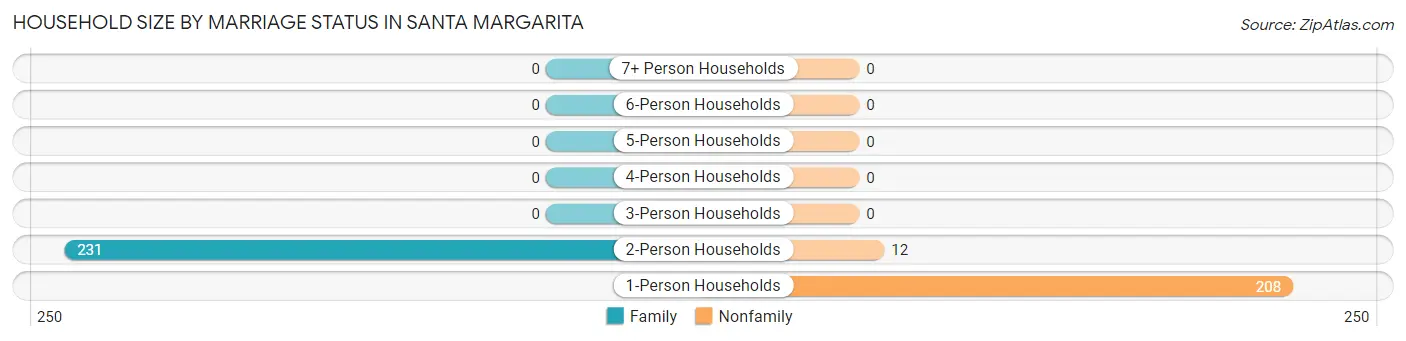
| Household Size | Family Households | Nonfamily Households |
| 1-Person Households | - | 208 (46.1%) |
| 2-Person Households | 231 (51.2%) | 12 (2.7%) |
| 3-Person Households | 0 (0.0%) | 0 (0.0%) |
| 4-Person Households | 0 (0.0%) | 0 (0.0%) |
| 5-Person Households | 0 (0.0%) | 0 (0.0%) |
| 6-Person Households | 0 (0.0%) | 0 (0.0%) |
| 7+ Person Households | 0 (0.0%) | 0 (0.0%) |
| Total | 231 (51.2%) | 220 (48.8%) |
Female Fertility in Santa Margarita
Fertility by Age in Santa Margarita
| Age Bracket | Women with Births | Births / 1,000 Women |
| 15 to 19 years | 0 (0.0%) | 0.0 |
| 20 to 34 years | 0 (0.0%) | 0.0 |
| 35 to 50 years | 0 (0.0%) | 0.0 |
| Total | 0 (0.0%) | 0.0 |
Fertility by Age by Marriage Status in Santa Margarita
| Age Bracket | Married | Unmarried |
| 15 to 19 years | 0 (0.0%) | 0 (0.0%) |
| 20 to 34 years | 0 (0.0%) | 0 (0.0%) |
| 35 to 50 years | 0 (0.0%) | 0 (0.0%) |
| Total | 0 (0.0%) | 0 (0.0%) |
Fertility by Education in Santa Margarita
| Educational Attainment | Women with Births | Births / 1,000 Women |
| Less than High School | 0 (0.0%) | 0.0 |
| High School Diploma | 0 (0.0%) | 0.0 |
| College or Associate's Degree | 0 (0.0%) | 0.0 |
| Bachelor's Degree | 0 (0.0%) | 0.0 |
| Graduate Degree | 0 (0.0%) | 0.0 |
| Total | 0 (0.0%) | 0.0 |
Fertility by Education by Marriage Status in Santa Margarita
| Educational Attainment | Married | Unmarried |
| Less than High School | 0 (0.0%) | 0 (0.0%) |
| High School Diploma | 0 (0.0%) | 0 (0.0%) |
| College or Associate's Degree | 0 (0.0%) | 0 (0.0%) |
| Bachelor's Degree | 0 (0.0%) | 0 (0.0%) |
| Graduate Degree | 0 (0.0%) | 0 (0.0%) |
| Total | 0 (0.0%) | 0 (0.0%) |
Employment Characteristics in Santa Margarita
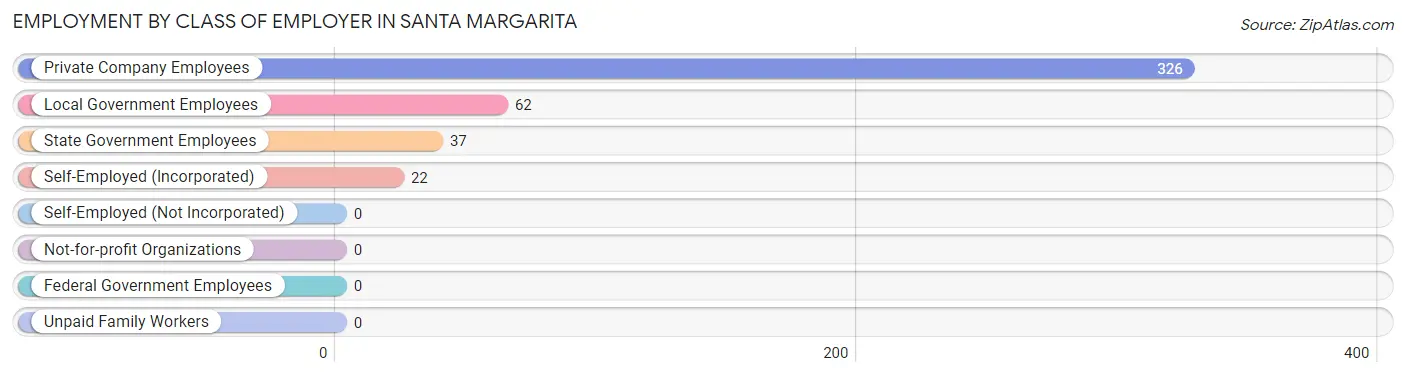
Employment by Class of Employer in Santa Margarita
Among the 447 employed individuals in Santa Margarita, private company employees (326 | 72.9%), local government employees (62 | 13.9%), and state government employees (37 | 8.3%) make up the most common classes of employment.
| Employer Class | # Employees | % Employees |
| Private Company Employees | 326 | 72.9% |
| Self-Employed (Incorporated) | 22 | 4.9% |
| Self-Employed (Not Incorporated) | 0 | 0.0% |
| Not-for-profit Organizations | 0 | 0.0% |
| Local Government Employees | 62 | 13.9% |
| State Government Employees | 37 | 8.3% |
| Federal Government Employees | 0 | 0.0% |
| Unpaid Family Workers | 0 | 0.0% |
| Total | 447 | 100.0% |
Employment Status by Age in Santa Margarita
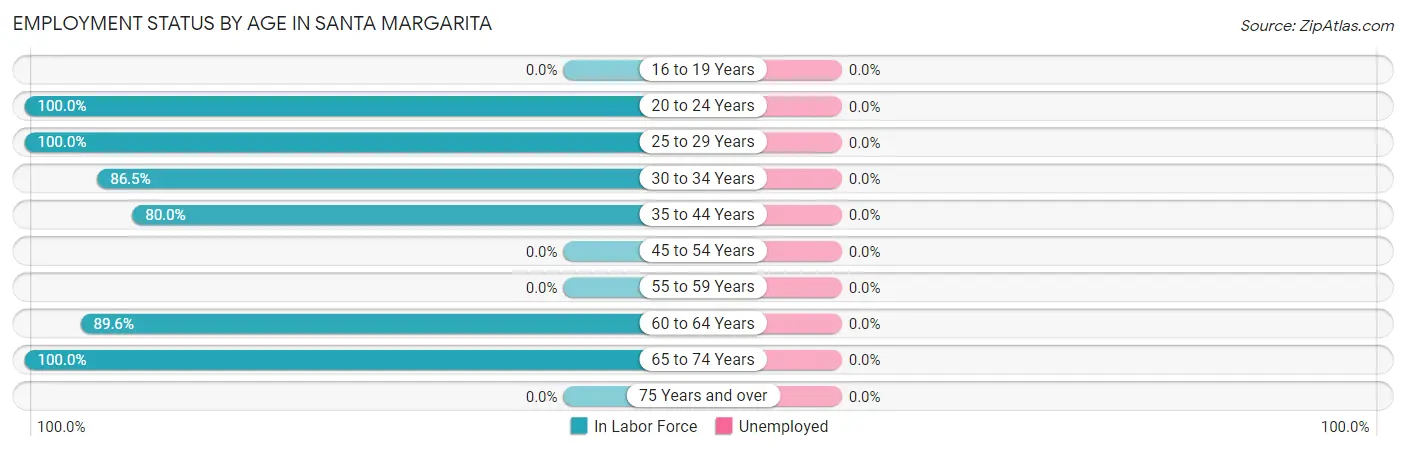
| Age Bracket | In Labor Force | Unemployed |
| 16 to 19 Years | 0 (0.0%) | 0 (0.0%) |
| 20 to 24 Years | 14 (100.0%) | 0 (0.0%) |
| 25 to 29 Years | 48 (100.0%) | 0 (0.0%) |
| 30 to 34 Years | 77 (86.5%) | 0 (0.0%) |
| 35 to 44 Years | 64 (80.0%) | 0 (0.0%) |
| 45 to 54 Years | 0 (0.0%) | 0 (0.0%) |
| 55 to 59 Years | 0 (0.0%) | 0 (0.0%) |
| 60 to 64 Years | 199 (89.6%) | 0 (0.0%) |
| 65 to 74 Years | 45 (100.0%) | 0 (0.0%) |
| 75 Years and over | 0 (0.0%) | 0 (0.0%) |
| Total | 447 (64.0%) | 0 (0.0%) |
Employment Status by Educational Attainment in Santa Margarita
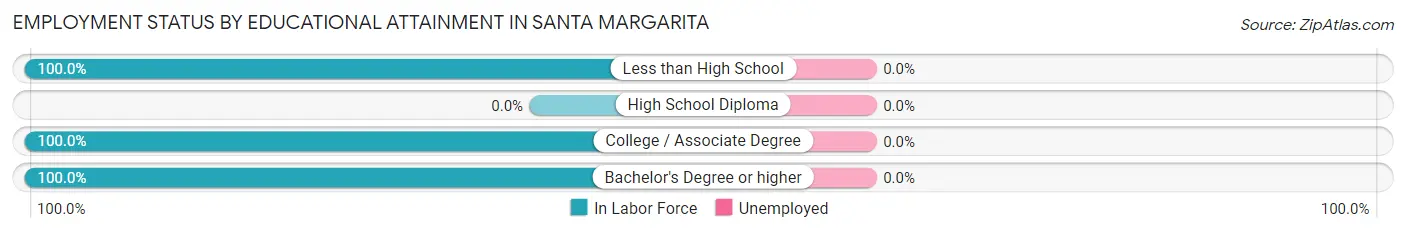
| Educational Attainment | In Labor Force | Unemployed |
| Less than High School | 13 (100.0%) | 0 (0.0%) |
| High School Diploma | 0 (0.0%) | 0 (0.0%) |
| College / Associate Degree | 39 (100.0%) | 0 (0.0%) |
| Bachelor's Degree or higher | 336 (100.0%) | 0 (0.0%) |
| Total | 388 (88.4%) | 0 (0.0%) |
Employment Occupations by Sex in Santa Margarita
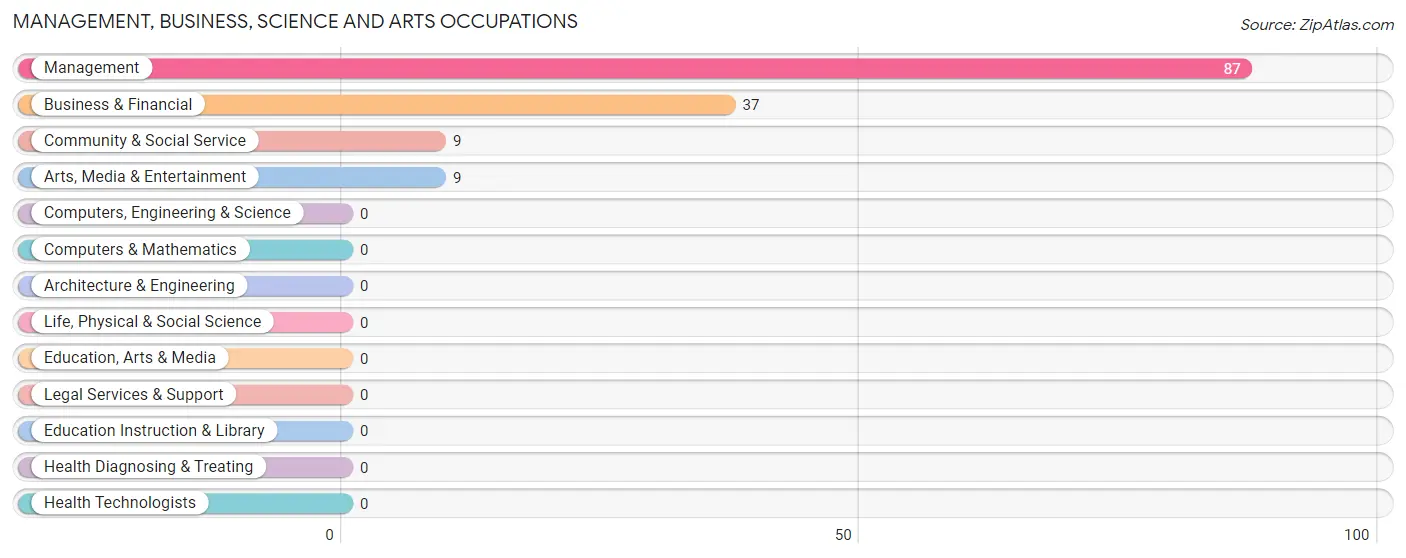
Management, Business, Science and Arts Occupations
The most common Management, Business, Science and Arts occupations in Santa Margarita are Management (87 | 19.5%), Business & Financial (37 | 8.3%), Community & Social Service (9 | 2.0%), and Arts, Media & Entertainment (9 | 2.0%).
Management, Business, Science and Arts Occupations by Sex
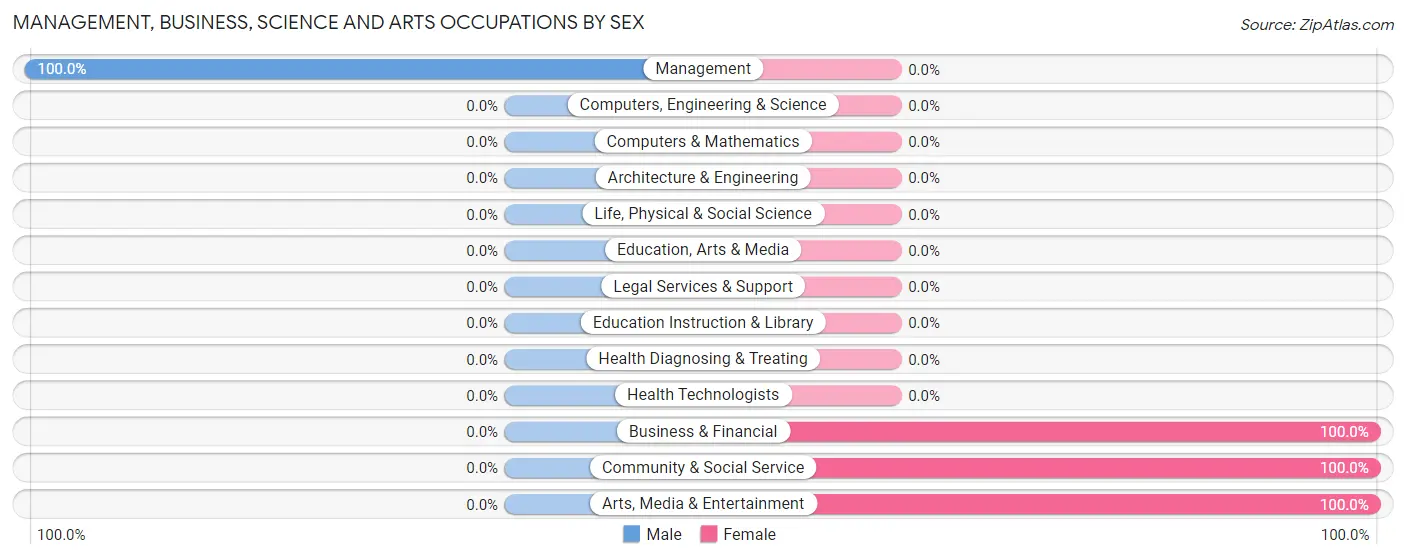
| Occupation | Male | Female |
| Management | 87 (100.0%) | 0 (0.0%) |
| Business & Financial | 0 (0.0%) | 37 (100.0%) |
| Computers, Engineering & Science | 0 (0.0%) | 0 (0.0%) |
| Computers & Mathematics | 0 (0.0%) | 0 (0.0%) |
| Architecture & Engineering | 0 (0.0%) | 0 (0.0%) |
| Life, Physical & Social Science | 0 (0.0%) | 0 (0.0%) |
| Community & Social Service | 0 (0.0%) | 9 (100.0%) |
| Education, Arts & Media | 0 (0.0%) | 0 (0.0%) |
| Legal Services & Support | 0 (0.0%) | 0 (0.0%) |
| Education Instruction & Library | 0 (0.0%) | 0 (0.0%) |
| Arts, Media & Entertainment | 0 (0.0%) | 9 (100.0%) |
| Health Diagnosing & Treating | 0 (0.0%) | 0 (0.0%) |
| Health Technologists | 0 (0.0%) | 0 (0.0%) |
| Total (Category) | 87 (65.4%) | 46 (34.6%) |
| Total (Overall) | 213 (47.6%) | 234 (52.3%) |
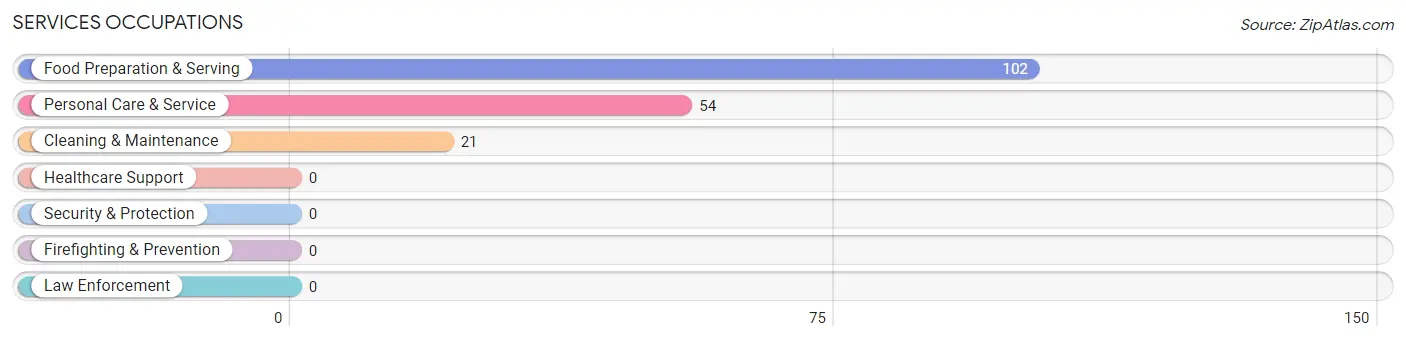
Services Occupations
The most common Services occupations in Santa Margarita are Food Preparation & Serving (102 | 22.8%), Personal Care & Service (54 | 12.1%), and Cleaning & Maintenance (21 | 4.7%).
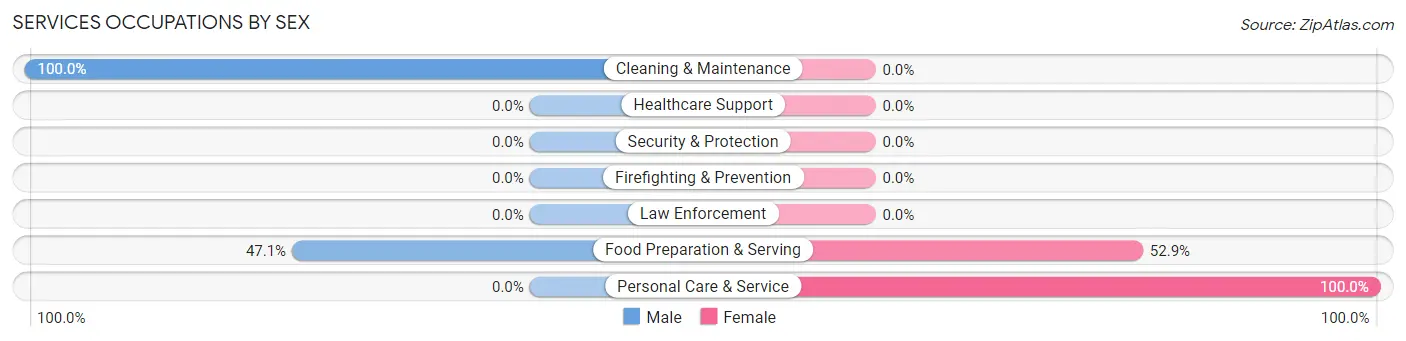
Services Occupations by Sex
Within the Services occupations in Santa Margarita, the most male-oriented occupations are Cleaning & Maintenance (100.0%), and Food Preparation & Serving (47.1%), while the most female-oriented occupations are Personal Care & Service (100.0%), and Food Preparation & Serving (52.9%).
| Occupation | Male | Female |
| Healthcare Support | 0 (0.0%) | 0 (0.0%) |
| Security & Protection | 0 (0.0%) | 0 (0.0%) |
| Firefighting & Prevention | 0 (0.0%) | 0 (0.0%) |
| Law Enforcement | 0 (0.0%) | 0 (0.0%) |
| Food Preparation & Serving | 48 (47.1%) | 54 (52.9%) |
| Cleaning & Maintenance | 21 (100.0%) | 0 (0.0%) |
| Personal Care & Service | 0 (0.0%) | 54 (100.0%) |
| Total (Category) | 69 (39.0%) | 108 (61.0%) |
| Total (Overall) | 213 (47.6%) | 234 (52.3%) |
Sales and Office Occupations
The most common Sales and Office occupations in Santa Margarita are , and Office & Administration (58 | 13.0%).

Sales and Office Occupations by Sex

| Occupation | Male | Female |
| Sales & Related | 0 (0.0%) | 0 (0.0%) |
| Office & Administration | 0 (0.0%) | 58 (100.0%) |
| Total (Category) | 0 (0.0%) | 58 (100.0%) |
| Total (Overall) | 213 (47.6%) | 234 (52.3%) |
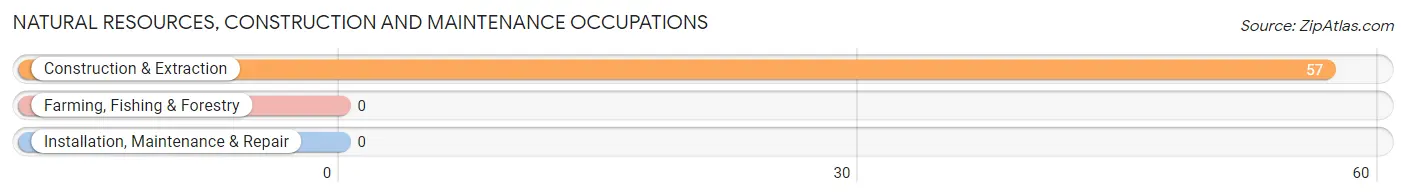
Natural Resources, Construction and Maintenance Occupations
The most common Natural Resources, Construction and Maintenance occupations in Santa Margarita are , and Construction & Extraction (57 | 12.8%).
Natural Resources, Construction and Maintenance Occupations by Sex

| Occupation | Male | Female |
| Farming, Fishing & Forestry | 0 (0.0%) | 0 (0.0%) |
| Construction & Extraction | 57 (100.0%) | 0 (0.0%) |
| Installation, Maintenance & Repair | 0 (0.0%) | 0 (0.0%) |
| Total (Category) | 57 (100.0%) | 0 (0.0%) |
| Total (Overall) | 213 (47.6%) | 234 (52.3%) |
Production, Transportation and Moving Occupations
The most common Production, Transportation and Moving occupations in Santa Margarita are , and Material Moving (22 | 4.9%).
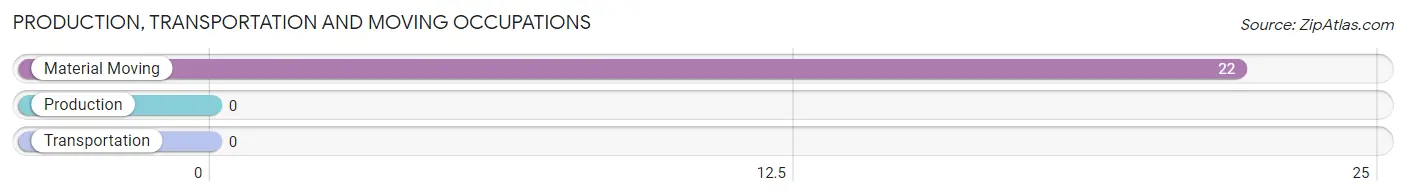
Production, Transportation and Moving Occupations by Sex
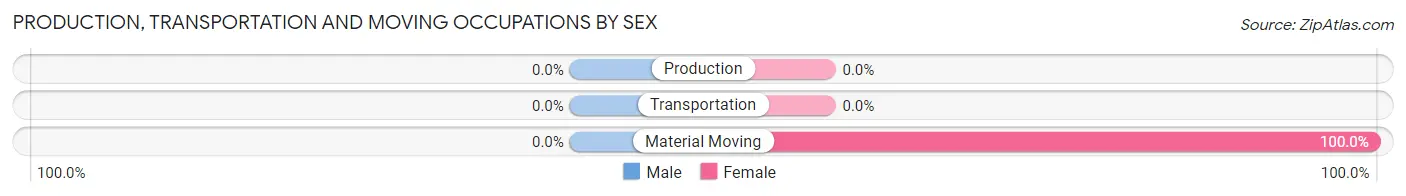
| Occupation | Male | Female |
| Production | 0 (0.0%) | 0 (0.0%) |
| Transportation | 0 (0.0%) | 0 (0.0%) |
| Material Moving | 0 (0.0%) | 22 (100.0%) |
| Total (Category) | 0 (0.0%) | 22 (100.0%) |
| Total (Overall) | 213 (47.6%) | 234 (52.3%) |
Employment Industries by Sex in Santa Margarita
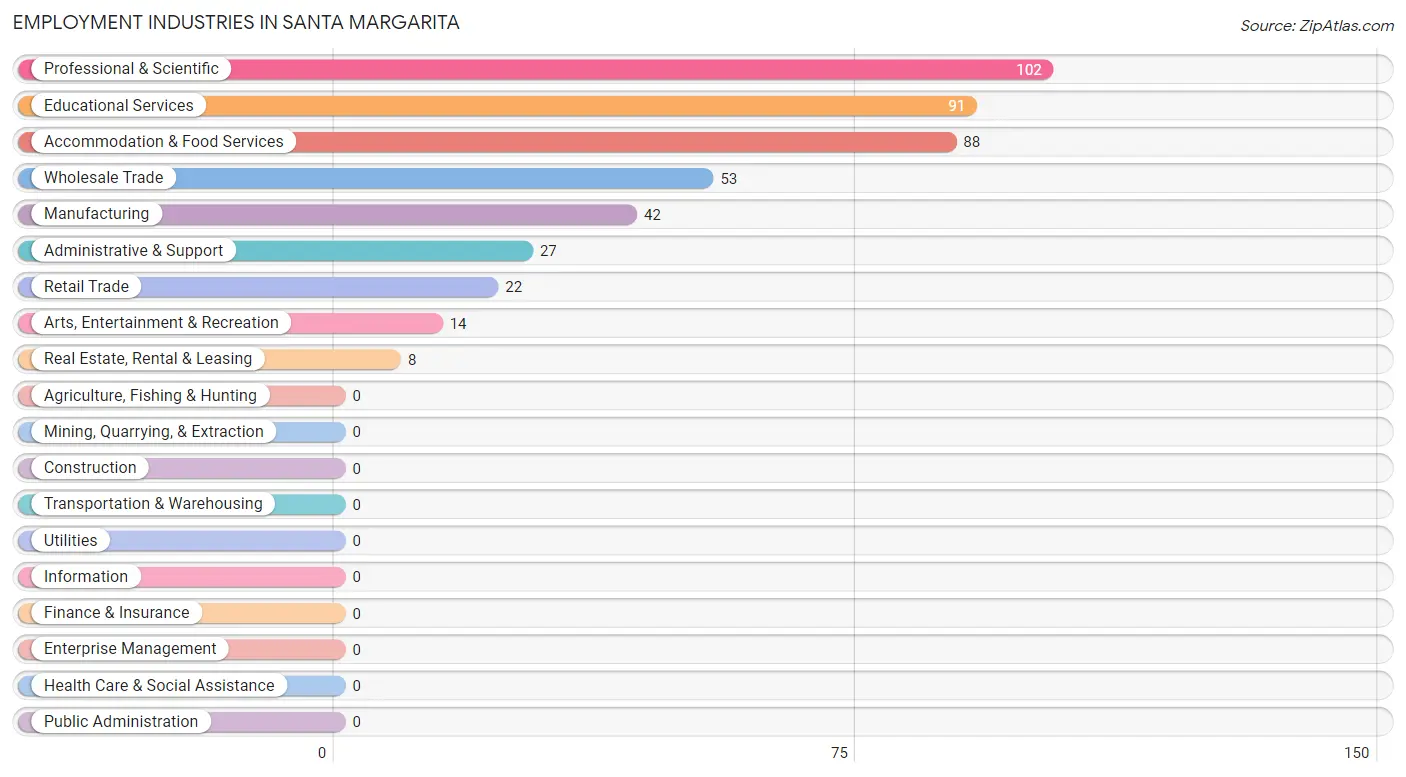
Employment Industries in Santa Margarita
The major employment industries in Santa Margarita include Professional & Scientific (102 | 22.8%), Educational Services (91 | 20.4%), Accommodation & Food Services (88 | 19.7%), Wholesale Trade (53 | 11.9%), and Manufacturing (42 | 9.4%).
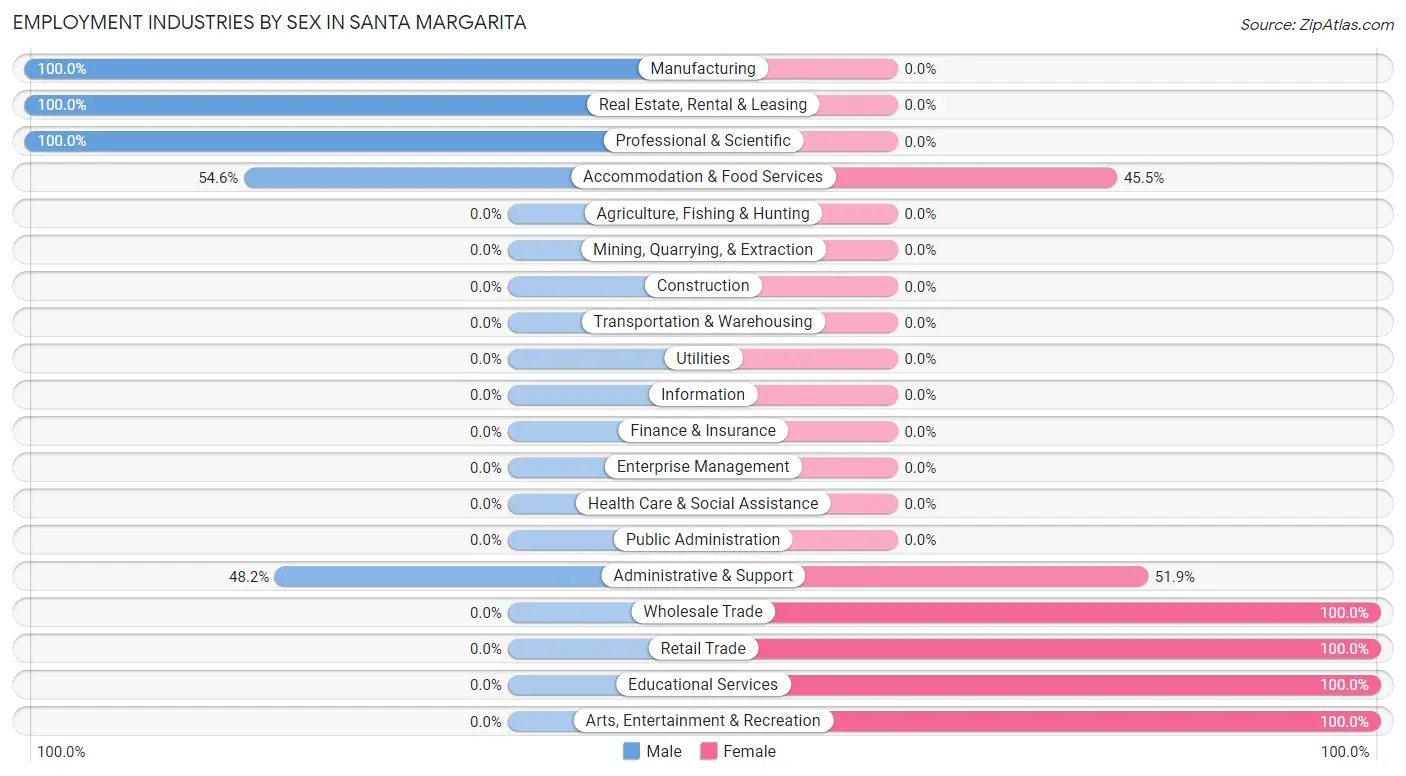
Employment Industries by Sex in Santa Margarita
The Santa Margarita industries that see more men than women are Manufacturing (100.0%), Real Estate, Rental & Leasing (100.0%), and Professional & Scientific (100.0%), whereas the industries that tend to have a higher number of women are Wholesale Trade (100.0%), Retail Trade (100.0%), and Educational Services (100.0%).
| Industry | Male | Female |
| Agriculture, Fishing & Hunting | 0 (0.0%) | 0 (0.0%) |
| Mining, Quarrying, & Extraction | 0 (0.0%) | 0 (0.0%) |
| Construction | 0 (0.0%) | 0 (0.0%) |
| Manufacturing | 42 (100.0%) | 0 (0.0%) |
| Wholesale Trade | 0 (0.0%) | 53 (100.0%) |
| Retail Trade | 0 (0.0%) | 22 (100.0%) |
| Transportation & Warehousing | 0 (0.0%) | 0 (0.0%) |
| Utilities | 0 (0.0%) | 0 (0.0%) |
| Information | 0 (0.0%) | 0 (0.0%) |
| Finance & Insurance | 0 (0.0%) | 0 (0.0%) |
| Real Estate, Rental & Leasing | 8 (100.0%) | 0 (0.0%) |
| Professional & Scientific | 102 (100.0%) | 0 (0.0%) |
| Enterprise Management | 0 (0.0%) | 0 (0.0%) |
| Administrative & Support | 13 (48.1%) | 14 (51.8%) |
| Educational Services | 0 (0.0%) | 91 (100.0%) |
| Health Care & Social Assistance | 0 (0.0%) | 0 (0.0%) |
| Arts, Entertainment & Recreation | 0 (0.0%) | 14 (100.0%) |
| Accommodation & Food Services | 48 (54.5%) | 40 (45.5%) |
| Public Administration | 0 (0.0%) | 0 (0.0%) |
| Total | 213 (47.6%) | 234 (52.3%) |
Education in Santa Margarita
School Enrollment in Santa Margarita
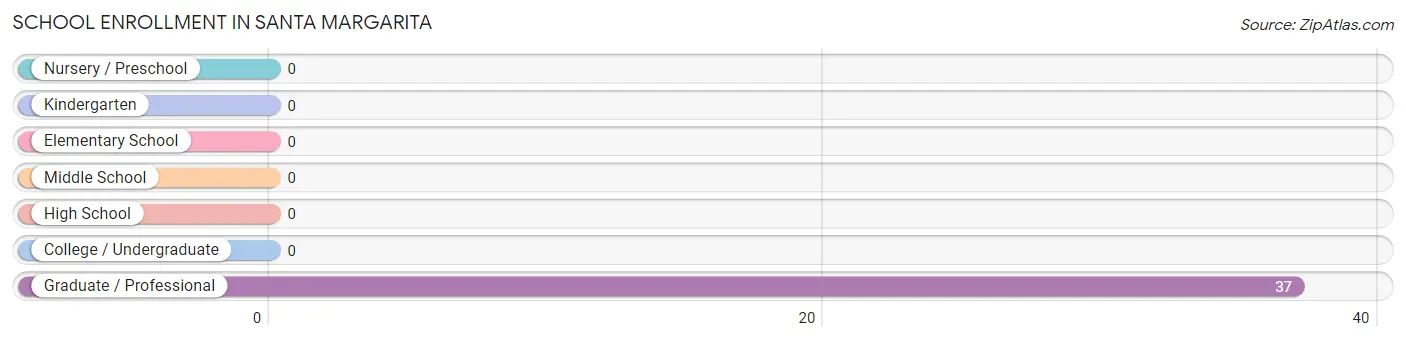
| School Level | # Students | % Students |
| Nursery / Preschool | 0 | 0.0% |
| Kindergarten | 0 | 0.0% |
| Elementary School | 0 | 0.0% |
| Middle School | 0 | 0.0% |
| High School | 0 | 0.0% |
| College / Undergraduate | 0 | 0.0% |
| Graduate / Professional | 37 | 100.0% |
| Total | 37 | 100.0% |
School Enrollment by Age by Funding Source in Santa Margarita
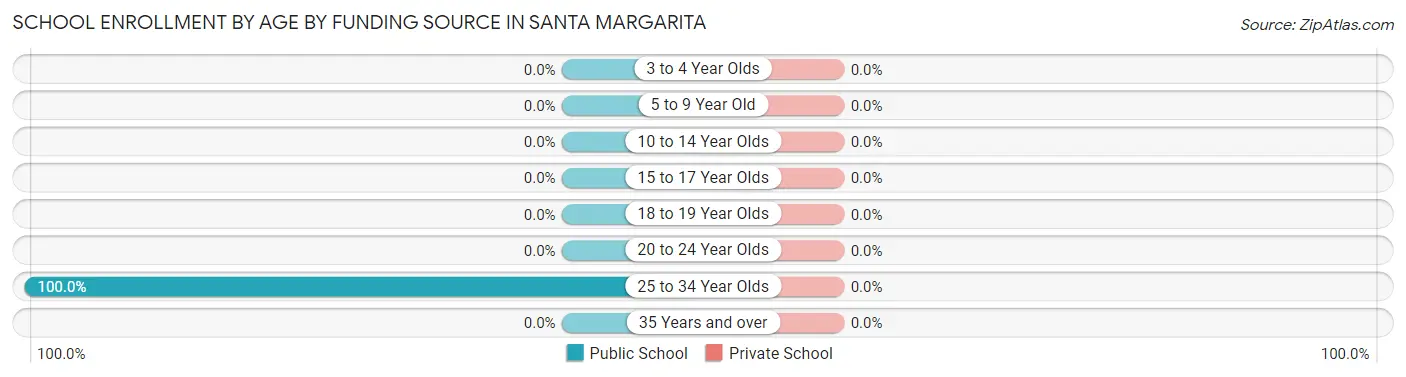
| Age Bracket | Public School | Private School |
| 3 to 4 Year Olds | 0 (0.0%) | 0 (0.0%) |
| 5 to 9 Year Old | 0 (0.0%) | 0 (0.0%) |
| 10 to 14 Year Olds | 0 (0.0%) | 0 (0.0%) |
| 15 to 17 Year Olds | 0 (0.0%) | 0 (0.0%) |
| 18 to 19 Year Olds | 0 (0.0%) | 0 (0.0%) |
| 20 to 24 Year Olds | 0 (0.0%) | 0 (0.0%) |
| 25 to 34 Year Olds | 37 (100.0%) | 0 (0.0%) |
| 35 Years and over | 0 (0.0%) | 0 (0.0%) |
| Total | 37 (100.0%) | 0 (0.0%) |
Educational Attainment by Field of Study in Santa Margarita
Bio, nature & agricultural (160 | 42.0%), engineering (79 | 20.7%), arts & humanities (54 | 14.2%), liberal arts & history (48 | 12.6%), and visual & performing arts (40 | 10.5%) are the most common fields of study among 381 individuals in Santa Margarita who have obtained a bachelor's degree or higher.
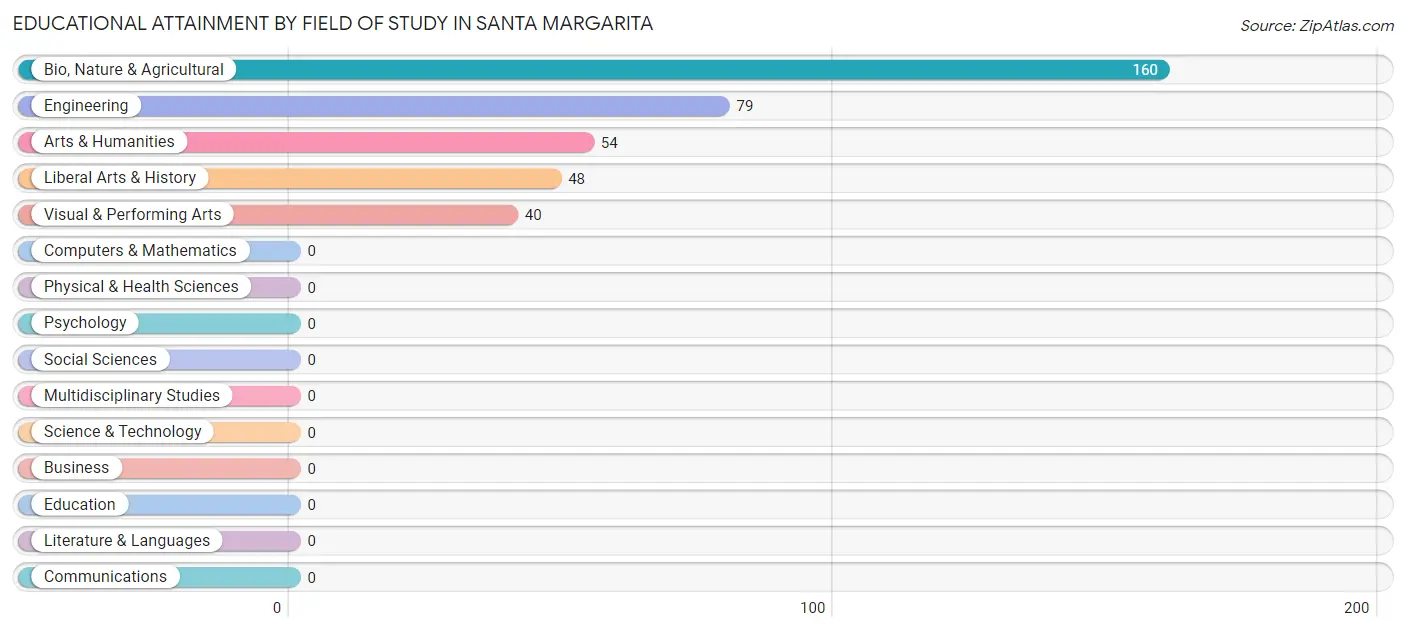
| Field of Study | # Graduates | % Graduates |
| Computers & Mathematics | 0 | 0.0% |
| Bio, Nature & Agricultural | 160 | 42.0% |
| Physical & Health Sciences | 0 | 0.0% |
| Psychology | 0 | 0.0% |
| Social Sciences | 0 | 0.0% |
| Engineering | 79 | 20.7% |
| Multidisciplinary Studies | 0 | 0.0% |
| Science & Technology | 0 | 0.0% |
| Business | 0 | 0.0% |
| Education | 0 | 0.0% |
| Literature & Languages | 0 | 0.0% |
| Liberal Arts & History | 48 | 12.6% |
| Visual & Performing Arts | 40 | 10.5% |
| Communications | 0 | 0.0% |
| Arts & Humanities | 54 | 14.2% |
| Total | 381 | 100.0% |
Transportation & Commute in Santa Margarita
Vehicle Availability by Sex in Santa Margarita
The most prevalent vehicle ownership categories in Santa Margarita are males with 2 vehicles (168, accounting for 78.9%) and females with 2 vehicles (176, making up 71.8%).
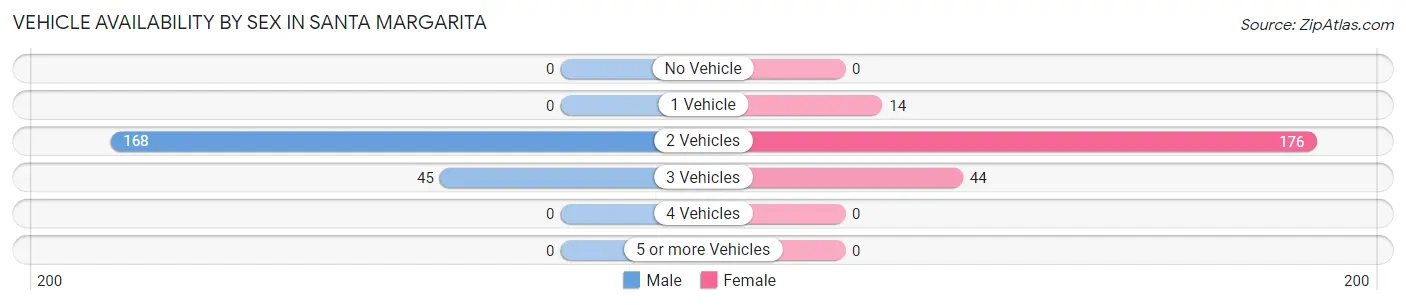
| Vehicles Available | Male | Female |
| No Vehicle | 0 (0.0%) | 0 (0.0%) |
| 1 Vehicle | 0 (0.0%) | 14 (6.0%) |
| 2 Vehicles | 168 (78.9%) | 176 (75.2%) |
| 3 Vehicles | 45 (21.1%) | 44 (18.8%) |
| 4 Vehicles | 0 (0.0%) | 0 (0.0%) |
| 5 or more Vehicles | 0 (0.0%) | 0 (0.0%) |
| Total | 213 (100.0%) | 234 (100.0%) |
Commute Time in Santa Margarita
The most frequently occuring commute durations in Santa Margarita are 10 to 14 minutes (88 commuters, 27.2%), 20 to 24 minutes (79 commuters, 24.4%), and 5 to 9 minutes (54 commuters, 16.7%).
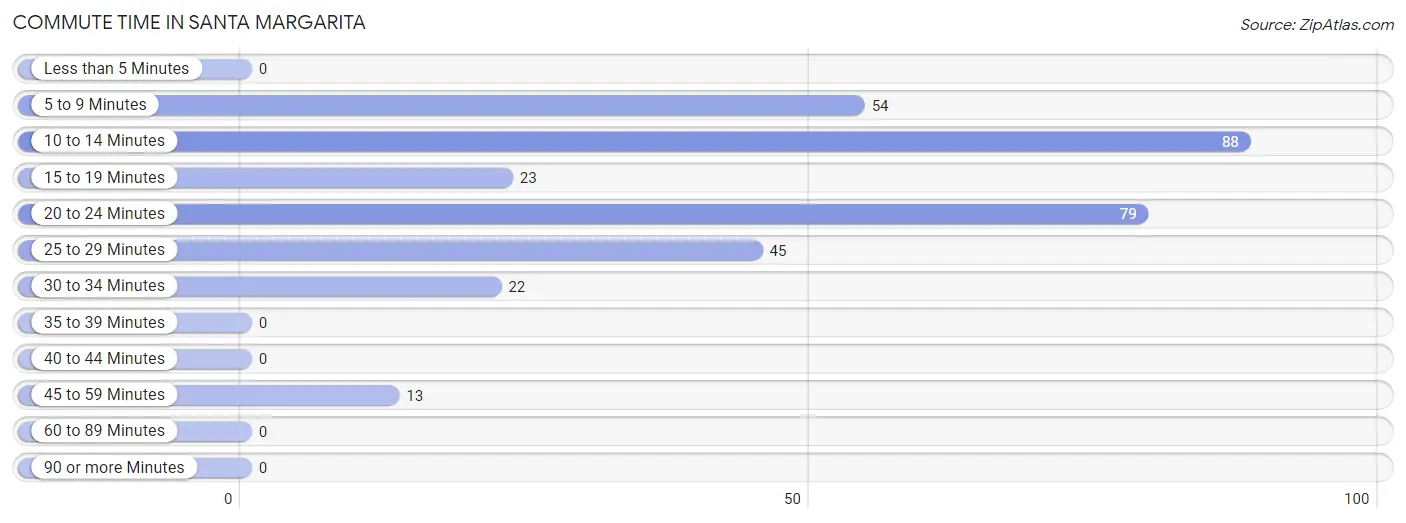
| Commute Time | # Commuters | % Commuters |
| Less than 5 Minutes | 0 | 0.0% |
| 5 to 9 Minutes | 54 | 16.7% |
| 10 to 14 Minutes | 88 | 27.2% |
| 15 to 19 Minutes | 23 | 7.1% |
| 20 to 24 Minutes | 79 | 24.4% |
| 25 to 29 Minutes | 45 | 13.9% |
| 30 to 34 Minutes | 22 | 6.8% |
| 35 to 39 Minutes | 0 | 0.0% |
| 40 to 44 Minutes | 0 | 0.0% |
| 45 to 59 Minutes | 13 | 4.0% |
| 60 to 89 Minutes | 0 | 0.0% |
| 90 or more Minutes | 0 | 0.0% |
Commute Time by Sex in Santa Margarita
The most common commute times in Santa Margarita are 20 to 24 minutes (65 commuters, 38.0%) for males and 5 to 9 minutes (54 commuters, 35.3%) for females.
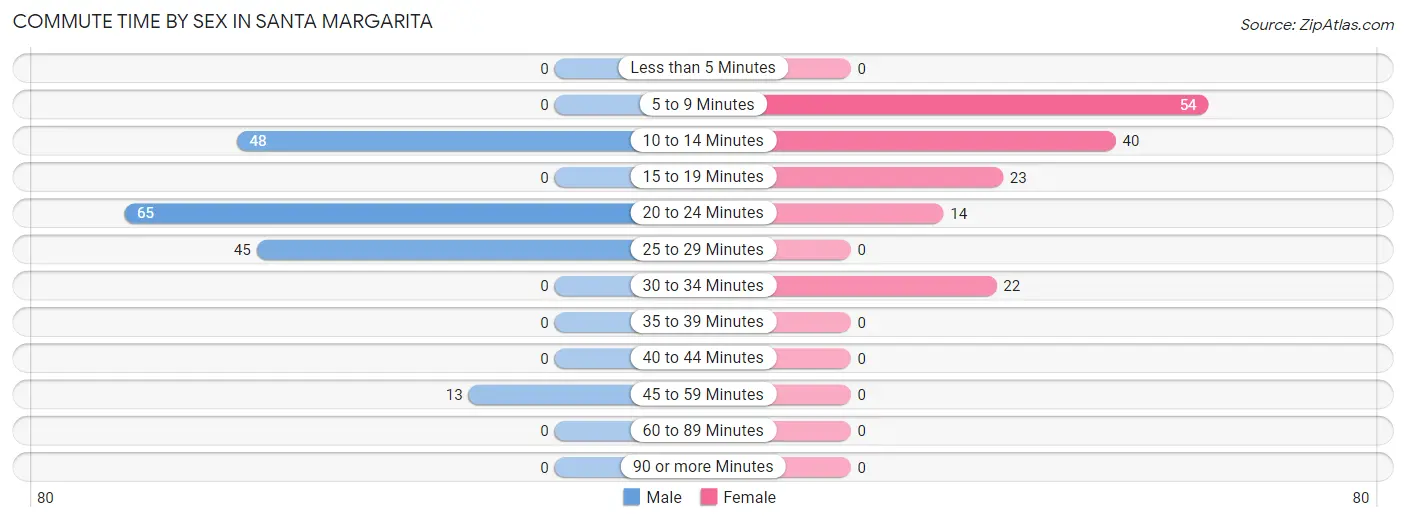
| Commute Time | Male | Female |
| Less than 5 Minutes | 0 (0.0%) | 0 (0.0%) |
| 5 to 9 Minutes | 0 (0.0%) | 54 (35.3%) |
| 10 to 14 Minutes | 48 (28.1%) | 40 (26.1%) |
| 15 to 19 Minutes | 0 (0.0%) | 23 (15.0%) |
| 20 to 24 Minutes | 65 (38.0%) | 14 (9.1%) |
| 25 to 29 Minutes | 45 (26.3%) | 0 (0.0%) |
| 30 to 34 Minutes | 0 (0.0%) | 22 (14.4%) |
| 35 to 39 Minutes | 0 (0.0%) | 0 (0.0%) |
| 40 to 44 Minutes | 0 (0.0%) | 0 (0.0%) |
| 45 to 59 Minutes | 13 (7.6%) | 0 (0.0%) |
| 60 to 89 Minutes | 0 (0.0%) | 0 (0.0%) |
| 90 or more Minutes | 0 (0.0%) | 0 (0.0%) |
Time of Departure to Work by Sex in Santa Margarita
The most frequent times of departure to work in Santa Margarita are 4:00 PM to 11:59 PM (57, 33.3%) for males and 8:00 AM to 8:29 AM (77, 50.3%) for females.
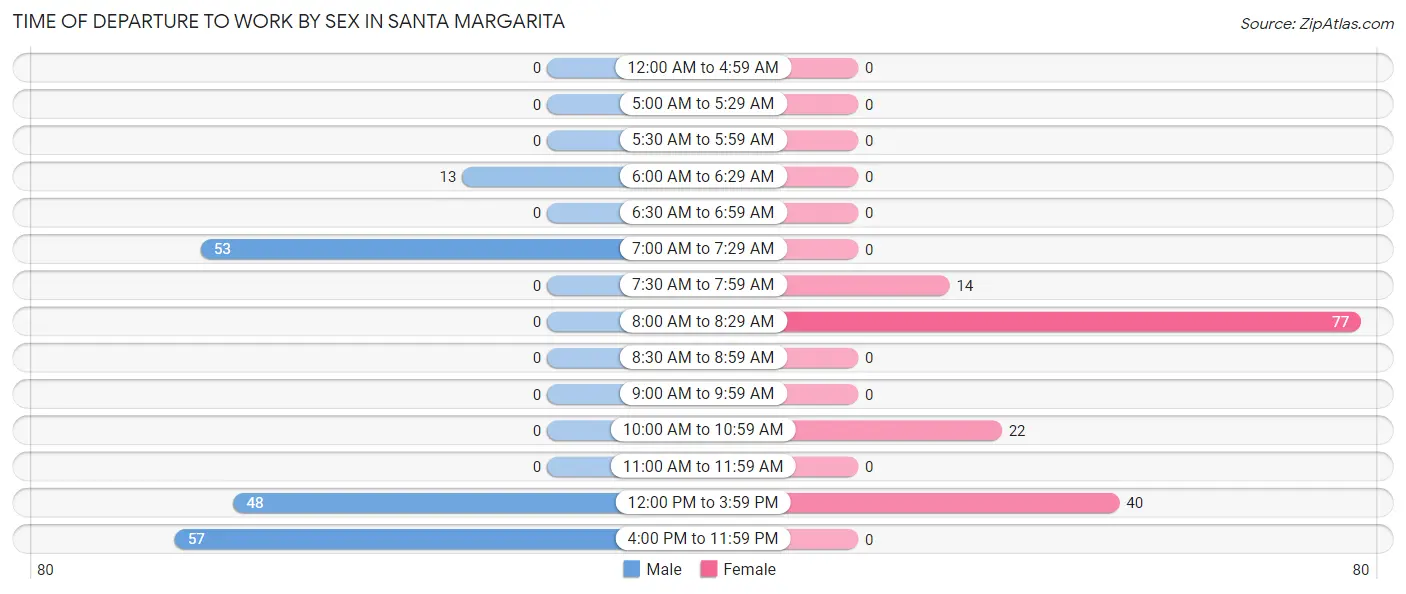
| Time of Departure | Male | Female |
| 12:00 AM to 4:59 AM | 0 (0.0%) | 0 (0.0%) |
| 5:00 AM to 5:29 AM | 0 (0.0%) | 0 (0.0%) |
| 5:30 AM to 5:59 AM | 0 (0.0%) | 0 (0.0%) |
| 6:00 AM to 6:29 AM | 13 (7.6%) | 0 (0.0%) |
| 6:30 AM to 6:59 AM | 0 (0.0%) | 0 (0.0%) |
| 7:00 AM to 7:29 AM | 53 (31.0%) | 0 (0.0%) |
| 7:30 AM to 7:59 AM | 0 (0.0%) | 14 (9.1%) |
| 8:00 AM to 8:29 AM | 0 (0.0%) | 77 (50.3%) |
| 8:30 AM to 8:59 AM | 0 (0.0%) | 0 (0.0%) |
| 9:00 AM to 9:59 AM | 0 (0.0%) | 0 (0.0%) |
| 10:00 AM to 10:59 AM | 0 (0.0%) | 22 (14.4%) |
| 11:00 AM to 11:59 AM | 0 (0.0%) | 0 (0.0%) |
| 12:00 PM to 3:59 PM | 48 (28.1%) | 40 (26.1%) |
| 4:00 PM to 11:59 PM | 57 (33.3%) | 0 (0.0%) |
| Total | 171 (100.0%) | 153 (100.0%) |
Housing Occupancy in Santa Margarita
Occupancy by Ownership in Santa Margarita
Of the total 451 dwellings in Santa Margarita, owner-occupied units account for 180 (39.9%), while renter-occupied units make up 271 (60.1%).
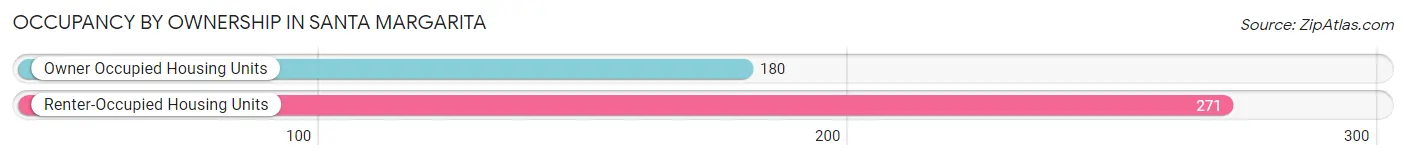
| Occupancy | # Housing Units | % Housing Units |
| Owner Occupied Housing Units | 180 | 39.9% |
| Renter-Occupied Housing Units | 271 | 60.1% |
| Total Occupied Housing Units | 451 | 100.0% |
Occupancy by Household Size in Santa Margarita
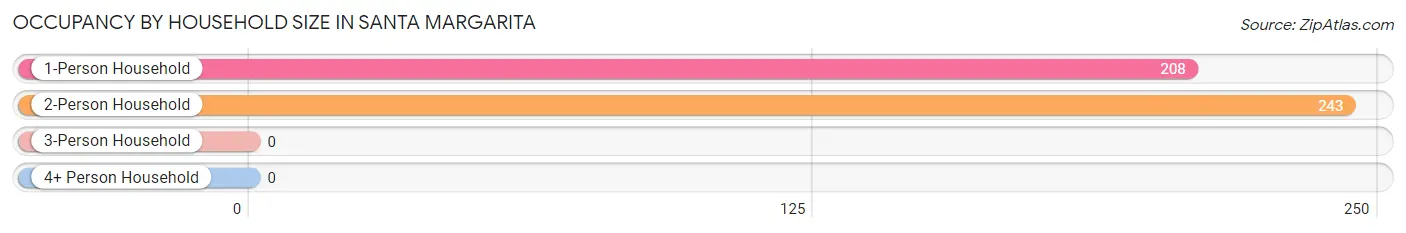
| Household Size | # Housing Units | % Housing Units |
| 1-Person Household | 208 | 46.1% |
| 2-Person Household | 243 | 53.9% |
| 3-Person Household | 0 | 0.0% |
| 4+ Person Household | 0 | 0.0% |
| Total Housing Units | 451 | 100.0% |
Occupancy by Ownership by Household Size in Santa Margarita
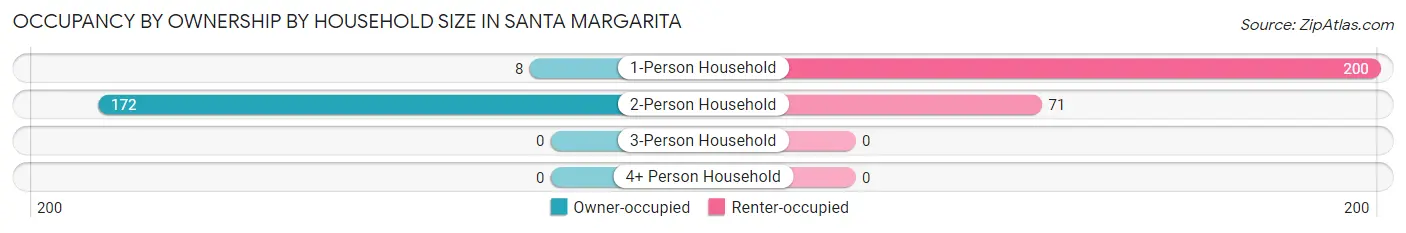
| Household Size | Owner-occupied | Renter-occupied |
| 1-Person Household | 8 (3.8%) | 200 (96.2%) |
| 2-Person Household | 172 (70.8%) | 71 (29.2%) |
| 3-Person Household | 0 (0.0%) | 0 (0.0%) |
| 4+ Person Household | 0 (0.0%) | 0 (0.0%) |
| Total Housing Units | 180 (39.9%) | 271 (60.1%) |
Occupancy by Educational Attainment in Santa Margarita
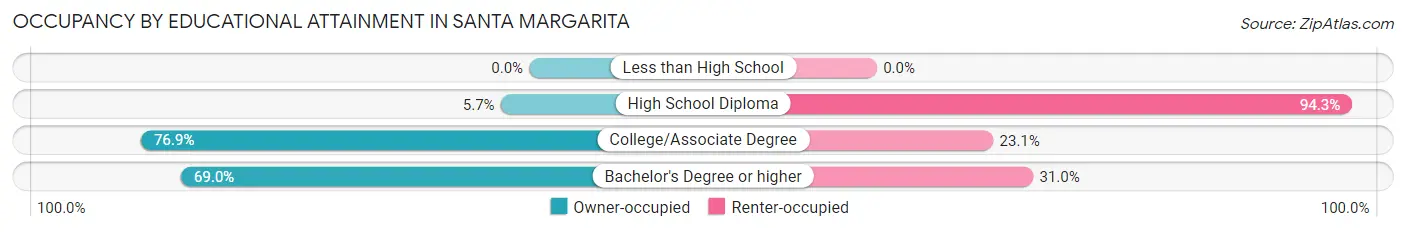
| Household Size | Owner-occupied | Renter-occupied |
| Less than High School | 0 (0.0%) | 0 (0.0%) |
| High School Diploma | 12 (5.7%) | 200 (94.3%) |
| College/Associate Degree | 30 (76.9%) | 9 (23.1%) |
| Bachelor's Degree or higher | 138 (69.0%) | 62 (31.0%) |
Occupancy by Age of Householder in Santa Margarita
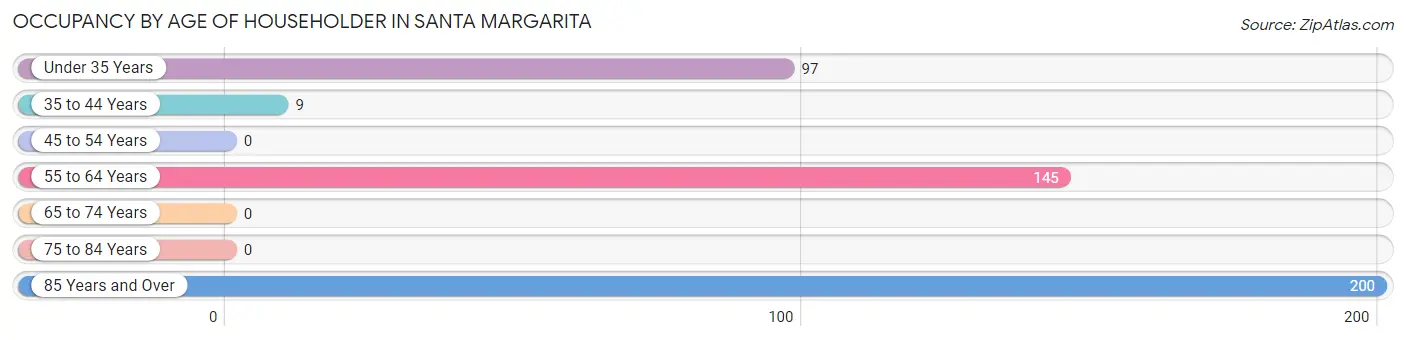
| Age Bracket | # Households | % Households |
| Under 35 Years | 97 | 21.5% |
| 35 to 44 Years | 9 | 2.0% |
| 45 to 54 Years | 0 | 0.0% |
| 55 to 64 Years | 145 | 32.2% |
| 65 to 74 Years | 0 | 0.0% |
| 75 to 84 Years | 0 | 0.0% |
| 85 Years and Over | 200 | 44.4% |
| Total | 451 | 100.0% |
Housing Finances in Santa Margarita
Median Income by Occupancy in Santa Margarita
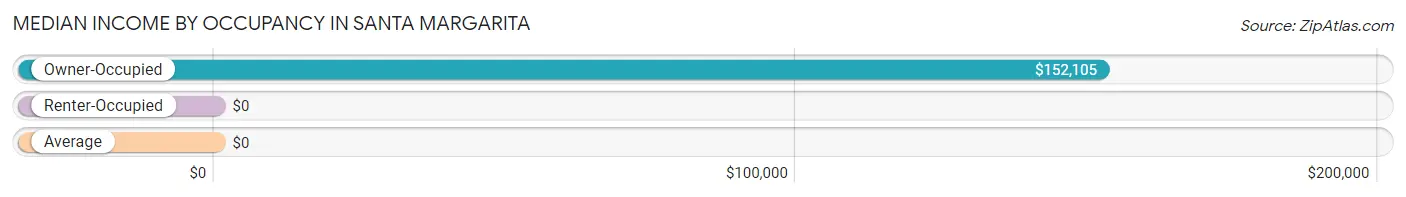
| Occupancy Type | # Households | Median Income |
| Owner-Occupied | 180 (39.9%) | $152,105 |
| Renter-Occupied | 271 (60.1%) | $0 |
| Average | 451 (100.0%) | $0 |
Occupancy by Householder Income Bracket in Santa Margarita
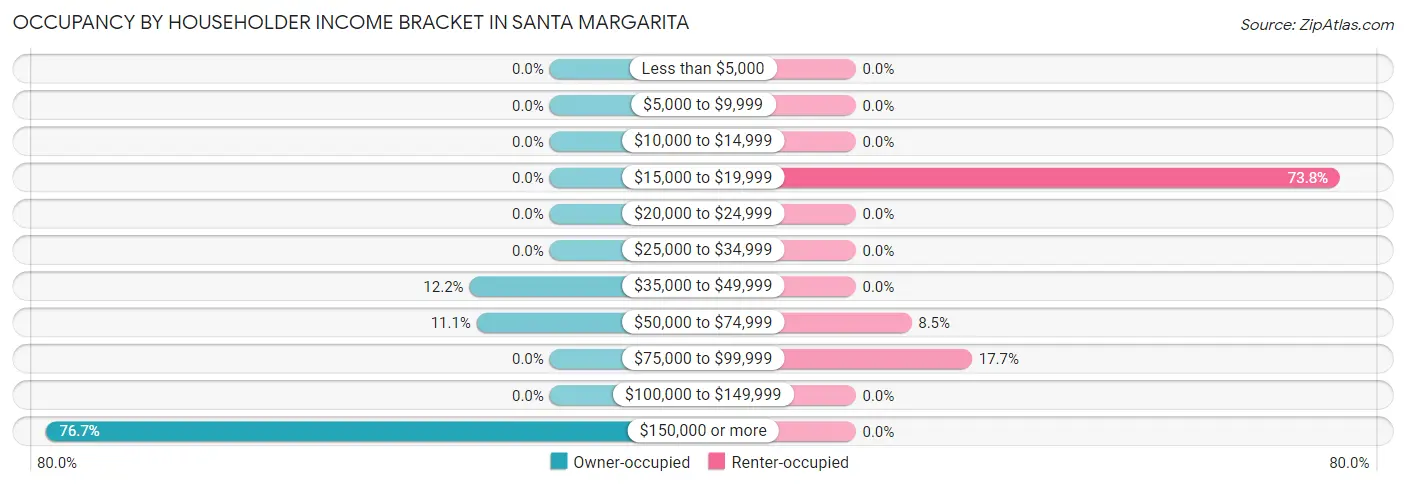
| Income Bracket | Owner-occupied | Renter-occupied |
| Less than $5,000 | 0 (0.0%) | 0 (0.0%) |
| $5,000 to $9,999 | 0 (0.0%) | 0 (0.0%) |
| $10,000 to $14,999 | 0 (0.0%) | 0 (0.0%) |
| $15,000 to $19,999 | 0 (0.0%) | 200 (73.8%) |
| $20,000 to $24,999 | 0 (0.0%) | 0 (0.0%) |
| $25,000 to $34,999 | 0 (0.0%) | 0 (0.0%) |
| $35,000 to $49,999 | 22 (12.2%) | 0 (0.0%) |
| $50,000 to $74,999 | 20 (11.1%) | 23 (8.5%) |
| $75,000 to $99,999 | 0 (0.0%) | 48 (17.7%) |
| $100,000 to $149,999 | 0 (0.0%) | 0 (0.0%) |
| $150,000 or more | 138 (76.7%) | 0 (0.0%) |
| Total | 180 (100.0%) | 271 (100.0%) |
Monthly Housing Cost Tiers in Santa Margarita
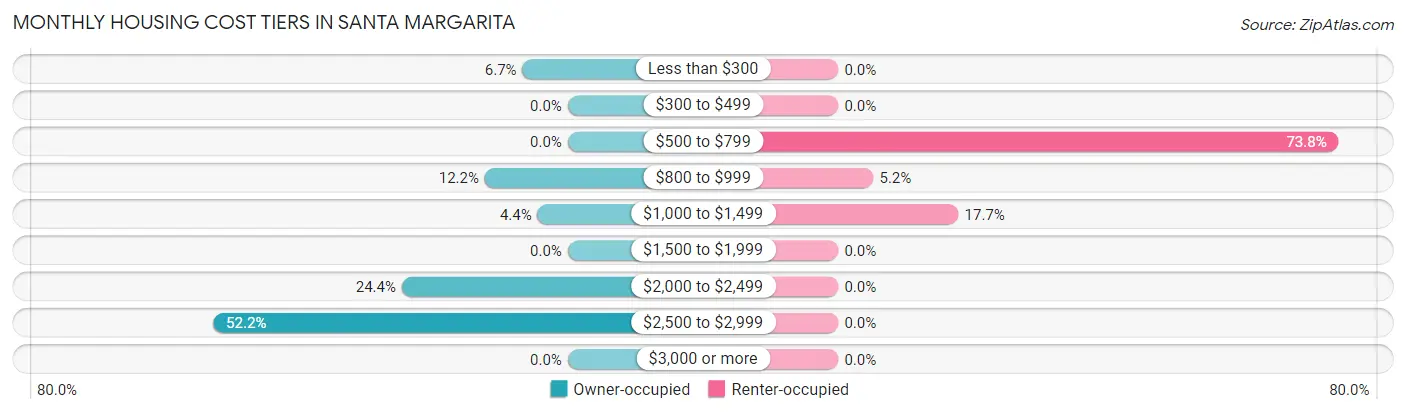
| Monthly Cost | Owner-occupied | Renter-occupied |
| Less than $300 | 12 (6.7%) | 0 (0.0%) |
| $300 to $499 | 0 (0.0%) | 0 (0.0%) |
| $500 to $799 | 0 (0.0%) | 200 (73.8%) |
| $800 to $999 | 22 (12.2%) | 14 (5.2%) |
| $1,000 to $1,499 | 8 (4.4%) | 48 (17.7%) |
| $1,500 to $1,999 | 0 (0.0%) | 0 (0.0%) |
| $2,000 to $2,499 | 44 (24.4%) | 0 (0.0%) |
| $2,500 to $2,999 | 94 (52.2%) | 0 (0.0%) |
| $3,000 or more | 0 (0.0%) | 0 (0.0%) |
| Total | 180 (100.0%) | 271 (100.0%) |
Physical Housing Characteristics in Santa Margarita
Housing Structures in Santa Margarita
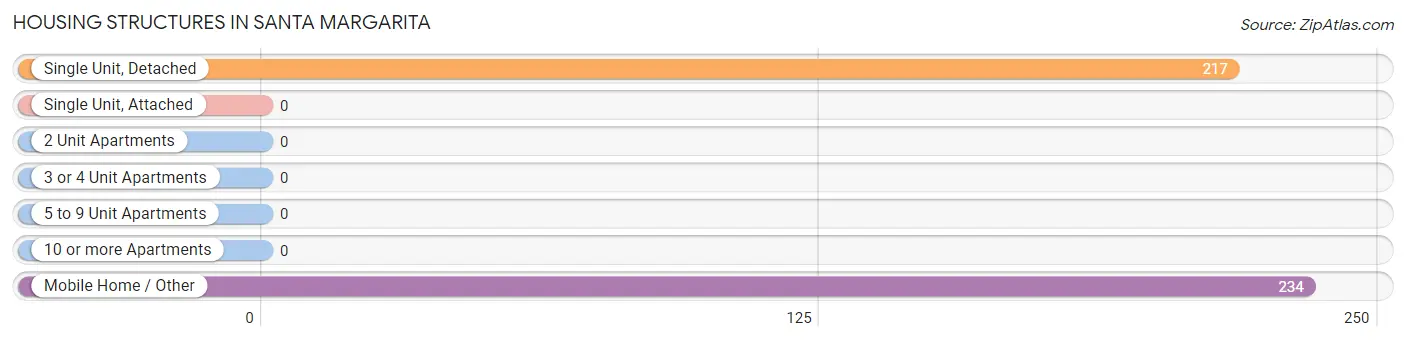
| Structure Type | # Housing Units | % Housing Units |
| Single Unit, Detached | 217 | 48.1% |
| Single Unit, Attached | 0 | 0.0% |
| 2 Unit Apartments | 0 | 0.0% |
| 3 or 4 Unit Apartments | 0 | 0.0% |
| 5 to 9 Unit Apartments | 0 | 0.0% |
| 10 or more Apartments | 0 | 0.0% |
| Mobile Home / Other | 234 | 51.9% |
| Total | 451 | 100.0% |
Housing Structures by Occupancy in Santa Margarita
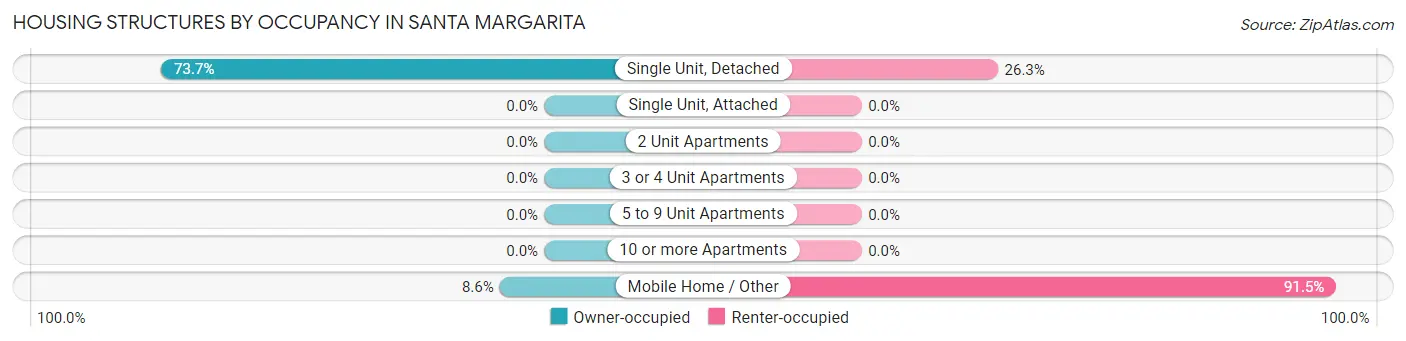
| Structure Type | Owner-occupied | Renter-occupied |
| Single Unit, Detached | 160 (73.7%) | 57 (26.3%) |
| Single Unit, Attached | 0 (0.0%) | 0 (0.0%) |
| 2 Unit Apartments | 0 (0.0%) | 0 (0.0%) |
| 3 or 4 Unit Apartments | 0 (0.0%) | 0 (0.0%) |
| 5 to 9 Unit Apartments | 0 (0.0%) | 0 (0.0%) |
| 10 or more Apartments | 0 (0.0%) | 0 (0.0%) |
| Mobile Home / Other | 20 (8.6%) | 214 (91.4%) |
| Total | 180 (39.9%) | 271 (60.1%) |
Housing Structures by Number of Rooms in Santa Margarita
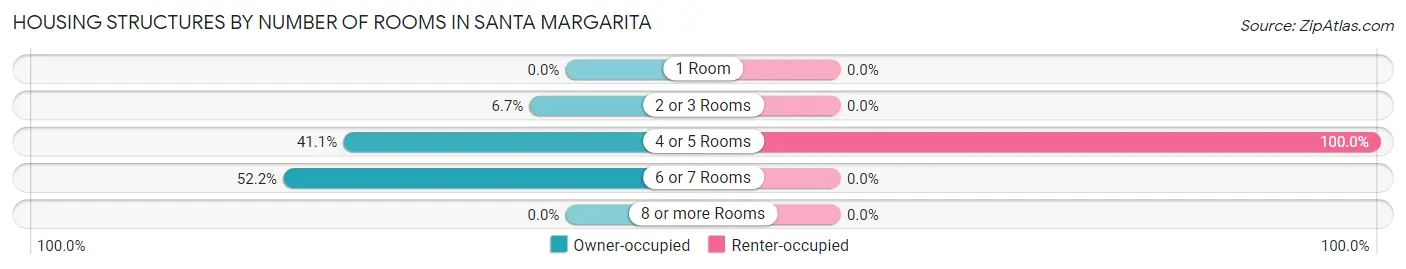
| Number of Rooms | Owner-occupied | Renter-occupied |
| 1 Room | 0 (0.0%) | 0 (0.0%) |
| 2 or 3 Rooms | 12 (6.7%) | 0 (0.0%) |
| 4 or 5 Rooms | 74 (41.1%) | 271 (100.0%) |
| 6 or 7 Rooms | 94 (52.2%) | 0 (0.0%) |
| 8 or more Rooms | 0 (0.0%) | 0 (0.0%) |
| Total | 180 (100.0%) | 271 (100.0%) |
Housing Structure by Heating Type in Santa Margarita
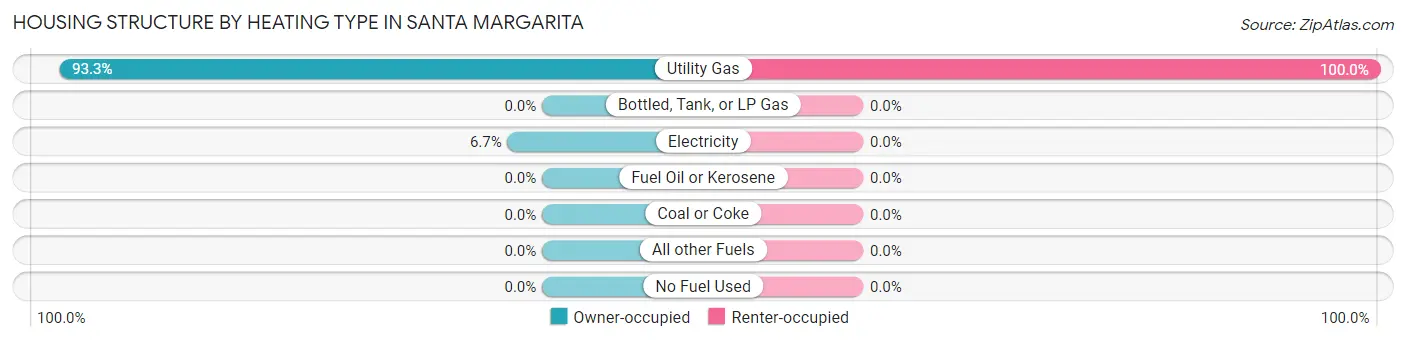
| Heating Type | Owner-occupied | Renter-occupied |
| Utility Gas | 168 (93.3%) | 271 (100.0%) |
| Bottled, Tank, or LP Gas | 0 (0.0%) | 0 (0.0%) |
| Electricity | 12 (6.7%) | 0 (0.0%) |
| Fuel Oil or Kerosene | 0 (0.0%) | 0 (0.0%) |
| Coal or Coke | 0 (0.0%) | 0 (0.0%) |
| All other Fuels | 0 (0.0%) | 0 (0.0%) |
| No Fuel Used | 0 (0.0%) | 0 (0.0%) |
| Total | 180 (100.0%) | 271 (100.0%) |
Household Vehicle Usage in Santa Margarita
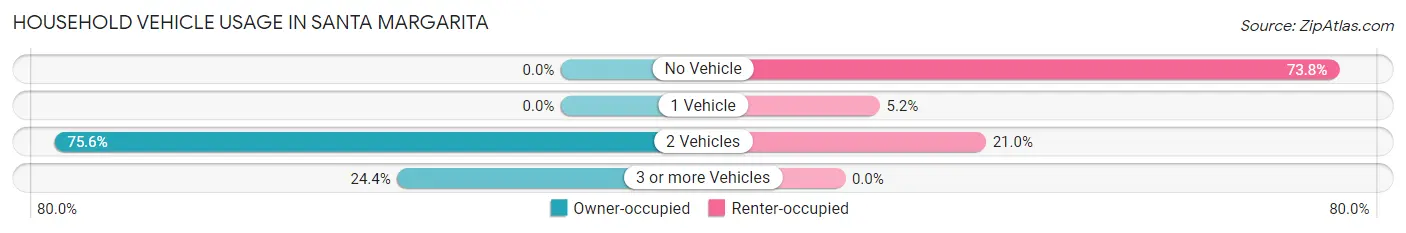
| Vehicles per Household | Owner-occupied | Renter-occupied |
| No Vehicle | 0 (0.0%) | 200 (73.8%) |
| 1 Vehicle | 0 (0.0%) | 14 (5.2%) |
| 2 Vehicles | 136 (75.6%) | 57 (21.0%) |
| 3 or more Vehicles | 44 (24.4%) | 0 (0.0%) |
| Total | 180 (100.0%) | 271 (100.0%) |
Real Estate & Mortgages in Santa Margarita
Real Estate and Mortgage Overview in Santa Margarita
| Characteristic | Without Mortgage | With Mortgage |
| Housing Units | 12 | 168 |
| Median Property Value | - | - |
| Median Household Income | - | - |
| Monthly Housing Costs | - | - |
| Real Estate Taxes | - | - |
Property Value by Mortgage Status in Santa Margarita
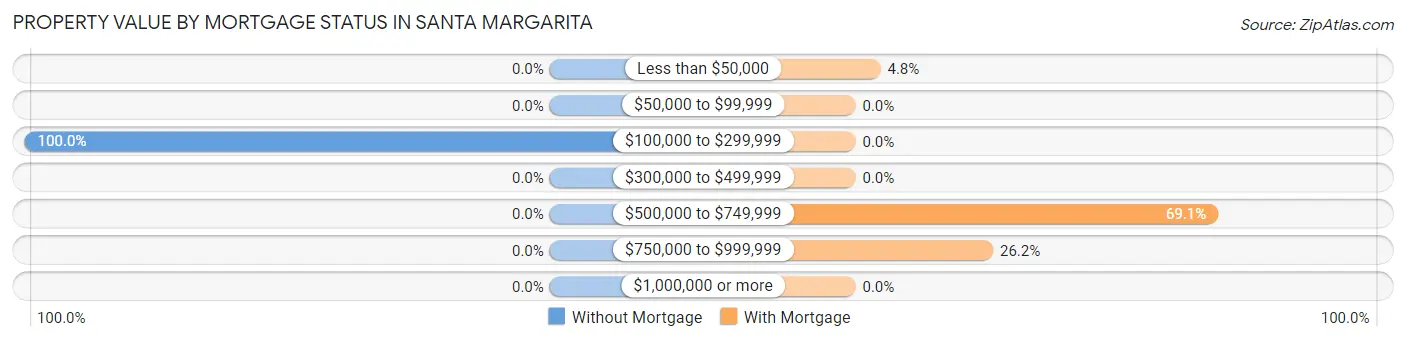
| Property Value | Without Mortgage | With Mortgage |
| Less than $50,000 | 0 (0.0%) | 8 (4.8%) |
| $50,000 to $99,999 | 0 (0.0%) | 0 (0.0%) |
| $100,000 to $299,999 | 12 (100.0%) | 0 (0.0%) |
| $300,000 to $499,999 | 0 (0.0%) | 0 (0.0%) |
| $500,000 to $749,999 | 0 (0.0%) | 116 (69.1%) |
| $750,000 to $999,999 | 0 (0.0%) | 44 (26.2%) |
| $1,000,000 or more | 0 (0.0%) | 0 (0.0%) |
| Total | 12 (100.0%) | 168 (100.0%) |
Household Income by Mortgage Status in Santa Margarita
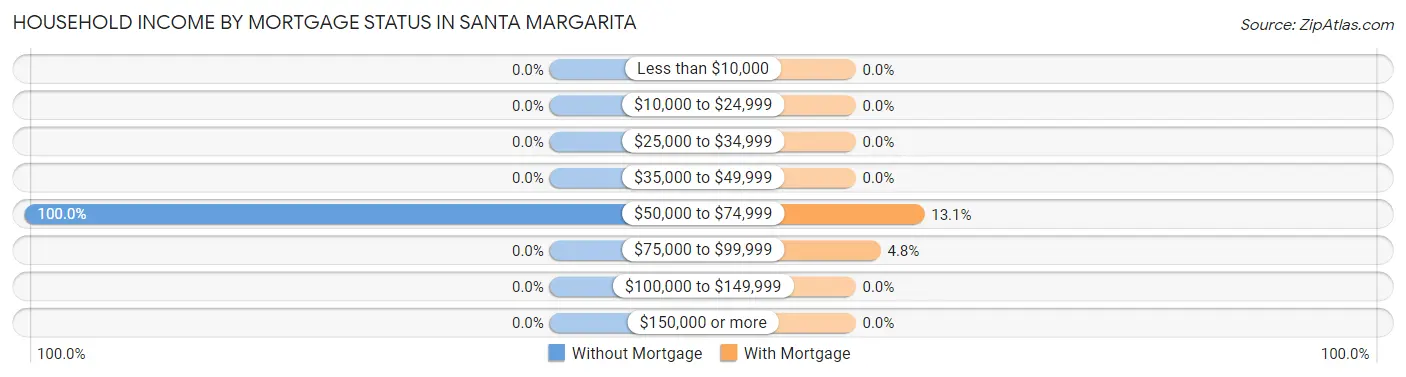
| Household Income | Without Mortgage | With Mortgage |
| Less than $10,000 | 0 (0.0%) | 0 (0.0%) |
| $10,000 to $24,999 | 0 (0.0%) | 0 (0.0%) |
| $25,000 to $34,999 | 0 (0.0%) | 0 (0.0%) |
| $35,000 to $49,999 | 0 (0.0%) | 0 (0.0%) |
| $50,000 to $74,999 | 12 (100.0%) | 22 (13.1%) |
| $75,000 to $99,999 | 0 (0.0%) | 8 (4.8%) |
| $100,000 to $149,999 | 0 (0.0%) | 0 (0.0%) |
| $150,000 or more | 0 (0.0%) | 0 (0.0%) |
| Total | 12 (100.0%) | 168 (100.0%) |
Property Value to Household Income Ratio in Santa Margarita
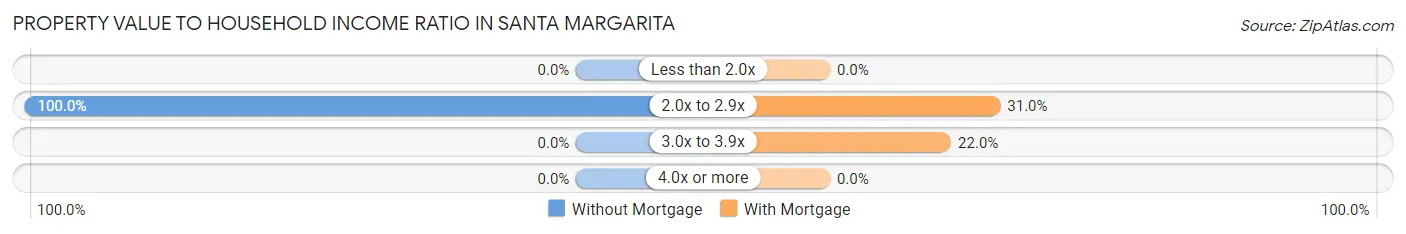
| Value-to-Income Ratio | Without Mortgage | With Mortgage |
| Less than 2.0x | 0 (0.0%) | 0 (0.0%) |
| 2.0x to 2.9x | 12 (100.0%) | 52 (30.9%) |
| 3.0x to 3.9x | 0 (0.0%) | 37 (22.0%) |
| 4.0x or more | 0 (0.0%) | 0 (0.0%) |
| Total | 12 (100.0%) | 168 (100.0%) |
Real Estate Taxes by Mortgage Status in Santa Margarita
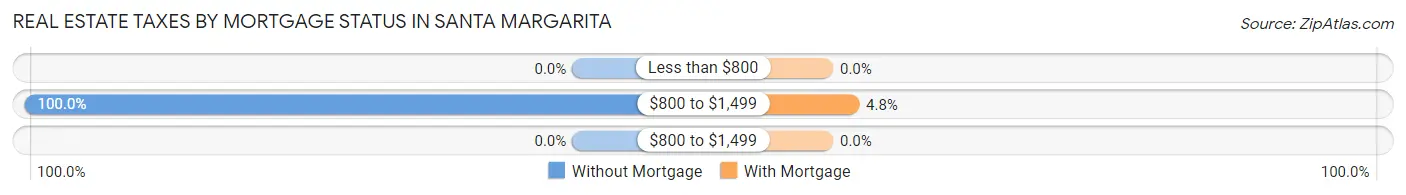
| Property Taxes | Without Mortgage | With Mortgage |
| Less than $800 | 0 (0.0%) | 0 (0.0%) |
| $800 to $1,499 | 12 (100.0%) | 8 (4.8%) |
| $800 to $1,499 | 0 (0.0%) | 0 (0.0%) |
| Total | 12 (100.0%) | 168 (100.0%) |
Health & Disability in Santa Margarita
Health Insurance Coverage by Age in Santa Margarita
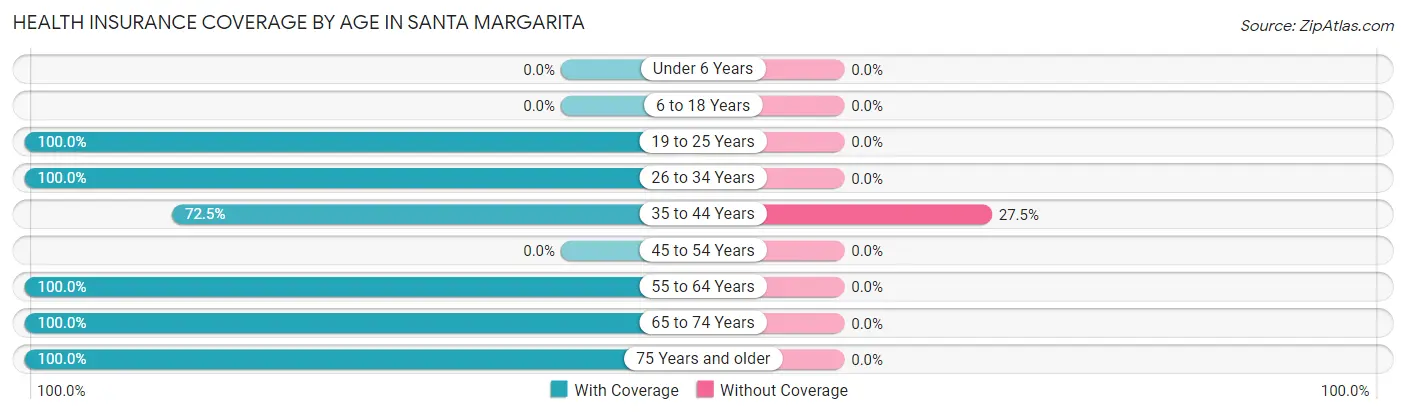
| Age Bracket | With Coverage | Without Coverage |
| Under 6 Years | 0 (0.0%) | 0 (0.0%) |
| 6 to 18 Years | 0 (0.0%) | 0 (0.0%) |
| 19 to 25 Years | 14 (100.0%) | 0 (0.0%) |
| 26 to 34 Years | 137 (100.0%) | 0 (0.0%) |
| 35 to 44 Years | 58 (72.5%) | 22 (27.5%) |
| 45 to 54 Years | 0 (0.0%) | 0 (0.0%) |
| 55 to 64 Years | 222 (100.0%) | 0 (0.0%) |
| 65 to 74 Years | 45 (100.0%) | 0 (0.0%) |
| 75 Years and older | 200 (100.0%) | 0 (0.0%) |
| Total | 676 (96.9%) | 22 (3.2%) |
Health Insurance Coverage by Citizenship Status in Santa Margarita
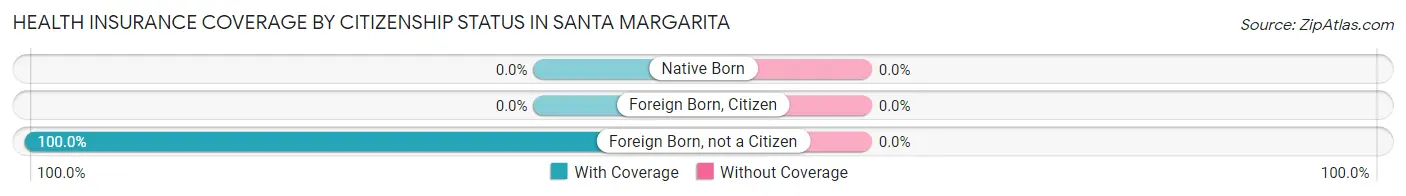
| Citizenship Status | With Coverage | Without Coverage |
| Native Born | 0 (0.0%) | 0 (0.0%) |
| Foreign Born, Citizen | 0 (0.0%) | 0 (0.0%) |
| Foreign Born, not a Citizen | 14 (100.0%) | 0 (0.0%) |
Health Insurance Coverage by Household Income in Santa Margarita
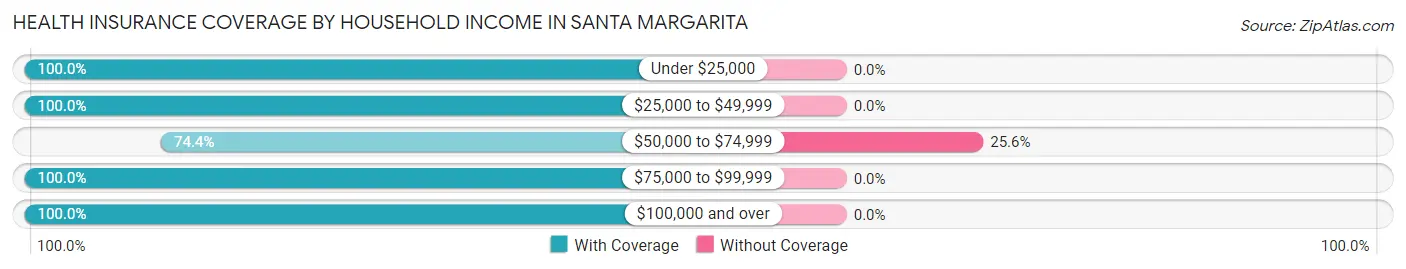
| Household Income | With Coverage | Without Coverage |
| Under $25,000 | 200 (100.0%) | 0 (0.0%) |
| $25,000 to $49,999 | 45 (100.0%) | 0 (0.0%) |
| $50,000 to $74,999 | 64 (74.4%) | 22 (25.6%) |
| $75,000 to $99,999 | 88 (100.0%) | 0 (0.0%) |
| $100,000 and over | 279 (100.0%) | 0 (0.0%) |
Public vs Private Health Insurance Coverage by Age in Santa Margarita
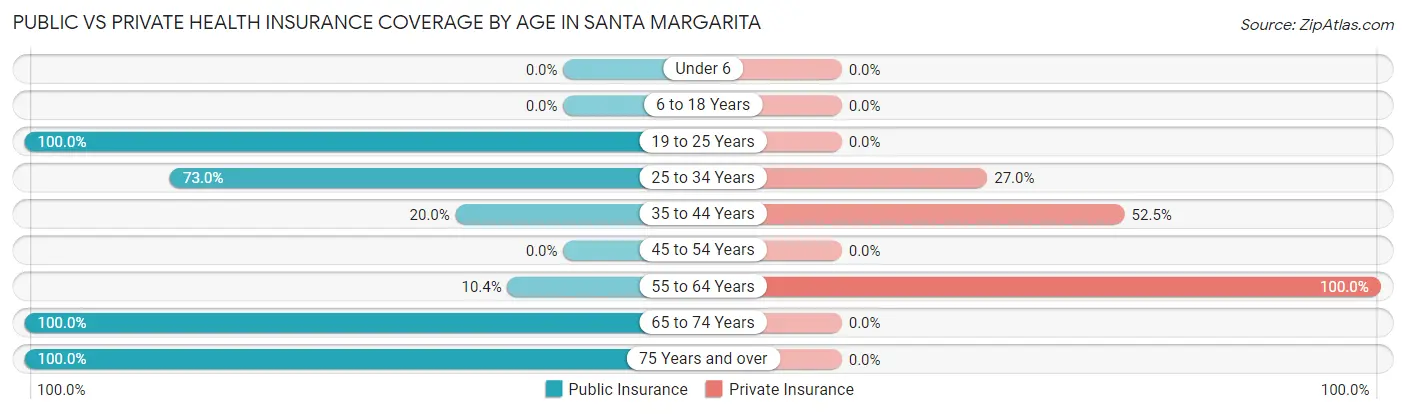
| Age Bracket | Public Insurance | Private Insurance |
| Under 6 | 0 (0.0%) | 0 (0.0%) |
| 6 to 18 Years | 0 (0.0%) | 0 (0.0%) |
| 19 to 25 Years | 14 (100.0%) | 0 (0.0%) |
| 25 to 34 Years | 100 (73.0%) | 37 (27.0%) |
| 35 to 44 Years | 16 (20.0%) | 42 (52.5%) |
| 45 to 54 Years | 0 (0.0%) | 0 (0.0%) |
| 55 to 64 Years | 23 (10.4%) | 222 (100.0%) |
| 65 to 74 Years | 45 (100.0%) | 0 (0.0%) |
| 75 Years and over | 200 (100.0%) | 0 (0.0%) |
| Total | 398 (57.0%) | 301 (43.1%) |
Disability Status by Sex by Age in Santa Margarita
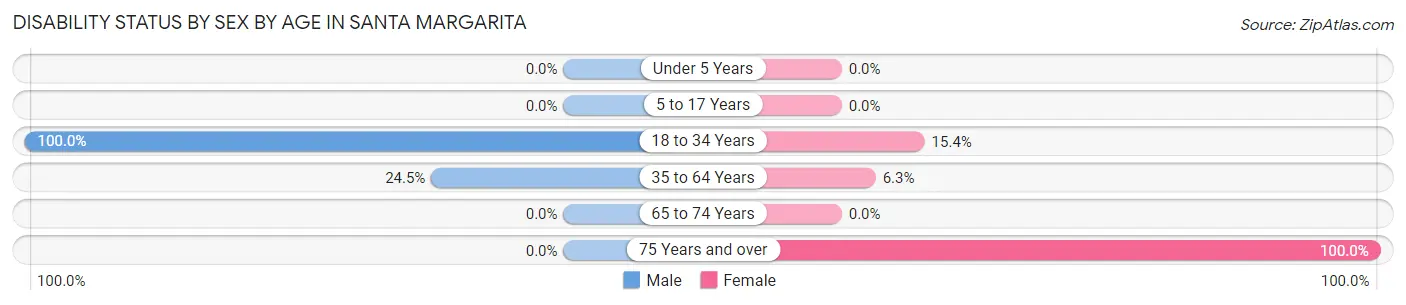
| Age Bracket | Male | Female |
| Under 5 Years | 0 (0.0%) | 0 (0.0%) |
| 5 to 17 Years | 0 (0.0%) | 0 (0.0%) |
| 18 to 34 Years | 60 (100.0%) | 14 (15.4%) |
| 35 to 64 Years | 39 (24.5%) | 9 (6.3%) |
| 65 to 74 Years | 0 (0.0%) | 0 (0.0%) |
| 75 Years and over | 0 (0.0%) | 200 (100.0%) |
Disability Class by Sex by Age in Santa Margarita
Disability Class: Hearing Difficulty
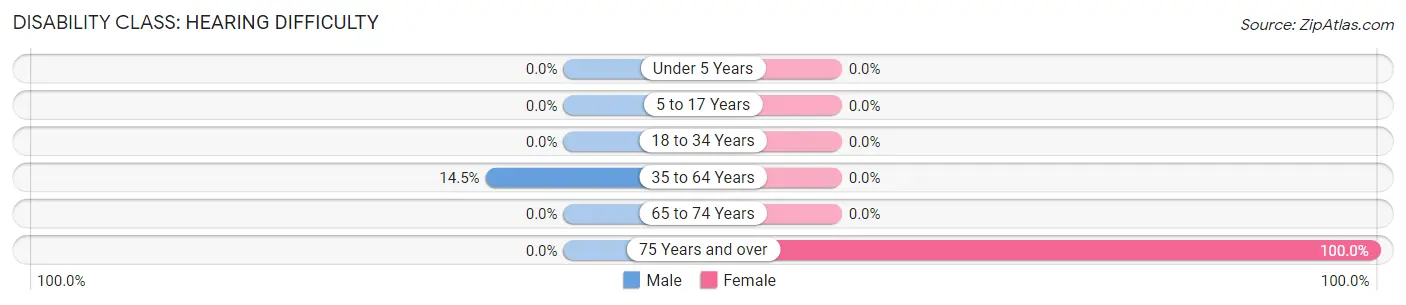
| Age Bracket | Male | Female |
| Under 5 Years | 0 (0.0%) | 0 (0.0%) |
| 5 to 17 Years | 0 (0.0%) | 0 (0.0%) |
| 18 to 34 Years | 0 (0.0%) | 0 (0.0%) |
| 35 to 64 Years | 23 (14.5%) | 0 (0.0%) |
| 65 to 74 Years | 0 (0.0%) | 0 (0.0%) |
| 75 Years and over | 0 (0.0%) | 200 (100.0%) |
Disability Class: Vision Difficulty
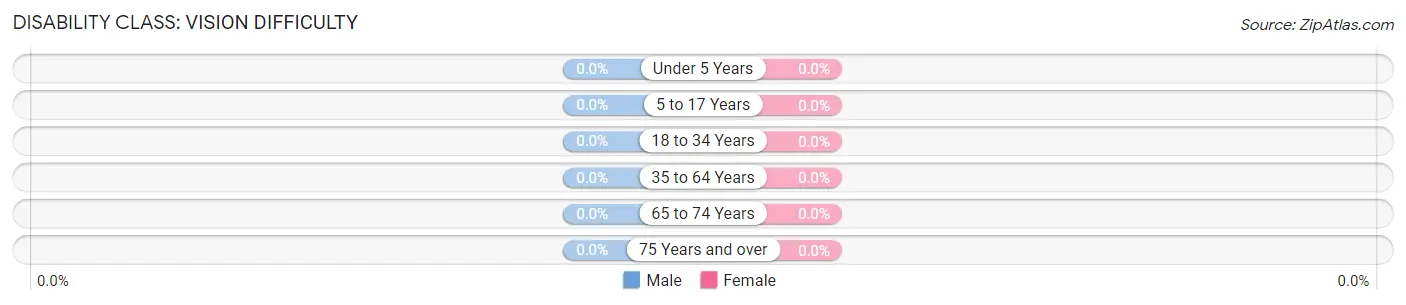
| Age Bracket | Male | Female |
| Under 5 Years | 0 (0.0%) | 0 (0.0%) |
| 5 to 17 Years | 0 (0.0%) | 0 (0.0%) |
| 18 to 34 Years | 0 (0.0%) | 0 (0.0%) |
| 35 to 64 Years | 0 (0.0%) | 0 (0.0%) |
| 65 to 74 Years | 0 (0.0%) | 0 (0.0%) |
| 75 Years and over | 0 (0.0%) | 0 (0.0%) |
Disability Class: Cognitive Difficulty
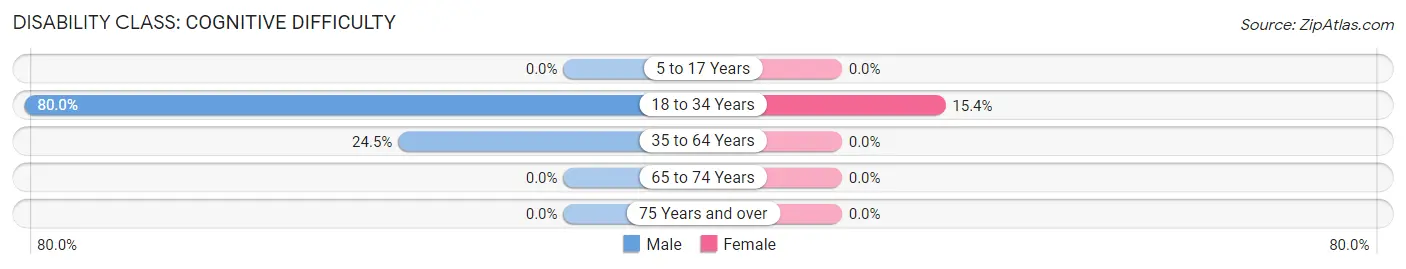
| Age Bracket | Male | Female |
| 5 to 17 Years | 0 (0.0%) | 0 (0.0%) |
| 18 to 34 Years | 48 (80.0%) | 14 (15.4%) |
| 35 to 64 Years | 39 (24.5%) | 0 (0.0%) |
| 65 to 74 Years | 0 (0.0%) | 0 (0.0%) |
| 75 Years and over | 0 (0.0%) | 0 (0.0%) |
Disability Class: Ambulatory Difficulty
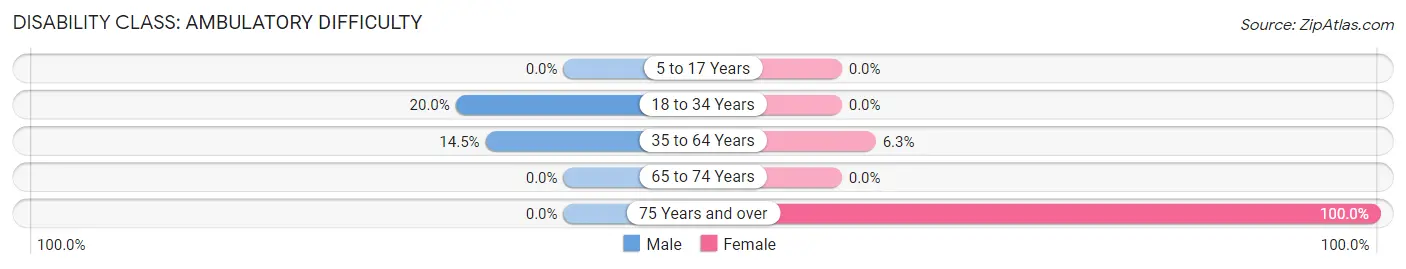
| Age Bracket | Male | Female |
| 5 to 17 Years | 0 (0.0%) | 0 (0.0%) |
| 18 to 34 Years | 12 (20.0%) | 0 (0.0%) |
| 35 to 64 Years | 23 (14.5%) | 9 (6.3%) |
| 65 to 74 Years | 0 (0.0%) | 0 (0.0%) |
| 75 Years and over | 0 (0.0%) | 200 (100.0%) |
Disability Class: Self-Care Difficulty
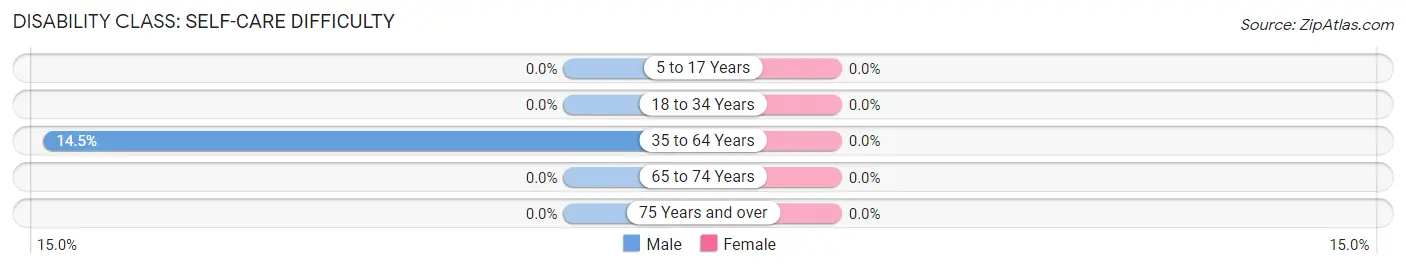
| Age Bracket | Male | Female |
| 5 to 17 Years | 0 (0.0%) | 0 (0.0%) |
| 18 to 34 Years | 0 (0.0%) | 0 (0.0%) |
| 35 to 64 Years | 23 (14.5%) | 0 (0.0%) |
| 65 to 74 Years | 0 (0.0%) | 0 (0.0%) |
| 75 Years and over | 0 (0.0%) | 0 (0.0%) |
Technology Access in Santa Margarita
Computing Device Access in Santa Margarita
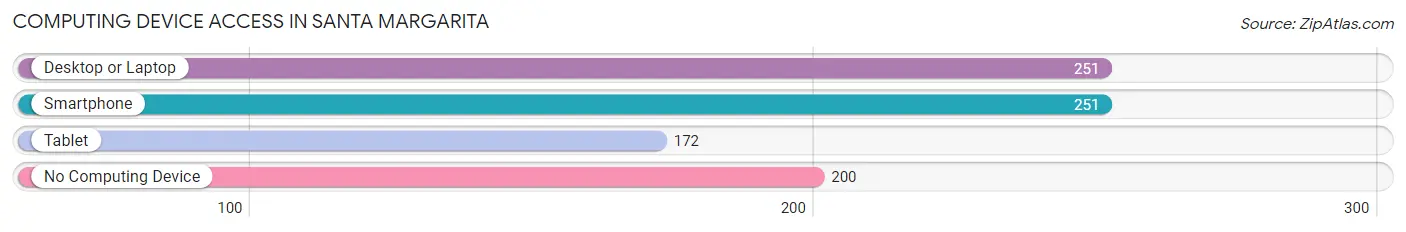
| Device Type | # Households | % Households |
| Desktop or Laptop | 251 | 55.6% |
| Smartphone | 251 | 55.6% |
| Tablet | 172 | 38.1% |
| No Computing Device | 200 | 44.4% |
| Total | 451 | 100.0% |
Internet Access in Santa Margarita
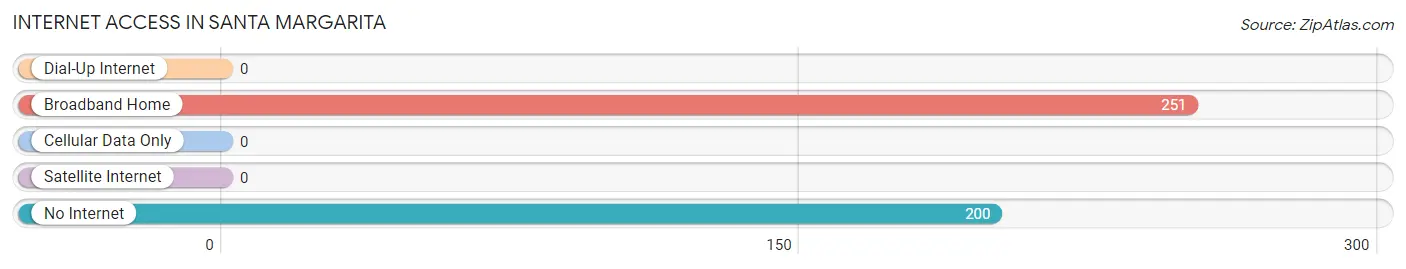
| Internet Type | # Households | % Households |
| Dial-Up Internet | 0 | 0.0% |
| Broadband Home | 251 | 55.6% |
| Cellular Data Only | 0 | 0.0% |
| Satellite Internet | 0 | 0.0% |
| No Internet | 200 | 44.4% |
| Total | 451 | 100.0% |
Santa Margarita Summary
Margarita, California is a small town located in San Luis Obispo County, California. It is situated in the foothills of the Santa Lucia Mountains, approximately halfway between San Luis Obispo and Atascadero. The town is home to a population of approximately 2,000 people, and is known for its rural atmosphere and small-town charm.
History
The area that is now Margarita was originally inhabited by the Chumash people, who lived in the area for thousands of years before the arrival of Europeans. The first Europeans to settle in the area were Spanish missionaries, who established the Mission San Luis Obispo de Tolosa in 1772. The mission was the first of its kind in California, and served as a base for the Spanish colonization of the region.
In 1846, the area was ceded to the United States as part of the Treaty of Guadalupe Hidalgo, which ended the Mexican-American War. The area was then divided into large land grants, and the area that is now Margarita was granted to the Dominguez family. The Dominguez family established a large ranch in the area, and the town of Margarita was founded in 1876.
Geography
Margarita is located in the foothills of the Santa Lucia Mountains, approximately halfway between San Luis Obispo and Atascadero. The town is situated at an elevation of approximately 1,000 feet, and is surrounded by rolling hills and oak-studded valleys. The climate in Margarita is mild, with temperatures rarely exceeding 90 degrees Fahrenheit in the summer and rarely dropping below 40 degrees Fahrenheit in the winter.
Economy
The economy of Margarita is largely based on agriculture and tourism. The town is home to several wineries, and the surrounding area is known for its production of wine grapes. The town is also home to several small businesses, including restaurants, shops, and art galleries. Tourism is also an important part of the local economy, as the town is a popular destination for visitors looking to explore the area’s natural beauty.
Demographics
As of the 2010 census, the population of Margarita was 2,000. The racial makeup of the town was 87.3% White, 0.7% African American, 0.3% Native American, 0.7% Asian, 0.1% Pacific Islander, 8.7% from other races, and 2.0% from two or more races. Hispanic or Latino of any race were 16.7% of the population.
The median household income in Margarita was $50,000, and the median family income was $54,000. The per capita income for the town was $21,000. About 10.3% of families and 13.2% of the population were below the poverty line, including 17.2% of those under age 18 and 8.3% of those age 65 or over.
Overall, Margarita is a small town with a rich history and a unique atmosphere. The town is known for its rural atmosphere and small-town charm, and is a popular destination for visitors looking to explore the area’s natural beauty. The town is also home to a diverse population, with a variety of cultures and backgrounds represented in the local population.
Common Questions
What is Per Capita Income in Santa Margarita?
Per Capita income in Santa Margarita is $71,448.
What is the Median Family Income in Santa Margarita?
Median Family Income in Santa Margarita is $150,987.
What is Income or Wage Gap in Santa Margarita?
Income or Wage Gap in Santa Margarita is 67.8%.
Women in Santa Margarita earn 32.2 cents for every dollar earned by a man.
What is Inequality or Gini Index in Santa Margarita?
Inequality or Gini Index in Santa Margarita is 0.59.
What is the Total Population of Santa Margarita?
Total Population of Santa Margarita is 698.
What is the Total Male Population of Santa Margarita?
Total Male Population of Santa Margarita is 264.
What is the Total Female Population of Santa Margarita?
Total Female Population of Santa Margarita is 434.
What is the Ratio of Males per 100 Females in Santa Margarita?
There are 60.83 Males per 100 Females in Santa Margarita.
What is the Ratio of Females per 100 Males in Santa Margarita?
There are 164.39 Females per 100 Males in Santa Margarita.
What is the Median Population Age in Santa Margarita?
Median Population Age in Santa Margarita is 63.0 Years.
What is the Average Family Size in Santa Margarita
Average Family Size in Santa Margarita is 2.0 People.
What is the Average Household Size in Santa Margarita
Average Household Size in Santa Margarita is 1.6 People.
How Large is the Labor Force in Santa Margarita?
There are 447 People in the Labor Forcein in Santa Margarita.
What is the Percentage of People in the Labor Force in Santa Margarita?
64.0% of People are in the Labor Force in Santa Margarita.