Santa Fe Springs, CA Map & Demographics
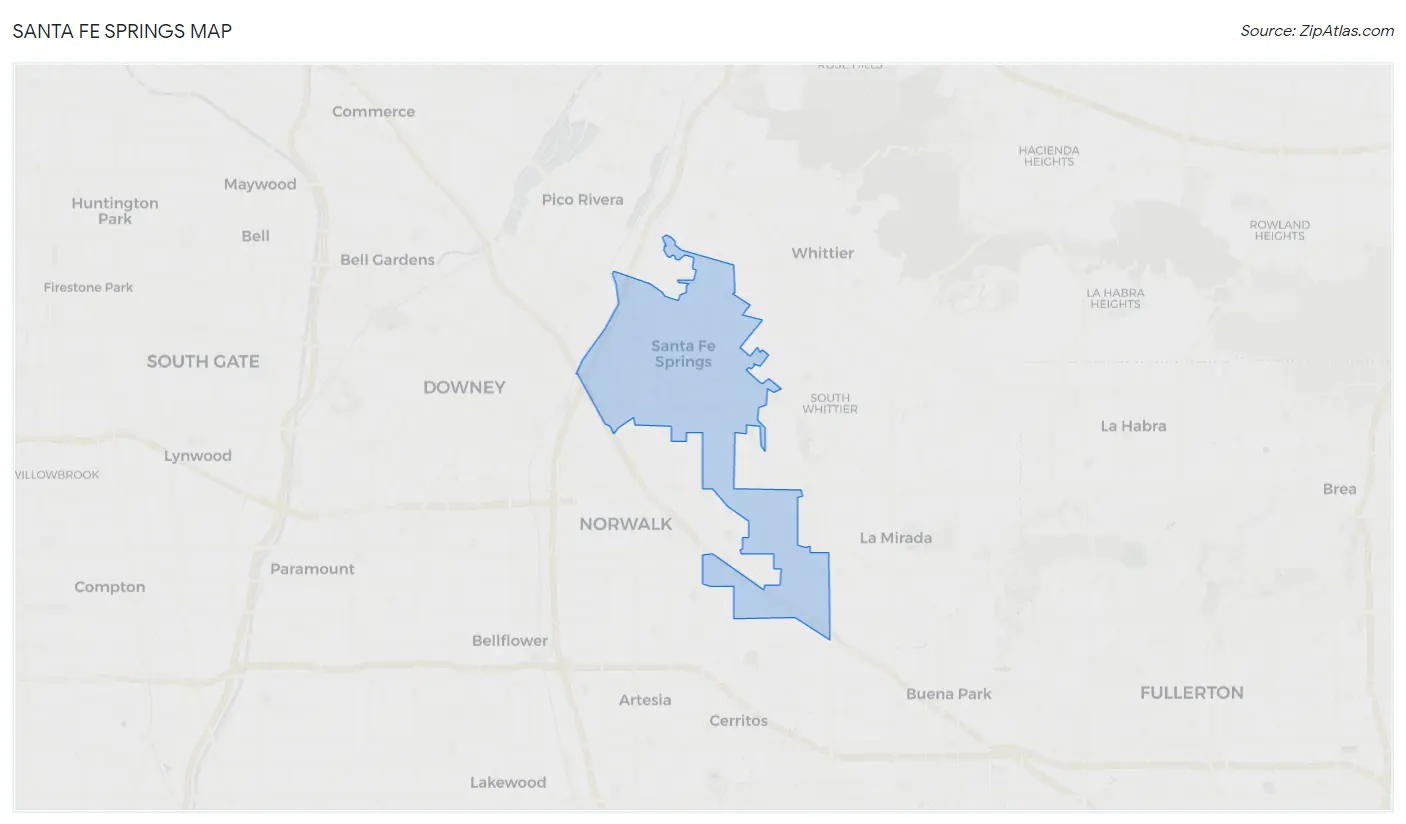
Santa Fe Springs Map
Santa Fe Springs Overview
$30,849
PER CAPITA INCOME
$93,462
AVG FAMILY INCOME
$81,500
AVG HOUSEHOLD INCOME
13.6%
WAGE / INCOME GAP [ % ]
86.4¢/ $1
WAGE / INCOME GAP [ $ ]
$15,706
FAMILY INCOME DEFICIT
0.42
INEQUALITY / GINI INDEX
18,840
TOTAL POPULATION
8,993
MALE POPULATION
9,847
FEMALE POPULATION
91.33
MALES / 100 FEMALES
109.50
FEMALES / 100 MALES
38.0
MEDIAN AGE
3.8
AVG FAMILY SIZE
3.3
AVG HOUSEHOLD SIZE
9,091
LABOR FORCE [ PEOPLE ]
60.0%
PERCENT IN LABOR FORCE
4.2%
UNEMPLOYMENT RATE
Santa Fe Springs Zip Codes
Santa Fe Springs Area Codes
Income in Santa Fe Springs
Income Overview in Santa Fe Springs
Per Capita Income in Santa Fe Springs is $30,849, while median incomes of families and households are $93,462 and $81,500 respectively.
| Characteristic | Number | Measure |
| Per Capita Income | 18,840 | $30,849 |
| Median Family Income | 4,206 | $93,462 |
| Mean Family Income | 4,206 | $112,781 |
| Median Household Income | 5,700 | $81,500 |
| Mean Household Income | 5,700 | $98,161 |
| Income Deficit | 4,206 | $15,706 |
| Wage / Income Gap (%) | 18,840 | 13.61% |
| Wage / Income Gap ($) | 18,840 | 86.39¢ per $1 |
| Gini / Inequality Index | 18,840 | 0.42 |
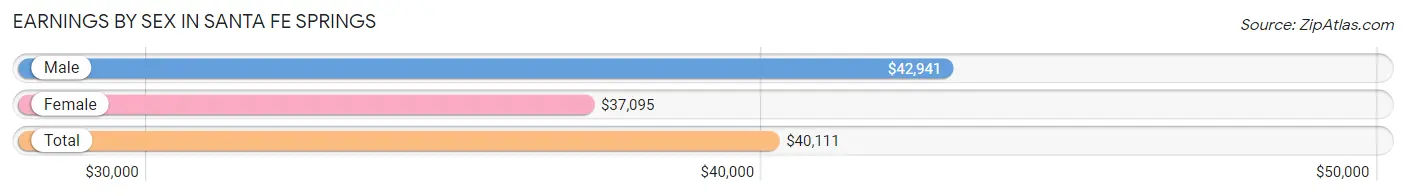
Earnings by Sex in Santa Fe Springs
Average Earnings in Santa Fe Springs are $40,111, $42,941 for men and $37,095 for women, a difference of 13.6%.
| Sex | Number | Average Earnings |
| Male | 4,894 (52.9%) | $42,941 |
| Female | 4,354 (47.1%) | $37,095 |
| Total | 9,248 (100.0%) | $40,111 |
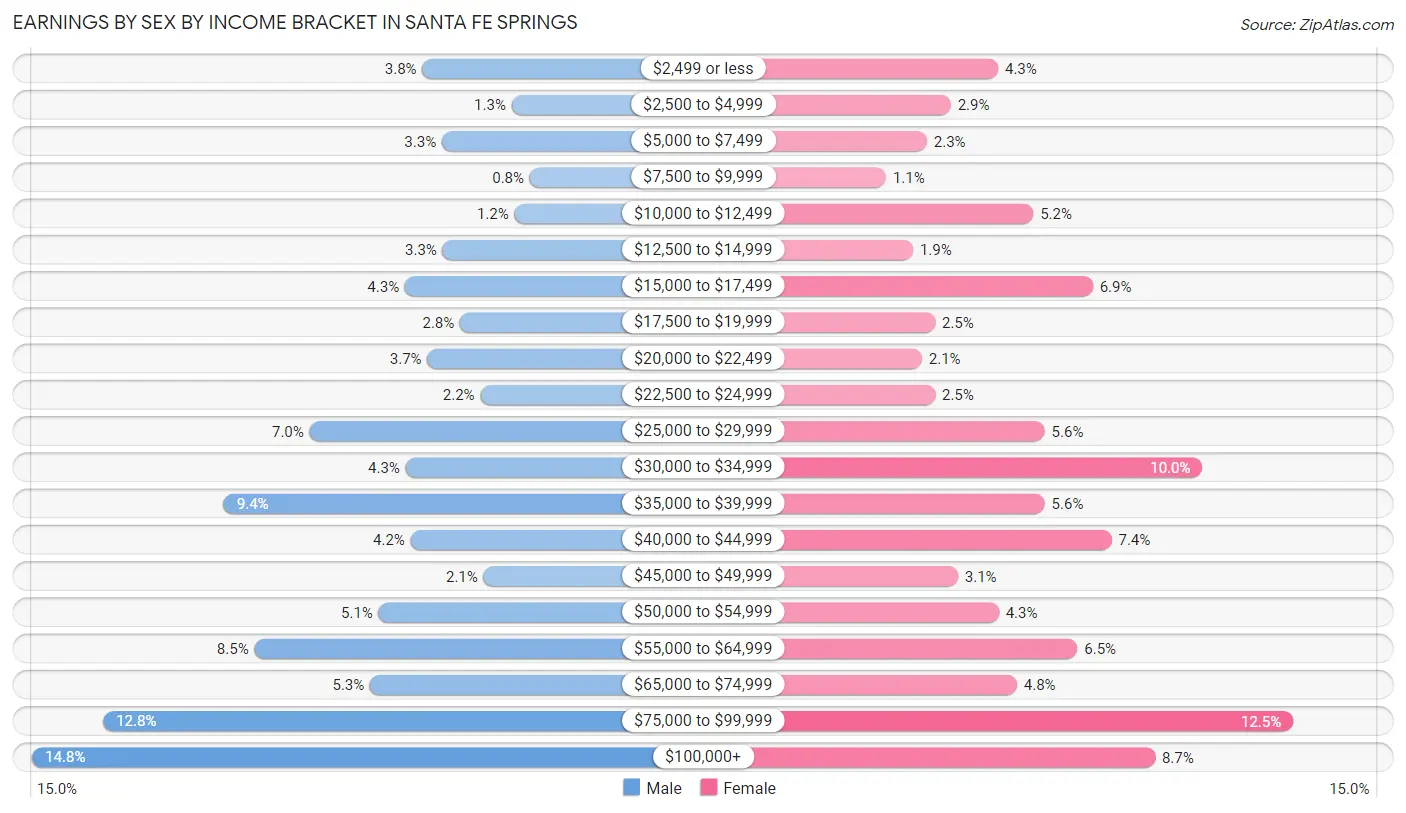
Earnings by Sex by Income Bracket in Santa Fe Springs
The most common earnings brackets in Santa Fe Springs are $100,000+ for men (724 | 14.8%) and $75,000 to $99,999 for women (546 | 12.5%).
| Income | Male | Female |
| $2,499 or less | 187 (3.8%) | 185 (4.3%) |
| $2,500 to $4,999 | 64 (1.3%) | 127 (2.9%) |
| $5,000 to $7,499 | 160 (3.3%) | 98 (2.2%) |
| $7,500 to $9,999 | 39 (0.8%) | 48 (1.1%) |
| $10,000 to $12,499 | 60 (1.2%) | 228 (5.2%) |
| $12,500 to $14,999 | 159 (3.3%) | 81 (1.9%) |
| $15,000 to $17,499 | 211 (4.3%) | 301 (6.9%) |
| $17,500 to $19,999 | 135 (2.8%) | 108 (2.5%) |
| $20,000 to $22,499 | 180 (3.7%) | 92 (2.1%) |
| $22,500 to $24,999 | 107 (2.2%) | 108 (2.5%) |
| $25,000 to $29,999 | 342 (7.0%) | 242 (5.6%) |
| $30,000 to $34,999 | 210 (4.3%) | 435 (10.0%) |
| $35,000 to $39,999 | 460 (9.4%) | 242 (5.6%) |
| $40,000 to $44,999 | 203 (4.2%) | 324 (7.4%) |
| $45,000 to $49,999 | 103 (2.1%) | 136 (3.1%) |
| $50,000 to $54,999 | 247 (5.1%) | 186 (4.3%) |
| $55,000 to $64,999 | 418 (8.5%) | 282 (6.5%) |
| $65,000 to $74,999 | 259 (5.3%) | 208 (4.8%) |
| $75,000 to $99,999 | 626 (12.8%) | 546 (12.5%) |
| $100,000+ | 724 (14.8%) | 377 (8.7%) |
| Total | 4,894 (100.0%) | 4,354 (100.0%) |
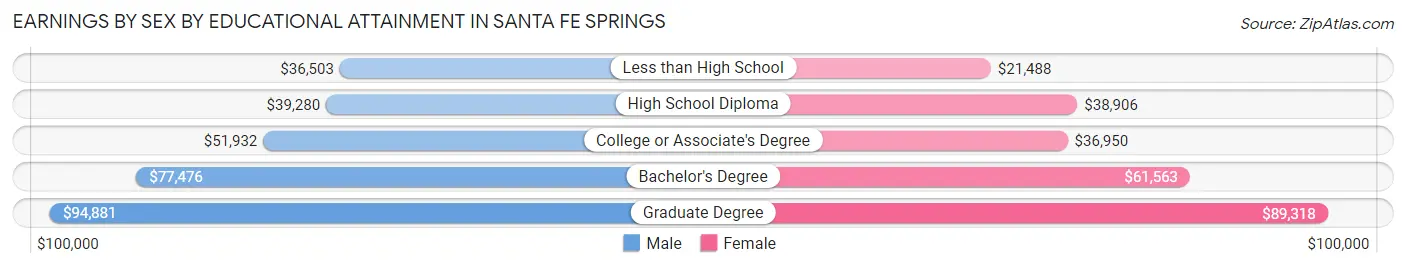
Earnings by Sex by Educational Attainment in Santa Fe Springs
Average earnings in Santa Fe Springs are $51,661 for men and $40,896 for women, a difference of 20.8%. Men with an educational attainment of graduate degree enjoy the highest average annual earnings of $94,881, while those with less than high school education earn the least with $36,503. Women with an educational attainment of graduate degree earn the most with the average annual earnings of $89,318, while those with less than high school education have the smallest earnings of $21,488.
| Educational Attainment | Male Income | Female Income |
| Less than High School | $36,503 | $21,488 |
| High School Diploma | $39,280 | $38,906 |
| College or Associate's Degree | $51,932 | $36,950 |
| Bachelor's Degree | $77,476 | $61,563 |
| Graduate Degree | $94,881 | $89,318 |
| Total | $51,661 | $40,896 |
Family Income in Santa Fe Springs
Family Income Brackets in Santa Fe Springs
According to the Santa Fe Springs family income data, there are 778 families falling into the $75,000 to $99,999 income range, which is the most common income bracket and makes up 18.5% of all families. Conversely, the $15,000 to $24,999 income bracket is the least frequent group with only 63 families (1.5%) belonging to this category.
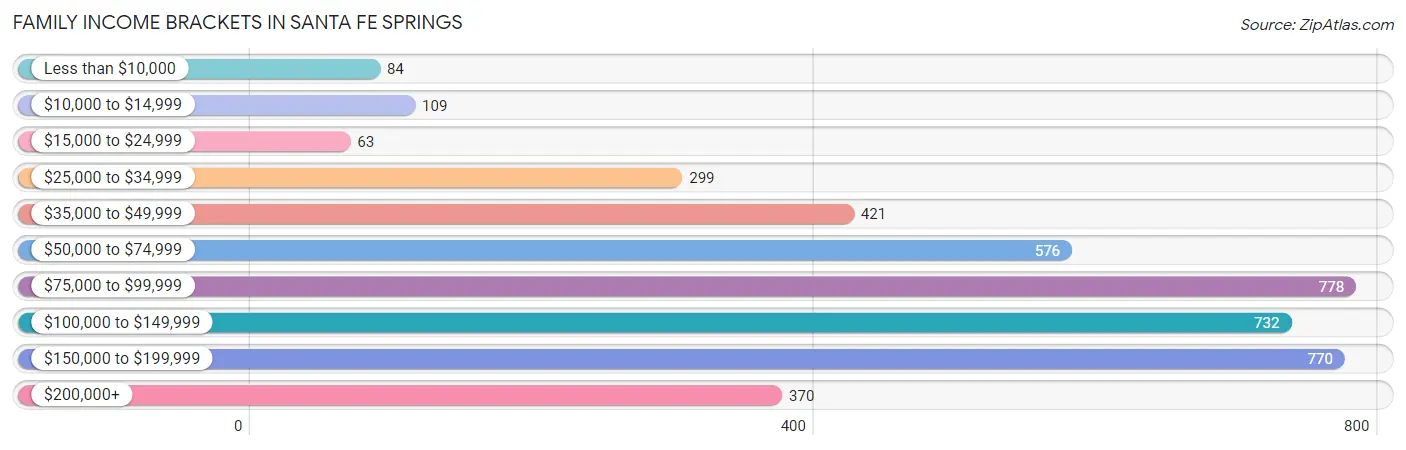
| Income Bracket | # Families | % Families |
| Less than $10,000 | 84 | 2.0% |
| $10,000 to $14,999 | 109 | 2.6% |
| $15,000 to $24,999 | 63 | 1.5% |
| $25,000 to $34,999 | 299 | 7.1% |
| $35,000 to $49,999 | 421 | 10.0% |
| $50,000 to $74,999 | 576 | 13.7% |
| $75,000 to $99,999 | 778 | 18.5% |
| $100,000 to $149,999 | 732 | 17.4% |
| $150,000 to $199,999 | 770 | 18.3% |
| $200,000+ | 370 | 8.8% |
Family Income by Famaliy Size in Santa Fe Springs
7+ person families (204 | 4.9%) account for the highest median family income in Santa Fe Springs with $159,868 per family, while 3-person families (946 | 22.5%) have the highest median income of $31,923 per family member.
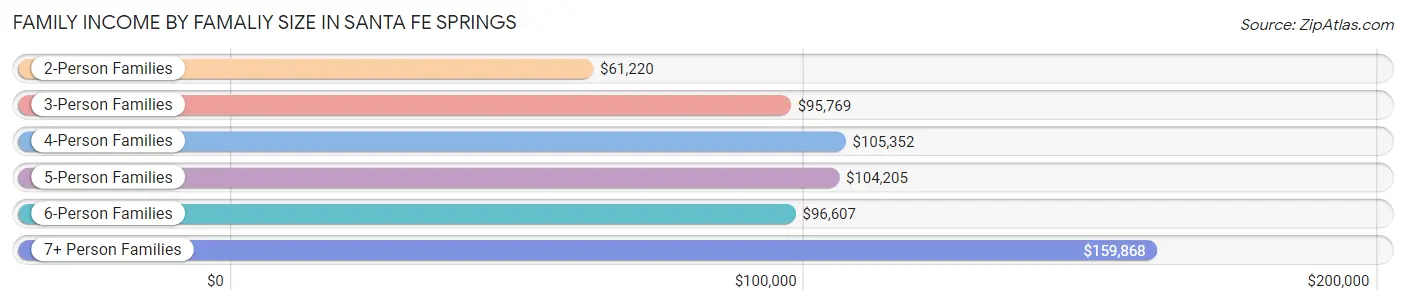
| Income Bracket | # Families | Median Income |
| 2-Person Families | 1,338 (31.8%) | $61,220 |
| 3-Person Families | 946 (22.5%) | $95,769 |
| 4-Person Families | 911 (21.7%) | $105,352 |
| 5-Person Families | 519 (12.3%) | $104,205 |
| 6-Person Families | 288 (6.9%) | $96,607 |
| 7+ Person Families | 204 (4.9%) | $159,868 |
| Total | 4,206 (100.0%) | $93,462 |
Family Income by Number of Earners in Santa Fe Springs
The median family income in Santa Fe Springs is $93,462, with families comprising 3+ earners (857) having the highest median family income of $175,046, while families with no earners (428) have the lowest median family income of $31,227, accounting for 20.4% and 10.2% of families, respectively.
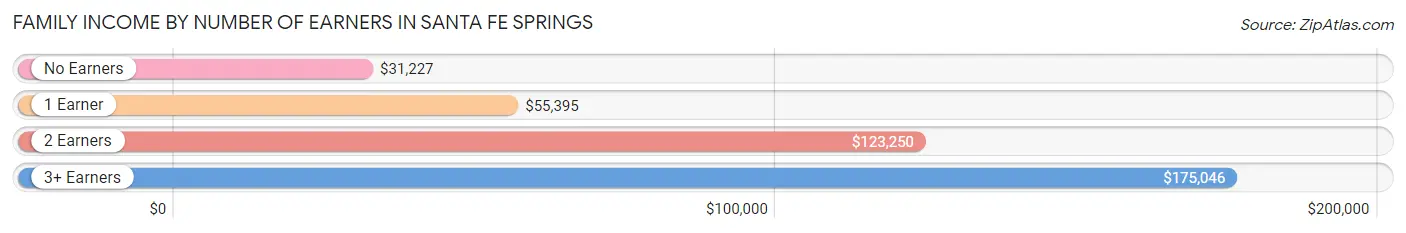
| Number of Earners | # Families | Median Income |
| No Earners | 428 (10.2%) | $31,227 |
| 1 Earner | 1,190 (28.3%) | $55,395 |
| 2 Earners | 1,731 (41.2%) | $123,250 |
| 3+ Earners | 857 (20.4%) | $175,046 |
| Total | 4,206 (100.0%) | $93,462 |
Household Income in Santa Fe Springs
Household Income Brackets in Santa Fe Springs
With 963 households falling in the category, the $75,000 to $99,999 income range is the most frequent in Santa Fe Springs, accounting for 16.9% of all households. In contrast, only 182 households (3.2%) fall into the $15,000 to $24,999 income bracket, making it the least populous group.
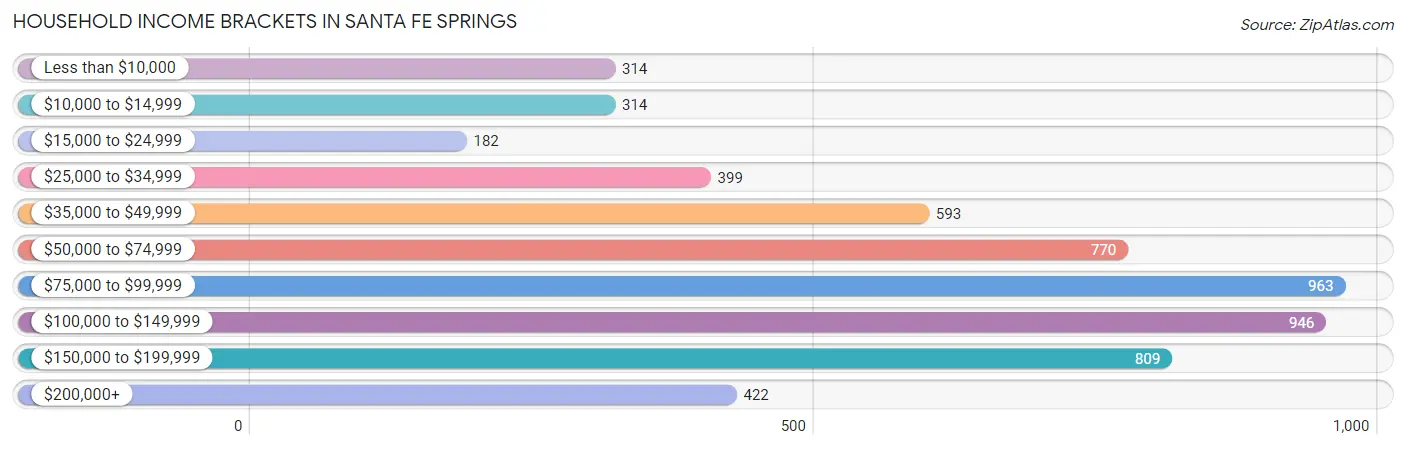
| Income Bracket | # Households | % Households |
| Less than $10,000 | 314 | 5.5% |
| $10,000 to $14,999 | 314 | 5.5% |
| $15,000 to $24,999 | 182 | 3.2% |
| $25,000 to $34,999 | 399 | 7.0% |
| $35,000 to $49,999 | 593 | 10.4% |
| $50,000 to $74,999 | 770 | 13.5% |
| $75,000 to $99,999 | 963 | 16.9% |
| $100,000 to $149,999 | 946 | 16.6% |
| $150,000 to $199,999 | 809 | 14.2% |
| $200,000+ | 422 | 7.4% |
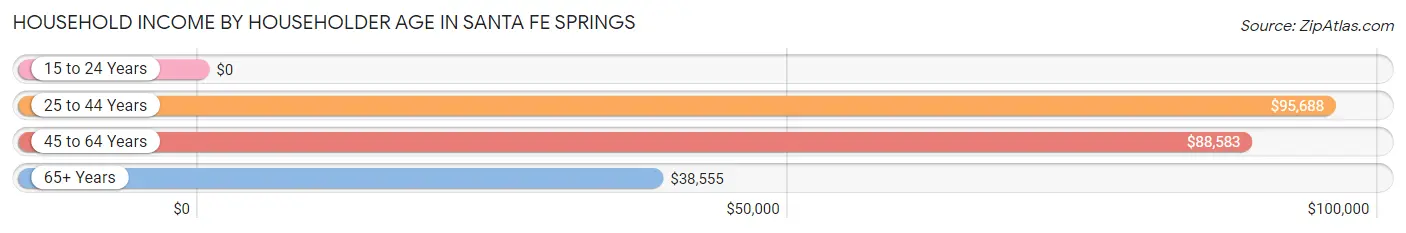
Household Income by Householder Age in Santa Fe Springs
The median household income in Santa Fe Springs is $81,500, with the highest median household income of $95,688 found in the 25 to 44 years age bracket for the primary householder. A total of 1,935 households (34.0%) fall into this category. Meanwhile, the 15 to 24 years age bracket for the primary householder has the lowest median household income of $0, with 51 households (0.9%) in this group.
| Income Bracket | # Households | Median Income |
| 15 to 24 Years | 51 (0.9%) | $0 |
| 25 to 44 Years | 1,935 (34.0%) | $95,688 |
| 45 to 64 Years | 2,041 (35.8%) | $88,583 |
| 65+ Years | 1,673 (29.3%) | $38,555 |
| Total | 5,700 (100.0%) | $81,500 |
Poverty in Santa Fe Springs
Income Below Poverty by Sex and Age in Santa Fe Springs
With 8.6% poverty level for males and 11.8% for females among the residents of Santa Fe Springs, 75 year old and over males and 65 to 74 year old females are the most vulnerable to poverty, with 181 males (30.0%) and 311 females (34.8%) in their respective age groups living below the poverty level.
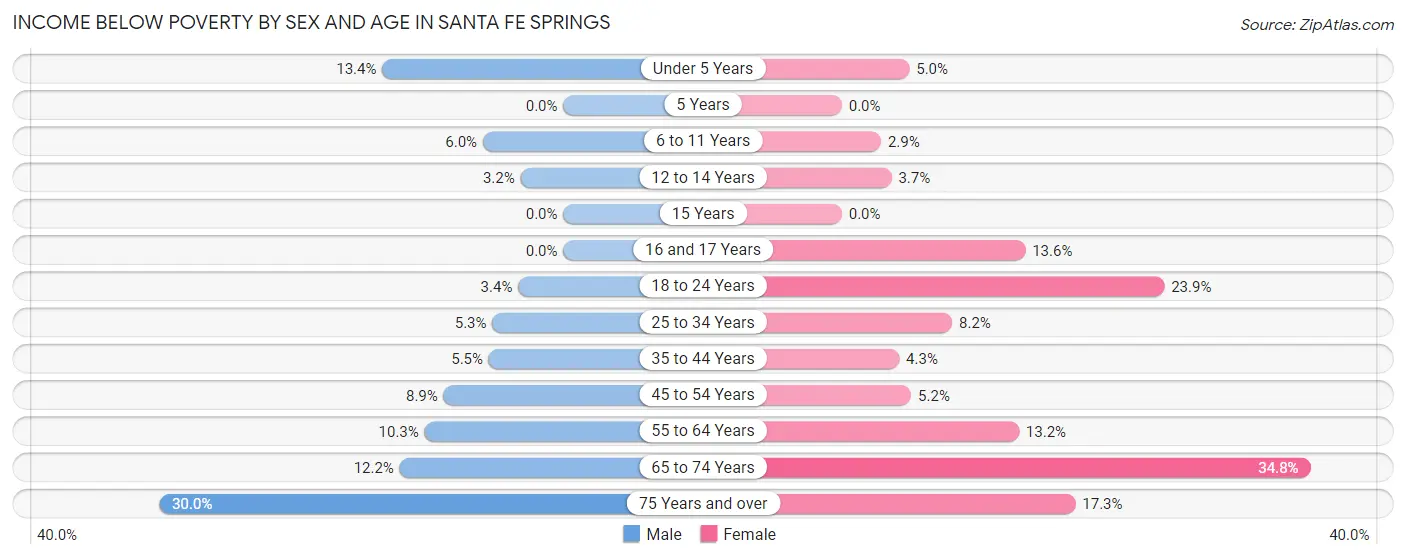
| Age Bracket | Male | Female |
| Under 5 Years | 77 (13.4%) | 37 (5.0%) |
| 5 Years | 0 (0.0%) | 0 (0.0%) |
| 6 to 11 Years | 38 (6.0%) | 19 (2.9%) |
| 12 to 14 Years | 11 (3.2%) | 12 (3.7%) |
| 15 Years | 0 (0.0%) | 0 (0.0%) |
| 16 and 17 Years | 0 (0.0%) | 41 (13.6%) |
| 18 to 24 Years | 29 (3.4%) | 209 (23.9%) |
| 25 to 34 Years | 71 (5.3%) | 116 (8.2%) |
| 35 to 44 Years | 78 (5.5%) | 52 (4.3%) |
| 45 to 54 Years | 96 (8.9%) | 61 (5.1%) |
| 55 to 64 Years | 110 (10.3%) | 162 (13.2%) |
| 65 to 74 Years | 78 (12.1%) | 311 (34.8%) |
| 75 Years and over | 181 (30.0%) | 134 (17.3%) |
| Total | 769 (8.6%) | 1,154 (11.8%) |
Income Above Poverty by Sex and Age in Santa Fe Springs
According to the poverty statistics in Santa Fe Springs, males aged 5 years and females aged 5 years are the age groups that are most secure financially, with 100.0% of males and 100.0% of females in these age groups living above the poverty line.
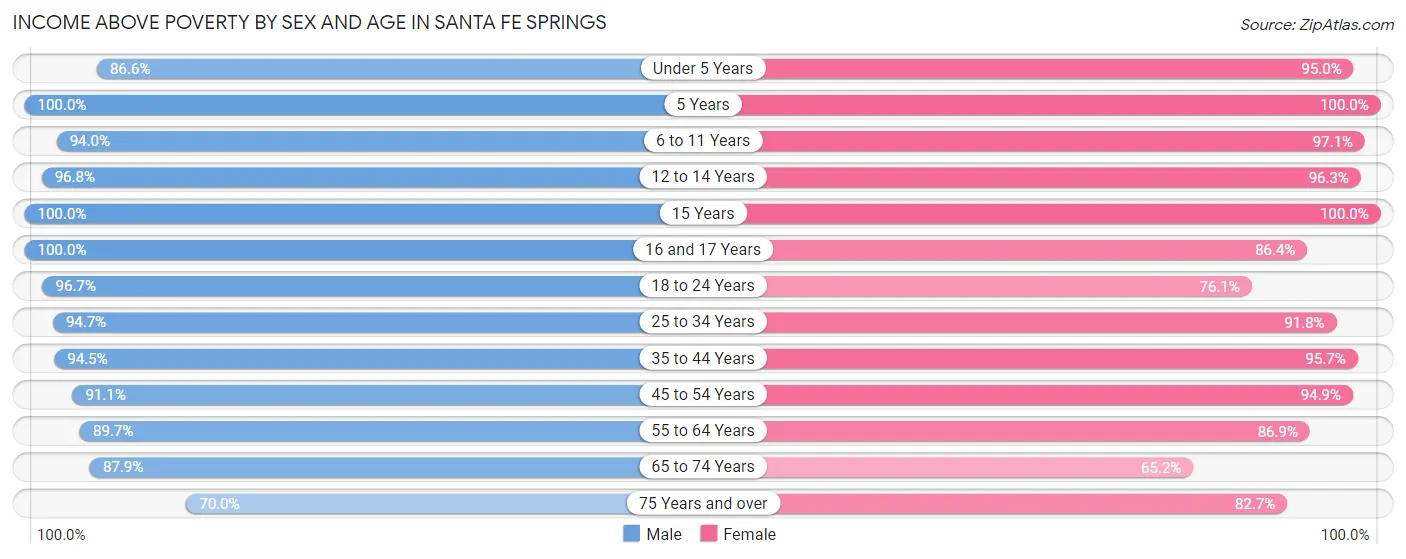
| Age Bracket | Male | Female |
| Under 5 Years | 496 (86.6%) | 701 (95.0%) |
| 5 Years | 100 (100.0%) | 48 (100.0%) |
| 6 to 11 Years | 598 (94.0%) | 635 (97.1%) |
| 12 to 14 Years | 335 (96.8%) | 313 (96.3%) |
| 15 Years | 69 (100.0%) | 105 (100.0%) |
| 16 and 17 Years | 161 (100.0%) | 260 (86.4%) |
| 18 to 24 Years | 837 (96.7%) | 664 (76.1%) |
| 25 to 34 Years | 1,275 (94.7%) | 1,301 (91.8%) |
| 35 to 44 Years | 1,332 (94.5%) | 1,169 (95.7%) |
| 45 to 54 Years | 984 (91.1%) | 1,124 (94.9%) |
| 55 to 64 Years | 958 (89.7%) | 1,070 (86.9%) |
| 65 to 74 Years | 564 (87.8%) | 583 (65.2%) |
| 75 Years and over | 422 (70.0%) | 639 (82.7%) |
| Total | 8,131 (91.4%) | 8,612 (88.2%) |
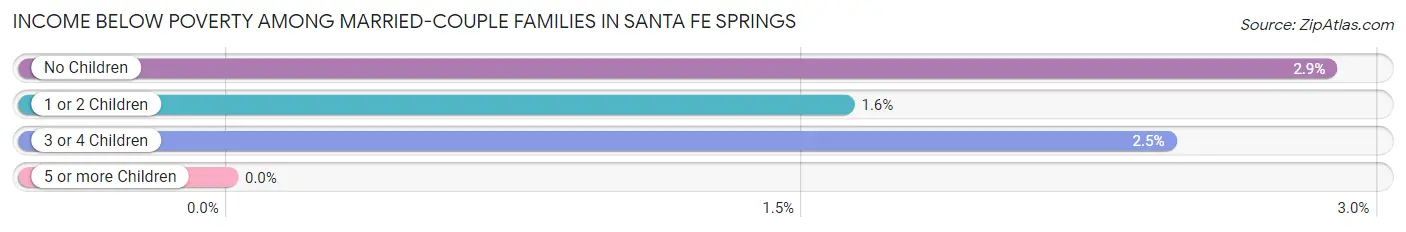
Income Below Poverty Among Married-Couple Families in Santa Fe Springs
The poverty statistics for married-couple families in Santa Fe Springs show that 2.4% or 67 of the total 2,821 families live below the poverty line. Families with no children have the highest poverty rate of 2.9%, comprising of 42 families. On the other hand, families with 1 or 2 children have the lowest poverty rate of 1.6%, which includes 16 families.
| Children | Above Poverty | Below Poverty |
| No Children | 1,419 (97.1%) | 42 (2.9%) |
| 1 or 2 Children | 977 (98.4%) | 16 (1.6%) |
| 3 or 4 Children | 358 (97.6%) | 9 (2.5%) |
| 5 or more Children | 0 (0.0%) | 0 (0.0%) |
| Total | 2,754 (97.6%) | 67 (2.4%) |
Income Below Poverty Among Single-Parent Households in Santa Fe Springs
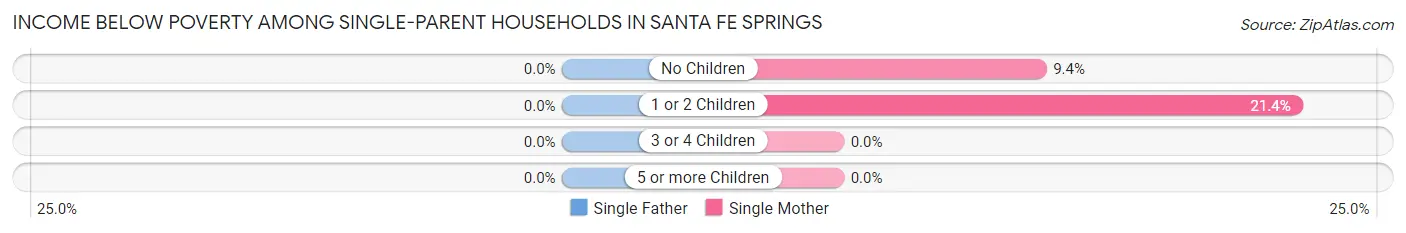
| Children | Single Father | Single Mother |
| No Children | 0 (0.0%) | 55 (9.4%) |
| 1 or 2 Children | 0 (0.0%) | 106 (21.4%) |
| 3 or 4 Children | 0 (0.0%) | 0 (0.0%) |
| 5 or more Children | 0 (0.0%) | 0 (0.0%) |
| Total | 0 (0.0%) | 161 (14.4%) |
Income Below Poverty Among Married-Couple vs Single-Parent Households in Santa Fe Springs
The poverty data for Santa Fe Springs shows that 67 of the married-couple family households (2.4%) and 161 of the single-parent households (11.6%) are living below the poverty level. Within the married-couple family households, those with no children have the highest poverty rate, with 42 households (2.9%) falling below the poverty line. Among the single-parent households, those with 1 or 2 children have the highest poverty rate, with 106 household (18.1%) living below poverty.
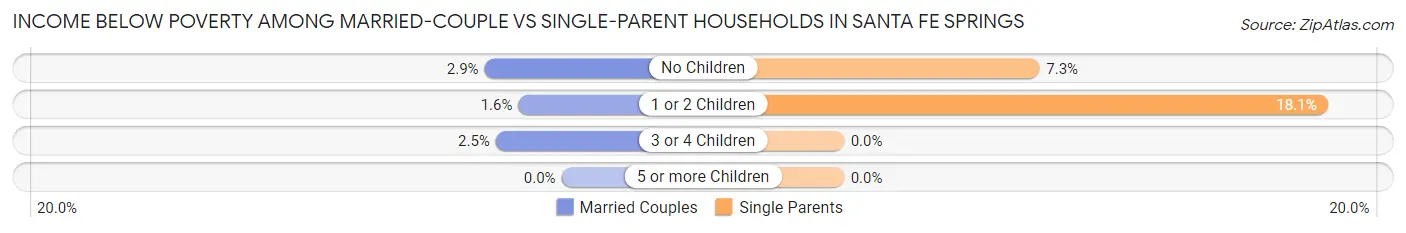
| Children | Married-Couple Families | Single-Parent Households |
| No Children | 42 (2.9%) | 55 (7.3%) |
| 1 or 2 Children | 16 (1.6%) | 106 (18.1%) |
| 3 or 4 Children | 9 (2.5%) | 0 (0.0%) |
| 5 or more Children | 0 (0.0%) | 0 (0.0%) |
| Total | 67 (2.4%) | 161 (11.6%) |
Race in Santa Fe Springs
The most populous races in Santa Fe Springs are Hispanic or Latino (13,761 | 73.0%), Some other Race (7,207 | 38.3%), and White / Caucasian (5,812 | 30.8%).
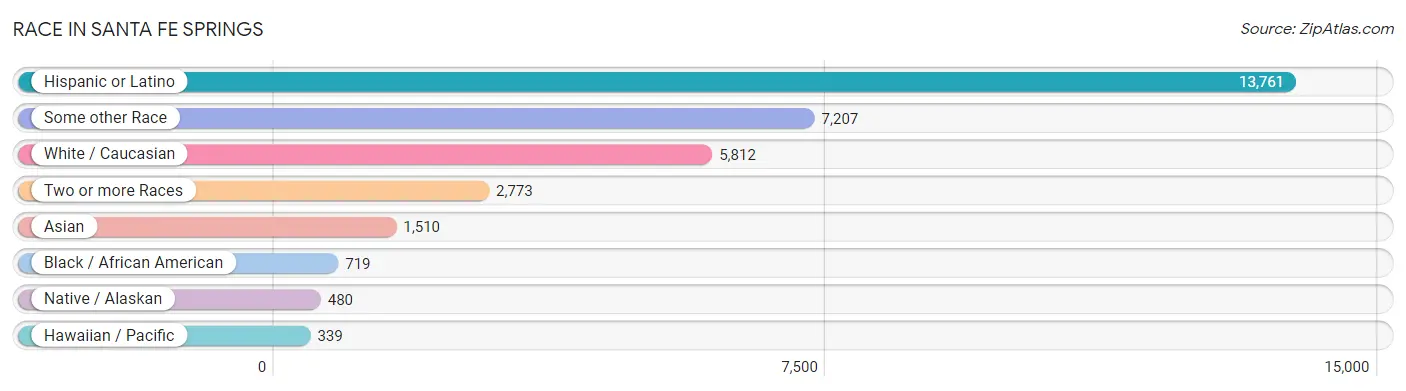
| Race | # Population | % Population |
| Asian | 1,510 | 8.0% |
| Black / African American | 719 | 3.8% |
| Hawaiian / Pacific | 339 | 1.8% |
| Hispanic or Latino | 13,761 | 73.0% |
| Native / Alaskan | 480 | 2.5% |
| White / Caucasian | 5,812 | 30.8% |
| Two or more Races | 2,773 | 14.7% |
| Some other Race | 7,207 | 38.3% |
| Total | 18,840 | 100.0% |
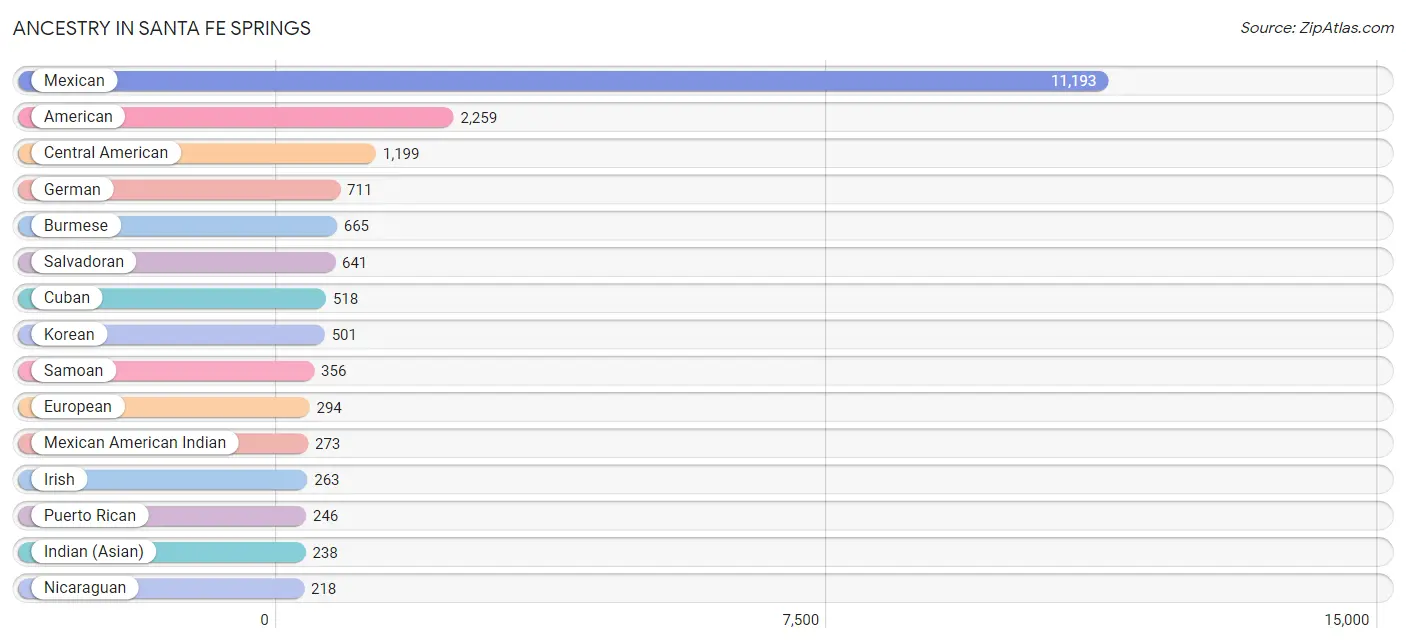
Ancestry in Santa Fe Springs
The most populous ancestries reported in Santa Fe Springs are Mexican (11,193 | 59.4%), American (2,259 | 12.0%), Central American (1,199 | 6.4%), German (711 | 3.8%), and Burmese (665 | 3.5%), together accounting for 85.1% of all Santa Fe Springs residents.
| Ancestry | # Population | % Population |
| African | 42 | 0.2% |
| American | 2,259 | 12.0% |
| Arab | 13 | 0.1% |
| Belizean | 180 | 1.0% |
| Bhutanese | 186 | 1.0% |
| Brazilian | 7 | 0.0% |
| Burmese | 665 | 3.5% |
| Central American | 1,199 | 6.4% |
| Central American Indian | 186 | 1.0% |
| Chilean | 3 | 0.0% |
| Choctaw | 30 | 0.2% |
| Colombian | 13 | 0.1% |
| Costa Rican | 63 | 0.3% |
| Cuban | 518 | 2.8% |
| Czechoslovakian | 21 | 0.1% |
| Dominican | 13 | 0.1% |
| Dutch | 11 | 0.1% |
| Ecuadorian | 59 | 0.3% |
| English | 133 | 0.7% |
| Ethiopian | 7 | 0.0% |
| European | 294 | 1.6% |
| Filipino | 11 | 0.1% |
| French | 75 | 0.4% |
| French Canadian | 6 | 0.0% |
| German | 711 | 3.8% |
| Guatemalan | 199 | 1.1% |
| Honduran | 57 | 0.3% |
| Hopi | 14 | 0.1% |
| Indian (Asian) | 238 | 1.3% |
| Iranian | 8 | 0.0% |
| Irish | 263 | 1.4% |
| Israeli | 5 | 0.0% |
| Italian | 197 | 1.1% |
| Jamaican | 23 | 0.1% |
| Japanese | 112 | 0.6% |
| Korean | 501 | 2.7% |
| Mexican | 11,193 | 59.4% |
| Mexican American Indian | 273 | 1.5% |
| Native Hawaiian | 46 | 0.2% |
| Nicaraguan | 218 | 1.2% |
| Norwegian | 27 | 0.1% |
| Pakistani | 15 | 0.1% |
| Palestinian | 13 | 0.1% |
| Panamanian | 5 | 0.0% |
| Peruvian | 76 | 0.4% |
| Polish | 15 | 0.1% |
| Portuguese | 19 | 0.1% |
| Pueblo | 37 | 0.2% |
| Puerto Rican | 246 | 1.3% |
| Russian | 9 | 0.1% |
| Salvadoran | 641 | 3.4% |
| Samoan | 356 | 1.9% |
| Scandinavian | 102 | 0.5% |
| Scottish | 29 | 0.2% |
| Seminole | 7 | 0.0% |
| South African | 32 | 0.2% |
| South American | 175 | 0.9% |
| South American Indian | 20 | 0.1% |
| Spaniard | 127 | 0.7% |
| Spanish | 35 | 0.2% |
| Spanish American | 7 | 0.0% |
| Spanish American Indian | 6 | 0.0% |
| Sri Lankan | 147 | 0.8% |
| Subsaharan African | 81 | 0.4% |
| Swedish | 28 | 0.2% |
| Thai | 151 | 0.8% |
| Ukrainian | 37 | 0.2% |
| Uruguayan | 24 | 0.1% |
| Welsh | 23 | 0.1% | View All 69 Rows |
Immigrants in Santa Fe Springs
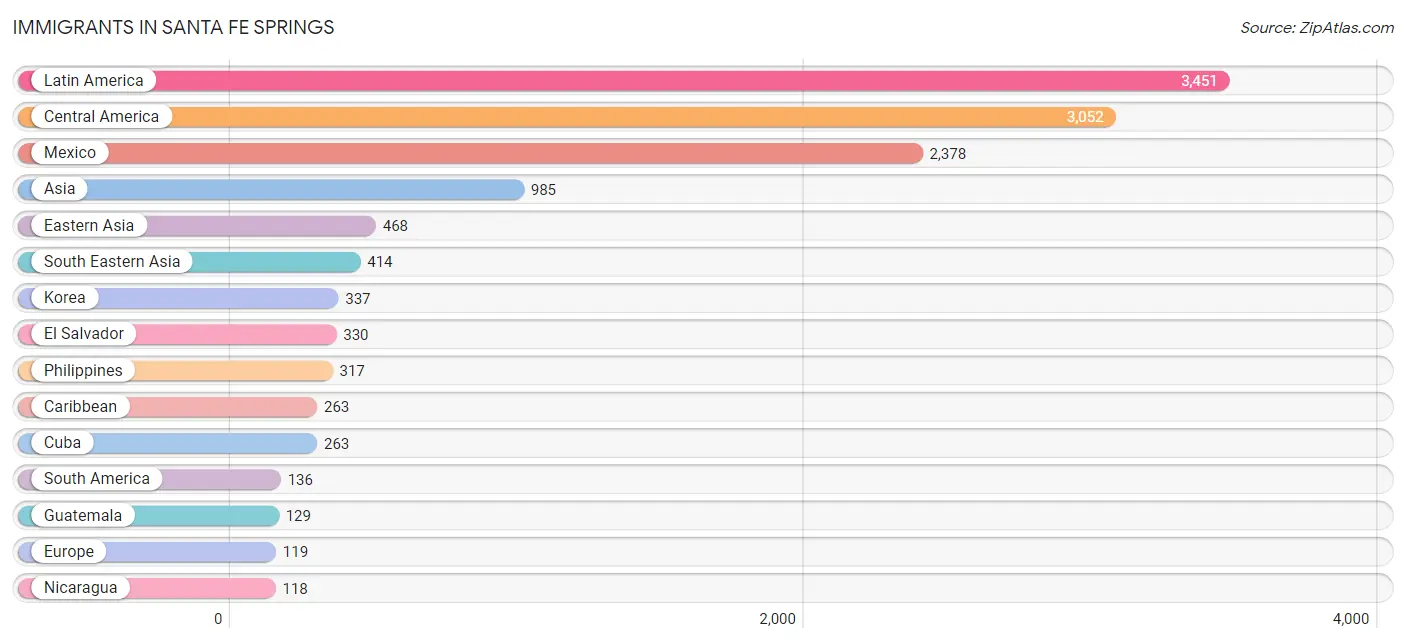
The most numerous immigrant groups reported in Santa Fe Springs came from Latin America (3,451 | 18.3%), Central America (3,052 | 16.2%), Mexico (2,378 | 12.6%), Asia (985 | 5.2%), and Eastern Asia (468 | 2.5%), together accounting for 54.9% of all Santa Fe Springs residents.
| Immigration Origin | # Population | % Population |
| Africa | 51 | 0.3% |
| Asia | 985 | 5.2% |
| Australia | 11 | 0.1% |
| Brazil | 19 | 0.1% |
| Cambodia | 64 | 0.3% |
| Caribbean | 263 | 1.4% |
| Central America | 3,052 | 16.2% |
| China | 109 | 0.6% |
| Colombia | 13 | 0.1% |
| Costa Rica | 40 | 0.2% |
| Cuba | 263 | 1.4% |
| Eastern Asia | 468 | 2.5% |
| Eastern Europe | 9 | 0.1% |
| Ecuador | 59 | 0.3% |
| El Salvador | 330 | 1.8% |
| Europe | 119 | 0.6% |
| Germany | 86 | 0.5% |
| Ghana | 19 | 0.1% |
| Guatemala | 129 | 0.7% |
| Honduras | 57 | 0.3% |
| Hong Kong | 9 | 0.1% |
| India | 63 | 0.3% |
| Iran | 8 | 0.0% |
| Ireland | 19 | 0.1% |
| Italy | 1 | 0.0% |
| Japan | 22 | 0.1% |
| Korea | 337 | 1.8% |
| Latin America | 3,451 | 18.3% |
| Mexico | 2,378 | 12.6% |
| Nicaragua | 118 | 0.6% |
| Northern Europe | 19 | 0.1% |
| Oceania | 11 | 0.1% |
| Peru | 45 | 0.2% |
| Philippines | 317 | 1.7% |
| Saudi Arabia | 27 | 0.1% |
| South Africa | 32 | 0.2% |
| South America | 136 | 0.7% |
| South Central Asia | 71 | 0.4% |
| South Eastern Asia | 414 | 2.2% |
| Southern Europe | 5 | 0.0% |
| Spain | 4 | 0.0% |
| Taiwan | 21 | 0.1% |
| Thailand | 10 | 0.1% |
| Ukraine | 9 | 0.1% |
| Vietnam | 23 | 0.1% |
| Western Africa | 19 | 0.1% |
| Western Asia | 27 | 0.1% |
| Western Europe | 86 | 0.5% | View All 48 Rows |
Sex and Age in Santa Fe Springs
Sex and Age in Santa Fe Springs
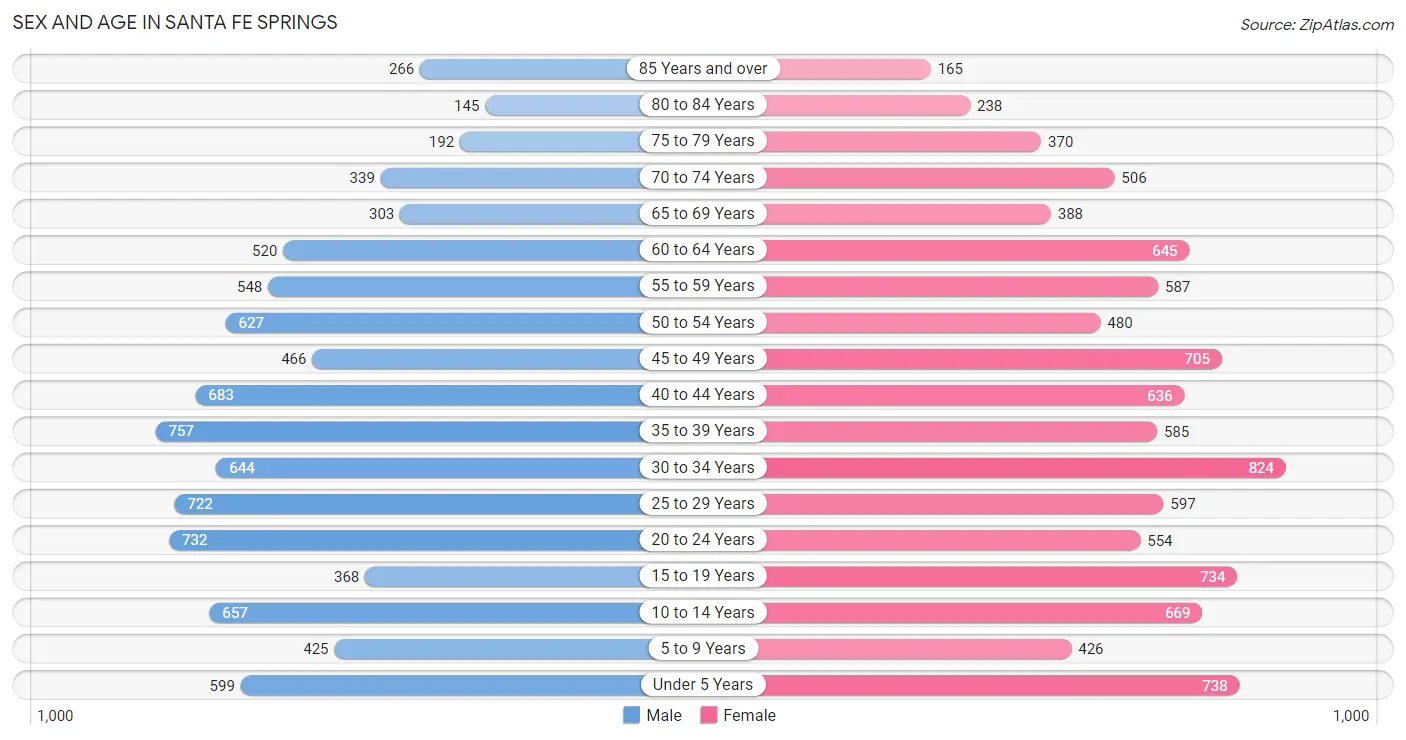
The most populous age groups in Santa Fe Springs are 35 to 39 Years (757 | 8.4%) for men and 30 to 34 Years (824 | 8.4%) for women.
| Age Bracket | Male | Female |
| Under 5 Years | 599 (6.7%) | 738 (7.5%) |
| 5 to 9 Years | 425 (4.7%) | 426 (4.3%) |
| 10 to 14 Years | 657 (7.3%) | 669 (6.8%) |
| 15 to 19 Years | 368 (4.1%) | 734 (7.4%) |
| 20 to 24 Years | 732 (8.1%) | 554 (5.6%) |
| 25 to 29 Years | 722 (8.0%) | 597 (6.1%) |
| 30 to 34 Years | 644 (7.2%) | 824 (8.4%) |
| 35 to 39 Years | 757 (8.4%) | 585 (5.9%) |
| 40 to 44 Years | 683 (7.6%) | 636 (6.5%) |
| 45 to 49 Years | 466 (5.2%) | 705 (7.2%) |
| 50 to 54 Years | 627 (7.0%) | 480 (4.9%) |
| 55 to 59 Years | 548 (6.1%) | 587 (6.0%) |
| 60 to 64 Years | 520 (5.8%) | 645 (6.6%) |
| 65 to 69 Years | 303 (3.4%) | 388 (3.9%) |
| 70 to 74 Years | 339 (3.8%) | 506 (5.1%) |
| 75 to 79 Years | 192 (2.1%) | 370 (3.8%) |
| 80 to 84 Years | 145 (1.6%) | 238 (2.4%) |
| 85 Years and over | 266 (3.0%) | 165 (1.7%) |
| Total | 8,993 (100.0%) | 9,847 (100.0%) |
Families and Households in Santa Fe Springs
Median Family Size in Santa Fe Springs
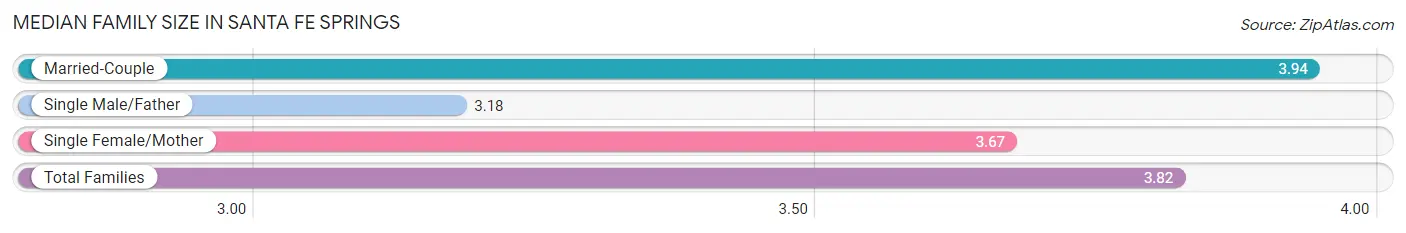
The median family size in Santa Fe Springs is 3.82 persons per family, with married-couple families (2,821 | 67.1%) accounting for the largest median family size of 3.94 persons per family. On the other hand, single male/father families (270 | 6.4%) represent the smallest median family size with 3.18 persons per family.
| Family Type | # Families | Family Size |
| Married-Couple | 2,821 (67.1%) | 3.94 |
| Single Male/Father | 270 (6.4%) | 3.18 |
| Single Female/Mother | 1,115 (26.5%) | 3.67 |
| Total Families | 4,206 (100.0%) | 3.82 |
Median Household Size in Santa Fe Springs
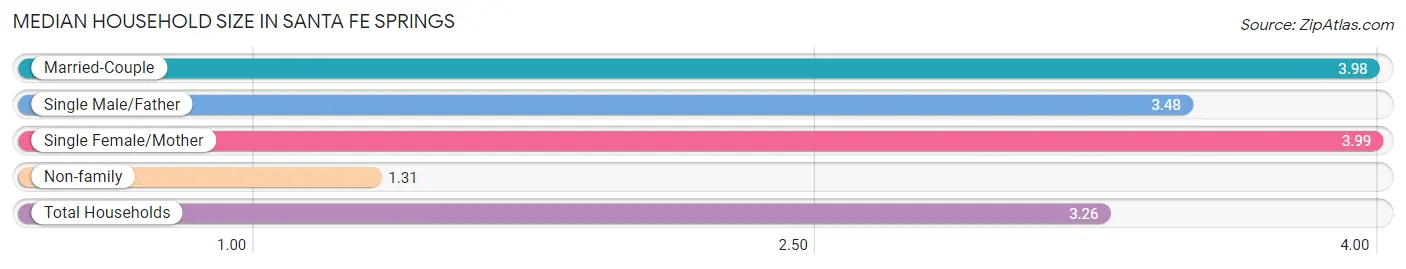
The median household size in Santa Fe Springs is 3.26 persons per household, with single female/mother households (1,115 | 19.6%) accounting for the largest median household size of 3.99 persons per household. non-family households (1,494 | 26.2%) represent the smallest median household size with 1.31 persons per household.
| Household Type | # Households | Household Size |
| Married-Couple | 2,821 (49.5%) | 3.98 |
| Single Male/Father | 270 (4.7%) | 3.48 |
| Single Female/Mother | 1,115 (19.6%) | 3.99 |
| Non-family | 1,494 (26.2%) | 1.31 |
| Total Households | 5,700 (100.0%) | 3.26 |
Household Size by Marriage Status in Santa Fe Springs
Out of a total of 5,700 households in Santa Fe Springs, 4,206 (73.8%) are family households, while 1,494 (26.2%) are nonfamily households. The most numerous type of family households are 2-person households, comprising 1,305, and the most common type of nonfamily households are 1-person households, comprising 1,278.
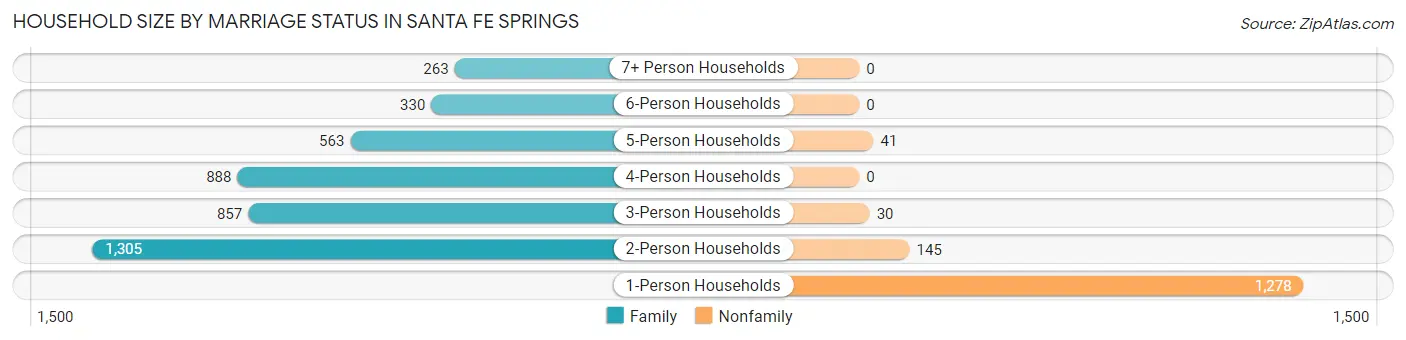
| Household Size | Family Households | Nonfamily Households |
| 1-Person Households | - | 1,278 (22.4%) |
| 2-Person Households | 1,305 (22.9%) | 145 (2.5%) |
| 3-Person Households | 857 (15.0%) | 30 (0.5%) |
| 4-Person Households | 888 (15.6%) | 0 (0.0%) |
| 5-Person Households | 563 (9.9%) | 41 (0.7%) |
| 6-Person Households | 330 (5.8%) | 0 (0.0%) |
| 7+ Person Households | 263 (4.6%) | 0 (0.0%) |
| Total | 4,206 (73.8%) | 1,494 (26.2%) |
Female Fertility in Santa Fe Springs
Fertility by Age in Santa Fe Springs
Average fertility rate in Santa Fe Springs is 34.0 births per 1,000 women. Women in the age bracket of 20 to 34 years have the highest fertility rate with 53.0 births per 1,000 women. Women in the age bracket of 20 to 34 years acount for 64.0% of all women with births.
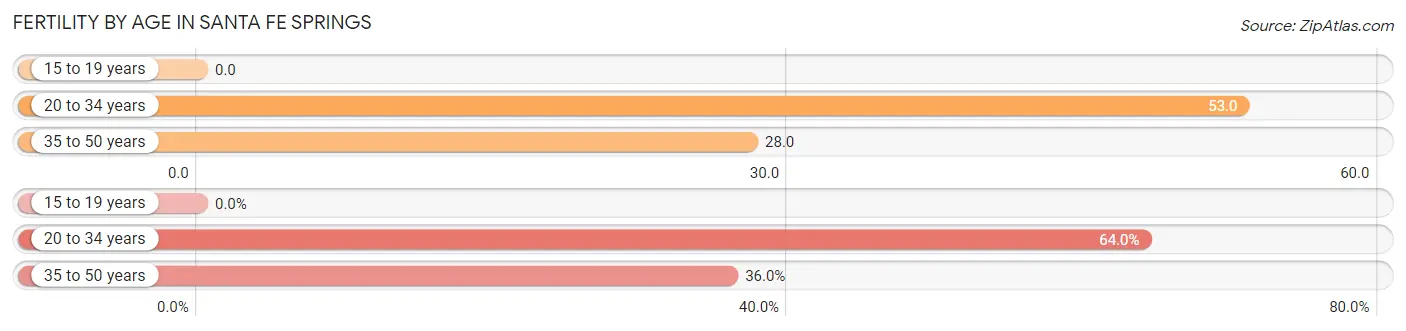
| Age Bracket | Women with Births | Births / 1,000 Women |
| 15 to 19 years | 0 (0.0%) | 0.0 |
| 20 to 34 years | 105 (64.0%) | 53.0 |
| 35 to 50 years | 59 (36.0%) | 28.0 |
| Total | 164 (100.0%) | 34.0 |
Fertility by Age by Marriage Status in Santa Fe Springs
82.3% of women with births (164) in Santa Fe Springs are married. The highest percentage of unmarried women with births falls into 35 to 50 years age bracket with 22.0% of them unmarried at the time of birth, while the lowest percentage of unmarried women with births belong to 20 to 34 years age bracket with 15.2% of them unmarried.
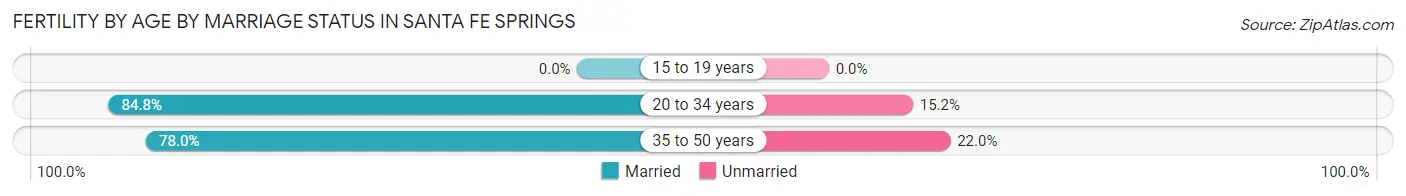
| Age Bracket | Married | Unmarried |
| 15 to 19 years | 0 (0.0%) | 0 (0.0%) |
| 20 to 34 years | 89 (84.8%) | 16 (15.2%) |
| 35 to 50 years | 46 (78.0%) | 13 (22.0%) |
| Total | 135 (82.3%) | 29 (17.7%) |
Fertility by Education in Santa Fe Springs
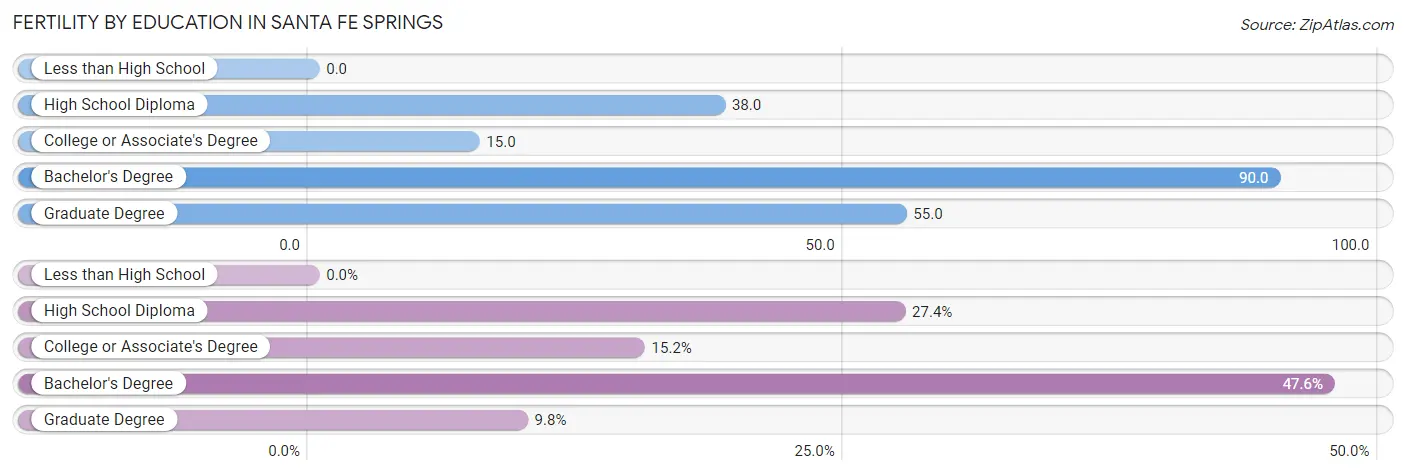
| Educational Attainment | Women with Births | Births / 1,000 Women |
| Less than High School | 0 (0.0%) | 0.0 |
| High School Diploma | 45 (27.4%) | 38.0 |
| College or Associate's Degree | 25 (15.2%) | 15.0 |
| Bachelor's Degree | 78 (47.6%) | 90.0 |
| Graduate Degree | 16 (9.8%) | 55.0 |
| Total | 164 (100.0%) | 34.0 |
Fertility by Education by Marriage Status in Santa Fe Springs
17.7% of women with births in Santa Fe Springs are unmarried. Women with the educational attainment of high school diploma are most likely to be married with 100.0% of them married at childbirth, while women with the educational attainment of college or associate's degree are least likely to be married with 76.0% of them unmarried at childbirth.
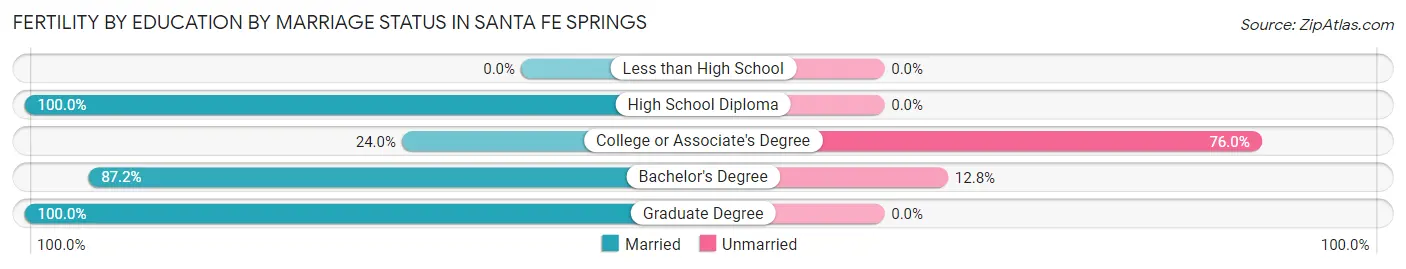
| Educational Attainment | Married | Unmarried |
| Less than High School | 0 (0.0%) | 0 (0.0%) |
| High School Diploma | 45 (100.0%) | 0 (0.0%) |
| College or Associate's Degree | 6 (24.0%) | 19 (76.0%) |
| Bachelor's Degree | 68 (87.2%) | 10 (12.8%) |
| Graduate Degree | 16 (100.0%) | 0 (0.0%) |
| Total | 135 (82.3%) | 29 (17.7%) |
Employment Characteristics in Santa Fe Springs
Employment by Class of Employer in Santa Fe Springs
Among the 8,338 employed individuals in Santa Fe Springs, private company employees (5,579 | 66.9%), local government employees (1,143 | 13.7%), and not-for-profit organizations (562 | 6.7%) make up the most common classes of employment.
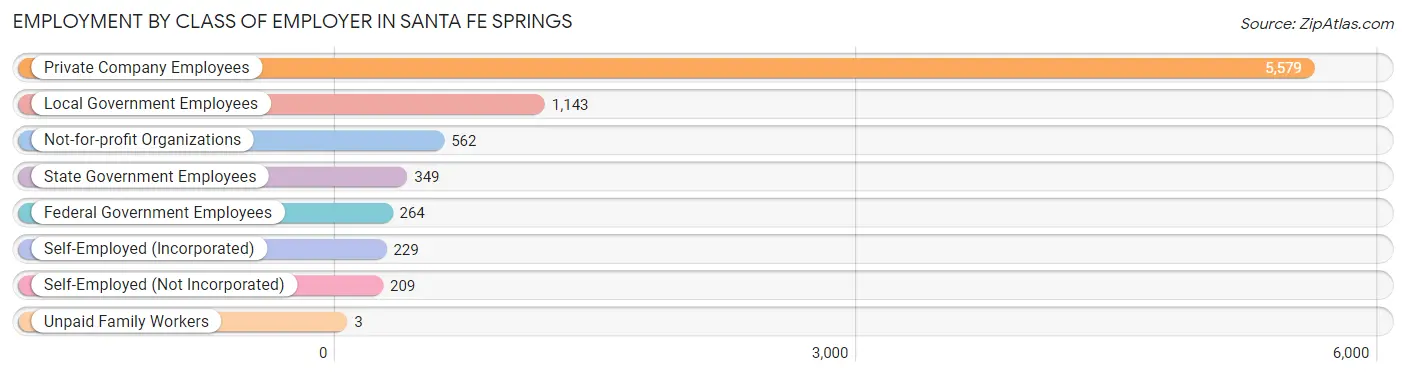
| Employer Class | # Employees | % Employees |
| Private Company Employees | 5,579 | 66.9% |
| Self-Employed (Incorporated) | 229 | 2.8% |
| Self-Employed (Not Incorporated) | 209 | 2.5% |
| Not-for-profit Organizations | 562 | 6.7% |
| Local Government Employees | 1,143 | 13.7% |
| State Government Employees | 349 | 4.2% |
| Federal Government Employees | 264 | 3.2% |
| Unpaid Family Workers | 3 | 0.0% |
| Total | 8,338 | 100.0% |
Employment Status by Age in Santa Fe Springs
According to the labor force statistics for Santa Fe Springs, out of the total population over 16 years of age (15,152), 60.0% or 9,091 individuals are in the labor force, with 4.2% or 382 of them unemployed. The age group with the highest labor force participation rate is 45 to 54 years, with 86.3% or 1,966 individuals in the labor force. Within the labor force, the 16 to 19 years age range has the highest percentage of unemployed individuals, with 24.2% or 46 of them being unemployed.
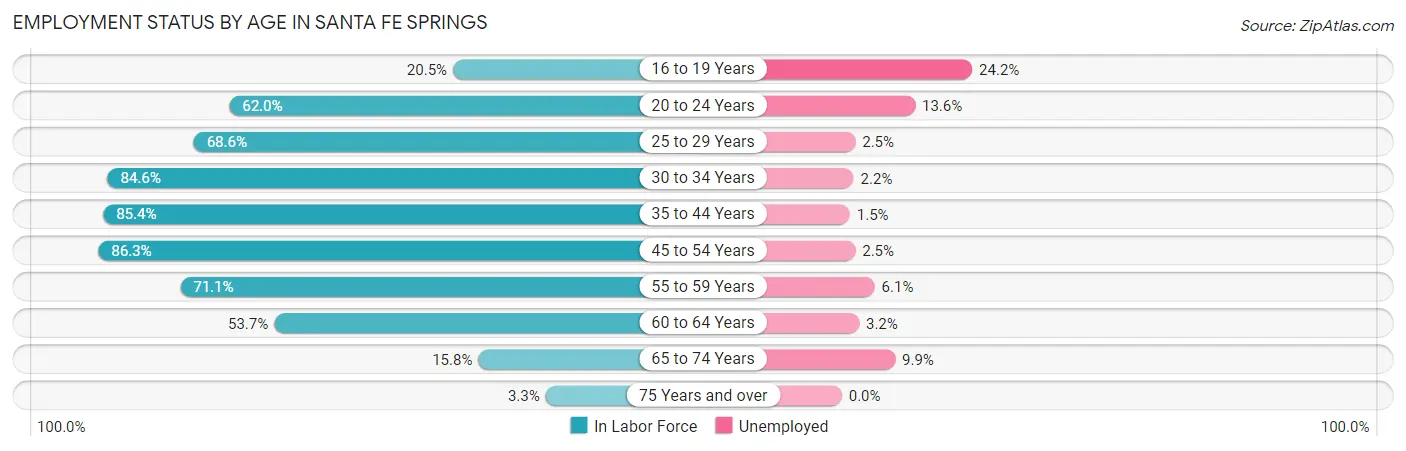
| Age Bracket | In Labor Force | Unemployed |
| 16 to 19 Years | 190 (20.5%) | 46 (24.2%) |
| 20 to 24 Years | 797 (62.0%) | 108 (13.6%) |
| 25 to 29 Years | 905 (68.6%) | 23 (2.5%) |
| 30 to 34 Years | 1,242 (84.6%) | 27 (2.2%) |
| 35 to 44 Years | 2,272 (85.4%) | 34 (1.5%) |
| 45 to 54 Years | 1,966 (86.3%) | 49 (2.5%) |
| 55 to 59 Years | 807 (71.1%) | 49 (6.1%) |
| 60 to 64 Years | 626 (53.7%) | 20 (3.2%) |
| 65 to 74 Years | 243 (15.8%) | 24 (9.9%) |
| 75 Years and over | 45 (3.3%) | 0 (0.0%) |
| Total | 9,091 (60.0%) | 382 (4.2%) |
Employment Status by Educational Attainment in Santa Fe Springs
According to labor force statistics for Santa Fe Springs, 78.0% of individuals (7,820) out of the total population between 25 and 64 years of age (10,026) are in the labor force, with 2.6% or 203 of them being unemployed. The group with the highest labor force participation rate are those with the educational attainment of college / associate degree, with 83.7% or 2,945 individuals in the labor force. Within the labor force, individuals with high school diploma education have the highest percentage of unemployment, with 4.5% or 89 of them being unemployed.
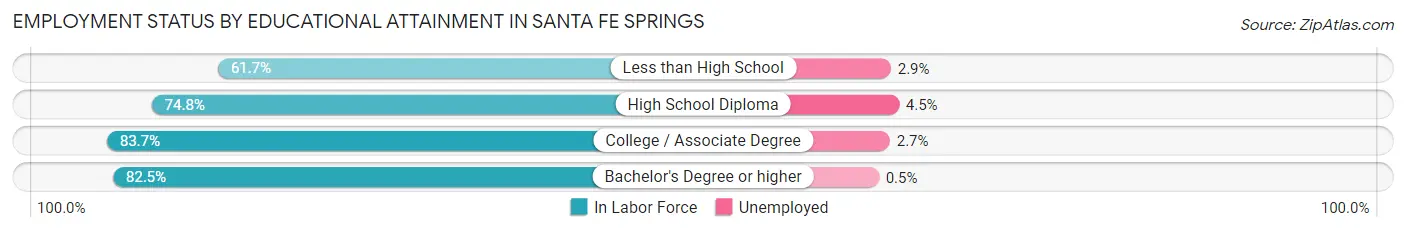
| Educational Attainment | In Labor Force | Unemployed |
| Less than High School | 871 (61.7%) | 41 (2.9%) |
| High School Diploma | 1,976 (74.8%) | 119 (4.5%) |
| College / Associate Degree | 2,945 (83.7%) | 95 (2.7%) |
| Bachelor's Degree or higher | 2,025 (82.5%) | 12 (0.5%) |
| Total | 7,820 (78.0%) | 261 (2.6%) |
Employment Occupations by Sex in Santa Fe Springs
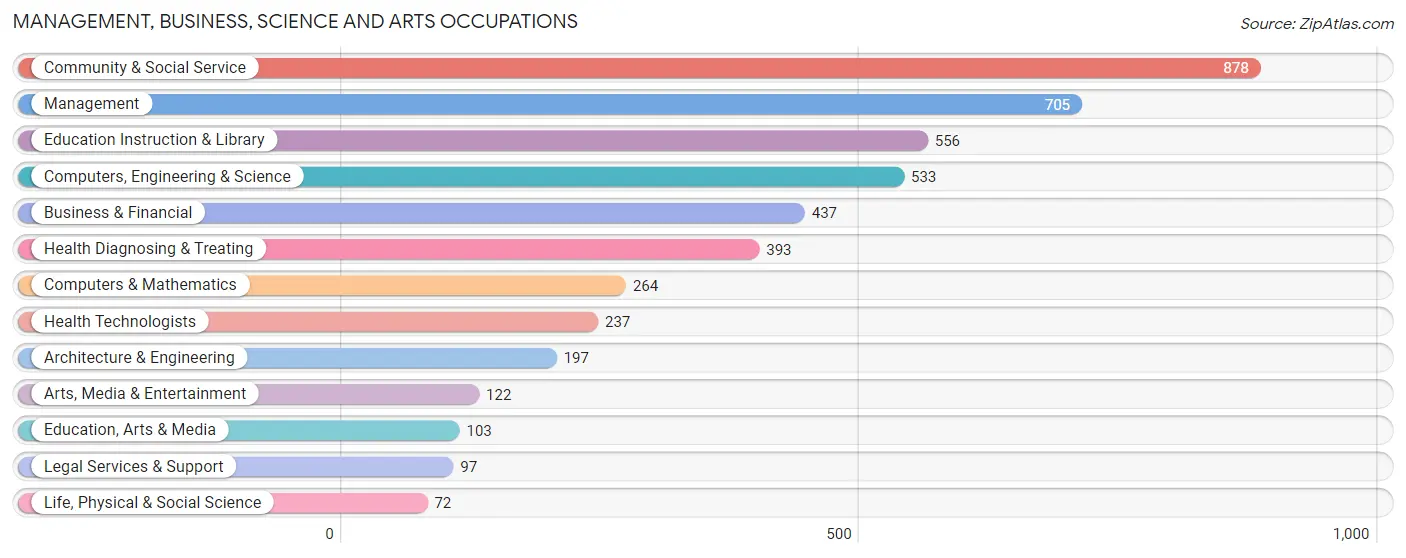
Management, Business, Science and Arts Occupations
The most common Management, Business, Science and Arts occupations in Santa Fe Springs are Community & Social Service (878 | 10.1%), Management (705 | 8.1%), Education Instruction & Library (556 | 6.4%), Computers, Engineering & Science (533 | 6.1%), and Business & Financial (437 | 5.0%).
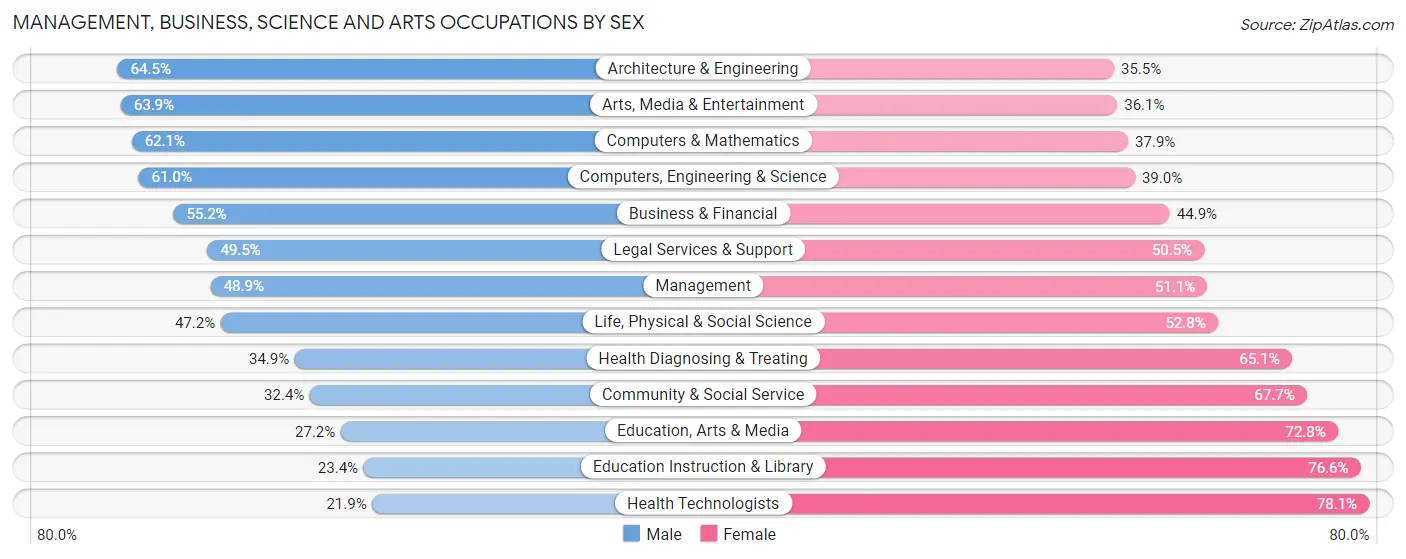
Management, Business, Science and Arts Occupations by Sex
Within the Management, Business, Science and Arts occupations in Santa Fe Springs, the most male-oriented occupations are Architecture & Engineering (64.5%), Arts, Media & Entertainment (63.9%), and Computers & Mathematics (62.1%), while the most female-oriented occupations are Health Technologists (78.1%), Education Instruction & Library (76.6%), and Education, Arts & Media (72.8%).
| Occupation | Male | Female |
| Management | 345 (48.9%) | 360 (51.1%) |
| Business & Financial | 241 (55.1%) | 196 (44.9%) |
| Computers, Engineering & Science | 325 (61.0%) | 208 (39.0%) |
| Computers & Mathematics | 164 (62.1%) | 100 (37.9%) |
| Architecture & Engineering | 127 (64.5%) | 70 (35.5%) |
| Life, Physical & Social Science | 34 (47.2%) | 38 (52.8%) |
| Community & Social Service | 284 (32.4%) | 594 (67.6%) |
| Education, Arts & Media | 28 (27.2%) | 75 (72.8%) |
| Legal Services & Support | 48 (49.5%) | 49 (50.5%) |
| Education Instruction & Library | 130 (23.4%) | 426 (76.6%) |
| Arts, Media & Entertainment | 78 (63.9%) | 44 (36.1%) |
| Health Diagnosing & Treating | 137 (34.9%) | 256 (65.1%) |
| Health Technologists | 52 (21.9%) | 185 (78.1%) |
| Total (Category) | 1,332 (45.2%) | 1,614 (54.8%) |
| Total (Overall) | 4,591 (52.8%) | 4,111 (47.2%) |
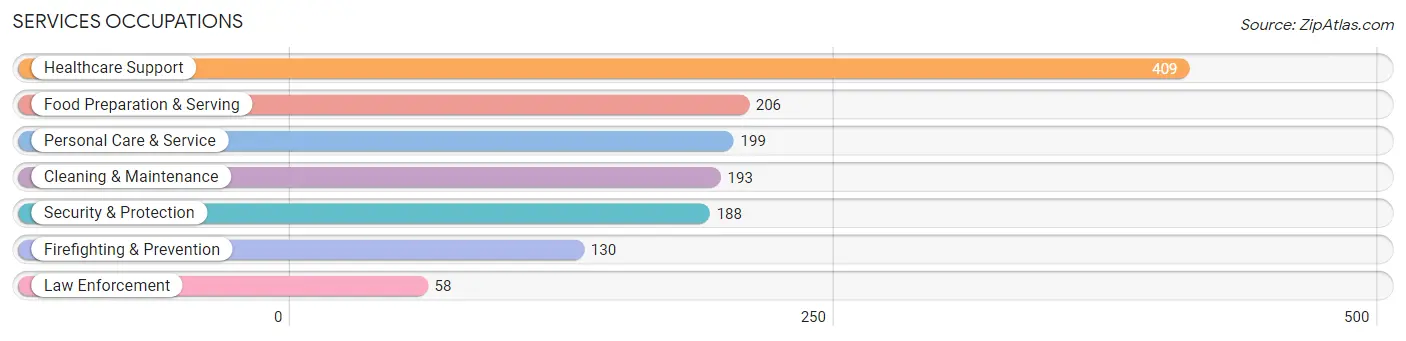
Services Occupations
The most common Services occupations in Santa Fe Springs are Healthcare Support (409 | 4.7%), Food Preparation & Serving (206 | 2.4%), Personal Care & Service (199 | 2.3%), Cleaning & Maintenance (193 | 2.2%), and Security & Protection (188 | 2.2%).
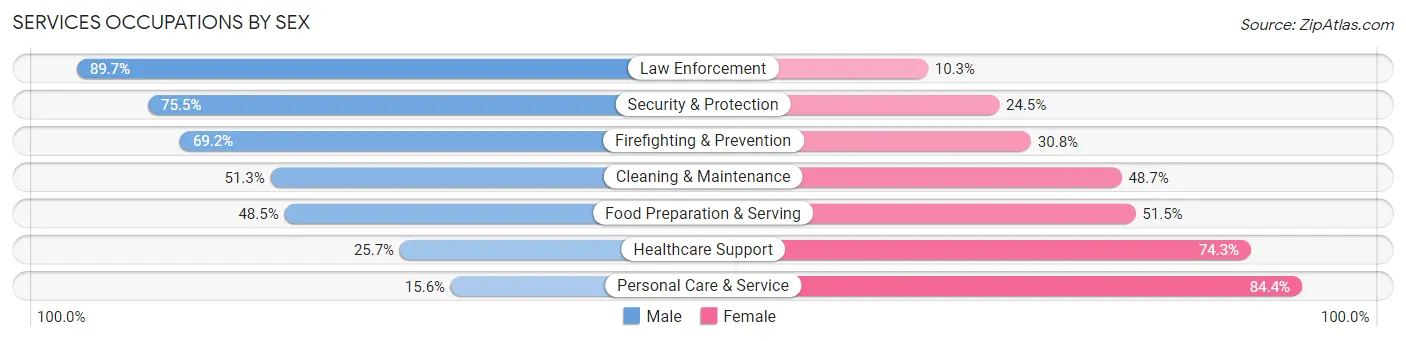
Services Occupations by Sex
Within the Services occupations in Santa Fe Springs, the most male-oriented occupations are Law Enforcement (89.7%), Security & Protection (75.5%), and Firefighting & Prevention (69.2%), while the most female-oriented occupations are Personal Care & Service (84.4%), Healthcare Support (74.3%), and Food Preparation & Serving (51.5%).
| Occupation | Male | Female |
| Healthcare Support | 105 (25.7%) | 304 (74.3%) |
| Security & Protection | 142 (75.5%) | 46 (24.5%) |
| Firefighting & Prevention | 90 (69.2%) | 40 (30.8%) |
| Law Enforcement | 52 (89.7%) | 6 (10.3%) |
| Food Preparation & Serving | 100 (48.5%) | 106 (51.5%) |
| Cleaning & Maintenance | 99 (51.3%) | 94 (48.7%) |
| Personal Care & Service | 31 (15.6%) | 168 (84.4%) |
| Total (Category) | 477 (39.9%) | 718 (60.1%) |
| Total (Overall) | 4,591 (52.8%) | 4,111 (47.2%) |
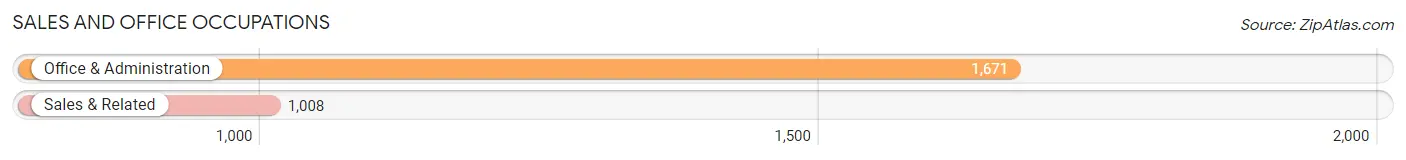
Sales and Office Occupations
The most common Sales and Office occupations in Santa Fe Springs are Office & Administration (1,671 | 19.2%), and Sales & Related (1,008 | 11.6%).
Sales and Office Occupations by Sex
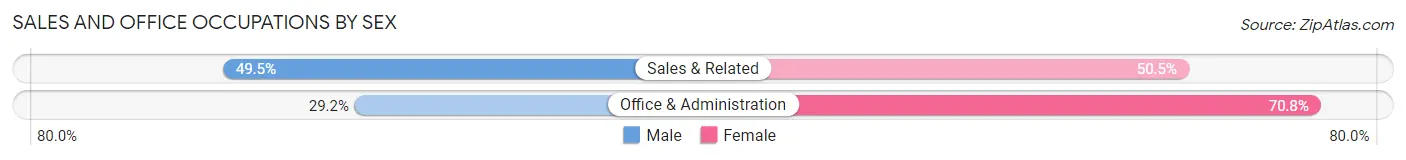
| Occupation | Male | Female |
| Sales & Related | 499 (49.5%) | 509 (50.5%) |
| Office & Administration | 488 (29.2%) | 1,183 (70.8%) |
| Total (Category) | 987 (36.8%) | 1,692 (63.2%) |
| Total (Overall) | 4,591 (52.8%) | 4,111 (47.2%) |
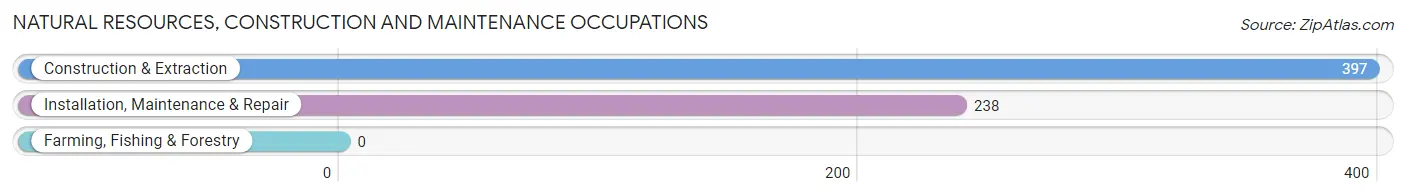
Natural Resources, Construction and Maintenance Occupations
The most common Natural Resources, Construction and Maintenance occupations in Santa Fe Springs are Construction & Extraction (397 | 4.6%), and Installation, Maintenance & Repair (238 | 2.7%).
Natural Resources, Construction and Maintenance Occupations by Sex
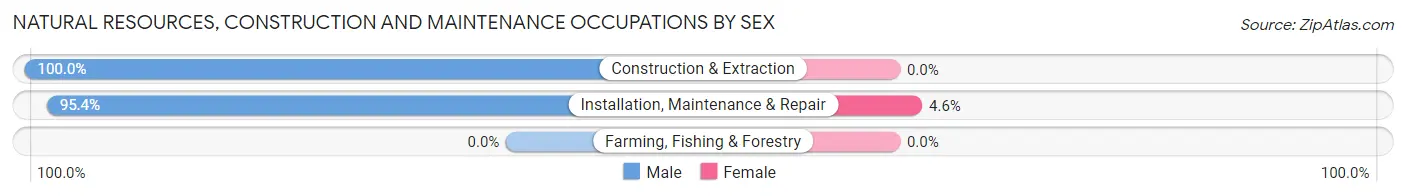
| Occupation | Male | Female |
| Farming, Fishing & Forestry | 0 (0.0%) | 0 (0.0%) |
| Construction & Extraction | 397 (100.0%) | 0 (0.0%) |
| Installation, Maintenance & Repair | 227 (95.4%) | 11 (4.6%) |
| Total (Category) | 624 (98.3%) | 11 (1.7%) |
| Total (Overall) | 4,591 (52.8%) | 4,111 (47.2%) |
Production, Transportation and Moving Occupations
The most common Production, Transportation and Moving occupations in Santa Fe Springs are Production (443 | 5.1%), Material Moving (412 | 4.7%), and Transportation (392 | 4.5%).
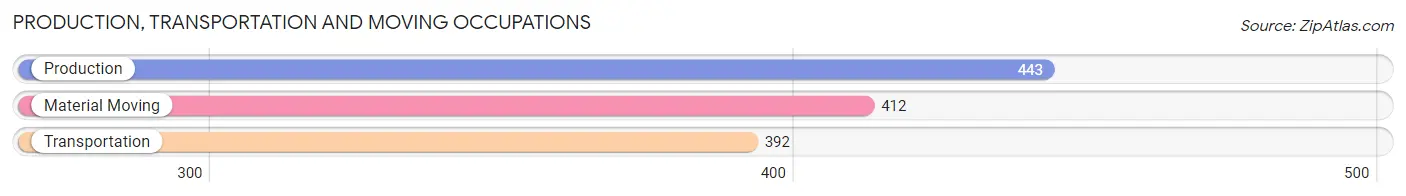
Production, Transportation and Moving Occupations by Sex
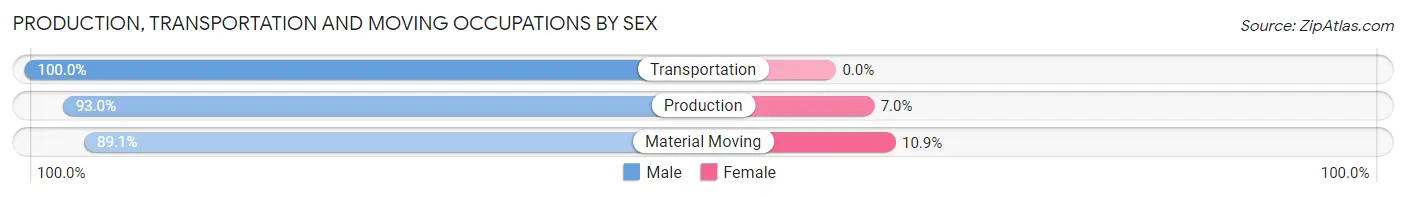
| Occupation | Male | Female |
| Production | 412 (93.0%) | 31 (7.0%) |
| Transportation | 392 (100.0%) | 0 (0.0%) |
| Material Moving | 367 (89.1%) | 45 (10.9%) |
| Total (Category) | 1,171 (93.9%) | 76 (6.1%) |
| Total (Overall) | 4,591 (52.8%) | 4,111 (47.2%) |
Employment Industries by Sex in Santa Fe Springs
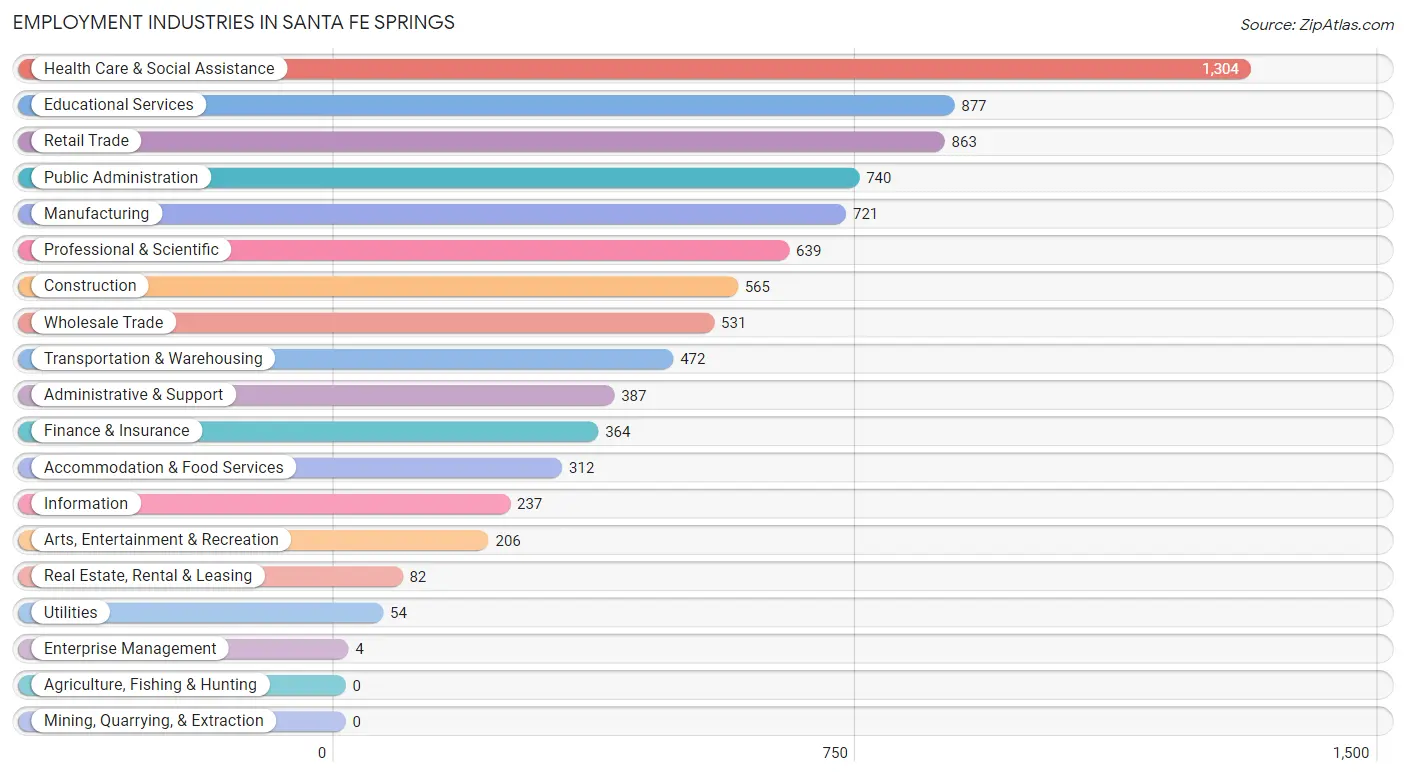
Employment Industries in Santa Fe Springs
The major employment industries in Santa Fe Springs include Health Care & Social Assistance (1,304 | 15.0%), Educational Services (877 | 10.1%), Retail Trade (863 | 9.9%), Public Administration (740 | 8.5%), and Manufacturing (721 | 8.3%).
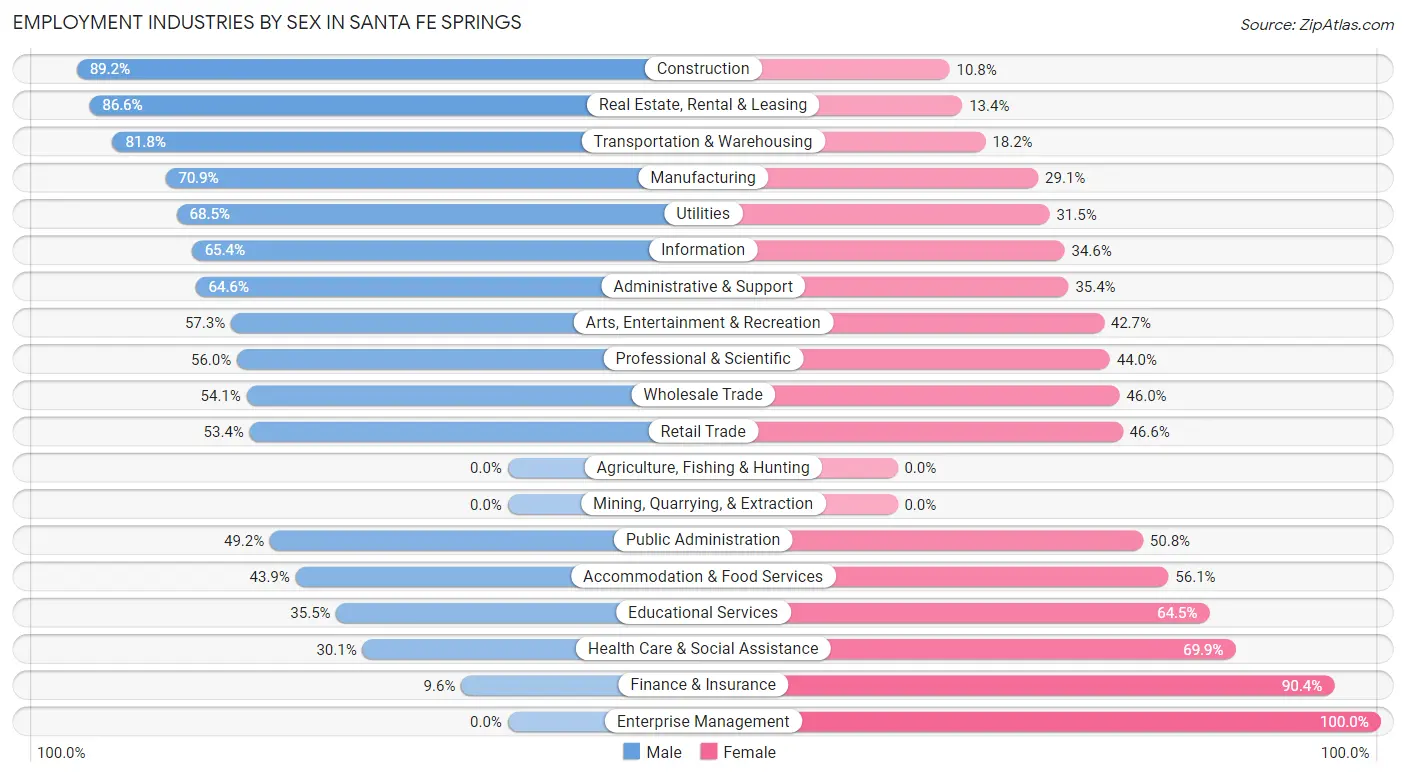
Employment Industries by Sex in Santa Fe Springs
The Santa Fe Springs industries that see more men than women are Construction (89.2%), Real Estate, Rental & Leasing (86.6%), and Transportation & Warehousing (81.8%), whereas the industries that tend to have a higher number of women are Enterprise Management (100.0%), Finance & Insurance (90.4%), and Health Care & Social Assistance (69.9%).
| Industry | Male | Female |
| Agriculture, Fishing & Hunting | 0 (0.0%) | 0 (0.0%) |
| Mining, Quarrying, & Extraction | 0 (0.0%) | 0 (0.0%) |
| Construction | 504 (89.2%) | 61 (10.8%) |
| Manufacturing | 511 (70.9%) | 210 (29.1%) |
| Wholesale Trade | 287 (54.0%) | 244 (46.0%) |
| Retail Trade | 461 (53.4%) | 402 (46.6%) |
| Transportation & Warehousing | 386 (81.8%) | 86 (18.2%) |
| Utilities | 37 (68.5%) | 17 (31.5%) |
| Information | 155 (65.4%) | 82 (34.6%) |
| Finance & Insurance | 35 (9.6%) | 329 (90.4%) |
| Real Estate, Rental & Leasing | 71 (86.6%) | 11 (13.4%) |
| Professional & Scientific | 358 (56.0%) | 281 (44.0%) |
| Enterprise Management | 0 (0.0%) | 4 (100.0%) |
| Administrative & Support | 250 (64.6%) | 137 (35.4%) |
| Educational Services | 311 (35.5%) | 566 (64.5%) |
| Health Care & Social Assistance | 392 (30.1%) | 912 (69.9%) |
| Arts, Entertainment & Recreation | 118 (57.3%) | 88 (42.7%) |
| Accommodation & Food Services | 137 (43.9%) | 175 (56.1%) |
| Public Administration | 364 (49.2%) | 376 (50.8%) |
| Total | 4,591 (52.8%) | 4,111 (47.2%) |
Education in Santa Fe Springs
School Enrollment in Santa Fe Springs
The most common levels of schooling among the 4,241 students in Santa Fe Springs are college / undergraduate (990 | 23.3%), middle school (979 | 23.1%), and high school (879 | 20.7%).
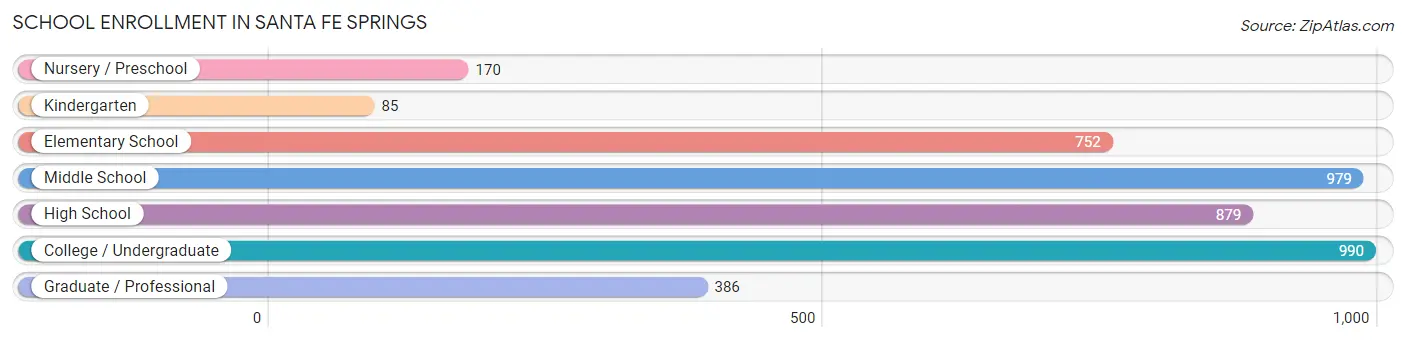
| School Level | # Students | % Students |
| Nursery / Preschool | 170 | 4.0% |
| Kindergarten | 85 | 2.0% |
| Elementary School | 752 | 17.7% |
| Middle School | 979 | 23.1% |
| High School | 879 | 20.7% |
| College / Undergraduate | 990 | 23.3% |
| Graduate / Professional | 386 | 9.1% |
| Total | 4,241 | 100.0% |
School Enrollment by Age by Funding Source in Santa Fe Springs
Out of a total of 4,241 students who are enrolled in schools in Santa Fe Springs, 551 (13.0%) attend a private institution, while the remaining 3,690 (87.0%) are enrolled in public schools. The age group of 3 to 4 year olds has the highest likelihood of being enrolled in private schools, with 88 (61.1% in the age bracket) enrolled. Conversely, the age group of 18 to 19 year olds has the lowest likelihood of being enrolled in a private school, with 312 (98.1% in the age bracket) attending a public institution.
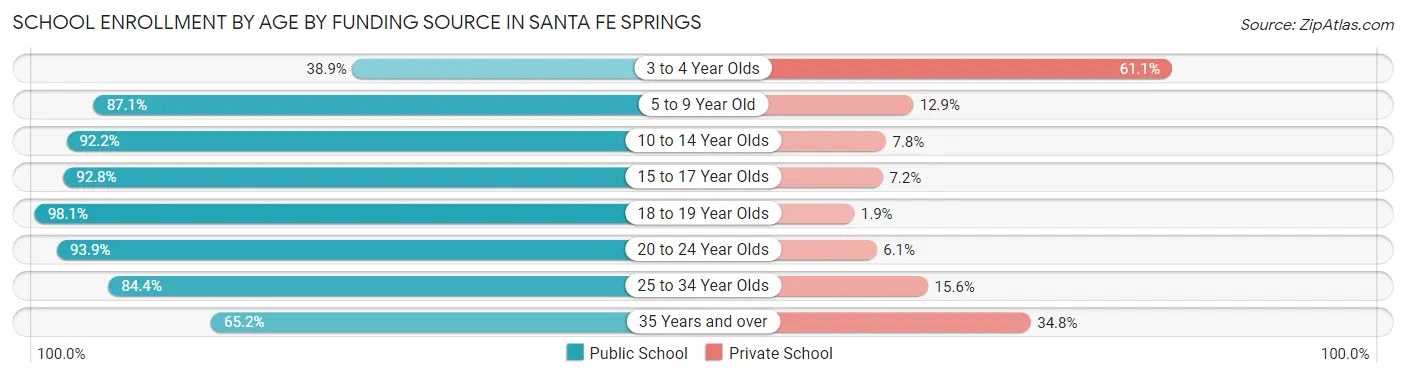
| Age Bracket | Public School | Private School |
| 3 to 4 Year Olds | 56 (38.9%) | 88 (61.1%) |
| 5 to 9 Year Old | 636 (87.1%) | 94 (12.9%) |
| 10 to 14 Year Olds | 1,100 (92.2%) | 93 (7.8%) |
| 15 to 17 Year Olds | 539 (92.8%) | 42 (7.2%) |
| 18 to 19 Year Olds | 312 (98.1%) | 6 (1.9%) |
| 20 to 24 Year Olds | 402 (93.9%) | 26 (6.1%) |
| 25 to 34 Year Olds | 399 (84.4%) | 74 (15.6%) |
| 35 Years and over | 244 (65.2%) | 130 (34.8%) |
| Total | 3,690 (87.0%) | 551 (13.0%) |
Educational Attainment by Field of Study in Santa Fe Springs
Business (724 | 24.5%), arts & humanities (338 | 11.4%), social sciences (317 | 10.7%), engineering (250 | 8.5%), and science & technology (226 | 7.6%) are the most common fields of study among 2,955 individuals in Santa Fe Springs who have obtained a bachelor's degree or higher.
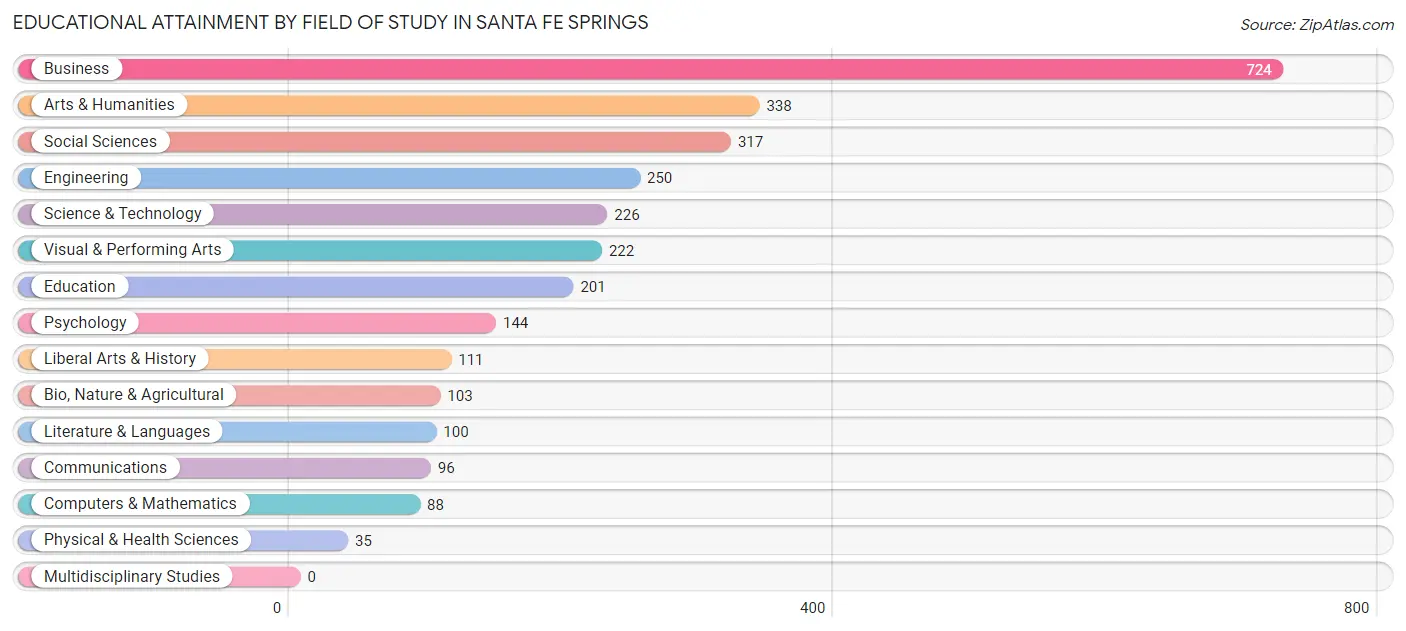
| Field of Study | # Graduates | % Graduates |
| Computers & Mathematics | 88 | 3.0% |
| Bio, Nature & Agricultural | 103 | 3.5% |
| Physical & Health Sciences | 35 | 1.2% |
| Psychology | 144 | 4.9% |
| Social Sciences | 317 | 10.7% |
| Engineering | 250 | 8.5% |
| Multidisciplinary Studies | 0 | 0.0% |
| Science & Technology | 226 | 7.6% |
| Business | 724 | 24.5% |
| Education | 201 | 6.8% |
| Literature & Languages | 100 | 3.4% |
| Liberal Arts & History | 111 | 3.8% |
| Visual & Performing Arts | 222 | 7.5% |
| Communications | 96 | 3.3% |
| Arts & Humanities | 338 | 11.4% |
| Total | 2,955 | 100.0% |
Transportation & Commute in Santa Fe Springs
Vehicle Availability by Sex in Santa Fe Springs
The most prevalent vehicle ownership categories in Santa Fe Springs are males with 2 vehicles (1,591, accounting for 36.2%) and females with 2 vehicles (1,562, making up 40.3%).
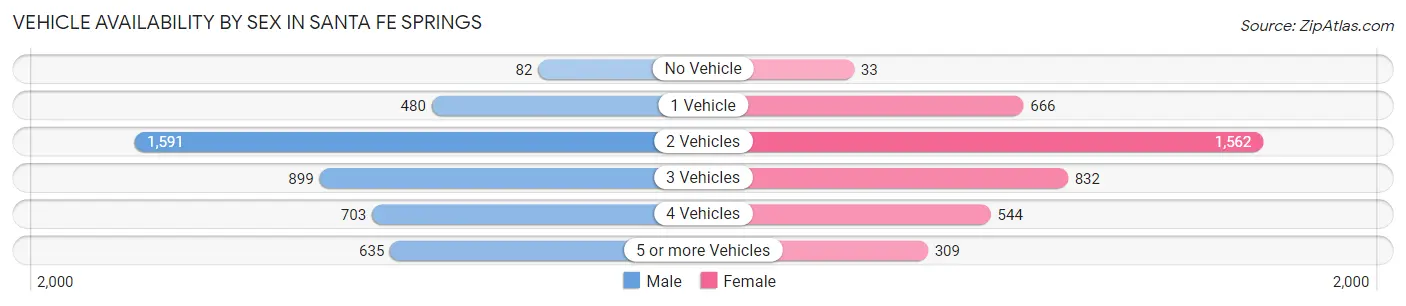
| Vehicles Available | Male | Female |
| No Vehicle | 82 (1.9%) | 33 (0.8%) |
| 1 Vehicle | 480 (10.9%) | 666 (16.9%) |
| 2 Vehicles | 1,591 (36.2%) | 1,562 (39.6%) |
| 3 Vehicles | 899 (20.5%) | 832 (21.1%) |
| 4 Vehicles | 703 (16.0%) | 544 (13.8%) |
| 5 or more Vehicles | 635 (14.5%) | 309 (7.8%) |
| Total | 4,390 (100.0%) | 3,946 (100.0%) |
Commute Time in Santa Fe Springs
The most frequently occuring commute durations in Santa Fe Springs are 30 to 34 minutes (1,438 commuters, 19.6%), 20 to 24 minutes (1,041 commuters, 14.2%), and 15 to 19 minutes (808 commuters, 11.0%).
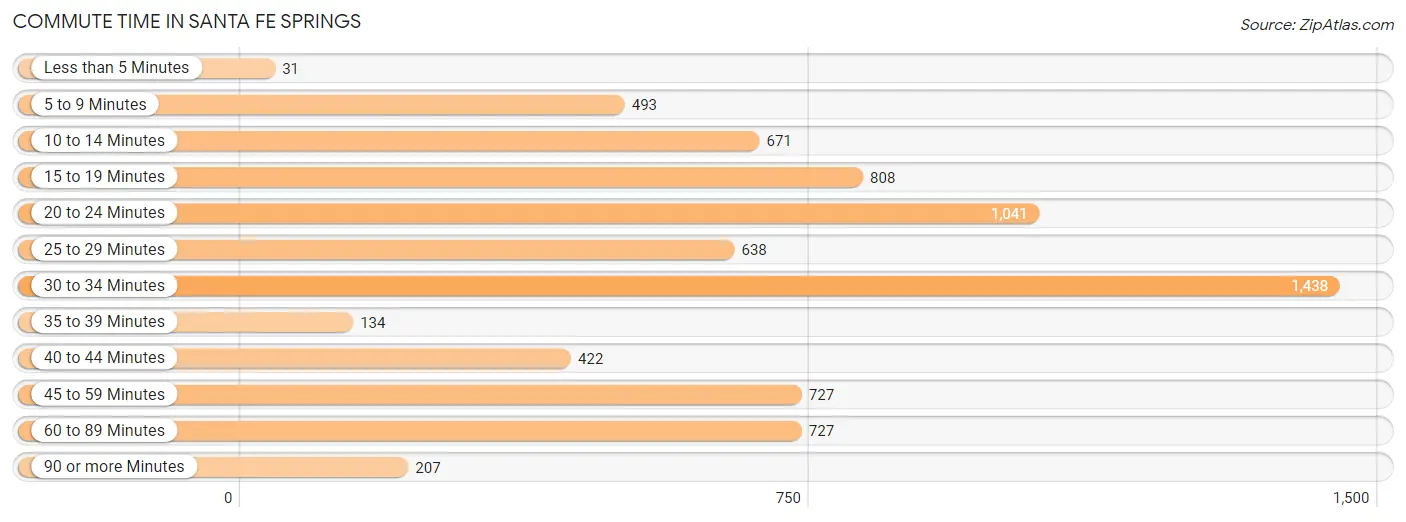
| Commute Time | # Commuters | % Commuters |
| Less than 5 Minutes | 31 | 0.4% |
| 5 to 9 Minutes | 493 | 6.7% |
| 10 to 14 Minutes | 671 | 9.1% |
| 15 to 19 Minutes | 808 | 11.0% |
| 20 to 24 Minutes | 1,041 | 14.2% |
| 25 to 29 Minutes | 638 | 8.7% |
| 30 to 34 Minutes | 1,438 | 19.6% |
| 35 to 39 Minutes | 134 | 1.8% |
| 40 to 44 Minutes | 422 | 5.8% |
| 45 to 59 Minutes | 727 | 9.9% |
| 60 to 89 Minutes | 727 | 9.9% |
| 90 or more Minutes | 207 | 2.8% |
Commute Time by Sex in Santa Fe Springs
The most common commute times in Santa Fe Springs are 30 to 34 minutes (801 commuters, 20.1%) for males and 30 to 34 minutes (637 commuters, 19.0%) for females.
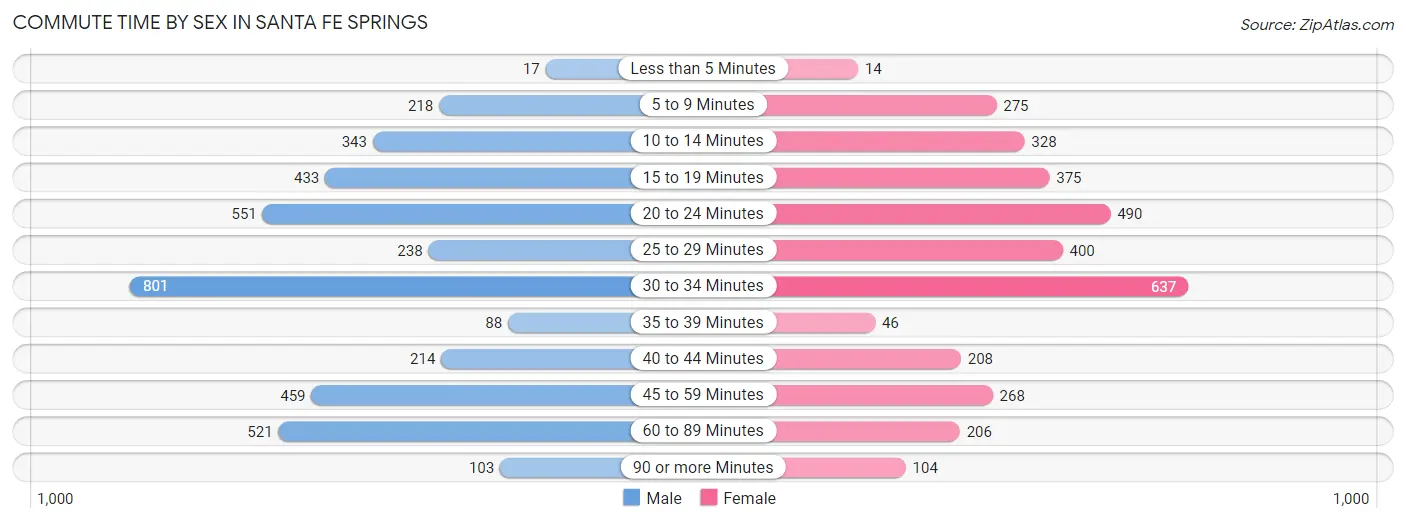
| Commute Time | Male | Female |
| Less than 5 Minutes | 17 (0.4%) | 14 (0.4%) |
| 5 to 9 Minutes | 218 (5.5%) | 275 (8.2%) |
| 10 to 14 Minutes | 343 (8.6%) | 328 (9.8%) |
| 15 to 19 Minutes | 433 (10.9%) | 375 (11.2%) |
| 20 to 24 Minutes | 551 (13.8%) | 490 (14.6%) |
| 25 to 29 Minutes | 238 (6.0%) | 400 (11.9%) |
| 30 to 34 Minutes | 801 (20.1%) | 637 (19.0%) |
| 35 to 39 Minutes | 88 (2.2%) | 46 (1.4%) |
| 40 to 44 Minutes | 214 (5.4%) | 208 (6.2%) |
| 45 to 59 Minutes | 459 (11.5%) | 268 (8.0%) |
| 60 to 89 Minutes | 521 (13.1%) | 206 (6.1%) |
| 90 or more Minutes | 103 (2.6%) | 104 (3.1%) |
Time of Departure to Work by Sex in Santa Fe Springs
The most frequent times of departure to work in Santa Fe Springs are 7:00 AM to 7:29 AM (681, 17.1%) for males and 8:00 AM to 8:29 AM (577, 17.2%) for females.
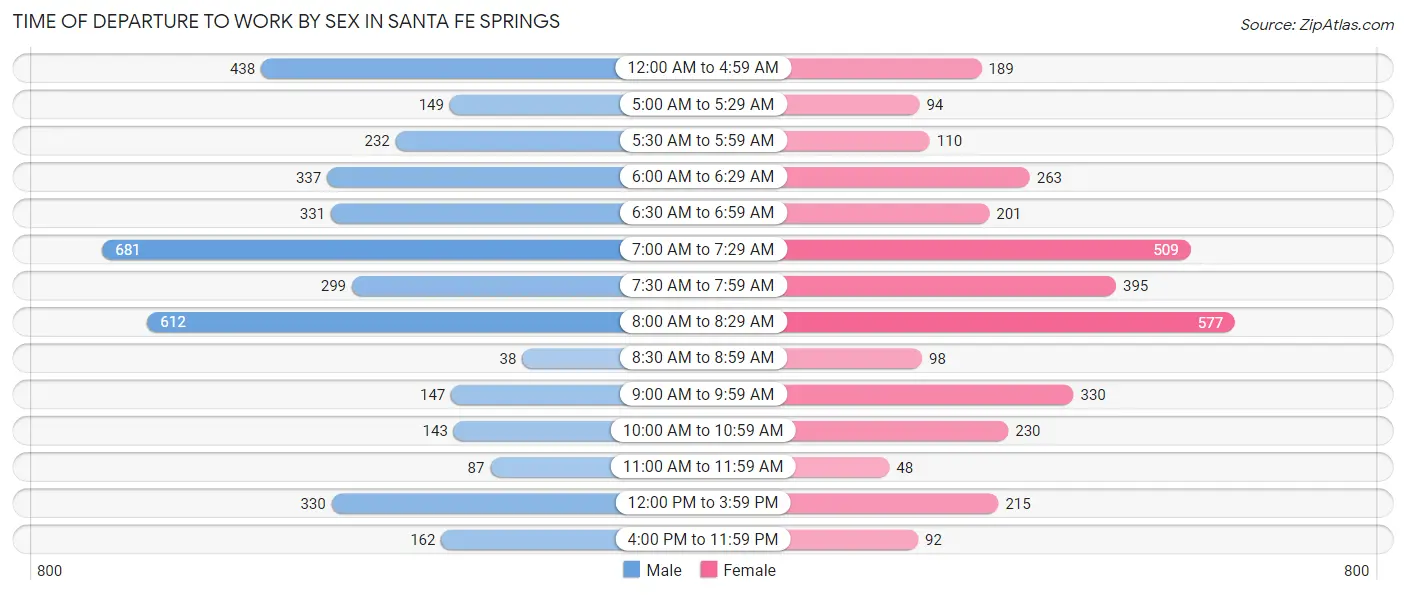
| Time of Departure | Male | Female |
| 12:00 AM to 4:59 AM | 438 (11.0%) | 189 (5.6%) |
| 5:00 AM to 5:29 AM | 149 (3.7%) | 94 (2.8%) |
| 5:30 AM to 5:59 AM | 232 (5.8%) | 110 (3.3%) |
| 6:00 AM to 6:29 AM | 337 (8.5%) | 263 (7.9%) |
| 6:30 AM to 6:59 AM | 331 (8.3%) | 201 (6.0%) |
| 7:00 AM to 7:29 AM | 681 (17.1%) | 509 (15.2%) |
| 7:30 AM to 7:59 AM | 299 (7.5%) | 395 (11.8%) |
| 8:00 AM to 8:29 AM | 612 (15.3%) | 577 (17.2%) |
| 8:30 AM to 8:59 AM | 38 (0.9%) | 98 (2.9%) |
| 9:00 AM to 9:59 AM | 147 (3.7%) | 330 (9.9%) |
| 10:00 AM to 10:59 AM | 143 (3.6%) | 230 (6.9%) |
| 11:00 AM to 11:59 AM | 87 (2.2%) | 48 (1.4%) |
| 12:00 PM to 3:59 PM | 330 (8.3%) | 215 (6.4%) |
| 4:00 PM to 11:59 PM | 162 (4.1%) | 92 (2.8%) |
| Total | 3,986 (100.0%) | 3,351 (100.0%) |
Housing Occupancy in Santa Fe Springs
Occupancy by Ownership in Santa Fe Springs
Of the total 5,700 dwellings in Santa Fe Springs, owner-occupied units account for 3,555 (62.4%), while renter-occupied units make up 2,145 (37.6%).
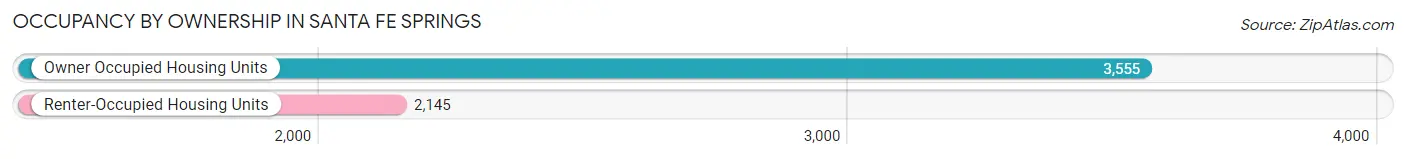
| Occupancy | # Housing Units | % Housing Units |
| Owner Occupied Housing Units | 3,555 | 62.4% |
| Renter-Occupied Housing Units | 2,145 | 37.6% |
| Total Occupied Housing Units | 5,700 | 100.0% |
Occupancy by Household Size in Santa Fe Springs
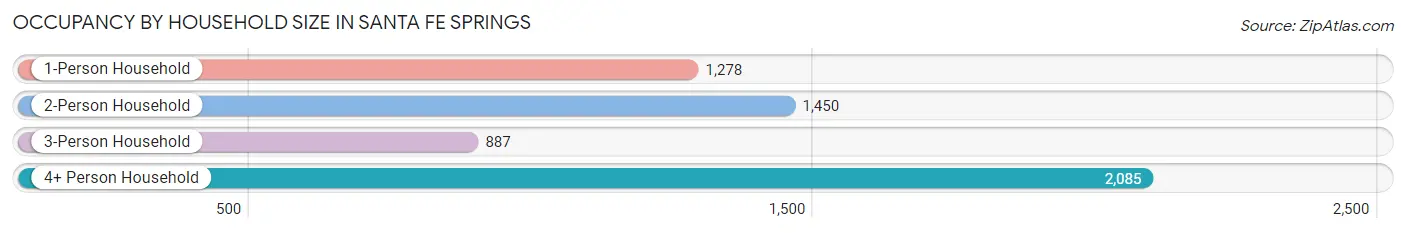
| Household Size | # Housing Units | % Housing Units |
| 1-Person Household | 1,278 | 22.4% |
| 2-Person Household | 1,450 | 25.4% |
| 3-Person Household | 887 | 15.6% |
| 4+ Person Household | 2,085 | 36.6% |
| Total Housing Units | 5,700 | 100.0% |
Occupancy by Ownership by Household Size in Santa Fe Springs
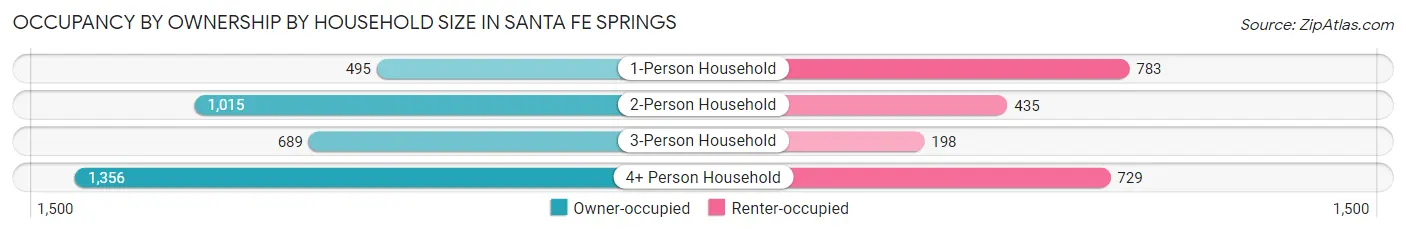
| Household Size | Owner-occupied | Renter-occupied |
| 1-Person Household | 495 (38.7%) | 783 (61.3%) |
| 2-Person Household | 1,015 (70.0%) | 435 (30.0%) |
| 3-Person Household | 689 (77.7%) | 198 (22.3%) |
| 4+ Person Household | 1,356 (65.0%) | 729 (35.0%) |
| Total Housing Units | 3,555 (62.4%) | 2,145 (37.6%) |
Occupancy by Educational Attainment in Santa Fe Springs
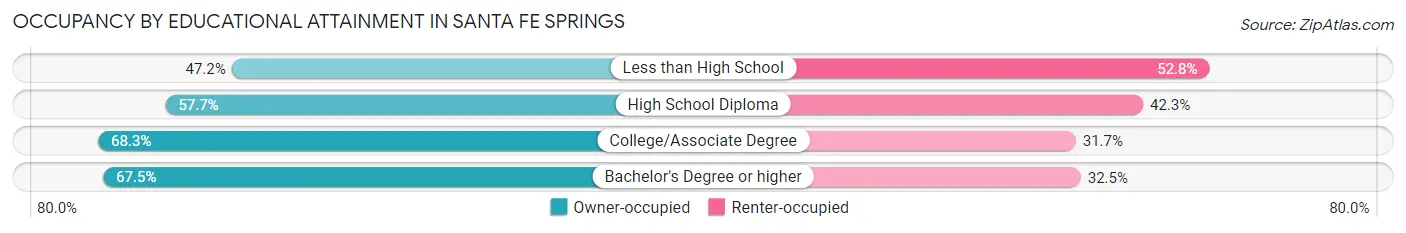
| Household Size | Owner-occupied | Renter-occupied |
| Less than High School | 409 (47.2%) | 458 (52.8%) |
| High School Diploma | 790 (57.7%) | 580 (42.3%) |
| College/Associate Degree | 1,453 (68.3%) | 673 (31.7%) |
| Bachelor's Degree or higher | 903 (67.5%) | 434 (32.5%) |
Occupancy by Age of Householder in Santa Fe Springs
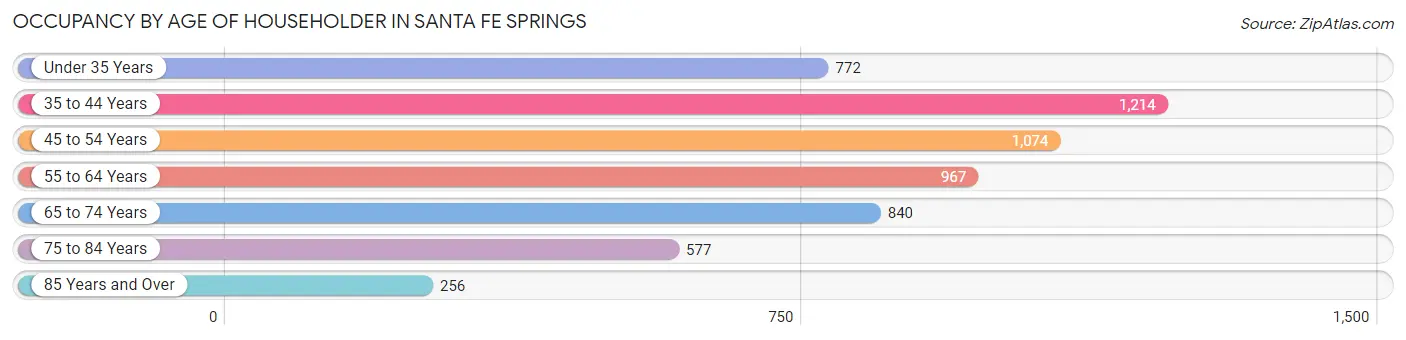
| Age Bracket | # Households | % Households |
| Under 35 Years | 772 | 13.5% |
| 35 to 44 Years | 1,214 | 21.3% |
| 45 to 54 Years | 1,074 | 18.8% |
| 55 to 64 Years | 967 | 17.0% |
| 65 to 74 Years | 840 | 14.7% |
| 75 to 84 Years | 577 | 10.1% |
| 85 Years and Over | 256 | 4.5% |
| Total | 5,700 | 100.0% |
Housing Finances in Santa Fe Springs
Median Income by Occupancy in Santa Fe Springs
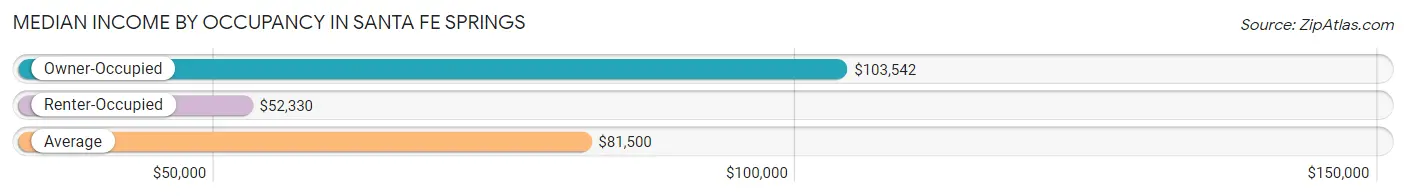
| Occupancy Type | # Households | Median Income |
| Owner-Occupied | 3,555 (62.4%) | $103,542 |
| Renter-Occupied | 2,145 (37.6%) | $52,330 |
| Average | 5,700 (100.0%) | $81,500 |
Occupancy by Householder Income Bracket in Santa Fe Springs
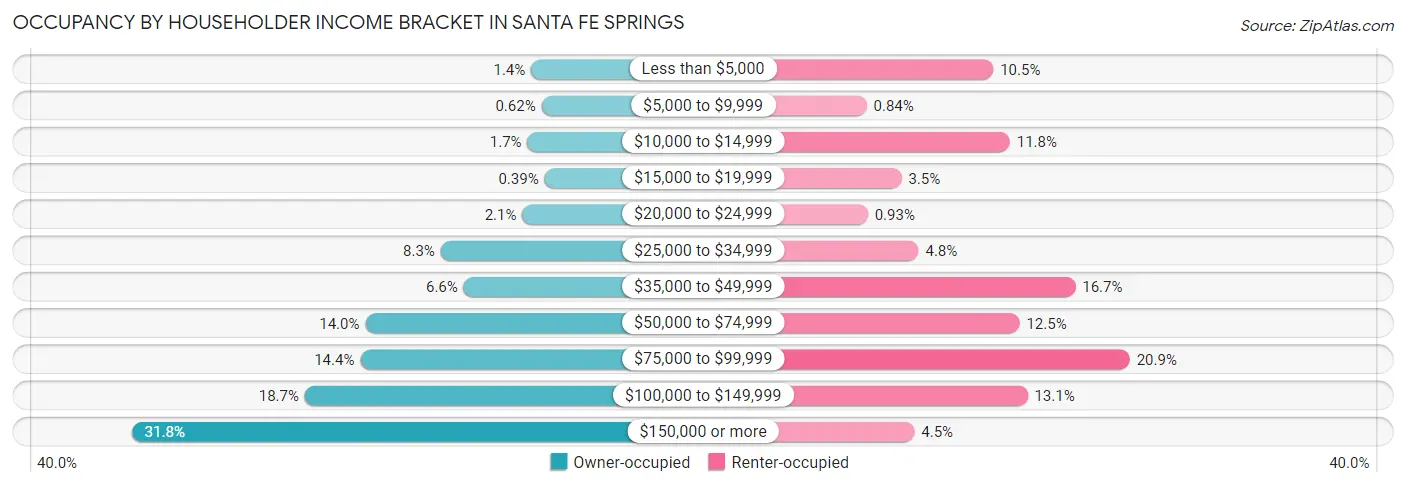
| Income Bracket | Owner-occupied | Renter-occupied |
| Less than $5,000 | 50 (1.4%) | 225 (10.5%) |
| $5,000 to $9,999 | 22 (0.6%) | 18 (0.8%) |
| $10,000 to $14,999 | 60 (1.7%) | 252 (11.7%) |
| $15,000 to $19,999 | 14 (0.4%) | 75 (3.5%) |
| $20,000 to $24,999 | 74 (2.1%) | 20 (0.9%) |
| $25,000 to $34,999 | 295 (8.3%) | 103 (4.8%) |
| $35,000 to $49,999 | 233 (6.6%) | 359 (16.7%) |
| $50,000 to $74,999 | 499 (14.0%) | 268 (12.5%) |
| $75,000 to $99,999 | 513 (14.4%) | 448 (20.9%) |
| $100,000 to $149,999 | 663 (18.6%) | 281 (13.1%) |
| $150,000 or more | 1,132 (31.8%) | 96 (4.5%) |
| Total | 3,555 (100.0%) | 2,145 (100.0%) |
Monthly Housing Cost Tiers in Santa Fe Springs
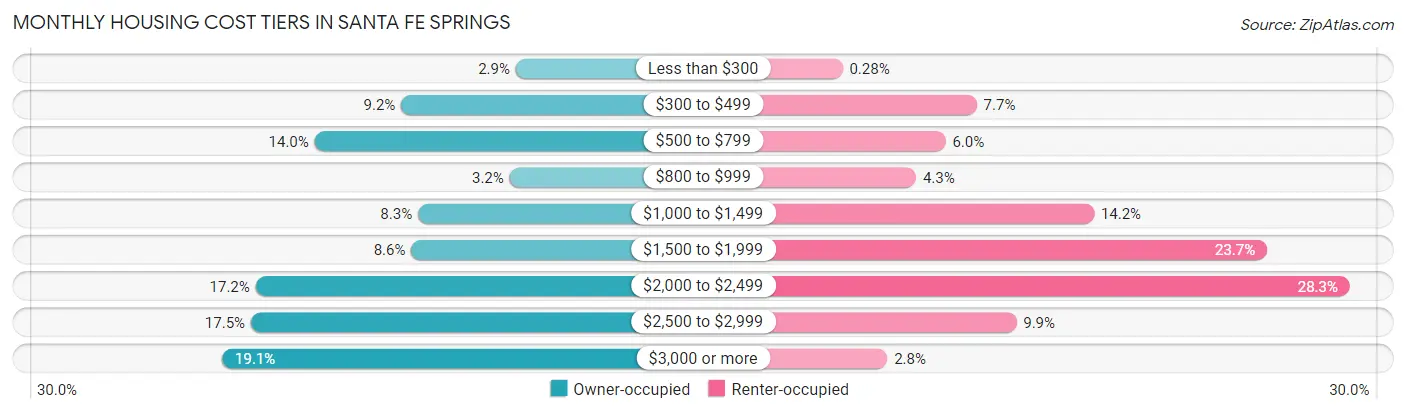
| Monthly Cost | Owner-occupied | Renter-occupied |
| Less than $300 | 102 (2.9%) | 6 (0.3%) |
| $300 to $499 | 327 (9.2%) | 165 (7.7%) |
| $500 to $799 | 497 (14.0%) | 128 (6.0%) |
| $800 to $999 | 114 (3.2%) | 93 (4.3%) |
| $1,000 to $1,499 | 294 (8.3%) | 304 (14.2%) |
| $1,500 to $1,999 | 307 (8.6%) | 509 (23.7%) |
| $2,000 to $2,499 | 613 (17.2%) | 607 (28.3%) |
| $2,500 to $2,999 | 622 (17.5%) | 212 (9.9%) |
| $3,000 or more | 679 (19.1%) | 59 (2.8%) |
| Total | 3,555 (100.0%) | 2,145 (100.0%) |
Physical Housing Characteristics in Santa Fe Springs
Housing Structures in Santa Fe Springs
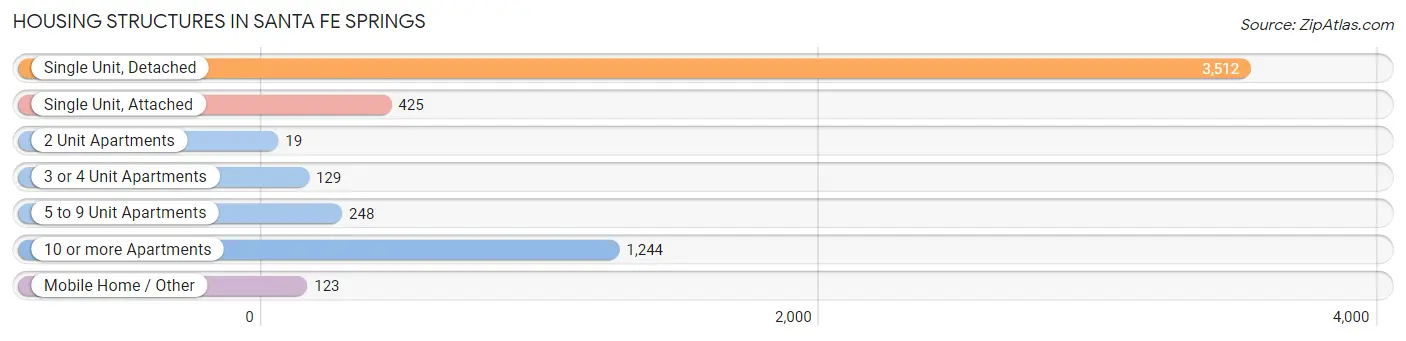
| Structure Type | # Housing Units | % Housing Units |
| Single Unit, Detached | 3,512 | 61.6% |
| Single Unit, Attached | 425 | 7.5% |
| 2 Unit Apartments | 19 | 0.3% |
| 3 or 4 Unit Apartments | 129 | 2.3% |
| 5 to 9 Unit Apartments | 248 | 4.3% |
| 10 or more Apartments | 1,244 | 21.8% |
| Mobile Home / Other | 123 | 2.2% |
| Total | 5,700 | 100.0% |
Housing Structures by Occupancy in Santa Fe Springs
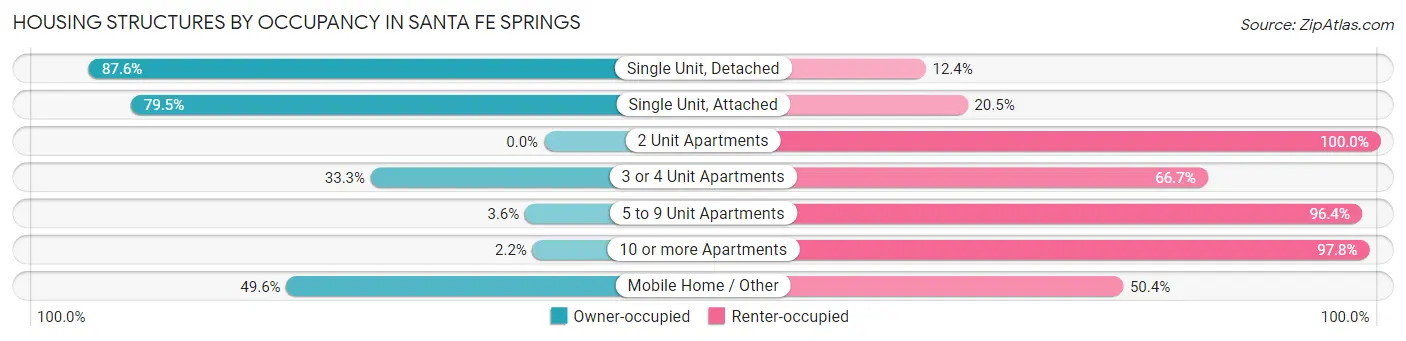
| Structure Type | Owner-occupied | Renter-occupied |
| Single Unit, Detached | 3,077 (87.6%) | 435 (12.4%) |
| Single Unit, Attached | 338 (79.5%) | 87 (20.5%) |
| 2 Unit Apartments | 0 (0.0%) | 19 (100.0%) |
| 3 or 4 Unit Apartments | 43 (33.3%) | 86 (66.7%) |
| 5 to 9 Unit Apartments | 9 (3.6%) | 239 (96.4%) |
| 10 or more Apartments | 27 (2.2%) | 1,217 (97.8%) |
| Mobile Home / Other | 61 (49.6%) | 62 (50.4%) |
| Total | 3,555 (62.4%) | 2,145 (37.6%) |
Housing Structures by Number of Rooms in Santa Fe Springs
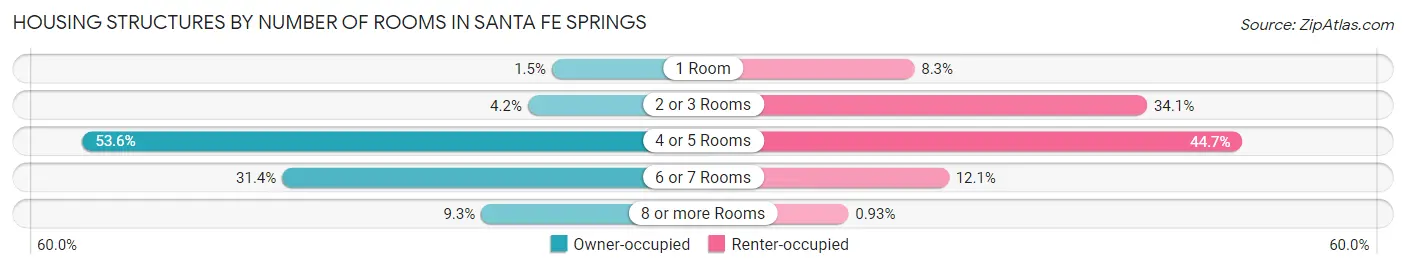
| Number of Rooms | Owner-occupied | Renter-occupied |
| 1 Room | 53 (1.5%) | 177 (8.3%) |
| 2 or 3 Rooms | 148 (4.2%) | 731 (34.1%) |
| 4 or 5 Rooms | 1,905 (53.6%) | 958 (44.7%) |
| 6 or 7 Rooms | 1,117 (31.4%) | 259 (12.1%) |
| 8 or more Rooms | 332 (9.3%) | 20 (0.9%) |
| Total | 3,555 (100.0%) | 2,145 (100.0%) |
Housing Structure by Heating Type in Santa Fe Springs
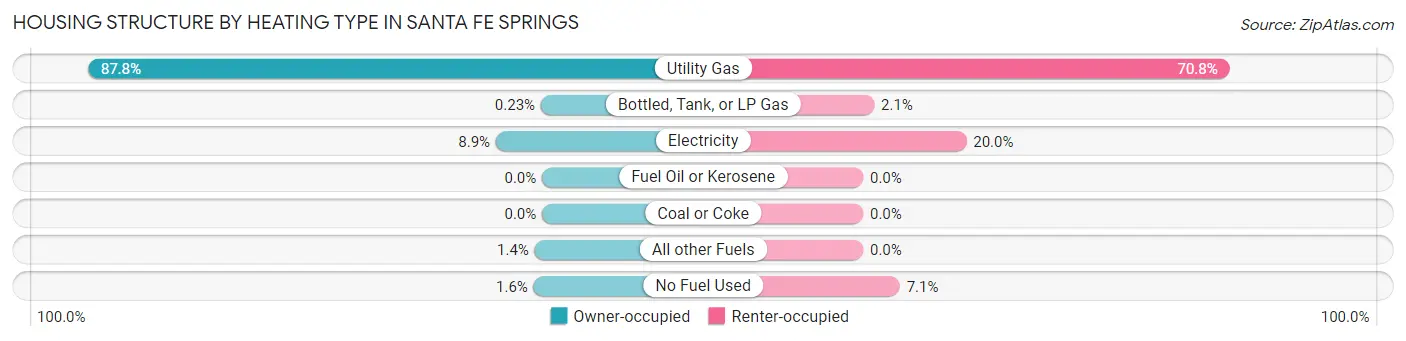
| Heating Type | Owner-occupied | Renter-occupied |
| Utility Gas | 3,121 (87.8%) | 1,519 (70.8%) |
| Bottled, Tank, or LP Gas | 8 (0.2%) | 46 (2.1%) |
| Electricity | 317 (8.9%) | 428 (20.0%) |
| Fuel Oil or Kerosene | 0 (0.0%) | 0 (0.0%) |
| Coal or Coke | 0 (0.0%) | 0 (0.0%) |
| All other Fuels | 51 (1.4%) | 0 (0.0%) |
| No Fuel Used | 58 (1.6%) | 152 (7.1%) |
| Total | 3,555 (100.0%) | 2,145 (100.0%) |
Household Vehicle Usage in Santa Fe Springs
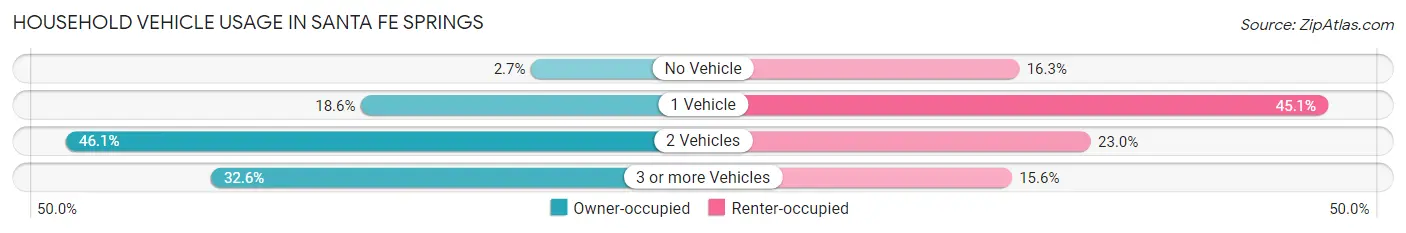
| Vehicles per Household | Owner-occupied | Renter-occupied |
| No Vehicle | 96 (2.7%) | 350 (16.3%) |
| 1 Vehicle | 660 (18.6%) | 967 (45.1%) |
| 2 Vehicles | 1,640 (46.1%) | 493 (23.0%) |
| 3 or more Vehicles | 1,159 (32.6%) | 335 (15.6%) |
| Total | 3,555 (100.0%) | 2,145 (100.0%) |
Real Estate & Mortgages in Santa Fe Springs
Real Estate and Mortgage Overview in Santa Fe Springs
| Characteristic | Without Mortgage | With Mortgage |
| Housing Units | 1,094 | 2,461 |
| Median Property Value | $550,600 | $597,100 |
| Median Household Income | $70,962 | $838 |
| Monthly Housing Costs | $614 | $679 |
| Real Estate Taxes | $2,791 | $70 |
Property Value by Mortgage Status in Santa Fe Springs
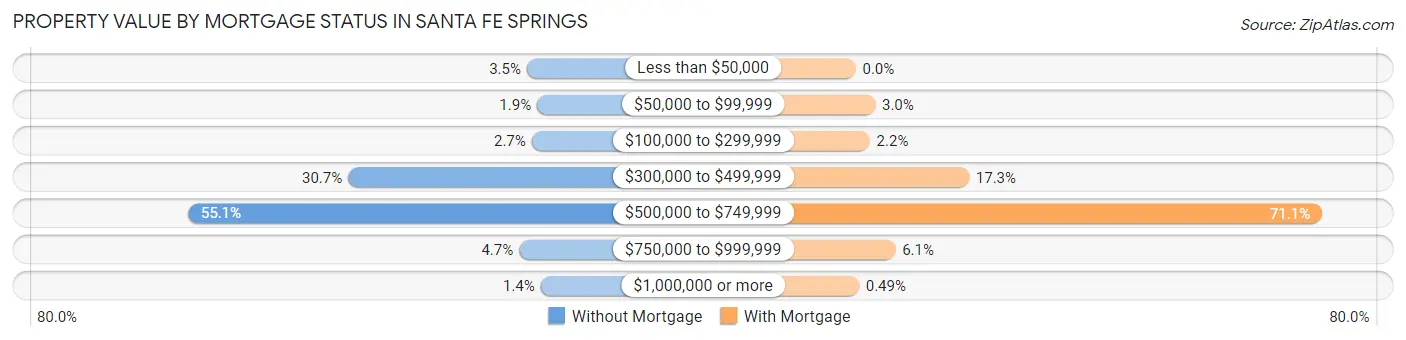
| Property Value | Without Mortgage | With Mortgage |
| Less than $50,000 | 38 (3.5%) | 0 (0.0%) |
| $50,000 to $99,999 | 21 (1.9%) | 73 (3.0%) |
| $100,000 to $299,999 | 30 (2.7%) | 53 (2.1%) |
| $300,000 to $499,999 | 336 (30.7%) | 425 (17.3%) |
| $500,000 to $749,999 | 603 (55.1%) | 1,749 (71.1%) |
| $750,000 to $999,999 | 51 (4.7%) | 149 (6.0%) |
| $1,000,000 or more | 15 (1.4%) | 12 (0.5%) |
| Total | 1,094 (100.0%) | 2,461 (100.0%) |
Household Income by Mortgage Status in Santa Fe Springs
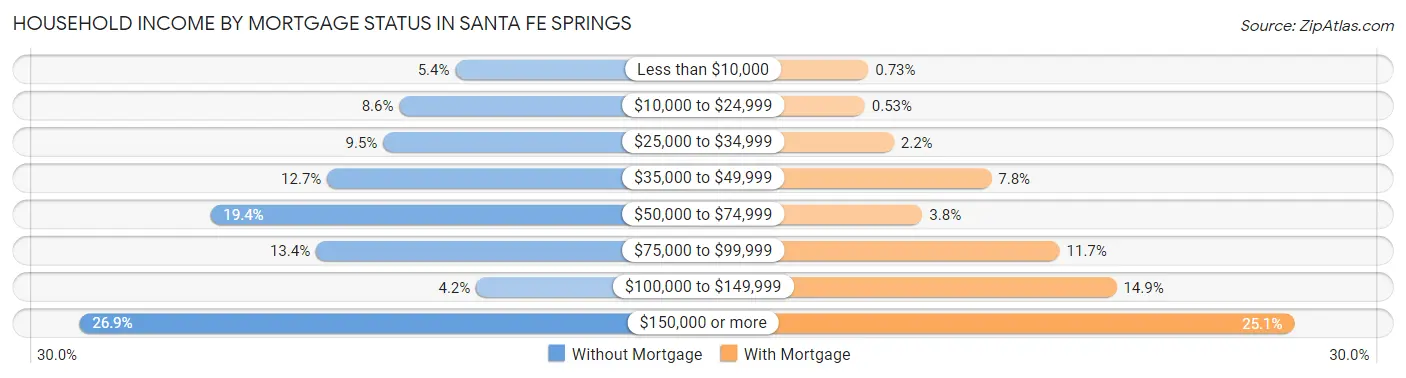
| Household Income | Without Mortgage | With Mortgage |
| Less than $10,000 | 59 (5.4%) | 18 (0.7%) |
| $10,000 to $24,999 | 94 (8.6%) | 13 (0.5%) |
| $25,000 to $34,999 | 104 (9.5%) | 54 (2.2%) |
| $35,000 to $49,999 | 139 (12.7%) | 191 (7.8%) |
| $50,000 to $74,999 | 212 (19.4%) | 94 (3.8%) |
| $75,000 to $99,999 | 146 (13.4%) | 287 (11.7%) |
| $100,000 to $149,999 | 46 (4.2%) | 367 (14.9%) |
| $150,000 or more | 294 (26.9%) | 617 (25.1%) |
| Total | 1,094 (100.0%) | 2,461 (100.0%) |
Property Value to Household Income Ratio in Santa Fe Springs
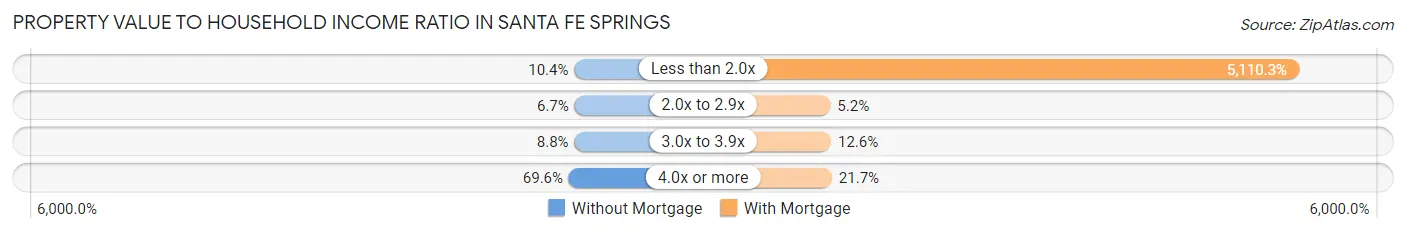
| Value-to-Income Ratio | Without Mortgage | With Mortgage |
| Less than 2.0x | 114 (10.4%) | 125,765 (5,110.3%) |
| 2.0x to 2.9x | 73 (6.7%) | 127 (5.2%) |
| 3.0x to 3.9x | 96 (8.8%) | 311 (12.6%) |
| 4.0x or more | 761 (69.6%) | 533 (21.7%) |
| Total | 1,094 (100.0%) | 2,461 (100.0%) |
Real Estate Taxes by Mortgage Status in Santa Fe Springs
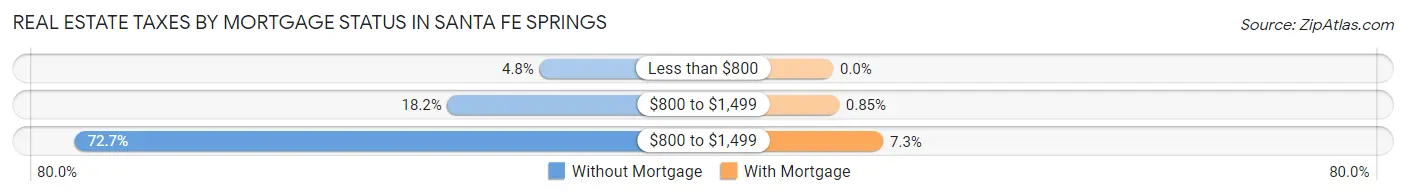
| Property Taxes | Without Mortgage | With Mortgage |
| Less than $800 | 52 (4.8%) | 0 (0.0%) |
| $800 to $1,499 | 199 (18.2%) | 21 (0.9%) |
| $800 to $1,499 | 795 (72.7%) | 180 (7.3%) |
| Total | 1,094 (100.0%) | 2,461 (100.0%) |
Health & Disability in Santa Fe Springs
Health Insurance Coverage by Age in Santa Fe Springs
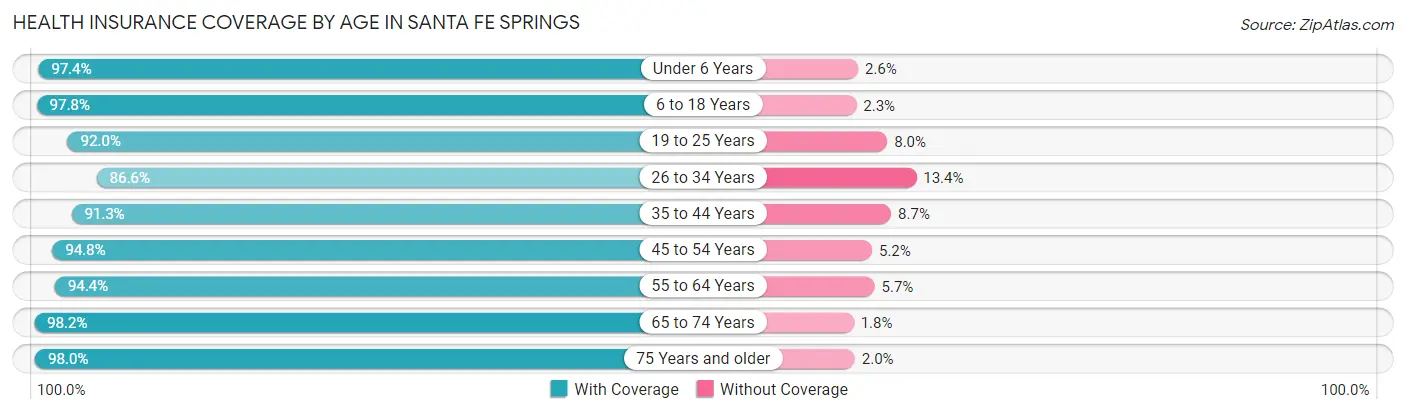
| Age Bracket | With Coverage | Without Coverage |
| Under 6 Years | 1,447 (97.4%) | 38 (2.6%) |
| 6 to 18 Years | 2,915 (97.8%) | 67 (2.2%) |
| 19 to 25 Years | 1,513 (92.0%) | 132 (8.0%) |
| 26 to 34 Years | 2,199 (86.6%) | 341 (13.4%) |
| 35 to 44 Years | 2,392 (91.3%) | 229 (8.7%) |
| 45 to 54 Years | 2,148 (94.8%) | 117 (5.2%) |
| 55 to 64 Years | 2,170 (94.4%) | 130 (5.7%) |
| 65 to 74 Years | 1,509 (98.2%) | 27 (1.8%) |
| 75 Years and older | 1,349 (98.0%) | 27 (2.0%) |
| Total | 17,642 (94.1%) | 1,108 (5.9%) |
Health Insurance Coverage by Citizenship Status in Santa Fe Springs
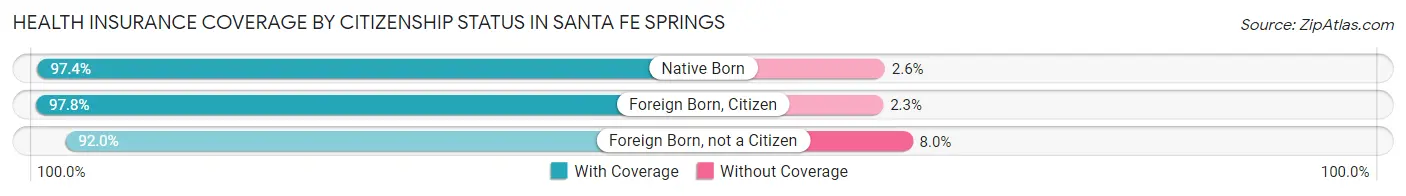
| Citizenship Status | With Coverage | Without Coverage |
| Native Born | 1,447 (97.4%) | 38 (2.6%) |
| Foreign Born, Citizen | 2,915 (97.8%) | 67 (2.2%) |
| Foreign Born, not a Citizen | 1,513 (92.0%) | 132 (8.0%) |
Health Insurance Coverage by Household Income in Santa Fe Springs
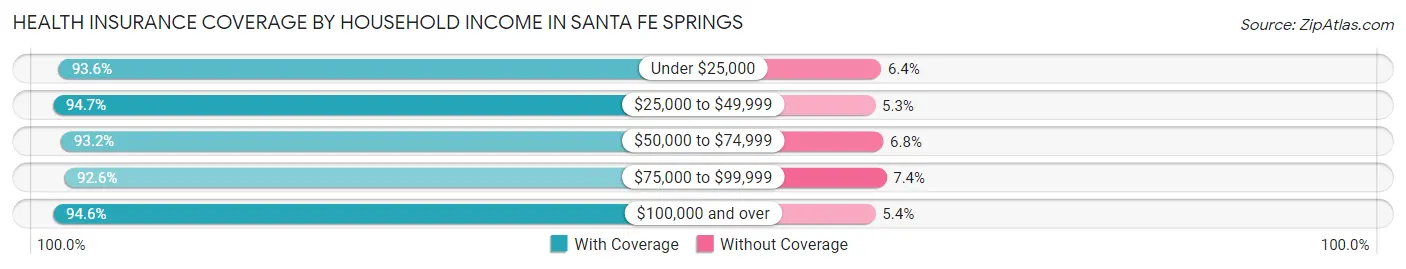
| Household Income | With Coverage | Without Coverage |
| Under $25,000 | 1,258 (93.6%) | 86 (6.4%) |
| $25,000 to $49,999 | 2,465 (94.7%) | 138 (5.3%) |
| $50,000 to $74,999 | 2,341 (93.2%) | 171 (6.8%) |
| $75,000 to $99,999 | 2,879 (92.6%) | 230 (7.4%) |
| $100,000 and over | 8,520 (94.6%) | 483 (5.4%) |
Public vs Private Health Insurance Coverage by Age in Santa Fe Springs
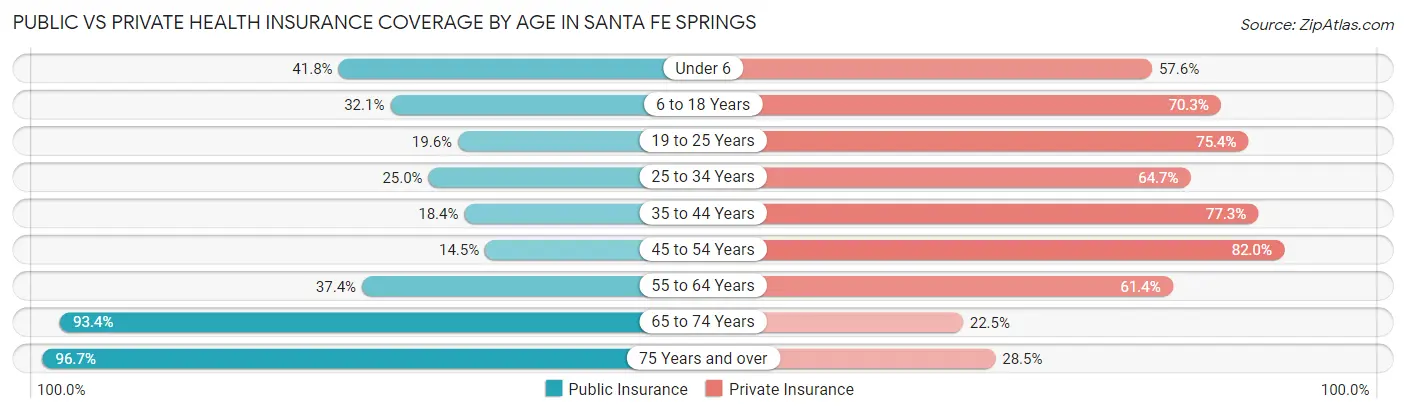
| Age Bracket | Public Insurance | Private Insurance |
| Under 6 | 620 (41.7%) | 855 (57.6%) |
| 6 to 18 Years | 958 (32.1%) | 2,097 (70.3%) |
| 19 to 25 Years | 322 (19.6%) | 1,241 (75.4%) |
| 25 to 34 Years | 636 (25.0%) | 1,643 (64.7%) |
| 35 to 44 Years | 482 (18.4%) | 2,025 (77.3%) |
| 45 to 54 Years | 329 (14.5%) | 1,858 (82.0%) |
| 55 to 64 Years | 860 (37.4%) | 1,412 (61.4%) |
| 65 to 74 Years | 1,435 (93.4%) | 345 (22.5%) |
| 75 Years and over | 1,330 (96.7%) | 392 (28.5%) |
| Total | 6,972 (37.2%) | 11,868 (63.3%) |
Disability Status by Sex by Age in Santa Fe Springs
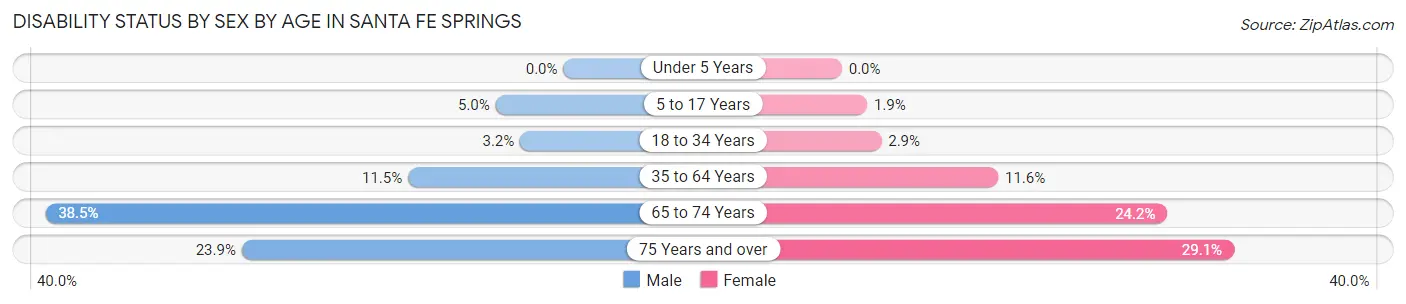
| Age Bracket | Male | Female |
| Under 5 Years | 0 (0.0%) | 0 (0.0%) |
| 5 to 17 Years | 66 (5.0%) | 28 (1.9%) |
| 18 to 34 Years | 71 (3.2%) | 67 (2.9%) |
| 35 to 64 Years | 409 (11.5%) | 422 (11.6%) |
| 65 to 74 Years | 247 (38.5%) | 216 (24.2%) |
| 75 Years and over | 144 (23.9%) | 225 (29.1%) |
Disability Class by Sex by Age in Santa Fe Springs
Disability Class: Hearing Difficulty
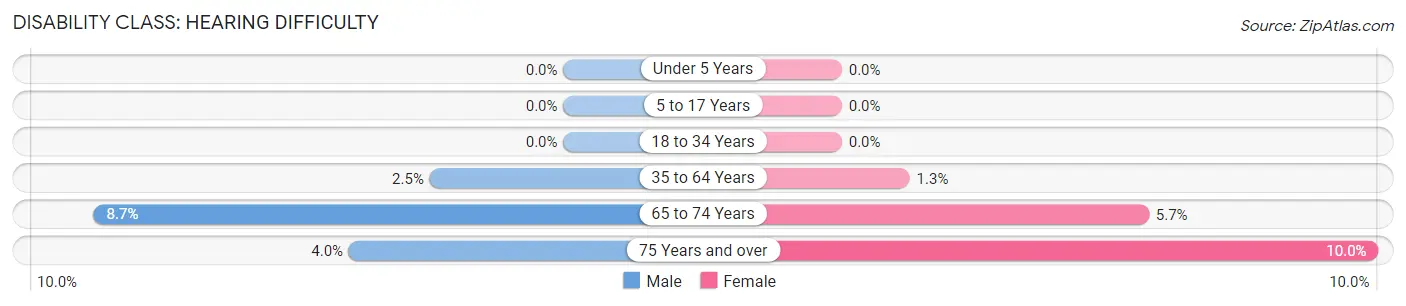
| Age Bracket | Male | Female |
| Under 5 Years | 0 (0.0%) | 0 (0.0%) |
| 5 to 17 Years | 0 (0.0%) | 0 (0.0%) |
| 18 to 34 Years | 0 (0.0%) | 0 (0.0%) |
| 35 to 64 Years | 88 (2.5%) | 46 (1.3%) |
| 65 to 74 Years | 56 (8.7%) | 51 (5.7%) |
| 75 Years and over | 24 (4.0%) | 77 (10.0%) |
Disability Class: Vision Difficulty
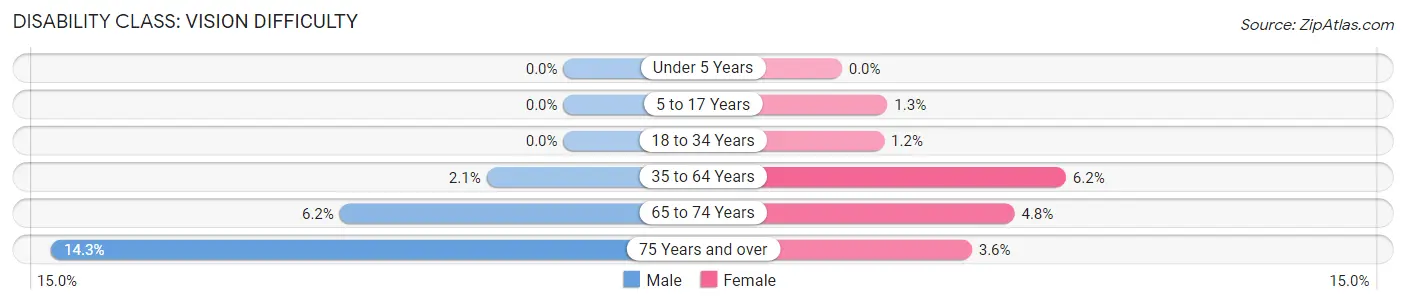
| Age Bracket | Male | Female |
| Under 5 Years | 0 (0.0%) | 0 (0.0%) |
| 5 to 17 Years | 0 (0.0%) | 19 (1.3%) |
| 18 to 34 Years | 0 (0.0%) | 27 (1.2%) |
| 35 to 64 Years | 76 (2.1%) | 227 (6.2%) |
| 65 to 74 Years | 40 (6.2%) | 43 (4.8%) |
| 75 Years and over | 86 (14.3%) | 28 (3.6%) |
Disability Class: Cognitive Difficulty
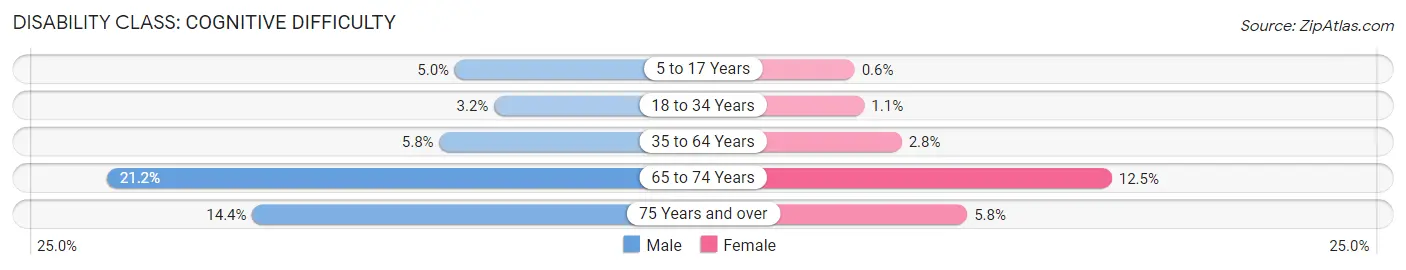
| Age Bracket | Male | Female |
| 5 to 17 Years | 66 (5.0%) | 9 (0.6%) |
| 18 to 34 Years | 71 (3.2%) | 24 (1.1%) |
| 35 to 64 Years | 204 (5.8%) | 101 (2.8%) |
| 65 to 74 Years | 136 (21.2%) | 112 (12.5%) |
| 75 Years and over | 87 (14.4%) | 45 (5.8%) |
Disability Class: Ambulatory Difficulty
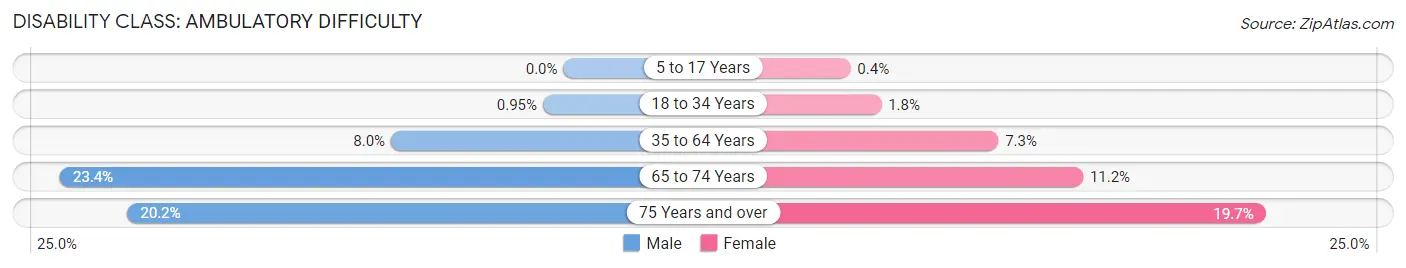
| Age Bracket | Male | Female |
| 5 to 17 Years | 0 (0.0%) | 6 (0.4%) |
| 18 to 34 Years | 21 (0.9%) | 42 (1.8%) |
| 35 to 64 Years | 284 (8.0%) | 264 (7.3%) |
| 65 to 74 Years | 150 (23.4%) | 100 (11.2%) |
| 75 Years and over | 122 (20.2%) | 152 (19.7%) |
Disability Class: Self-Care Difficulty
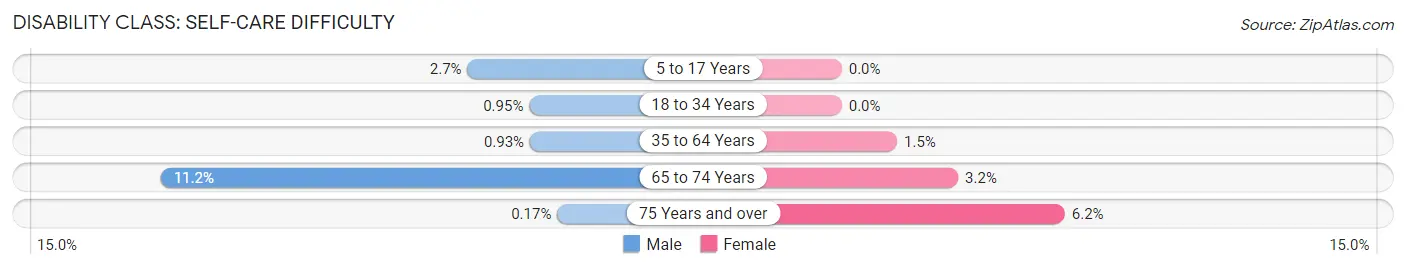
| Age Bracket | Male | Female |
| 5 to 17 Years | 35 (2.7%) | 0 (0.0%) |
| 18 to 34 Years | 21 (0.9%) | 0 (0.0%) |
| 35 to 64 Years | 33 (0.9%) | 56 (1.5%) |
| 65 to 74 Years | 72 (11.2%) | 29 (3.2%) |
| 75 Years and over | 1 (0.2%) | 48 (6.2%) |
Technology Access in Santa Fe Springs
Computing Device Access in Santa Fe Springs
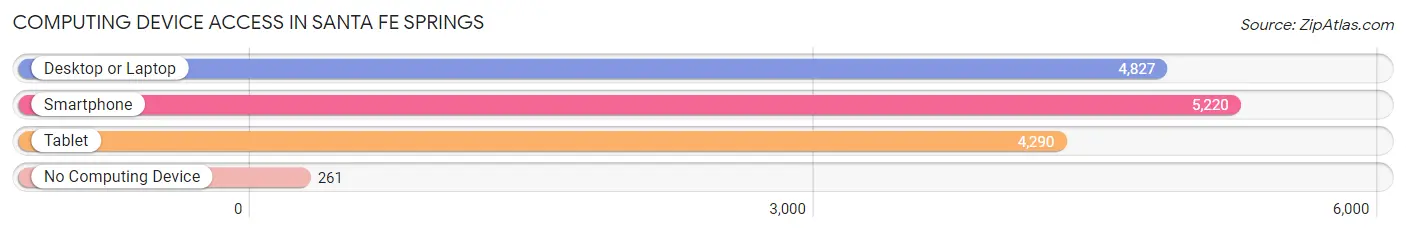
| Device Type | # Households | % Households |
| Desktop or Laptop | 4,827 | 84.7% |
| Smartphone | 5,220 | 91.6% |
| Tablet | 4,290 | 75.3% |
| No Computing Device | 261 | 4.6% |
| Total | 5,700 | 100.0% |
Internet Access in Santa Fe Springs
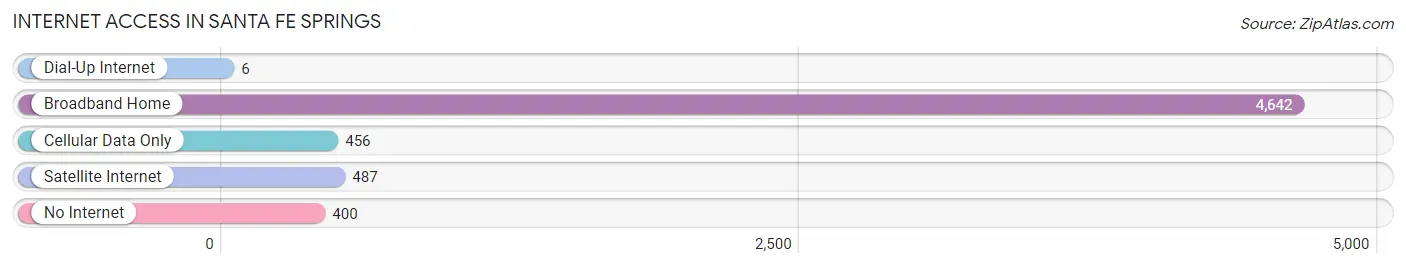
| Internet Type | # Households | % Households |
| Dial-Up Internet | 6 | 0.1% |
| Broadband Home | 4,642 | 81.4% |
| Cellular Data Only | 456 | 8.0% |
| Satellite Internet | 487 | 8.5% |
| No Internet | 400 | 7.0% |
| Total | 5,700 | 100.0% |
Santa Fe Springs Summary
History
The area now known as Santa Fe Springs, California was originally inhabited by the Tongva people, who were the original inhabitants of the Los Angeles Basin. The Tongva people were hunter-gatherers who lived in small villages and subsisted off of the land. The area was first explored by Spanish settlers in the late 1700s, and the first Spanish land grant in the area was given to Don Jose Antonio Yorba in 1810. The area was then known as Rancho La Merced, and it was used for cattle grazing and farming.
In the late 1800s, the area was developed by the Santa Fe Railroad, which built a rail line through the area. The railroad named the area Santa Fe Springs, and it became a popular stop for travelers. The area was incorporated as a city in 1957, and it has since grown to become a major industrial center in the Los Angeles area.
Geography
Santa Fe Springs is located in southeastern Los Angeles County, California. It is bordered by the cities of Norwalk to the north, Downey to the east, Whittier to the south, and Pico Rivera to the west. The city covers an area of 5.3 square miles, and it has a population of around 16,000 people.
The city is located in the San Gabriel Valley, and it is situated at the base of the Puente Hills. The city is mostly flat, with some rolling hills in the northern part of the city. The city is home to several parks, including Heritage Park, which is a popular spot for picnics and outdoor activities.
Economy
Santa Fe Springs is a major industrial center in the Los Angeles area. The city is home to several large companies, including the headquarters of the oil company Chevron, the aerospace company Northrop Grumman, and the automotive parts manufacturer TRW. The city is also home to several smaller businesses, including manufacturing, warehousing, and distribution companies.
The city is served by several major highways, including Interstate 5, Interstate 605, and State Route 91. The city is also served by the Santa Fe Springs/Norwalk Metrolink station, which provides rail service to downtown Los Angeles.
Demographics
As of the 2010 census, the population of Santa Fe Springs was 16,223. The racial makeup of the city was 57.3% White, 1.3% African American, 0.7% Native American, 11.2% Asian, 0.2% Pacific Islander, and 28.3% from other races. Hispanic or Latino of any race were 63.2% of the population.
The median household income in Santa Fe Springs was $50,945, and the median family income was $54,945. The per capita income was $20,945. About 16.3% of the population was below the poverty line.
Common Questions
What is Per Capita Income in Santa Fe Springs?
Per Capita income in Santa Fe Springs is $30,849.
What is the Median Family Income in Santa Fe Springs?
Median Family Income in Santa Fe Springs is $93,462.
What is the Median Household income in Santa Fe Springs?
Median Household Income in Santa Fe Springs is $81,500.
What is Income or Wage Gap in Santa Fe Springs?
Income or Wage Gap in Santa Fe Springs is 13.6%.
Women in Santa Fe Springs earn 86.4 cents for every dollar earned by a man.
What is Family Income Deficit in Santa Fe Springs?
Family Income Deficit in Santa Fe Springs is $15,706.
Families that are below poverty line in Santa Fe Springs earn $15,706 less on average than the poverty threshold level.
What is Inequality or Gini Index in Santa Fe Springs?
Inequality or Gini Index in Santa Fe Springs is 0.42.
What is the Total Population of Santa Fe Springs?
Total Population of Santa Fe Springs is 18,840.
What is the Total Male Population of Santa Fe Springs?
Total Male Population of Santa Fe Springs is 8,993.
What is the Total Female Population of Santa Fe Springs?
Total Female Population of Santa Fe Springs is 9,847.
What is the Ratio of Males per 100 Females in Santa Fe Springs?
There are 91.33 Males per 100 Females in Santa Fe Springs.
What is the Ratio of Females per 100 Males in Santa Fe Springs?
There are 109.50 Females per 100 Males in Santa Fe Springs.
What is the Median Population Age in Santa Fe Springs?
Median Population Age in Santa Fe Springs is 38.0 Years.
What is the Average Family Size in Santa Fe Springs
Average Family Size in Santa Fe Springs is 3.8 People.
What is the Average Household Size in Santa Fe Springs
Average Household Size in Santa Fe Springs is 3.3 People.
How Large is the Labor Force in Santa Fe Springs?
There are 9,091 People in the Labor Forcein in Santa Fe Springs.
What is the Percentage of People in the Labor Force in Santa Fe Springs?
60.0% of People are in the Labor Force in Santa Fe Springs.
What is the Unemployment Rate in Santa Fe Springs?
Unemployment Rate in Santa Fe Springs is 4.2%.