Zip Codes with the Highest Percentage of Households Heated by Bottled Gas / Liquid Propane in Santa Barbara, CA
RELATED REPORTS & OPTIONS
Bottled Gas / LP Heating
Santa Barbara
Compare Zip Codes
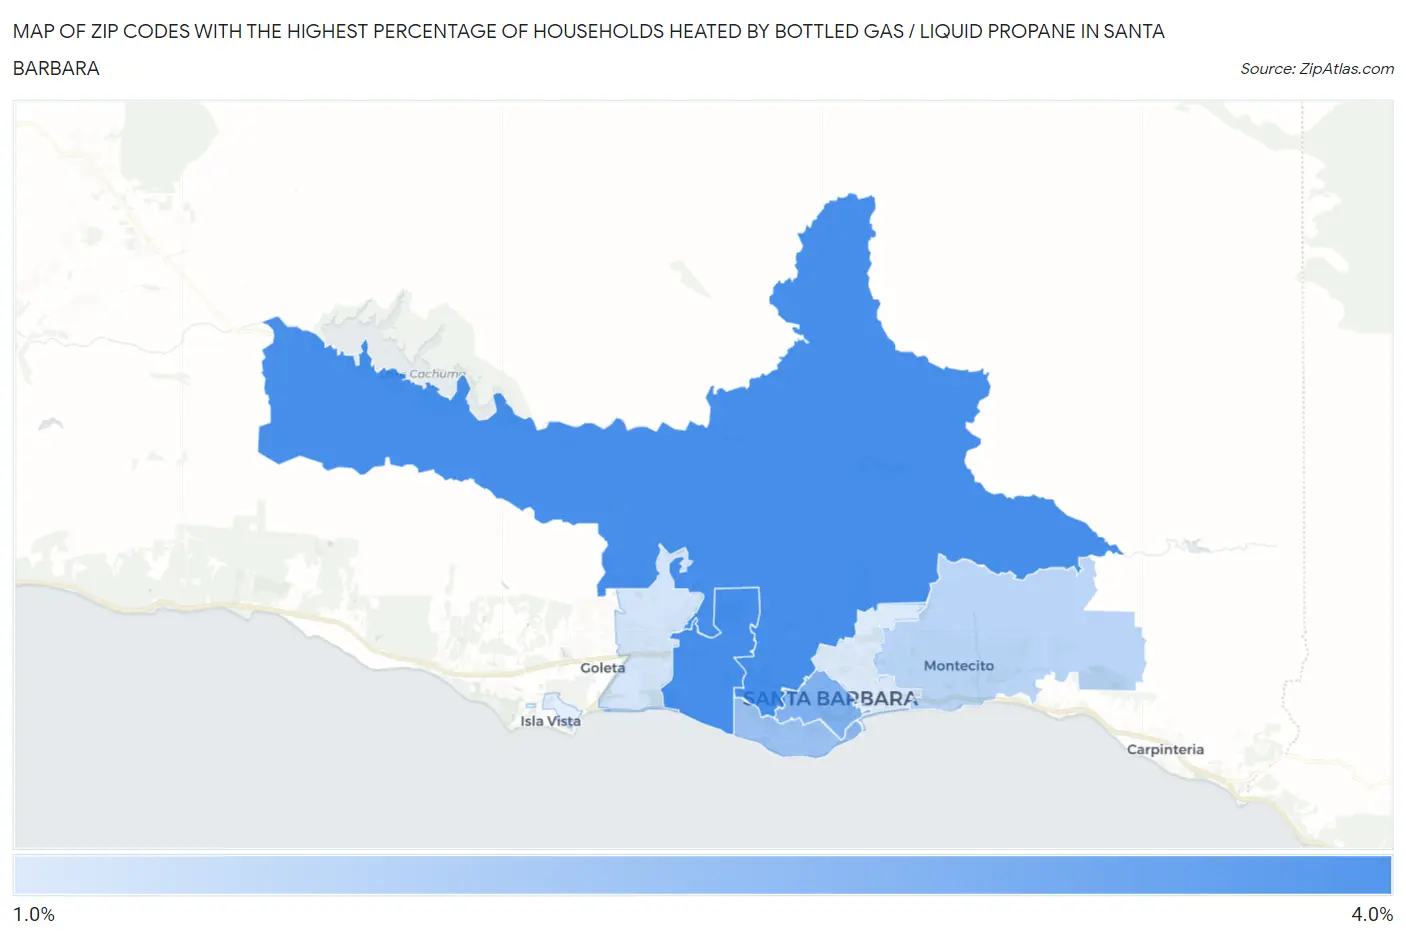
Map of Zip Codes with the Highest Percentage of Households Heated by Bottled Gas / Liquid Propane in Santa Barbara
0.0%
4.0%
Zip Codes with the Highest Percentage of Households Heated by Bottled Gas / Liquid Propane in Santa Barbara, CA
| Zip Code | Bottled Gas / LP Heating | vs State | vs National | |
| 1. | 93105 | 3.1% | 3.5%(-0.400)#718 | 4.9%(-1.80)#20,863 |
| 2. | 93110 | 3.1% | 3.5%(-0.400)#719 | 4.9%(-1.80)#20,891 |
| 3. | 93101 | 2.4% | 3.5%(-1.10)#816 | 4.9%(-2.50)#22,161 |
| 4. | 93109 | 2.1% | 3.5%(-1.40)#911 | 4.9%(-2.80)#22,990 |
| 5. | 93108 | 1.7% | 3.5%(-1.80)#1,074 | 4.9%(-3.20)#24,153 |
| 6. | 93111 | 1.4% | 3.5%(-2.10)#1,221 | 4.9%(-3.50)#25,187 |
| 7. | 93103 | 1.3% | 3.5%(-2.20)#1,268 | 4.9%(-3.60)#25,563 |
1
Common Questions
What are the Top 5 Zip Codes with the Highest Percentage of Households Heated by Bottled Gas / Liquid Propane in Santa Barbara, CA?
Top 5 Zip Codes with the Highest Percentage of Households Heated by Bottled Gas / Liquid Propane in Santa Barbara, CA are:
What zip code has the Highest Percentage of Households Heated by Bottled Gas / Liquid Propane in Santa Barbara, CA?
93105 has the Highest Percentage of Households Heated by Bottled Gas / Liquid Propane in Santa Barbara, CA with 3.1%.
What is the Percentage of Households Heated by Bottled Gas / Liquid Propane in Santa Barbara, CA?
Percentage of Households Heated by Bottled Gas / Liquid Propane in Santa Barbara is 1.8%.
What is the Percentage of Households Heated by Bottled Gas / Liquid Propane in California?
Percentage of Households Heated by Bottled Gas / Liquid Propane in California is 3.5%.
What is the Percentage of Households Heated by Bottled Gas / Liquid Propane in the United States?
Percentage of Households Heated by Bottled Gas / Liquid Propane in the United States is 4.9%.