Zip Codes with the Highest Percentage of Population Employed in Farming, Fishing & Forestry in Santa Barbara, CA
RELATED REPORTS & OPTIONS
Farming, Fishing & Forestry
Santa Barbara
Compare Zip Codes
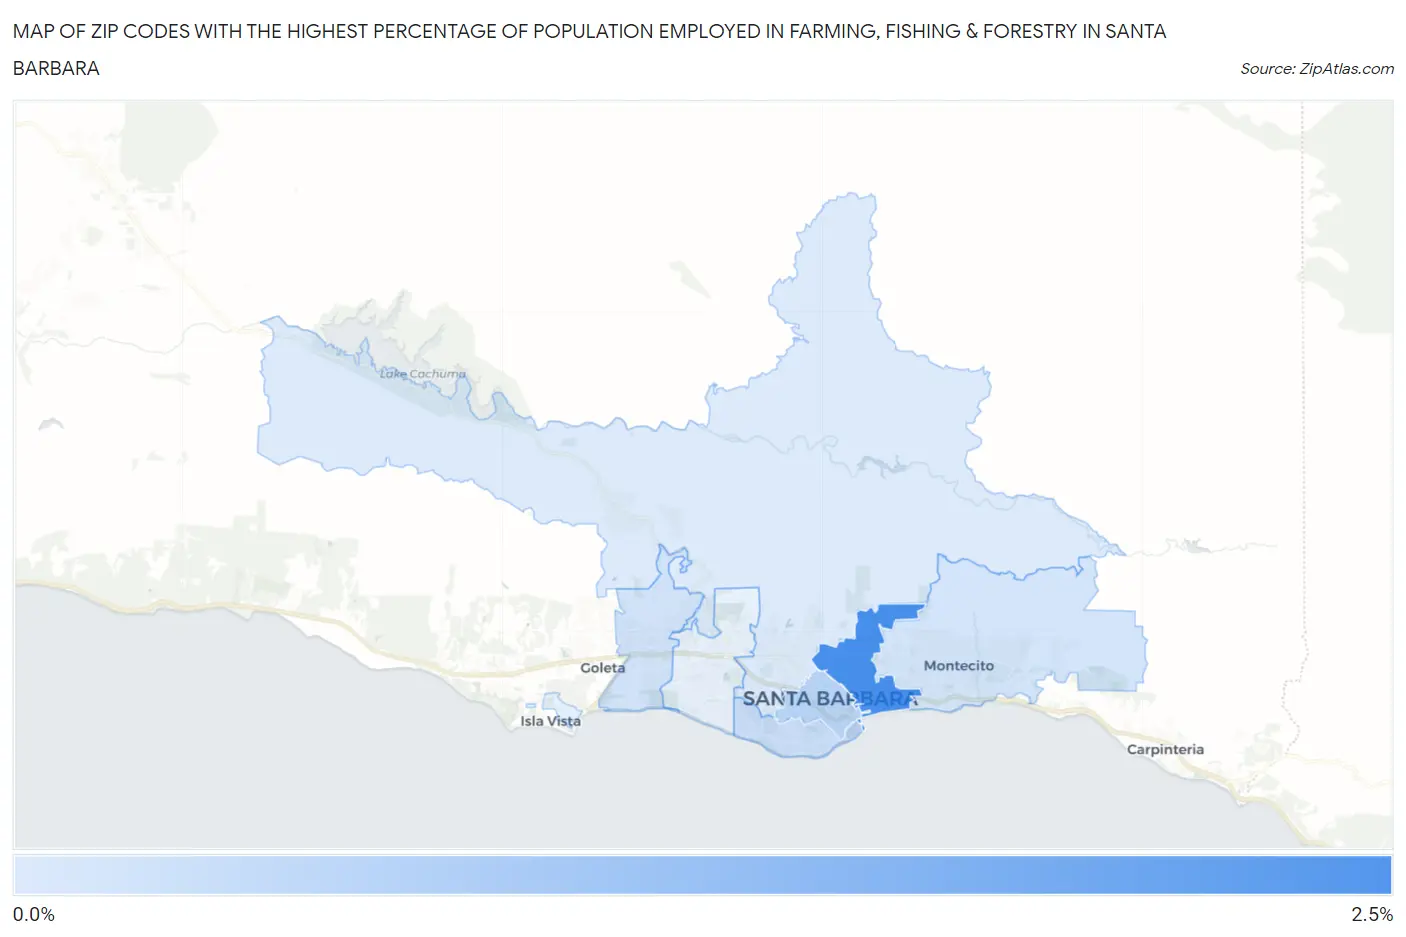
Map of Zip Codes with the Highest Percentage of Population Employed in Farming, Fishing & Forestry in Santa Barbara
0.0%
2.5%
Zip Codes with the Highest Percentage of Population Employed in Farming, Fishing & Forestry in Santa Barbara, CA
| Zip Code | % Employed | vs State | vs National | |
| 1. | 93103 | 2.2% | 1.4%(+0.839)#358 | 0.61%(+1.64)#6,026 |
| 2. | 93101 | 0.59% | 1.4%(-0.822)#638 | 0.61%(-0.017)#12,133 |
| 3. | 93109 | 0.37% | 1.4%(-1.04)#776 | 0.61%(-0.231)#14,000 |
| 4. | 93111 | 0.28% | 1.4%(-1.13)#865 | 0.61%(-0.327)#15,083 |
| 5. | 93108 | 0.25% | 1.4%(-1.16)#891 | 0.61%(-0.357)#15,437 |
| 6. | 93105 | 0.12% | 1.4%(-1.29)#1,053 | 0.61%(-0.489)#17,489 |
1
Common Questions
What are the Top 5 Zip Codes with the Highest Percentage of Population Employed in Farming, Fishing & Forestry in Santa Barbara, CA?
Top 5 Zip Codes with the Highest Percentage of Population Employed in Farming, Fishing & Forestry in Santa Barbara, CA are:
What zip code has the Highest Percentage of Population Employed in Farming, Fishing & Forestry in Santa Barbara, CA?
93103 has the Highest Percentage of Population Employed in Farming, Fishing & Forestry in Santa Barbara, CA with 2.2%.
What is the Percentage of Population Employed in Farming, Fishing & Forestry in Santa Barbara, CA?
Percentage of Population Employed in Farming, Fishing & Forestry in Santa Barbara is 0.80%.
What is the Percentage of Population Employed in Farming, Fishing & Forestry in California?
Percentage of Population Employed in Farming, Fishing & Forestry in California is 1.4%.
What is the Percentage of Population Employed in Farming, Fishing & Forestry in the United States?
Percentage of Population Employed in Farming, Fishing & Forestry in the United States is 0.61%.