San Simeon, CA Map & Demographics
San Simeon Map
San Simeon Overview
$34,805
PER CAPITA INCOME
$58,125
AVG HOUSEHOLD INCOME
0.20
INEQUALITY / GINI INDEX
307
TOTAL POPULATION
153
MALE POPULATION
154
FEMALE POPULATION
99.35
MALES / 100 FEMALES
100.65
FEMALES / 100 MALES
48.0
MEDIAN AGE
4.1
AVG FAMILY SIZE
1.8
AVG HOUSEHOLD SIZE
127
LABOR FORCE [ PEOPLE ]
58.3%
PERCENT IN LABOR FORCE
San Simeon Zip Codes
San Simeon Area Codes
Income in San Simeon
Income Overview in San Simeon
| Characteristic | Number | Measure |
| Per Capita Income | 307 | $34,805 |
| Median Family Income | 44 | $0 |
| Mean Family Income | 44 | $81,461 |
| Median Household Income | 170 | $58,125 |
| Mean Household Income | 170 | $63,572 |
| Income Deficit | 44 | $0 |
| Wage / Income Gap (%) | 307 | 0.00% |
| Wage / Income Gap ($) | 307 | 100.00¢ per $1 |
| Gini / Inequality Index | 307 | 0.20 |
Earnings by Sex in San Simeon
| Sex | Number | Average Earnings |
| Male | 63 (46.7%) | $0 |
| Female | 72 (53.3%) | $0 |
| Total | 135 (100.0%) | $0 |
Earnings by Sex by Income Bracket in San Simeon
The most common earnings brackets in San Simeon are $55,000 to $64,999 for men (28 | 44.4%) and $55,000 to $64,999 for women (28 | 38.9%).
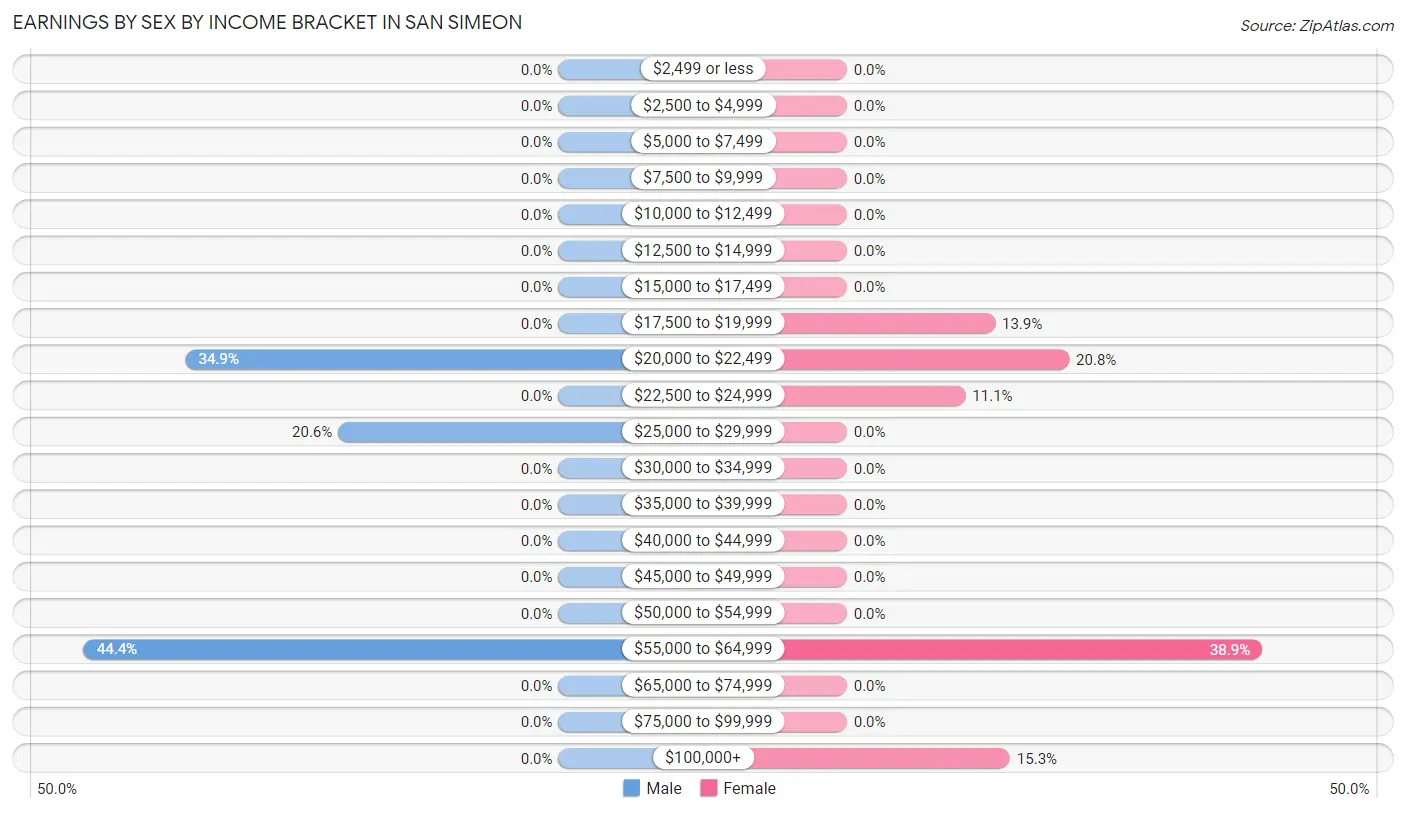
| Income | Male | Female |
| $2,499 or less | 0 (0.0%) | 0 (0.0%) |
| $2,500 to $4,999 | 0 (0.0%) | 0 (0.0%) |
| $5,000 to $7,499 | 0 (0.0%) | 0 (0.0%) |
| $7,500 to $9,999 | 0 (0.0%) | 0 (0.0%) |
| $10,000 to $12,499 | 0 (0.0%) | 0 (0.0%) |
| $12,500 to $14,999 | 0 (0.0%) | 0 (0.0%) |
| $15,000 to $17,499 | 0 (0.0%) | 0 (0.0%) |
| $17,500 to $19,999 | 0 (0.0%) | 10 (13.9%) |
| $20,000 to $22,499 | 22 (34.9%) | 15 (20.8%) |
| $22,500 to $24,999 | 0 (0.0%) | 8 (11.1%) |
| $25,000 to $29,999 | 13 (20.6%) | 0 (0.0%) |
| $30,000 to $34,999 | 0 (0.0%) | 0 (0.0%) |
| $35,000 to $39,999 | 0 (0.0%) | 0 (0.0%) |
| $40,000 to $44,999 | 0 (0.0%) | 0 (0.0%) |
| $45,000 to $49,999 | 0 (0.0%) | 0 (0.0%) |
| $50,000 to $54,999 | 0 (0.0%) | 0 (0.0%) |
| $55,000 to $64,999 | 28 (44.4%) | 28 (38.9%) |
| $65,000 to $74,999 | 0 (0.0%) | 0 (0.0%) |
| $75,000 to $99,999 | 0 (0.0%) | 0 (0.0%) |
| $100,000+ | 0 (0.0%) | 11 (15.3%) |
| Total | 63 (100.0%) | 72 (100.0%) |
Earnings by Sex by Educational Attainment in San Simeon
| Educational Attainment | Male Income | Female Income |
| Less than High School | - | - |
| High School Diploma | - | - |
| College or Associate's Degree | - | - |
| Bachelor's Degree | - | - |
| Graduate Degree | - | - |
| Total | - | - |
Family Income in San Simeon
Family Income Brackets in San Simeon
According to the San Simeon family income data, there are 31 families falling into the $35,000 to $49,999 income range, which is the most common income bracket and makes up 70.5% of all families.
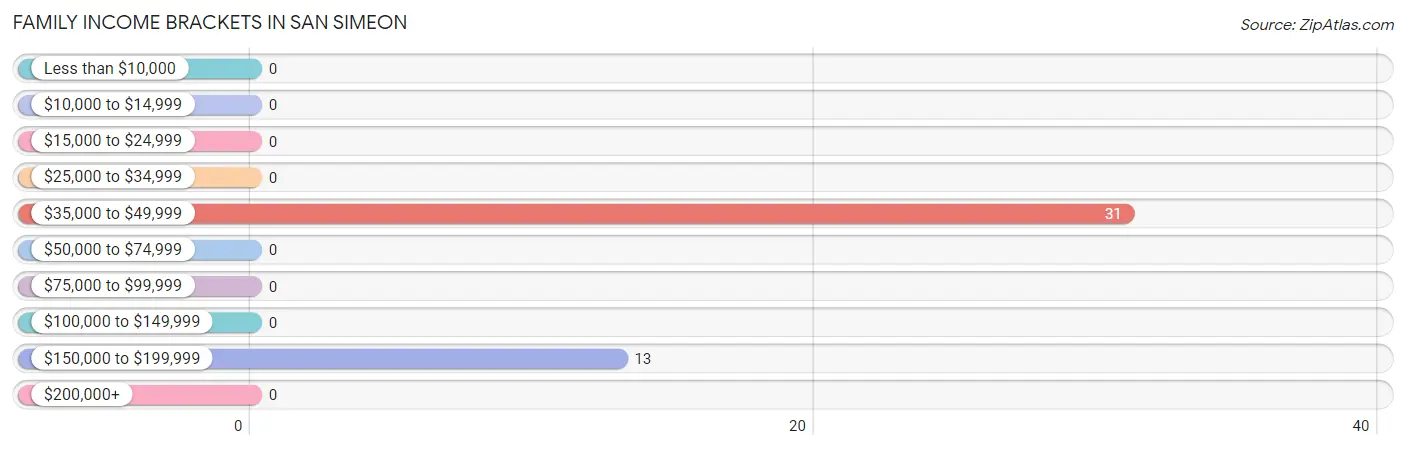
| Income Bracket | # Families | % Families |
| Less than $10,000 | 0 | 0.0% |
| $10,000 to $14,999 | 0 | 0.0% |
| $15,000 to $24,999 | 0 | 0.0% |
| $25,000 to $34,999 | 0 | 0.0% |
| $35,000 to $49,999 | 31 | 70.5% |
| $50,000 to $74,999 | 0 | 0.0% |
| $75,000 to $99,999 | 0 | 0.0% |
| $100,000 to $149,999 | 0 | 0.0% |
| $150,000 to $199,999 | 13 | 29.5% |
| $200,000+ | 0 | 0.0% |
Family Income by Famaliy Size in San Simeon
| Income Bracket | # Families | Median Income |
| 2-Person Families | 29 (65.9%) | $0 |
| 3-Person Families | 0 (0.0%) | $0 |
| 4-Person Families | 0 (0.0%) | $0 |
| 5-Person Families | 0 (0.0%) | $0 |
| 6-Person Families | 15 (34.1%) | $0 |
| 7+ Person Families | 0 (0.0%) | $0 |
| Total | 44 (100.0%) | $0 |
Family Income by Number of Earners in San Simeon
| Number of Earners | # Families | Median Income |
| No Earners | 16 (36.4%) | $0 |
| 1 Earner | 0 (0.0%) | $0 |
| 2 Earners | 28 (63.6%) | $0 |
| 3+ Earners | 0 (0.0%) | $0 |
| Total | 44 (100.0%) | $0 |
Household Income in San Simeon
Household Income Brackets in San Simeon
With 107 households falling in the category, the $50,000 to $74,999 income range is the most frequent in San Simeon, accounting for 62.9% of all households.
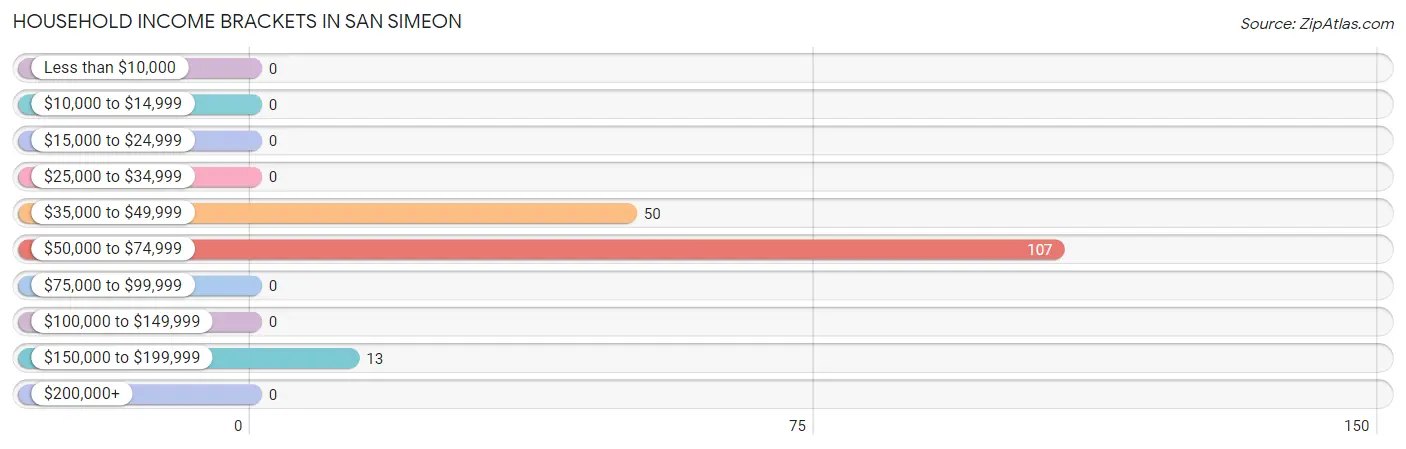
| Income Bracket | # Households | % Households |
| Less than $10,000 | 0 | 0.0% |
| $10,000 to $14,999 | 0 | 0.0% |
| $15,000 to $24,999 | 0 | 0.0% |
| $25,000 to $34,999 | 0 | 0.0% |
| $35,000 to $49,999 | 50 | 29.4% |
| $50,000 to $74,999 | 107 | 62.9% |
| $75,000 to $99,999 | 0 | 0.0% |
| $100,000 to $149,999 | 0 | 0.0% |
| $150,000 to $199,999 | 13 | 7.6% |
| $200,000+ | 0 | 0.0% |
Household Income by Householder Age in San Simeon
The median household income in San Simeon is $58,125, with the highest median household income of $60,588 found in the 65+ years age bracket for the primary householder. A total of 86 households (50.6%) fall into this category.
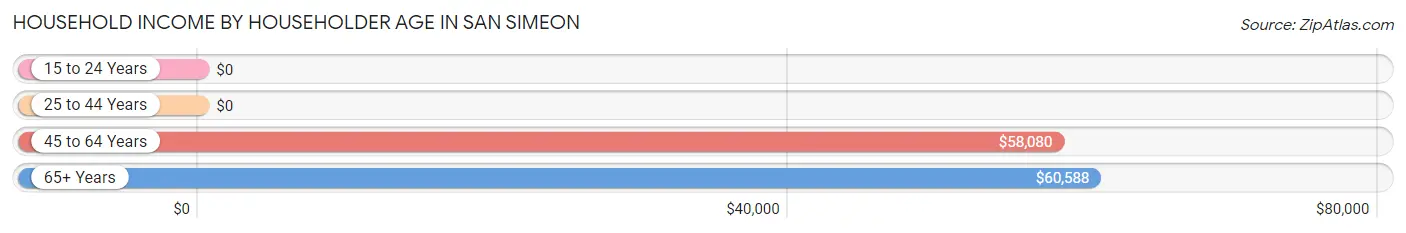
| Income Bracket | # Households | Median Income |
| 15 to 24 Years | 0 (0.0%) | $0 |
| 25 to 44 Years | 15 (8.8%) | $0 |
| 45 to 64 Years | 69 (40.6%) | $58,080 |
| 65+ Years | 86 (50.6%) | $60,588 |
| Total | 170 (100.0%) | $58,125 |
Poverty in San Simeon
Income Below Poverty by Sex and Age in San Simeon
| Age Bracket | Male | Female |
| Under 5 Years | 0 (0.0%) | 0 (0.0%) |
| 5 Years | 0 (0.0%) | 0 (0.0%) |
| 6 to 11 Years | 0 (0.0%) | 0 (0.0%) |
| 12 to 14 Years | 0 (0.0%) | 0 (0.0%) |
| 15 Years | 0 (0.0%) | 0 (0.0%) |
| 16 and 17 Years | 0 (0.0%) | 0 (0.0%) |
| 18 to 24 Years | 0 (0.0%) | 0 (0.0%) |
| 25 to 34 Years | 0 (0.0%) | 0 (0.0%) |
| 35 to 44 Years | 0 (0.0%) | 0 (0.0%) |
| 45 to 54 Years | 0 (0.0%) | 0 (0.0%) |
| 55 to 64 Years | 0 (0.0%) | 0 (0.0%) |
| 65 to 74 Years | 0 (0.0%) | 0 (0.0%) |
| 75 Years and over | 0 (0.0%) | 0 (0.0%) |
| Total | 0 (0.0%) | 0 (0.0%) |
Income Above Poverty by Sex and Age in San Simeon
According to the poverty statistics in San Simeon, males aged under 5 years and females aged under 5 years are the age groups that are most secure financially, with 100.0% of males and 100.0% of females in these age groups living above the poverty line.
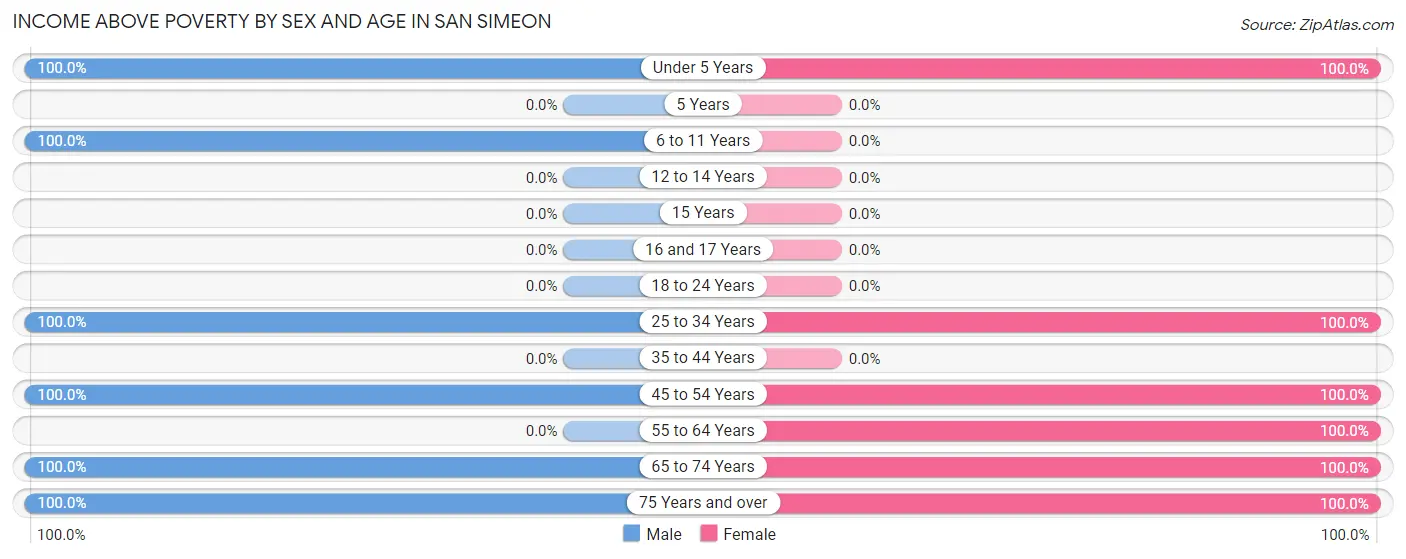
| Age Bracket | Male | Female |
| Under 5 Years | 28 (100.0%) | 24 (100.0%) |
| 5 Years | 0 (0.0%) | 0 (0.0%) |
| 6 to 11 Years | 37 (100.0%) | 0 (0.0%) |
| 12 to 14 Years | 0 (0.0%) | 0 (0.0%) |
| 15 Years | 0 (0.0%) | 0 (0.0%) |
| 16 and 17 Years | 0 (0.0%) | 0 (0.0%) |
| 18 to 24 Years | 0 (0.0%) | 0 (0.0%) |
| 25 to 34 Years | 22 (100.0%) | 15 (100.0%) |
| 35 to 44 Years | 0 (0.0%) | 0 (0.0%) |
| 45 to 54 Years | 41 (100.0%) | 11 (100.0%) |
| 55 to 64 Years | 0 (0.0%) | 28 (100.0%) |
| 65 to 74 Years | 17 (100.0%) | 57 (100.0%) |
| 75 Years and over | 8 (100.0%) | 19 (100.0%) |
| Total | 153 (100.0%) | 154 (100.0%) |
Income Below Poverty Among Married-Couple Families in San Simeon
| Children | Above Poverty | Below Poverty |
| No Children | 29 (100.0%) | 0 (0.0%) |
| 1 or 2 Children | 0 (0.0%) | 0 (0.0%) |
| 3 or 4 Children | 15 (100.0%) | 0 (0.0%) |
| 5 or more Children | 0 (0.0%) | 0 (0.0%) |
| Total | 44 (100.0%) | 0 (0.0%) |
Income Below Poverty Among Single-Parent Households in San Simeon
| Children | Single Father | Single Mother |
| No Children | 0 (0.0%) | 0 (0.0%) |
| 1 or 2 Children | 0 (0.0%) | 0 (0.0%) |
| 3 or 4 Children | 0 (0.0%) | 0 (0.0%) |
| 5 or more Children | 0 (0.0%) | 0 (0.0%) |
| Total | 0 (0.0%) | 0 (0.0%) |
Income Below Poverty Among Married-Couple vs Single-Parent Households in San Simeon
| Children | Married-Couple Families | Single-Parent Households |
| No Children | 0 (0.0%) | 0 (0.0%) |
| 1 or 2 Children | 0 (0.0%) | 0 (0.0%) |
| 3 or 4 Children | 0 (0.0%) | 0 (0.0%) |
| 5 or more Children | 0 (0.0%) | 0 (0.0%) |
| Total | 0 (0.0%) | 0 (0.0%) |
Race in San Simeon
The most populous races in San Simeon are White / Caucasian (307 | 100.0%), and Hispanic or Latino (165 | 53.7%).
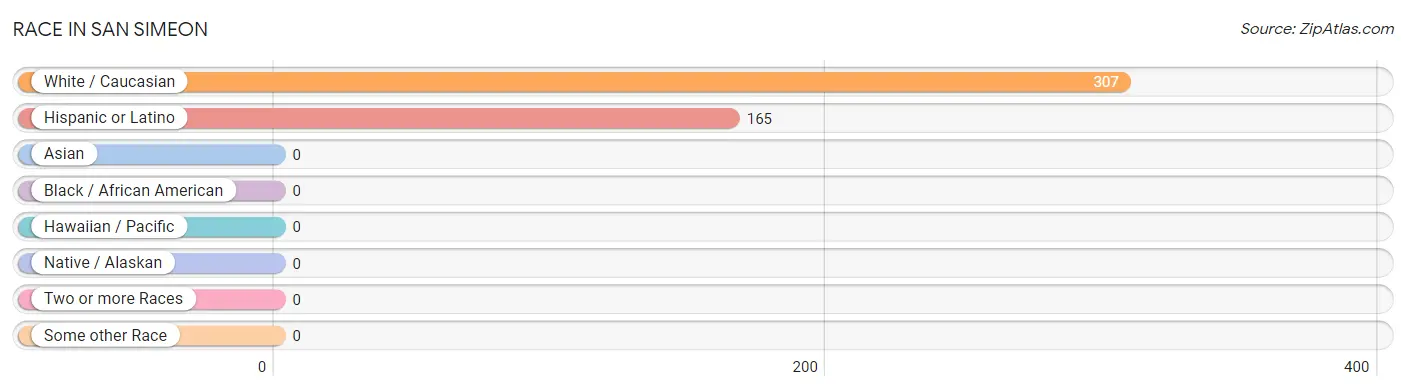
| Race | # Population | % Population |
| Asian | 0 | 0.0% |
| Black / African American | 0 | 0.0% |
| Hawaiian / Pacific | 0 | 0.0% |
| Hispanic or Latino | 165 | 53.7% |
| Native / Alaskan | 0 | 0.0% |
| White / Caucasian | 307 | 100.0% |
| Two or more Races | 0 | 0.0% |
| Some other Race | 0 | 0.0% |
| Total | 307 | 100.0% |
Ancestry in San Simeon
The most populous ancestries reported in San Simeon are Mexican (165 | 53.7%), Croatian (34 | 11.1%), Irish (34 | 11.1%), British (28 | 9.1%), and Portuguese (21 | 6.8%), together accounting for 91.9% of all San Simeon residents.
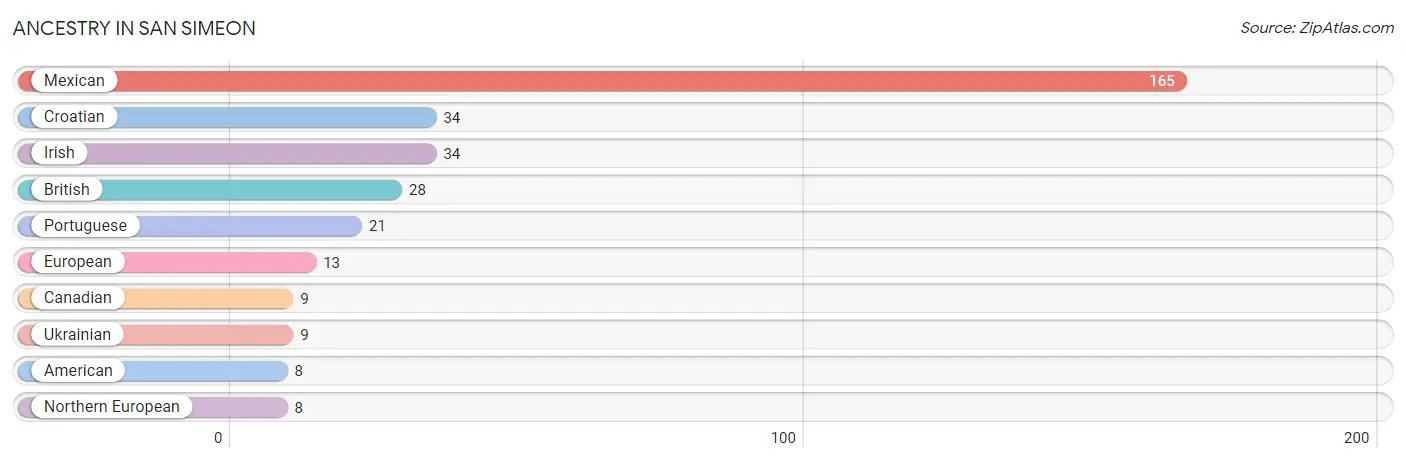
| Ancestry | # Population | % Population |
| American | 8 | 2.6% |
| British | 28 | 9.1% |
| Canadian | 9 | 2.9% |
| Croatian | 34 | 11.1% |
| European | 13 | 4.2% |
| Irish | 34 | 11.1% |
| Mexican | 165 | 53.7% |
| Northern European | 8 | 2.6% |
| Portuguese | 21 | 6.8% |
| Ukrainian | 9 | 2.9% | View All 10 Rows |
Immigrants in San Simeon
The most numerous immigrant groups reported in San Simeon came from Central America (65 | 21.2%), Latin America (65 | 21.2%), and Mexico (65 | 21.2%), together accounting for 63.5% of all San Simeon residents.
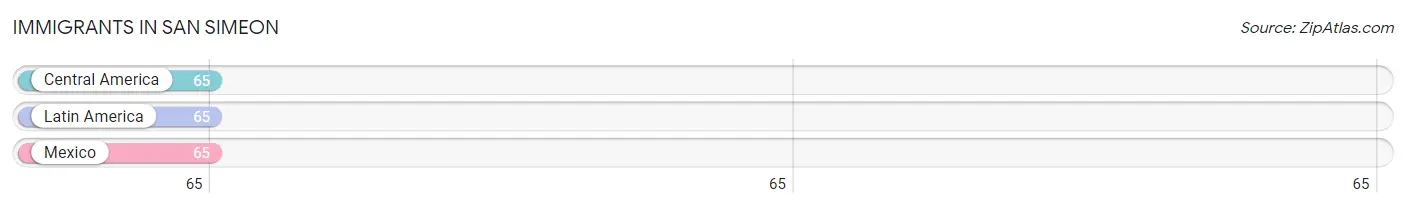
| Immigration Origin | # Population | % Population |
| Central America | 65 | 21.2% |
| Latin America | 65 | 21.2% |
| Mexico | 65 | 21.2% | View All 3 Rows |
Sex and Age in San Simeon
Sex and Age in San Simeon
The most populous age groups in San Simeon are 5 to 9 Years (37 | 24.2%) for men and 65 to 69 Years (57 | 37.0%) for women.
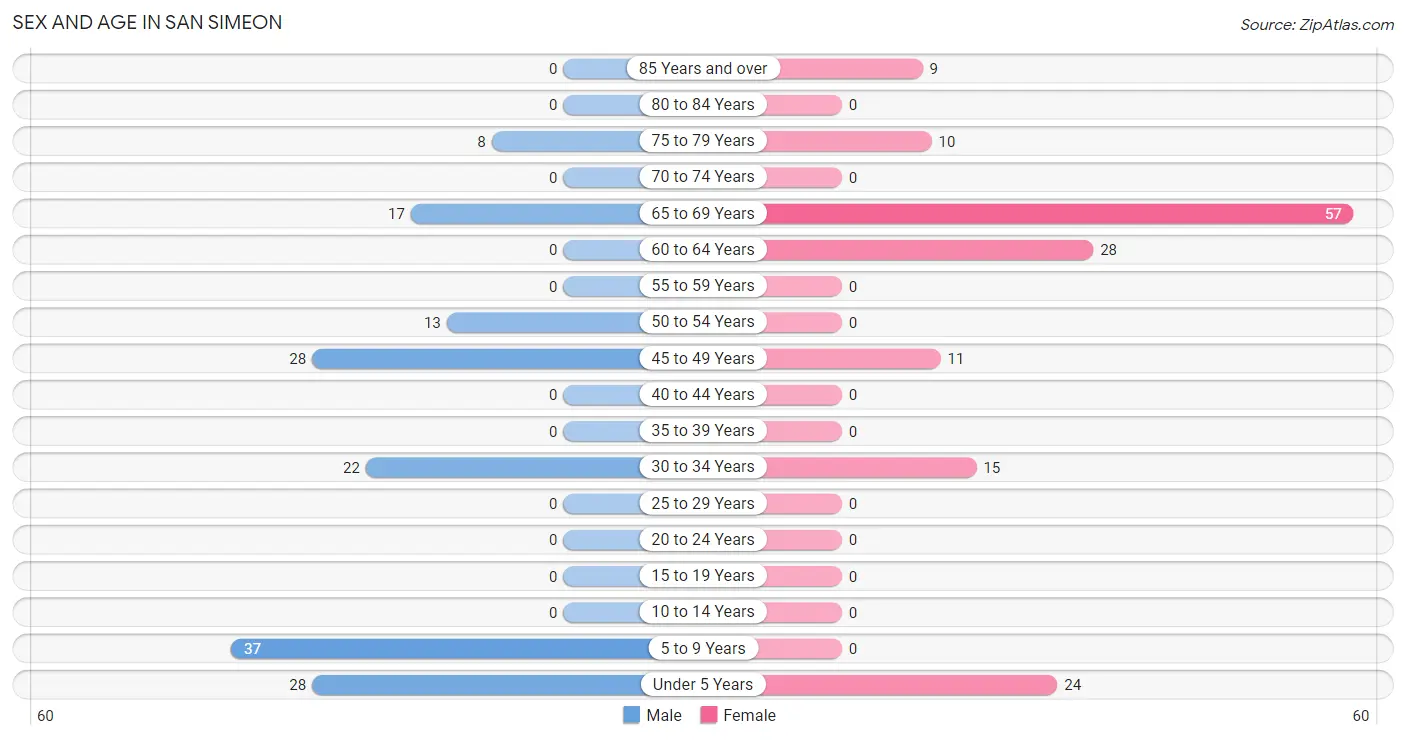
| Age Bracket | Male | Female |
| Under 5 Years | 28 (18.3%) | 24 (15.6%) |
| 5 to 9 Years | 37 (24.2%) | 0 (0.0%) |
| 10 to 14 Years | 0 (0.0%) | 0 (0.0%) |
| 15 to 19 Years | 0 (0.0%) | 0 (0.0%) |
| 20 to 24 Years | 0 (0.0%) | 0 (0.0%) |
| 25 to 29 Years | 0 (0.0%) | 0 (0.0%) |
| 30 to 34 Years | 22 (14.4%) | 15 (9.7%) |
| 35 to 39 Years | 0 (0.0%) | 0 (0.0%) |
| 40 to 44 Years | 0 (0.0%) | 0 (0.0%) |
| 45 to 49 Years | 28 (18.3%) | 11 (7.1%) |
| 50 to 54 Years | 13 (8.5%) | 0 (0.0%) |
| 55 to 59 Years | 0 (0.0%) | 0 (0.0%) |
| 60 to 64 Years | 0 (0.0%) | 28 (18.2%) |
| 65 to 69 Years | 17 (11.1%) | 57 (37.0%) |
| 70 to 74 Years | 0 (0.0%) | 0 (0.0%) |
| 75 to 79 Years | 8 (5.2%) | 10 (6.5%) |
| 80 to 84 Years | 0 (0.0%) | 0 (0.0%) |
| 85 Years and over | 0 (0.0%) | 9 (5.8%) |
| Total | 153 (100.0%) | 154 (100.0%) |
Families and Households in San Simeon
Median Family Size in San Simeon
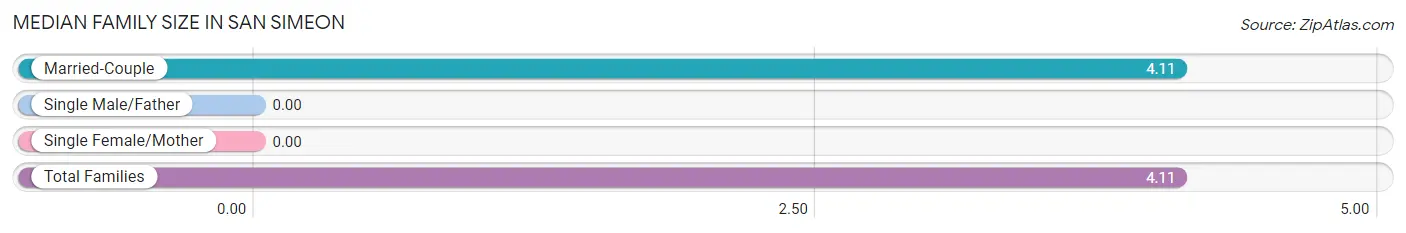
| Family Type | # Families | Family Size |
| Married-Couple | 44 (100.0%) | 4.11 |
| Single Male/Father | 0 (0.0%) | - |
| Single Female/Mother | 0 (0.0%) | - |
| Total Families | 44 (100.0%) | 4.11 |
Median Household Size in San Simeon
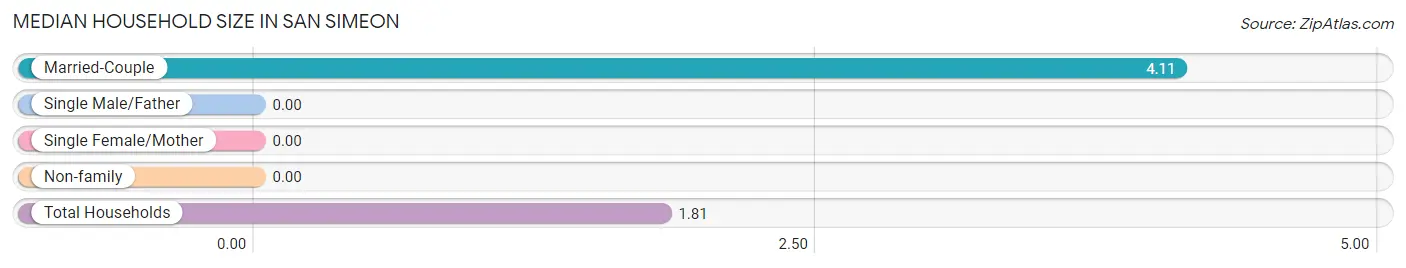
| Household Type | # Households | Household Size |
| Married-Couple | 44 (25.9%) | 4.11 |
| Single Male/Father | 0 (0.0%) | - |
| Single Female/Mother | 0 (0.0%) | - |
| Non-family | 126 (74.1%) | - |
| Total Households | 170 (100.0%) | 1.81 |
Household Size by Marriage Status in San Simeon
Out of a total of 170 households in San Simeon, 44 (25.9%) are family households, while 126 (74.1%) are nonfamily households. The most numerous type of family households are 2-person households, comprising 29, and the most common type of nonfamily households are 1-person households, comprising 126.
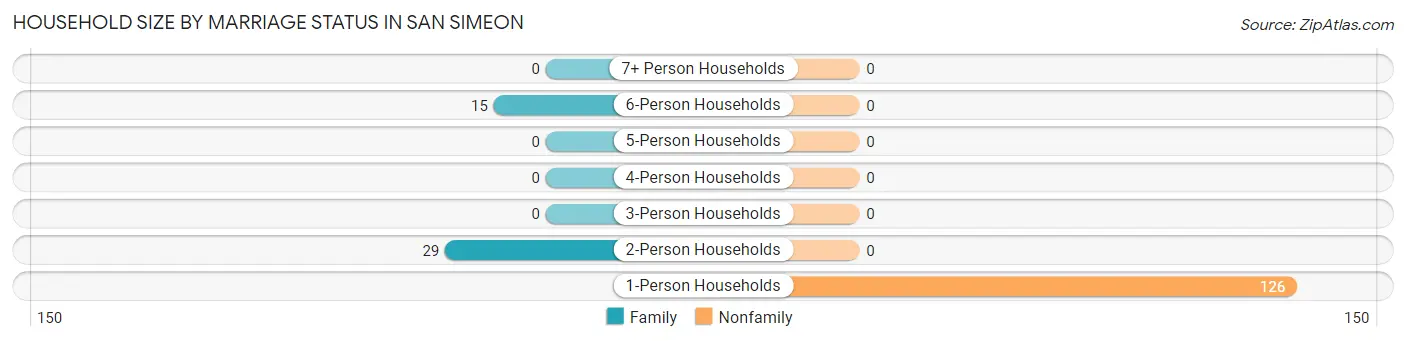
| Household Size | Family Households | Nonfamily Households |
| 1-Person Households | - | 126 (74.1%) |
| 2-Person Households | 29 (17.1%) | 0 (0.0%) |
| 3-Person Households | 0 (0.0%) | 0 (0.0%) |
| 4-Person Households | 0 (0.0%) | 0 (0.0%) |
| 5-Person Households | 0 (0.0%) | 0 (0.0%) |
| 6-Person Households | 15 (8.8%) | 0 (0.0%) |
| 7+ Person Households | 0 (0.0%) | 0 (0.0%) |
| Total | 44 (25.9%) | 126 (74.1%) |
Female Fertility in San Simeon
Fertility by Age in San Simeon
| Age Bracket | Women with Births | Births / 1,000 Women |
| 15 to 19 years | 0 (0.0%) | 0.0 |
| 20 to 34 years | 0 (0.0%) | 0.0 |
| 35 to 50 years | 0 (0.0%) | 0.0 |
| Total | 0 (0.0%) | 0.0 |
Fertility by Age by Marriage Status in San Simeon
| Age Bracket | Married | Unmarried |
| 15 to 19 years | 0 (0.0%) | 0 (0.0%) |
| 20 to 34 years | 0 (0.0%) | 0 (0.0%) |
| 35 to 50 years | 0 (0.0%) | 0 (0.0%) |
| Total | 0 (0.0%) | 0 (0.0%) |
Fertility by Education in San Simeon
| Educational Attainment | Women with Births | Births / 1,000 Women |
| Less than High School | 0 (0.0%) | 0.0 |
| High School Diploma | 0 (0.0%) | 0.0 |
| College or Associate's Degree | 0 (0.0%) | 0.0 |
| Bachelor's Degree | 0 (0.0%) | 0.0 |
| Graduate Degree | 0 (0.0%) | 0.0 |
| Total | 0 (0.0%) | 0.0 |
Fertility by Education by Marriage Status in San Simeon
| Educational Attainment | Married | Unmarried |
| Less than High School | 0 (0.0%) | 0 (0.0%) |
| High School Diploma | 0 (0.0%) | 0 (0.0%) |
| College or Associate's Degree | 0 (0.0%) | 0 (0.0%) |
| Bachelor's Degree | 0 (0.0%) | 0 (0.0%) |
| Graduate Degree | 0 (0.0%) | 0 (0.0%) |
| Total | 0 (0.0%) | 0 (0.0%) |
Employment Characteristics in San Simeon
Employment by Class of Employer in San Simeon
Among the 127 employed individuals in San Simeon, private company employees (94 | 74.0%), self-employed (not incorporated) (22 | 17.3%), and state government employees (11 | 8.7%) make up the most common classes of employment.
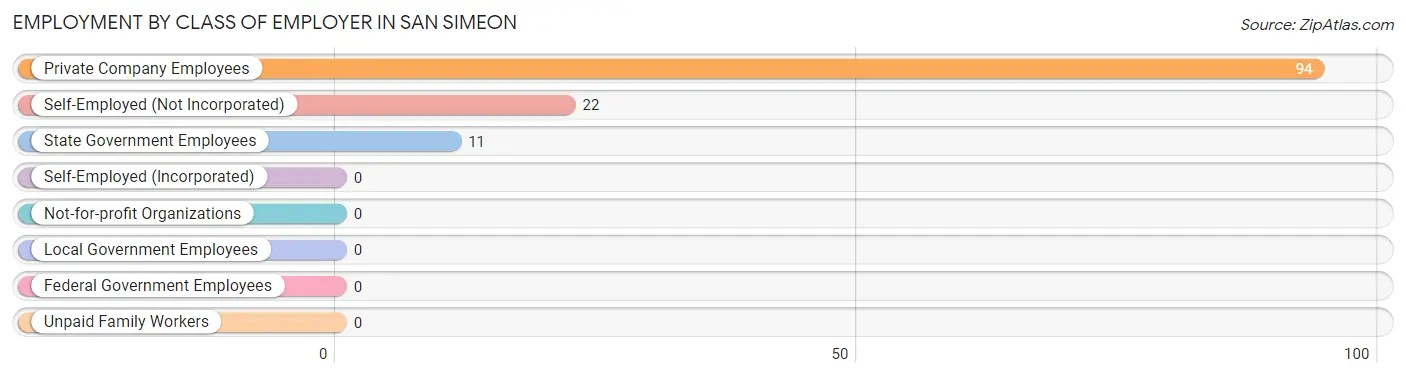
| Employer Class | # Employees | % Employees |
| Private Company Employees | 94 | 74.0% |
| Self-Employed (Incorporated) | 0 | 0.0% |
| Self-Employed (Not Incorporated) | 22 | 17.3% |
| Not-for-profit Organizations | 0 | 0.0% |
| Local Government Employees | 0 | 0.0% |
| State Government Employees | 11 | 8.7% |
| Federal Government Employees | 0 | 0.0% |
| Unpaid Family Workers | 0 | 0.0% |
| Total | 127 | 100.0% |
Employment Status by Age in San Simeon
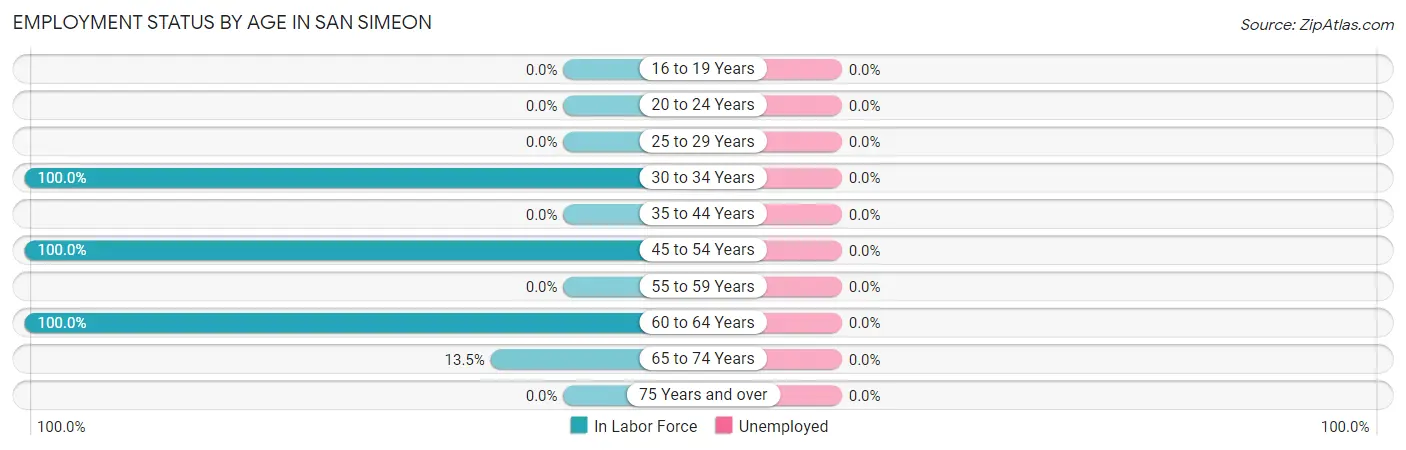
| Age Bracket | In Labor Force | Unemployed |
| 16 to 19 Years | 0 (0.0%) | 0 (0.0%) |
| 20 to 24 Years | 0 (0.0%) | 0 (0.0%) |
| 25 to 29 Years | 0 (0.0%) | 0 (0.0%) |
| 30 to 34 Years | 37 (100.0%) | 0 (0.0%) |
| 35 to 44 Years | 0 (0.0%) | 0 (0.0%) |
| 45 to 54 Years | 52 (100.0%) | 0 (0.0%) |
| 55 to 59 Years | 0 (0.0%) | 0 (0.0%) |
| 60 to 64 Years | 28 (100.0%) | 0 (0.0%) |
| 65 to 74 Years | 10 (13.5%) | 0 (0.0%) |
| 75 Years and over | 0 (0.0%) | 0 (0.0%) |
| Total | 127 (58.3%) | 0 (0.0%) |
Employment Status by Educational Attainment in San Simeon
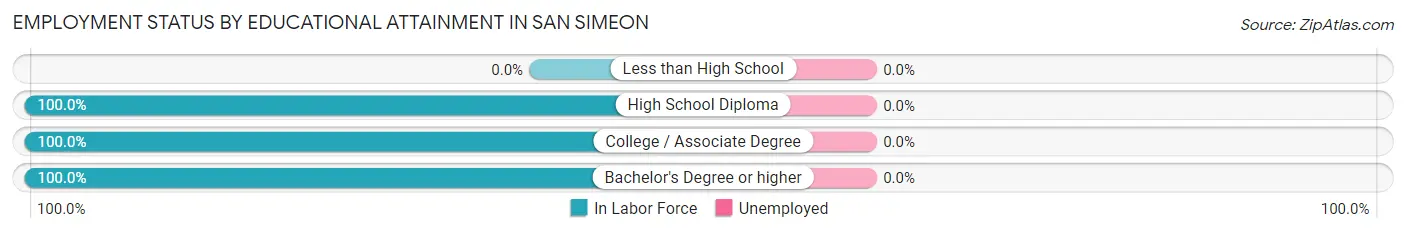
| Educational Attainment | In Labor Force | Unemployed |
| Less than High School | 0 (0.0%) | 0 (0.0%) |
| High School Diploma | 65 (100.0%) | 0 (0.0%) |
| College / Associate Degree | 28 (100.0%) | 0 (0.0%) |
| Bachelor's Degree or higher | 24 (100.0%) | 0 (0.0%) |
| Total | 117 (100.0%) | 0 (0.0%) |
Employment Occupations by Sex in San Simeon
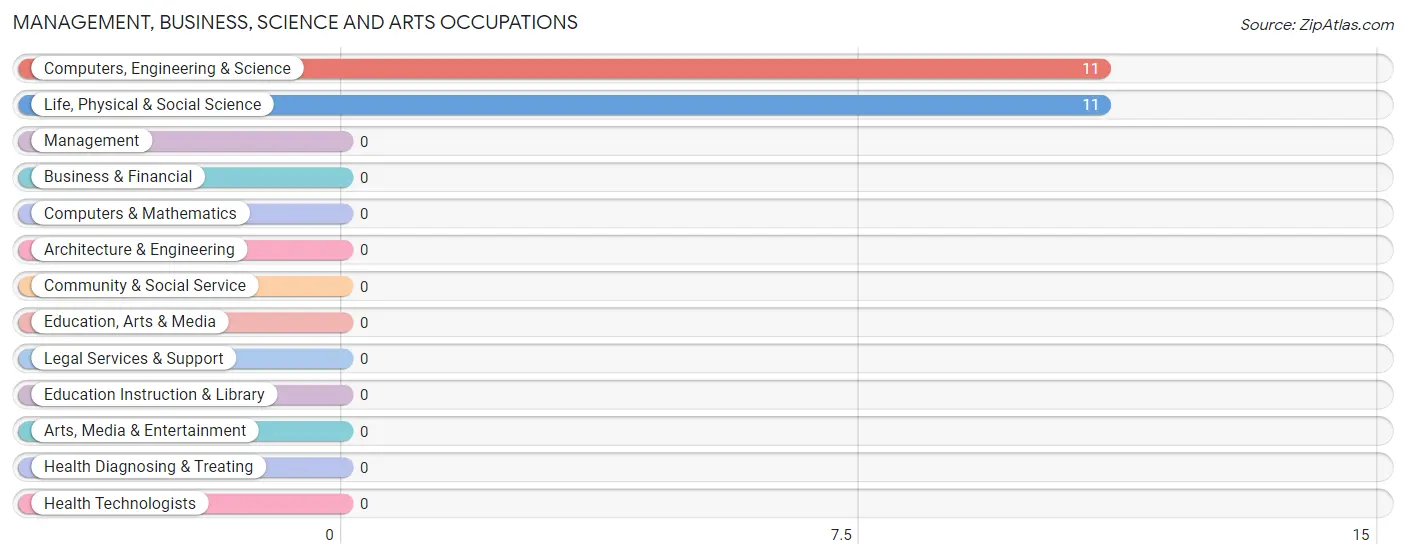
Management, Business, Science and Arts Occupations
The most common Management, Business, Science and Arts occupations in San Simeon are Computers, Engineering & Science (11 | 8.7%), and Life, Physical & Social Science (11 | 8.7%).
Management, Business, Science and Arts Occupations by Sex
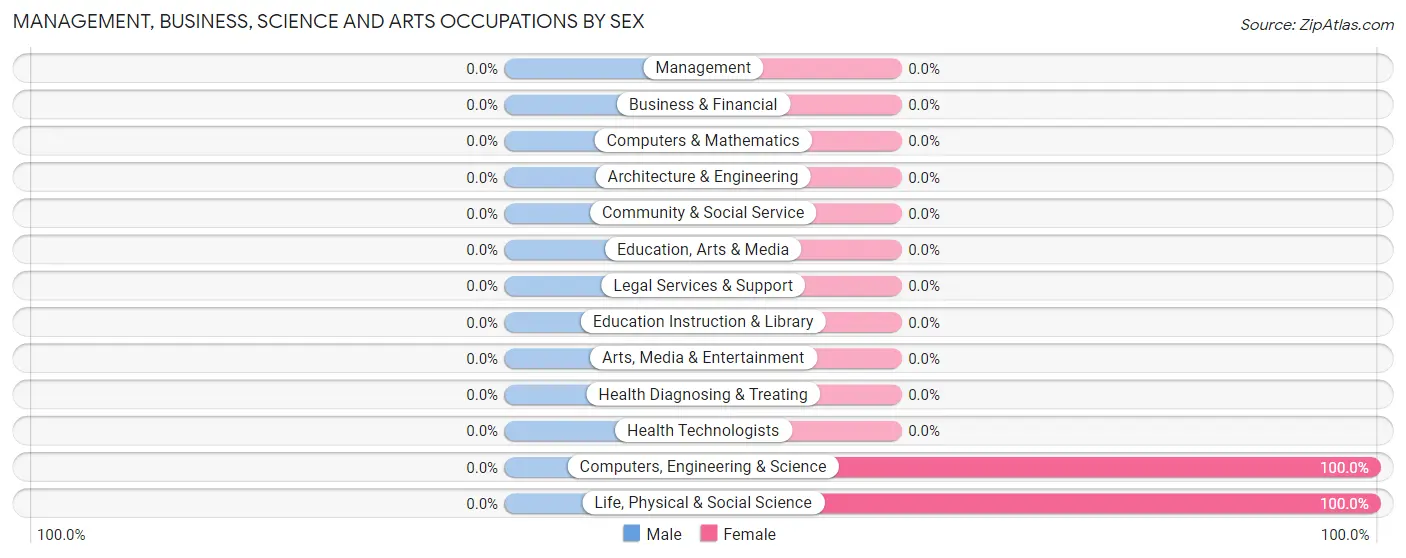
| Occupation | Male | Female |
| Management | 0 (0.0%) | 0 (0.0%) |
| Business & Financial | 0 (0.0%) | 0 (0.0%) |
| Computers, Engineering & Science | 0 (0.0%) | 11 (100.0%) |
| Computers & Mathematics | 0 (0.0%) | 0 (0.0%) |
| Architecture & Engineering | 0 (0.0%) | 0 (0.0%) |
| Life, Physical & Social Science | 0 (0.0%) | 11 (100.0%) |
| Community & Social Service | 0 (0.0%) | 0 (0.0%) |
| Education, Arts & Media | 0 (0.0%) | 0 (0.0%) |
| Legal Services & Support | 0 (0.0%) | 0 (0.0%) |
| Education Instruction & Library | 0 (0.0%) | 0 (0.0%) |
| Arts, Media & Entertainment | 0 (0.0%) | 0 (0.0%) |
| Health Diagnosing & Treating | 0 (0.0%) | 0 (0.0%) |
| Health Technologists | 0 (0.0%) | 0 (0.0%) |
| Total (Category) | 0 (0.0%) | 11 (100.0%) |
| Total (Overall) | 63 (49.6%) | 64 (50.4%) |
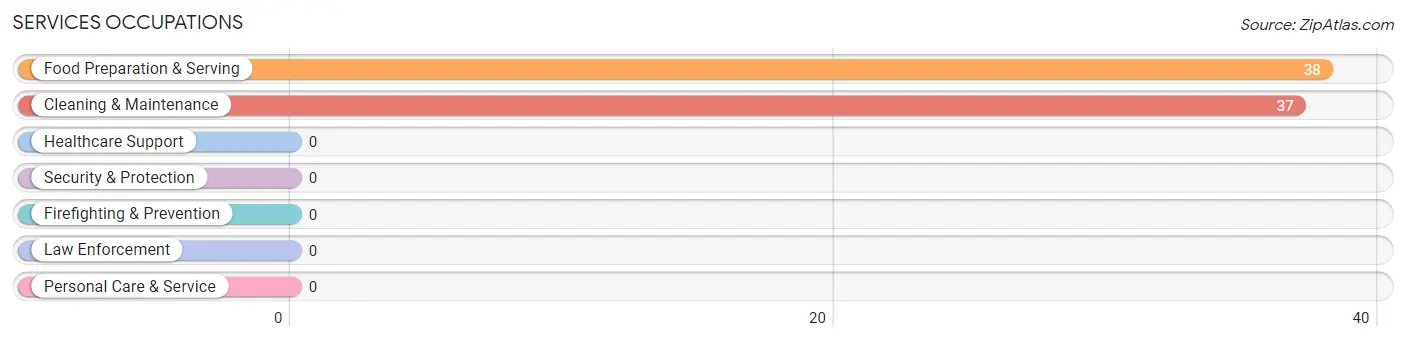
Services Occupations
The most common Services occupations in San Simeon are Food Preparation & Serving (38 | 29.9%), and Cleaning & Maintenance (37 | 29.1%).
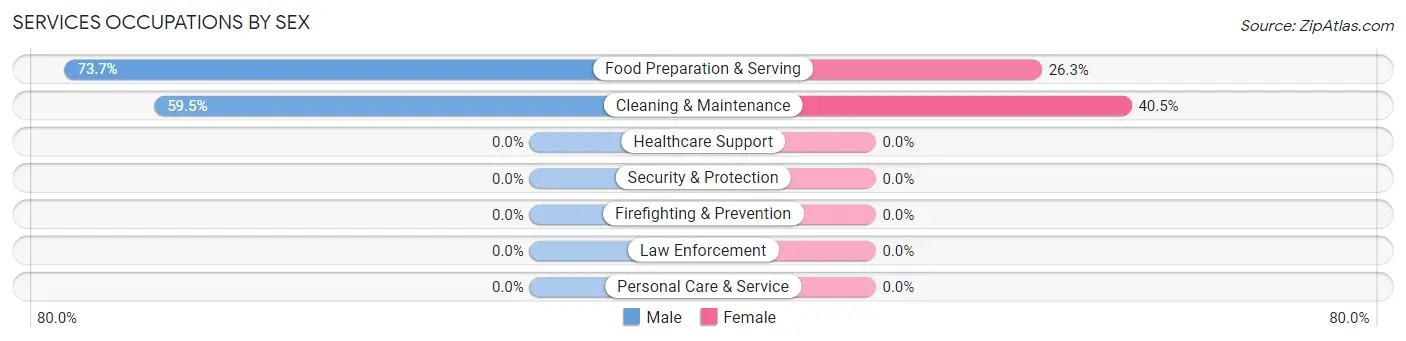
Services Occupations by Sex
Within the Services occupations in San Simeon, the most male-oriented occupations are Food Preparation & Serving (73.7%), and Cleaning & Maintenance (59.5%), while the most female-oriented occupations are Cleaning & Maintenance (40.5%), and Food Preparation & Serving (26.3%).
| Occupation | Male | Female |
| Healthcare Support | 0 (0.0%) | 0 (0.0%) |
| Security & Protection | 0 (0.0%) | 0 (0.0%) |
| Firefighting & Prevention | 0 (0.0%) | 0 (0.0%) |
| Law Enforcement | 0 (0.0%) | 0 (0.0%) |
| Food Preparation & Serving | 28 (73.7%) | 10 (26.3%) |
| Cleaning & Maintenance | 22 (59.5%) | 15 (40.5%) |
| Personal Care & Service | 0 (0.0%) | 0 (0.0%) |
| Total (Category) | 50 (66.7%) | 25 (33.3%) |
| Total (Overall) | 63 (49.6%) | 64 (50.4%) |
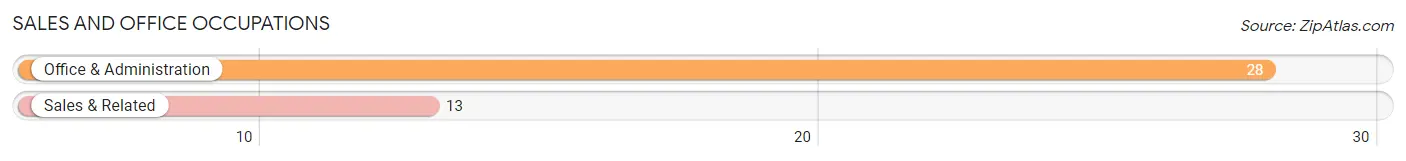
Sales and Office Occupations
The most common Sales and Office occupations in San Simeon are Office & Administration (28 | 22.1%), and Sales & Related (13 | 10.2%).
Sales and Office Occupations by Sex
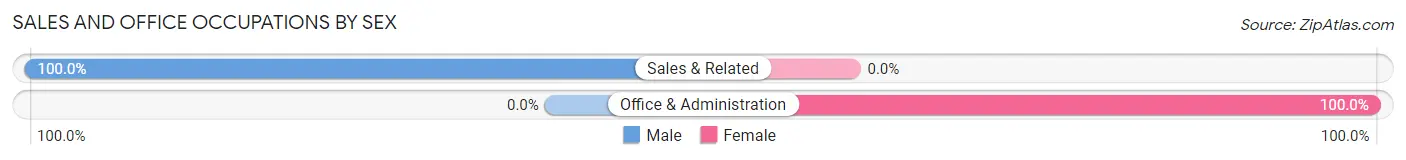
| Occupation | Male | Female |
| Sales & Related | 13 (100.0%) | 0 (0.0%) |
| Office & Administration | 0 (0.0%) | 28 (100.0%) |
| Total (Category) | 13 (31.7%) | 28 (68.3%) |
| Total (Overall) | 63 (49.6%) | 64 (50.4%) |
Natural Resources, Construction and Maintenance Occupations
Natural Resources, Construction and Maintenance Occupations by Sex
| Occupation | Male | Female |
| Farming, Fishing & Forestry | 0 (0.0%) | 0 (0.0%) |
| Construction & Extraction | 0 (0.0%) | 0 (0.0%) |
| Installation, Maintenance & Repair | 0 (0.0%) | 0 (0.0%) |
| Total (Category) | 0 (0.0%) | 0 (0.0%) |
| Total (Overall) | 63 (49.6%) | 64 (50.4%) |
Production, Transportation and Moving Occupations
Production, Transportation and Moving Occupations by Sex
| Occupation | Male | Female |
| Production | 0 (0.0%) | 0 (0.0%) |
| Transportation | 0 (0.0%) | 0 (0.0%) |
| Material Moving | 0 (0.0%) | 0 (0.0%) |
| Total (Category) | 0 (0.0%) | 0 (0.0%) |
| Total (Overall) | 63 (49.6%) | 64 (50.4%) |
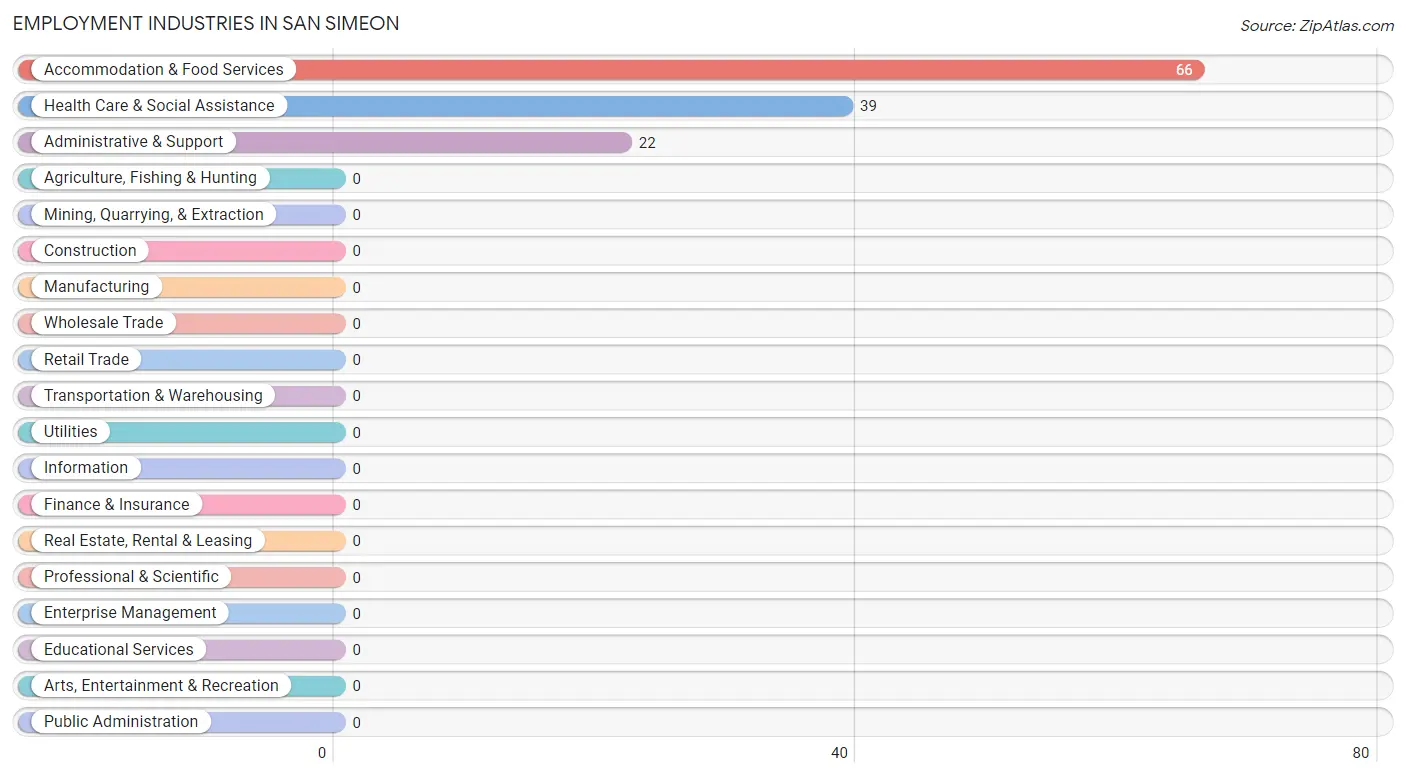
Employment Industries by Sex in San Simeon
Employment Industries in San Simeon
The major employment industries in San Simeon include Accommodation & Food Services (66 | 52.0%), Health Care & Social Assistance (39 | 30.7%), and Administrative & Support (22 | 17.3%).
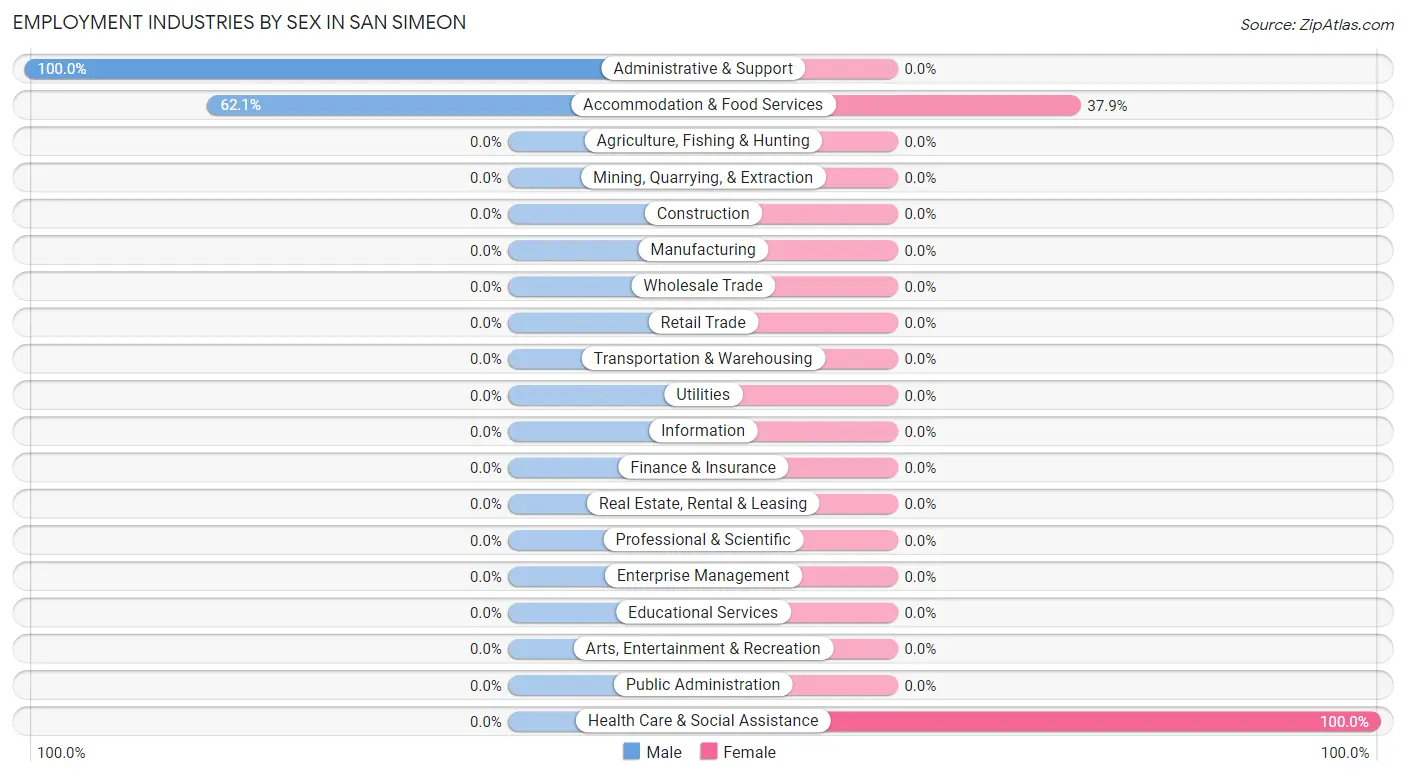
Employment Industries by Sex in San Simeon
The San Simeon industries that see more men than women are Administrative & Support (100.0%), and Accommodation & Food Services (62.1%), whereas the industries that tend to have a higher number of women are Health Care & Social Assistance (100.0%), and Accommodation & Food Services (37.9%).
| Industry | Male | Female |
| Agriculture, Fishing & Hunting | 0 (0.0%) | 0 (0.0%) |
| Mining, Quarrying, & Extraction | 0 (0.0%) | 0 (0.0%) |
| Construction | 0 (0.0%) | 0 (0.0%) |
| Manufacturing | 0 (0.0%) | 0 (0.0%) |
| Wholesale Trade | 0 (0.0%) | 0 (0.0%) |
| Retail Trade | 0 (0.0%) | 0 (0.0%) |
| Transportation & Warehousing | 0 (0.0%) | 0 (0.0%) |
| Utilities | 0 (0.0%) | 0 (0.0%) |
| Information | 0 (0.0%) | 0 (0.0%) |
| Finance & Insurance | 0 (0.0%) | 0 (0.0%) |
| Real Estate, Rental & Leasing | 0 (0.0%) | 0 (0.0%) |
| Professional & Scientific | 0 (0.0%) | 0 (0.0%) |
| Enterprise Management | 0 (0.0%) | 0 (0.0%) |
| Administrative & Support | 22 (100.0%) | 0 (0.0%) |
| Educational Services | 0 (0.0%) | 0 (0.0%) |
| Health Care & Social Assistance | 0 (0.0%) | 39 (100.0%) |
| Arts, Entertainment & Recreation | 0 (0.0%) | 0 (0.0%) |
| Accommodation & Food Services | 41 (62.1%) | 25 (37.9%) |
| Public Administration | 0 (0.0%) | 0 (0.0%) |
| Total | 63 (49.6%) | 64 (50.4%) |
Education in San Simeon
School Enrollment in San Simeon
The most common levels of schooling among the 65 students in San Simeon are elementary school (37 | 56.9%), and nursery / preschool (28 | 43.1%).
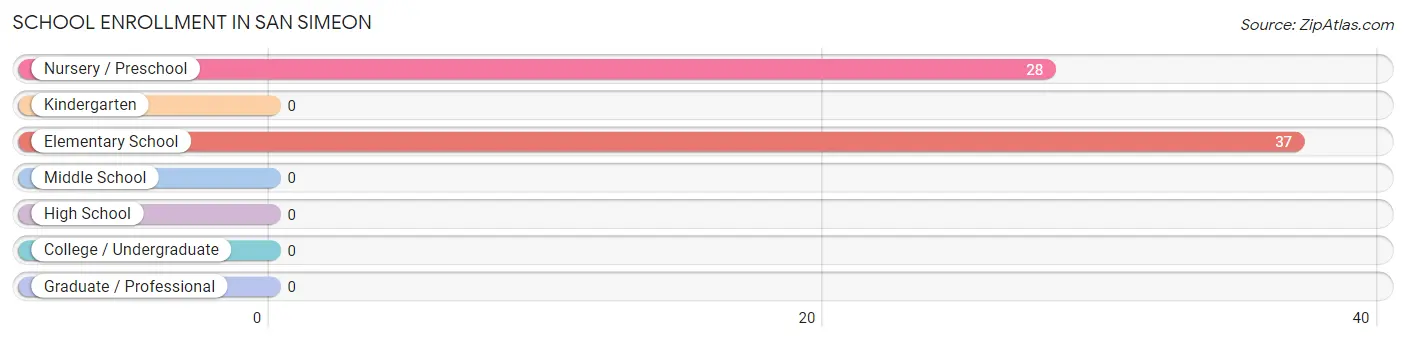
| School Level | # Students | % Students |
| Nursery / Preschool | 28 | 43.1% |
| Kindergarten | 0 | 0.0% |
| Elementary School | 37 | 56.9% |
| Middle School | 0 | 0.0% |
| High School | 0 | 0.0% |
| College / Undergraduate | 0 | 0.0% |
| Graduate / Professional | 0 | 0.0% |
| Total | 65 | 100.0% |
School Enrollment by Age by Funding Source in San Simeon
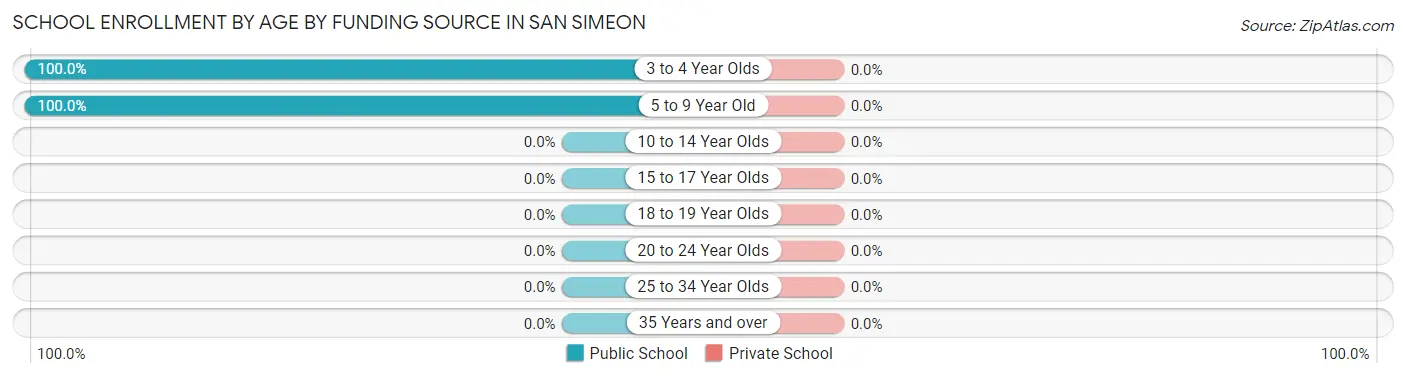
| Age Bracket | Public School | Private School |
| 3 to 4 Year Olds | 28 (100.0%) | 0 (0.0%) |
| 5 to 9 Year Old | 37 (100.0%) | 0 (0.0%) |
| 10 to 14 Year Olds | 0 (0.0%) | 0 (0.0%) |
| 15 to 17 Year Olds | 0 (0.0%) | 0 (0.0%) |
| 18 to 19 Year Olds | 0 (0.0%) | 0 (0.0%) |
| 20 to 24 Year Olds | 0 (0.0%) | 0 (0.0%) |
| 25 to 34 Year Olds | 0 (0.0%) | 0 (0.0%) |
| 35 Years and over | 0 (0.0%) | 0 (0.0%) |
| Total | 65 (100.0%) | 0 (0.0%) |
Educational Attainment by Field of Study in San Simeon
Business (21 | 50.0%), psychology (11 | 26.2%), and literature & languages (10 | 23.8%) are the most common fields of study among 42 individuals in San Simeon who have obtained a bachelor's degree or higher.
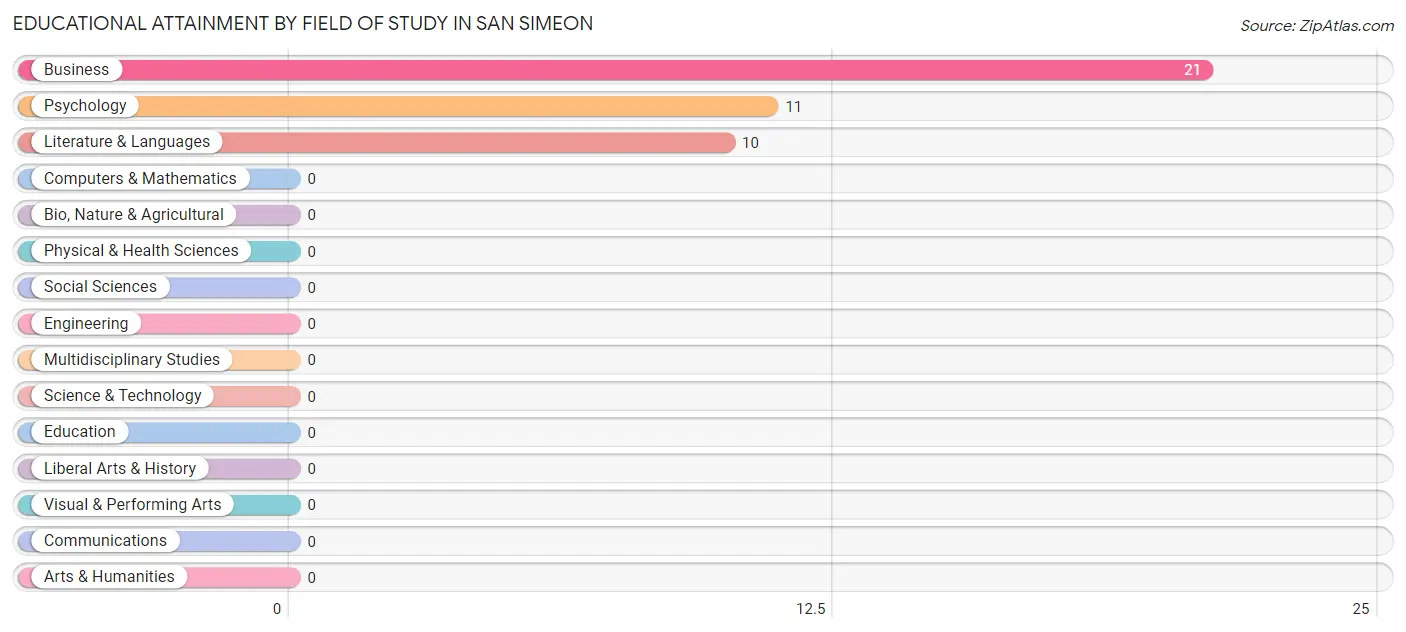
| Field of Study | # Graduates | % Graduates |
| Computers & Mathematics | 0 | 0.0% |
| Bio, Nature & Agricultural | 0 | 0.0% |
| Physical & Health Sciences | 0 | 0.0% |
| Psychology | 11 | 26.2% |
| Social Sciences | 0 | 0.0% |
| Engineering | 0 | 0.0% |
| Multidisciplinary Studies | 0 | 0.0% |
| Science & Technology | 0 | 0.0% |
| Business | 21 | 50.0% |
| Education | 0 | 0.0% |
| Literature & Languages | 10 | 23.8% |
| Liberal Arts & History | 0 | 0.0% |
| Visual & Performing Arts | 0 | 0.0% |
| Communications | 0 | 0.0% |
| Arts & Humanities | 0 | 0.0% |
| Total | 42 | 100.0% |
Transportation & Commute in San Simeon
Vehicle Availability by Sex in San Simeon
The most prevalent vehicle ownership categories in San Simeon are males with 2 vehicles (35, accounting for 55.6%) and females with 2 vehicles (26, making up 54.7%).
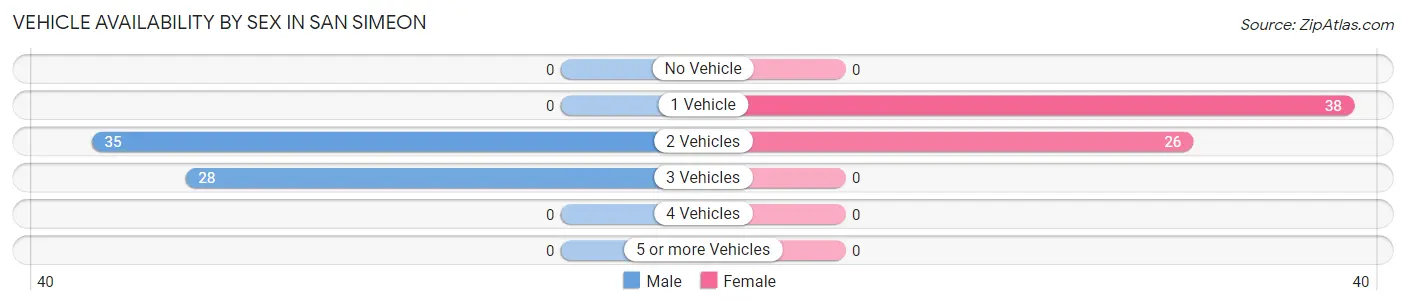
| Vehicles Available | Male | Female |
| No Vehicle | 0 (0.0%) | 0 (0.0%) |
| 1 Vehicle | 0 (0.0%) | 38 (59.4%) |
| 2 Vehicles | 35 (55.6%) | 26 (40.6%) |
| 3 Vehicles | 28 (44.4%) | 0 (0.0%) |
| 4 Vehicles | 0 (0.0%) | 0 (0.0%) |
| 5 or more Vehicles | 0 (0.0%) | 0 (0.0%) |
| Total | 63 (100.0%) | 64 (100.0%) |
Commute Time in San Simeon
The most frequently occuring commute durations in San Simeon are 20 to 24 minutes (65 commuters, 51.2%), 10 to 14 minutes (28 commuters, 22.1%), and 5 to 9 minutes (23 commuters, 18.1%).
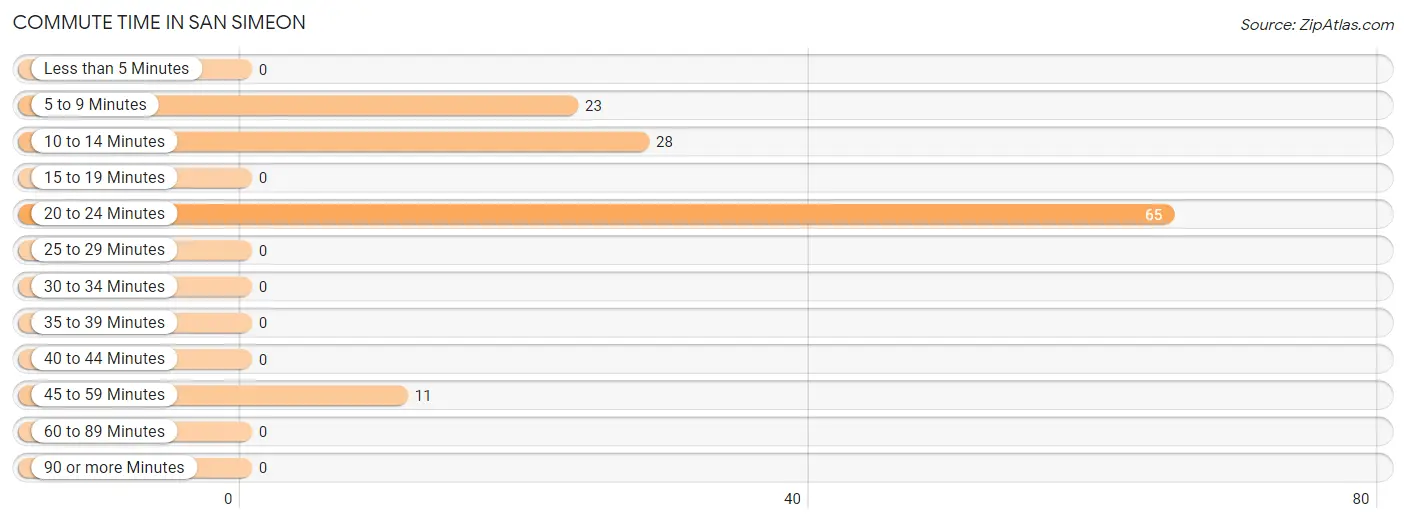
| Commute Time | # Commuters | % Commuters |
| Less than 5 Minutes | 0 | 0.0% |
| 5 to 9 Minutes | 23 | 18.1% |
| 10 to 14 Minutes | 28 | 22.1% |
| 15 to 19 Minutes | 0 | 0.0% |
| 20 to 24 Minutes | 65 | 51.2% |
| 25 to 29 Minutes | 0 | 0.0% |
| 30 to 34 Minutes | 0 | 0.0% |
| 35 to 39 Minutes | 0 | 0.0% |
| 40 to 44 Minutes | 0 | 0.0% |
| 45 to 59 Minutes | 11 | 8.7% |
| 60 to 89 Minutes | 0 | 0.0% |
| 90 or more Minutes | 0 | 0.0% |
Commute Time by Sex in San Simeon
The most common commute times in San Simeon are 20 to 24 minutes (50 commuters, 79.4%) for males and 10 to 14 minutes (28 commuters, 43.8%) for females.
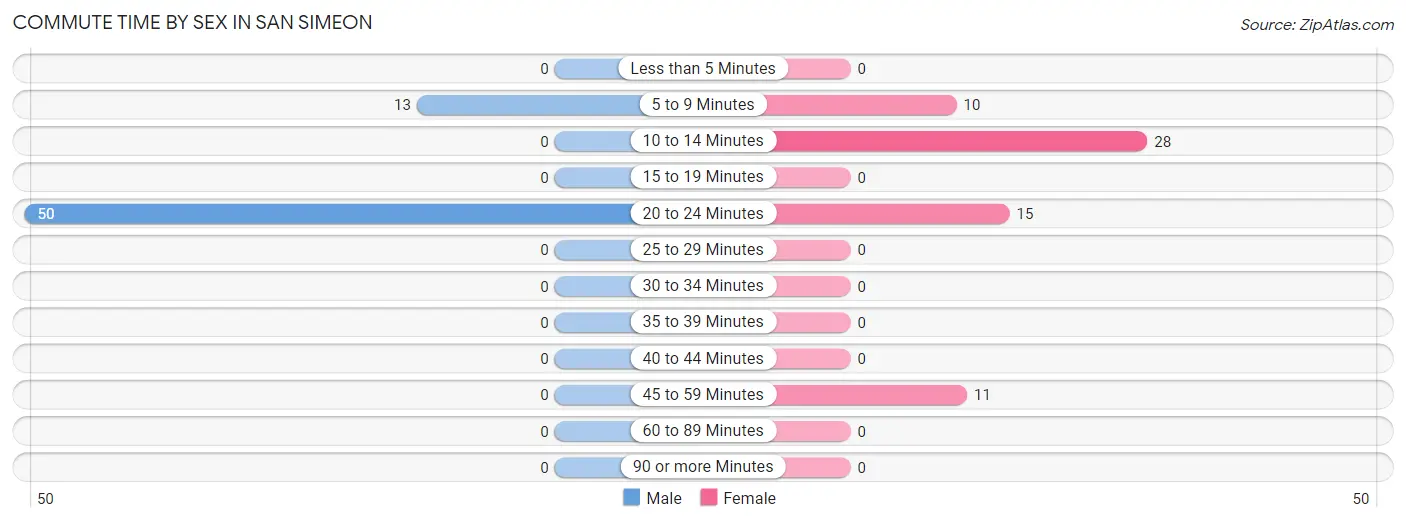
| Commute Time | Male | Female |
| Less than 5 Minutes | 0 (0.0%) | 0 (0.0%) |
| 5 to 9 Minutes | 13 (20.6%) | 10 (15.6%) |
| 10 to 14 Minutes | 0 (0.0%) | 28 (43.8%) |
| 15 to 19 Minutes | 0 (0.0%) | 0 (0.0%) |
| 20 to 24 Minutes | 50 (79.4%) | 15 (23.4%) |
| 25 to 29 Minutes | 0 (0.0%) | 0 (0.0%) |
| 30 to 34 Minutes | 0 (0.0%) | 0 (0.0%) |
| 35 to 39 Minutes | 0 (0.0%) | 0 (0.0%) |
| 40 to 44 Minutes | 0 (0.0%) | 0 (0.0%) |
| 45 to 59 Minutes | 0 (0.0%) | 11 (17.2%) |
| 60 to 89 Minutes | 0 (0.0%) | 0 (0.0%) |
| 90 or more Minutes | 0 (0.0%) | 0 (0.0%) |
Time of Departure to Work by Sex in San Simeon
The most frequent times of departure to work in San Simeon are 6:00 AM to 6:29 AM (28, 44.4%) for males and 8:00 AM to 8:29 AM (28, 43.8%) for females.
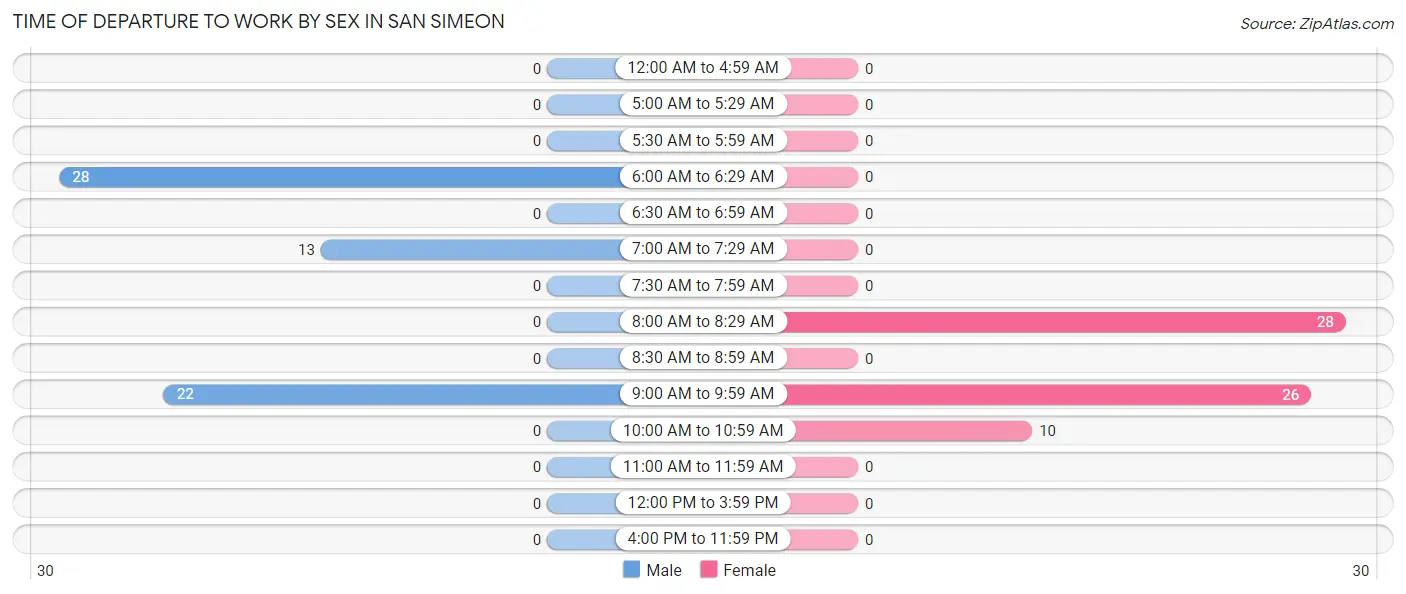
| Time of Departure | Male | Female |
| 12:00 AM to 4:59 AM | 0 (0.0%) | 0 (0.0%) |
| 5:00 AM to 5:29 AM | 0 (0.0%) | 0 (0.0%) |
| 5:30 AM to 5:59 AM | 0 (0.0%) | 0 (0.0%) |
| 6:00 AM to 6:29 AM | 28 (44.4%) | 0 (0.0%) |
| 6:30 AM to 6:59 AM | 0 (0.0%) | 0 (0.0%) |
| 7:00 AM to 7:29 AM | 13 (20.6%) | 0 (0.0%) |
| 7:30 AM to 7:59 AM | 0 (0.0%) | 0 (0.0%) |
| 8:00 AM to 8:29 AM | 0 (0.0%) | 28 (43.8%) |
| 8:30 AM to 8:59 AM | 0 (0.0%) | 0 (0.0%) |
| 9:00 AM to 9:59 AM | 22 (34.9%) | 26 (40.6%) |
| 10:00 AM to 10:59 AM | 0 (0.0%) | 10 (15.6%) |
| 11:00 AM to 11:59 AM | 0 (0.0%) | 0 (0.0%) |
| 12:00 PM to 3:59 PM | 0 (0.0%) | 0 (0.0%) |
| 4:00 PM to 11:59 PM | 0 (0.0%) | 0 (0.0%) |
| Total | 63 (100.0%) | 64 (100.0%) |
Housing Occupancy in San Simeon
Occupancy by Ownership in San Simeon
Of the total 170 dwellings in San Simeon, owner-occupied units account for 90 (52.9%), while renter-occupied units make up 80 (47.1%).
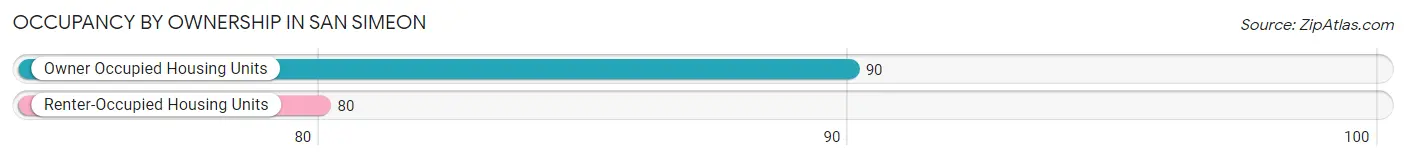
| Occupancy | # Housing Units | % Housing Units |
| Owner Occupied Housing Units | 90 | 52.9% |
| Renter-Occupied Housing Units | 80 | 47.1% |
| Total Occupied Housing Units | 170 | 100.0% |
Occupancy by Household Size in San Simeon
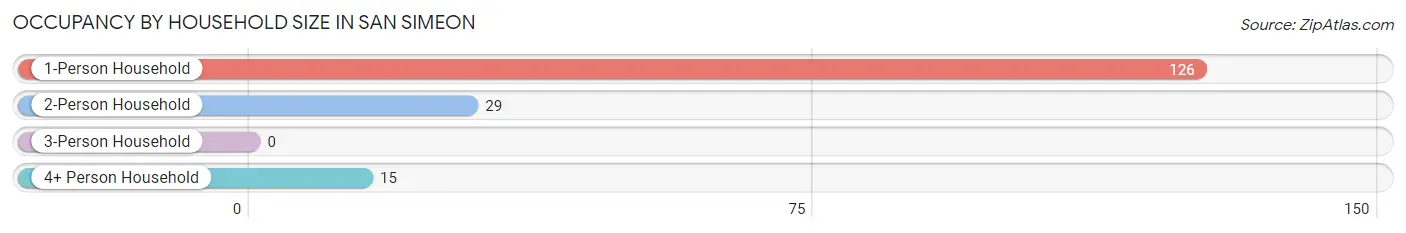
| Household Size | # Housing Units | % Housing Units |
| 1-Person Household | 126 | 74.1% |
| 2-Person Household | 29 | 17.1% |
| 3-Person Household | 0 | 0.0% |
| 4+ Person Household | 15 | 8.8% |
| Total Housing Units | 170 | 100.0% |
Occupancy by Ownership by Household Size in San Simeon
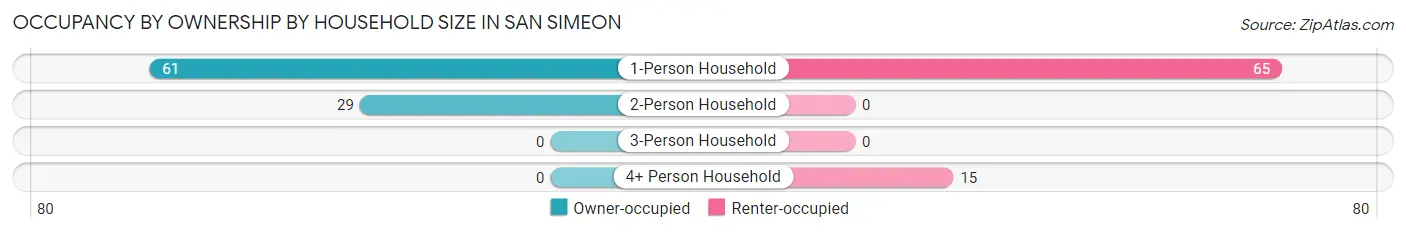
| Household Size | Owner-occupied | Renter-occupied |
| 1-Person Household | 61 (48.4%) | 65 (51.6%) |
| 2-Person Household | 29 (100.0%) | 0 (0.0%) |
| 3-Person Household | 0 (0.0%) | 0 (0.0%) |
| 4+ Person Household | 0 (0.0%) | 15 (100.0%) |
| Total Housing Units | 90 (52.9%) | 80 (47.1%) |
Occupancy by Educational Attainment in San Simeon
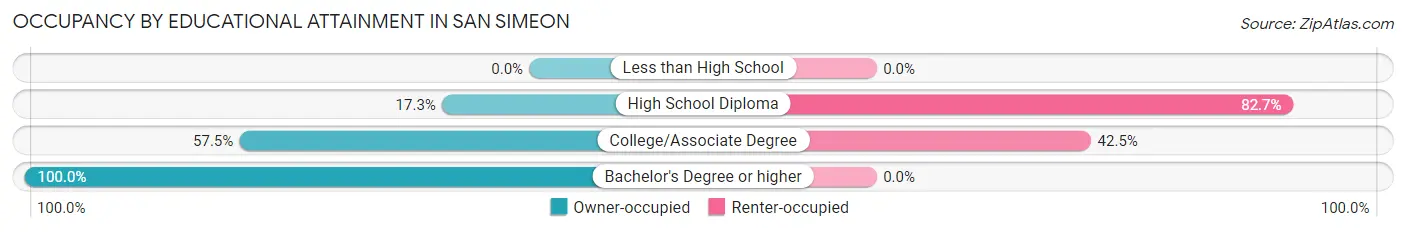
| Household Size | Owner-occupied | Renter-occupied |
| Less than High School | 0 (0.0%) | 0 (0.0%) |
| High School Diploma | 9 (17.3%) | 43 (82.7%) |
| College/Associate Degree | 50 (57.5%) | 37 (42.5%) |
| Bachelor's Degree or higher | 31 (100.0%) | 0 (0.0%) |
Occupancy by Age of Householder in San Simeon
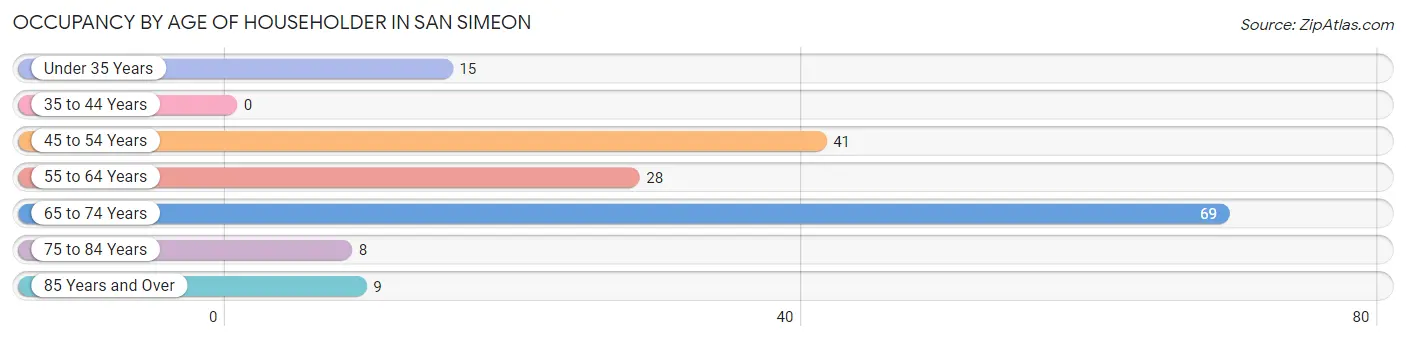
| Age Bracket | # Households | % Households |
| Under 35 Years | 15 | 8.8% |
| 35 to 44 Years | 0 | 0.0% |
| 45 to 54 Years | 41 | 24.1% |
| 55 to 64 Years | 28 | 16.5% |
| 65 to 74 Years | 69 | 40.6% |
| 75 to 84 Years | 8 | 4.7% |
| 85 Years and Over | 9 | 5.3% |
| Total | 170 | 100.0% |
Housing Finances in San Simeon
Median Income by Occupancy in San Simeon
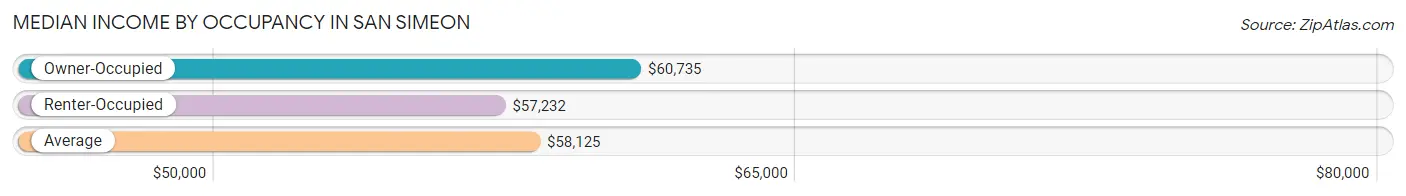
| Occupancy Type | # Households | Median Income |
| Owner-Occupied | 90 (52.9%) | $60,735 |
| Renter-Occupied | 80 (47.1%) | $57,232 |
| Average | 170 (100.0%) | $58,125 |
Occupancy by Householder Income Bracket in San Simeon
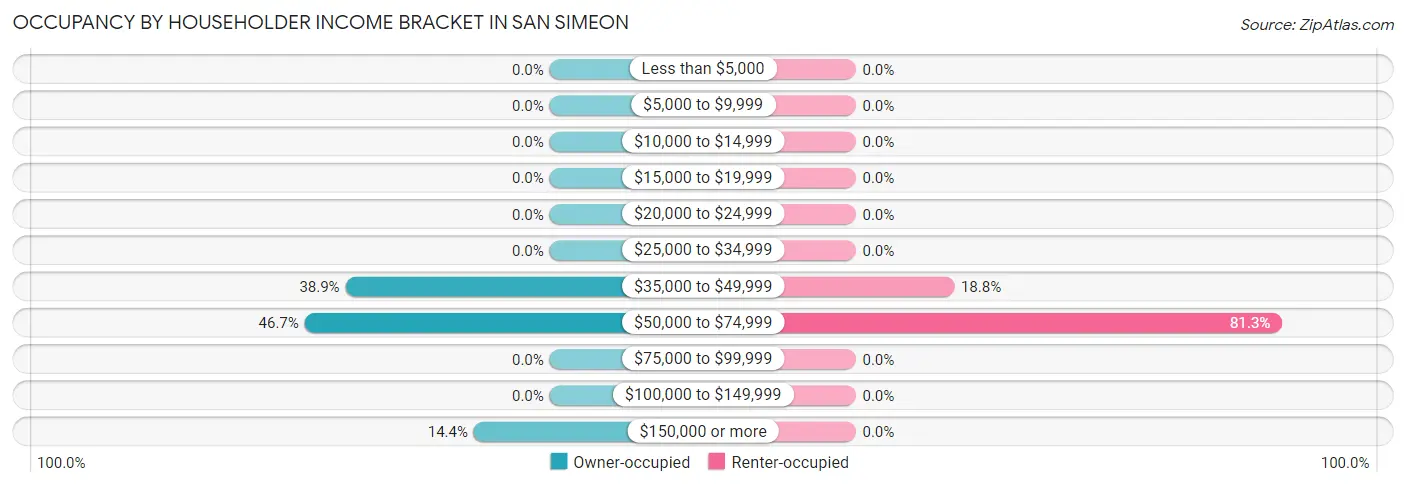
| Income Bracket | Owner-occupied | Renter-occupied |
| Less than $5,000 | 0 (0.0%) | 0 (0.0%) |
| $5,000 to $9,999 | 0 (0.0%) | 0 (0.0%) |
| $10,000 to $14,999 | 0 (0.0%) | 0 (0.0%) |
| $15,000 to $19,999 | 0 (0.0%) | 0 (0.0%) |
| $20,000 to $24,999 | 0 (0.0%) | 0 (0.0%) |
| $25,000 to $34,999 | 0 (0.0%) | 0 (0.0%) |
| $35,000 to $49,999 | 35 (38.9%) | 15 (18.8%) |
| $50,000 to $74,999 | 42 (46.7%) | 65 (81.2%) |
| $75,000 to $99,999 | 0 (0.0%) | 0 (0.0%) |
| $100,000 to $149,999 | 0 (0.0%) | 0 (0.0%) |
| $150,000 or more | 13 (14.4%) | 0 (0.0%) |
| Total | 90 (100.0%) | 80 (100.0%) |
Monthly Housing Cost Tiers in San Simeon
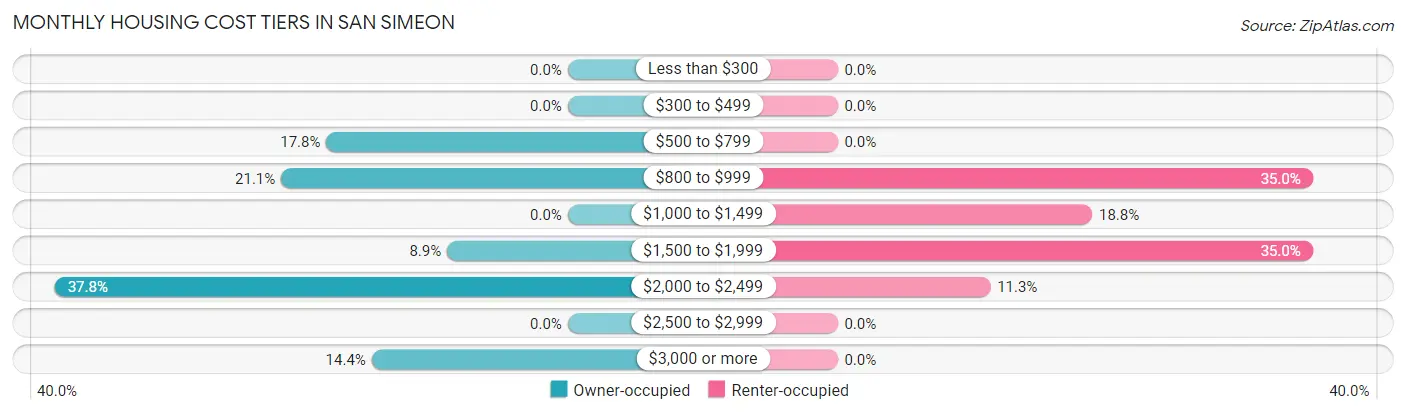
| Monthly Cost | Owner-occupied | Renter-occupied |
| Less than $300 | 0 (0.0%) | 0 (0.0%) |
| $300 to $499 | 0 (0.0%) | 0 (0.0%) |
| $500 to $799 | 16 (17.8%) | 0 (0.0%) |
| $800 to $999 | 19 (21.1%) | 28 (35.0%) |
| $1,000 to $1,499 | 0 (0.0%) | 15 (18.8%) |
| $1,500 to $1,999 | 8 (8.9%) | 28 (35.0%) |
| $2,000 to $2,499 | 34 (37.8%) | 9 (11.3%) |
| $2,500 to $2,999 | 0 (0.0%) | 0 (0.0%) |
| $3,000 or more | 13 (14.4%) | 0 (0.0%) |
| Total | 90 (100.0%) | 80 (100.0%) |
Physical Housing Characteristics in San Simeon
Housing Structures in San Simeon
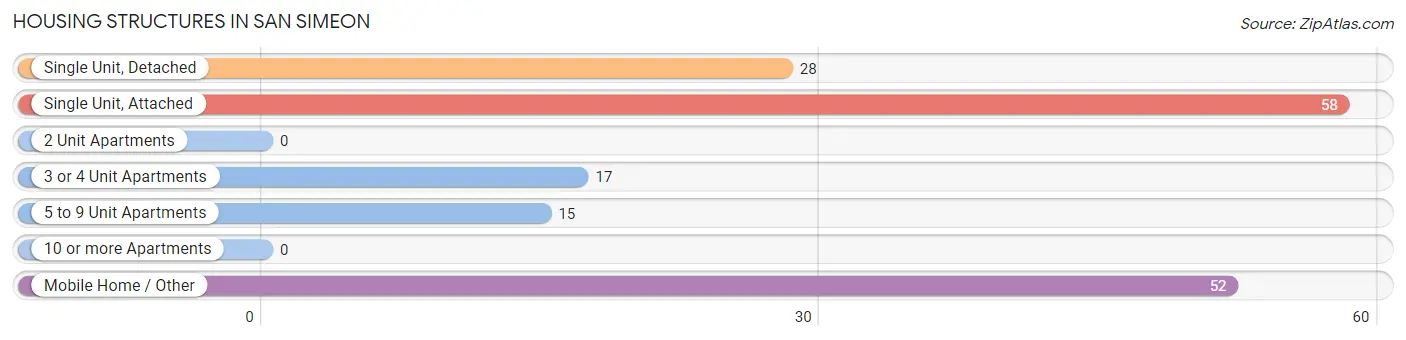
| Structure Type | # Housing Units | % Housing Units |
| Single Unit, Detached | 28 | 16.5% |
| Single Unit, Attached | 58 | 34.1% |
| 2 Unit Apartments | 0 | 0.0% |
| 3 or 4 Unit Apartments | 17 | 10.0% |
| 5 to 9 Unit Apartments | 15 | 8.8% |
| 10 or more Apartments | 0 | 0.0% |
| Mobile Home / Other | 52 | 30.6% |
| Total | 170 | 100.0% |
Housing Structures by Occupancy in San Simeon
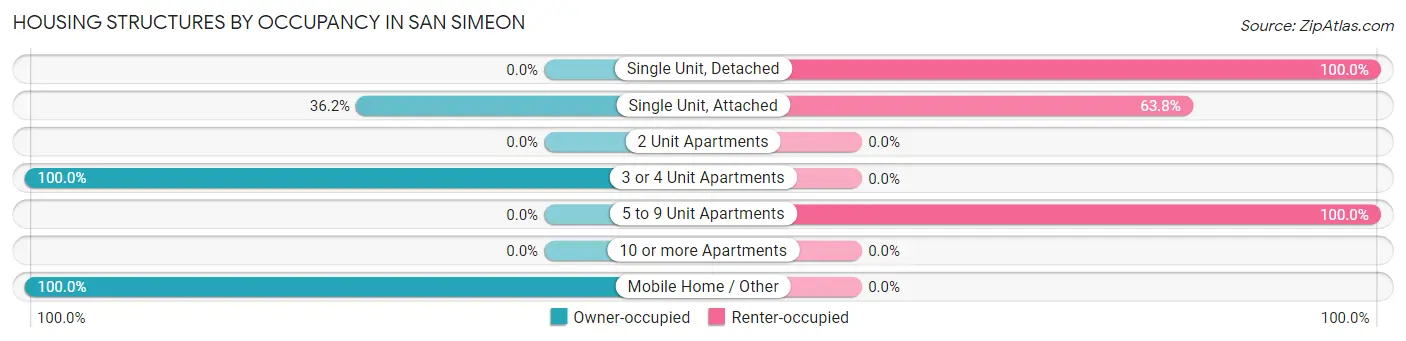
| Structure Type | Owner-occupied | Renter-occupied |
| Single Unit, Detached | 0 (0.0%) | 28 (100.0%) |
| Single Unit, Attached | 21 (36.2%) | 37 (63.8%) |
| 2 Unit Apartments | 0 (0.0%) | 0 (0.0%) |
| 3 or 4 Unit Apartments | 17 (100.0%) | 0 (0.0%) |
| 5 to 9 Unit Apartments | 0 (0.0%) | 15 (100.0%) |
| 10 or more Apartments | 0 (0.0%) | 0 (0.0%) |
| Mobile Home / Other | 52 (100.0%) | 0 (0.0%) |
| Total | 90 (52.9%) | 80 (47.1%) |
Housing Structures by Number of Rooms in San Simeon
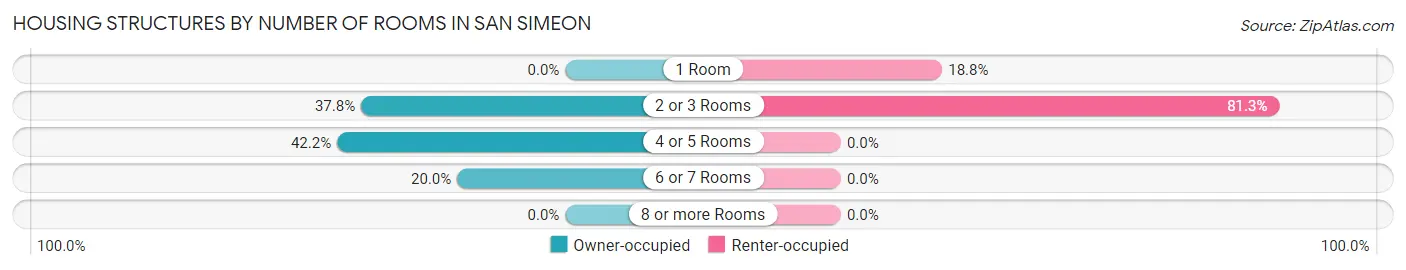
| Number of Rooms | Owner-occupied | Renter-occupied |
| 1 Room | 0 (0.0%) | 15 (18.8%) |
| 2 or 3 Rooms | 34 (37.8%) | 65 (81.2%) |
| 4 or 5 Rooms | 38 (42.2%) | 0 (0.0%) |
| 6 or 7 Rooms | 18 (20.0%) | 0 (0.0%) |
| 8 or more Rooms | 0 (0.0%) | 0 (0.0%) |
| Total | 90 (100.0%) | 80 (100.0%) |
Housing Structure by Heating Type in San Simeon
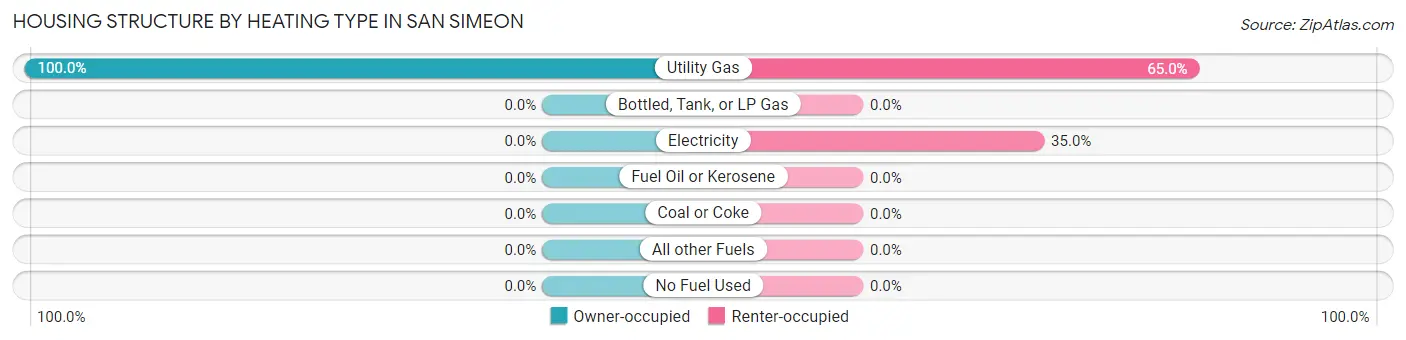
| Heating Type | Owner-occupied | Renter-occupied |
| Utility Gas | 90 (100.0%) | 52 (65.0%) |
| Bottled, Tank, or LP Gas | 0 (0.0%) | 0 (0.0%) |
| Electricity | 0 (0.0%) | 28 (35.0%) |
| Fuel Oil or Kerosene | 0 (0.0%) | 0 (0.0%) |
| Coal or Coke | 0 (0.0%) | 0 (0.0%) |
| All other Fuels | 0 (0.0%) | 0 (0.0%) |
| No Fuel Used | 0 (0.0%) | 0 (0.0%) |
| Total | 90 (100.0%) | 80 (100.0%) |
Household Vehicle Usage in San Simeon
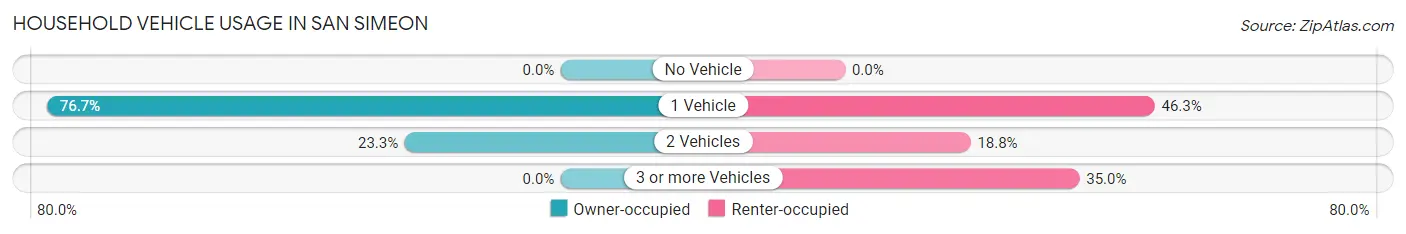
| Vehicles per Household | Owner-occupied | Renter-occupied |
| No Vehicle | 0 (0.0%) | 0 (0.0%) |
| 1 Vehicle | 69 (76.7%) | 37 (46.3%) |
| 2 Vehicles | 21 (23.3%) | 15 (18.8%) |
| 3 or more Vehicles | 0 (0.0%) | 28 (35.0%) |
| Total | 90 (100.0%) | 80 (100.0%) |
Real Estate & Mortgages in San Simeon
Real Estate and Mortgage Overview in San Simeon
| Characteristic | Without Mortgage | With Mortgage |
| Housing Units | 35 | 55 |
| Median Property Value | $246,900 | $290,400 |
| Median Household Income | $44,844 | $13 |
| Monthly Housing Costs | $815 | $13 |
| Real Estate Taxes | - | - |
Property Value by Mortgage Status in San Simeon
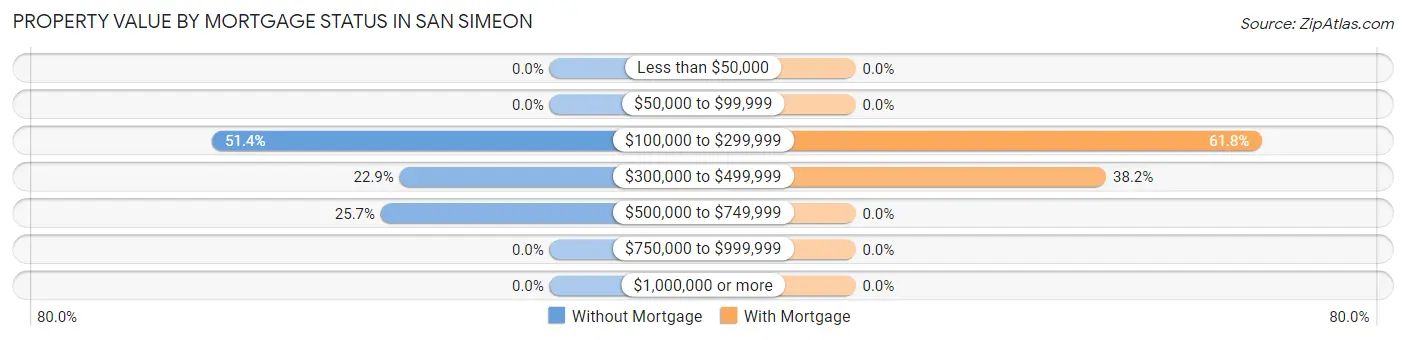
| Property Value | Without Mortgage | With Mortgage |
| Less than $50,000 | 0 (0.0%) | 0 (0.0%) |
| $50,000 to $99,999 | 0 (0.0%) | 0 (0.0%) |
| $100,000 to $299,999 | 18 (51.4%) | 34 (61.8%) |
| $300,000 to $499,999 | 8 (22.9%) | 21 (38.2%) |
| $500,000 to $749,999 | 9 (25.7%) | 0 (0.0%) |
| $750,000 to $999,999 | 0 (0.0%) | 0 (0.0%) |
| $1,000,000 or more | 0 (0.0%) | 0 (0.0%) |
| Total | 35 (100.0%) | 55 (100.0%) |
Household Income by Mortgage Status in San Simeon
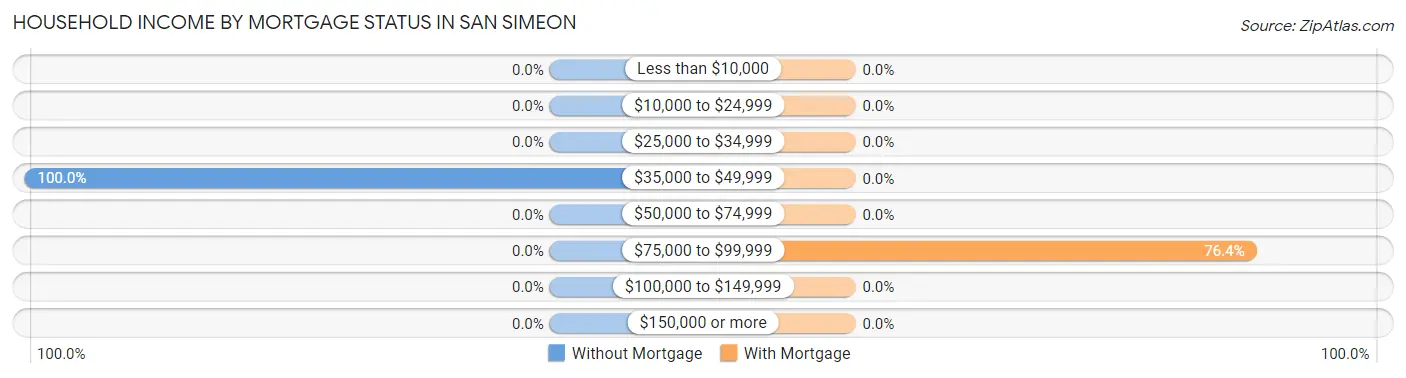
| Household Income | Without Mortgage | With Mortgage |
| Less than $10,000 | 0 (0.0%) | 0 (0.0%) |
| $10,000 to $24,999 | 0 (0.0%) | 0 (0.0%) |
| $25,000 to $34,999 | 0 (0.0%) | 0 (0.0%) |
| $35,000 to $49,999 | 35 (100.0%) | 0 (0.0%) |
| $50,000 to $74,999 | 0 (0.0%) | 0 (0.0%) |
| $75,000 to $99,999 | 0 (0.0%) | 42 (76.4%) |
| $100,000 to $149,999 | 0 (0.0%) | 0 (0.0%) |
| $150,000 or more | 0 (0.0%) | 0 (0.0%) |
| Total | 35 (100.0%) | 55 (100.0%) |
Property Value to Household Income Ratio in San Simeon
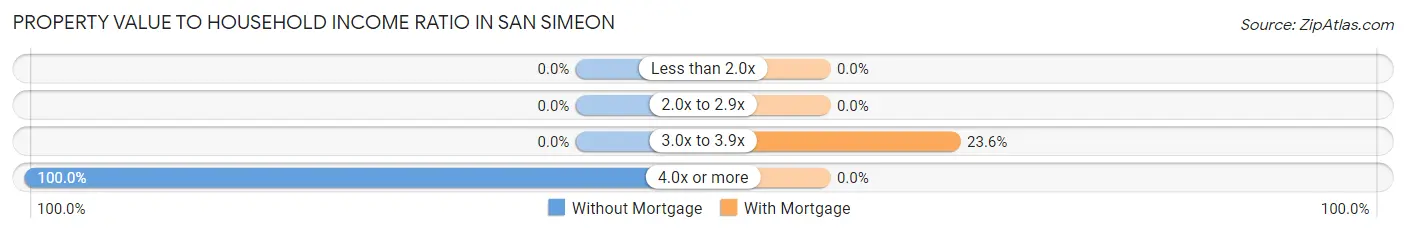
| Value-to-Income Ratio | Without Mortgage | With Mortgage |
| Less than 2.0x | 0 (0.0%) | 0 (0.0%) |
| 2.0x to 2.9x | 0 (0.0%) | 0 (0.0%) |
| 3.0x to 3.9x | 0 (0.0%) | 13 (23.6%) |
| 4.0x or more | 35 (100.0%) | 0 (0.0%) |
| Total | 35 (100.0%) | 55 (100.0%) |
Real Estate Taxes by Mortgage Status in San Simeon
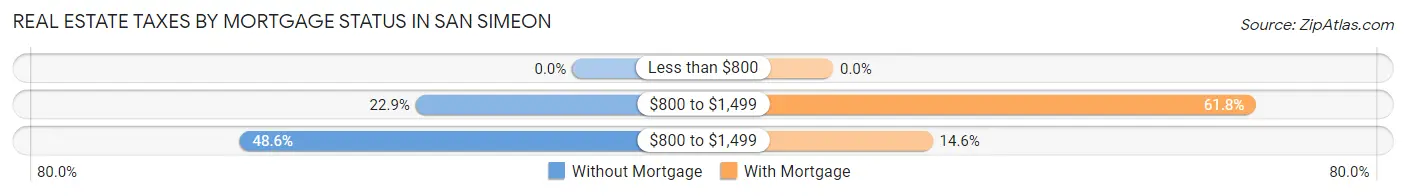
| Property Taxes | Without Mortgage | With Mortgage |
| Less than $800 | 0 (0.0%) | 0 (0.0%) |
| $800 to $1,499 | 8 (22.9%) | 34 (61.8%) |
| $800 to $1,499 | 17 (48.6%) | 8 (14.5%) |
| Total | 35 (100.0%) | 55 (100.0%) |
Health & Disability in San Simeon
Health Insurance Coverage by Age in San Simeon
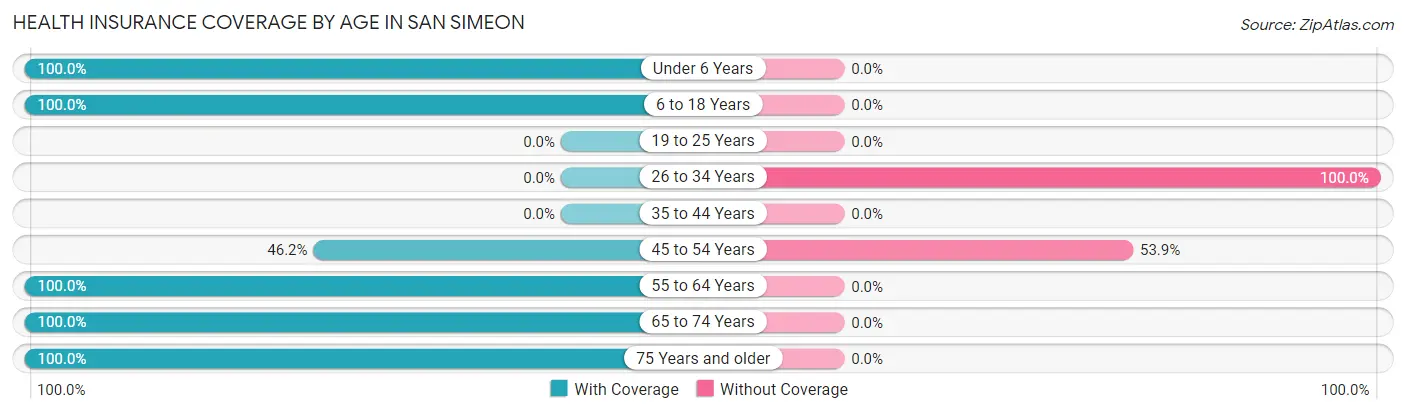
| Age Bracket | With Coverage | Without Coverage |
| Under 6 Years | 52 (100.0%) | 0 (0.0%) |
| 6 to 18 Years | 37 (100.0%) | 0 (0.0%) |
| 19 to 25 Years | 0 (0.0%) | 0 (0.0%) |
| 26 to 34 Years | 0 (0.0%) | 37 (100.0%) |
| 35 to 44 Years | 0 (0.0%) | 0 (0.0%) |
| 45 to 54 Years | 24 (46.2%) | 28 (53.8%) |
| 55 to 64 Years | 28 (100.0%) | 0 (0.0%) |
| 65 to 74 Years | 74 (100.0%) | 0 (0.0%) |
| 75 Years and older | 27 (100.0%) | 0 (0.0%) |
| Total | 242 (78.8%) | 65 (21.2%) |
Health Insurance Coverage by Citizenship Status in San Simeon
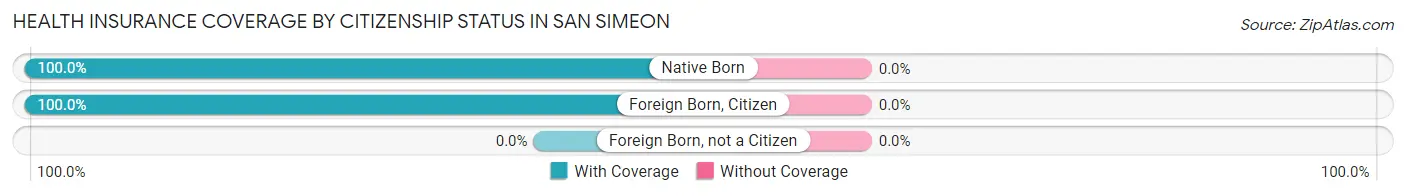
| Citizenship Status | With Coverage | Without Coverage |
| Native Born | 52 (100.0%) | 0 (0.0%) |
| Foreign Born, Citizen | 37 (100.0%) | 0 (0.0%) |
| Foreign Born, not a Citizen | 0 (0.0%) | 0 (0.0%) |
Health Insurance Coverage by Household Income in San Simeon
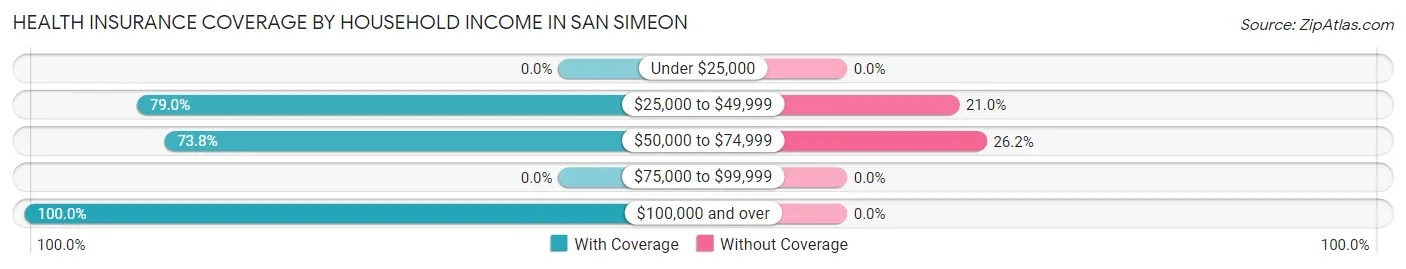
| Household Income | With Coverage | Without Coverage |
| Under $25,000 | 0 (0.0%) | 0 (0.0%) |
| $25,000 to $49,999 | 139 (79.0%) | 37 (21.0%) |
| $50,000 to $74,999 | 79 (73.8%) | 28 (26.2%) |
| $75,000 to $99,999 | 0 (0.0%) | 0 (0.0%) |
| $100,000 and over | 24 (100.0%) | 0 (0.0%) |
Public vs Private Health Insurance Coverage by Age in San Simeon
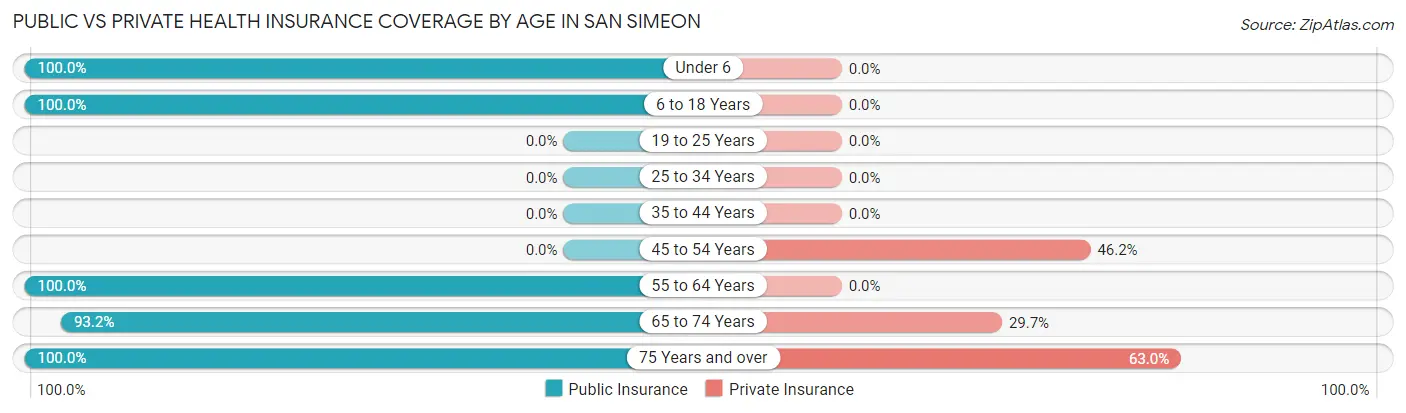
| Age Bracket | Public Insurance | Private Insurance |
| Under 6 | 52 (100.0%) | 0 (0.0%) |
| 6 to 18 Years | 37 (100.0%) | 0 (0.0%) |
| 19 to 25 Years | 0 (0.0%) | 0 (0.0%) |
| 25 to 34 Years | 0 (0.0%) | 0 (0.0%) |
| 35 to 44 Years | 0 (0.0%) | 0 (0.0%) |
| 45 to 54 Years | 0 (0.0%) | 24 (46.2%) |
| 55 to 64 Years | 28 (100.0%) | 0 (0.0%) |
| 65 to 74 Years | 69 (93.2%) | 22 (29.7%) |
| 75 Years and over | 27 (100.0%) | 17 (63.0%) |
| Total | 213 (69.4%) | 63 (20.5%) |
Disability Status by Sex by Age in San Simeon
| Age Bracket | Male | Female |
| Under 5 Years | 0 (0.0%) | 0 (0.0%) |
| 5 to 17 Years | 0 (0.0%) | 0 (0.0%) |
| 18 to 34 Years | 0 (0.0%) | 0 (0.0%) |
| 35 to 64 Years | 0 (0.0%) | 0 (0.0%) |
| 65 to 74 Years | 0 (0.0%) | 0 (0.0%) |
| 75 Years and over | 0 (0.0%) | 0 (0.0%) |
Disability Class by Sex by Age in San Simeon
Disability Class: Hearing Difficulty
| Age Bracket | Male | Female |
| Under 5 Years | 0 (0.0%) | 0 (0.0%) |
| 5 to 17 Years | 0 (0.0%) | 0 (0.0%) |
| 18 to 34 Years | 0 (0.0%) | 0 (0.0%) |
| 35 to 64 Years | 0 (0.0%) | 0 (0.0%) |
| 65 to 74 Years | 0 (0.0%) | 0 (0.0%) |
| 75 Years and over | 0 (0.0%) | 0 (0.0%) |
Disability Class: Vision Difficulty
| Age Bracket | Male | Female |
| Under 5 Years | 0 (0.0%) | 0 (0.0%) |
| 5 to 17 Years | 0 (0.0%) | 0 (0.0%) |
| 18 to 34 Years | 0 (0.0%) | 0 (0.0%) |
| 35 to 64 Years | 0 (0.0%) | 0 (0.0%) |
| 65 to 74 Years | 0 (0.0%) | 0 (0.0%) |
| 75 Years and over | 0 (0.0%) | 0 (0.0%) |
Disability Class: Cognitive Difficulty

| Age Bracket | Male | Female |
| 5 to 17 Years | 0 (0.0%) | 0 (0.0%) |
| 18 to 34 Years | 0 (0.0%) | 0 (0.0%) |
| 35 to 64 Years | 0 (0.0%) | 0 (0.0%) |
| 65 to 74 Years | 0 (0.0%) | 0 (0.0%) |
| 75 Years and over | 0 (0.0%) | 0 (0.0%) |
Disability Class: Ambulatory Difficulty
| Age Bracket | Male | Female |
| 5 to 17 Years | 0 (0.0%) | 0 (0.0%) |
| 18 to 34 Years | 0 (0.0%) | 0 (0.0%) |
| 35 to 64 Years | 0 (0.0%) | 0 (0.0%) |
| 65 to 74 Years | 0 (0.0%) | 0 (0.0%) |
| 75 Years and over | 0 (0.0%) | 0 (0.0%) |
Disability Class: Self-Care Difficulty
| Age Bracket | Male | Female |
| 5 to 17 Years | 0 (0.0%) | 0 (0.0%) |
| 18 to 34 Years | 0 (0.0%) | 0 (0.0%) |
| 35 to 64 Years | 0 (0.0%) | 0 (0.0%) |
| 65 to 74 Years | 0 (0.0%) | 0 (0.0%) |
| 75 Years and over | 0 (0.0%) | 0 (0.0%) |
Technology Access in San Simeon
Computing Device Access in San Simeon
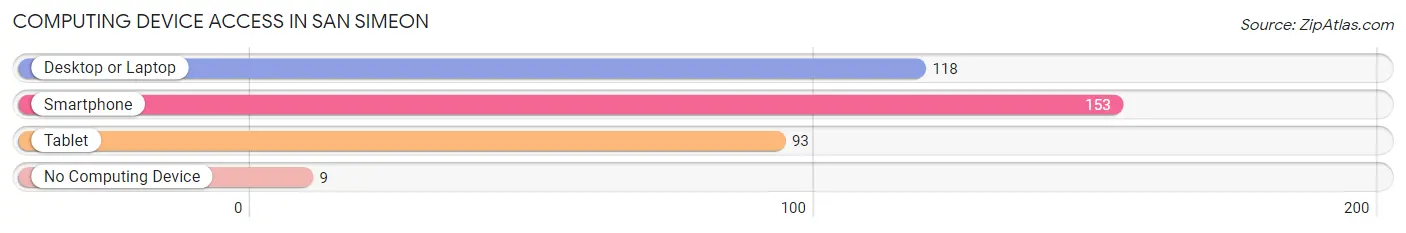
| Device Type | # Households | % Households |
| Desktop or Laptop | 118 | 69.4% |
| Smartphone | 153 | 90.0% |
| Tablet | 93 | 54.7% |
| No Computing Device | 9 | 5.3% |
| Total | 170 | 100.0% |
Internet Access in San Simeon
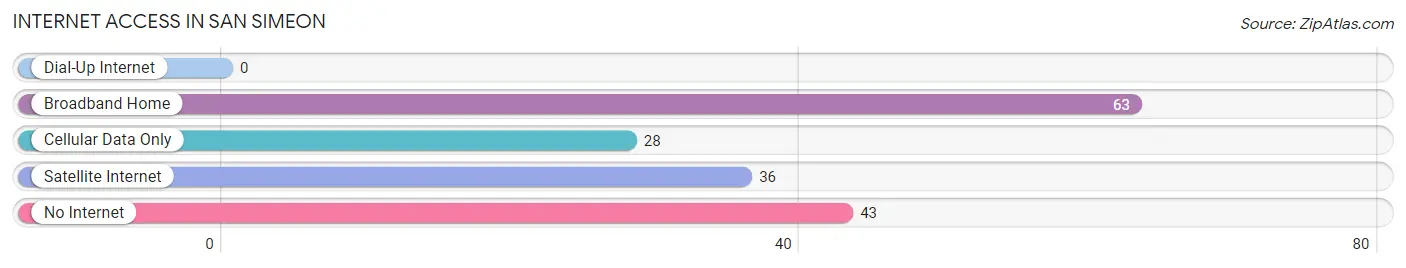
| Internet Type | # Households | % Households |
| Dial-Up Internet | 0 | 0.0% |
| Broadband Home | 63 | 37.1% |
| Cellular Data Only | 28 | 16.5% |
| Satellite Internet | 36 | 21.2% |
| No Internet | 43 | 25.3% |
| Total | 170 | 100.0% |
San Simeon Summary
San Simeon is a small unincorporated community located in San Luis Obispo County, California. It is situated on the Pacific Coast, approximately halfway between Los Angeles and San Francisco. The community is best known for its proximity to Hearst Castle, a National Historic Landmark and popular tourist destination.
History
The area now known as San Simeon was originally inhabited by the Chumash people, who lived in the area for thousands of years. The first European settlers arrived in the area in the late 1700s, and the town was officially founded in 1875. The town was named after Saint Simeon, a Christian saint who was believed to have lived in the area.
In the late 1800s, the area began to attract wealthy visitors from the East Coast, including newspaper magnate William Randolph Hearst. Hearst purchased a large tract of land in the area and began construction on his famous estate, Hearst Castle, in 1919. The castle was completed in 1947 and is now a popular tourist destination.
Geography
San Simeon is located in San Luis Obispo County, California, on the Pacific Coast. It is situated approximately halfway between Los Angeles and San Francisco. The town is located on a coastal plain, with the Santa Lucia Mountains to the east and the Pacific Ocean to the west. The climate in the area is mild, with temperatures rarely exceeding 80 degrees Fahrenheit.
Economy
The economy of San Simeon is largely driven by tourism. The town is home to Hearst Castle, a popular tourist destination that attracts thousands of visitors each year. The castle is owned by the Hearst Corporation, which also owns several other businesses in the area, including a hotel and a restaurant. In addition, the town is home to several small businesses, including restaurants, shops, and galleries.
Demographics
As of the 2010 census, the population of San Simeon was 591. The racial makeup of the town was 87.3% White, 0.2% African American, 0.7% Native American, 0.7% Asian, 0.2% Pacific Islander, 8.2% from other races, and 2.7% from two or more races. The median household income in the town was $45,000, and the median family income was $50,000. The per capita income in the town was $20,000.
Common Questions
What is Per Capita Income in San Simeon?
Per Capita income in San Simeon is $34,805.
What is the Median Household income in San Simeon?
Median Household Income in San Simeon is $58,125.
What is Inequality or Gini Index in San Simeon?
Inequality or Gini Index in San Simeon is 0.20.
What is the Total Population of San Simeon?
Total Population of San Simeon is 307.
What is the Total Male Population of San Simeon?
Total Male Population of San Simeon is 153.
What is the Total Female Population of San Simeon?
Total Female Population of San Simeon is 154.
What is the Ratio of Males per 100 Females in San Simeon?
There are 99.35 Males per 100 Females in San Simeon.
What is the Ratio of Females per 100 Males in San Simeon?
There are 100.65 Females per 100 Males in San Simeon.
What is the Median Population Age in San Simeon?
Median Population Age in San Simeon is 48.0 Years.
What is the Average Family Size in San Simeon
Average Family Size in San Simeon is 4.1 People.
What is the Average Household Size in San Simeon
Average Household Size in San Simeon is 1.8 People.
How Large is the Labor Force in San Simeon?
There are 127 People in the Labor Forcein in San Simeon.
What is the Percentage of People in the Labor Force in San Simeon?
58.3% of People are in the Labor Force in San Simeon.