San Miguel CDP Contra Costa County, CA Map & Demographics
San Miguel CDP Contra Costa County Overview
$102,486
PER CAPITA INCOME
$250,001
AVG FAMILY INCOME
$238,472
AVG HOUSEHOLD INCOME
4.0%
WAGE / INCOME GAP [ % ]
96.0¢/ $1
WAGE / INCOME GAP [ $ ]
0.43
INEQUALITY / GINI INDEX
4,004
TOTAL POPULATION
2,072
MALE POPULATION
1,932
FEMALE POPULATION
107.25
MALES / 100 FEMALES
93.24
FEMALES / 100 MALES
46.8
MEDIAN AGE
3.2
AVG FAMILY SIZE
3.0
AVG HOUSEHOLD SIZE
2,069
LABOR FORCE [ PEOPLE ]
66.2%
PERCENT IN LABOR FORCE
3.1%
UNEMPLOYMENT RATE
Income in San Miguel CDP Contra Costa County
Income Overview in San Miguel CDP Contra Costa County
Per Capita Income in San Miguel CDP Contra Costa County is $102,486, while median incomes of families and households are $250,001 and $238,472 respectively.
| Characteristic | Number | Measure |
| Per Capita Income | 4,004 | $102,486 |
| Median Family Income | 1,148 | $250,001 |
| Mean Family Income | 1,148 | $331,084 |
| Median Household Income | 1,349 | $238,472 |
| Mean Household Income | 1,349 | $296,280 |
| Income Deficit | 1,148 | $0 |
| Wage / Income Gap (%) | 4,004 | 3.99% |
| Wage / Income Gap ($) | 4,004 | 96.01¢ per $1 |
| Gini / Inequality Index | 4,004 | 0.43 |
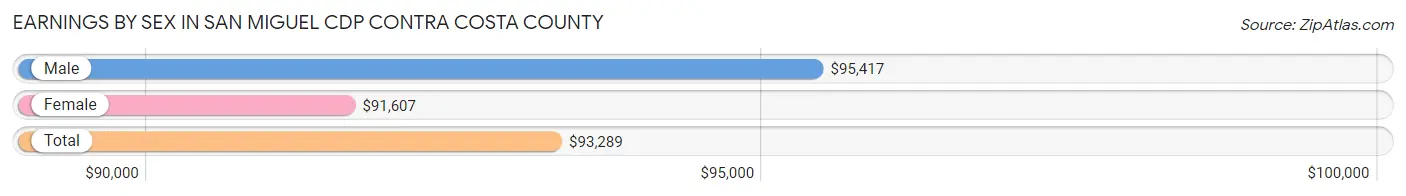
Earnings by Sex in San Miguel CDP Contra Costa County
Average Earnings in San Miguel CDP Contra Costa County are $93,289, $95,417 for men and $91,607 for women, a difference of 4.0%.
| Sex | Number | Average Earnings |
| Male | 1,176 (53.6%) | $95,417 |
| Female | 1,018 (46.4%) | $91,607 |
| Total | 2,194 (100.0%) | $93,289 |
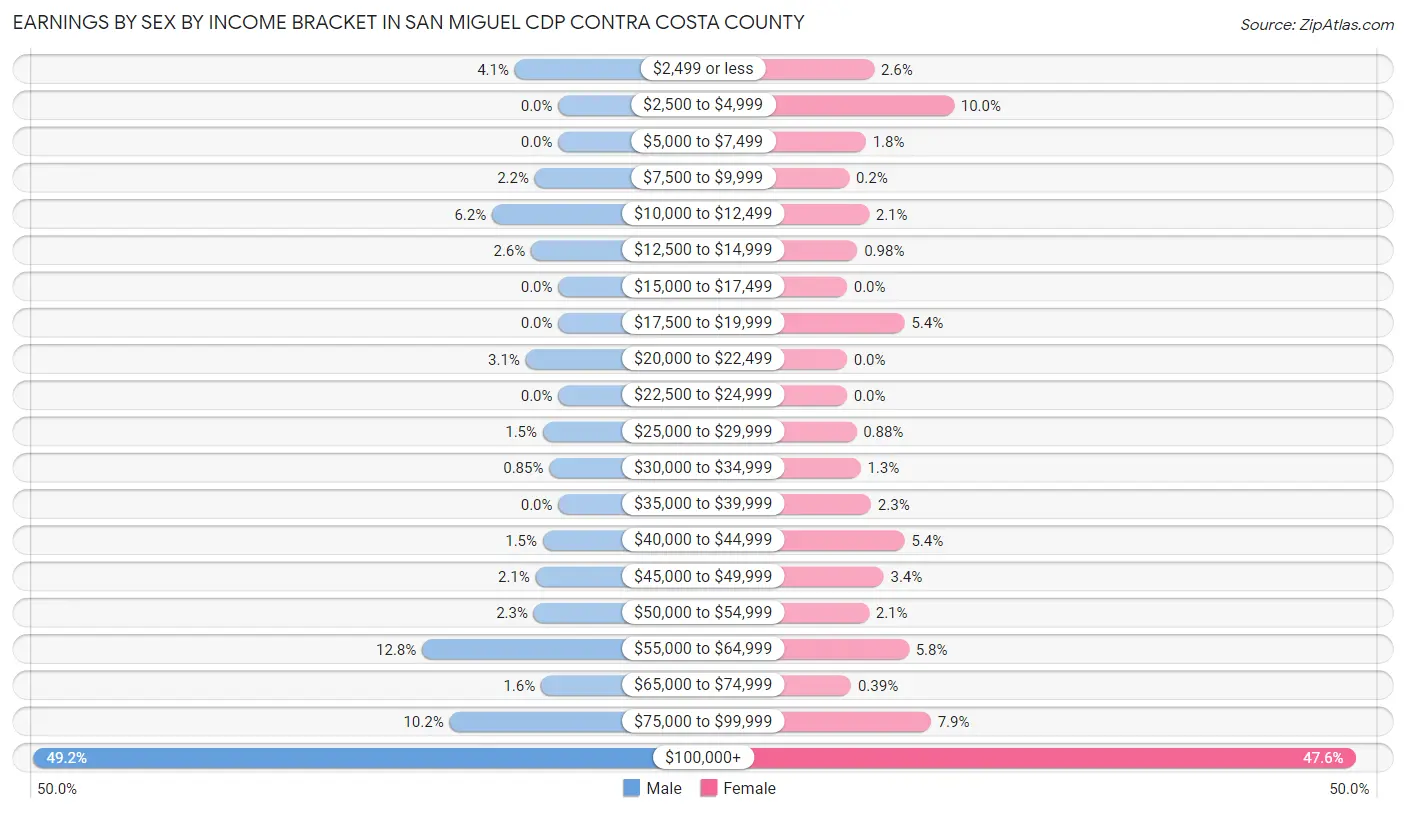
Earnings by Sex by Income Bracket in San Miguel CDP Contra Costa County
The most common earnings brackets in San Miguel CDP Contra Costa County are $100,000+ for men (578 | 49.1%) and $100,000+ for women (485 | 47.6%).
| Income | Male | Female |
| $2,499 or less | 48 (4.1%) | 26 (2.5%) |
| $2,500 to $4,999 | 0 (0.0%) | 102 (10.0%) |
| $5,000 to $7,499 | 0 (0.0%) | 18 (1.8%) |
| $7,500 to $9,999 | 26 (2.2%) | 2 (0.2%) |
| $10,000 to $12,499 | 73 (6.2%) | 21 (2.1%) |
| $12,500 to $14,999 | 30 (2.5%) | 10 (1.0%) |
| $15,000 to $17,499 | 0 (0.0%) | 0 (0.0%) |
| $17,500 to $19,999 | 0 (0.0%) | 55 (5.4%) |
| $20,000 to $22,499 | 36 (3.1%) | 0 (0.0%) |
| $22,500 to $24,999 | 0 (0.0%) | 0 (0.0%) |
| $25,000 to $29,999 | 17 (1.5%) | 9 (0.9%) |
| $30,000 to $34,999 | 10 (0.9%) | 13 (1.3%) |
| $35,000 to $39,999 | 0 (0.0%) | 23 (2.3%) |
| $40,000 to $44,999 | 17 (1.5%) | 55 (5.4%) |
| $45,000 to $49,999 | 25 (2.1%) | 35 (3.4%) |
| $50,000 to $54,999 | 27 (2.3%) | 21 (2.1%) |
| $55,000 to $64,999 | 150 (12.8%) | 59 (5.8%) |
| $65,000 to $74,999 | 19 (1.6%) | 4 (0.4%) |
| $75,000 to $99,999 | 120 (10.2%) | 80 (7.9%) |
| $100,000+ | 578 (49.1%) | 485 (47.6%) |
| Total | 1,176 (100.0%) | 1,018 (100.0%) |
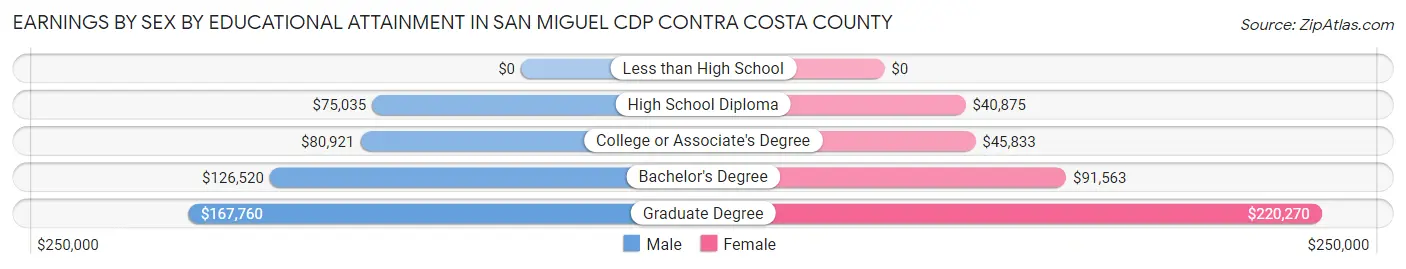
Earnings by Sex by Educational Attainment in San Miguel CDP Contra Costa County
Average earnings in San Miguel CDP Contra Costa County are $120,104 for men and $104,500 for women, a difference of 13.0%. Men with an educational attainment of graduate degree enjoy the highest average annual earnings of $167,760, while those with high school diploma education earn the least with $75,035. Women with an educational attainment of graduate degree earn the most with the average annual earnings of $220,270, while those with high school diploma education have the smallest earnings of $40,875.
| Educational Attainment | Male Income | Female Income |
| Less than High School | - | - |
| High School Diploma | $75,035 | $40,875 |
| College or Associate's Degree | $80,921 | $45,833 |
| Bachelor's Degree | $126,520 | $91,563 |
| Graduate Degree | $167,760 | $220,270 |
| Total | $120,104 | $104,500 |
Family Income in San Miguel CDP Contra Costa County
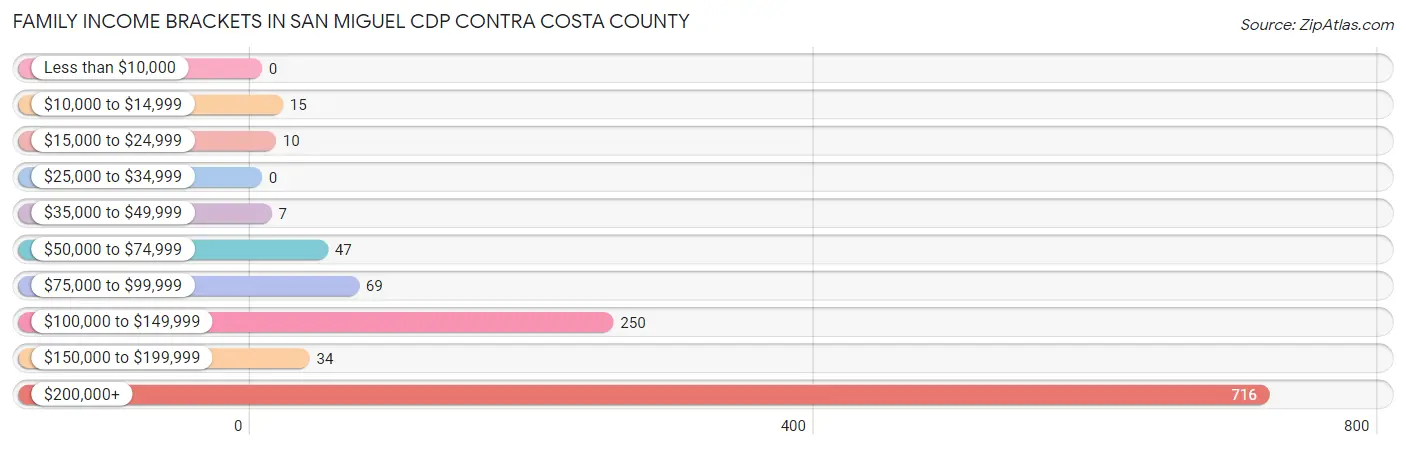
Family Income Brackets in San Miguel CDP Contra Costa County
According to the San Miguel CDP Contra Costa County family income data, there are 716 families falling into the $200,000+ income range, which is the most common income bracket and makes up 62.4% of all families.
| Income Bracket | # Families | % Families |
| Less than $10,000 | 0 | 0.0% |
| $10,000 to $14,999 | 15 | 1.3% |
| $15,000 to $24,999 | 10 | 0.9% |
| $25,000 to $34,999 | 0 | 0.0% |
| $35,000 to $49,999 | 7 | 0.6% |
| $50,000 to $74,999 | 47 | 4.1% |
| $75,000 to $99,999 | 69 | 6.0% |
| $100,000 to $149,999 | 250 | 21.8% |
| $150,000 to $199,999 | 34 | 3.0% |
| $200,000+ | 716 | 62.4% |
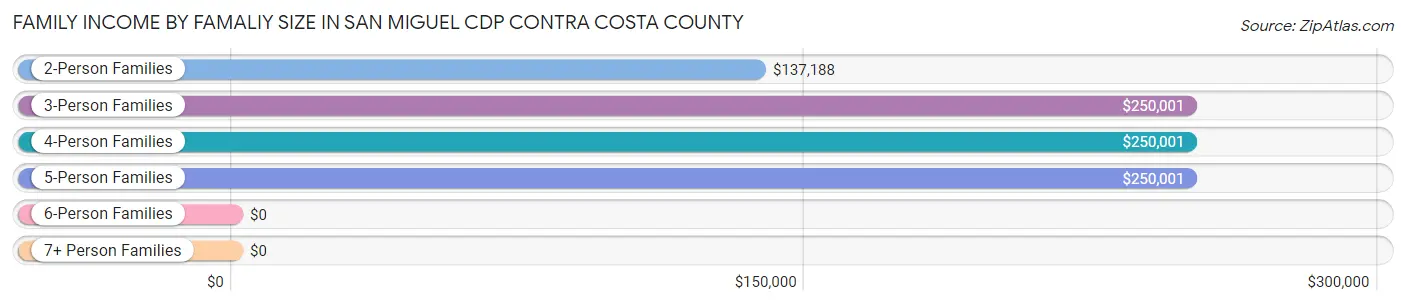
Family Income by Famaliy Size in San Miguel CDP Contra Costa County
3-person families (251 | 21.9%) account for the highest median family income in San Miguel CDP Contra Costa County with $250,001 per family, while 3-person families (251 | 21.9%) have the highest median income of $83,334 per family member.
| Income Bracket | # Families | Median Income |
| 2-Person Families | 450 (39.2%) | $137,188 |
| 3-Person Families | 251 (21.9%) | $250,001 |
| 4-Person Families | 368 (32.1%) | $250,001 |
| 5-Person Families | 67 (5.8%) | $250,001 |
| 6-Person Families | 12 (1.1%) | $0 |
| 7+ Person Families | 0 (0.0%) | $0 |
| Total | 1,148 (100.0%) | $250,001 |
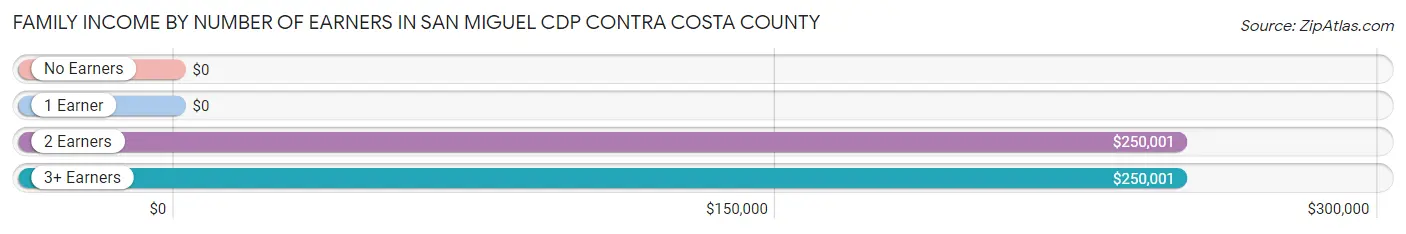
Family Income by Number of Earners in San Miguel CDP Contra Costa County
| Number of Earners | # Families | Median Income |
| No Earners | 110 (9.6%) | $0 |
| 1 Earner | 298 (26.0%) | $0 |
| 2 Earners | 555 (48.3%) | $250,001 |
| 3+ Earners | 185 (16.1%) | $250,001 |
| Total | 1,148 (100.0%) | $250,001 |
Household Income in San Miguel CDP Contra Costa County
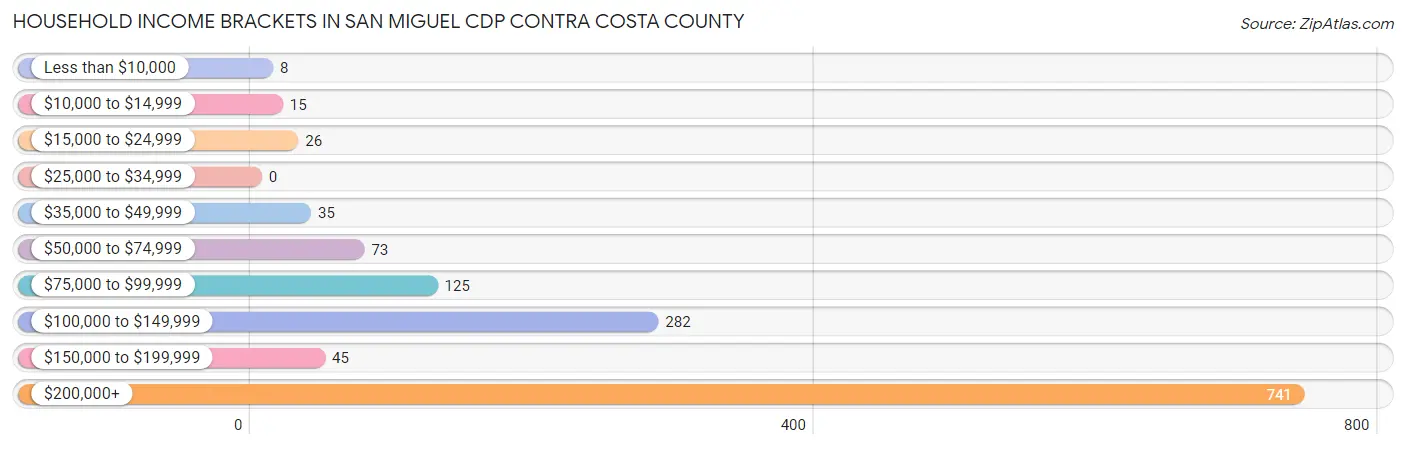
Household Income Brackets in San Miguel CDP Contra Costa County
With 741 households falling in the category, the $200,000+ income range is the most frequent in San Miguel CDP Contra Costa County, accounting for 54.9% of all households.
| Income Bracket | # Households | % Households |
| Less than $10,000 | 8 | 0.6% |
| $10,000 to $14,999 | 15 | 1.1% |
| $15,000 to $24,999 | 26 | 1.9% |
| $25,000 to $34,999 | 0 | 0.0% |
| $35,000 to $49,999 | 35 | 2.6% |
| $50,000 to $74,999 | 73 | 5.4% |
| $75,000 to $99,999 | 125 | 9.3% |
| $100,000 to $149,999 | 282 | 20.9% |
| $150,000 to $199,999 | 45 | 3.3% |
| $200,000+ | 741 | 54.9% |
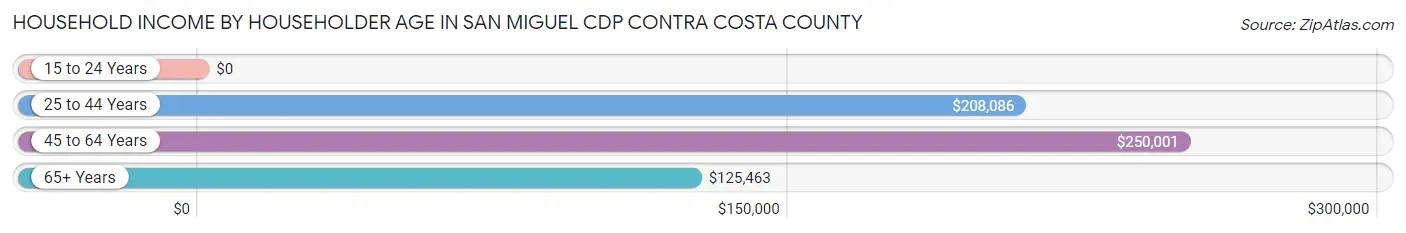
Household Income by Householder Age in San Miguel CDP Contra Costa County
The median household income in San Miguel CDP Contra Costa County is $238,472, with the highest median household income of $250,001 found in the 45 to 64 years age bracket for the primary householder. A total of 669 households (49.6%) fall into this category.
| Income Bracket | # Households | Median Income |
| 15 to 24 Years | 0 (0.0%) | $0 |
| 25 to 44 Years | 185 (13.7%) | $208,086 |
| 45 to 64 Years | 669 (49.6%) | $250,001 |
| 65+ Years | 495 (36.7%) | $125,463 |
| Total | 1,349 (100.0%) | $238,472 |
Poverty in San Miguel CDP Contra Costa County
Income Below Poverty by Sex and Age in San Miguel CDP Contra Costa County
With 2.5% poverty level for males and 2.3% for females among the residents of San Miguel CDP Contra Costa County, 25 to 34 year old males and 55 to 64 year old females are the most vulnerable to poverty, with 28 males (17.9%) and 37 females (12.1%) in their respective age groups living below the poverty level.
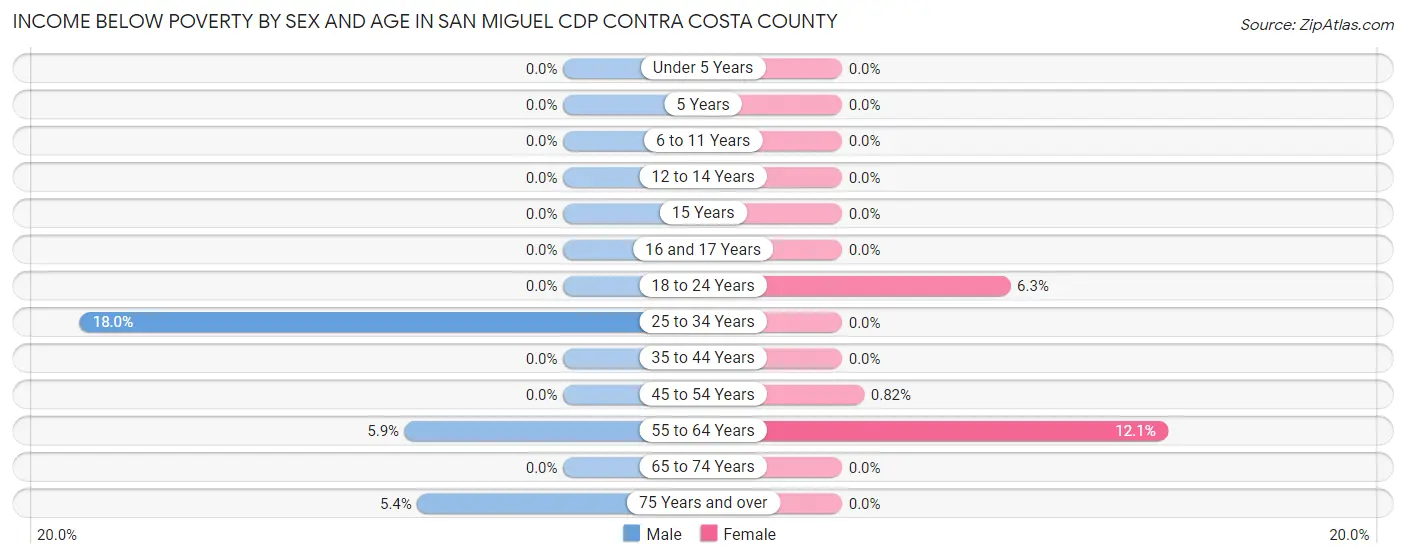
| Age Bracket | Male | Female |
| Under 5 Years | 0 (0.0%) | 0 (0.0%) |
| 5 Years | 0 (0.0%) | 0 (0.0%) |
| 6 to 11 Years | 0 (0.0%) | 0 (0.0%) |
| 12 to 14 Years | 0 (0.0%) | 0 (0.0%) |
| 15 Years | 0 (0.0%) | 0 (0.0%) |
| 16 and 17 Years | 0 (0.0%) | 0 (0.0%) |
| 18 to 24 Years | 0 (0.0%) | 5 (6.2%) |
| 25 to 34 Years | 28 (17.9%) | 0 (0.0%) |
| 35 to 44 Years | 0 (0.0%) | 0 (0.0%) |
| 45 to 54 Years | 0 (0.0%) | 3 (0.8%) |
| 55 to 64 Years | 15 (5.9%) | 37 (12.1%) |
| 65 to 74 Years | 0 (0.0%) | 0 (0.0%) |
| 75 Years and over | 8 (5.4%) | 0 (0.0%) |
| Total | 51 (2.5%) | 45 (2.3%) |
Income Above Poverty by Sex and Age in San Miguel CDP Contra Costa County
According to the poverty statistics in San Miguel CDP Contra Costa County, males aged under 5 years and females aged under 5 years are the age groups that are most secure financially, with 100.0% of males and 100.0% of females in these age groups living above the poverty line.
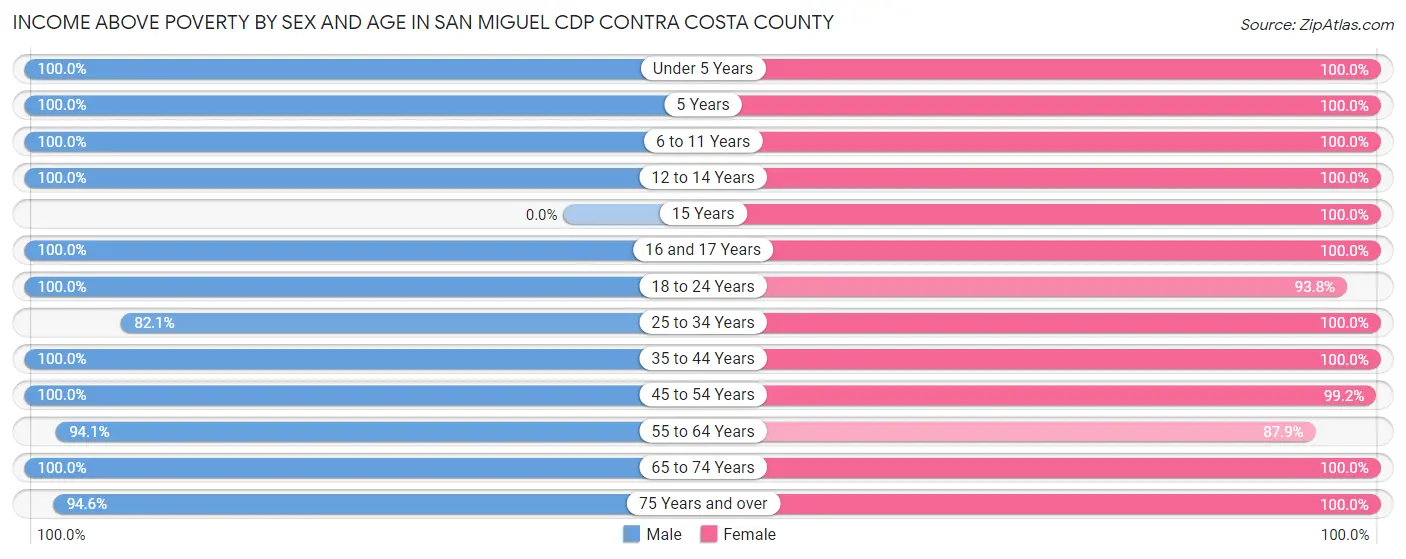
| Age Bracket | Male | Female |
| Under 5 Years | 37 (100.0%) | 57 (100.0%) |
| 5 Years | 87 (100.0%) | 19 (100.0%) |
| 6 to 11 Years | 143 (100.0%) | 72 (100.0%) |
| 12 to 14 Years | 228 (100.0%) | 71 (100.0%) |
| 15 Years | 0 (0.0%) | 165 (100.0%) |
| 16 and 17 Years | 43 (100.0%) | 34 (100.0%) |
| 18 to 24 Years | 111 (100.0%) | 75 (93.8%) |
| 25 to 34 Years | 128 (82.1%) | 143 (100.0%) |
| 35 to 44 Years | 142 (100.0%) | 165 (100.0%) |
| 45 to 54 Years | 401 (100.0%) | 365 (99.2%) |
| 55 to 64 Years | 240 (94.1%) | 269 (87.9%) |
| 65 to 74 Years | 321 (100.0%) | 284 (100.0%) |
| 75 Years and over | 140 (94.6%) | 168 (100.0%) |
| Total | 2,021 (97.5%) | 1,887 (97.7%) |
Income Below Poverty Among Married-Couple Families in San Miguel CDP Contra Costa County
The poverty statistics for married-couple families in San Miguel CDP Contra Costa County show that 1.3% or 15 of the total 1,112 families live below the poverty line. Families with no children have the highest poverty rate of 2.4%, comprising of 15 families. On the other hand, families with 1 or 2 children have the lowest poverty rate of 0.0%, which includes 0 families.
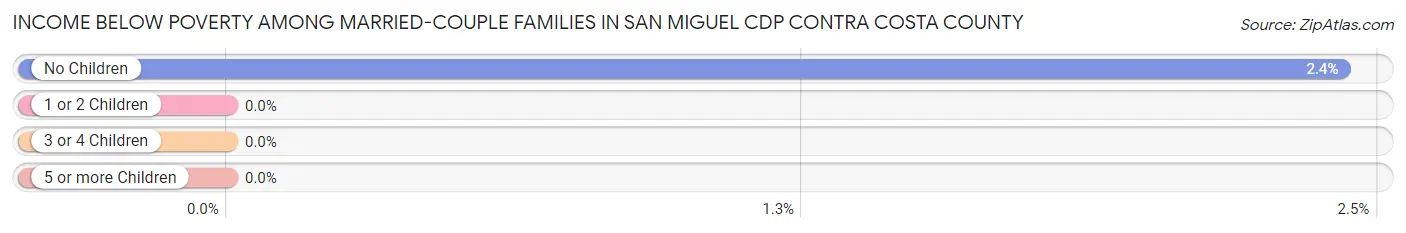
| Children | Above Poverty | Below Poverty |
| No Children | 606 (97.6%) | 15 (2.4%) |
| 1 or 2 Children | 432 (100.0%) | 0 (0.0%) |
| 3 or 4 Children | 59 (100.0%) | 0 (0.0%) |
| 5 or more Children | 0 (0.0%) | 0 (0.0%) |
| Total | 1,097 (98.7%) | 15 (1.3%) |
Income Below Poverty Among Single-Parent Households in San Miguel CDP Contra Costa County
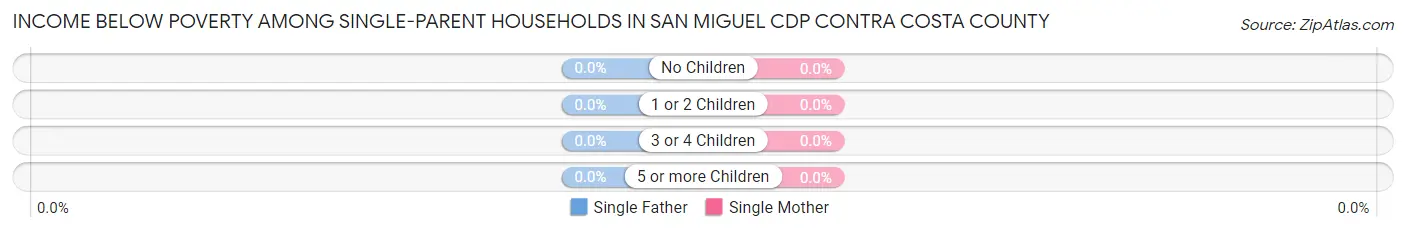
| Children | Single Father | Single Mother |
| No Children | 0 (0.0%) | 0 (0.0%) |
| 1 or 2 Children | 0 (0.0%) | 0 (0.0%) |
| 3 or 4 Children | 0 (0.0%) | 0 (0.0%) |
| 5 or more Children | 0 (0.0%) | 0 (0.0%) |
| Total | 0 (0.0%) | 0 (0.0%) |
Income Below Poverty Among Married-Couple vs Single-Parent Households in San Miguel CDP Contra Costa County
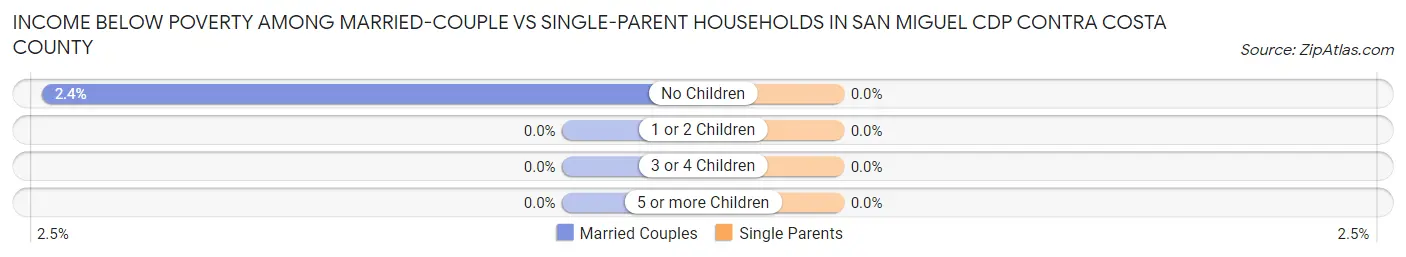
| Children | Married-Couple Families | Single-Parent Households |
| No Children | 15 (2.4%) | 0 (0.0%) |
| 1 or 2 Children | 0 (0.0%) | 0 (0.0%) |
| 3 or 4 Children | 0 (0.0%) | 0 (0.0%) |
| 5 or more Children | 0 (0.0%) | 0 (0.0%) |
| Total | 15 (1.3%) | 0 (0.0%) |
Race in San Miguel CDP Contra Costa County
The most populous races in San Miguel CDP Contra Costa County are White / Caucasian (3,413 | 85.2%), Asian (269 | 6.7%), and Two or more Races (244 | 6.1%).
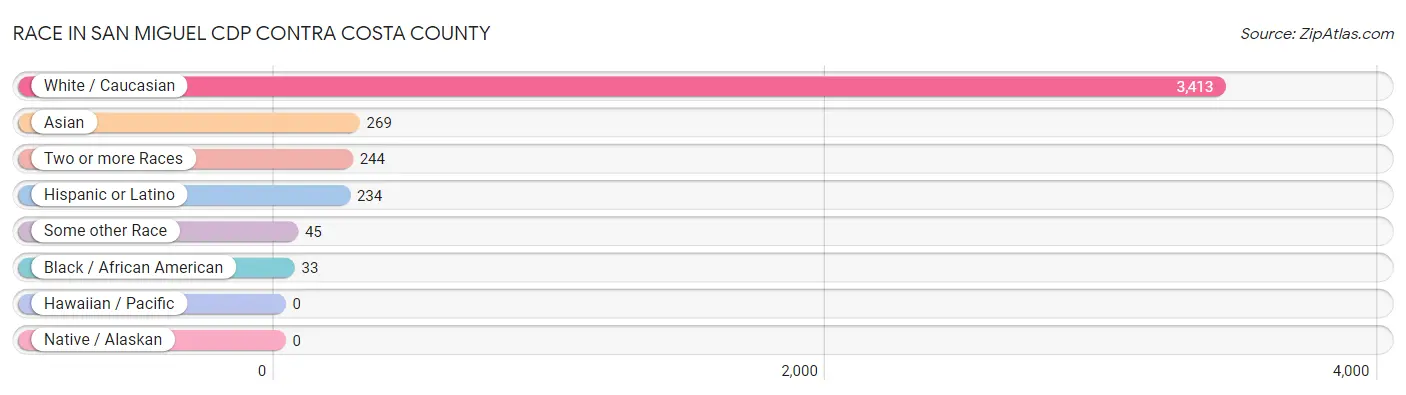
| Race | # Population | % Population |
| Asian | 269 | 6.7% |
| Black / African American | 33 | 0.8% |
| Hawaiian / Pacific | 0 | 0.0% |
| Hispanic or Latino | 234 | 5.8% |
| Native / Alaskan | 0 | 0.0% |
| White / Caucasian | 3,413 | 85.2% |
| Two or more Races | 244 | 6.1% |
| Some other Race | 45 | 1.1% |
| Total | 4,004 | 100.0% |
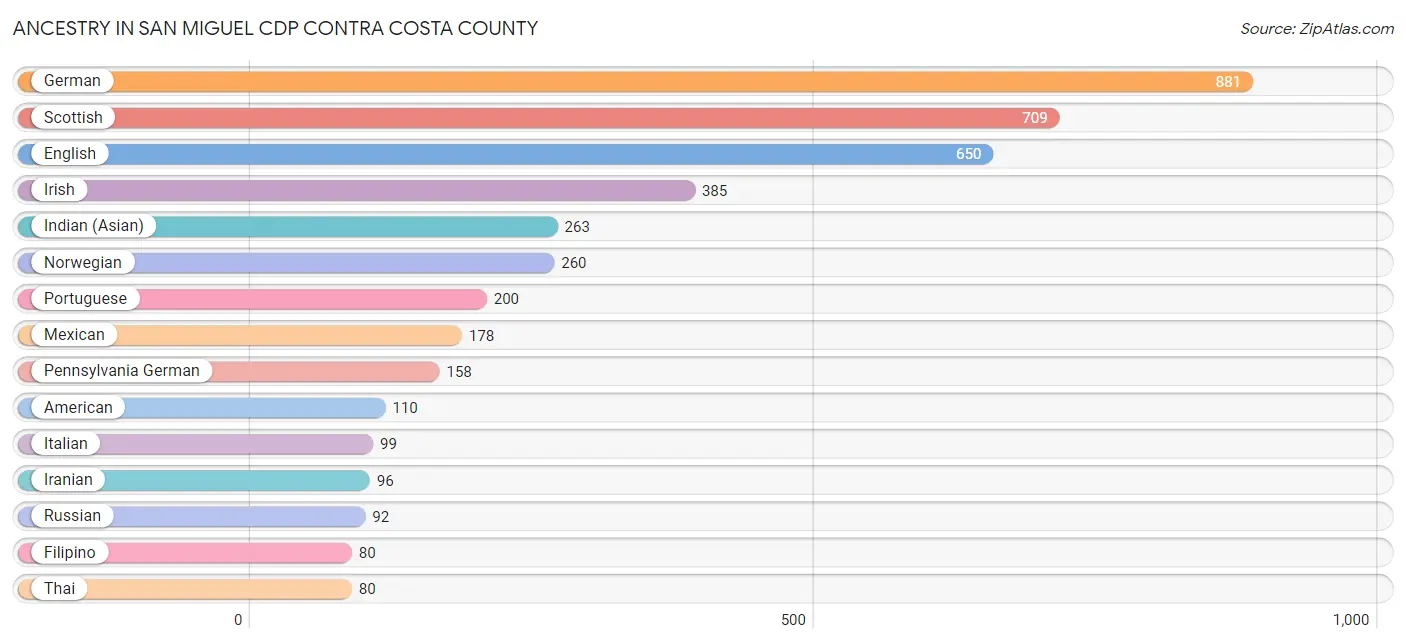
Ancestry in San Miguel CDP Contra Costa County
The most populous ancestries reported in San Miguel CDP Contra Costa County are German (881 | 22.0%), Scottish (709 | 17.7%), English (650 | 16.2%), Irish (385 | 9.6%), and Indian (Asian) (263 | 6.6%), together accounting for 72.1% of all San Miguel CDP Contra Costa County residents.
| Ancestry | # Population | % Population |
| American | 110 | 2.8% |
| Arab | 10 | 0.3% |
| Bhutanese | 47 | 1.2% |
| British | 58 | 1.5% |
| Burmese | 41 | 1.0% |
| Central American | 54 | 1.3% |
| Costa Rican | 54 | 1.3% |
| Czech | 22 | 0.5% |
| Danish | 57 | 1.4% |
| Dutch | 43 | 1.1% |
| Eastern European | 26 | 0.6% |
| English | 650 | 16.2% |
| European | 32 | 0.8% |
| Filipino | 80 | 2.0% |
| Finnish | 39 | 1.0% |
| French | 46 | 1.1% |
| French Canadian | 10 | 0.3% |
| German | 881 | 22.0% |
| Greek | 8 | 0.2% |
| Hungarian | 56 | 1.4% |
| Indian (Asian) | 263 | 6.6% |
| Iranian | 96 | 2.4% |
| Irish | 385 | 9.6% |
| Italian | 99 | 2.5% |
| Kenyan | 4 | 0.1% |
| Luxembourger | 8 | 0.2% |
| Mexican | 178 | 4.4% |
| Native Hawaiian | 47 | 1.2% |
| Norwegian | 260 | 6.5% |
| Palestinian | 10 | 0.3% |
| Pennsylvania German | 158 | 4.0% |
| Polish | 53 | 1.3% |
| Portuguese | 200 | 5.0% |
| Russian | 92 | 2.3% |
| Scandinavian | 34 | 0.9% |
| Scottish | 709 | 17.7% |
| Subsaharan African | 4 | 0.1% |
| Swedish | 34 | 0.9% |
| Swiss | 32 | 0.8% |
| Thai | 80 | 2.0% |
| Ukrainian | 22 | 0.5% |
| Welsh | 25 | 0.6% | View All 42 Rows |
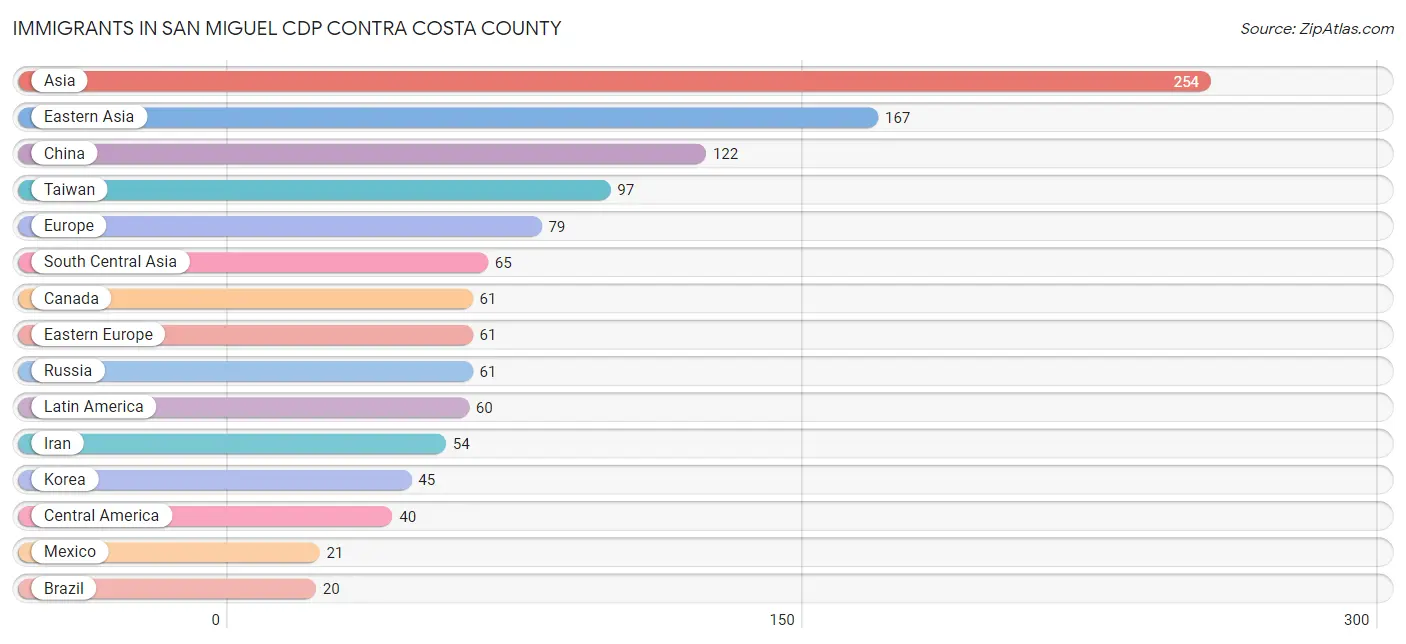
Immigrants in San Miguel CDP Contra Costa County
The most numerous immigrant groups reported in San Miguel CDP Contra Costa County came from Asia (254 | 6.3%), Eastern Asia (167 | 4.2%), China (122 | 3.0%), Taiwan (97 | 2.4%), and Europe (79 | 2.0%), together accounting for 17.9% of all San Miguel CDP Contra Costa County residents.
| Immigration Origin | # Population | % Population |
| Africa | 4 | 0.1% |
| Asia | 254 | 6.3% |
| Brazil | 20 | 0.5% |
| Canada | 61 | 1.5% |
| Central America | 40 | 1.0% |
| China | 122 | 3.0% |
| Costa Rica | 17 | 0.4% |
| Eastern Africa | 4 | 0.1% |
| Eastern Asia | 167 | 4.2% |
| Eastern Europe | 61 | 1.5% |
| England | 3 | 0.1% |
| Europe | 79 | 2.0% |
| Germany | 8 | 0.2% |
| Guatemala | 2 | 0.1% |
| Hong Kong | 17 | 0.4% |
| India | 11 | 0.3% |
| Iran | 54 | 1.3% |
| Jordan | 10 | 0.3% |
| Kenya | 4 | 0.1% |
| Korea | 45 | 1.1% |
| Latin America | 60 | 1.5% |
| Mexico | 21 | 0.5% |
| Northern Europe | 10 | 0.3% |
| Philippines | 12 | 0.3% |
| Russia | 61 | 1.5% |
| South America | 20 | 0.5% |
| South Central Asia | 65 | 1.6% |
| South Eastern Asia | 12 | 0.3% |
| Taiwan | 97 | 2.4% |
| Western Asia | 10 | 0.3% |
| Western Europe | 8 | 0.2% | View All 31 Rows |
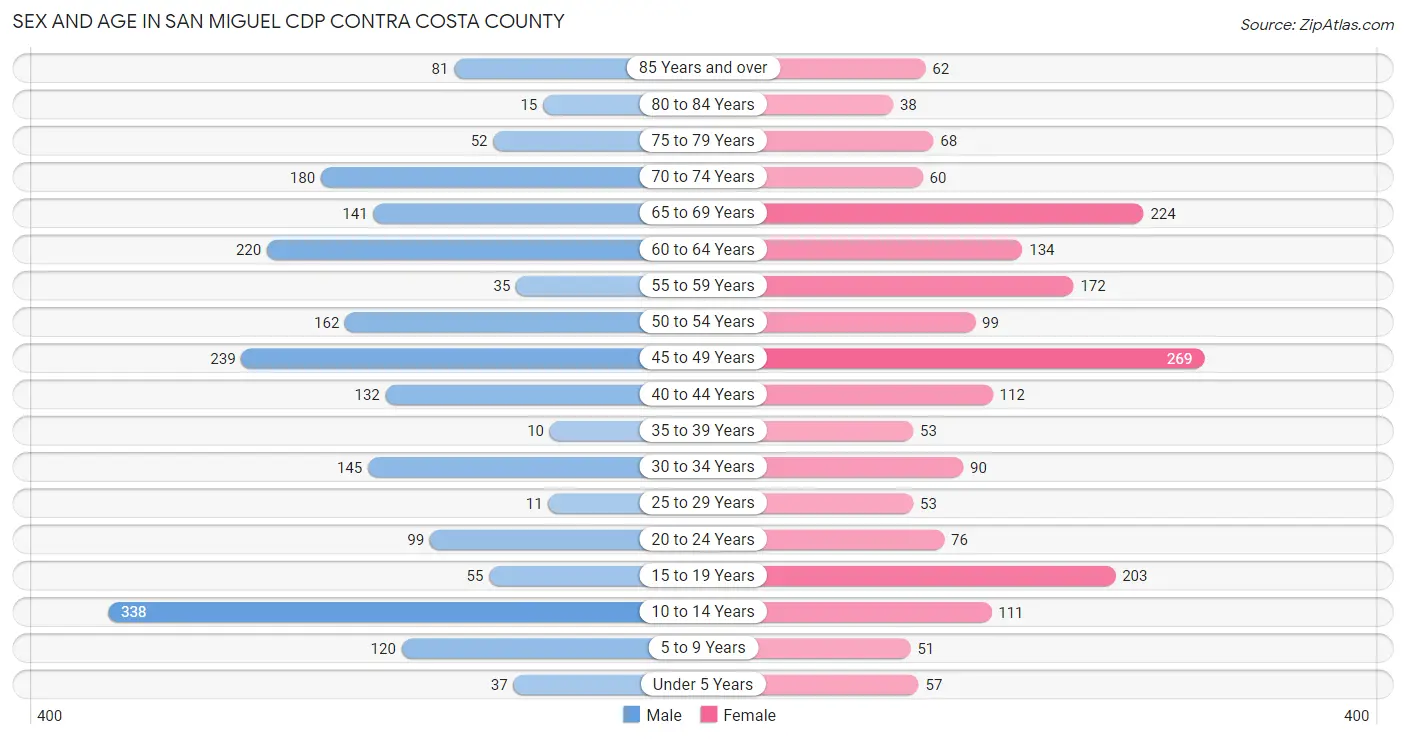
Sex and Age in San Miguel CDP Contra Costa County
Sex and Age in San Miguel CDP Contra Costa County
The most populous age groups in San Miguel CDP Contra Costa County are 10 to 14 Years (338 | 16.3%) for men and 45 to 49 Years (269 | 13.9%) for women.
| Age Bracket | Male | Female |
| Under 5 Years | 37 (1.8%) | 57 (2.9%) |
| 5 to 9 Years | 120 (5.8%) | 51 (2.6%) |
| 10 to 14 Years | 338 (16.3%) | 111 (5.8%) |
| 15 to 19 Years | 55 (2.6%) | 203 (10.5%) |
| 20 to 24 Years | 99 (4.8%) | 76 (3.9%) |
| 25 to 29 Years | 11 (0.5%) | 53 (2.7%) |
| 30 to 34 Years | 145 (7.0%) | 90 (4.7%) |
| 35 to 39 Years | 10 (0.5%) | 53 (2.7%) |
| 40 to 44 Years | 132 (6.4%) | 112 (5.8%) |
| 45 to 49 Years | 239 (11.5%) | 269 (13.9%) |
| 50 to 54 Years | 162 (7.8%) | 99 (5.1%) |
| 55 to 59 Years | 35 (1.7%) | 172 (8.9%) |
| 60 to 64 Years | 220 (10.6%) | 134 (6.9%) |
| 65 to 69 Years | 141 (6.8%) | 224 (11.6%) |
| 70 to 74 Years | 180 (8.7%) | 60 (3.1%) |
| 75 to 79 Years | 52 (2.5%) | 68 (3.5%) |
| 80 to 84 Years | 15 (0.7%) | 38 (2.0%) |
| 85 Years and over | 81 (3.9%) | 62 (3.2%) |
| Total | 2,072 (100.0%) | 1,932 (100.0%) |
Families and Households in San Miguel CDP Contra Costa County
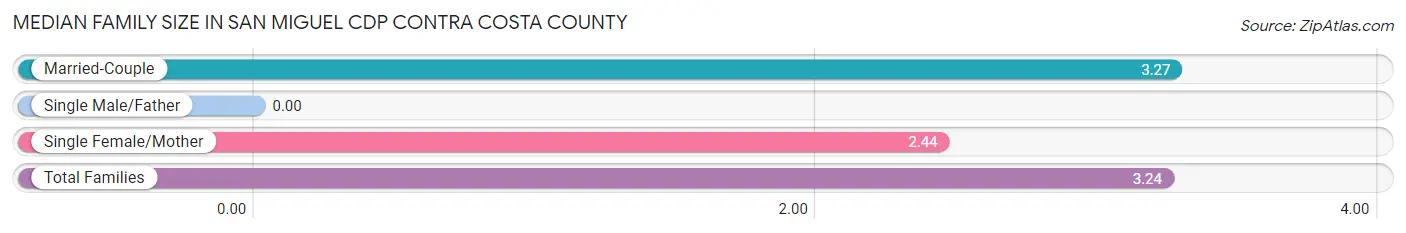
Median Family Size in San Miguel CDP Contra Costa County
| Family Type | # Families | Family Size |
| Married-Couple | 1,112 (96.9%) | 3.27 |
| Single Male/Father | 0 (0.0%) | - |
| Single Female/Mother | 36 (3.1%) | 2.44 |
| Total Families | 1,148 (100.0%) | 3.24 |
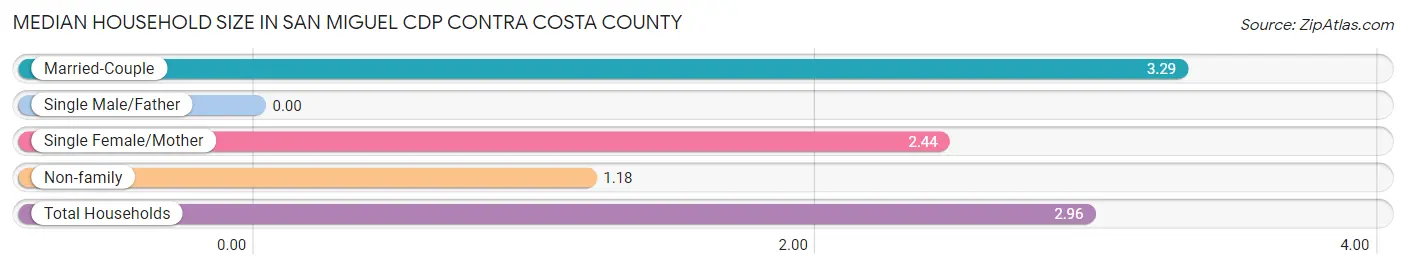
Median Household Size in San Miguel CDP Contra Costa County
| Household Type | # Households | Household Size |
| Married-Couple | 1,112 (82.4%) | 3.29 |
| Single Male/Father | 0 (0.0%) | - |
| Single Female/Mother | 36 (2.7%) | 2.44 |
| Non-family | 201 (14.9%) | 1.18 |
| Total Households | 1,349 (100.0%) | 2.96 |
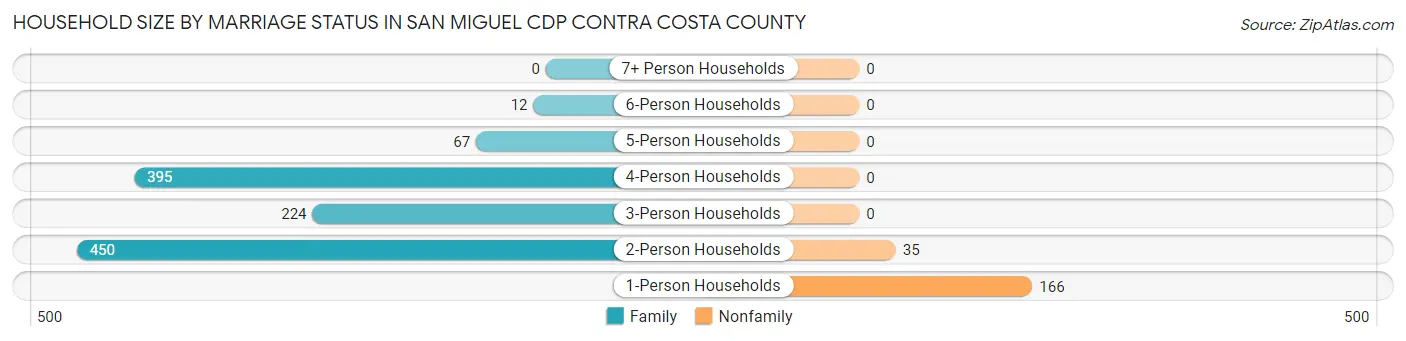
Household Size by Marriage Status in San Miguel CDP Contra Costa County
Out of a total of 1,349 households in San Miguel CDP Contra Costa County, 1,148 (85.1%) are family households, while 201 (14.9%) are nonfamily households. The most numerous type of family households are 2-person households, comprising 450, and the most common type of nonfamily households are 1-person households, comprising 166.
| Household Size | Family Households | Nonfamily Households |
| 1-Person Households | - | 166 (12.3%) |
| 2-Person Households | 450 (33.4%) | 35 (2.6%) |
| 3-Person Households | 224 (16.6%) | 0 (0.0%) |
| 4-Person Households | 395 (29.3%) | 0 (0.0%) |
| 5-Person Households | 67 (5.0%) | 0 (0.0%) |
| 6-Person Households | 12 (0.9%) | 0 (0.0%) |
| 7+ Person Households | 0 (0.0%) | 0 (0.0%) |
| Total | 1,148 (85.1%) | 201 (14.9%) |
Female Fertility in San Miguel CDP Contra Costa County
Fertility by Age in San Miguel CDP Contra Costa County
Average fertility rate in San Miguel CDP Contra Costa County is 23.0 births per 1,000 women. Women in the age bracket of 20 to 34 years have the highest fertility rate with 91.0 births per 1,000 women. Women in the age bracket of 20 to 34 years acount for 100.0% of all women with births.
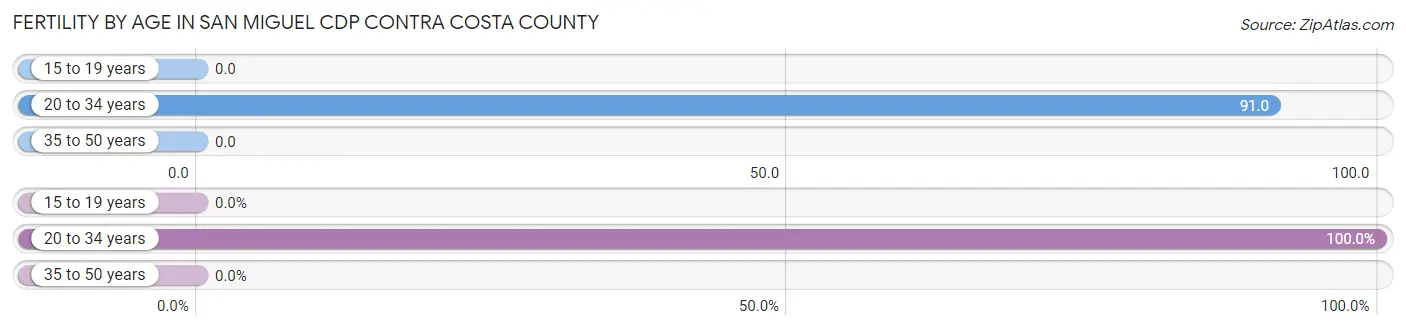
| Age Bracket | Women with Births | Births / 1,000 Women |
| 15 to 19 years | 0 (0.0%) | 0.0 |
| 20 to 34 years | 20 (100.0%) | 91.0 |
| 35 to 50 years | 0 (0.0%) | 0.0 |
| Total | 20 (100.0%) | 23.0 |
Fertility by Age by Marriage Status in San Miguel CDP Contra Costa County
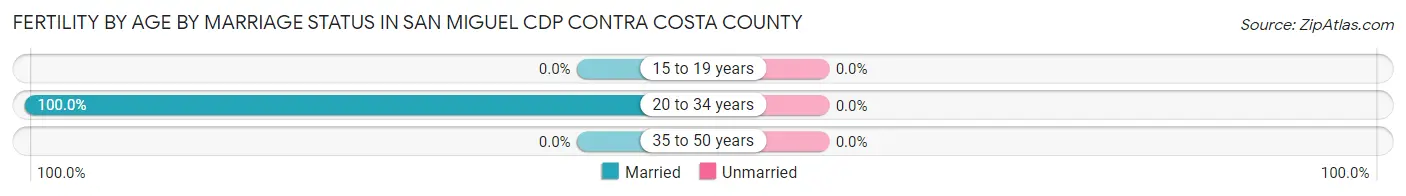
| Age Bracket | Married | Unmarried |
| 15 to 19 years | 0 (0.0%) | 0 (0.0%) |
| 20 to 34 years | 20 (100.0%) | 0 (0.0%) |
| 35 to 50 years | 0 (0.0%) | 0 (0.0%) |
| Total | 20 (100.0%) | 0 (0.0%) |
Fertility by Education in San Miguel CDP Contra Costa County
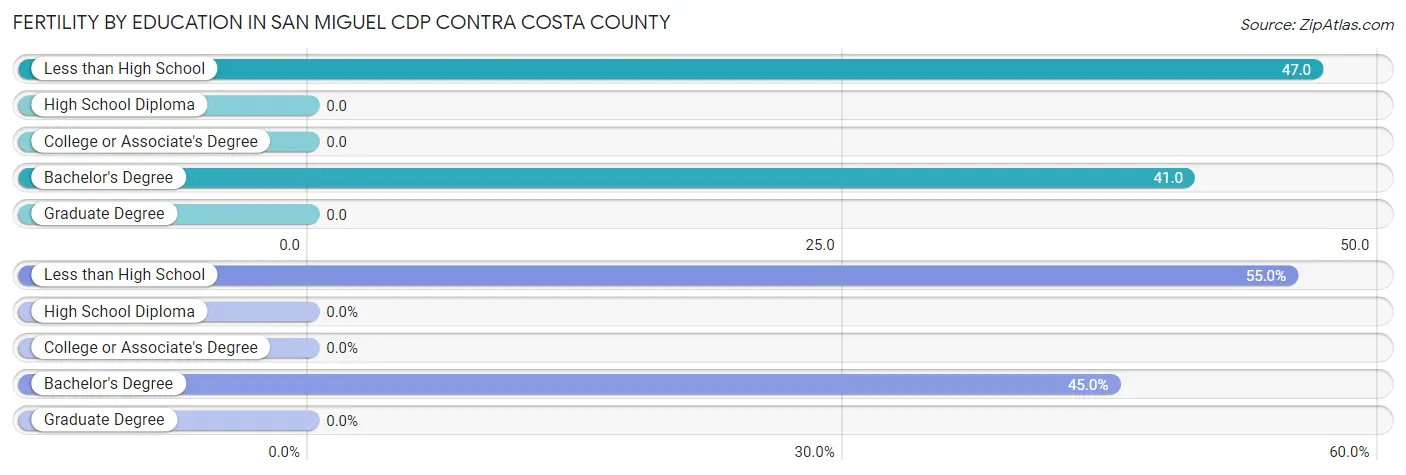
| Educational Attainment | Women with Births | Births / 1,000 Women |
| Less than High School | 11 (55.0%) | 47.0 |
| High School Diploma | 0 (0.0%) | 0.0 |
| College or Associate's Degree | 0 (0.0%) | 0.0 |
| Bachelor's Degree | 9 (45.0%) | 41.0 |
| Graduate Degree | 0 (0.0%) | 0.0 |
| Total | 20 (100.0%) | 23.0 |
Fertility by Education by Marriage Status in San Miguel CDP Contra Costa County
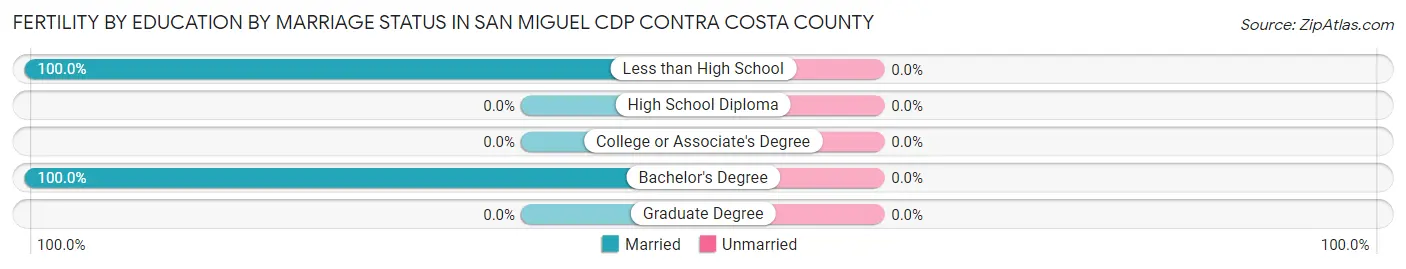
| Educational Attainment | Married | Unmarried |
| Less than High School | 11 (100.0%) | 0 (0.0%) |
| High School Diploma | 0 (0.0%) | 0 (0.0%) |
| College or Associate's Degree | 0 (0.0%) | 0 (0.0%) |
| Bachelor's Degree | 9 (100.0%) | 0 (0.0%) |
| Graduate Degree | 0 (0.0%) | 0 (0.0%) |
| Total | 20 (100.0%) | 0 (0.0%) |
Employment Characteristics in San Miguel CDP Contra Costa County
Employment by Class of Employer in San Miguel CDP Contra Costa County
Among the 1,971 employed individuals in San Miguel CDP Contra Costa County, private company employees (1,068 | 54.2%), self-employed (incorporated) (333 | 16.9%), and self-employed (not incorporated) (326 | 16.5%) make up the most common classes of employment.
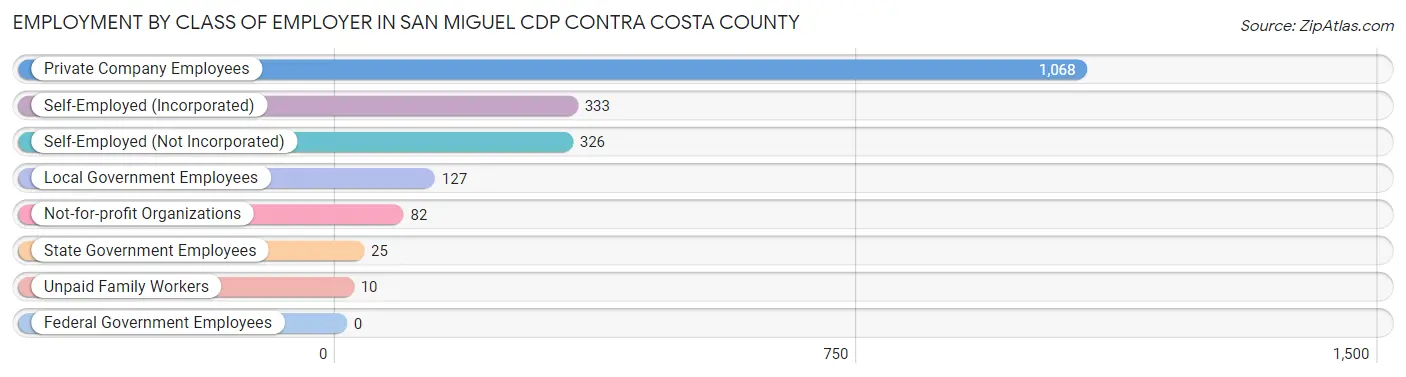
| Employer Class | # Employees | % Employees |
| Private Company Employees | 1,068 | 54.2% |
| Self-Employed (Incorporated) | 333 | 16.9% |
| Self-Employed (Not Incorporated) | 326 | 16.5% |
| Not-for-profit Organizations | 82 | 4.2% |
| Local Government Employees | 127 | 6.4% |
| State Government Employees | 25 | 1.3% |
| Federal Government Employees | 0 | 0.0% |
| Unpaid Family Workers | 10 | 0.5% |
| Total | 1,971 | 100.0% |
Employment Status by Age in San Miguel CDP Contra Costa County
According to the labor force statistics for San Miguel CDP Contra Costa County, out of the total population over 16 years of age (3,125), 66.2% or 2,069 individuals are in the labor force, with 3.1% or 64 of them unemployed. The age group with the highest labor force participation rate is 25 to 29 years, with 100.0% or 64 individuals in the labor force. Within the labor force, the 20 to 24 years age range has the highest percentage of unemployed individuals, with 40.2% or 53 of them being unemployed.
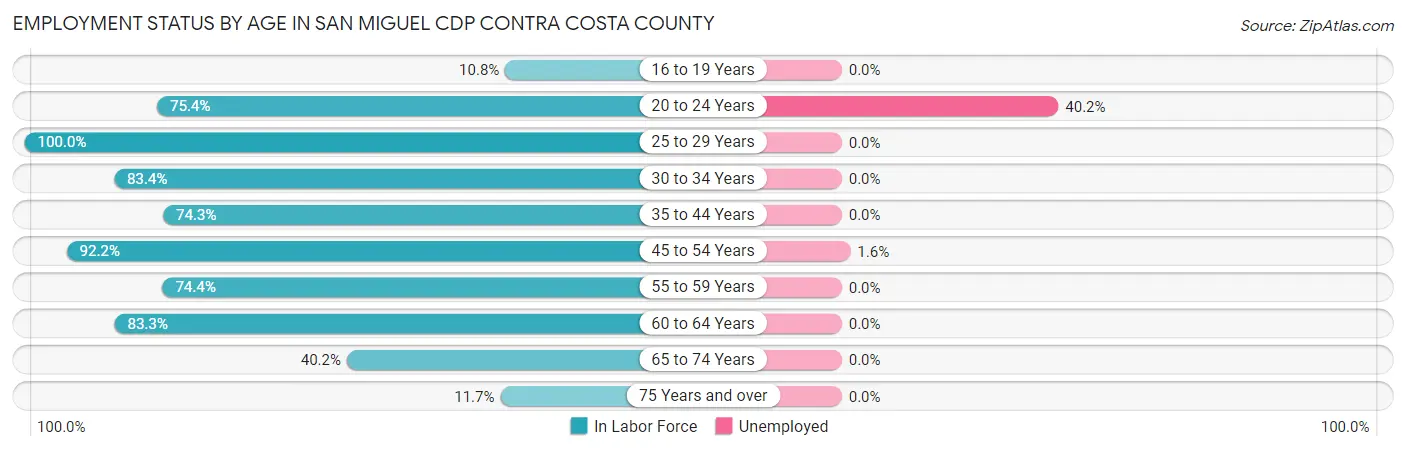
| Age Bracket | In Labor Force | Unemployed |
| 16 to 19 Years | 10 (10.8%) | 0 (0.0%) |
| 20 to 24 Years | 132 (75.4%) | 53 (40.2%) |
| 25 to 29 Years | 64 (100.0%) | 0 (0.0%) |
| 30 to 34 Years | 196 (83.4%) | 0 (0.0%) |
| 35 to 44 Years | 228 (74.3%) | 0 (0.0%) |
| 45 to 54 Years | 709 (92.2%) | 11 (1.6%) |
| 55 to 59 Years | 154 (74.4%) | 0 (0.0%) |
| 60 to 64 Years | 295 (83.3%) | 0 (0.0%) |
| 65 to 74 Years | 243 (40.2%) | 0 (0.0%) |
| 75 Years and over | 37 (11.7%) | 0 (0.0%) |
| Total | 2,069 (66.2%) | 64 (3.1%) |
Employment Status by Educational Attainment in San Miguel CDP Contra Costa County
According to labor force statistics for San Miguel CDP Contra Costa County, 85.0% of individuals (1,646) out of the total population between 25 and 64 years of age (1,936) are in the labor force, with 0.7% or 12 of them being unemployed. The group with the highest labor force participation rate are those with the educational attainment of bachelor's degree or higher, with 90.6% or 1,193 individuals in the labor force. Within the labor force, individuals with bachelor's degree or higher education have the highest percentage of unemployment, with 0.9% or 11 of them being unemployed.
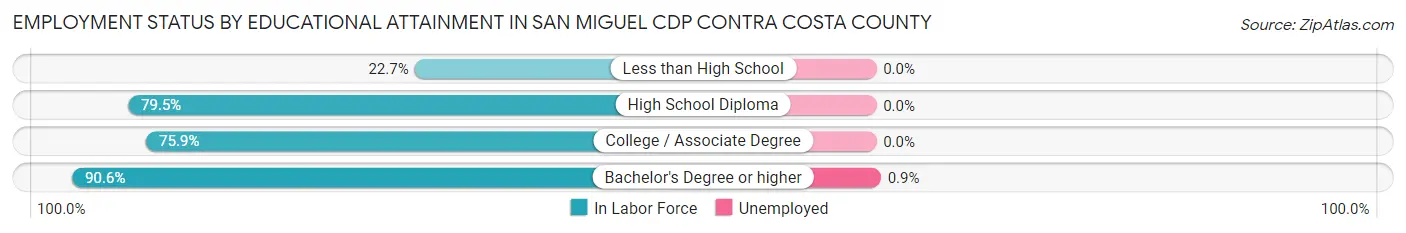
| Educational Attainment | In Labor Force | Unemployed |
| Less than High School | 10 (22.7%) | 0 (0.0%) |
| High School Diploma | 147 (79.5%) | 0 (0.0%) |
| College / Associate Degree | 296 (75.9%) | 0 (0.0%) |
| Bachelor's Degree or higher | 1,193 (90.6%) | 12 (0.9%) |
| Total | 1,646 (85.0%) | 14 (0.7%) |
Employment Occupations by Sex in San Miguel CDP Contra Costa County
Management, Business, Science and Arts Occupations
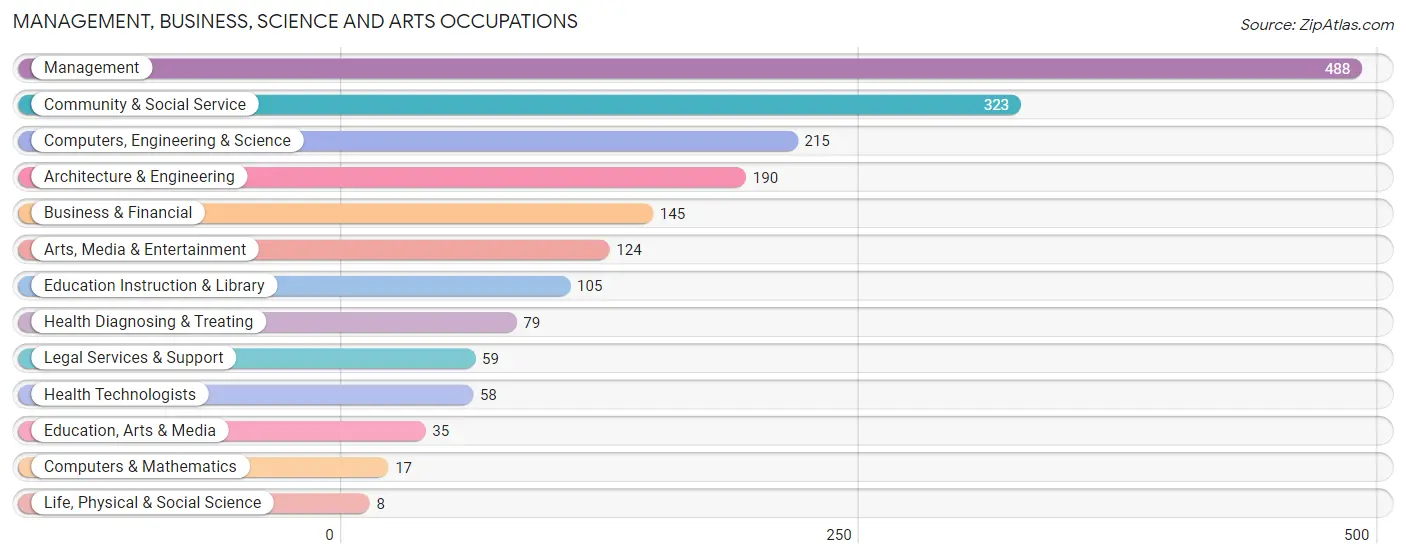
The most common Management, Business, Science and Arts occupations in San Miguel CDP Contra Costa County are Management (488 | 24.3%), Community & Social Service (323 | 16.1%), Computers, Engineering & Science (215 | 10.7%), Architecture & Engineering (190 | 9.5%), and Business & Financial (145 | 7.2%).
Management, Business, Science and Arts Occupations by Sex
Within the Management, Business, Science and Arts occupations in San Miguel CDP Contra Costa County, the most male-oriented occupations are Computers & Mathematics (100.0%), Life, Physical & Social Science (100.0%), and Health Technologists (91.4%), while the most female-oriented occupations are Legal Services & Support (72.9%), Education, Arts & Media (71.4%), and Management (66.2%).
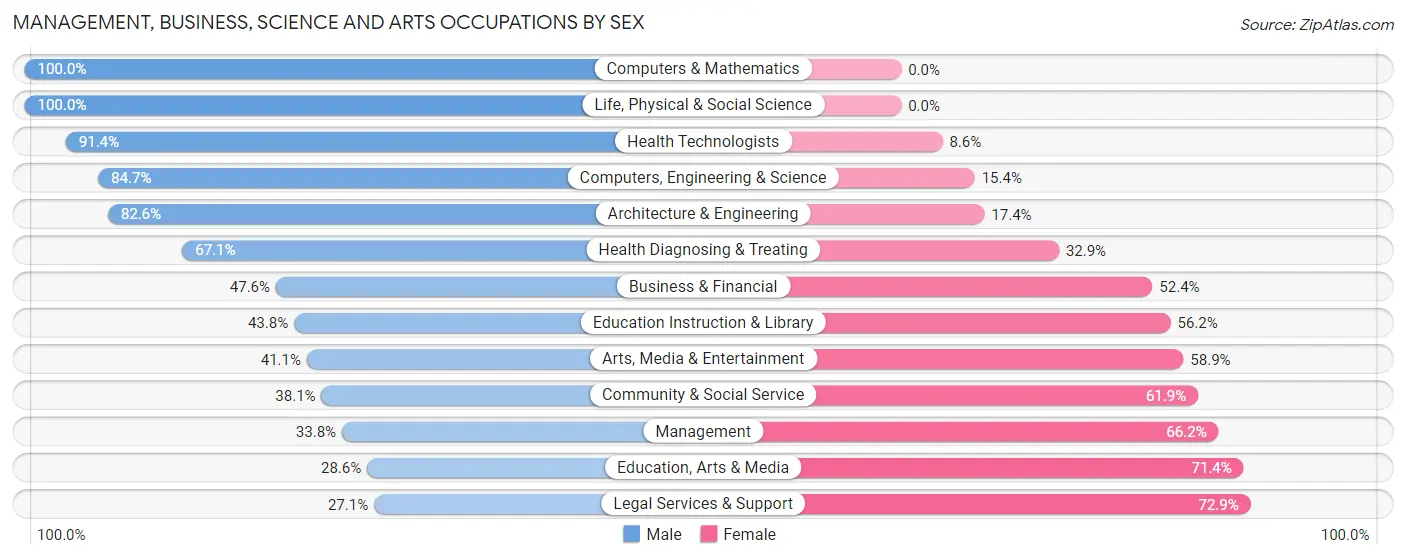
| Occupation | Male | Female |
| Management | 165 (33.8%) | 323 (66.2%) |
| Business & Financial | 69 (47.6%) | 76 (52.4%) |
| Computers, Engineering & Science | 182 (84.7%) | 33 (15.3%) |
| Computers & Mathematics | 17 (100.0%) | 0 (0.0%) |
| Architecture & Engineering | 157 (82.6%) | 33 (17.4%) |
| Life, Physical & Social Science | 8 (100.0%) | 0 (0.0%) |
| Community & Social Service | 123 (38.1%) | 200 (61.9%) |
| Education, Arts & Media | 10 (28.6%) | 25 (71.4%) |
| Legal Services & Support | 16 (27.1%) | 43 (72.9%) |
| Education Instruction & Library | 46 (43.8%) | 59 (56.2%) |
| Arts, Media & Entertainment | 51 (41.1%) | 73 (58.9%) |
| Health Diagnosing & Treating | 53 (67.1%) | 26 (32.9%) |
| Health Technologists | 53 (91.4%) | 5 (8.6%) |
| Total (Category) | 592 (47.4%) | 658 (52.6%) |
| Total (Overall) | 1,146 (57.2%) | 858 (42.8%) |
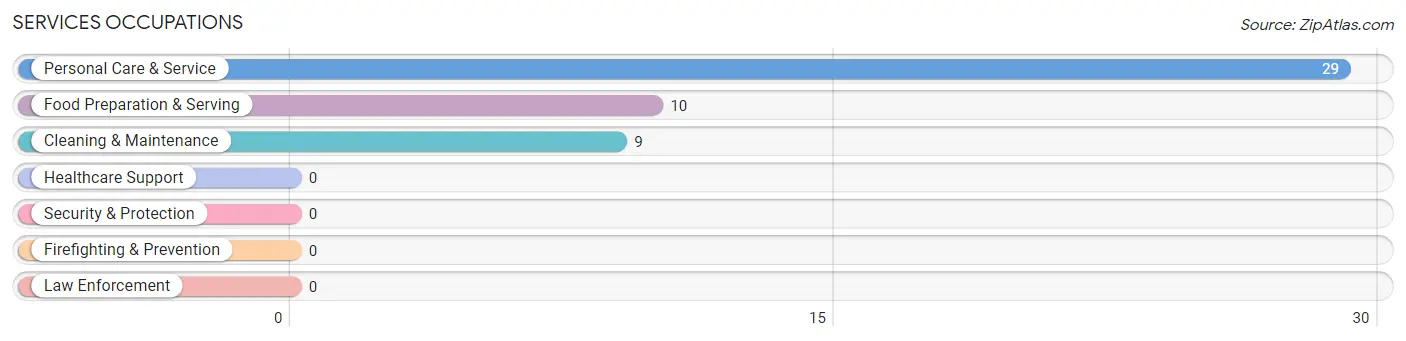
Services Occupations
The most common Services occupations in San Miguel CDP Contra Costa County are Personal Care & Service (29 | 1.5%), Food Preparation & Serving (10 | 0.5%), and Cleaning & Maintenance (9 | 0.4%).
Services Occupations by Sex
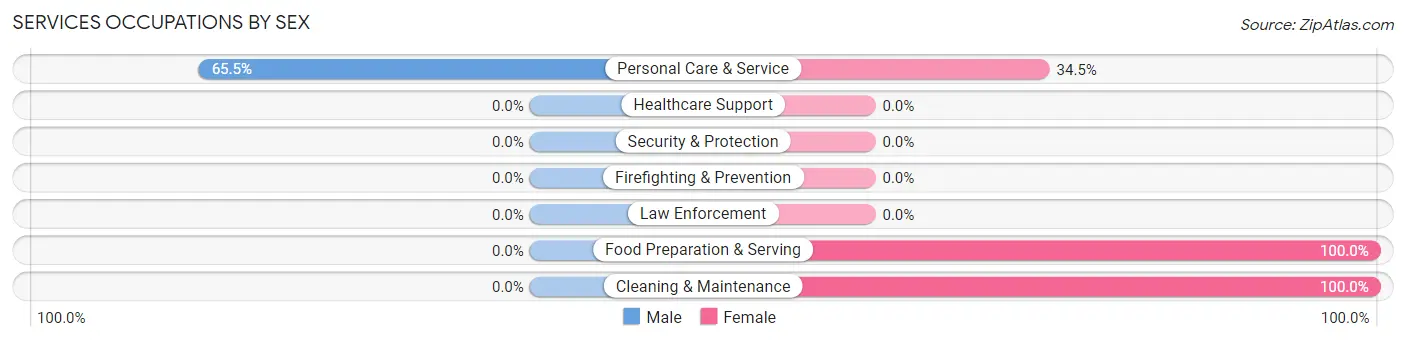
| Occupation | Male | Female |
| Healthcare Support | 0 (0.0%) | 0 (0.0%) |
| Security & Protection | 0 (0.0%) | 0 (0.0%) |
| Firefighting & Prevention | 0 (0.0%) | 0 (0.0%) |
| Law Enforcement | 0 (0.0%) | 0 (0.0%) |
| Food Preparation & Serving | 0 (0.0%) | 10 (100.0%) |
| Cleaning & Maintenance | 0 (0.0%) | 9 (100.0%) |
| Personal Care & Service | 19 (65.5%) | 10 (34.5%) |
| Total (Category) | 19 (39.6%) | 29 (60.4%) |
| Total (Overall) | 1,146 (57.2%) | 858 (42.8%) |
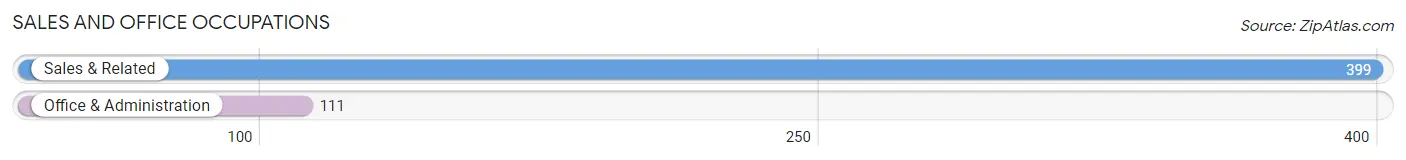
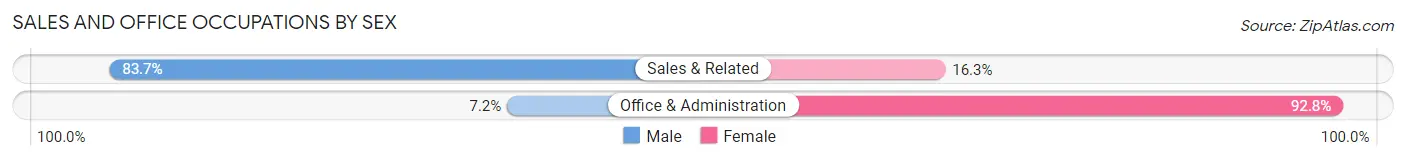
Sales and Office Occupations
The most common Sales and Office occupations in San Miguel CDP Contra Costa County are Sales & Related (399 | 19.9%), and Office & Administration (111 | 5.5%).
Sales and Office Occupations by Sex
| Occupation | Male | Female |
| Sales & Related | 334 (83.7%) | 65 (16.3%) |
| Office & Administration | 8 (7.2%) | 103 (92.8%) |
| Total (Category) | 342 (67.1%) | 168 (32.9%) |
| Total (Overall) | 1,146 (57.2%) | 858 (42.8%) |
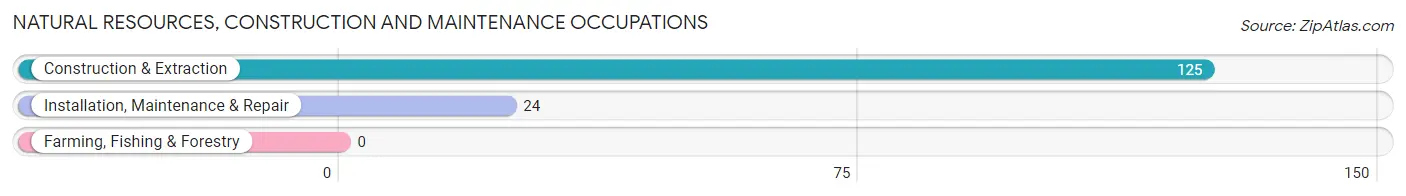
Natural Resources, Construction and Maintenance Occupations
The most common Natural Resources, Construction and Maintenance occupations in San Miguel CDP Contra Costa County are Construction & Extraction (125 | 6.2%), and Installation, Maintenance & Repair (24 | 1.2%).
Natural Resources, Construction and Maintenance Occupations by Sex
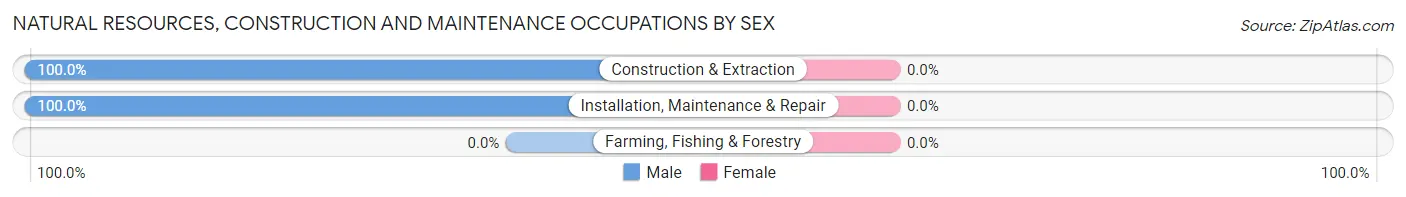
| Occupation | Male | Female |
| Farming, Fishing & Forestry | 0 (0.0%) | 0 (0.0%) |
| Construction & Extraction | 125 (100.0%) | 0 (0.0%) |
| Installation, Maintenance & Repair | 24 (100.0%) | 0 (0.0%) |
| Total (Category) | 149 (100.0%) | 0 (0.0%) |
| Total (Overall) | 1,146 (57.2%) | 858 (42.8%) |
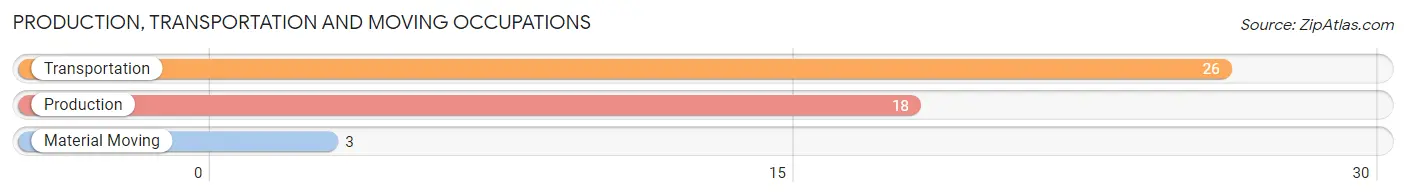
Production, Transportation and Moving Occupations
The most common Production, Transportation and Moving occupations in San Miguel CDP Contra Costa County are Transportation (26 | 1.3%), Production (18 | 0.9%), and Material Moving (3 | 0.2%).
Production, Transportation and Moving Occupations by Sex
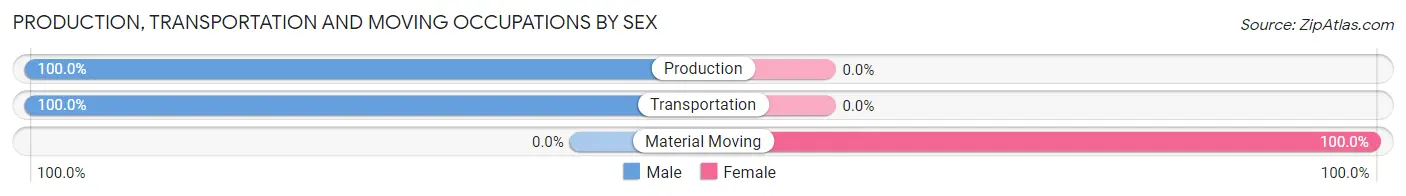
| Occupation | Male | Female |
| Production | 18 (100.0%) | 0 (0.0%) |
| Transportation | 26 (100.0%) | 0 (0.0%) |
| Material Moving | 0 (0.0%) | 3 (100.0%) |
| Total (Category) | 44 (93.6%) | 3 (6.4%) |
| Total (Overall) | 1,146 (57.2%) | 858 (42.8%) |
Employment Industries by Sex in San Miguel CDP Contra Costa County
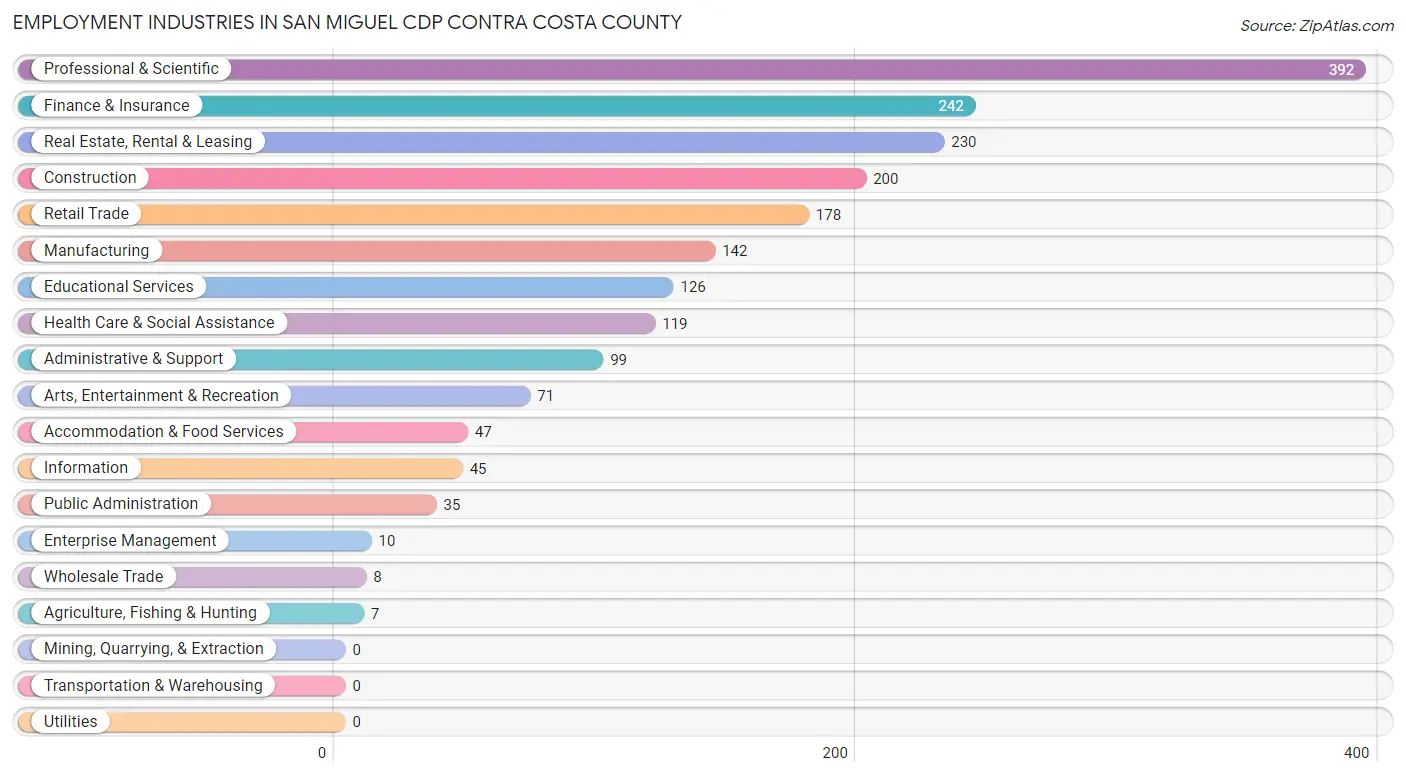
Employment Industries in San Miguel CDP Contra Costa County
The major employment industries in San Miguel CDP Contra Costa County include Professional & Scientific (392 | 19.6%), Finance & Insurance (242 | 12.1%), Real Estate, Rental & Leasing (230 | 11.5%), Construction (200 | 10.0%), and Retail Trade (178 | 8.9%).
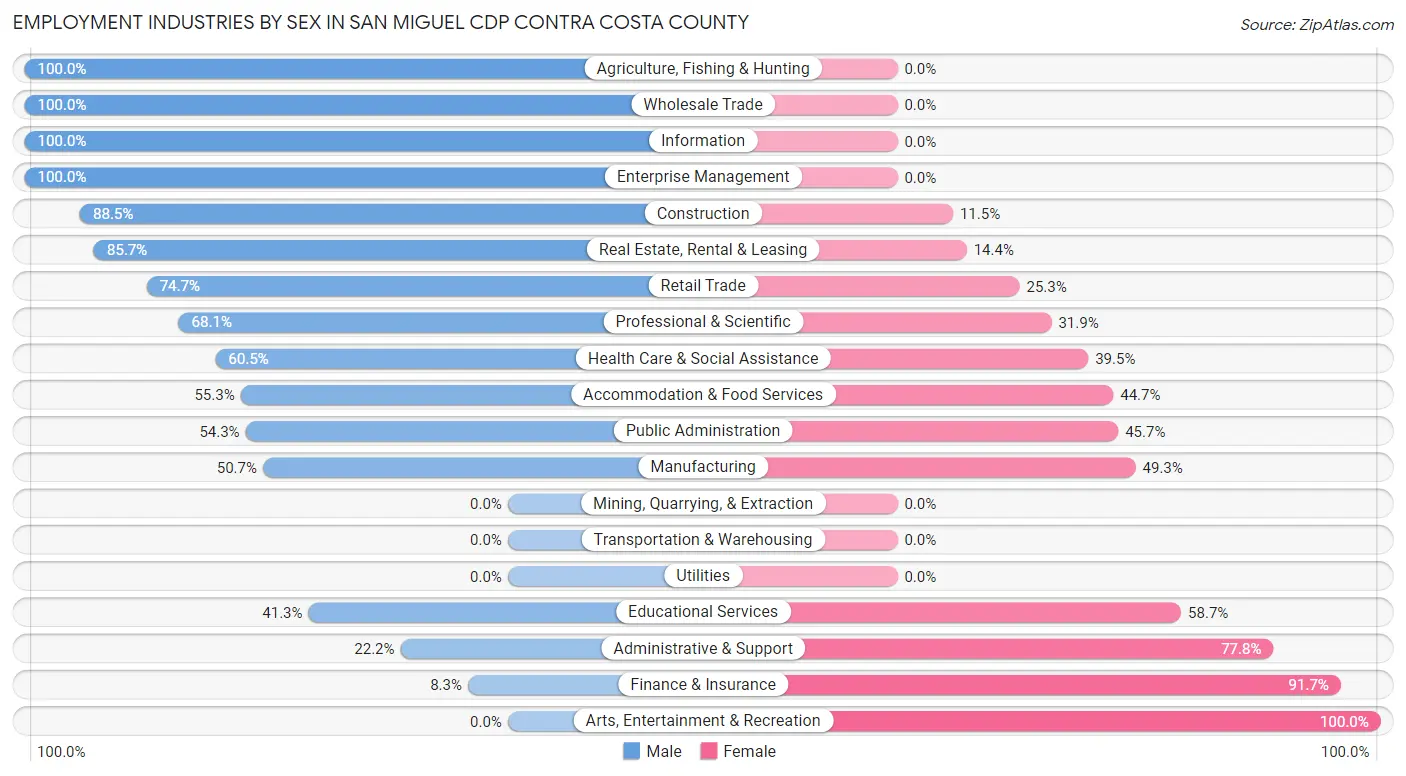
Employment Industries by Sex in San Miguel CDP Contra Costa County
The San Miguel CDP Contra Costa County industries that see more men than women are Agriculture, Fishing & Hunting (100.0%), Wholesale Trade (100.0%), and Information (100.0%), whereas the industries that tend to have a higher number of women are Arts, Entertainment & Recreation (100.0%), Finance & Insurance (91.7%), and Administrative & Support (77.8%).
| Industry | Male | Female |
| Agriculture, Fishing & Hunting | 7 (100.0%) | 0 (0.0%) |
| Mining, Quarrying, & Extraction | 0 (0.0%) | 0 (0.0%) |
| Construction | 177 (88.5%) | 23 (11.5%) |
| Manufacturing | 72 (50.7%) | 70 (49.3%) |
| Wholesale Trade | 8 (100.0%) | 0 (0.0%) |
| Retail Trade | 133 (74.7%) | 45 (25.3%) |
| Transportation & Warehousing | 0 (0.0%) | 0 (0.0%) |
| Utilities | 0 (0.0%) | 0 (0.0%) |
| Information | 45 (100.0%) | 0 (0.0%) |
| Finance & Insurance | 20 (8.3%) | 222 (91.7%) |
| Real Estate, Rental & Leasing | 197 (85.7%) | 33 (14.3%) |
| Professional & Scientific | 267 (68.1%) | 125 (31.9%) |
| Enterprise Management | 10 (100.0%) | 0 (0.0%) |
| Administrative & Support | 22 (22.2%) | 77 (77.8%) |
| Educational Services | 52 (41.3%) | 74 (58.7%) |
| Health Care & Social Assistance | 72 (60.5%) | 47 (39.5%) |
| Arts, Entertainment & Recreation | 0 (0.0%) | 71 (100.0%) |
| Accommodation & Food Services | 26 (55.3%) | 21 (44.7%) |
| Public Administration | 19 (54.3%) | 16 (45.7%) |
| Total | 1,146 (57.2%) | 858 (42.8%) |
Education in San Miguel CDP Contra Costa County
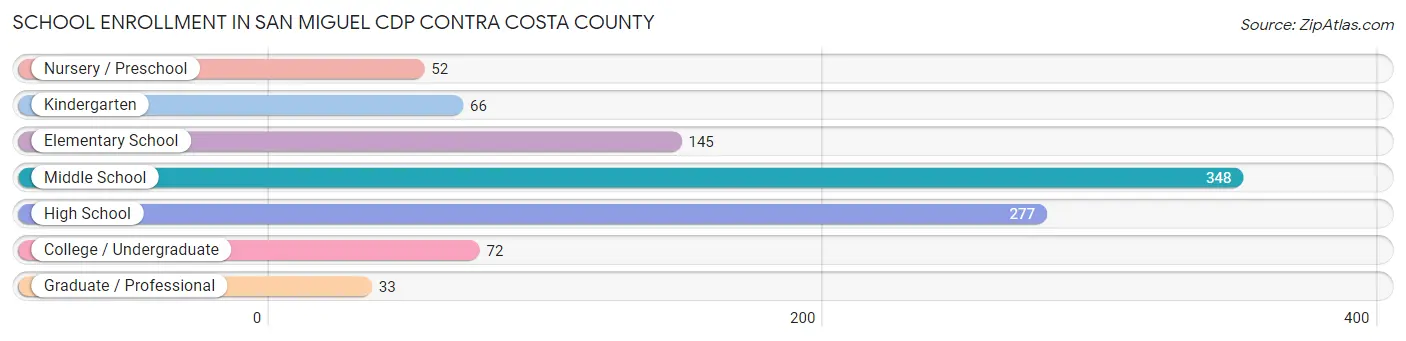
School Enrollment in San Miguel CDP Contra Costa County
The most common levels of schooling among the 993 students in San Miguel CDP Contra Costa County are middle school (348 | 35.0%), high school (277 | 27.9%), and elementary school (145 | 14.6%).
| School Level | # Students | % Students |
| Nursery / Preschool | 52 | 5.2% |
| Kindergarten | 66 | 6.7% |
| Elementary School | 145 | 14.6% |
| Middle School | 348 | 35.0% |
| High School | 277 | 27.9% |
| College / Undergraduate | 72 | 7.2% |
| Graduate / Professional | 33 | 3.3% |
| Total | 993 | 100.0% |
School Enrollment by Age by Funding Source in San Miguel CDP Contra Costa County
Out of a total of 993 students who are enrolled in schools in San Miguel CDP Contra Costa County, 140 (14.1%) attend a private institution, while the remaining 853 (85.9%) are enrolled in public schools. The age group of 3 to 4 year olds has the highest likelihood of being enrolled in private schools, with 12 (100.0% in the age bracket) enrolled. Conversely, the age group of 10 to 14 year olds has the lowest likelihood of being enrolled in a private school, with 449 (100.0% in the age bracket) attending a public institution.
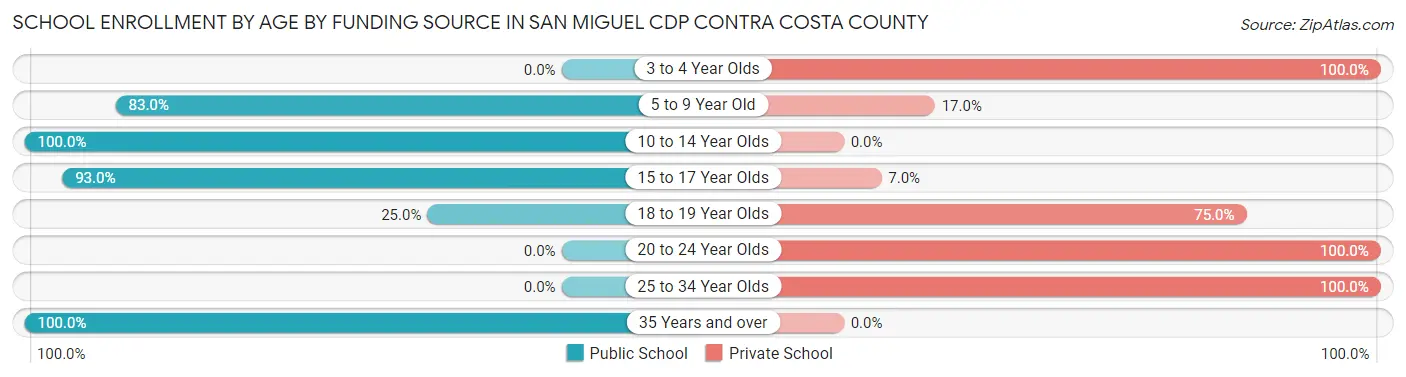
| Age Bracket | Public School | Private School |
| 3 to 4 Year Olds | 0 (0.0%) | 12 (100.0%) |
| 5 to 9 Year Old | 142 (83.0%) | 29 (17.0%) |
| 10 to 14 Year Olds | 449 (100.0%) | 0 (0.0%) |
| 15 to 17 Year Olds | 225 (93.0%) | 17 (7.0%) |
| 18 to 19 Year Olds | 4 (25.0%) | 12 (75.0%) |
| 20 to 24 Year Olds | 0 (0.0%) | 42 (100.0%) |
| 25 to 34 Year Olds | 0 (0.0%) | 28 (100.0%) |
| 35 Years and over | 33 (100.0%) | 0 (0.0%) |
| Total | 853 (85.9%) | 140 (14.1%) |
Educational Attainment by Field of Study in San Miguel CDP Contra Costa County
Business (439 | 20.7%), engineering (323 | 15.2%), social sciences (218 | 10.3%), bio, nature & agricultural (212 | 10.0%), and communications (200 | 9.4%) are the most common fields of study among 2,118 individuals in San Miguel CDP Contra Costa County who have obtained a bachelor's degree or higher.
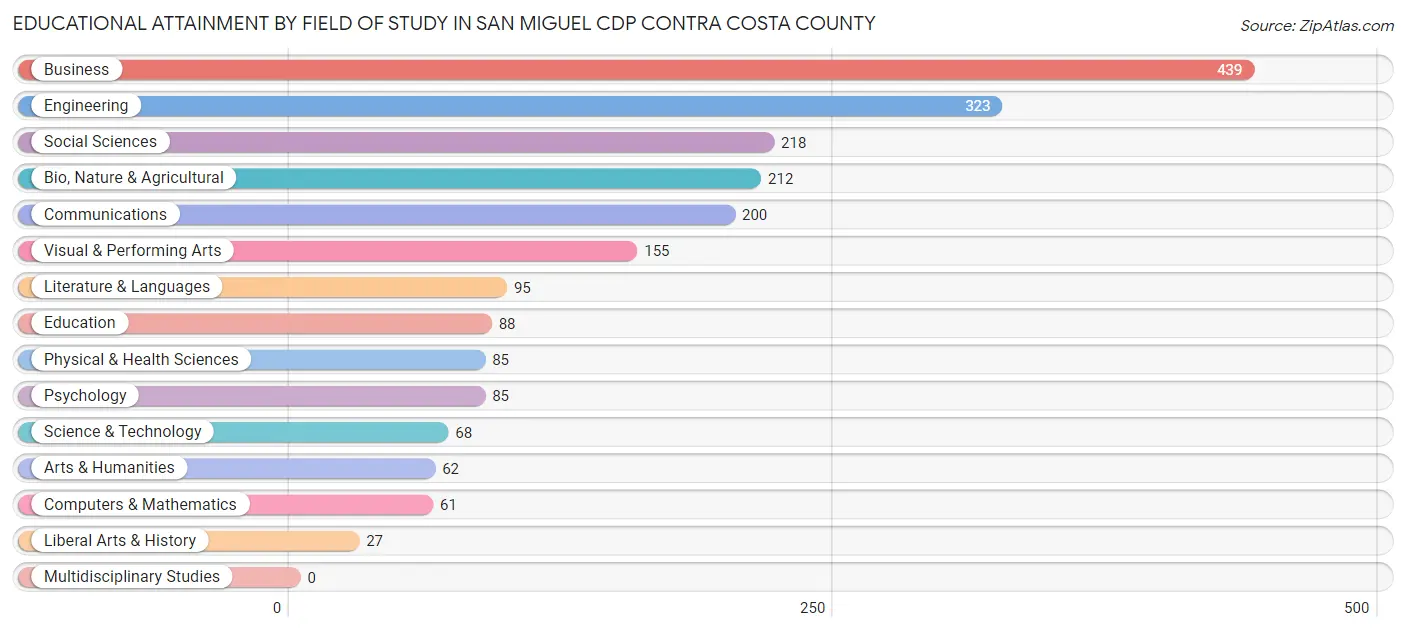
| Field of Study | # Graduates | % Graduates |
| Computers & Mathematics | 61 | 2.9% |
| Bio, Nature & Agricultural | 212 | 10.0% |
| Physical & Health Sciences | 85 | 4.0% |
| Psychology | 85 | 4.0% |
| Social Sciences | 218 | 10.3% |
| Engineering | 323 | 15.2% |
| Multidisciplinary Studies | 0 | 0.0% |
| Science & Technology | 68 | 3.2% |
| Business | 439 | 20.7% |
| Education | 88 | 4.2% |
| Literature & Languages | 95 | 4.5% |
| Liberal Arts & History | 27 | 1.3% |
| Visual & Performing Arts | 155 | 7.3% |
| Communications | 200 | 9.4% |
| Arts & Humanities | 62 | 2.9% |
| Total | 2,118 | 100.0% |
Transportation & Commute in San Miguel CDP Contra Costa County
Vehicle Availability by Sex in San Miguel CDP Contra Costa County
The most prevalent vehicle ownership categories in San Miguel CDP Contra Costa County are males with 3 vehicles (490, accounting for 42.8%) and females with 3 vehicles (306, making up 59.9%).
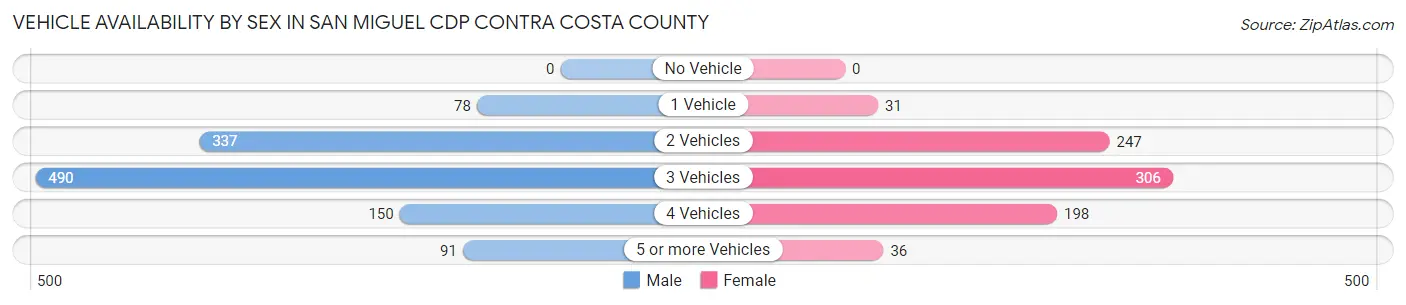
| Vehicles Available | Male | Female |
| No Vehicle | 0 (0.0%) | 0 (0.0%) |
| 1 Vehicle | 78 (6.8%) | 31 (3.8%) |
| 2 Vehicles | 337 (29.4%) | 247 (30.2%) |
| 3 Vehicles | 490 (42.8%) | 306 (37.4%) |
| 4 Vehicles | 150 (13.1%) | 198 (24.2%) |
| 5 or more Vehicles | 91 (7.9%) | 36 (4.4%) |
| Total | 1,146 (100.0%) | 818 (100.0%) |
Commute Time in San Miguel CDP Contra Costa County
The most frequently occuring commute durations in San Miguel CDP Contra Costa County are 30 to 34 minutes (300 commuters, 20.0%), 10 to 14 minutes (291 commuters, 19.4%), and 60 to 89 minutes (272 commuters, 18.1%).
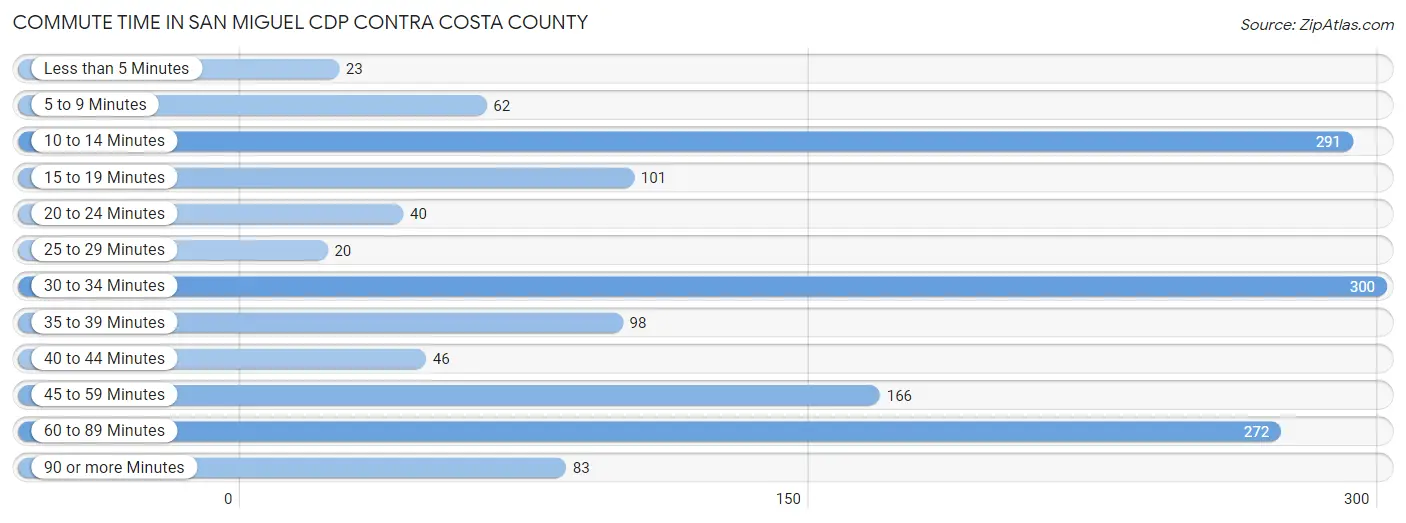
| Commute Time | # Commuters | % Commuters |
| Less than 5 Minutes | 23 | 1.5% |
| 5 to 9 Minutes | 62 | 4.1% |
| 10 to 14 Minutes | 291 | 19.4% |
| 15 to 19 Minutes | 101 | 6.7% |
| 20 to 24 Minutes | 40 | 2.7% |
| 25 to 29 Minutes | 20 | 1.3% |
| 30 to 34 Minutes | 300 | 20.0% |
| 35 to 39 Minutes | 98 | 6.5% |
| 40 to 44 Minutes | 46 | 3.1% |
| 45 to 59 Minutes | 166 | 11.1% |
| 60 to 89 Minutes | 272 | 18.1% |
| 90 or more Minutes | 83 | 5.5% |
Commute Time by Sex in San Miguel CDP Contra Costa County
The most common commute times in San Miguel CDP Contra Costa County are 10 to 14 minutes (221 commuters, 24.9%) for males and 60 to 89 minutes (157 commuters, 25.6%) for females.
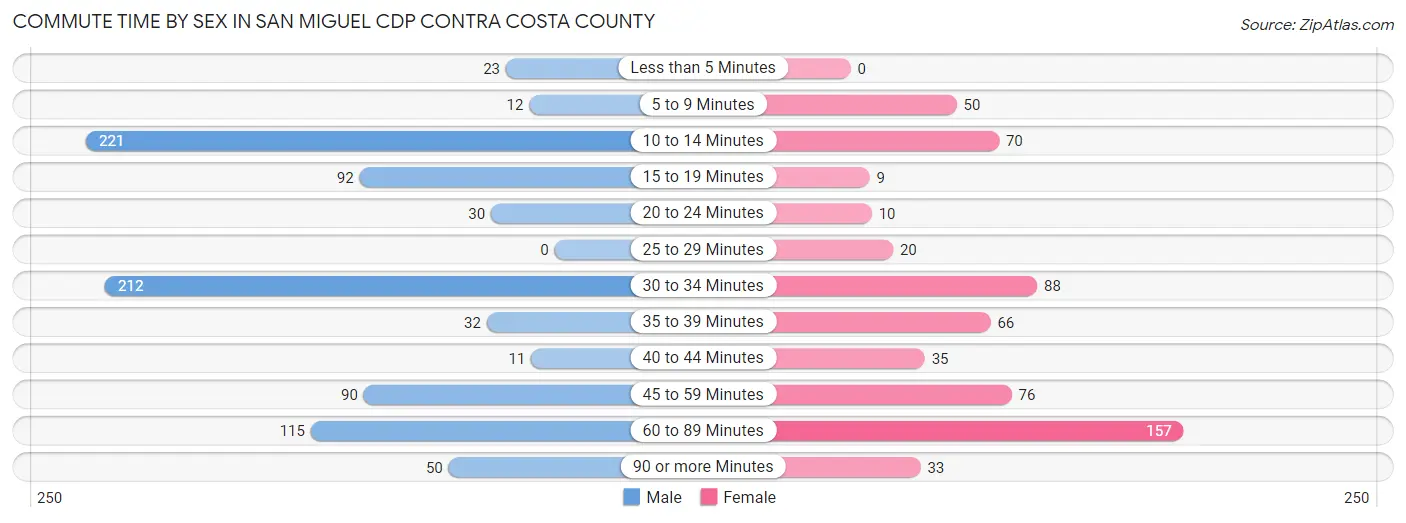
| Commute Time | Male | Female |
| Less than 5 Minutes | 23 (2.6%) | 0 (0.0%) |
| 5 to 9 Minutes | 12 (1.3%) | 50 (8.1%) |
| 10 to 14 Minutes | 221 (24.9%) | 70 (11.4%) |
| 15 to 19 Minutes | 92 (10.4%) | 9 (1.5%) |
| 20 to 24 Minutes | 30 (3.4%) | 10 (1.6%) |
| 25 to 29 Minutes | 0 (0.0%) | 20 (3.3%) |
| 30 to 34 Minutes | 212 (23.9%) | 88 (14.3%) |
| 35 to 39 Minutes | 32 (3.6%) | 66 (10.7%) |
| 40 to 44 Minutes | 11 (1.2%) | 35 (5.7%) |
| 45 to 59 Minutes | 90 (10.1%) | 76 (12.4%) |
| 60 to 89 Minutes | 115 (13.0%) | 157 (25.6%) |
| 90 or more Minutes | 50 (5.6%) | 33 (5.4%) |
Time of Departure to Work by Sex in San Miguel CDP Contra Costa County
The most frequent times of departure to work in San Miguel CDP Contra Costa County are 7:00 AM to 7:29 AM (246, 27.7%) for males and 7:00 AM to 7:29 AM (186, 30.3%) for females.
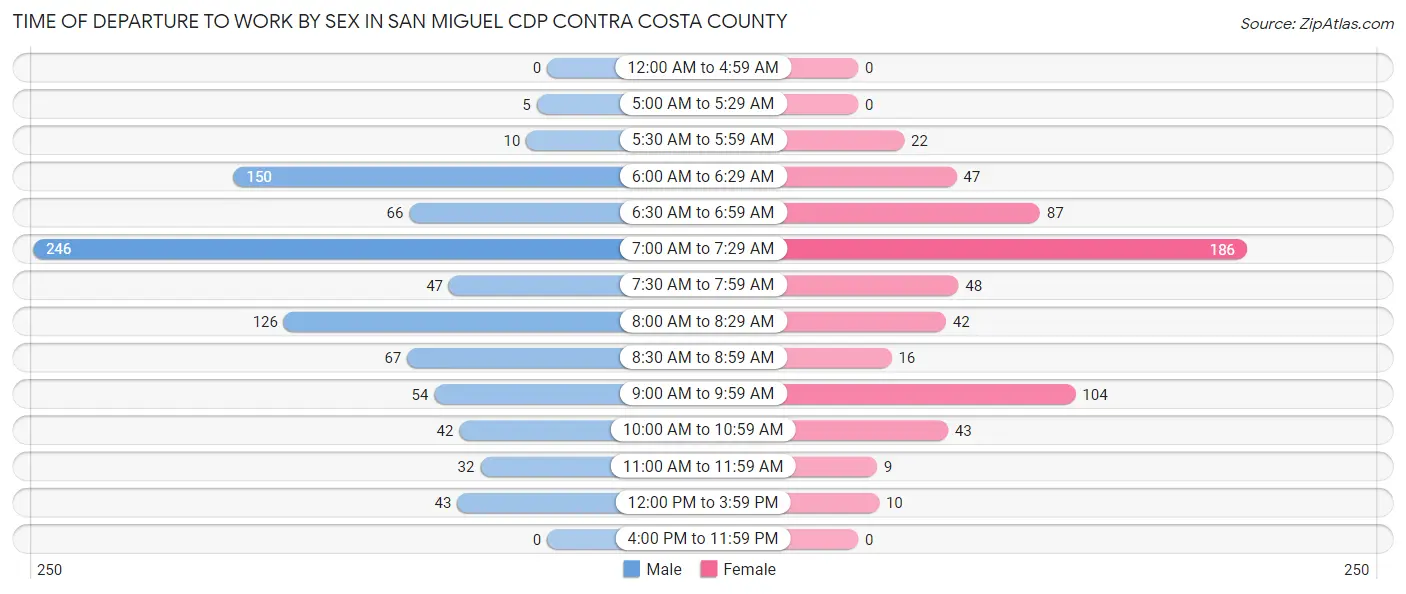
| Time of Departure | Male | Female |
| 12:00 AM to 4:59 AM | 0 (0.0%) | 0 (0.0%) |
| 5:00 AM to 5:29 AM | 5 (0.6%) | 0 (0.0%) |
| 5:30 AM to 5:59 AM | 10 (1.1%) | 22 (3.6%) |
| 6:00 AM to 6:29 AM | 150 (16.9%) | 47 (7.6%) |
| 6:30 AM to 6:59 AM | 66 (7.4%) | 87 (14.2%) |
| 7:00 AM to 7:29 AM | 246 (27.7%) | 186 (30.3%) |
| 7:30 AM to 7:59 AM | 47 (5.3%) | 48 (7.8%) |
| 8:00 AM to 8:29 AM | 126 (14.2%) | 42 (6.8%) |
| 8:30 AM to 8:59 AM | 67 (7.5%) | 16 (2.6%) |
| 9:00 AM to 9:59 AM | 54 (6.1%) | 104 (16.9%) |
| 10:00 AM to 10:59 AM | 42 (4.7%) | 43 (7.0%) |
| 11:00 AM to 11:59 AM | 32 (3.6%) | 9 (1.5%) |
| 12:00 PM to 3:59 PM | 43 (4.8%) | 10 (1.6%) |
| 4:00 PM to 11:59 PM | 0 (0.0%) | 0 (0.0%) |
| Total | 888 (100.0%) | 614 (100.0%) |
Housing Occupancy in San Miguel CDP Contra Costa County
Occupancy by Ownership in San Miguel CDP Contra Costa County
Of the total 1,349 dwellings in San Miguel CDP Contra Costa County, owner-occupied units account for 1,238 (91.8%), while renter-occupied units make up 111 (8.2%).
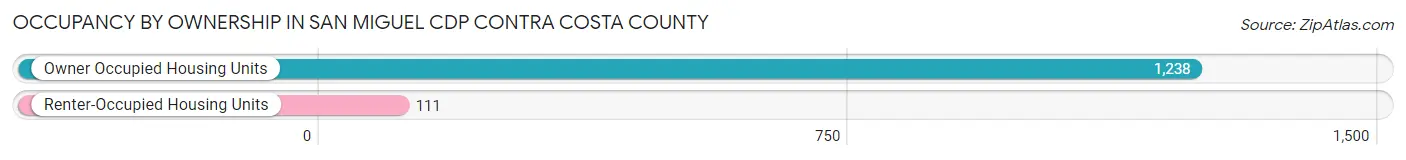
| Occupancy | # Housing Units | % Housing Units |
| Owner Occupied Housing Units | 1,238 | 91.8% |
| Renter-Occupied Housing Units | 111 | 8.2% |
| Total Occupied Housing Units | 1,349 | 100.0% |
Occupancy by Household Size in San Miguel CDP Contra Costa County
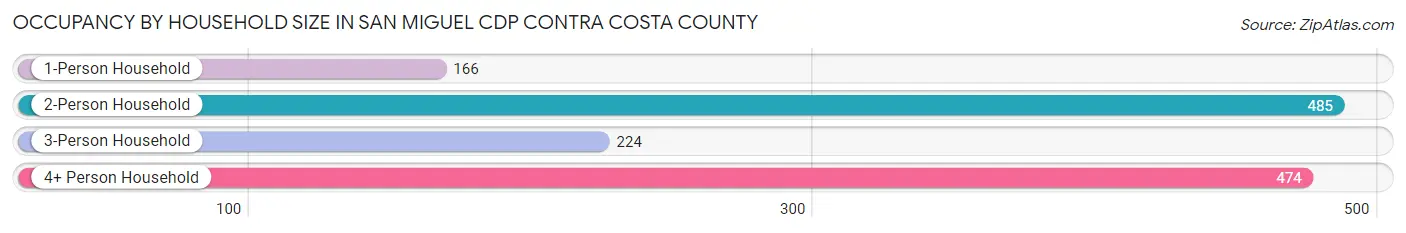
| Household Size | # Housing Units | % Housing Units |
| 1-Person Household | 166 | 12.3% |
| 2-Person Household | 485 | 35.9% |
| 3-Person Household | 224 | 16.6% |
| 4+ Person Household | 474 | 35.1% |
| Total Housing Units | 1,349 | 100.0% |
Occupancy by Ownership by Household Size in San Miguel CDP Contra Costa County
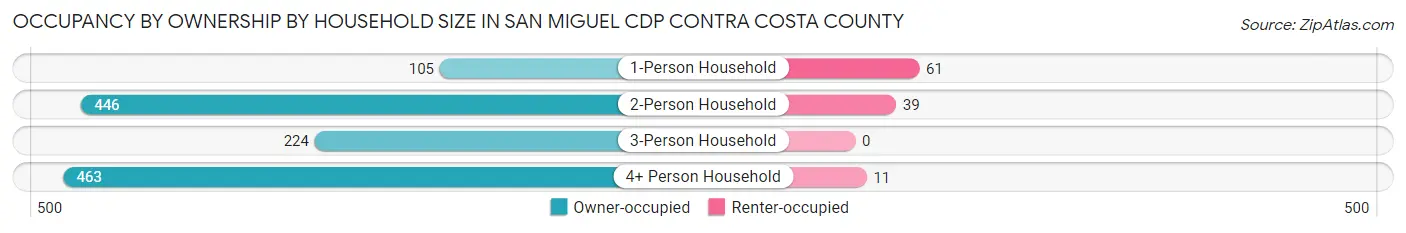
| Household Size | Owner-occupied | Renter-occupied |
| 1-Person Household | 105 (63.2%) | 61 (36.7%) |
| 2-Person Household | 446 (92.0%) | 39 (8.0%) |
| 3-Person Household | 224 (100.0%) | 0 (0.0%) |
| 4+ Person Household | 463 (97.7%) | 11 (2.3%) |
| Total Housing Units | 1,238 (91.8%) | 111 (8.2%) |
Occupancy by Educational Attainment in San Miguel CDP Contra Costa County
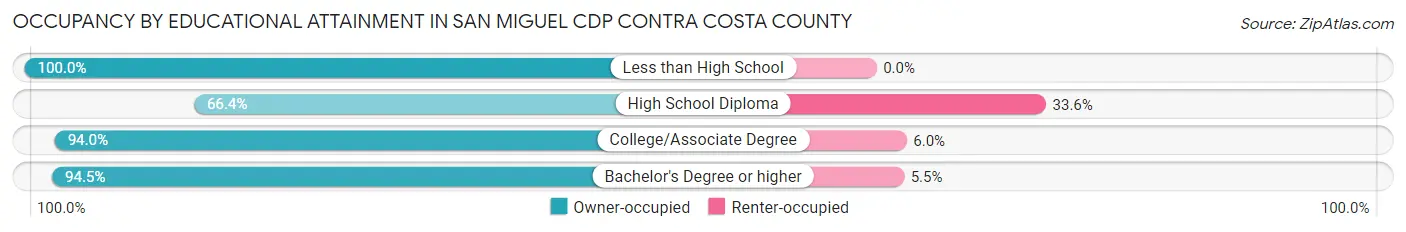
| Household Size | Owner-occupied | Renter-occupied |
| Less than High School | 8 (100.0%) | 0 (0.0%) |
| High School Diploma | 87 (66.4%) | 44 (33.6%) |
| College/Associate Degree | 173 (94.0%) | 11 (6.0%) |
| Bachelor's Degree or higher | 970 (94.5%) | 56 (5.5%) |
Occupancy by Age of Householder in San Miguel CDP Contra Costa County
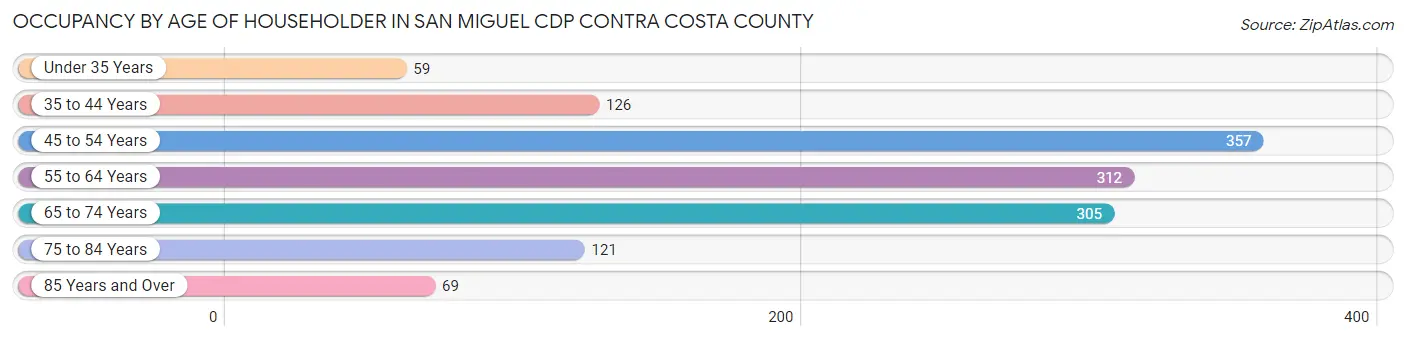
| Age Bracket | # Households | % Households |
| Under 35 Years | 59 | 4.4% |
| 35 to 44 Years | 126 | 9.3% |
| 45 to 54 Years | 357 | 26.5% |
| 55 to 64 Years | 312 | 23.1% |
| 65 to 74 Years | 305 | 22.6% |
| 75 to 84 Years | 121 | 9.0% |
| 85 Years and Over | 69 | 5.1% |
| Total | 1,349 | 100.0% |
Housing Finances in San Miguel CDP Contra Costa County
Median Income by Occupancy in San Miguel CDP Contra Costa County
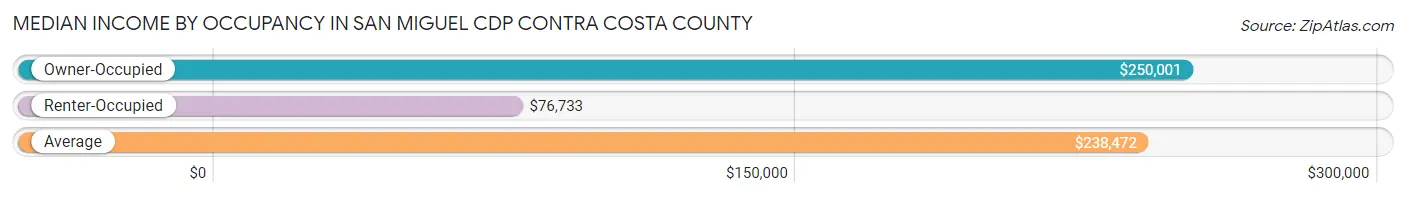
| Occupancy Type | # Households | Median Income |
| Owner-Occupied | 1,238 (91.8%) | $250,001 |
| Renter-Occupied | 111 (8.2%) | $76,733 |
| Average | 1,349 (100.0%) | $238,472 |
Occupancy by Householder Income Bracket in San Miguel CDP Contra Costa County
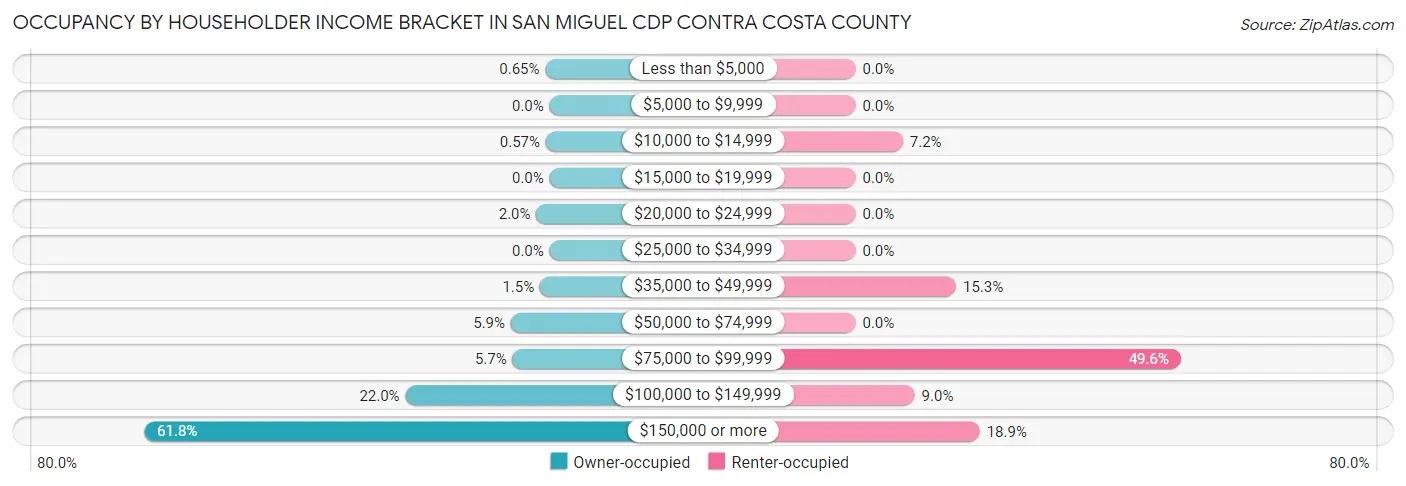
| Income Bracket | Owner-occupied | Renter-occupied |
| Less than $5,000 | 8 (0.6%) | 0 (0.0%) |
| $5,000 to $9,999 | 0 (0.0%) | 0 (0.0%) |
| $10,000 to $14,999 | 7 (0.6%) | 8 (7.2%) |
| $15,000 to $19,999 | 0 (0.0%) | 0 (0.0%) |
| $20,000 to $24,999 | 25 (2.0%) | 0 (0.0%) |
| $25,000 to $34,999 | 0 (0.0%) | 0 (0.0%) |
| $35,000 to $49,999 | 18 (1.5%) | 17 (15.3%) |
| $50,000 to $74,999 | 73 (5.9%) | 0 (0.0%) |
| $75,000 to $99,999 | 70 (5.7%) | 55 (49.5%) |
| $100,000 to $149,999 | 272 (22.0%) | 10 (9.0%) |
| $150,000 or more | 765 (61.8%) | 21 (18.9%) |
| Total | 1,238 (100.0%) | 111 (100.0%) |
Monthly Housing Cost Tiers in San Miguel CDP Contra Costa County
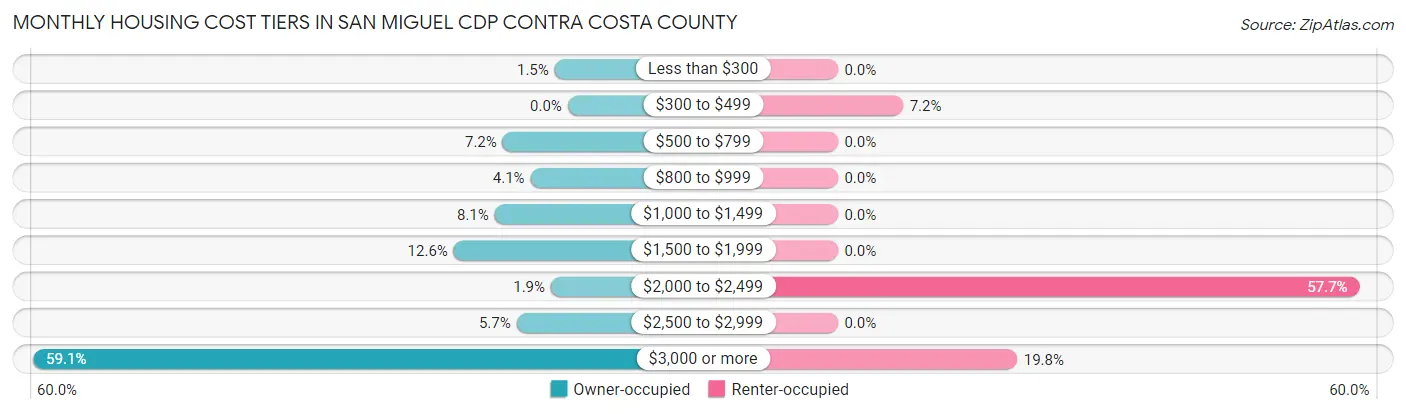
| Monthly Cost | Owner-occupied | Renter-occupied |
| Less than $300 | 18 (1.5%) | 0 (0.0%) |
| $300 to $499 | 0 (0.0%) | 8 (7.2%) |
| $500 to $799 | 89 (7.2%) | 0 (0.0%) |
| $800 to $999 | 51 (4.1%) | 0 (0.0%) |
| $1,000 to $1,499 | 100 (8.1%) | 0 (0.0%) |
| $1,500 to $1,999 | 156 (12.6%) | 0 (0.0%) |
| $2,000 to $2,499 | 23 (1.9%) | 64 (57.7%) |
| $2,500 to $2,999 | 70 (5.7%) | 0 (0.0%) |
| $3,000 or more | 731 (59.1%) | 22 (19.8%) |
| Total | 1,238 (100.0%) | 111 (100.0%) |
Physical Housing Characteristics in San Miguel CDP Contra Costa County
Housing Structures in San Miguel CDP Contra Costa County
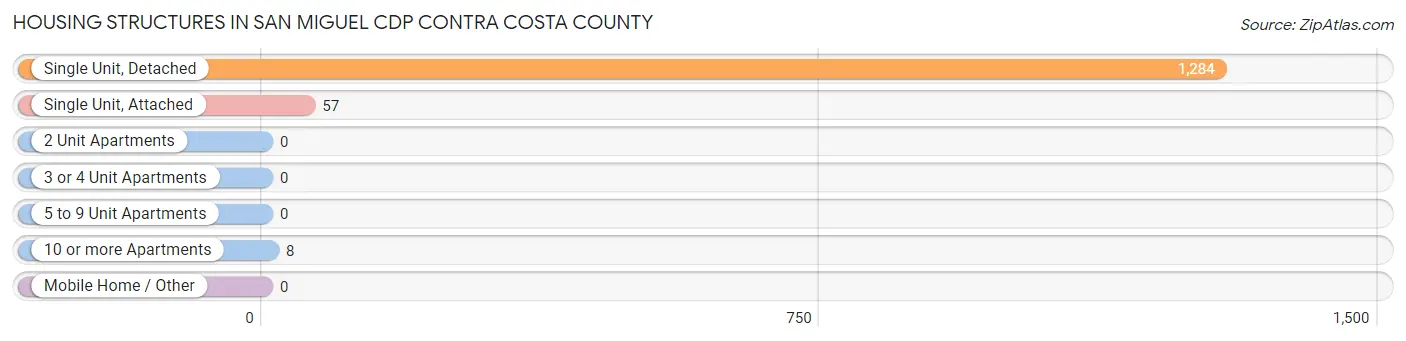
| Structure Type | # Housing Units | % Housing Units |
| Single Unit, Detached | 1,284 | 95.2% |
| Single Unit, Attached | 57 | 4.2% |
| 2 Unit Apartments | 0 | 0.0% |
| 3 or 4 Unit Apartments | 0 | 0.0% |
| 5 to 9 Unit Apartments | 0 | 0.0% |
| 10 or more Apartments | 8 | 0.6% |
| Mobile Home / Other | 0 | 0.0% |
| Total | 1,349 | 100.0% |
Housing Structures by Occupancy in San Miguel CDP Contra Costa County
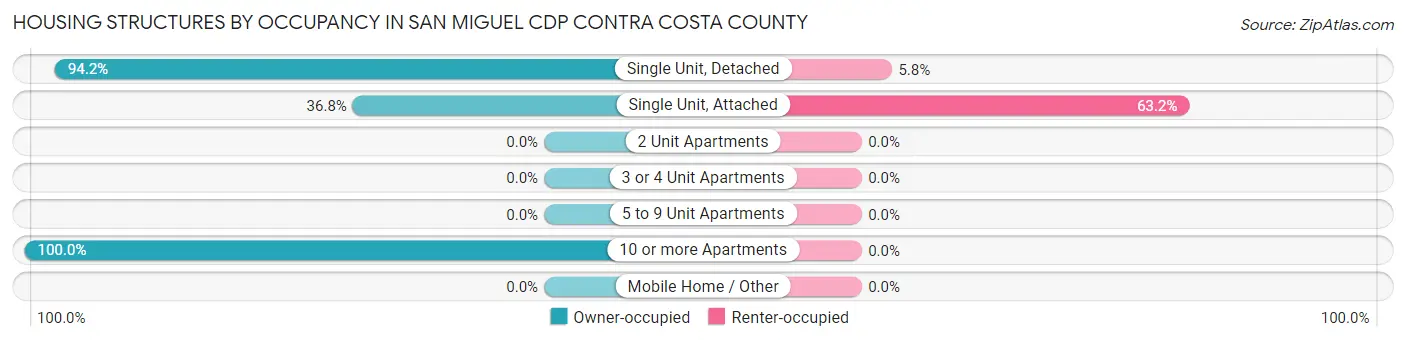
| Structure Type | Owner-occupied | Renter-occupied |
| Single Unit, Detached | 1,209 (94.2%) | 75 (5.8%) |
| Single Unit, Attached | 21 (36.8%) | 36 (63.2%) |
| 2 Unit Apartments | 0 (0.0%) | 0 (0.0%) |
| 3 or 4 Unit Apartments | 0 (0.0%) | 0 (0.0%) |
| 5 to 9 Unit Apartments | 0 (0.0%) | 0 (0.0%) |
| 10 or more Apartments | 8 (100.0%) | 0 (0.0%) |
| Mobile Home / Other | 0 (0.0%) | 0 (0.0%) |
| Total | 1,238 (91.8%) | 111 (8.2%) |
Housing Structures by Number of Rooms in San Miguel CDP Contra Costa County
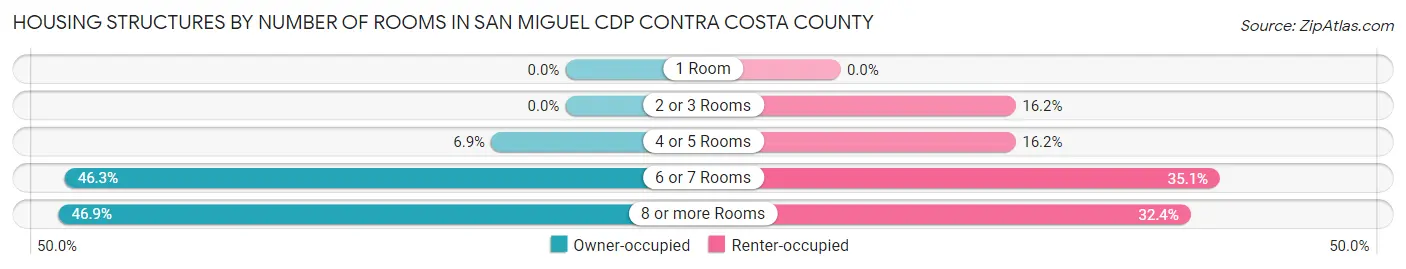
| Number of Rooms | Owner-occupied | Renter-occupied |
| 1 Room | 0 (0.0%) | 0 (0.0%) |
| 2 or 3 Rooms | 0 (0.0%) | 18 (16.2%) |
| 4 or 5 Rooms | 85 (6.9%) | 18 (16.2%) |
| 6 or 7 Rooms | 573 (46.3%) | 39 (35.1%) |
| 8 or more Rooms | 580 (46.9%) | 36 (32.4%) |
| Total | 1,238 (100.0%) | 111 (100.0%) |
Housing Structure by Heating Type in San Miguel CDP Contra Costa County
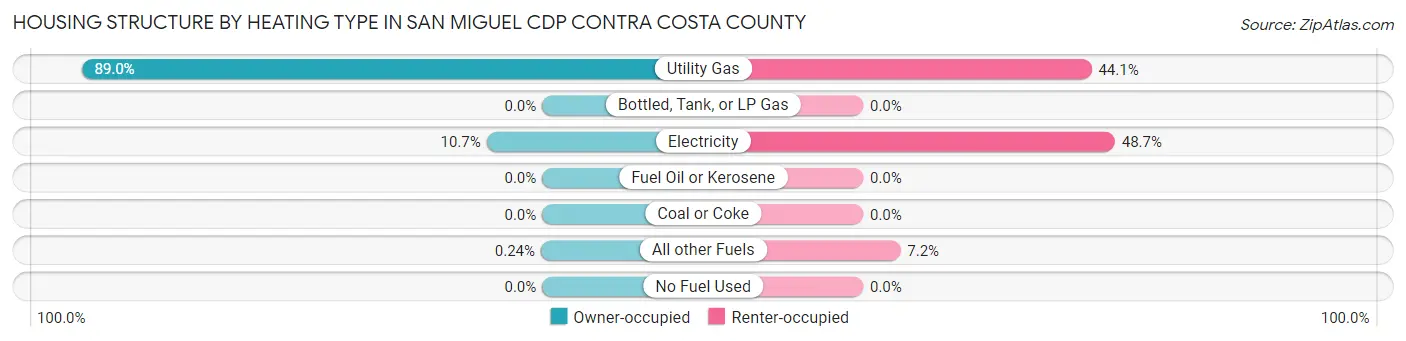
| Heating Type | Owner-occupied | Renter-occupied |
| Utility Gas | 1,102 (89.0%) | 49 (44.1%) |
| Bottled, Tank, or LP Gas | 0 (0.0%) | 0 (0.0%) |
| Electricity | 133 (10.7%) | 54 (48.6%) |
| Fuel Oil or Kerosene | 0 (0.0%) | 0 (0.0%) |
| Coal or Coke | 0 (0.0%) | 0 (0.0%) |
| All other Fuels | 3 (0.2%) | 8 (7.2%) |
| No Fuel Used | 0 (0.0%) | 0 (0.0%) |
| Total | 1,238 (100.0%) | 111 (100.0%) |
Household Vehicle Usage in San Miguel CDP Contra Costa County
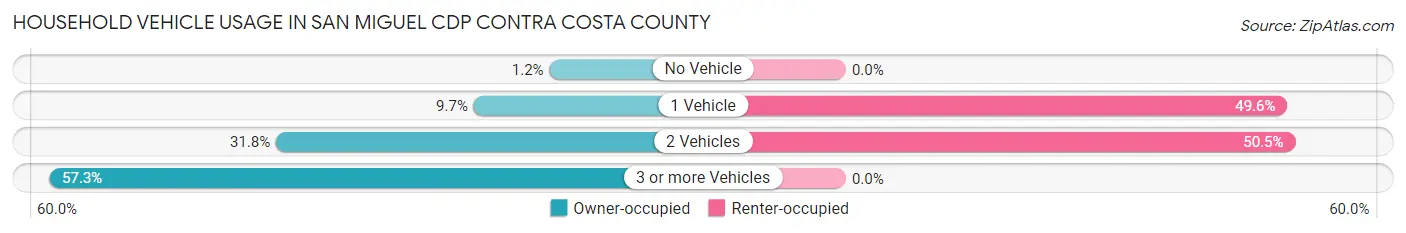
| Vehicles per Household | Owner-occupied | Renter-occupied |
| No Vehicle | 15 (1.2%) | 0 (0.0%) |
| 1 Vehicle | 120 (9.7%) | 55 (49.5%) |
| 2 Vehicles | 394 (31.8%) | 56 (50.4%) |
| 3 or more Vehicles | 709 (57.3%) | 0 (0.0%) |
| Total | 1,238 (100.0%) | 111 (100.0%) |
Real Estate & Mortgages in San Miguel CDP Contra Costa County
Real Estate and Mortgage Overview in San Miguel CDP Contra Costa County
| Characteristic | Without Mortgage | With Mortgage |
| Housing Units | 291 | 947 |
| Median Property Value | $1,474,000 | $1,588,700 |
| Median Household Income | $108,693 | $676 |
| Monthly Housing Costs | $892 | $724 |
| Real Estate Taxes | $4,643 | $0 |
Property Value by Mortgage Status in San Miguel CDP Contra Costa County
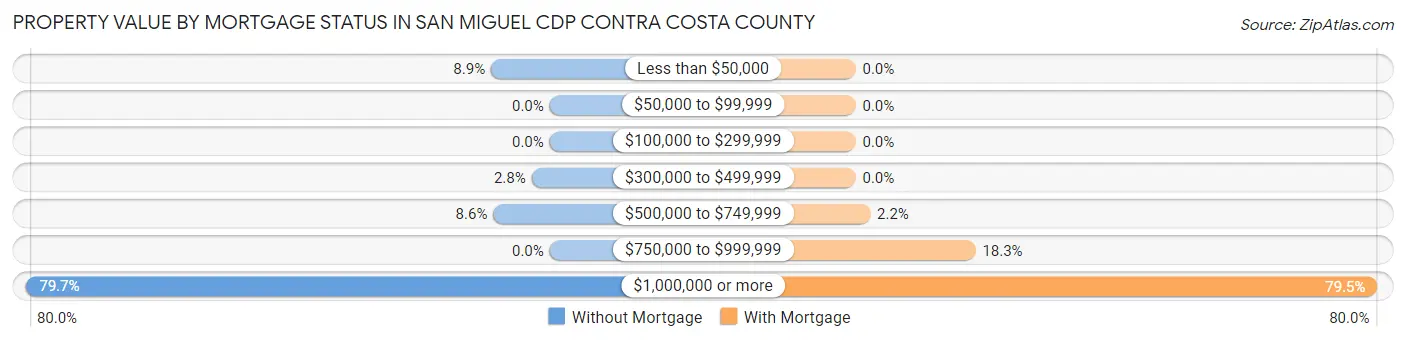
| Property Value | Without Mortgage | With Mortgage |
| Less than $50,000 | 26 (8.9%) | 0 (0.0%) |
| $50,000 to $99,999 | 0 (0.0%) | 0 (0.0%) |
| $100,000 to $299,999 | 0 (0.0%) | 0 (0.0%) |
| $300,000 to $499,999 | 8 (2.8%) | 0 (0.0%) |
| $500,000 to $749,999 | 25 (8.6%) | 21 (2.2%) |
| $750,000 to $999,999 | 0 (0.0%) | 173 (18.3%) |
| $1,000,000 or more | 232 (79.7%) | 753 (79.5%) |
| Total | 291 (100.0%) | 947 (100.0%) |
Household Income by Mortgage Status in San Miguel CDP Contra Costa County
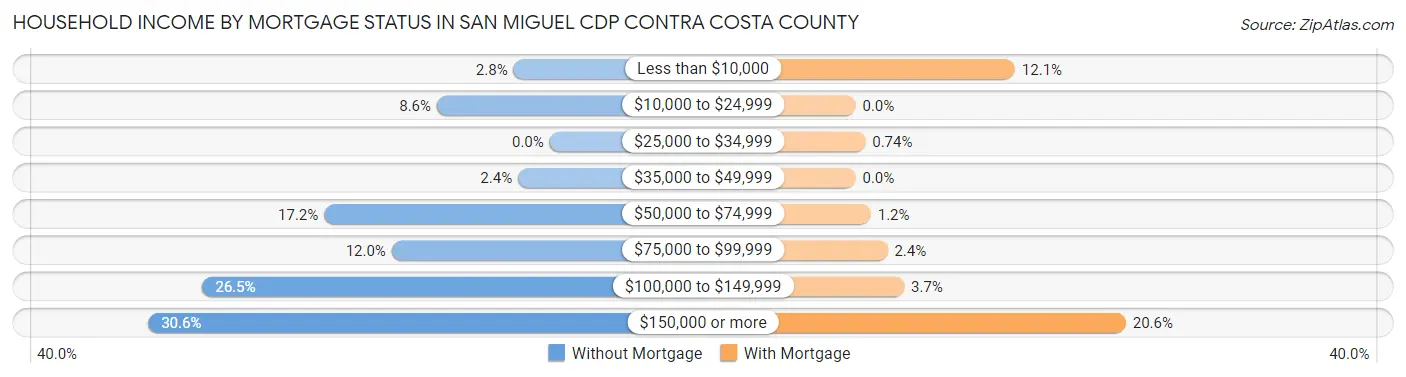
| Household Income | Without Mortgage | With Mortgage |
| Less than $10,000 | 8 (2.8%) | 115 (12.1%) |
| $10,000 to $24,999 | 25 (8.6%) | 0 (0.0%) |
| $25,000 to $34,999 | 0 (0.0%) | 7 (0.7%) |
| $35,000 to $49,999 | 7 (2.4%) | 0 (0.0%) |
| $50,000 to $74,999 | 50 (17.2%) | 11 (1.2%) |
| $75,000 to $99,999 | 35 (12.0%) | 23 (2.4%) |
| $100,000 to $149,999 | 77 (26.5%) | 35 (3.7%) |
| $150,000 or more | 89 (30.6%) | 195 (20.6%) |
| Total | 291 (100.0%) | 947 (100.0%) |
Property Value to Household Income Ratio in San Miguel CDP Contra Costa County
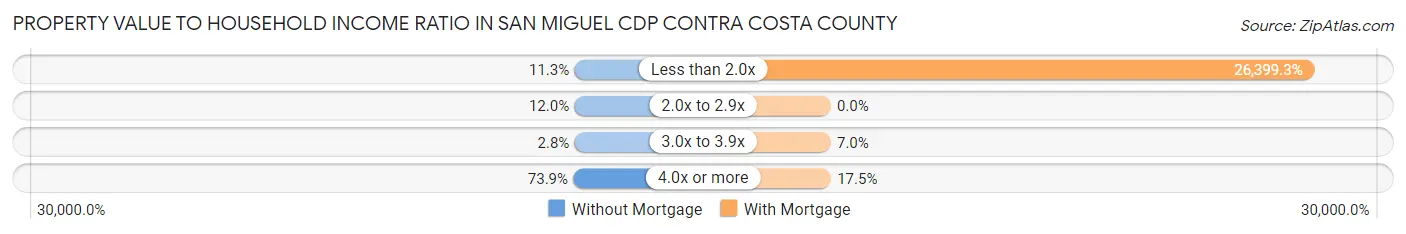
| Value-to-Income Ratio | Without Mortgage | With Mortgage |
| Less than 2.0x | 33 (11.3%) | 250,001 (26,399.3%) |
| 2.0x to 2.9x | 35 (12.0%) | 0 (0.0%) |
| 3.0x to 3.9x | 8 (2.8%) | 66 (7.0%) |
| 4.0x or more | 215 (73.9%) | 166 (17.5%) |
| Total | 291 (100.0%) | 947 (100.0%) |
Real Estate Taxes by Mortgage Status in San Miguel CDP Contra Costa County
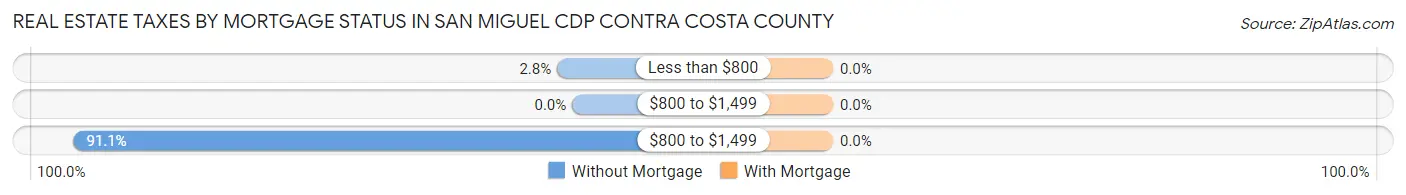
| Property Taxes | Without Mortgage | With Mortgage |
| Less than $800 | 8 (2.8%) | 0 (0.0%) |
| $800 to $1,499 | 0 (0.0%) | 0 (0.0%) |
| $800 to $1,499 | 265 (91.1%) | 0 (0.0%) |
| Total | 291 (100.0%) | 947 (100.0%) |
Health & Disability in San Miguel CDP Contra Costa County
Health Insurance Coverage by Age in San Miguel CDP Contra Costa County
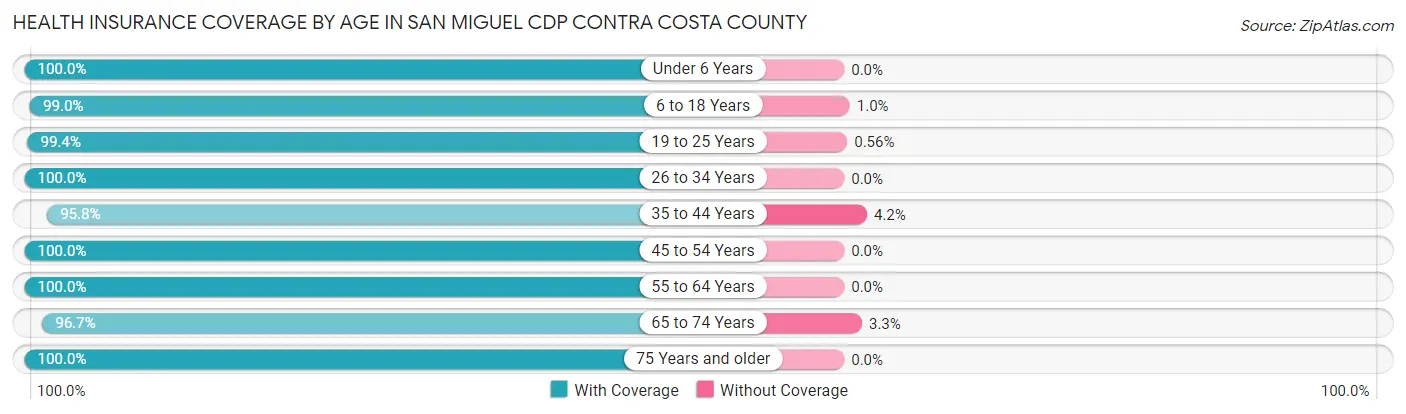
| Age Bracket | With Coverage | Without Coverage |
| Under 6 Years | 200 (100.0%) | 0 (0.0%) |
| 6 to 18 Years | 762 (99.0%) | 8 (1.0%) |
| 19 to 25 Years | 176 (99.4%) | 1 (0.6%) |
| 26 to 34 Years | 299 (100.0%) | 0 (0.0%) |
| 35 to 44 Years | 294 (95.8%) | 13 (4.2%) |
| 45 to 54 Years | 769 (100.0%) | 0 (0.0%) |
| 55 to 64 Years | 561 (100.0%) | 0 (0.0%) |
| 65 to 74 Years | 585 (96.7%) | 20 (3.3%) |
| 75 Years and older | 316 (100.0%) | 0 (0.0%) |
| Total | 3,962 (99.0%) | 42 (1.1%) |
Health Insurance Coverage by Citizenship Status in San Miguel CDP Contra Costa County
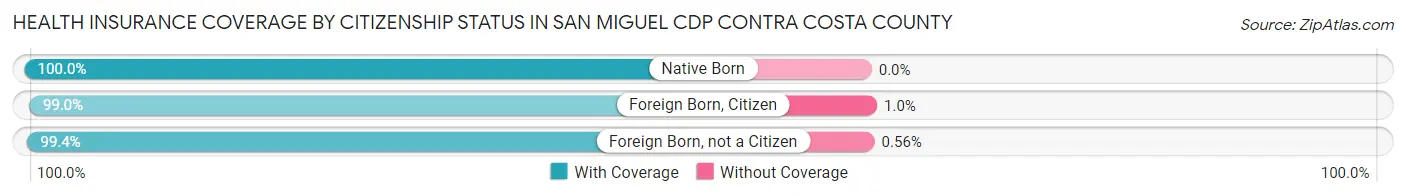
| Citizenship Status | With Coverage | Without Coverage |
| Native Born | 200 (100.0%) | 0 (0.0%) |
| Foreign Born, Citizen | 762 (99.0%) | 8 (1.0%) |
| Foreign Born, not a Citizen | 176 (99.4%) | 1 (0.6%) |
Health Insurance Coverage by Household Income in San Miguel CDP Contra Costa County
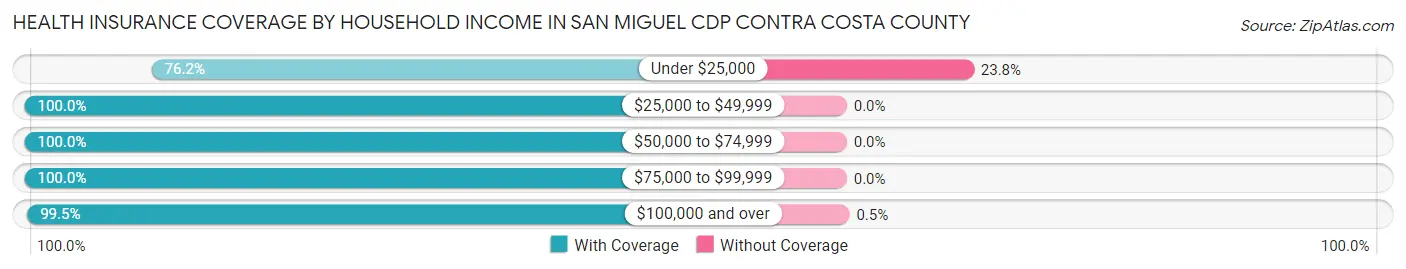
| Household Income | With Coverage | Without Coverage |
| Under $25,000 | 64 (76.2%) | 20 (23.8%) |
| $25,000 to $49,999 | 43 (100.0%) | 0 (0.0%) |
| $50,000 to $74,999 | 144 (100.0%) | 0 (0.0%) |
| $75,000 to $99,999 | 287 (100.0%) | 0 (0.0%) |
| $100,000 and over | 3,414 (99.5%) | 17 (0.5%) |
Public vs Private Health Insurance Coverage by Age in San Miguel CDP Contra Costa County
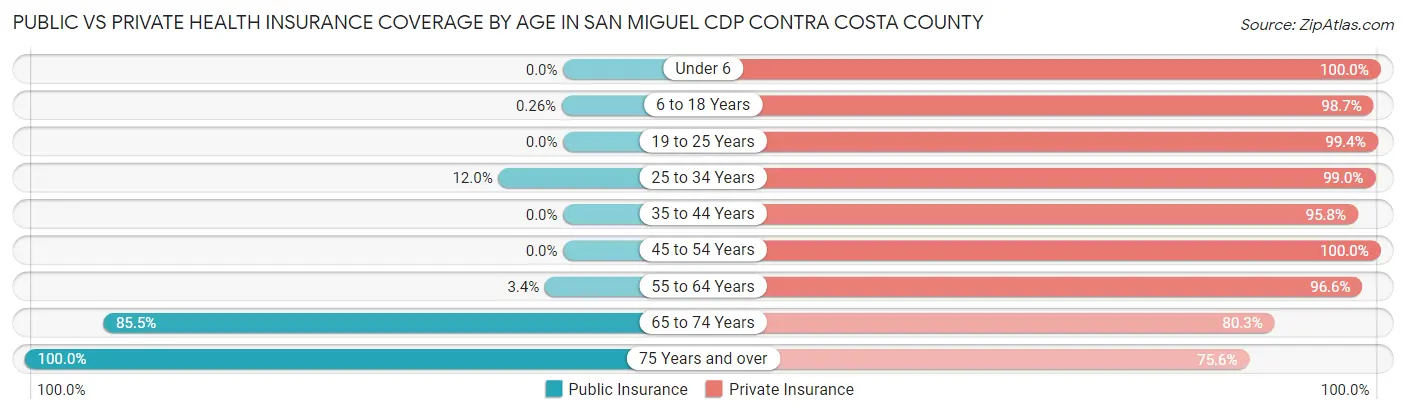
| Age Bracket | Public Insurance | Private Insurance |
| Under 6 | 0 (0.0%) | 200 (100.0%) |
| 6 to 18 Years | 2 (0.3%) | 760 (98.7%) |
| 19 to 25 Years | 0 (0.0%) | 176 (99.4%) |
| 25 to 34 Years | 36 (12.0%) | 296 (99.0%) |
| 35 to 44 Years | 0 (0.0%) | 294 (95.8%) |
| 45 to 54 Years | 0 (0.0%) | 769 (100.0%) |
| 55 to 64 Years | 19 (3.4%) | 542 (96.6%) |
| 65 to 74 Years | 517 (85.5%) | 486 (80.3%) |
| 75 Years and over | 316 (100.0%) | 239 (75.6%) |
| Total | 890 (22.2%) | 3,762 (94.0%) |
Disability Status by Sex by Age in San Miguel CDP Contra Costa County
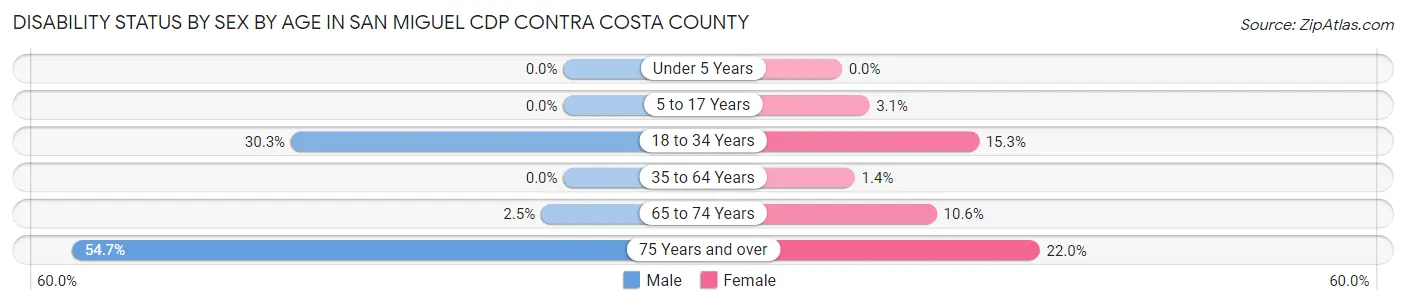
| Age Bracket | Male | Female |
| Under 5 Years | 0 (0.0%) | 0 (0.0%) |
| 5 to 17 Years | 0 (0.0%) | 11 (3.0%) |
| 18 to 34 Years | 81 (30.3%) | 34 (15.2%) |
| 35 to 64 Years | 0 (0.0%) | 12 (1.4%) |
| 65 to 74 Years | 8 (2.5%) | 30 (10.6%) |
| 75 Years and over | 81 (54.7%) | 37 (22.0%) |
Disability Class by Sex by Age in San Miguel CDP Contra Costa County
Disability Class: Hearing Difficulty
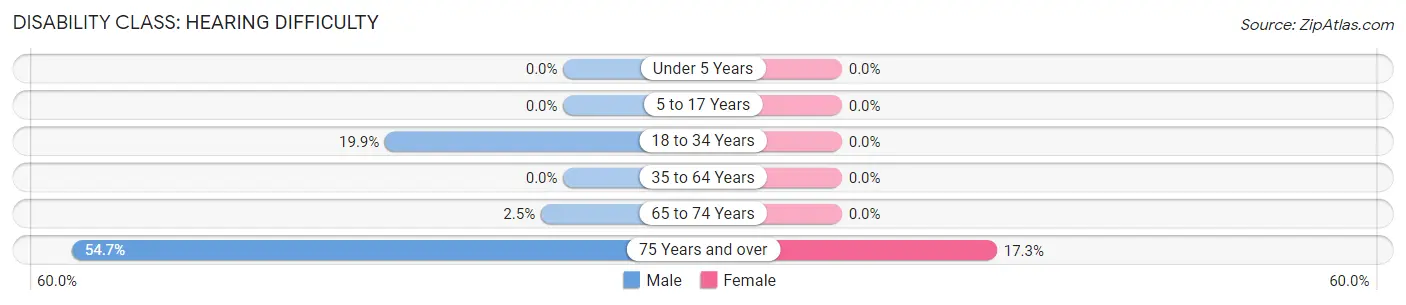
| Age Bracket | Male | Female |
| Under 5 Years | 0 (0.0%) | 0 (0.0%) |
| 5 to 17 Years | 0 (0.0%) | 0 (0.0%) |
| 18 to 34 Years | 53 (19.9%) | 0 (0.0%) |
| 35 to 64 Years | 0 (0.0%) | 0 (0.0%) |
| 65 to 74 Years | 8 (2.5%) | 0 (0.0%) |
| 75 Years and over | 81 (54.7%) | 29 (17.3%) |
Disability Class: Vision Difficulty
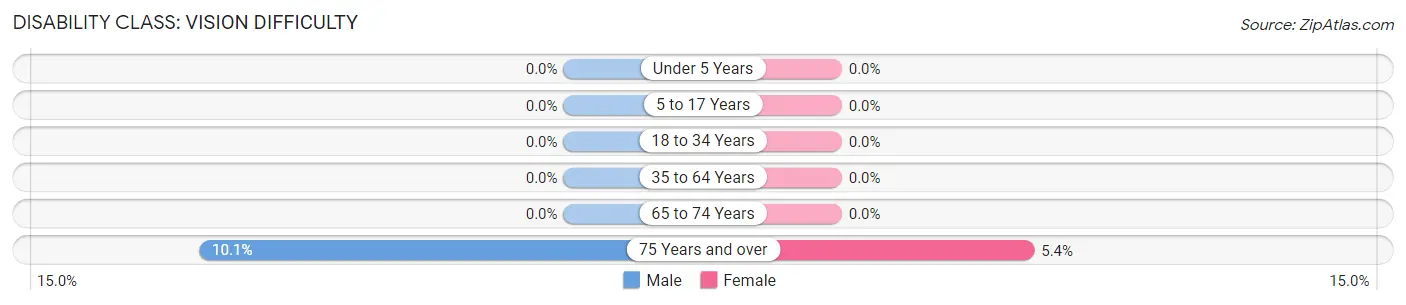
| Age Bracket | Male | Female |
| Under 5 Years | 0 (0.0%) | 0 (0.0%) |
| 5 to 17 Years | 0 (0.0%) | 0 (0.0%) |
| 18 to 34 Years | 0 (0.0%) | 0 (0.0%) |
| 35 to 64 Years | 0 (0.0%) | 0 (0.0%) |
| 65 to 74 Years | 0 (0.0%) | 0 (0.0%) |
| 75 Years and over | 15 (10.1%) | 9 (5.4%) |
Disability Class: Cognitive Difficulty
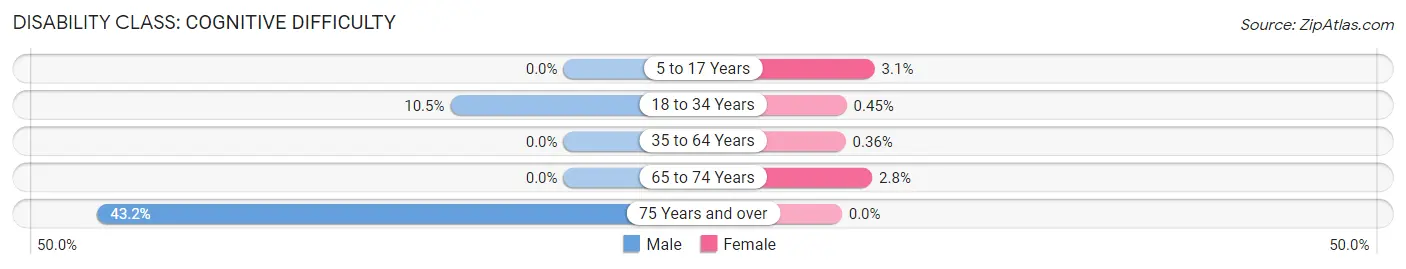
| Age Bracket | Male | Female |
| 5 to 17 Years | 0 (0.0%) | 11 (3.0%) |
| 18 to 34 Years | 28 (10.5%) | 1 (0.4%) |
| 35 to 64 Years | 0 (0.0%) | 3 (0.4%) |
| 65 to 74 Years | 0 (0.0%) | 8 (2.8%) |
| 75 Years and over | 64 (43.2%) | 0 (0.0%) |
Disability Class: Ambulatory Difficulty
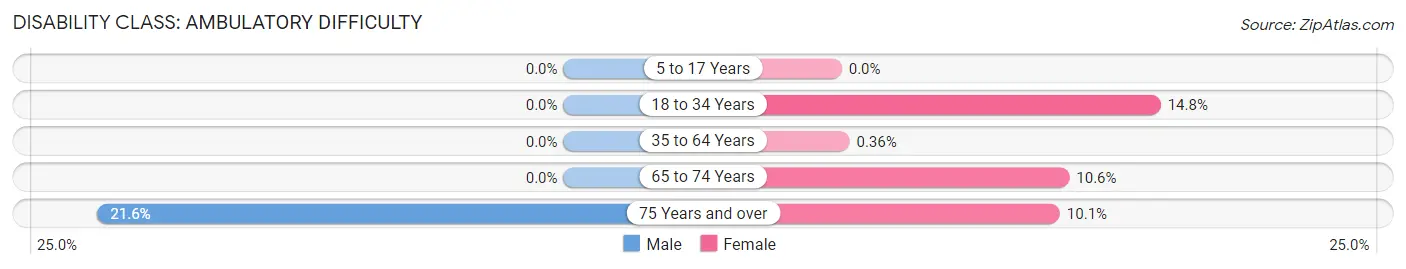
| Age Bracket | Male | Female |
| 5 to 17 Years | 0 (0.0%) | 0 (0.0%) |
| 18 to 34 Years | 0 (0.0%) | 33 (14.8%) |
| 35 to 64 Years | 0 (0.0%) | 3 (0.4%) |
| 65 to 74 Years | 0 (0.0%) | 30 (10.6%) |
| 75 Years and over | 32 (21.6%) | 17 (10.1%) |
Disability Class: Self-Care Difficulty
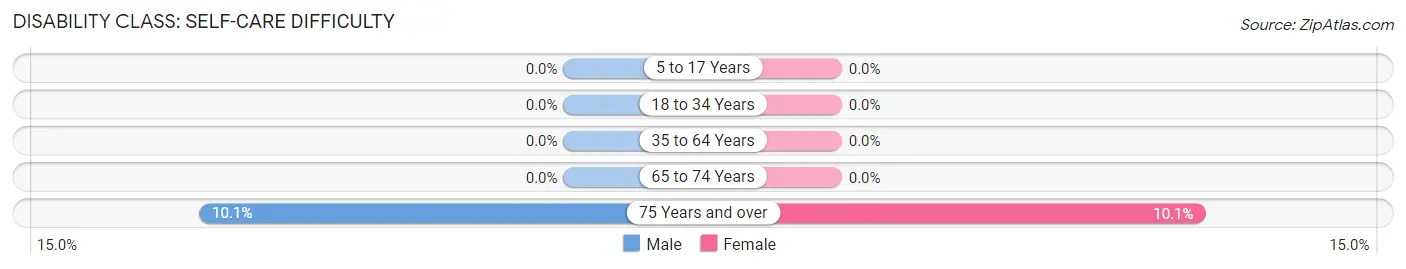
| Age Bracket | Male | Female |
| 5 to 17 Years | 0 (0.0%) | 0 (0.0%) |
| 18 to 34 Years | 0 (0.0%) | 0 (0.0%) |
| 35 to 64 Years | 0 (0.0%) | 0 (0.0%) |
| 65 to 74 Years | 0 (0.0%) | 0 (0.0%) |
| 75 Years and over | 15 (10.1%) | 17 (10.1%) |
Technology Access in San Miguel CDP Contra Costa County
Computing Device Access in San Miguel CDP Contra Costa County
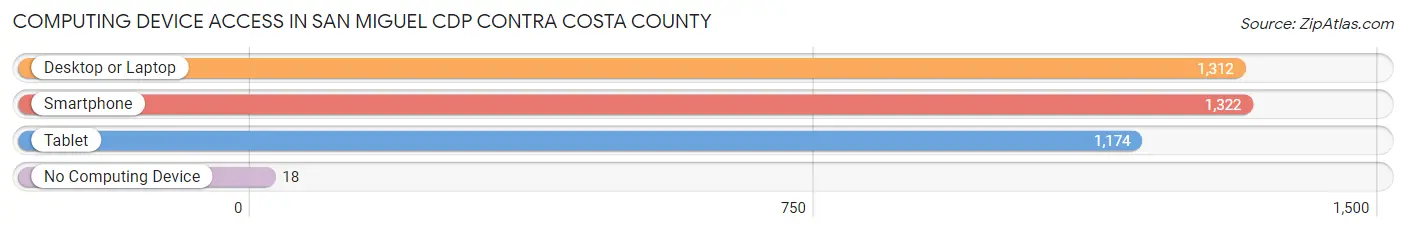
| Device Type | # Households | % Households |
| Desktop or Laptop | 1,312 | 97.3% |
| Smartphone | 1,322 | 98.0% |
| Tablet | 1,174 | 87.0% |
| No Computing Device | 18 | 1.3% |
| Total | 1,349 | 100.0% |
Internet Access in San Miguel CDP Contra Costa County
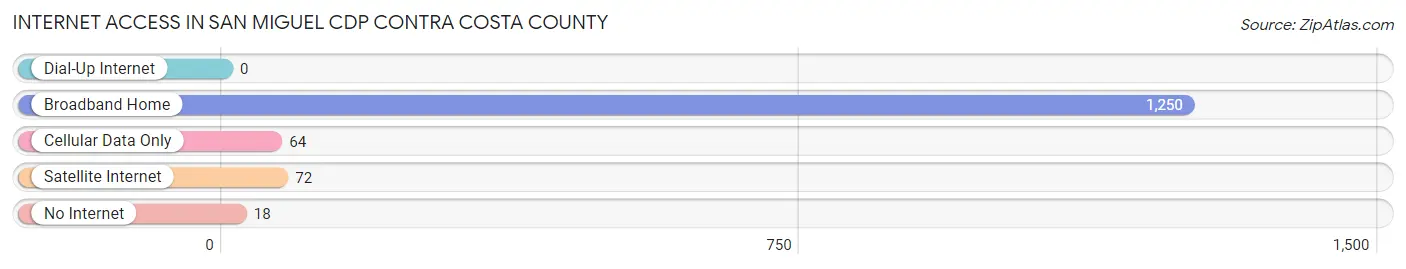
| Internet Type | # Households | % Households |
| Dial-Up Internet | 0 | 0.0% |
| Broadband Home | 1,250 | 92.7% |
| Cellular Data Only | 64 | 4.7% |
| Satellite Internet | 72 | 5.3% |
| No Internet | 18 | 1.3% |
| Total | 1,349 | 100.0% |
San Miguel CDP Contra Costa County Summary
Introduction
San Miguel CDP is a census-designated place (CDP) located in Contra Costa County, California. It is situated in the San Francisco Bay Area, and is part of the East Bay region. The population of San Miguel CDP was 2,845 at the 2010 census.
History
San Miguel CDP was originally inhabited by the Ohlone people, who were the first inhabitants of the area. The Ohlone people were hunter-gatherers who lived in the area for thousands of years before the arrival of Europeans.
In 1772, the Spanish explorer Don Gaspar de Portolà and his expedition passed through the area, and named it San Miguel. The area was later settled by Spanish colonists in the late 18th century.
In 1821, Mexico gained independence from Spain, and the area became part of Mexico. In 1848, the area was ceded to the United States as part of the Treaty of Guadalupe Hidalgo, which ended the Mexican-American War.
In the late 19th century, the area was settled by farmers and ranchers. The area was then annexed by the city of Martinez in the early 20th century.
Geography
San Miguel CDP is located in Contra Costa County, California. It is situated in the San Francisco Bay Area, and is part of the East Bay region. The CDP has a total area of 0.9 square miles, all of which is land.
The CDP is bordered by the city of Martinez to the north, the city of Pleasant Hill to the east, the city of Walnut Creek to the south, and the city of Concord to the west.
Economy
The economy of San Miguel CDP is largely based on the service industry. The CDP is home to a number of restaurants, retail stores, and other businesses.
Demographics
As of the 2010 census, the population of San Miguel CDP was 2,845. The racial makeup of the CDP was 63.2% White, 16.2% African American, 0.7% Native American, 11.2% Asian, 0.2% Pacific Islander, 5.2% from other races, and 3.3% from two or more races. Hispanic or Latino of any race were 16.7% of the population.
The median household income in San Miguel CDP was $63,917, and the median family income was $71,917. The per capita income for the CDP was $30,917.
Conclusion
San Miguel CDP is a census-designated place located in Contra Costa County, California. It is situated in the San Francisco Bay Area, and is part of the East Bay region. The population of San Miguel CDP was 2,845 at the 2010 census. The economy of San Miguel CDP is largely based on the service industry, and the racial makeup of the CDP was 63.2% White, 16.2% African American, 0.7% Native American, 11.2% Asian, 0.2% Pacific Islander, 5.2% from other races, and 3.3% from two or more races. The median household income in San Miguel CDP was $63,917, and the median family income was $71,917.
Common Questions
What is Per Capita Income in San Miguel CDP Contra Costa County?
Per Capita income in San Miguel CDP Contra Costa County is $102,486.
What is the Median Family Income in San Miguel CDP Contra Costa County?
Median Family Income in San Miguel CDP Contra Costa County is $250,001.
What is the Median Household income in San Miguel CDP Contra Costa County?
Median Household Income in San Miguel CDP Contra Costa County is $238,472.
What is Income or Wage Gap in San Miguel CDP Contra Costa County?
Income or Wage Gap in San Miguel CDP Contra Costa County is 4.0%.
Women in San Miguel CDP Contra Costa County earn 96.0 cents for every dollar earned by a man.
What is Inequality or Gini Index in San Miguel CDP Contra Costa County?
Inequality or Gini Index in San Miguel CDP Contra Costa County is 0.43.
What is the Total Population of San Miguel CDP Contra Costa County?
Total Population of San Miguel CDP Contra Costa County is 4,004.
What is the Total Male Population of San Miguel CDP Contra Costa County?
Total Male Population of San Miguel CDP Contra Costa County is 2,072.
What is the Total Female Population of San Miguel CDP Contra Costa County?
Total Female Population of San Miguel CDP Contra Costa County is 1,932.
What is the Ratio of Males per 100 Females in San Miguel CDP Contra Costa County?
There are 107.25 Males per 100 Females in San Miguel CDP Contra Costa County.
What is the Ratio of Females per 100 Males in San Miguel CDP Contra Costa County?
There are 93.24 Females per 100 Males in San Miguel CDP Contra Costa County.
What is the Median Population Age in San Miguel CDP Contra Costa County?
Median Population Age in San Miguel CDP Contra Costa County is 46.8 Years.
What is the Average Family Size in San Miguel CDP Contra Costa County
Average Family Size in San Miguel CDP Contra Costa County is 3.2 People.
What is the Average Household Size in San Miguel CDP Contra Costa County
Average Household Size in San Miguel CDP Contra Costa County is 3.0 People.
How Large is the Labor Force in San Miguel CDP Contra Costa County?
There are 2,069 People in the Labor Forcein in San Miguel CDP Contra Costa County.
What is the Percentage of People in the Labor Force in San Miguel CDP Contra Costa County?
66.2% of People are in the Labor Force in San Miguel CDP Contra Costa County.
What is the Unemployment Rate in San Miguel CDP Contra Costa County?
Unemployment Rate in San Miguel CDP Contra Costa County is 3.1%.