San Luis Obispo, CA Map & Demographics
San Luis Obispo Map
San Luis Obispo Overview
$41,749
PER CAPITA INCOME
$117,692
AVG FAMILY INCOME
$65,000
AVG HOUSEHOLD INCOME
26.9%
WAGE / INCOME GAP [ % ]
73.1¢/ $1
WAGE / INCOME GAP [ $ ]
$10,787
FAMILY INCOME DEFICIT
0.53
INEQUALITY / GINI INDEX
47,529
TOTAL POPULATION
24,099
MALE POPULATION
23,430
FEMALE POPULATION
102.86
MALES / 100 FEMALES
97.22
FEMALES / 100 MALES
25.2
MEDIAN AGE
2.7
AVG FAMILY SIZE
2.4
AVG HOUSEHOLD SIZE
26,926
LABOR FORCE [ PEOPLE ]
62.5%
PERCENT IN LABOR FORCE
6.9%
UNEMPLOYMENT RATE
San Luis Obispo Area Codes
Income in San Luis Obispo
Income Overview in San Luis Obispo
Per Capita Income in San Luis Obispo is $41,749, while median incomes of families and households are $117,692 and $65,000 respectively.
| Characteristic | Number | Measure |
| Per Capita Income | 47,529 | $41,749 |
| Median Family Income | 7,772 | $117,692 |
| Mean Family Income | 7,772 | $150,730 |
| Median Household Income | 19,254 | $65,000 |
| Mean Household Income | 19,254 | $102,391 |
| Income Deficit | 7,772 | $10,787 |
| Wage / Income Gap (%) | 47,529 | 26.89% |
| Wage / Income Gap ($) | 47,529 | 73.11¢ per $1 |
| Gini / Inequality Index | 47,529 | 0.53 |
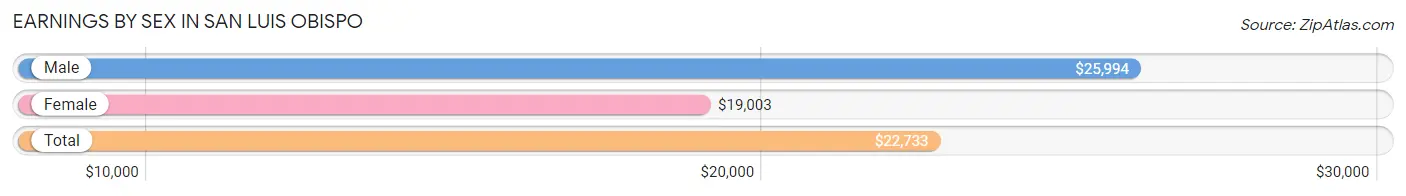
Earnings by Sex in San Luis Obispo
Average Earnings in San Luis Obispo are $22,733, $25,994 for men and $19,003 for women, a difference of 26.9%.
| Sex | Number | Average Earnings |
| Male | 16,455 (52.1%) | $25,994 |
| Female | 15,155 (47.9%) | $19,003 |
| Total | 31,610 (100.0%) | $22,733 |
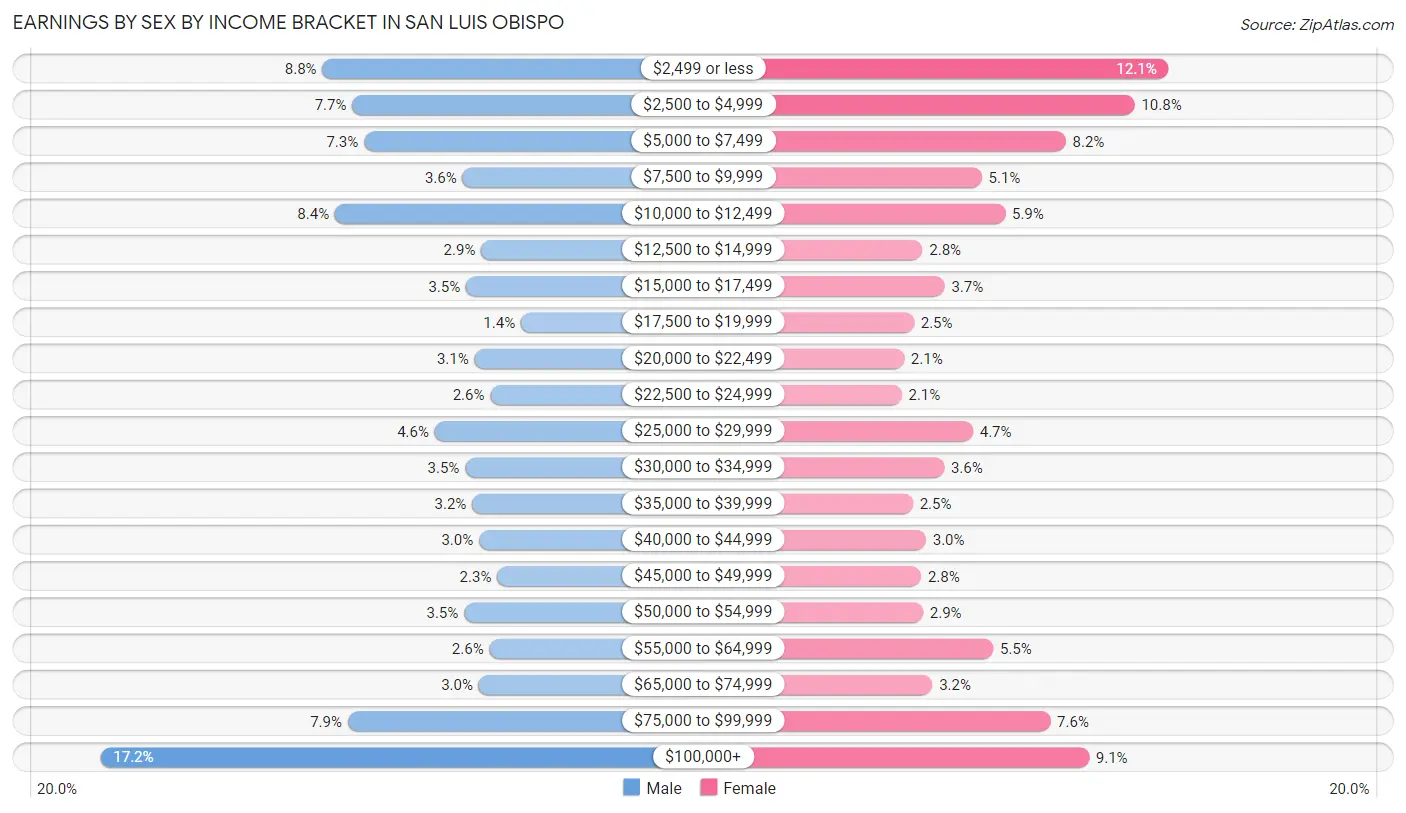
Earnings by Sex by Income Bracket in San Luis Obispo
The most common earnings brackets in San Luis Obispo are $100,000+ for men (2,824 | 17.2%) and $2,499 or less for women (1,827 | 12.1%).
| Income | Male | Female |
| $2,499 or less | 1,455 (8.8%) | 1,827 (12.1%) |
| $2,500 to $4,999 | 1,271 (7.7%) | 1,633 (10.8%) |
| $5,000 to $7,499 | 1,198 (7.3%) | 1,242 (8.2%) |
| $7,500 to $9,999 | 591 (3.6%) | 765 (5.1%) |
| $10,000 to $12,499 | 1,377 (8.4%) | 899 (5.9%) |
| $12,500 to $14,999 | 475 (2.9%) | 429 (2.8%) |
| $15,000 to $17,499 | 570 (3.5%) | 554 (3.7%) |
| $17,500 to $19,999 | 230 (1.4%) | 380 (2.5%) |
| $20,000 to $22,499 | 517 (3.1%) | 324 (2.1%) |
| $22,500 to $24,999 | 419 (2.5%) | 311 (2.1%) |
| $25,000 to $29,999 | 762 (4.6%) | 715 (4.7%) |
| $30,000 to $34,999 | 575 (3.5%) | 552 (3.6%) |
| $35,000 to $39,999 | 532 (3.2%) | 375 (2.5%) |
| $40,000 to $44,999 | 488 (3.0%) | 449 (3.0%) |
| $45,000 to $49,999 | 376 (2.3%) | 422 (2.8%) |
| $50,000 to $54,999 | 581 (3.5%) | 432 (2.9%) |
| $55,000 to $64,999 | 425 (2.6%) | 831 (5.5%) |
| $65,000 to $74,999 | 490 (3.0%) | 485 (3.2%) |
| $75,000 to $99,999 | 1,299 (7.9%) | 1,155 (7.6%) |
| $100,000+ | 2,824 (17.2%) | 1,375 (9.1%) |
| Total | 16,455 (100.0%) | 15,155 (100.0%) |
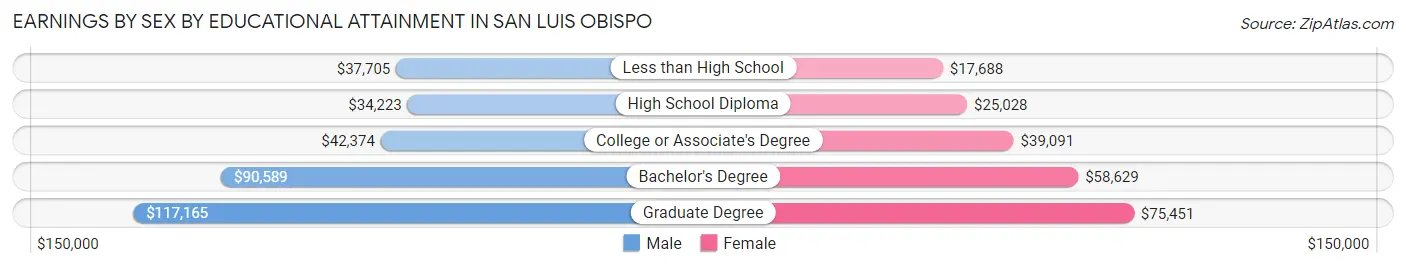
Earnings by Sex by Educational Attainment in San Luis Obispo
Average earnings in San Luis Obispo are $68,645 for men and $51,124 for women, a difference of 25.5%. Men with an educational attainment of graduate degree enjoy the highest average annual earnings of $117,165, while those with high school diploma education earn the least with $34,223. Women with an educational attainment of graduate degree earn the most with the average annual earnings of $75,451, while those with less than high school education have the smallest earnings of $17,688.
| Educational Attainment | Male Income | Female Income |
| Less than High School | $37,705 | $17,688 |
| High School Diploma | $34,223 | $25,028 |
| College or Associate's Degree | $42,374 | $39,091 |
| Bachelor's Degree | $90,589 | $58,629 |
| Graduate Degree | $117,165 | $75,451 |
| Total | $68,645 | $51,124 |
Family Income in San Luis Obispo
Family Income Brackets in San Luis Obispo
According to the San Luis Obispo family income data, there are 1,997 families falling into the $200,000+ income range, which is the most common income bracket and makes up 25.7% of all families. Conversely, the $10,000 to $14,999 income bracket is the least frequent group with only 117 families (1.5%) belonging to this category.
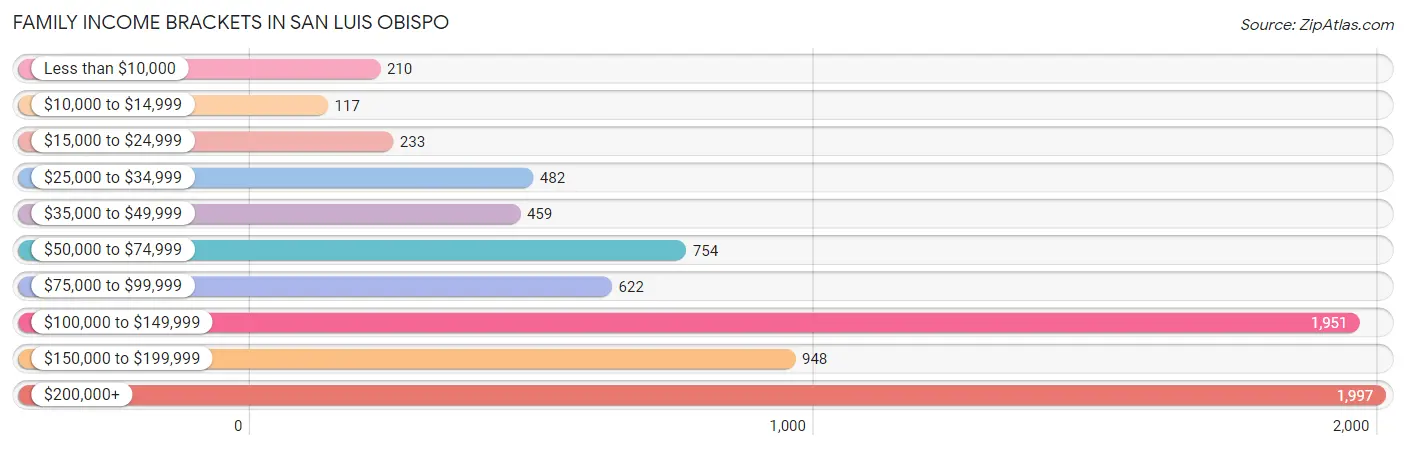
| Income Bracket | # Families | % Families |
| Less than $10,000 | 210 | 2.7% |
| $10,000 to $14,999 | 117 | 1.5% |
| $15,000 to $24,999 | 233 | 3.0% |
| $25,000 to $34,999 | 482 | 6.2% |
| $35,000 to $49,999 | 459 | 5.9% |
| $50,000 to $74,999 | 754 | 9.7% |
| $75,000 to $99,999 | 622 | 8.0% |
| $100,000 to $149,999 | 1,951 | 25.1% |
| $150,000 to $199,999 | 948 | 12.2% |
| $200,000+ | 1,997 | 25.7% |
Family Income by Famaliy Size in San Luis Obispo
5-person families (282 | 3.6%) account for the highest median family income in San Luis Obispo with $202,250 per family, while 2-person families (4,575 | 58.9%) have the highest median income of $55,286 per family member.
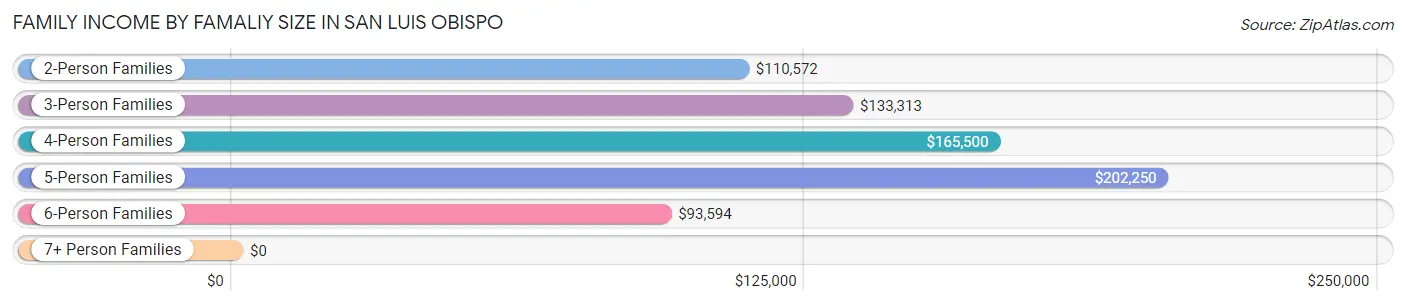
| Income Bracket | # Families | Median Income |
| 2-Person Families | 4,575 (58.9%) | $110,572 |
| 3-Person Families | 1,531 (19.7%) | $133,313 |
| 4-Person Families | 1,254 (16.1%) | $165,500 |
| 5-Person Families | 282 (3.6%) | $202,250 |
| 6-Person Families | 130 (1.7%) | $93,594 |
| 7+ Person Families | 0 (0.0%) | $0 |
| Total | 7,772 (100.0%) | $117,692 |
Family Income by Number of Earners in San Luis Obispo
The median family income in San Luis Obispo is $117,692, with families comprising 2 earners (3,754) having the highest median family income of $147,978, while families with no earners (1,315) have the lowest median family income of $72,642, accounting for 48.3% and 16.9% of families, respectively.
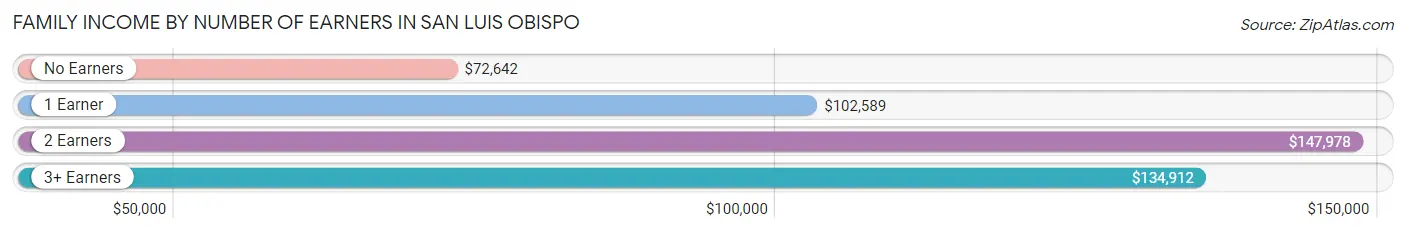
| Number of Earners | # Families | Median Income |
| No Earners | 1,315 (16.9%) | $72,642 |
| 1 Earner | 2,151 (27.7%) | $102,589 |
| 2 Earners | 3,754 (48.3%) | $147,978 |
| 3+ Earners | 552 (7.1%) | $134,912 |
| Total | 7,772 (100.0%) | $117,692 |
Household Income in San Luis Obispo
Household Income Brackets in San Luis Obispo
With 2,984 households falling in the category, the $100,000 to $149,999 income range is the most frequent in San Luis Obispo, accounting for 15.5% of all households. In contrast, only 1,059 households (5.5%) fall into the $10,000 to $14,999 income bracket, making it the least populous group.
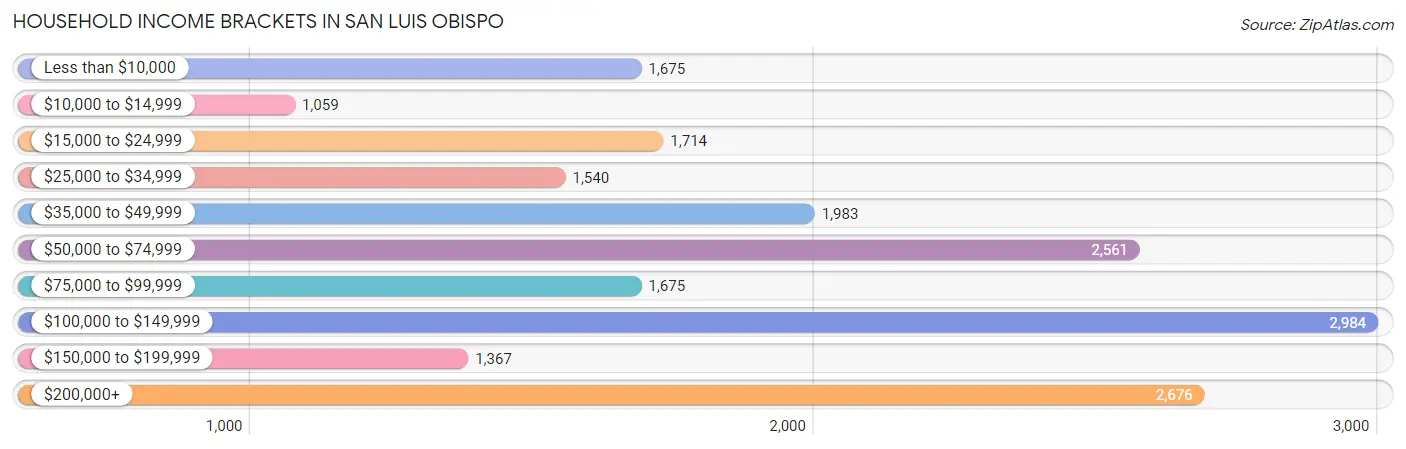
| Income Bracket | # Households | % Households |
| Less than $10,000 | 1,675 | 8.7% |
| $10,000 to $14,999 | 1,059 | 5.5% |
| $15,000 to $24,999 | 1,714 | 8.9% |
| $25,000 to $34,999 | 1,540 | 8.0% |
| $35,000 to $49,999 | 1,983 | 10.3% |
| $50,000 to $74,999 | 2,561 | 13.3% |
| $75,000 to $99,999 | 1,675 | 8.7% |
| $100,000 to $149,999 | 2,984 | 15.5% |
| $150,000 to $199,999 | 1,367 | 7.1% |
| $200,000+ | 2,676 | 13.9% |
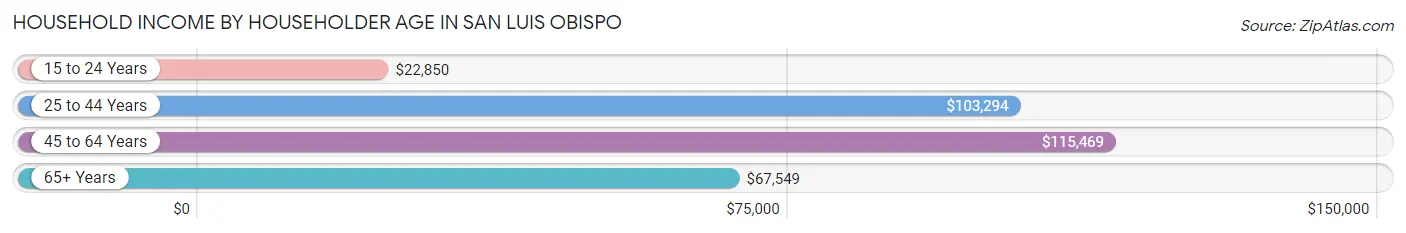
Household Income by Householder Age in San Luis Obispo
The median household income in San Luis Obispo is $65,000, with the highest median household income of $115,469 found in the 45 to 64 years age bracket for the primary householder. A total of 4,087 households (21.2%) fall into this category. Meanwhile, the 15 to 24 years age bracket for the primary householder has the lowest median household income of $22,850, with 5,400 households (28.1%) in this group.
| Income Bracket | # Households | Median Income |
| 15 to 24 Years | 5,400 (28.1%) | $22,850 |
| 25 to 44 Years | 5,299 (27.5%) | $103,294 |
| 45 to 64 Years | 4,087 (21.2%) | $115,469 |
| 65+ Years | 4,468 (23.2%) | $67,549 |
| Total | 19,254 (100.0%) | $65,000 |
Poverty in San Luis Obispo
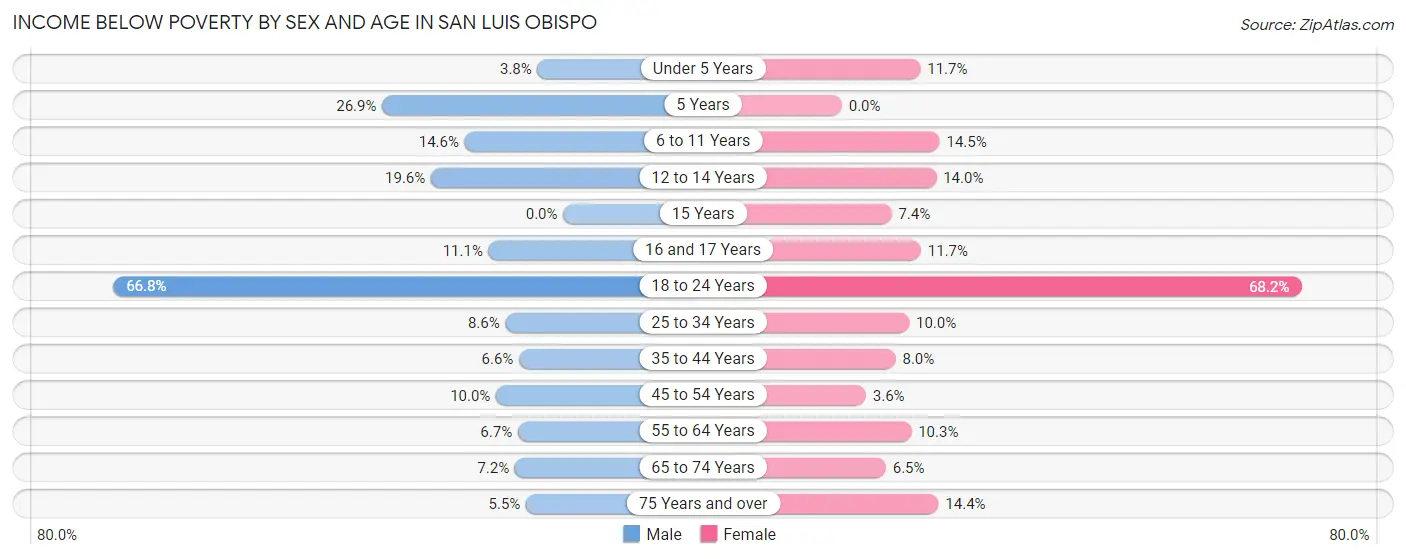
Income Below Poverty by Sex and Age in San Luis Obispo
With 32.5% poverty level for males and 30.4% for females among the residents of San Luis Obispo, 18 to 24 year old males and 18 to 24 year old females are the most vulnerable to poverty, with 6,433 males (66.8%) and 5,551 females (68.2%) in their respective age groups living below the poverty level.
| Age Bracket | Male | Female |
| Under 5 Years | 30 (3.8%) | 64 (11.7%) |
| 5 Years | 103 (26.9%) | 0 (0.0%) |
| 6 to 11 Years | 80 (14.6%) | 113 (14.5%) |
| 12 to 14 Years | 76 (19.6%) | 76 (14.0%) |
| 15 Years | 0 (0.0%) | 11 (7.4%) |
| 16 and 17 Years | 35 (11.1%) | 29 (11.7%) |
| 18 to 24 Years | 6,433 (66.8%) | 5,551 (68.2%) |
| 25 to 34 Years | 265 (8.6%) | 324 (10.0%) |
| 35 to 44 Years | 122 (6.6%) | 163 (8.0%) |
| 45 to 54 Years | 163 (10.0%) | 52 (3.6%) |
| 55 to 64 Years | 128 (6.7%) | 237 (10.3%) |
| 65 to 74 Years | 121 (7.2%) | 114 (6.5%) |
| 75 Years and over | 61 (5.5%) | 228 (14.3%) |
| Total | 7,617 (32.5%) | 6,962 (30.4%) |
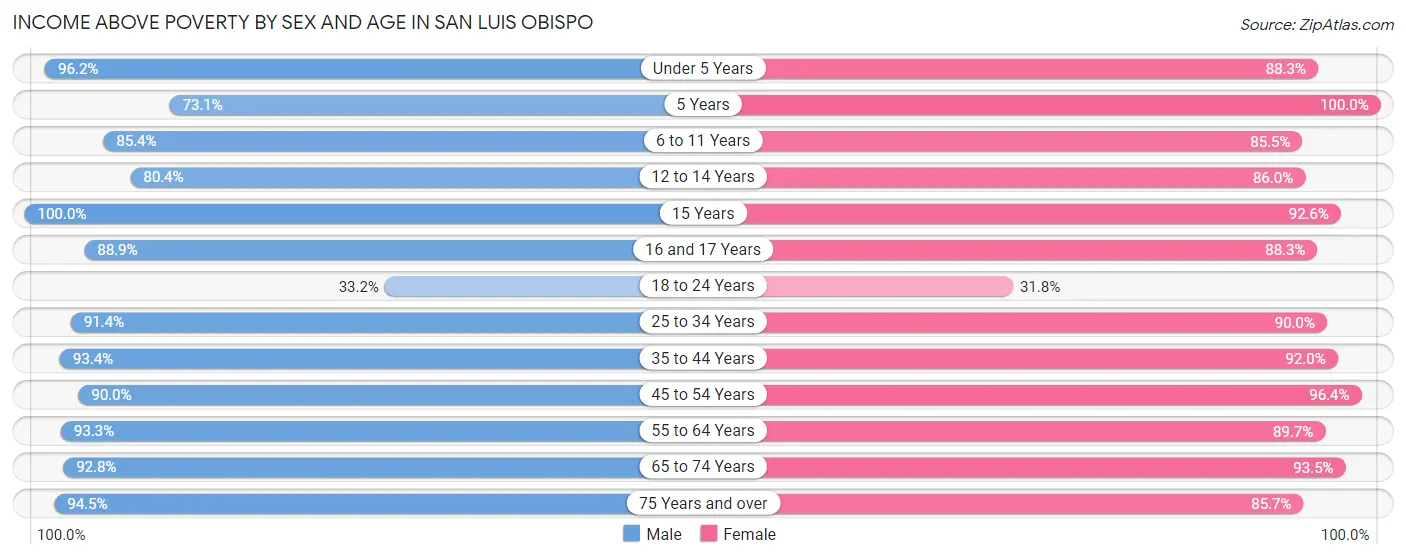
Income Above Poverty by Sex and Age in San Luis Obispo
According to the poverty statistics in San Luis Obispo, males aged 15 years and females aged 5 years are the age groups that are most secure financially, with 100.0% of males and 100.0% of females in these age groups living above the poverty line.
| Age Bracket | Male | Female |
| Under 5 Years | 755 (96.2%) | 485 (88.3%) |
| 5 Years | 280 (73.1%) | 103 (100.0%) |
| 6 to 11 Years | 467 (85.4%) | 665 (85.5%) |
| 12 to 14 Years | 311 (80.4%) | 466 (86.0%) |
| 15 Years | 131 (100.0%) | 138 (92.6%) |
| 16 and 17 Years | 281 (88.9%) | 218 (88.3%) |
| 18 to 24 Years | 3,191 (33.2%) | 2,586 (31.8%) |
| 25 to 34 Years | 2,825 (91.4%) | 2,919 (90.0%) |
| 35 to 44 Years | 1,738 (93.4%) | 1,880 (92.0%) |
| 45 to 54 Years | 1,472 (90.0%) | 1,405 (96.4%) |
| 55 to 64 Years | 1,772 (93.3%) | 2,061 (89.7%) |
| 65 to 74 Years | 1,566 (92.8%) | 1,633 (93.5%) |
| 75 Years and over | 1,044 (94.5%) | 1,361 (85.7%) |
| Total | 15,833 (67.5%) | 15,920 (69.6%) |
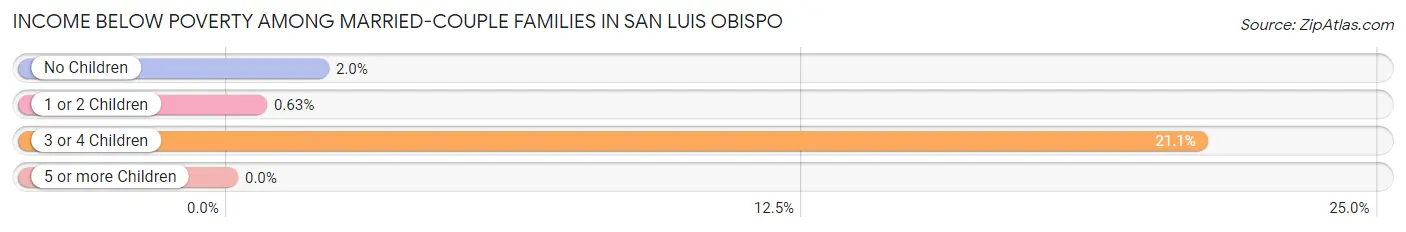
Income Below Poverty Among Married-Couple Families in San Luis Obispo
The poverty statistics for married-couple families in San Luis Obispo show that 2.3% or 132 of the total 5,756 families live below the poverty line. Families with 3 or 4 children have the highest poverty rate of 21.1%, comprising of 46 families. On the other hand, families with 1 or 2 children have the lowest poverty rate of 0.6%, which includes 11 families.
| Children | Above Poverty | Below Poverty |
| No Children | 3,714 (98.0%) | 75 (2.0%) |
| 1 or 2 Children | 1,738 (99.4%) | 11 (0.6%) |
| 3 or 4 Children | 172 (78.9%) | 46 (21.1%) |
| 5 or more Children | 0 (0.0%) | 0 (0.0%) |
| Total | 5,624 (97.7%) | 132 (2.3%) |
Income Below Poverty Among Single-Parent Households in San Luis Obispo
According to the poverty data in San Luis Obispo, 28.2% or 220 single-father households and 12.4% or 154 single-mother households are living below the poverty line. Among single-father households, those with 3 or 4 children have the highest poverty rate, with 47 households (70.2%) experiencing poverty. Likewise, among single-mother households, those with 3 or 4 children have the highest poverty rate, with 15 households (25.0%) falling below the poverty line.
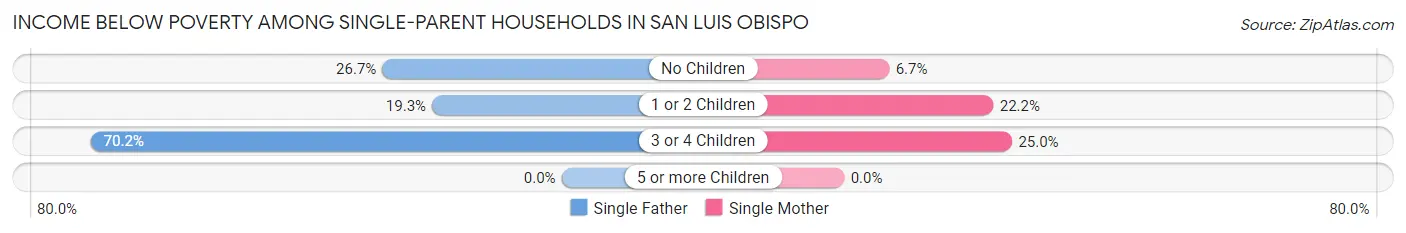
| Children | Single Father | Single Mother |
| No Children | 128 (26.7%) | 53 (6.7%) |
| 1 or 2 Children | 45 (19.3%) | 86 (22.2%) |
| 3 or 4 Children | 47 (70.2%) | 15 (25.0%) |
| 5 or more Children | 0 (0.0%) | 0 (0.0%) |
| Total | 220 (28.2%) | 154 (12.4%) |
Income Below Poverty Among Married-Couple vs Single-Parent Households in San Luis Obispo
The poverty data for San Luis Obispo shows that 132 of the married-couple family households (2.3%) and 374 of the single-parent households (18.5%) are living below the poverty level. Within the married-couple family households, those with 3 or 4 children have the highest poverty rate, with 46 households (21.1%) falling below the poverty line. Among the single-parent households, those with 3 or 4 children have the highest poverty rate, with 62 household (48.8%) living below poverty.
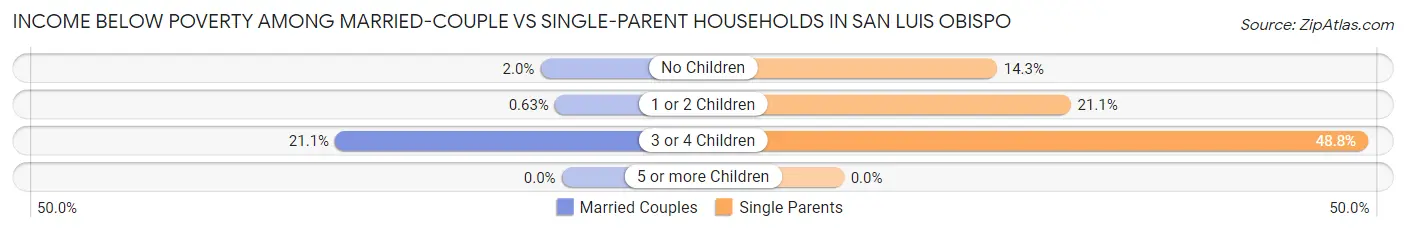
| Children | Married-Couple Families | Single-Parent Households |
| No Children | 75 (2.0%) | 181 (14.3%) |
| 1 or 2 Children | 11 (0.6%) | 131 (21.1%) |
| 3 or 4 Children | 46 (21.1%) | 62 (48.8%) |
| 5 or more Children | 0 (0.0%) | 0 (0.0%) |
| Total | 132 (2.3%) | 374 (18.5%) |
Race in San Luis Obispo
The most populous races in San Luis Obispo are White / Caucasian (37,608 | 79.1%), Hispanic or Latino (8,521 | 17.9%), and Two or more Races (4,892 | 10.3%).
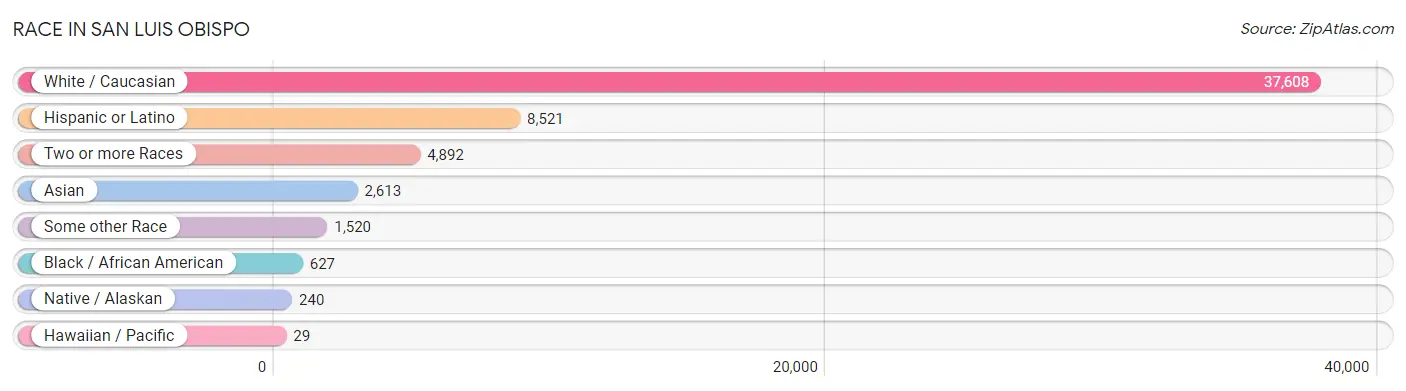
| Race | # Population | % Population |
| Asian | 2,613 | 5.5% |
| Black / African American | 627 | 1.3% |
| Hawaiian / Pacific | 29 | 0.1% |
| Hispanic or Latino | 8,521 | 17.9% |
| Native / Alaskan | 240 | 0.5% |
| White / Caucasian | 37,608 | 79.1% |
| Two or more Races | 4,892 | 10.3% |
| Some other Race | 1,520 | 3.2% |
| Total | 47,529 | 100.0% |
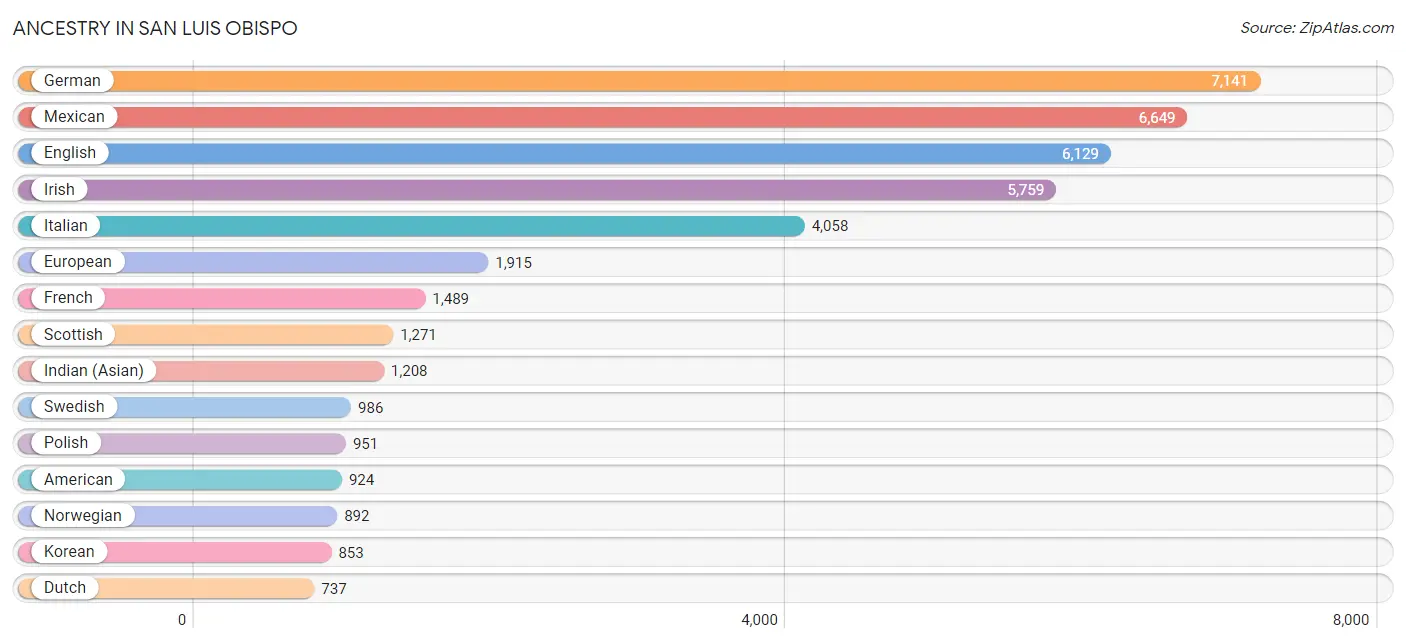
Ancestry in San Luis Obispo
The most populous ancestries reported in San Luis Obispo are German (7,141 | 15.0%), Mexican (6,649 | 14.0%), English (6,129 | 12.9%), Irish (5,759 | 12.1%), and Italian (4,058 | 8.5%), together accounting for 62.6% of all San Luis Obispo residents.
| Ancestry | # Population | % Population |
| African | 88 | 0.2% |
| American | 924 | 1.9% |
| Apache | 10 | 0.0% |
| Arab | 684 | 1.4% |
| Argentinean | 52 | 0.1% |
| Armenian | 56 | 0.1% |
| Assyrian / Chaldean / Syriac | 6 | 0.0% |
| Australian | 76 | 0.2% |
| Austrian | 110 | 0.2% |
| Basque | 63 | 0.1% |
| Belgian | 5 | 0.0% |
| Bhutanese | 410 | 0.9% |
| Blackfeet | 19 | 0.0% |
| Brazilian | 193 | 0.4% |
| British | 667 | 1.4% |
| Bulgarian | 46 | 0.1% |
| Burmese | 690 | 1.5% |
| Canadian | 74 | 0.2% |
| Cape Verdean | 2 | 0.0% |
| Celtic | 8 | 0.0% |
| Central American | 397 | 0.8% |
| Central American Indian | 75 | 0.2% |
| Cherokee | 73 | 0.2% |
| Chickasaw | 11 | 0.0% |
| Chippewa | 13 | 0.0% |
| Colombian | 132 | 0.3% |
| Comanche | 19 | 0.0% |
| Costa Rican | 9 | 0.0% |
| Croatian | 79 | 0.2% |
| Cuban | 152 | 0.3% |
| Czech | 142 | 0.3% |
| Czechoslovakian | 41 | 0.1% |
| Danish | 327 | 0.7% |
| Dutch | 737 | 1.5% |
| Eastern European | 117 | 0.3% |
| Ecuadorian | 55 | 0.1% |
| Egyptian | 65 | 0.1% |
| English | 6,129 | 12.9% |
| Ethiopian | 11 | 0.0% |
| European | 1,915 | 4.0% |
| Filipino | 146 | 0.3% |
| Finnish | 121 | 0.3% |
| French | 1,489 | 3.1% |
| French Canadian | 104 | 0.2% |
| German | 7,141 | 15.0% |
| Greek | 372 | 0.8% |
| Guamanian / Chamorro | 12 | 0.0% |
| Guatemalan | 148 | 0.3% |
| Haitian | 7 | 0.0% |
| Honduran | 12 | 0.0% |
| Hopi | 3 | 0.0% |
| Hungarian | 229 | 0.5% |
| Icelander | 11 | 0.0% |
| Indian (Asian) | 1,208 | 2.5% |
| Indonesian | 26 | 0.1% |
| Iranian | 310 | 0.6% |
| Irish | 5,759 | 12.1% |
| Israeli | 17 | 0.0% |
| Italian | 4,058 | 8.5% |
| Jamaican | 52 | 0.1% |
| Japanese | 6 | 0.0% |
| Jordanian | 47 | 0.1% |
| Korean | 853 | 1.8% |
| Laotian | 137 | 0.3% |
| Lebanese | 195 | 0.4% |
| Lithuanian | 59 | 0.1% |
| Malaysian | 26 | 0.1% |
| Mexican | 6,649 | 14.0% |
| Mexican American Indian | 88 | 0.2% |
| Mongolian | 30 | 0.1% |
| Native Hawaiian | 63 | 0.1% |
| Navajo | 82 | 0.2% |
| Nicaraguan | 48 | 0.1% |
| Nigerian | 109 | 0.2% |
| Northern European | 255 | 0.5% |
| Norwegian | 892 | 1.9% |
| Pakistani | 9 | 0.0% |
| Palestinian | 120 | 0.3% |
| Panamanian | 5 | 0.0% |
| Pennsylvania German | 9 | 0.0% |
| Peruvian | 99 | 0.2% |
| Polish | 951 | 2.0% |
| Portuguese | 720 | 1.5% |
| Puerto Rican | 129 | 0.3% |
| Romanian | 161 | 0.3% |
| Russian | 516 | 1.1% |
| Salvadoran | 175 | 0.4% |
| Samoan | 2 | 0.0% |
| Scandinavian | 298 | 0.6% |
| Scotch-Irish | 312 | 0.7% |
| Scottish | 1,271 | 2.7% |
| Serbian | 108 | 0.2% |
| Slavic | 61 | 0.1% |
| Slovak | 47 | 0.1% |
| Slovene | 37 | 0.1% |
| South African | 87 | 0.2% |
| South American | 338 | 0.7% |
| South American Indian | 30 | 0.1% |
| Spaniard | 317 | 0.7% |
| Spanish | 332 | 0.7% |
| Sri Lankan | 617 | 1.3% |
| Subsaharan African | 325 | 0.7% |
| Swedish | 986 | 2.1% |
| Swiss | 378 | 0.8% |
| Syrian | 158 | 0.3% |
| Thai | 381 | 0.8% |
| Tlingit-Haida | 27 | 0.1% |
| Tsimshian | 27 | 0.1% |
| Turkish | 51 | 0.1% |
| Ugandan | 22 | 0.1% |
| Ukrainian | 134 | 0.3% |
| Welsh | 412 | 0.9% |
| West Indian | 22 | 0.1% |
| Yaqui | 24 | 0.1% |
| Yugoslavian | 35 | 0.1% | View All 115 Rows |
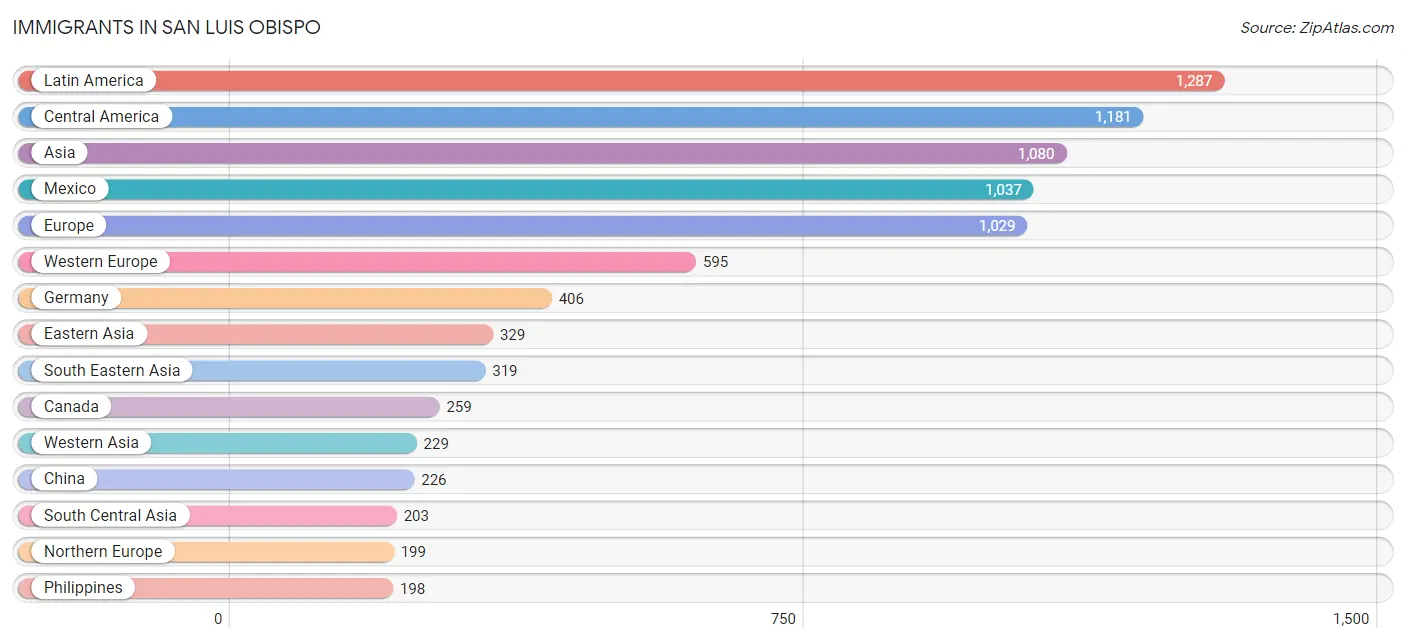
Immigrants in San Luis Obispo
The most numerous immigrant groups reported in San Luis Obispo came from Latin America (1,287 | 2.7%), Central America (1,181 | 2.5%), Asia (1,080 | 2.3%), Mexico (1,037 | 2.2%), and Europe (1,029 | 2.2%), together accounting for 11.8% of all San Luis Obispo residents.
| Immigration Origin | # Population | % Population |
| Africa | 89 | 0.2% |
| Asia | 1,080 | 2.3% |
| Australia | 54 | 0.1% |
| Austria | 11 | 0.0% |
| Brazil | 8 | 0.0% |
| Canada | 259 | 0.5% |
| Central America | 1,181 | 2.5% |
| China | 226 | 0.5% |
| Denmark | 34 | 0.1% |
| Eastern Africa | 14 | 0.0% |
| Eastern Asia | 329 | 0.7% |
| Eastern Europe | 135 | 0.3% |
| Ecuador | 42 | 0.1% |
| Egypt | 14 | 0.0% |
| El Salvador | 70 | 0.2% |
| England | 60 | 0.1% |
| Ethiopia | 9 | 0.0% |
| Europe | 1,029 | 2.2% |
| France | 86 | 0.2% |
| Germany | 406 | 0.9% |
| Guatemala | 74 | 0.2% |
| Hong Kong | 18 | 0.0% |
| India | 141 | 0.3% |
| Indonesia | 26 | 0.1% |
| Iran | 26 | 0.1% |
| Ireland | 19 | 0.0% |
| Israel | 39 | 0.1% |
| Italy | 68 | 0.1% |
| Japan | 12 | 0.0% |
| Jordan | 68 | 0.1% |
| Kazakhstan | 14 | 0.0% |
| Korea | 91 | 0.2% |
| Latin America | 1,287 | 2.7% |
| Malaysia | 18 | 0.0% |
| Mexico | 1,037 | 2.2% |
| Moldova | 1 | 0.0% |
| Morocco | 29 | 0.1% |
| Netherlands | 38 | 0.1% |
| Northern Africa | 43 | 0.1% |
| Northern Europe | 199 | 0.4% |
| Oceania | 80 | 0.2% |
| Peru | 56 | 0.1% |
| Philippines | 198 | 0.4% |
| Poland | 21 | 0.0% |
| Portugal | 23 | 0.1% |
| Romania | 24 | 0.1% |
| Russia | 46 | 0.1% |
| Scotland | 8 | 0.0% |
| Serbia | 32 | 0.1% |
| South Africa | 32 | 0.1% |
| South America | 106 | 0.2% |
| South Central Asia | 203 | 0.4% |
| South Eastern Asia | 319 | 0.7% |
| Southern Europe | 100 | 0.2% |
| Spain | 9 | 0.0% |
| Sri Lanka | 22 | 0.1% |
| Sweden | 5 | 0.0% |
| Switzerland | 54 | 0.1% |
| Syria | 69 | 0.2% |
| Taiwan | 19 | 0.0% |
| Thailand | 9 | 0.0% |
| Turkey | 19 | 0.0% |
| Ukraine | 11 | 0.0% |
| Vietnam | 51 | 0.1% |
| Western Asia | 229 | 0.5% |
| Western Europe | 595 | 1.3% |
| Yemen | 5 | 0.0% | View All 67 Rows |
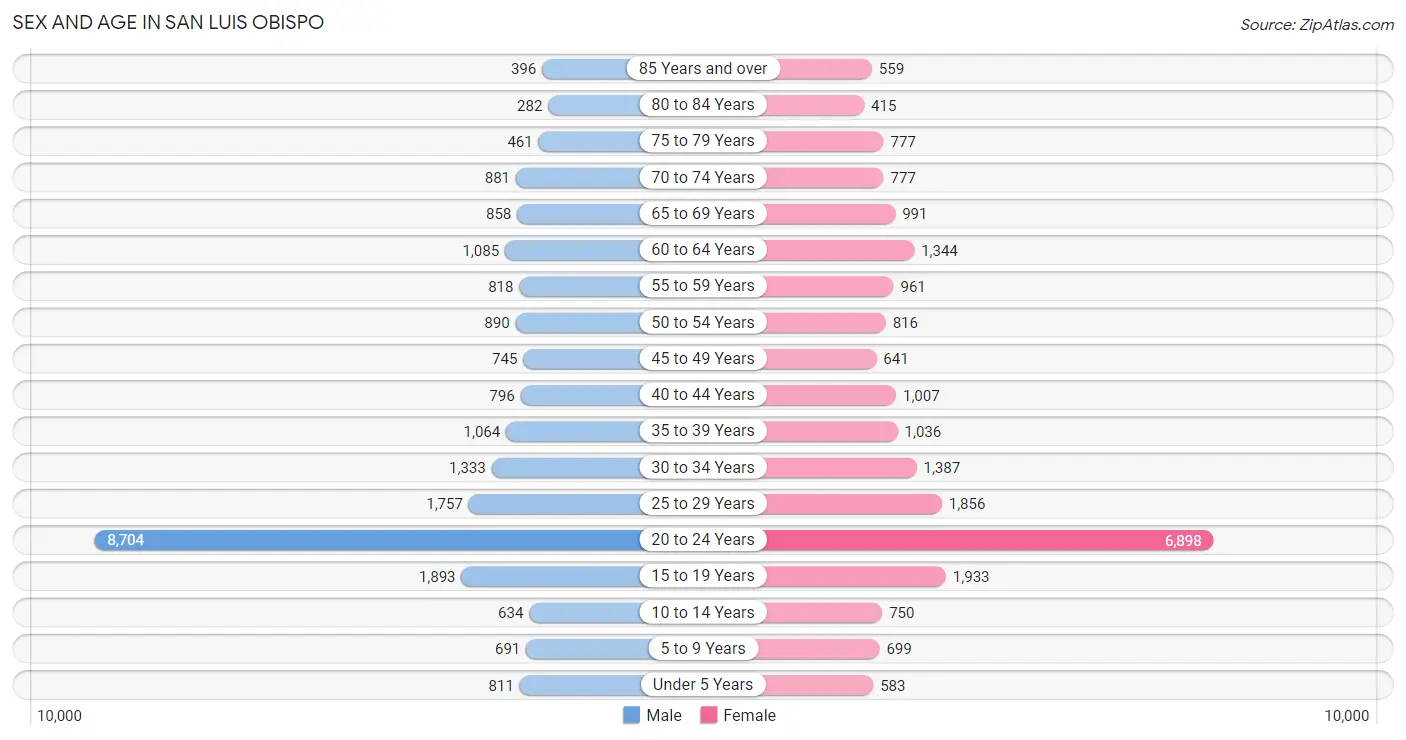
Sex and Age in San Luis Obispo
Sex and Age in San Luis Obispo
The most populous age groups in San Luis Obispo are 20 to 24 Years (8,704 | 36.1%) for men and 20 to 24 Years (6,898 | 29.4%) for women.
| Age Bracket | Male | Female |
| Under 5 Years | 811 (3.4%) | 583 (2.5%) |
| 5 to 9 Years | 691 (2.9%) | 699 (3.0%) |
| 10 to 14 Years | 634 (2.6%) | 750 (3.2%) |
| 15 to 19 Years | 1,893 (7.9%) | 1,933 (8.3%) |
| 20 to 24 Years | 8,704 (36.1%) | 6,898 (29.4%) |
| 25 to 29 Years | 1,757 (7.3%) | 1,856 (7.9%) |
| 30 to 34 Years | 1,333 (5.5%) | 1,387 (5.9%) |
| 35 to 39 Years | 1,064 (4.4%) | 1,036 (4.4%) |
| 40 to 44 Years | 796 (3.3%) | 1,007 (4.3%) |
| 45 to 49 Years | 745 (3.1%) | 641 (2.7%) |
| 50 to 54 Years | 890 (3.7%) | 816 (3.5%) |
| 55 to 59 Years | 818 (3.4%) | 961 (4.1%) |
| 60 to 64 Years | 1,085 (4.5%) | 1,344 (5.7%) |
| 65 to 69 Years | 858 (3.6%) | 991 (4.2%) |
| 70 to 74 Years | 881 (3.7%) | 777 (3.3%) |
| 75 to 79 Years | 461 (1.9%) | 777 (3.3%) |
| 80 to 84 Years | 282 (1.2%) | 415 (1.8%) |
| 85 Years and over | 396 (1.6%) | 559 (2.4%) |
| Total | 24,099 (100.0%) | 23,430 (100.0%) |
Families and Households in San Luis Obispo
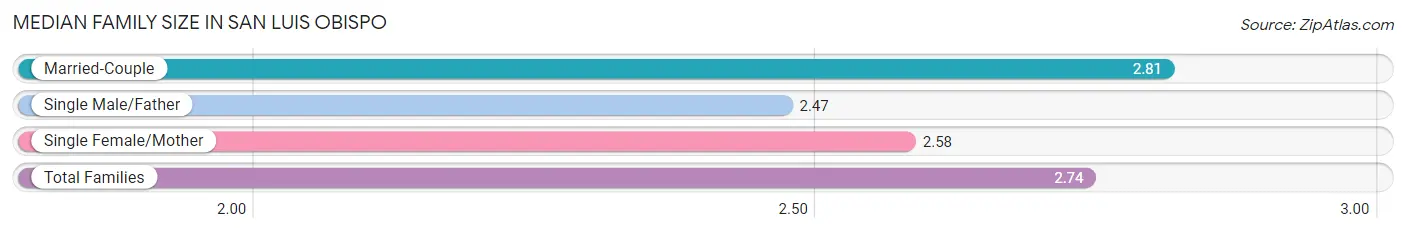
Median Family Size in San Luis Obispo
The median family size in San Luis Obispo is 2.74 persons per family, with married-couple families (5,756 | 74.1%) accounting for the largest median family size of 2.81 persons per family. On the other hand, single male/father families (779 | 10.0%) represent the smallest median family size with 2.47 persons per family.
| Family Type | # Families | Family Size |
| Married-Couple | 5,756 (74.1%) | 2.81 |
| Single Male/Father | 779 (10.0%) | 2.47 |
| Single Female/Mother | 1,237 (15.9%) | 2.58 |
| Total Families | 7,772 (100.0%) | 2.74 |
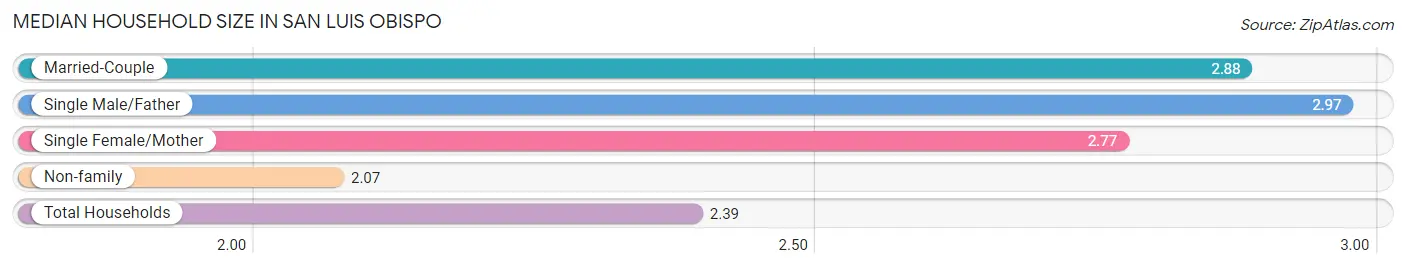
Median Household Size in San Luis Obispo
The median household size in San Luis Obispo is 2.39 persons per household, with single male/father households (779 | 4.1%) accounting for the largest median household size of 2.97 persons per household. non-family households (11,482 | 59.6%) represent the smallest median household size with 2.07 persons per household.
| Household Type | # Households | Household Size |
| Married-Couple | 5,756 (29.9%) | 2.88 |
| Single Male/Father | 779 (4.1%) | 2.97 |
| Single Female/Mother | 1,237 (6.4%) | 2.77 |
| Non-family | 11,482 (59.6%) | 2.07 |
| Total Households | 19,254 (100.0%) | 2.39 |
Household Size by Marriage Status in San Luis Obispo
Out of a total of 19,254 households in San Luis Obispo, 7,772 (40.4%) are family households, while 11,482 (59.6%) are nonfamily households. The most numerous type of family households are 2-person households, comprising 4,000, and the most common type of nonfamily households are 1-person households, comprising 5,807.

| Household Size | Family Households | Nonfamily Households |
| 1-Person Households | - | 5,807 (30.2%) |
| 2-Person Households | 4,000 (20.8%) | 2,548 (13.2%) |
| 3-Person Households | 1,881 (9.8%) | 1,123 (5.8%) |
| 4-Person Households | 1,378 (7.2%) | 1,258 (6.5%) |
| 5-Person Households | 289 (1.5%) | 490 (2.5%) |
| 6-Person Households | 185 (1.0%) | 125 (0.6%) |
| 7+ Person Households | 39 (0.2%) | 131 (0.7%) |
| Total | 7,772 (40.4%) | 11,482 (59.6%) |
Female Fertility in San Luis Obispo
Fertility by Age in San Luis Obispo
Average fertility rate in San Luis Obispo is 17.0 births per 1,000 women. Women in the age bracket of 35 to 50 years have the highest fertility rate with 32.0 births per 1,000 women. Women in the age bracket of 20 to 34 years acount for 63.6% of all women with births.
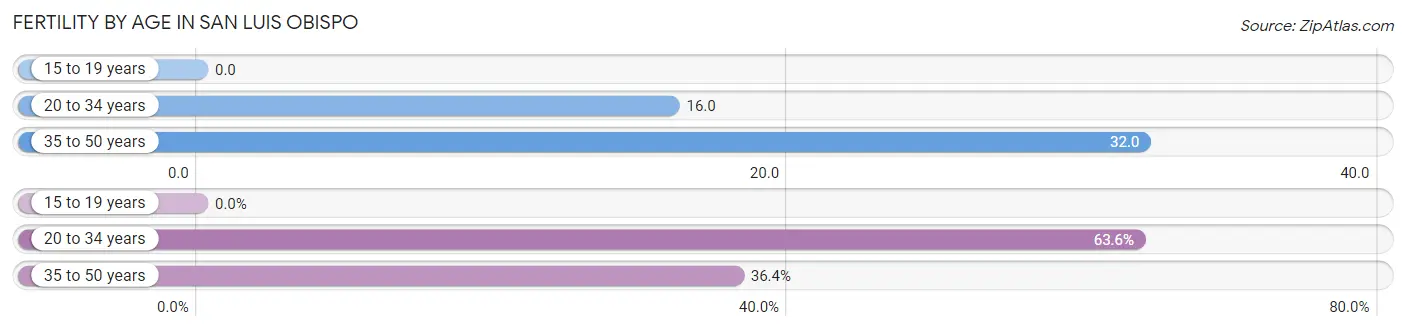
| Age Bracket | Women with Births | Births / 1,000 Women |
| 15 to 19 years | 0 (0.0%) | 0.0 |
| 20 to 34 years | 161 (63.6%) | 16.0 |
| 35 to 50 years | 92 (36.4%) | 32.0 |
| Total | 253 (100.0%) | 17.0 |
Fertility by Age by Marriage Status in San Luis Obispo
76.3% of women with births (253) in San Luis Obispo are married. The highest percentage of unmarried women with births falls into 20 to 34 years age bracket with 37.3% of them unmarried at the time of birth, while the lowest percentage of unmarried women with births belong to 35 to 50 years age bracket with 0.0% of them unmarried.
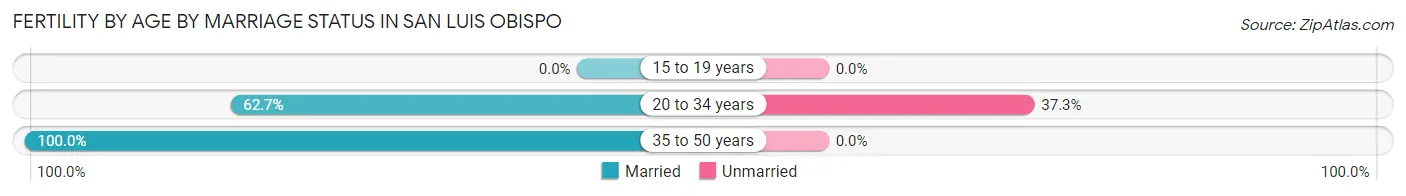
| Age Bracket | Married | Unmarried |
| 15 to 19 years | 0 (0.0%) | 0 (0.0%) |
| 20 to 34 years | 101 (62.7%) | 60 (37.3%) |
| 35 to 50 years | 92 (100.0%) | 0 (0.0%) |
| Total | 193 (76.3%) | 60 (23.7%) |
Fertility by Education in San Luis Obispo
Average fertility rate in San Luis Obispo is 17.0 births per 1,000 women. Women with the education attainment of graduate degree have the highest fertility rate of 50.0 births per 1,000 women, while women with the education attainment of high school diploma have the lowest fertility at 4.0 births per 1,000 women. Women with the education attainment of graduate degree represent 34.0% of all women with births.
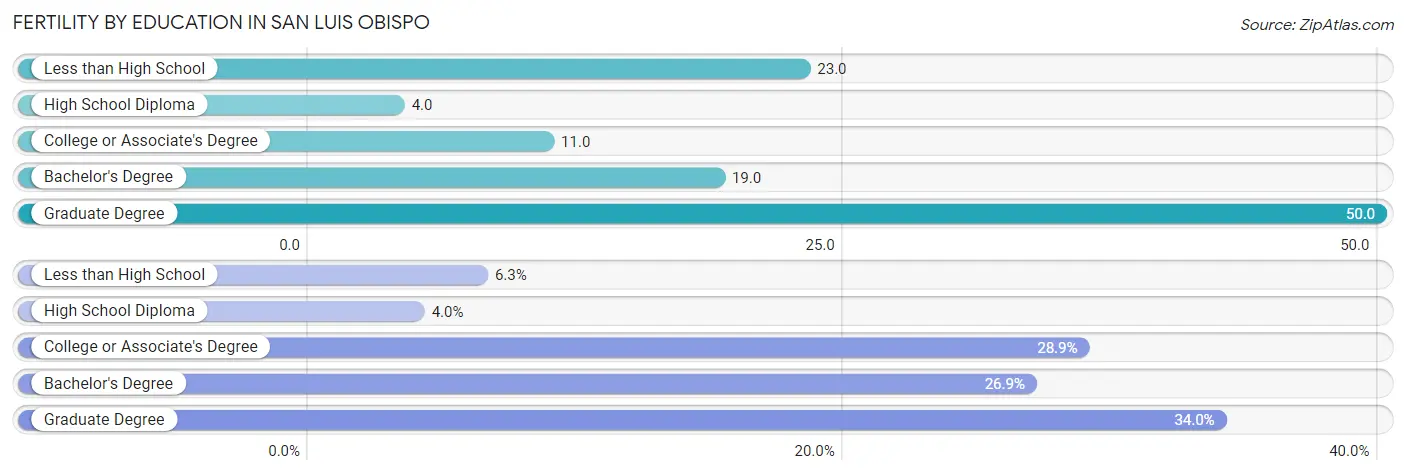
| Educational Attainment | Women with Births | Births / 1,000 Women |
| Less than High School | 16 (6.3%) | 23.0 |
| High School Diploma | 10 (4.0%) | 4.0 |
| College or Associate's Degree | 73 (28.8%) | 11.0 |
| Bachelor's Degree | 68 (26.9%) | 19.0 |
| Graduate Degree | 86 (34.0%) | 50.0 |
| Total | 253 (100.0%) | 17.0 |
Fertility by Education by Marriage Status in San Luis Obispo
23.7% of women with births in San Luis Obispo are unmarried. Women with the educational attainment of less than high school are most likely to be married with 100.0% of them married at childbirth, while women with the educational attainment of high school diploma are least likely to be married with 100.0% of them unmarried at childbirth.
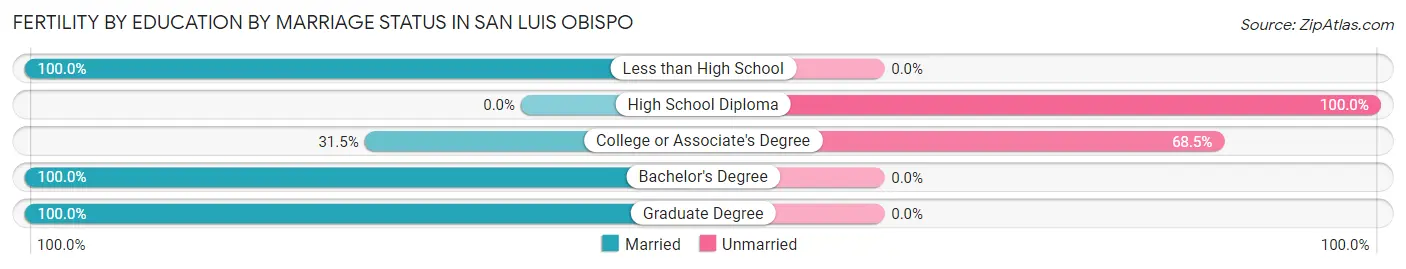
| Educational Attainment | Married | Unmarried |
| Less than High School | 16 (100.0%) | 0 (0.0%) |
| High School Diploma | 0 (0.0%) | 10 (100.0%) |
| College or Associate's Degree | 23 (31.5%) | 50 (68.5%) |
| Bachelor's Degree | 68 (100.0%) | 0 (0.0%) |
| Graduate Degree | 86 (100.0%) | 0 (0.0%) |
| Total | 193 (76.3%) | 60 (23.7%) |
Employment Characteristics in San Luis Obispo
Employment by Class of Employer in San Luis Obispo
Among the 24,387 employed individuals in San Luis Obispo, private company employees (15,324 | 62.8%), state government employees (2,757 | 11.3%), and local government employees (2,143 | 8.8%) make up the most common classes of employment.
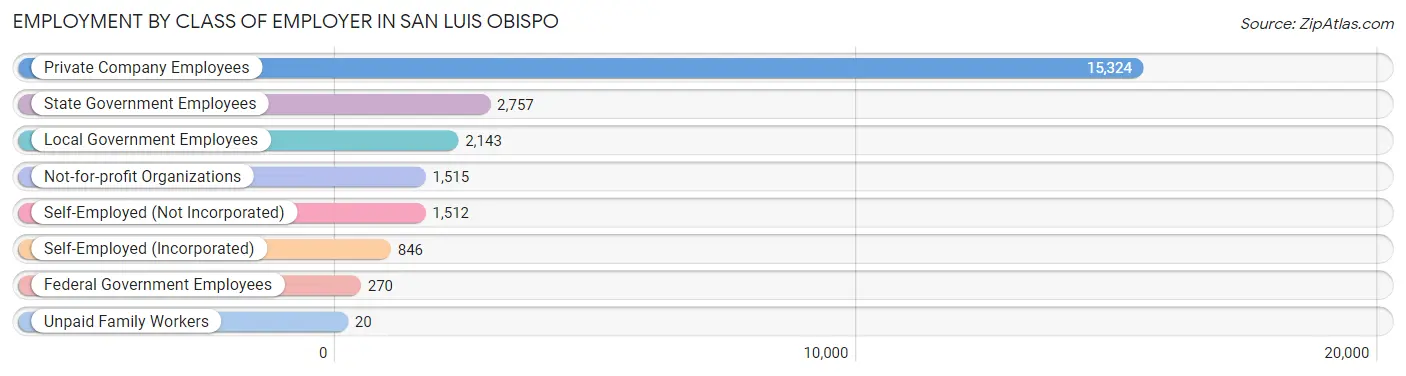
| Employer Class | # Employees | % Employees |
| Private Company Employees | 15,324 | 62.8% |
| Self-Employed (Incorporated) | 846 | 3.5% |
| Self-Employed (Not Incorporated) | 1,512 | 6.2% |
| Not-for-profit Organizations | 1,515 | 6.2% |
| Local Government Employees | 2,143 | 8.8% |
| State Government Employees | 2,757 | 11.3% |
| Federal Government Employees | 270 | 1.1% |
| Unpaid Family Workers | 20 | 0.1% |
| Total | 24,387 | 100.0% |
Employment Status by Age in San Luis Obispo
According to the labor force statistics for San Luis Obispo, out of the total population over 16 years of age (43,081), 62.5% or 26,926 individuals are in the labor force, with 6.9% or 1,858 of them unemployed. The age group with the highest labor force participation rate is 30 to 34 years, with 90.6% or 2,464 individuals in the labor force. Within the labor force, the 16 to 19 years age range has the highest percentage of unemployed individuals, with 11.2% or 196 of them being unemployed.
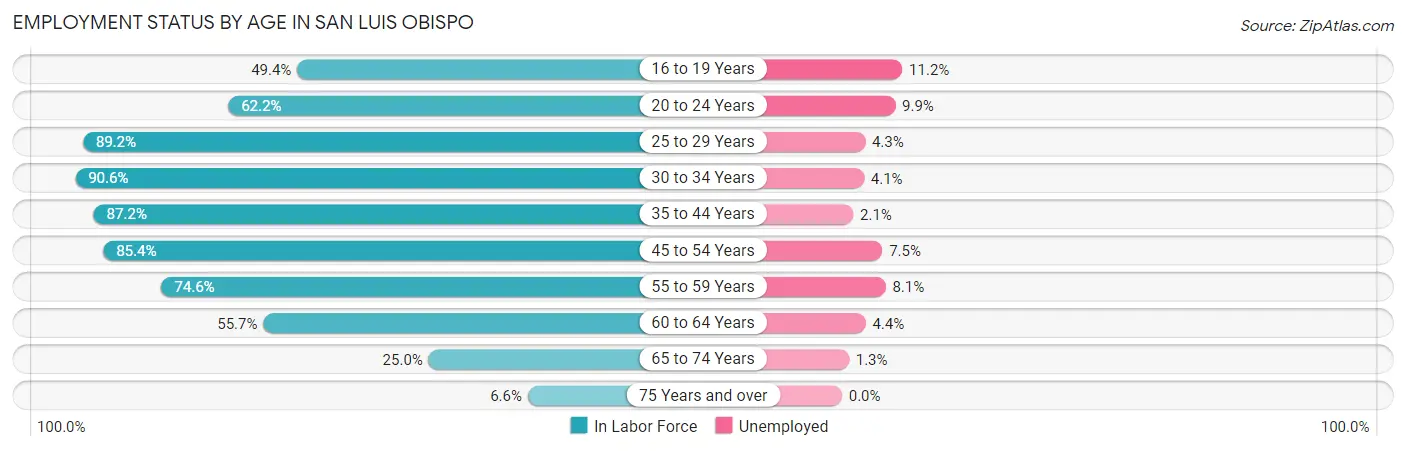
| Age Bracket | In Labor Force | Unemployed |
| 16 to 19 Years | 1,752 (49.4%) | 196 (11.2%) |
| 20 to 24 Years | 9,704 (62.2%) | 961 (9.9%) |
| 25 to 29 Years | 3,223 (89.2%) | 139 (4.3%) |
| 30 to 34 Years | 2,464 (90.6%) | 101 (4.1%) |
| 35 to 44 Years | 3,403 (87.2%) | 71 (2.1%) |
| 45 to 54 Years | 2,641 (85.4%) | 198 (7.5%) |
| 55 to 59 Years | 1,327 (74.6%) | 107 (8.1%) |
| 60 to 64 Years | 1,353 (55.7%) | 60 (4.4%) |
| 65 to 74 Years | 877 (25.0%) | 11 (1.3%) |
| 75 Years and over | 191 (6.6%) | 0 (0.0%) |
| Total | 26,926 (62.5%) | 1,858 (6.9%) |
Employment Status by Educational Attainment in San Luis Obispo
According to labor force statistics for San Luis Obispo, 82.2% of individuals (14,415) out of the total population between 25 and 64 years of age (17,536) are in the labor force, with 4.7% or 678 of them being unemployed. The group with the highest labor force participation rate are those with the educational attainment of bachelor's degree or higher, with 86.2% or 8,272 individuals in the labor force. Within the labor force, individuals with college / associate degree education have the highest percentage of unemployment, with 8.9% or 341 of them being unemployed.
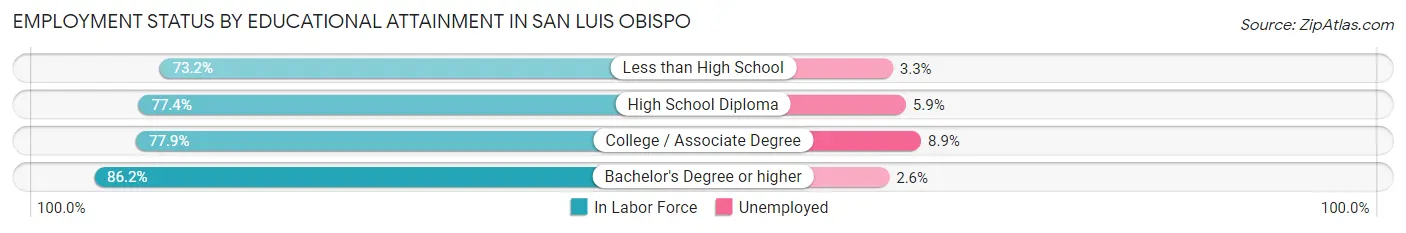
| Educational Attainment | In Labor Force | Unemployed |
| Less than High School | 602 (73.2%) | 27 (3.3%) |
| High School Diploma | 1,708 (77.4%) | 130 (5.9%) |
| College / Associate Degree | 3,826 (77.9%) | 437 (8.9%) |
| Bachelor's Degree or higher | 8,272 (86.2%) | 249 (2.6%) |
| Total | 14,415 (82.2%) | 824 (4.7%) |
Employment Occupations by Sex in San Luis Obispo
Management, Business, Science and Arts Occupations
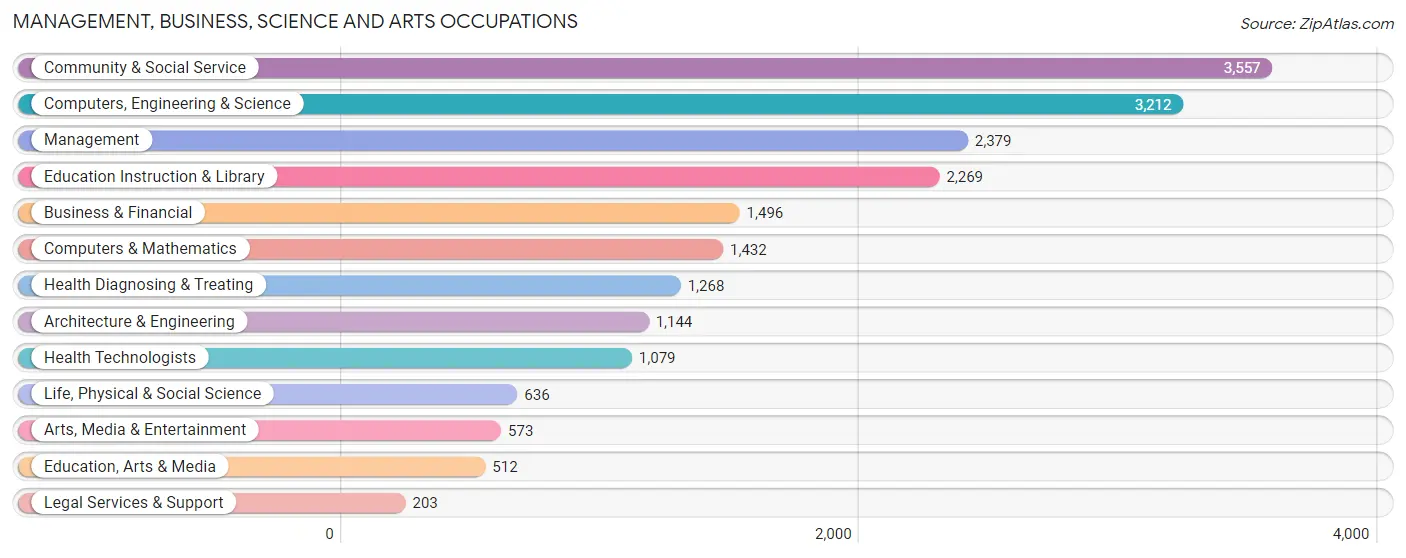
The most common Management, Business, Science and Arts occupations in San Luis Obispo are Community & Social Service (3,557 | 14.2%), Computers, Engineering & Science (3,212 | 12.8%), Management (2,379 | 9.5%), Education Instruction & Library (2,269 | 9.0%), and Business & Financial (1,496 | 6.0%).
Management, Business, Science and Arts Occupations by Sex
Within the Management, Business, Science and Arts occupations in San Luis Obispo, the most male-oriented occupations are Computers & Mathematics (72.0%), Architecture & Engineering (69.6%), and Computers, Engineering & Science (68.3%), while the most female-oriented occupations are Education, Arts & Media (87.1%), Health Diagnosing & Treating (73.5%), and Health Technologists (72.5%).
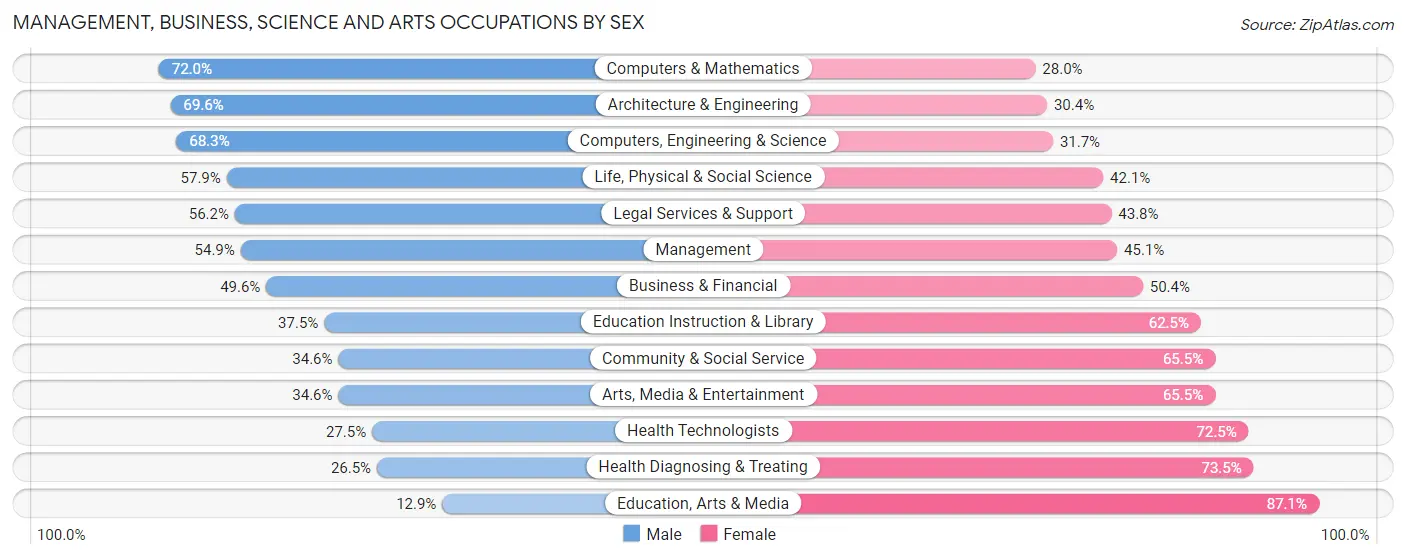
| Occupation | Male | Female |
| Management | 1,307 (54.9%) | 1,072 (45.1%) |
| Business & Financial | 742 (49.6%) | 754 (50.4%) |
| Computers, Engineering & Science | 2,195 (68.3%) | 1,017 (31.7%) |
| Computers & Mathematics | 1,031 (72.0%) | 401 (28.0%) |
| Architecture & Engineering | 796 (69.6%) | 348 (30.4%) |
| Life, Physical & Social Science | 368 (57.9%) | 268 (42.1%) |
| Community & Social Service | 1,229 (34.5%) | 2,328 (65.4%) |
| Education, Arts & Media | 66 (12.9%) | 446 (87.1%) |
| Legal Services & Support | 114 (56.2%) | 89 (43.8%) |
| Education Instruction & Library | 851 (37.5%) | 1,418 (62.5%) |
| Arts, Media & Entertainment | 198 (34.5%) | 375 (65.4%) |
| Health Diagnosing & Treating | 336 (26.5%) | 932 (73.5%) |
| Health Technologists | 297 (27.5%) | 782 (72.5%) |
| Total (Category) | 5,809 (48.8%) | 6,103 (51.2%) |
| Total (Overall) | 12,815 (51.1%) | 12,246 (48.9%) |
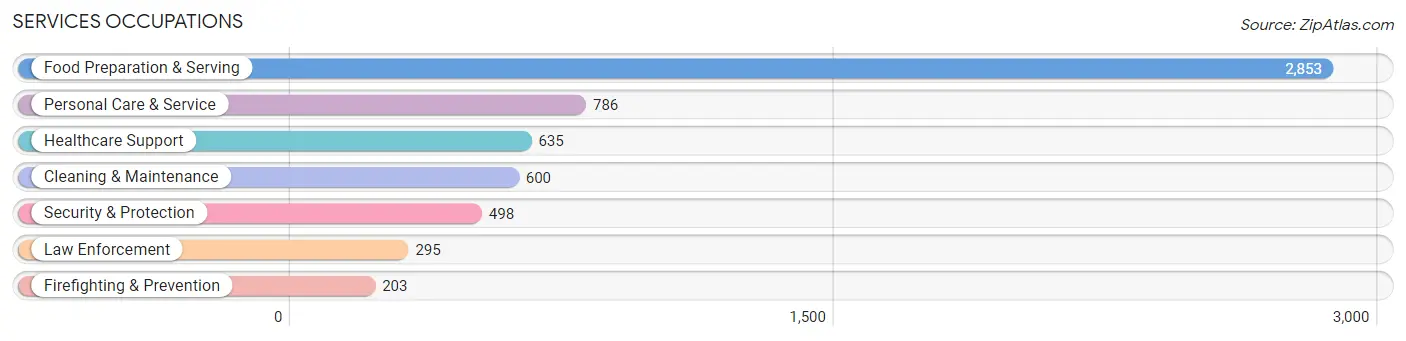
Services Occupations
The most common Services occupations in San Luis Obispo are Food Preparation & Serving (2,853 | 11.4%), Personal Care & Service (786 | 3.1%), Healthcare Support (635 | 2.5%), Cleaning & Maintenance (600 | 2.4%), and Security & Protection (498 | 2.0%).
Services Occupations by Sex
Within the Services occupations in San Luis Obispo, the most male-oriented occupations are Firefighting & Prevention (71.4%), Cleaning & Maintenance (62.7%), and Security & Protection (57.8%), while the most female-oriented occupations are Healthcare Support (71.7%), Personal Care & Service (70.5%), and Law Enforcement (51.5%).
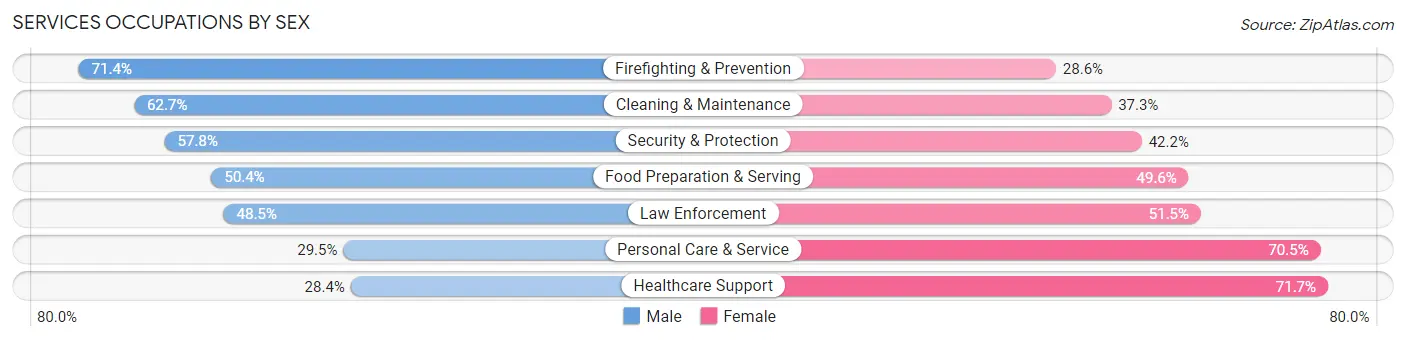
| Occupation | Male | Female |
| Healthcare Support | 180 (28.3%) | 455 (71.7%) |
| Security & Protection | 288 (57.8%) | 210 (42.2%) |
| Firefighting & Prevention | 145 (71.4%) | 58 (28.6%) |
| Law Enforcement | 143 (48.5%) | 152 (51.5%) |
| Food Preparation & Serving | 1,438 (50.4%) | 1,415 (49.6%) |
| Cleaning & Maintenance | 376 (62.7%) | 224 (37.3%) |
| Personal Care & Service | 232 (29.5%) | 554 (70.5%) |
| Total (Category) | 2,514 (46.8%) | 2,858 (53.2%) |
| Total (Overall) | 12,815 (51.1%) | 12,246 (48.9%) |
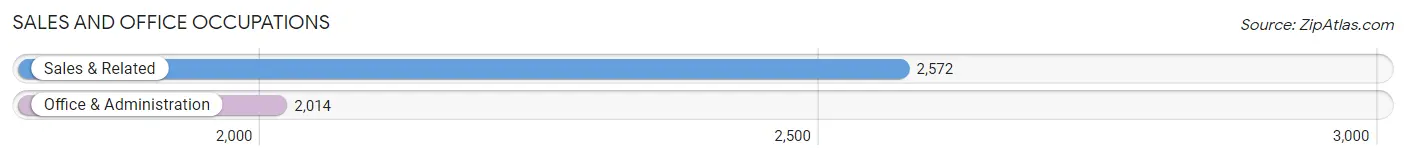
Sales and Office Occupations
The most common Sales and Office occupations in San Luis Obispo are Sales & Related (2,572 | 10.3%), and Office & Administration (2,014 | 8.0%).
Sales and Office Occupations by Sex
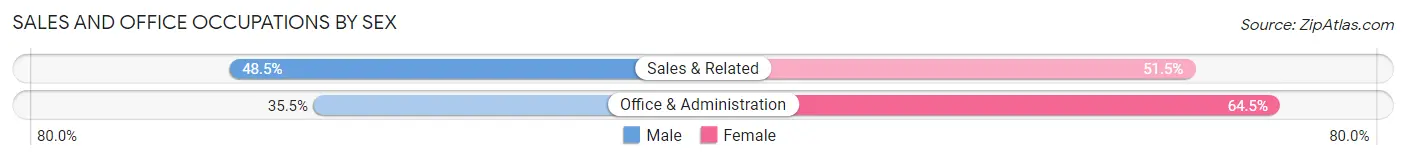
| Occupation | Male | Female |
| Sales & Related | 1,248 (48.5%) | 1,324 (51.5%) |
| Office & Administration | 715 (35.5%) | 1,299 (64.5%) |
| Total (Category) | 1,963 (42.8%) | 2,623 (57.2%) |
| Total (Overall) | 12,815 (51.1%) | 12,246 (48.9%) |
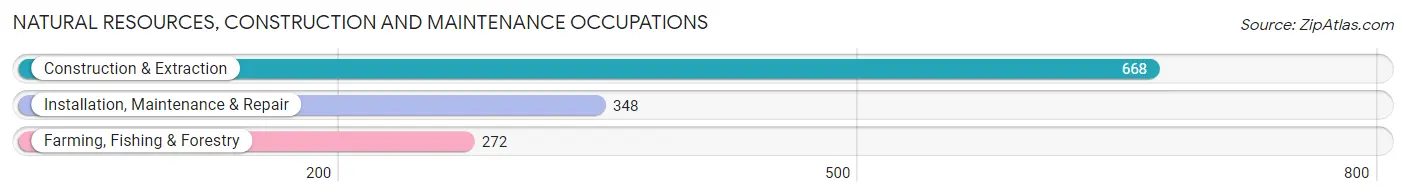
Natural Resources, Construction and Maintenance Occupations
The most common Natural Resources, Construction and Maintenance occupations in San Luis Obispo are Construction & Extraction (668 | 2.7%), Installation, Maintenance & Repair (348 | 1.4%), and Farming, Fishing & Forestry (272 | 1.1%).
Natural Resources, Construction and Maintenance Occupations by Sex
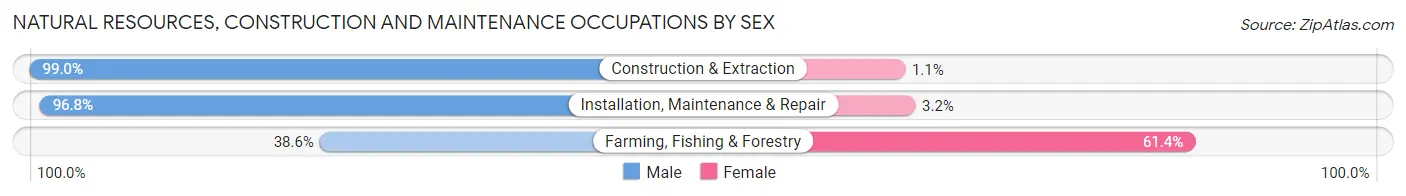
| Occupation | Male | Female |
| Farming, Fishing & Forestry | 105 (38.6%) | 167 (61.4%) |
| Construction & Extraction | 661 (99.0%) | 7 (1.1%) |
| Installation, Maintenance & Repair | 337 (96.8%) | 11 (3.2%) |
| Total (Category) | 1,103 (85.6%) | 185 (14.4%) |
| Total (Overall) | 12,815 (51.1%) | 12,246 (48.9%) |
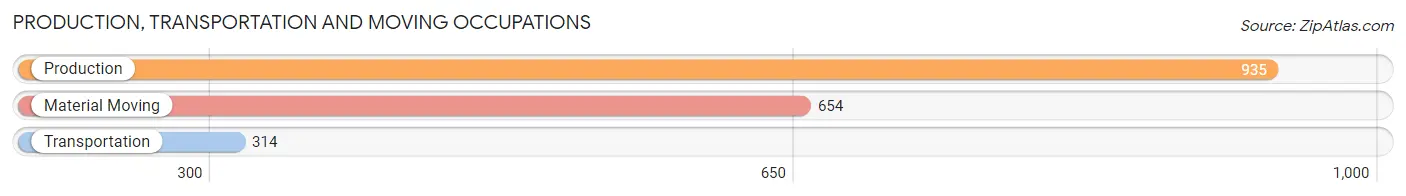
Production, Transportation and Moving Occupations
The most common Production, Transportation and Moving occupations in San Luis Obispo are Production (935 | 3.7%), Material Moving (654 | 2.6%), and Transportation (314 | 1.3%).
Production, Transportation and Moving Occupations by Sex
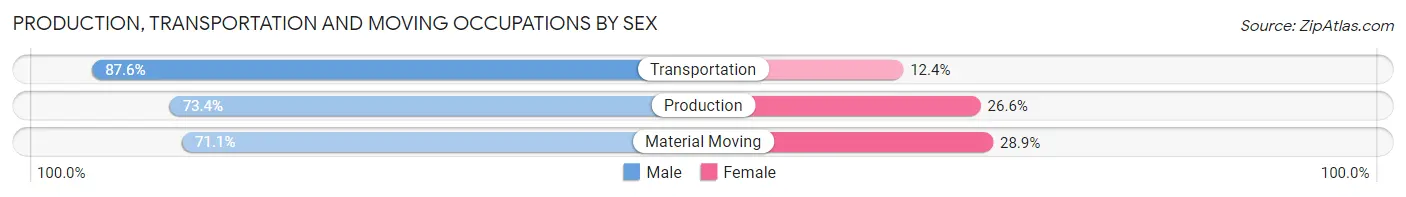
| Occupation | Male | Female |
| Production | 686 (73.4%) | 249 (26.6%) |
| Transportation | 275 (87.6%) | 39 (12.4%) |
| Material Moving | 465 (71.1%) | 189 (28.9%) |
| Total (Category) | 1,426 (74.9%) | 477 (25.1%) |
| Total (Overall) | 12,815 (51.1%) | 12,246 (48.9%) |
Employment Industries by Sex in San Luis Obispo
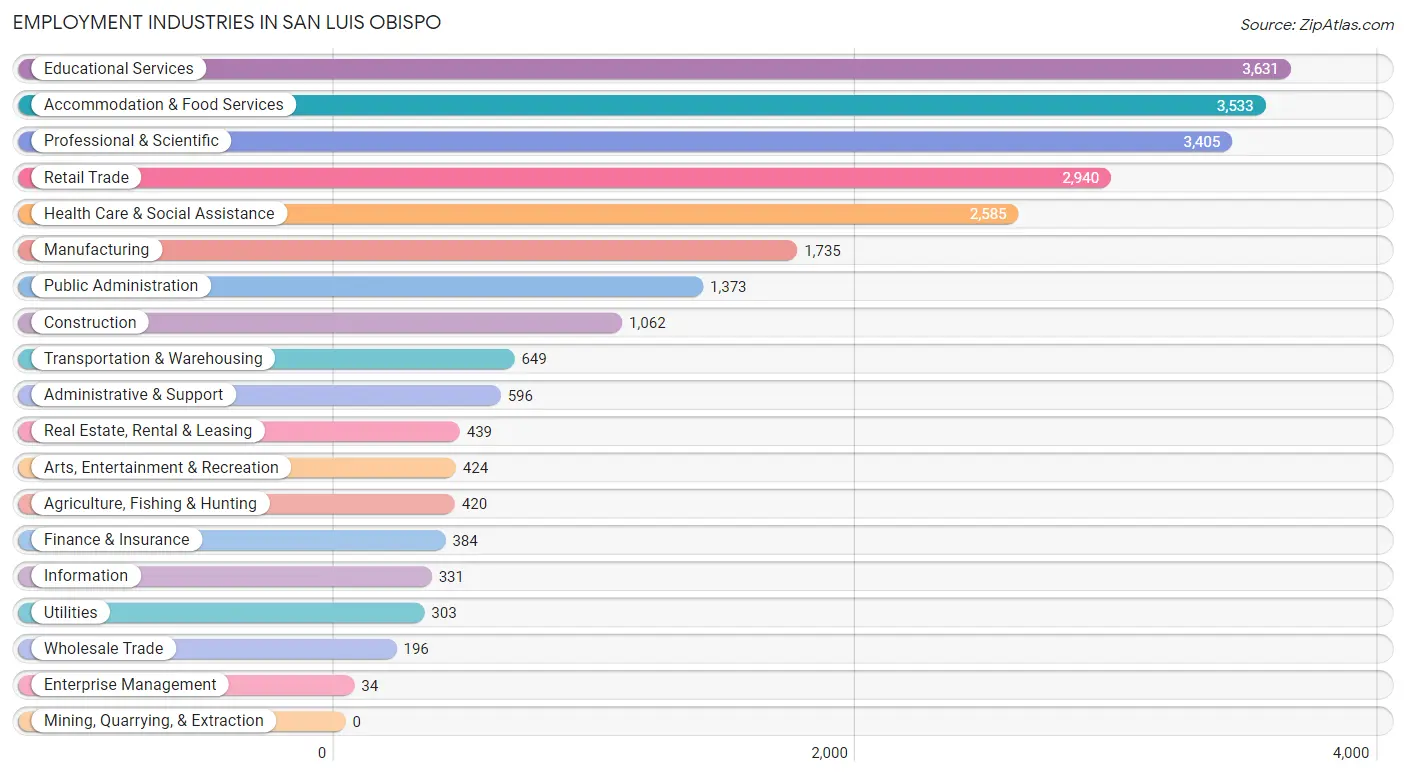
Employment Industries in San Luis Obispo
The major employment industries in San Luis Obispo include Educational Services (3,631 | 14.5%), Accommodation & Food Services (3,533 | 14.1%), Professional & Scientific (3,405 | 13.6%), Retail Trade (2,940 | 11.7%), and Health Care & Social Assistance (2,585 | 10.3%).
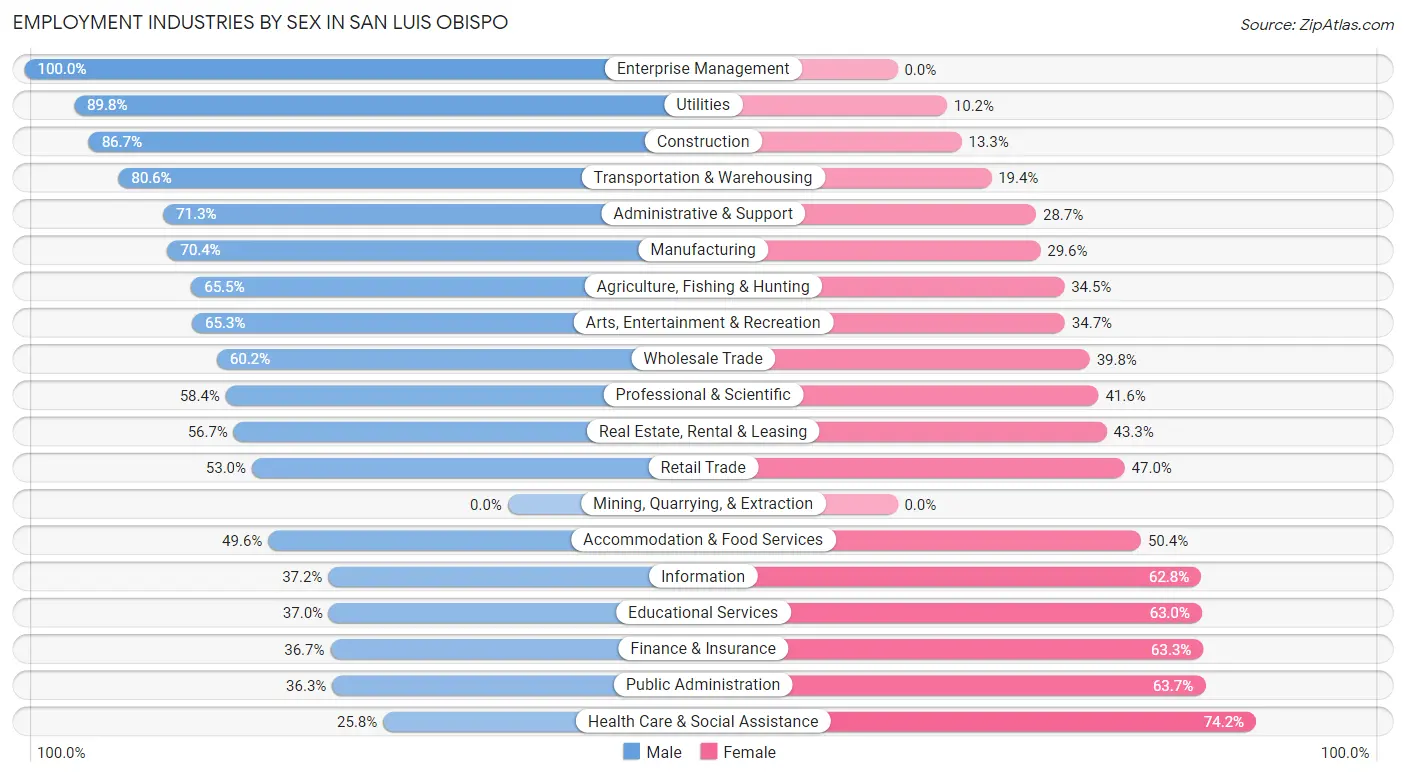
Employment Industries by Sex in San Luis Obispo
The San Luis Obispo industries that see more men than women are Enterprise Management (100.0%), Utilities (89.8%), and Construction (86.7%), whereas the industries that tend to have a higher number of women are Health Care & Social Assistance (74.2%), Public Administration (63.7%), and Finance & Insurance (63.3%).
| Industry | Male | Female |
| Agriculture, Fishing & Hunting | 275 (65.5%) | 145 (34.5%) |
| Mining, Quarrying, & Extraction | 0 (0.0%) | 0 (0.0%) |
| Construction | 921 (86.7%) | 141 (13.3%) |
| Manufacturing | 1,222 (70.4%) | 513 (29.6%) |
| Wholesale Trade | 118 (60.2%) | 78 (39.8%) |
| Retail Trade | 1,557 (53.0%) | 1,383 (47.0%) |
| Transportation & Warehousing | 523 (80.6%) | 126 (19.4%) |
| Utilities | 272 (89.8%) | 31 (10.2%) |
| Information | 123 (37.2%) | 208 (62.8%) |
| Finance & Insurance | 141 (36.7%) | 243 (63.3%) |
| Real Estate, Rental & Leasing | 249 (56.7%) | 190 (43.3%) |
| Professional & Scientific | 1,988 (58.4%) | 1,417 (41.6%) |
| Enterprise Management | 34 (100.0%) | 0 (0.0%) |
| Administrative & Support | 425 (71.3%) | 171 (28.7%) |
| Educational Services | 1,344 (37.0%) | 2,287 (63.0%) |
| Health Care & Social Assistance | 667 (25.8%) | 1,918 (74.2%) |
| Arts, Entertainment & Recreation | 277 (65.3%) | 147 (34.7%) |
| Accommodation & Food Services | 1,752 (49.6%) | 1,781 (50.4%) |
| Public Administration | 499 (36.3%) | 874 (63.7%) |
| Total | 12,815 (51.1%) | 12,246 (48.9%) |
Education in San Luis Obispo
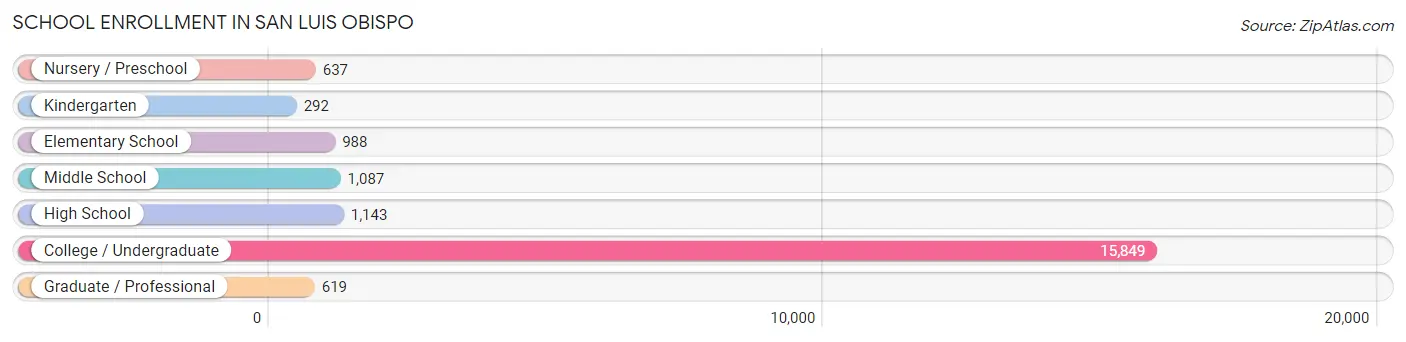
School Enrollment in San Luis Obispo
The most common levels of schooling among the 20,615 students in San Luis Obispo are college / undergraduate (15,849 | 76.9%), high school (1,143 | 5.5%), and middle school (1,087 | 5.3%).
| School Level | # Students | % Students |
| Nursery / Preschool | 637 | 3.1% |
| Kindergarten | 292 | 1.4% |
| Elementary School | 988 | 4.8% |
| Middle School | 1,087 | 5.3% |
| High School | 1,143 | 5.5% |
| College / Undergraduate | 15,849 | 76.9% |
| Graduate / Professional | 619 | 3.0% |
| Total | 20,615 | 100.0% |
School Enrollment by Age by Funding Source in San Luis Obispo
Out of a total of 20,615 students who are enrolled in schools in San Luis Obispo, 948 (4.6%) attend a private institution, while the remaining 19,667 (95.4%) are enrolled in public schools. The age group of 3 to 4 year olds has the highest likelihood of being enrolled in private schools, with 247 (60.8% in the age bracket) enrolled. Conversely, the age group of 20 to 24 year olds has the lowest likelihood of being enrolled in a private school, with 12,261 (98.5% in the age bracket) attending a public institution.
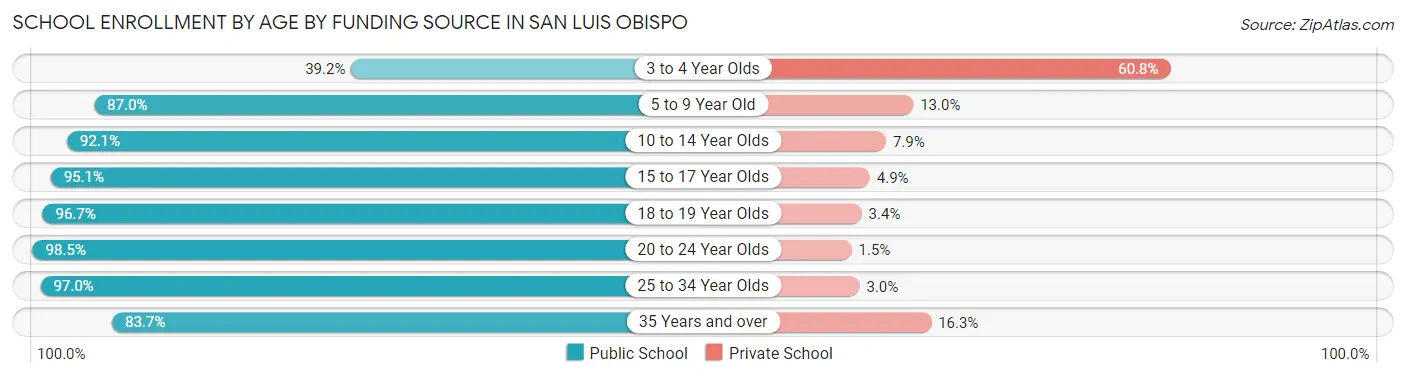
| Age Bracket | Public School | Private School |
| 3 to 4 Year Olds | 159 (39.2%) | 247 (60.8%) |
| 5 to 9 Year Old | 1,169 (87.0%) | 174 (13.0%) |
| 10 to 14 Year Olds | 1,275 (92.1%) | 109 (7.9%) |
| 15 to 17 Year Olds | 801 (95.1%) | 41 (4.9%) |
| 18 to 19 Year Olds | 2,716 (96.7%) | 94 (3.4%) |
| 20 to 24 Year Olds | 12,261 (98.5%) | 184 (1.5%) |
| 25 to 34 Year Olds | 951 (97.0%) | 29 (3.0%) |
| 35 Years and over | 339 (83.7%) | 66 (16.3%) |
| Total | 19,667 (95.4%) | 948 (4.6%) |
Educational Attainment by Field of Study in San Luis Obispo
Bio, nature & agricultural (1,658 | 12.3%), engineering (1,520 | 11.3%), business (1,452 | 10.8%), social sciences (1,433 | 10.7%), and education (1,278 | 9.5%) are the most common fields of study among 13,431 individuals in San Luis Obispo who have obtained a bachelor's degree or higher.
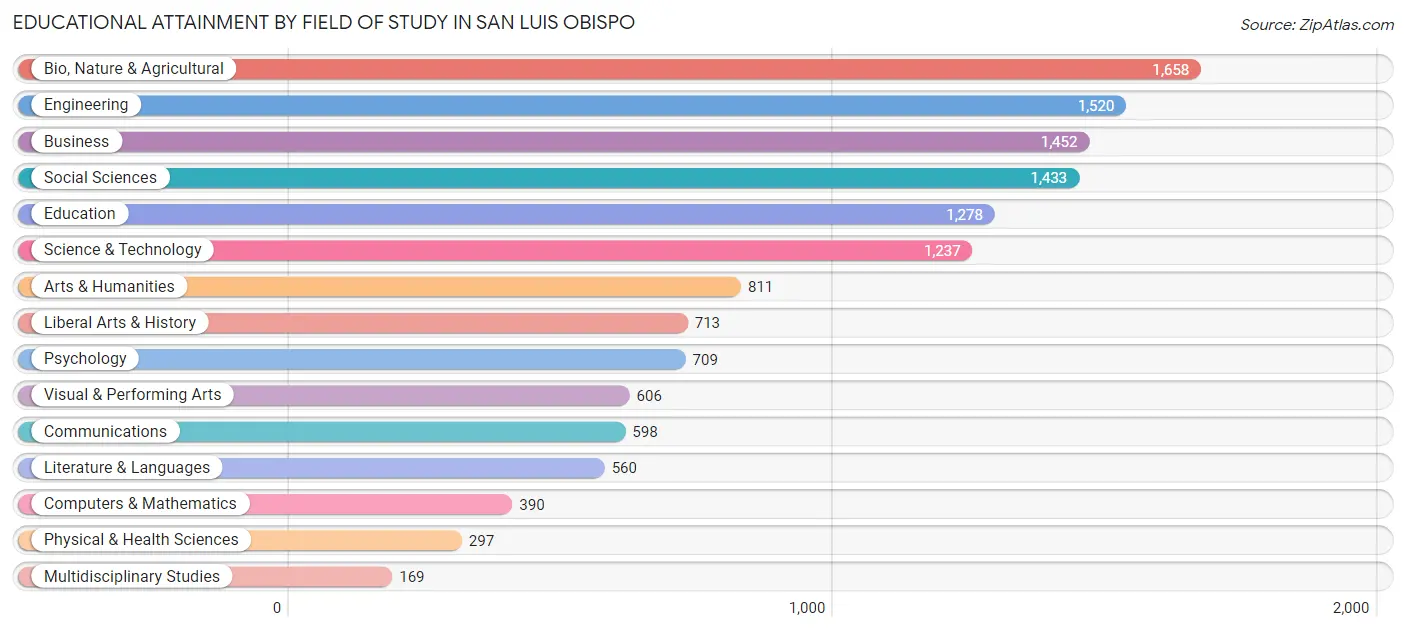
| Field of Study | # Graduates | % Graduates |
| Computers & Mathematics | 390 | 2.9% |
| Bio, Nature & Agricultural | 1,658 | 12.3% |
| Physical & Health Sciences | 297 | 2.2% |
| Psychology | 709 | 5.3% |
| Social Sciences | 1,433 | 10.7% |
| Engineering | 1,520 | 11.3% |
| Multidisciplinary Studies | 169 | 1.3% |
| Science & Technology | 1,237 | 9.2% |
| Business | 1,452 | 10.8% |
| Education | 1,278 | 9.5% |
| Literature & Languages | 560 | 4.2% |
| Liberal Arts & History | 713 | 5.3% |
| Visual & Performing Arts | 606 | 4.5% |
| Communications | 598 | 4.4% |
| Arts & Humanities | 811 | 6.0% |
| Total | 13,431 | 100.0% |
Transportation & Commute in San Luis Obispo
Vehicle Availability by Sex in San Luis Obispo
The most prevalent vehicle ownership categories in San Luis Obispo are males with 2 vehicles (4,298, accounting for 34.9%) and females with 2 vehicles (4,527, making up 36.6%).
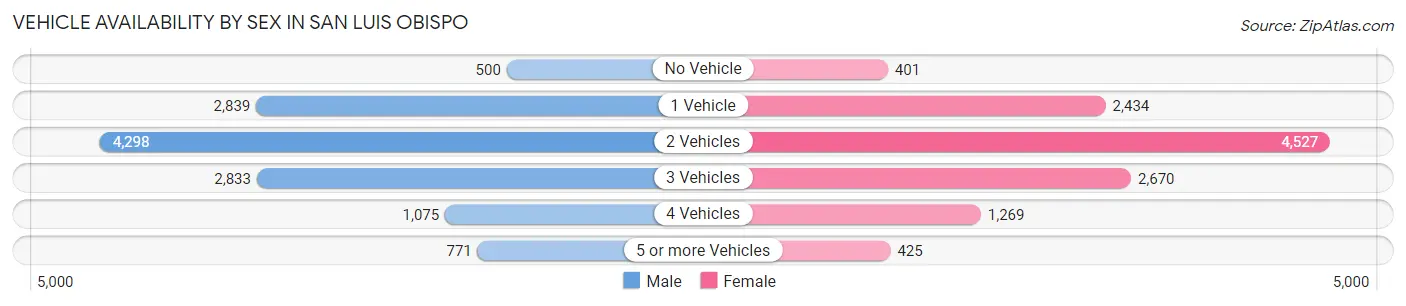
| Vehicles Available | Male | Female |
| No Vehicle | 500 (4.1%) | 401 (3.4%) |
| 1 Vehicle | 2,839 (23.1%) | 2,434 (20.8%) |
| 2 Vehicles | 4,298 (34.9%) | 4,527 (38.6%) |
| 3 Vehicles | 2,833 (23.0%) | 2,670 (22.8%) |
| 4 Vehicles | 1,075 (8.7%) | 1,269 (10.8%) |
| 5 or more Vehicles | 771 (6.3%) | 425 (3.6%) |
| Total | 12,316 (100.0%) | 11,726 (100.0%) |
Commute Time in San Luis Obispo
The most frequently occuring commute durations in San Luis Obispo are 10 to 14 minutes (5,467 commuters, 26.1%), 5 to 9 minutes (5,305 commuters, 25.3%), and 15 to 19 minutes (3,632 commuters, 17.3%).
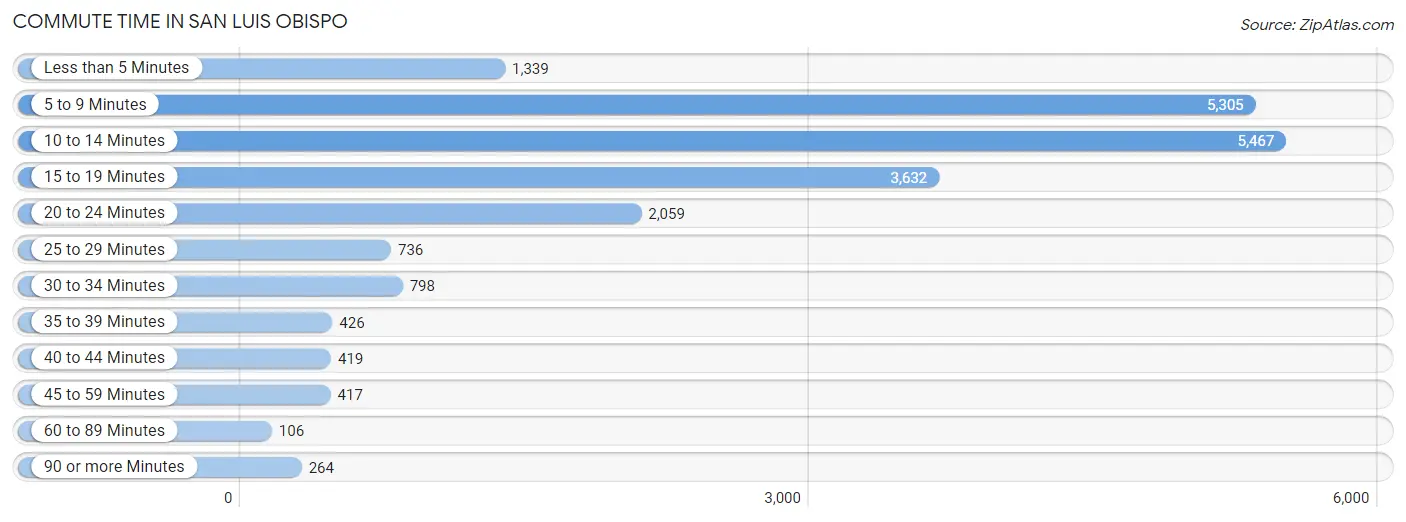
| Commute Time | # Commuters | % Commuters |
| Less than 5 Minutes | 1,339 | 6.4% |
| 5 to 9 Minutes | 5,305 | 25.3% |
| 10 to 14 Minutes | 5,467 | 26.1% |
| 15 to 19 Minutes | 3,632 | 17.3% |
| 20 to 24 Minutes | 2,059 | 9.8% |
| 25 to 29 Minutes | 736 | 3.5% |
| 30 to 34 Minutes | 798 | 3.8% |
| 35 to 39 Minutes | 426 | 2.0% |
| 40 to 44 Minutes | 419 | 2.0% |
| 45 to 59 Minutes | 417 | 2.0% |
| 60 to 89 Minutes | 106 | 0.5% |
| 90 or more Minutes | 264 | 1.3% |
Commute Time by Sex in San Luis Obispo
The most common commute times in San Luis Obispo are 10 to 14 minutes (2,813 commuters, 26.3%) for males and 5 to 9 minutes (2,666 commuters, 26.0%) for females.
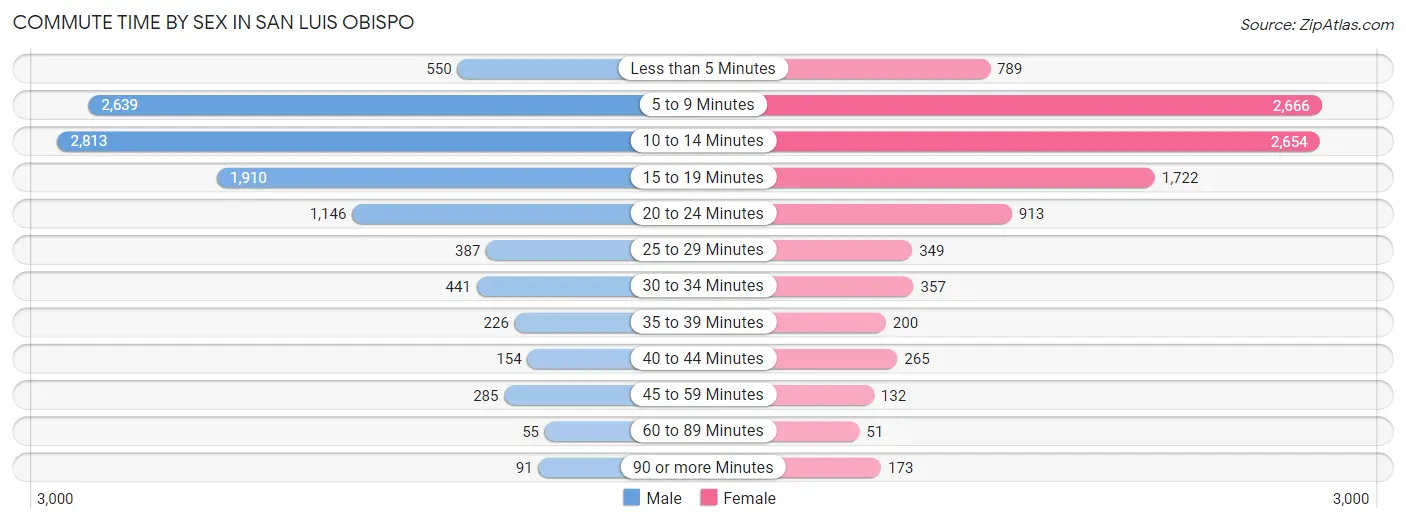
| Commute Time | Male | Female |
| Less than 5 Minutes | 550 (5.1%) | 789 (7.7%) |
| 5 to 9 Minutes | 2,639 (24.7%) | 2,666 (26.0%) |
| 10 to 14 Minutes | 2,813 (26.3%) | 2,654 (25.8%) |
| 15 to 19 Minutes | 1,910 (17.9%) | 1,722 (16.8%) |
| 20 to 24 Minutes | 1,146 (10.7%) | 913 (8.9%) |
| 25 to 29 Minutes | 387 (3.6%) | 349 (3.4%) |
| 30 to 34 Minutes | 441 (4.1%) | 357 (3.5%) |
| 35 to 39 Minutes | 226 (2.1%) | 200 (1.9%) |
| 40 to 44 Minutes | 154 (1.4%) | 265 (2.6%) |
| 45 to 59 Minutes | 285 (2.7%) | 132 (1.3%) |
| 60 to 89 Minutes | 55 (0.5%) | 51 (0.5%) |
| 90 or more Minutes | 91 (0.9%) | 173 (1.7%) |
Time of Departure to Work by Sex in San Luis Obispo
The most frequent times of departure to work in San Luis Obispo are 7:30 AM to 7:59 AM (1,622, 15.2%) for males and 7:30 AM to 7:59 AM (1,593, 15.5%) for females.
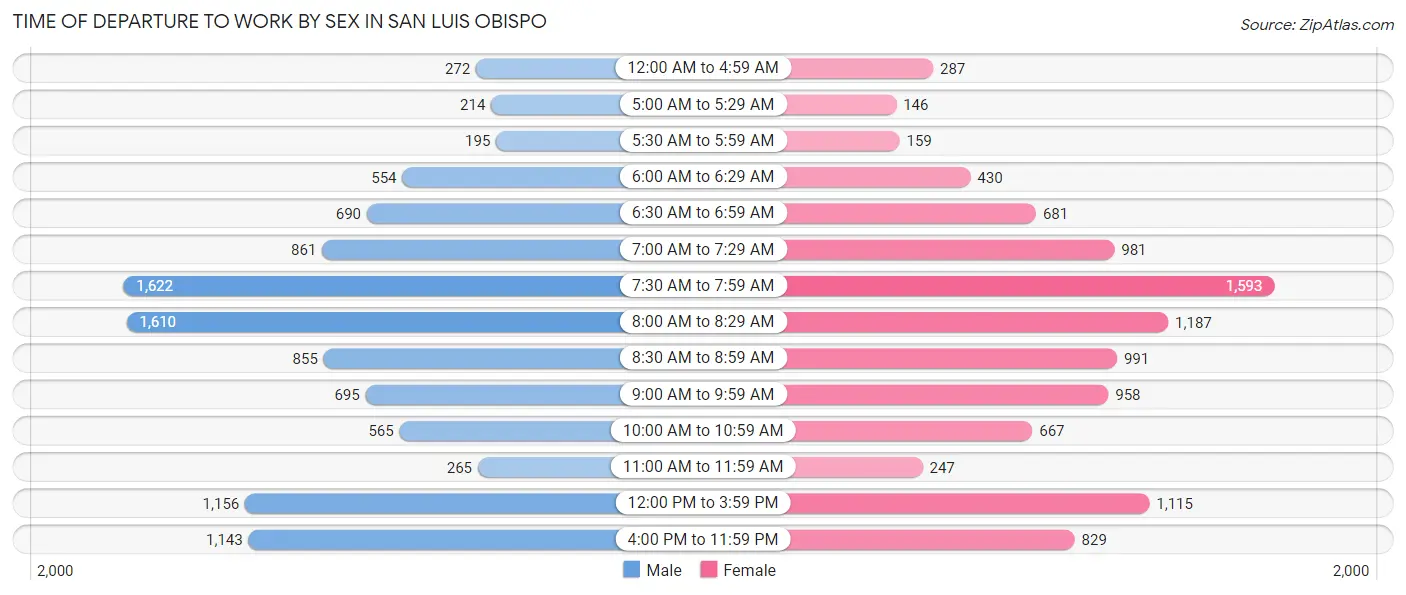
| Time of Departure | Male | Female |
| 12:00 AM to 4:59 AM | 272 (2.5%) | 287 (2.8%) |
| 5:00 AM to 5:29 AM | 214 (2.0%) | 146 (1.4%) |
| 5:30 AM to 5:59 AM | 195 (1.8%) | 159 (1.5%) |
| 6:00 AM to 6:29 AM | 554 (5.2%) | 430 (4.2%) |
| 6:30 AM to 6:59 AM | 690 (6.5%) | 681 (6.6%) |
| 7:00 AM to 7:29 AM | 861 (8.1%) | 981 (9.6%) |
| 7:30 AM to 7:59 AM | 1,622 (15.2%) | 1,593 (15.5%) |
| 8:00 AM to 8:29 AM | 1,610 (15.0%) | 1,187 (11.6%) |
| 8:30 AM to 8:59 AM | 855 (8.0%) | 991 (9.7%) |
| 9:00 AM to 9:59 AM | 695 (6.5%) | 958 (9.3%) |
| 10:00 AM to 10:59 AM | 565 (5.3%) | 667 (6.5%) |
| 11:00 AM to 11:59 AM | 265 (2.5%) | 247 (2.4%) |
| 12:00 PM to 3:59 PM | 1,156 (10.8%) | 1,115 (10.9%) |
| 4:00 PM to 11:59 PM | 1,143 (10.7%) | 829 (8.1%) |
| Total | 10,697 (100.0%) | 10,271 (100.0%) |
Housing Occupancy in San Luis Obispo
Occupancy by Ownership in San Luis Obispo
Of the total 19,254 dwellings in San Luis Obispo, owner-occupied units account for 7,320 (38.0%), while renter-occupied units make up 11,934 (62.0%).
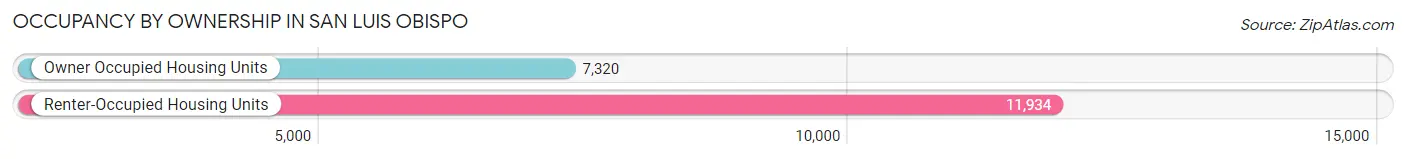
| Occupancy | # Housing Units | % Housing Units |
| Owner Occupied Housing Units | 7,320 | 38.0% |
| Renter-Occupied Housing Units | 11,934 | 62.0% |
| Total Occupied Housing Units | 19,254 | 100.0% |
Occupancy by Household Size in San Luis Obispo
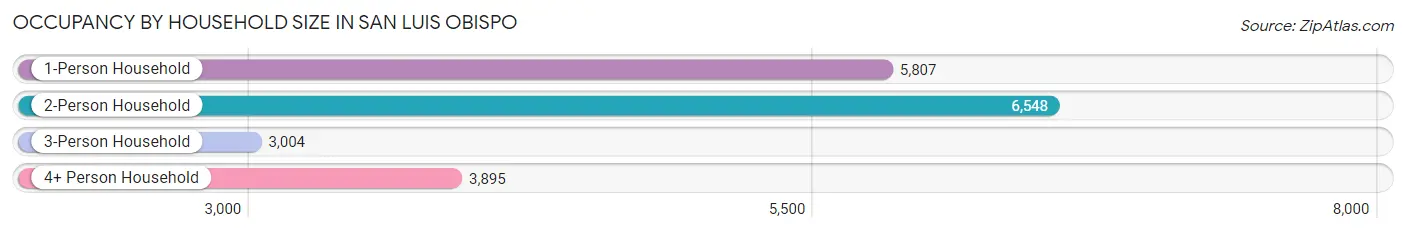
| Household Size | # Housing Units | % Housing Units |
| 1-Person Household | 5,807 | 30.2% |
| 2-Person Household | 6,548 | 34.0% |
| 3-Person Household | 3,004 | 15.6% |
| 4+ Person Household | 3,895 | 20.2% |
| Total Housing Units | 19,254 | 100.0% |
Occupancy by Ownership by Household Size in San Luis Obispo
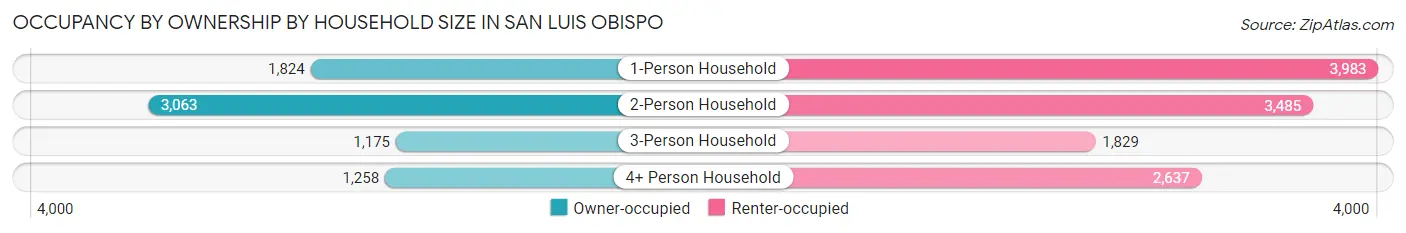
| Household Size | Owner-occupied | Renter-occupied |
| 1-Person Household | 1,824 (31.4%) | 3,983 (68.6%) |
| 2-Person Household | 3,063 (46.8%) | 3,485 (53.2%) |
| 3-Person Household | 1,175 (39.1%) | 1,829 (60.9%) |
| 4+ Person Household | 1,258 (32.3%) | 2,637 (67.7%) |
| Total Housing Units | 7,320 (38.0%) | 11,934 (62.0%) |
Occupancy by Educational Attainment in San Luis Obispo
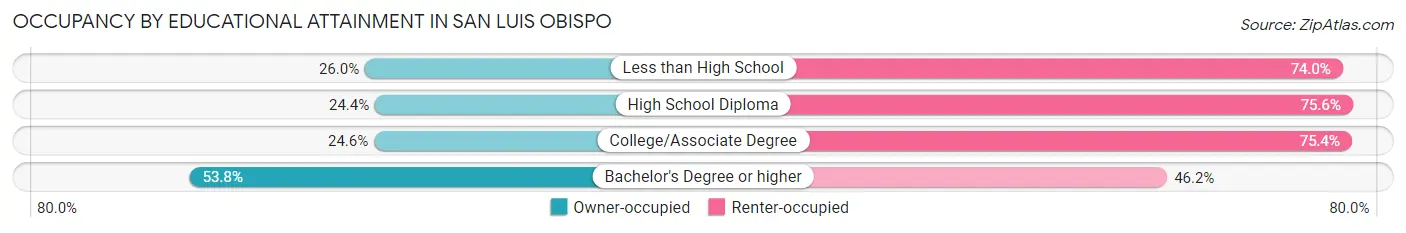
| Household Size | Owner-occupied | Renter-occupied |
| Less than High School | 135 (26.0%) | 384 (74.0%) |
| High School Diploma | 526 (24.4%) | 1,628 (75.6%) |
| College/Associate Degree | 1,904 (24.6%) | 5,845 (75.4%) |
| Bachelor's Degree or higher | 4,755 (53.8%) | 4,077 (46.2%) |
Occupancy by Age of Householder in San Luis Obispo
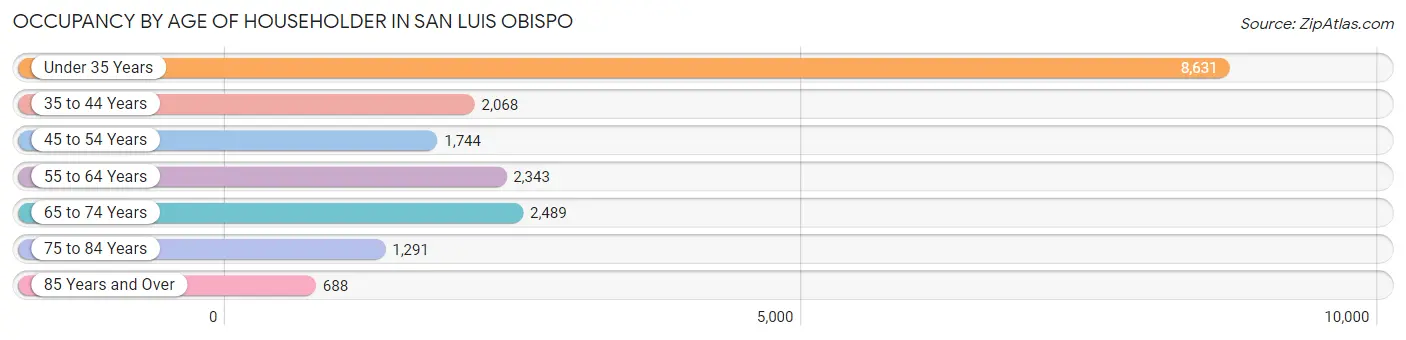
| Age Bracket | # Households | % Households |
| Under 35 Years | 8,631 | 44.8% |
| 35 to 44 Years | 2,068 | 10.7% |
| 45 to 54 Years | 1,744 | 9.1% |
| 55 to 64 Years | 2,343 | 12.2% |
| 65 to 74 Years | 2,489 | 12.9% |
| 75 to 84 Years | 1,291 | 6.7% |
| 85 Years and Over | 688 | 3.6% |
| Total | 19,254 | 100.0% |
Housing Finances in San Luis Obispo
Median Income by Occupancy in San Luis Obispo
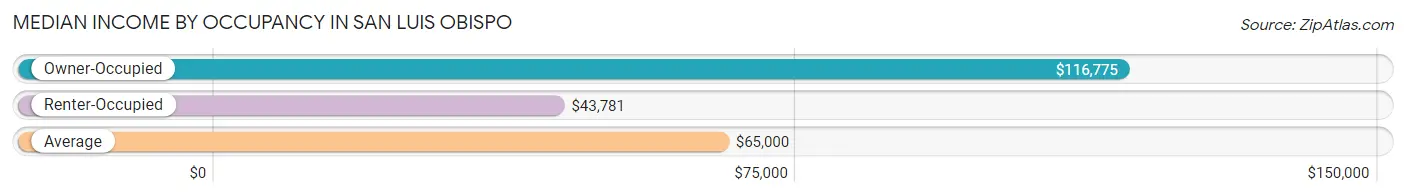
| Occupancy Type | # Households | Median Income |
| Owner-Occupied | 7,320 (38.0%) | $116,775 |
| Renter-Occupied | 11,934 (62.0%) | $43,781 |
| Average | 19,254 (100.0%) | $65,000 |
Occupancy by Householder Income Bracket in San Luis Obispo
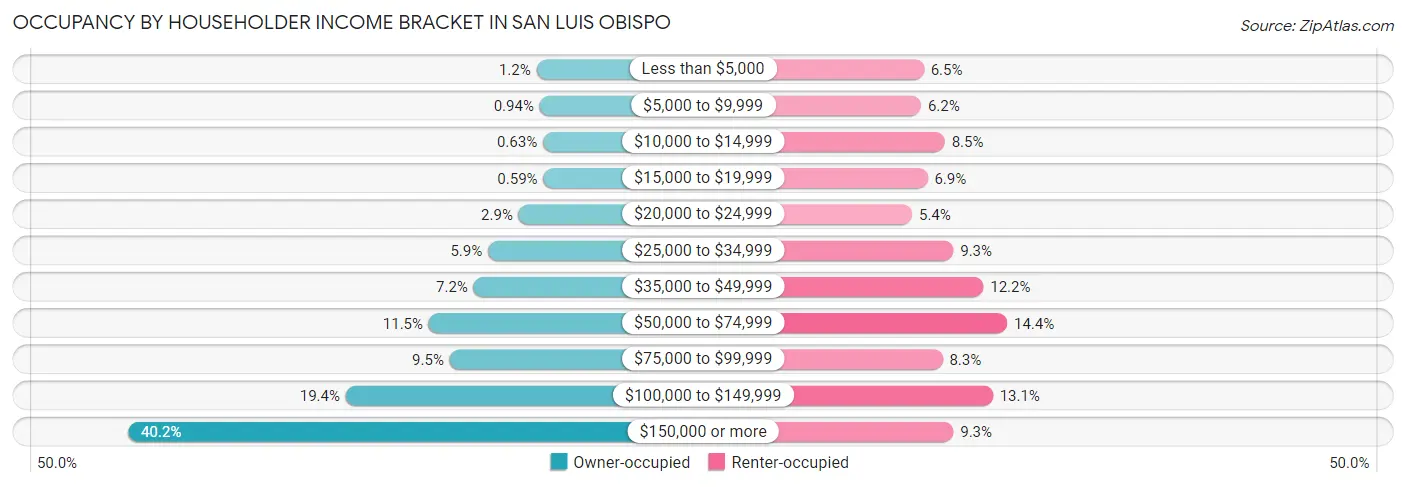
| Income Bracket | Owner-occupied | Renter-occupied |
| Less than $5,000 | 91 (1.2%) | 774 (6.5%) |
| $5,000 to $9,999 | 69 (0.9%) | 744 (6.2%) |
| $10,000 to $14,999 | 46 (0.6%) | 1,013 (8.5%) |
| $15,000 to $19,999 | 43 (0.6%) | 818 (6.9%) |
| $20,000 to $24,999 | 215 (2.9%) | 642 (5.4%) |
| $25,000 to $34,999 | 429 (5.9%) | 1,111 (9.3%) |
| $35,000 to $49,999 | 529 (7.2%) | 1,452 (12.2%) |
| $50,000 to $74,999 | 842 (11.5%) | 1,722 (14.4%) |
| $75,000 to $99,999 | 696 (9.5%) | 988 (8.3%) |
| $100,000 to $149,999 | 1,421 (19.4%) | 1,559 (13.1%) |
| $150,000 or more | 2,939 (40.2%) | 1,111 (9.3%) |
| Total | 7,320 (100.0%) | 11,934 (100.0%) |
Monthly Housing Cost Tiers in San Luis Obispo
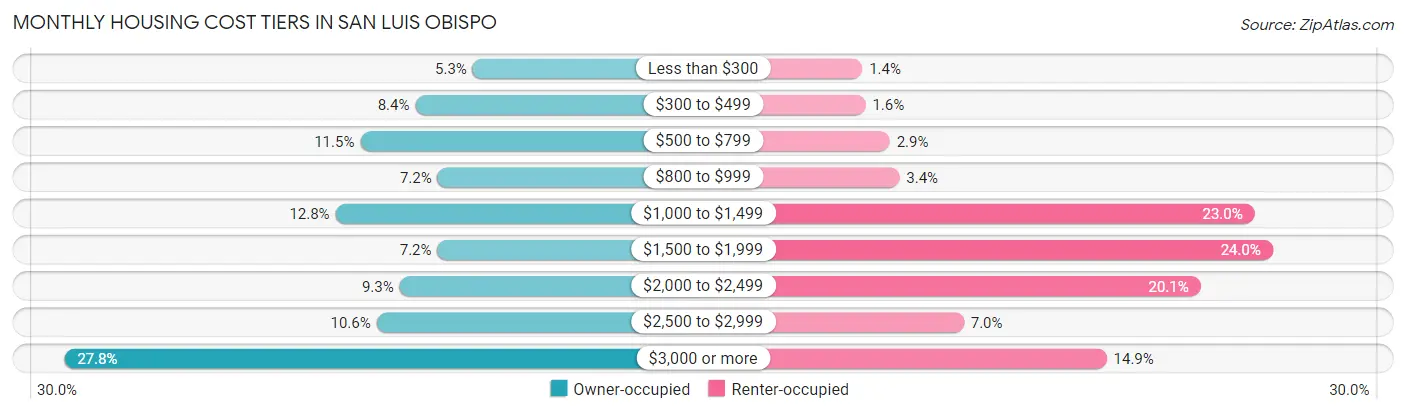
| Monthly Cost | Owner-occupied | Renter-occupied |
| Less than $300 | 384 (5.2%) | 164 (1.4%) |
| $300 to $499 | 616 (8.4%) | 185 (1.5%) |
| $500 to $799 | 839 (11.5%) | 345 (2.9%) |
| $800 to $999 | 526 (7.2%) | 408 (3.4%) |
| $1,000 to $1,499 | 939 (12.8%) | 2,749 (23.0%) |
| $1,500 to $1,999 | 527 (7.2%) | 2,869 (24.0%) |
| $2,000 to $2,499 | 680 (9.3%) | 2,394 (20.1%) |
| $2,500 to $2,999 | 773 (10.6%) | 833 (7.0%) |
| $3,000 or more | 2,036 (27.8%) | 1,774 (14.9%) |
| Total | 7,320 (100.0%) | 11,934 (100.0%) |
Physical Housing Characteristics in San Luis Obispo
Housing Structures in San Luis Obispo
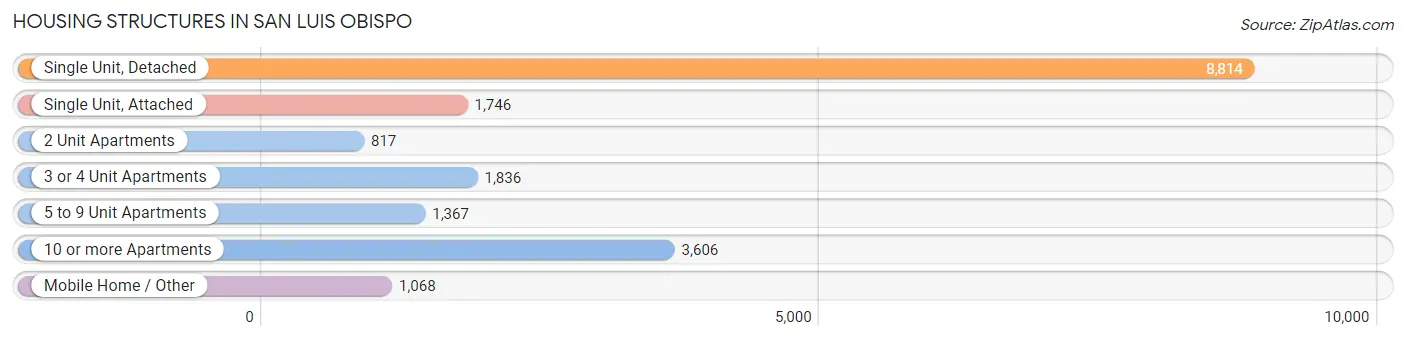
| Structure Type | # Housing Units | % Housing Units |
| Single Unit, Detached | 8,814 | 45.8% |
| Single Unit, Attached | 1,746 | 9.1% |
| 2 Unit Apartments | 817 | 4.2% |
| 3 or 4 Unit Apartments | 1,836 | 9.5% |
| 5 to 9 Unit Apartments | 1,367 | 7.1% |
| 10 or more Apartments | 3,606 | 18.7% |
| Mobile Home / Other | 1,068 | 5.6% |
| Total | 19,254 | 100.0% |
Housing Structures by Occupancy in San Luis Obispo
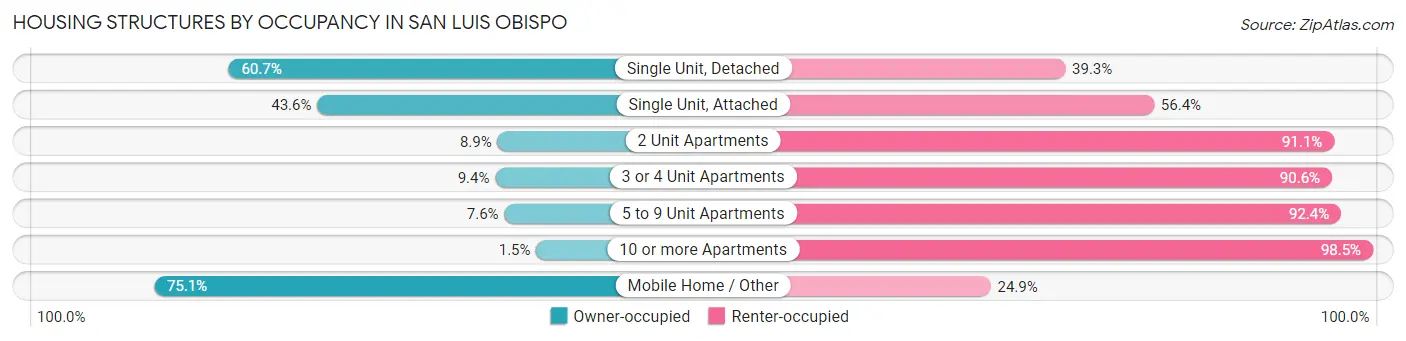
| Structure Type | Owner-occupied | Renter-occupied |
| Single Unit, Detached | 5,354 (60.7%) | 3,460 (39.3%) |
| Single Unit, Attached | 762 (43.6%) | 984 (56.4%) |
| 2 Unit Apartments | 73 (8.9%) | 744 (91.1%) |
| 3 or 4 Unit Apartments | 172 (9.4%) | 1,664 (90.6%) |
| 5 to 9 Unit Apartments | 104 (7.6%) | 1,263 (92.4%) |
| 10 or more Apartments | 53 (1.5%) | 3,553 (98.5%) |
| Mobile Home / Other | 802 (75.1%) | 266 (24.9%) |
| Total | 7,320 (38.0%) | 11,934 (62.0%) |
Housing Structures by Number of Rooms in San Luis Obispo
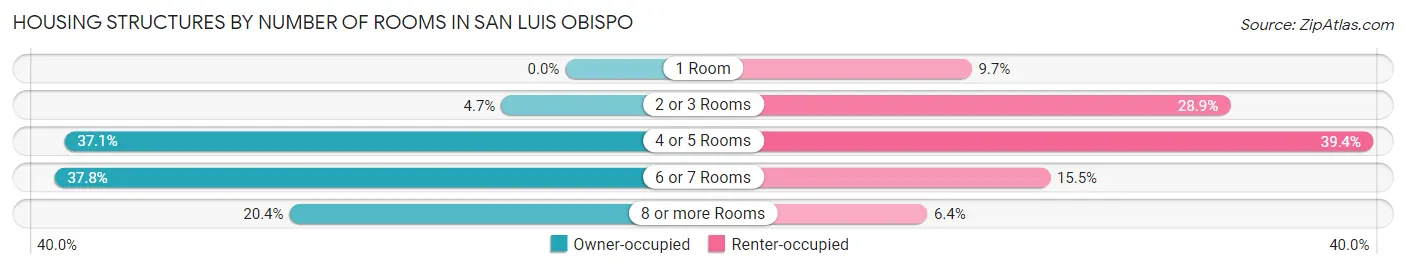
| Number of Rooms | Owner-occupied | Renter-occupied |
| 1 Room | 0 (0.0%) | 1,161 (9.7%) |
| 2 or 3 Rooms | 347 (4.7%) | 3,444 (28.9%) |
| 4 or 5 Rooms | 2,713 (37.1%) | 4,706 (39.4%) |
| 6 or 7 Rooms | 2,766 (37.8%) | 1,854 (15.5%) |
| 8 or more Rooms | 1,494 (20.4%) | 769 (6.4%) |
| Total | 7,320 (100.0%) | 11,934 (100.0%) |
Housing Structure by Heating Type in San Luis Obispo
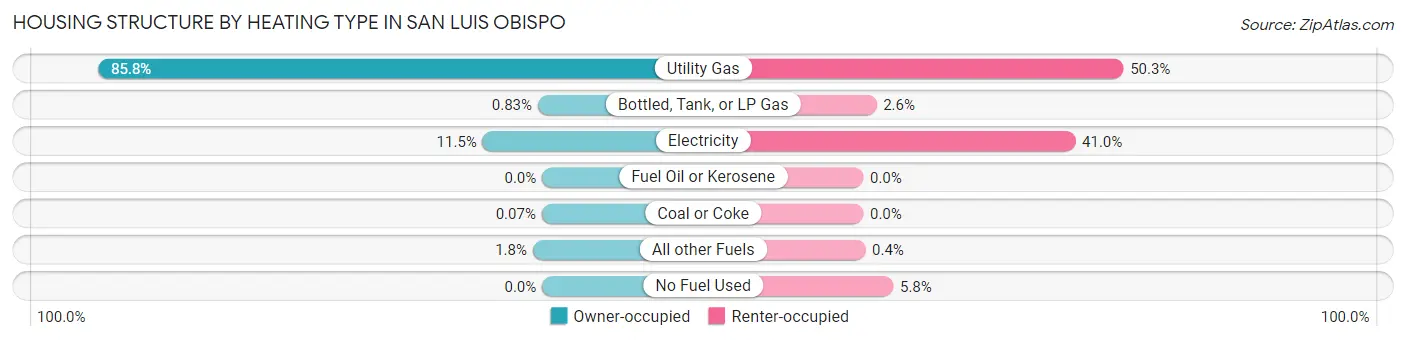
| Heating Type | Owner-occupied | Renter-occupied |
| Utility Gas | 6,282 (85.8%) | 5,999 (50.3%) |
| Bottled, Tank, or LP Gas | 61 (0.8%) | 304 (2.5%) |
| Electricity | 841 (11.5%) | 4,891 (41.0%) |
| Fuel Oil or Kerosene | 0 (0.0%) | 0 (0.0%) |
| Coal or Coke | 5 (0.1%) | 0 (0.0%) |
| All other Fuels | 131 (1.8%) | 48 (0.4%) |
| No Fuel Used | 0 (0.0%) | 692 (5.8%) |
| Total | 7,320 (100.0%) | 11,934 (100.0%) |
Household Vehicle Usage in San Luis Obispo
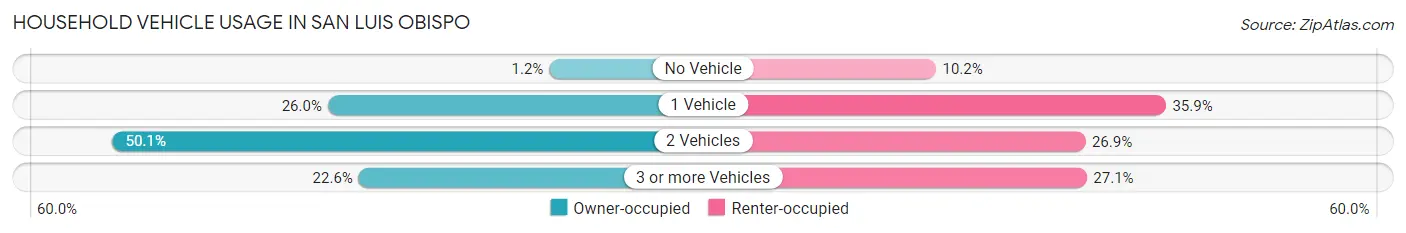
| Vehicles per Household | Owner-occupied | Renter-occupied |
| No Vehicle | 91 (1.2%) | 1,211 (10.2%) |
| 1 Vehicle | 1,906 (26.0%) | 4,286 (35.9%) |
| 2 Vehicles | 3,670 (50.1%) | 3,209 (26.9%) |
| 3 or more Vehicles | 1,653 (22.6%) | 3,228 (27.1%) |
| Total | 7,320 (100.0%) | 11,934 (100.0%) |
Real Estate & Mortgages in San Luis Obispo
Real Estate and Mortgage Overview in San Luis Obispo
| Characteristic | Without Mortgage | With Mortgage |
| Housing Units | 2,947 | 4,373 |
| Median Property Value | $783,300 | $874,800 |
| Median Household Income | $84,982 | $2,201 |
| Monthly Housing Costs | $699 | $2,031 |
| Real Estate Taxes | $3,118 | $113 |
Property Value by Mortgage Status in San Luis Obispo
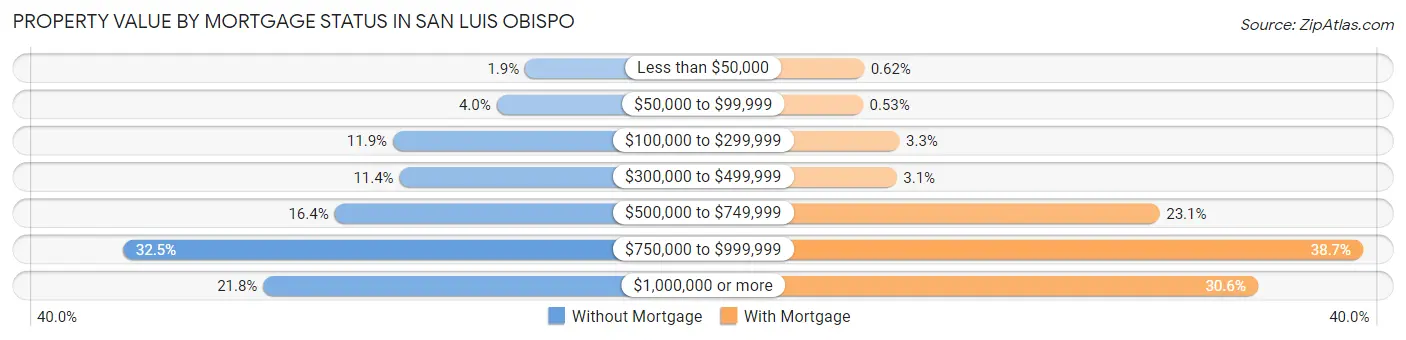
| Property Value | Without Mortgage | With Mortgage |
| Less than $50,000 | 55 (1.9%) | 27 (0.6%) |
| $50,000 to $99,999 | 119 (4.0%) | 23 (0.5%) |
| $100,000 to $299,999 | 352 (11.9%) | 145 (3.3%) |
| $300,000 to $499,999 | 337 (11.4%) | 136 (3.1%) |
| $500,000 to $749,999 | 483 (16.4%) | 1,012 (23.1%) |
| $750,000 to $999,999 | 958 (32.5%) | 1,690 (38.7%) |
| $1,000,000 or more | 643 (21.8%) | 1,340 (30.6%) |
| Total | 2,947 (100.0%) | 4,373 (100.0%) |
Household Income by Mortgage Status in San Luis Obispo
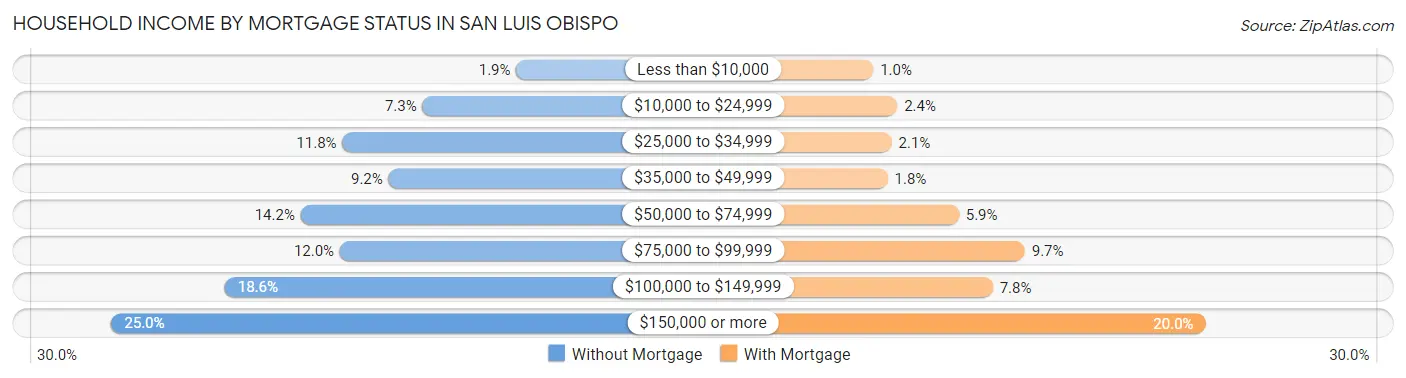
| Household Income | Without Mortgage | With Mortgage |
| Less than $10,000 | 56 (1.9%) | 44 (1.0%) |
| $10,000 to $24,999 | 214 (7.3%) | 104 (2.4%) |
| $25,000 to $34,999 | 349 (11.8%) | 90 (2.1%) |
| $35,000 to $49,999 | 271 (9.2%) | 80 (1.8%) |
| $50,000 to $74,999 | 419 (14.2%) | 258 (5.9%) |
| $75,000 to $99,999 | 353 (12.0%) | 423 (9.7%) |
| $100,000 to $149,999 | 547 (18.6%) | 343 (7.8%) |
| $150,000 or more | 738 (25.0%) | 874 (20.0%) |
| Total | 2,947 (100.0%) | 4,373 (100.0%) |
Property Value to Household Income Ratio in San Luis Obispo
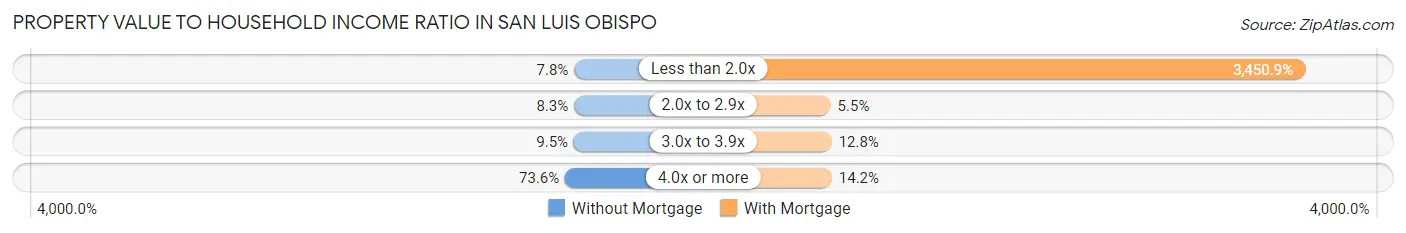
| Value-to-Income Ratio | Without Mortgage | With Mortgage |
| Less than 2.0x | 230 (7.8%) | 150,906 (3,450.9%) |
| 2.0x to 2.9x | 244 (8.3%) | 242 (5.5%) |
| 3.0x to 3.9x | 281 (9.5%) | 561 (12.8%) |
| 4.0x or more | 2,169 (73.6%) | 619 (14.2%) |
| Total | 2,947 (100.0%) | 4,373 (100.0%) |
Real Estate Taxes by Mortgage Status in San Luis Obispo
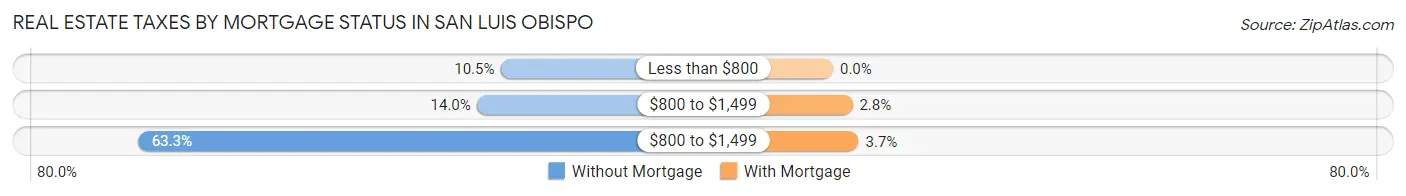
| Property Taxes | Without Mortgage | With Mortgage |
| Less than $800 | 309 (10.5%) | 0 (0.0%) |
| $800 to $1,499 | 411 (14.0%) | 124 (2.8%) |
| $800 to $1,499 | 1,866 (63.3%) | 163 (3.7%) |
| Total | 2,947 (100.0%) | 4,373 (100.0%) |
Health & Disability in San Luis Obispo
Health Insurance Coverage by Age in San Luis Obispo
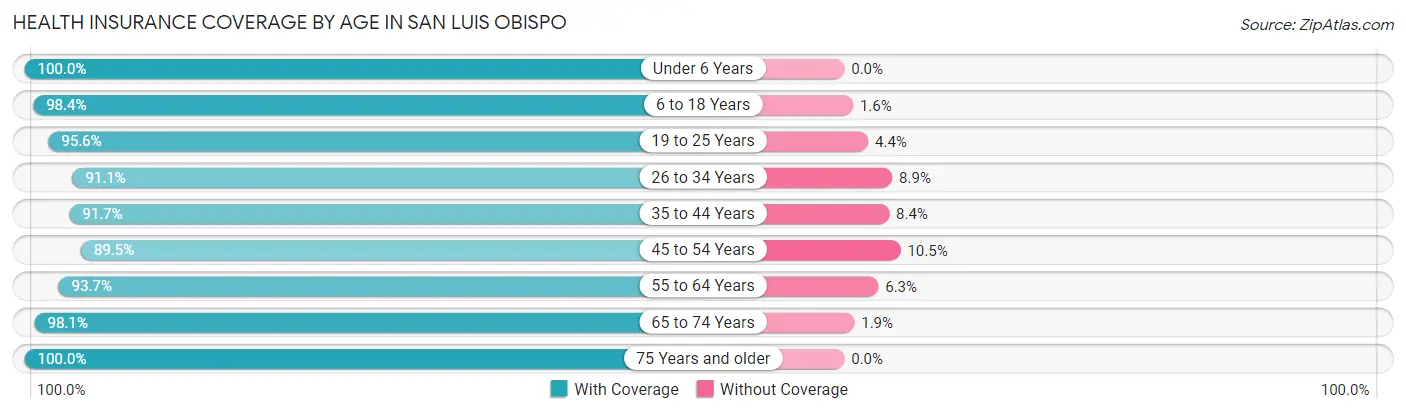
| Age Bracket | With Coverage | Without Coverage |
| Under 6 Years | 1,880 (100.0%) | 0 (0.0%) |
| 6 to 18 Years | 3,922 (98.4%) | 64 (1.6%) |
| 19 to 25 Years | 17,810 (95.6%) | 827 (4.4%) |
| 26 to 34 Years | 4,917 (91.1%) | 482 (8.9%) |
| 35 to 44 Years | 3,577 (91.6%) | 326 (8.4%) |
| 45 to 54 Years | 2,768 (89.5%) | 324 (10.5%) |
| 55 to 64 Years | 3,932 (93.7%) | 266 (6.3%) |
| 65 to 74 Years | 3,370 (98.1%) | 64 (1.9%) |
| 75 Years and older | 2,694 (100.0%) | 0 (0.0%) |
| Total | 44,870 (95.0%) | 2,353 (5.0%) |
Health Insurance Coverage by Citizenship Status in San Luis Obispo
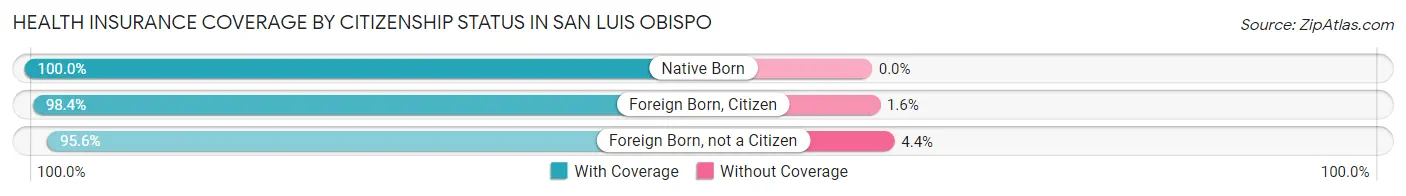
| Citizenship Status | With Coverage | Without Coverage |
| Native Born | 1,880 (100.0%) | 0 (0.0%) |
| Foreign Born, Citizen | 3,922 (98.4%) | 64 (1.6%) |
| Foreign Born, not a Citizen | 17,810 (95.6%) | 827 (4.4%) |
Health Insurance Coverage by Household Income in San Luis Obispo
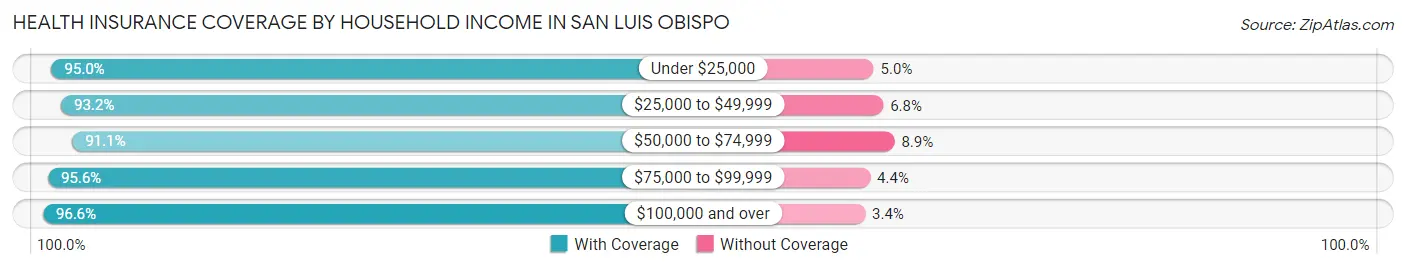
| Household Income | With Coverage | Without Coverage |
| Under $25,000 | 8,831 (95.0%) | 468 (5.0%) |
| $25,000 to $49,999 | 7,609 (93.2%) | 558 (6.8%) |
| $50,000 to $74,999 | 4,802 (91.1%) | 471 (8.9%) |
| $75,000 to $99,999 | 3,366 (95.6%) | 154 (4.4%) |
| $100,000 and over | 19,101 (96.6%) | 678 (3.4%) |
Public vs Private Health Insurance Coverage by Age in San Luis Obispo
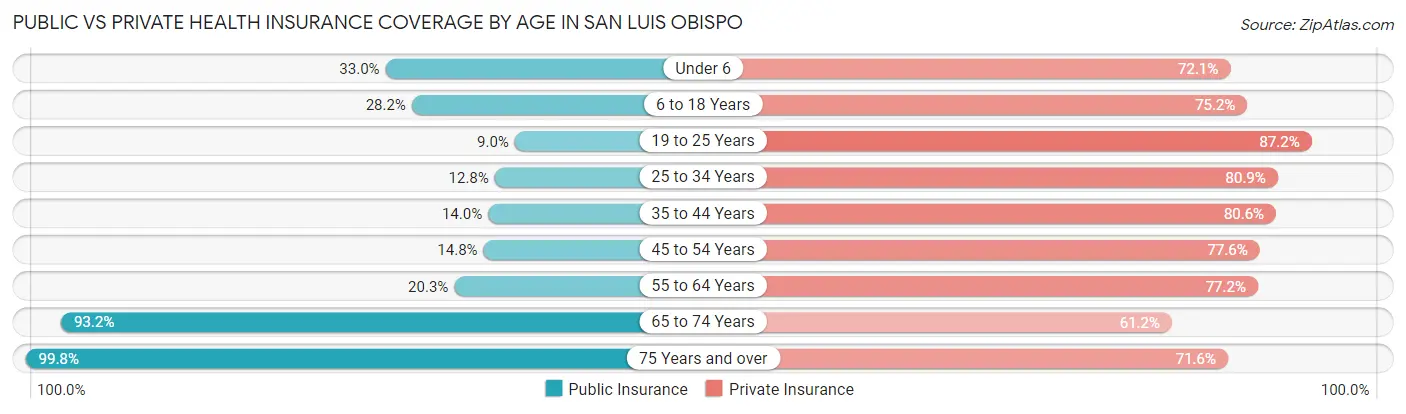
| Age Bracket | Public Insurance | Private Insurance |
| Under 6 | 621 (33.0%) | 1,355 (72.1%) |
| 6 to 18 Years | 1,122 (28.1%) | 2,999 (75.2%) |
| 19 to 25 Years | 1,683 (9.0%) | 16,250 (87.2%) |
| 25 to 34 Years | 689 (12.8%) | 4,367 (80.9%) |
| 35 to 44 Years | 546 (14.0%) | 3,145 (80.6%) |
| 45 to 54 Years | 459 (14.8%) | 2,398 (77.5%) |
| 55 to 64 Years | 851 (20.3%) | 3,241 (77.2%) |
| 65 to 74 Years | 3,202 (93.2%) | 2,103 (61.2%) |
| 75 Years and over | 2,689 (99.8%) | 1,930 (71.6%) |
| Total | 11,862 (25.1%) | 37,788 (80.0%) |
Disability Status by Sex by Age in San Luis Obispo
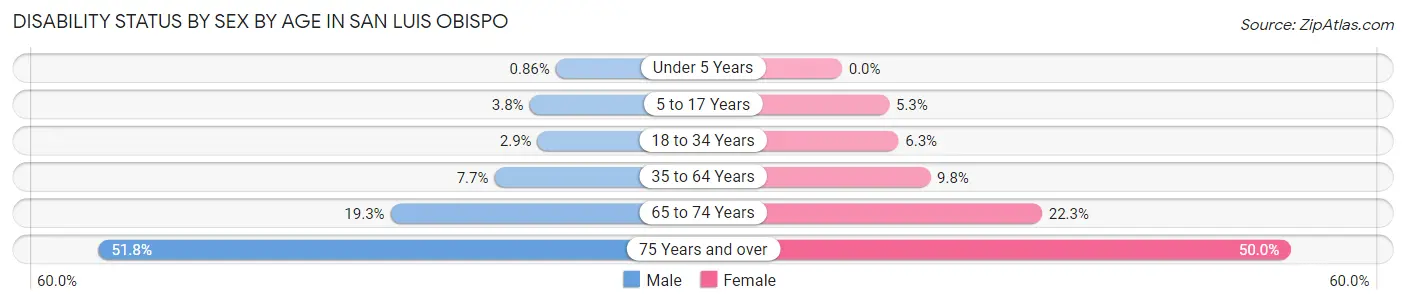
| Age Bracket | Male | Female |
| Under 5 Years | 7 (0.9%) | 0 (0.0%) |
| 5 to 17 Years | 67 (3.8%) | 97 (5.3%) |
| 18 to 34 Years | 382 (2.9%) | 736 (6.3%) |
| 35 to 64 Years | 415 (7.7%) | 570 (9.8%) |
| 65 to 74 Years | 325 (19.3%) | 389 (22.3%) |
| 75 Years and over | 572 (51.8%) | 795 (50.0%) |
Disability Class by Sex by Age in San Luis Obispo
Disability Class: Hearing Difficulty
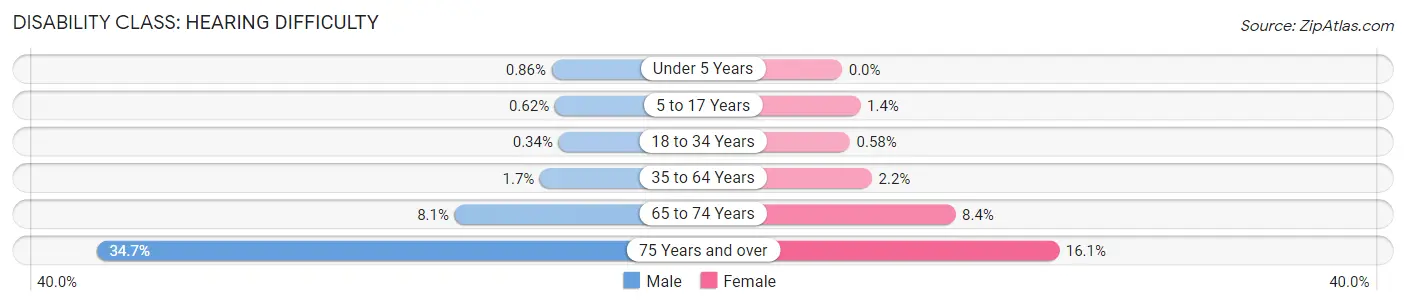
| Age Bracket | Male | Female |
| Under 5 Years | 7 (0.9%) | 0 (0.0%) |
| 5 to 17 Years | 11 (0.6%) | 25 (1.4%) |
| 18 to 34 Years | 45 (0.3%) | 68 (0.6%) |
| 35 to 64 Years | 93 (1.7%) | 128 (2.2%) |
| 65 to 74 Years | 136 (8.1%) | 147 (8.4%) |
| 75 Years and over | 383 (34.7%) | 256 (16.1%) |
Disability Class: Vision Difficulty
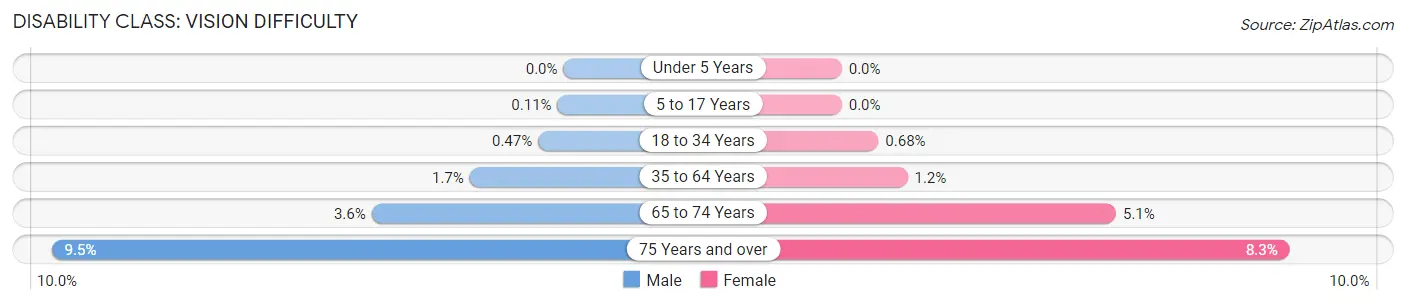
| Age Bracket | Male | Female |
| Under 5 Years | 0 (0.0%) | 0 (0.0%) |
| 5 to 17 Years | 2 (0.1%) | 0 (0.0%) |
| 18 to 34 Years | 62 (0.5%) | 79 (0.7%) |
| 35 to 64 Years | 94 (1.7%) | 71 (1.2%) |
| 65 to 74 Years | 60 (3.6%) | 89 (5.1%) |
| 75 Years and over | 105 (9.5%) | 132 (8.3%) |
Disability Class: Cognitive Difficulty
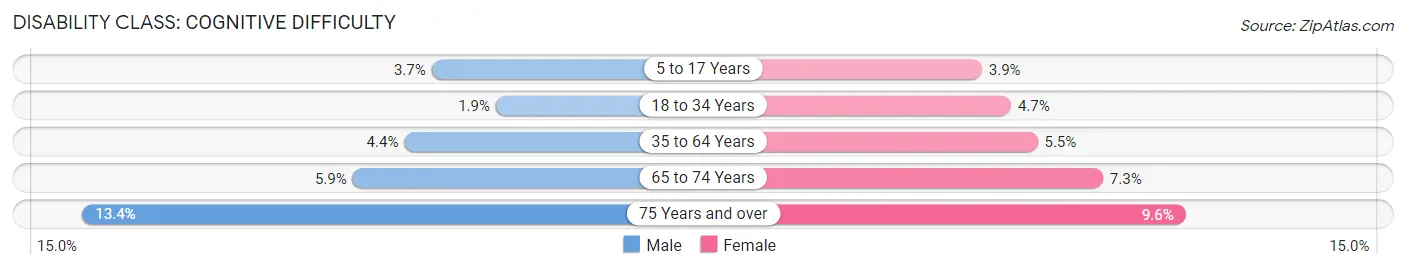
| Age Bracket | Male | Female |
| 5 to 17 Years | 65 (3.7%) | 72 (3.9%) |
| 18 to 34 Years | 249 (1.9%) | 550 (4.7%) |
| 35 to 64 Years | 239 (4.4%) | 316 (5.4%) |
| 65 to 74 Years | 99 (5.9%) | 127 (7.3%) |
| 75 Years and over | 148 (13.4%) | 152 (9.6%) |
Disability Class: Ambulatory Difficulty
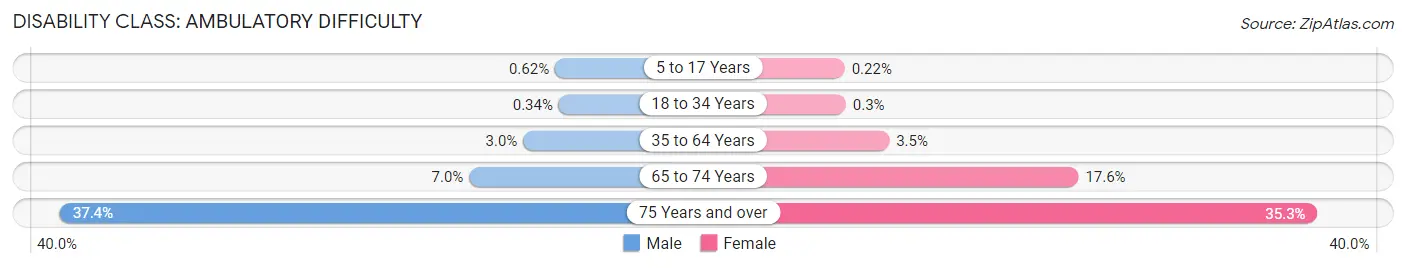
| Age Bracket | Male | Female |
| 5 to 17 Years | 11 (0.6%) | 4 (0.2%) |
| 18 to 34 Years | 45 (0.3%) | 35 (0.3%) |
| 35 to 64 Years | 161 (3.0%) | 204 (3.5%) |
| 65 to 74 Years | 118 (7.0%) | 307 (17.6%) |
| 75 Years and over | 413 (37.4%) | 561 (35.3%) |
Disability Class: Self-Care Difficulty
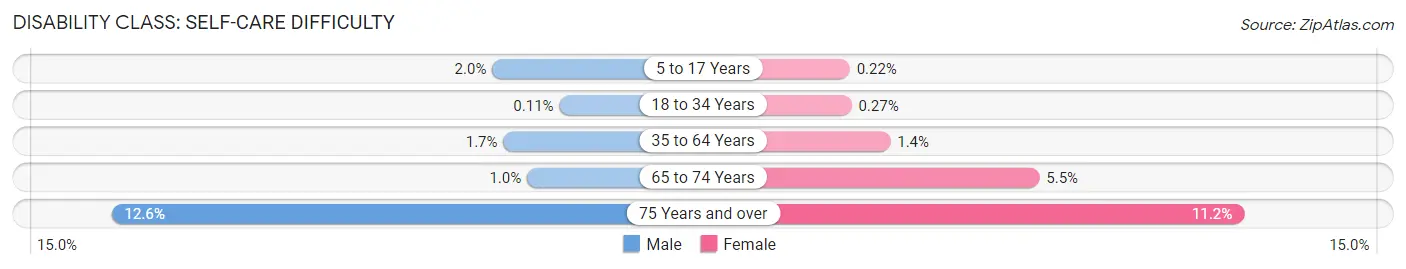
| Age Bracket | Male | Female |
| 5 to 17 Years | 35 (2.0%) | 4 (0.2%) |
| 18 to 34 Years | 15 (0.1%) | 32 (0.3%) |
| 35 to 64 Years | 90 (1.7%) | 78 (1.3%) |
| 65 to 74 Years | 17 (1.0%) | 96 (5.5%) |
| 75 Years and over | 139 (12.6%) | 178 (11.2%) |
Technology Access in San Luis Obispo
Computing Device Access in San Luis Obispo
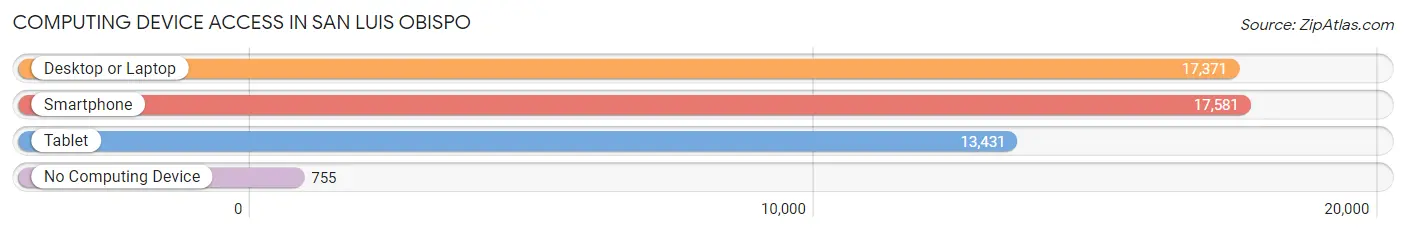
| Device Type | # Households | % Households |
| Desktop or Laptop | 17,371 | 90.2% |
| Smartphone | 17,581 | 91.3% |
| Tablet | 13,431 | 69.8% |
| No Computing Device | 755 | 3.9% |
| Total | 19,254 | 100.0% |
Internet Access in San Luis Obispo
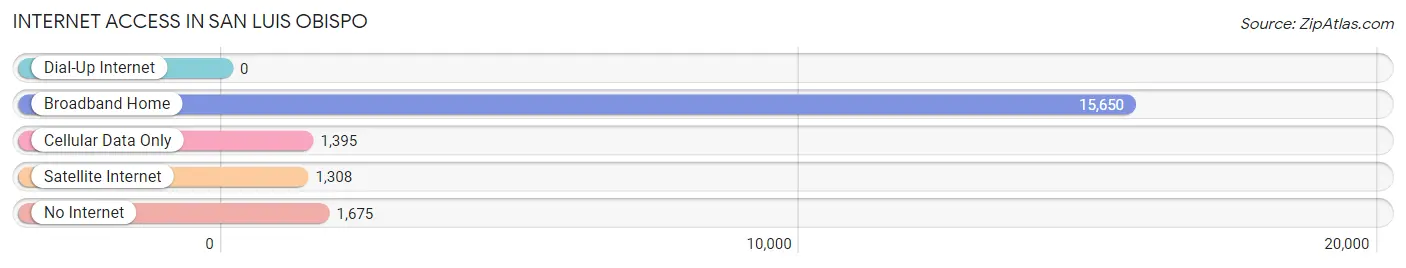
| Internet Type | # Households | % Households |
| Dial-Up Internet | 0 | 0.0% |
| Broadband Home | 15,650 | 81.3% |
| Cellular Data Only | 1,395 | 7.2% |
| Satellite Internet | 1,308 | 6.8% |
| No Internet | 1,675 | 8.7% |
| Total | 19,254 | 100.0% |
San Luis Obispo Summary
San Luis Obispo, California is a city located in the Central Coast region of California, about halfway between Los Angeles and San Francisco. It is the county seat of San Luis Obispo County and is home to a population of approximately 45,000 people. San Luis Obispo is known for its mild climate, beautiful scenery, and vibrant culture.
History
San Luis Obispo was founded in 1772 by Spanish Franciscan missionary Junípero Serra. The city was named after Saint Louis of Toulouse, a 13th-century French saint. The city was originally a mission settlement, and it served as a waypoint for travelers and traders traveling between Los Angeles and San Francisco.
In 1846, San Luis Obispo became part of the United States after the Mexican-American War. The city was incorporated in 1856 and has since grown to become a major center of commerce and culture in the Central Coast region.
Geography
San Luis Obispo is located in the Central Coast region of California, about halfway between Los Angeles and San Francisco. The city is situated on the Pacific Coast, and it is surrounded by rolling hills and mountains. The city is located at an elevation of about 500 feet above sea level.
The climate in San Luis Obispo is mild and temperate, with warm summers and mild winters. The average temperature in the summer is around 70 degrees Fahrenheit, and the average temperature in the winter is around 50 degrees Fahrenheit.
Economy
San Luis Obispo is a major center of commerce and industry in the Central Coast region. The city is home to a variety of businesses, including technology, manufacturing, agriculture, and tourism.
The city is home to several major employers, including California Polytechnic State University, the County of San Luis Obispo, and the City of San Luis Obispo. The city is also home to a variety of small businesses, including restaurants, retail stores, and professional services.
Demographics
As of the 2010 census, the population of San Luis Obispo was 45,119. The population is composed of a diverse mix of ethnicities, including White (63.2%), Hispanic or Latino (25.2%), Asian (4.7%), African American (2.2%), and Native American (0.7%).
The median household income in San Luis Obispo is $63,845, and the median age is 33. The city has a high rate of homeownership, with nearly 70% of residents owning their own homes.
San Luis Obispo is a vibrant and diverse city with a rich history and culture. The city is home to a variety of businesses, and it is a major center of commerce and industry in the Central Coast region. The city is also known for its mild climate, beautiful scenery, and vibrant culture.
Common Questions
What is Per Capita Income in San Luis Obispo?
Per Capita income in San Luis Obispo is $41,749.
What is the Median Family Income in San Luis Obispo?
Median Family Income in San Luis Obispo is $117,692.
What is the Median Household income in San Luis Obispo?
Median Household Income in San Luis Obispo is $65,000.
What is Income or Wage Gap in San Luis Obispo?
Income or Wage Gap in San Luis Obispo is 26.9%.
Women in San Luis Obispo earn 73.1 cents for every dollar earned by a man.
What is Family Income Deficit in San Luis Obispo?
Family Income Deficit in San Luis Obispo is $10,787.
Families that are below poverty line in San Luis Obispo earn $10,787 less on average than the poverty threshold level.
What is Inequality or Gini Index in San Luis Obispo?
Inequality or Gini Index in San Luis Obispo is 0.53.
What is the Total Population of San Luis Obispo?
Total Population of San Luis Obispo is 47,529.
What is the Total Male Population of San Luis Obispo?
Total Male Population of San Luis Obispo is 24,099.
What is the Total Female Population of San Luis Obispo?
Total Female Population of San Luis Obispo is 23,430.
What is the Ratio of Males per 100 Females in San Luis Obispo?
There are 102.86 Males per 100 Females in San Luis Obispo.
What is the Ratio of Females per 100 Males in San Luis Obispo?
There are 97.22 Females per 100 Males in San Luis Obispo.
What is the Median Population Age in San Luis Obispo?
Median Population Age in San Luis Obispo is 25.2 Years.
What is the Average Family Size in San Luis Obispo
Average Family Size in San Luis Obispo is 2.7 People.
What is the Average Household Size in San Luis Obispo
Average Household Size in San Luis Obispo is 2.4 People.
How Large is the Labor Force in San Luis Obispo?
There are 26,926 People in the Labor Forcein in San Luis Obispo.
What is the Percentage of People in the Labor Force in San Luis Obispo?
62.5% of People are in the Labor Force in San Luis Obispo.
What is the Unemployment Rate in San Luis Obispo?
Unemployment Rate in San Luis Obispo is 6.9%.