San Lorenzo, CA Map & Demographics
San Lorenzo Map
San Lorenzo Overview
$39,145
PER CAPITA INCOME
$109,464
AVG FAMILY INCOME
$102,860
AVG HOUSEHOLD INCOME
23.7%
WAGE / INCOME GAP [ % ]
76.3¢/ $1
WAGE / INCOME GAP [ $ ]
0.39
INEQUALITY / GINI INDEX
29,759
TOTAL POPULATION
14,892
MALE POPULATION
14,867
FEMALE POPULATION
100.17
MALES / 100 FEMALES
99.83
FEMALES / 100 MALES
40.1
MEDIAN AGE
3.8
AVG FAMILY SIZE
3.4
AVG HOUSEHOLD SIZE
16,180
LABOR FORCE [ PEOPLE ]
65.5%
PERCENT IN LABOR FORCE
5.5%
UNEMPLOYMENT RATE
San Lorenzo Zip Codes
Income in San Lorenzo
Income Overview in San Lorenzo
Per Capita Income in San Lorenzo is $39,145, while median incomes of families and households are $109,464 and $102,860 respectively.
| Characteristic | Number | Measure |
| Per Capita Income | 29,759 | $39,145 |
| Median Family Income | 6,636 | $109,464 |
| Mean Family Income | 6,636 | $132,163 |
| Median Household Income | 8,766 | $102,860 |
| Mean Household Income | 8,766 | $123,695 |
| Income Deficit | 6,636 | $0 |
| Wage / Income Gap (%) | 29,759 | 23.72% |
| Wage / Income Gap ($) | 29,759 | 76.28¢ per $1 |
| Gini / Inequality Index | 29,759 | 0.39 |
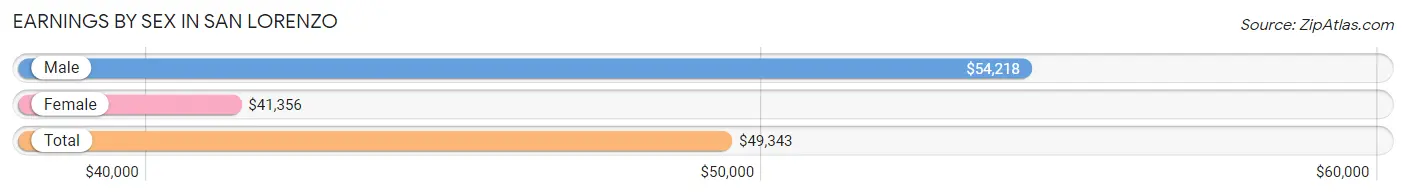
Earnings by Sex in San Lorenzo
Average Earnings in San Lorenzo are $49,343, $54,218 for men and $41,356 for women, a difference of 23.7%.
| Sex | Number | Average Earnings |
| Male | 8,829 (53.7%) | $54,218 |
| Female | 7,617 (46.3%) | $41,356 |
| Total | 16,446 (100.0%) | $49,343 |
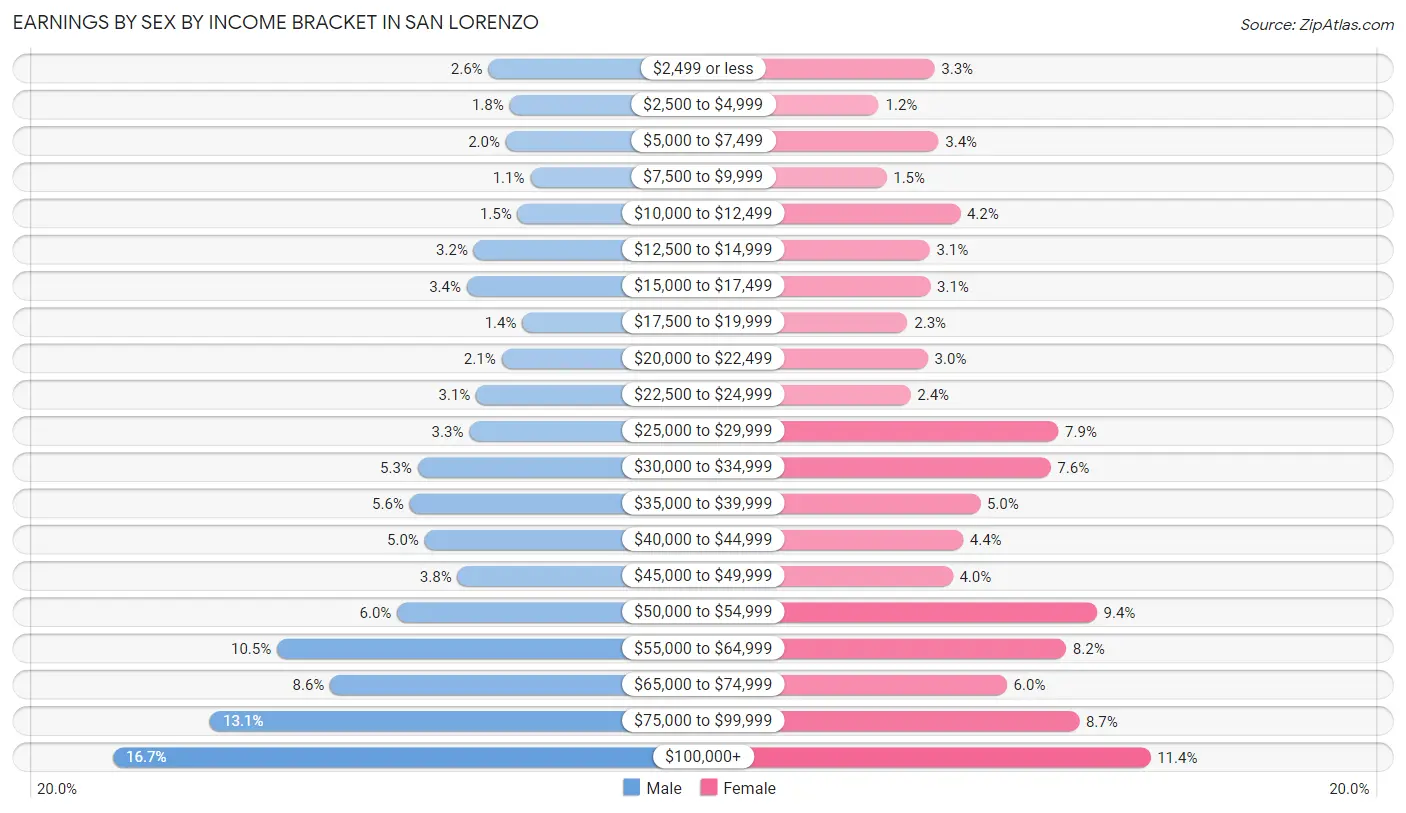
Earnings by Sex by Income Bracket in San Lorenzo
The most common earnings brackets in San Lorenzo are $100,000+ for men (1,473 | 16.7%) and $100,000+ for women (866 | 11.4%).
| Income | Male | Female |
| $2,499 or less | 231 (2.6%) | 250 (3.3%) |
| $2,500 to $4,999 | 162 (1.8%) | 91 (1.2%) |
| $5,000 to $7,499 | 174 (2.0%) | 261 (3.4%) |
| $7,500 to $9,999 | 93 (1.1%) | 113 (1.5%) |
| $10,000 to $12,499 | 135 (1.5%) | 323 (4.2%) |
| $12,500 to $14,999 | 280 (3.2%) | 236 (3.1%) |
| $15,000 to $17,499 | 303 (3.4%) | 238 (3.1%) |
| $17,500 to $19,999 | 119 (1.3%) | 173 (2.3%) |
| $20,000 to $22,499 | 188 (2.1%) | 231 (3.0%) |
| $22,500 to $24,999 | 272 (3.1%) | 181 (2.4%) |
| $25,000 to $29,999 | 295 (3.3%) | 603 (7.9%) |
| $30,000 to $34,999 | 465 (5.3%) | 581 (7.6%) |
| $35,000 to $39,999 | 492 (5.6%) | 380 (5.0%) |
| $40,000 to $44,999 | 442 (5.0%) | 331 (4.3%) |
| $45,000 to $49,999 | 334 (3.8%) | 302 (4.0%) |
| $50,000 to $54,999 | 533 (6.0%) | 713 (9.4%) |
| $55,000 to $64,999 | 931 (10.5%) | 625 (8.2%) |
| $65,000 to $74,999 | 755 (8.6%) | 456 (6.0%) |
| $75,000 to $99,999 | 1,152 (13.1%) | 663 (8.7%) |
| $100,000+ | 1,473 (16.7%) | 866 (11.4%) |
| Total | 8,829 (100.0%) | 7,617 (100.0%) |
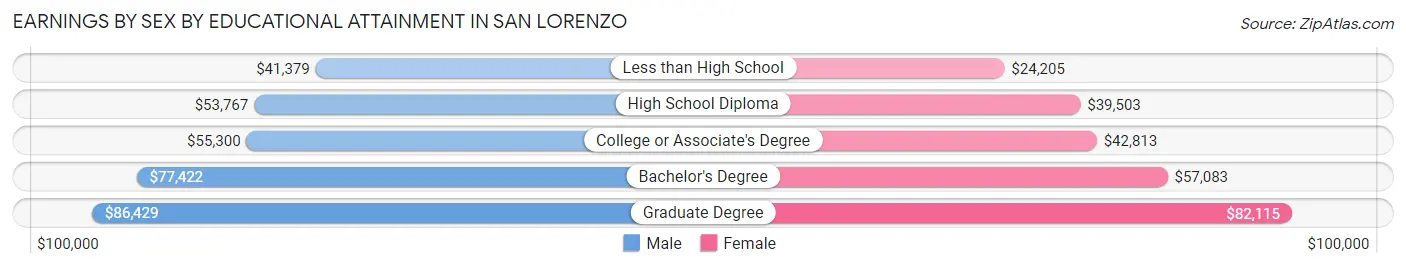
Earnings by Sex by Educational Attainment in San Lorenzo
Average earnings in San Lorenzo are $56,804 for men and $48,955 for women, a difference of 13.8%. Men with an educational attainment of graduate degree enjoy the highest average annual earnings of $86,429, while those with less than high school education earn the least with $41,379. Women with an educational attainment of graduate degree earn the most with the average annual earnings of $82,115, while those with less than high school education have the smallest earnings of $24,205.
| Educational Attainment | Male Income | Female Income |
| Less than High School | $41,379 | $24,205 |
| High School Diploma | $53,767 | $39,503 |
| College or Associate's Degree | $55,300 | $42,813 |
| Bachelor's Degree | $77,422 | $57,083 |
| Graduate Degree | $86,429 | $82,115 |
| Total | $56,804 | $48,955 |
Family Income in San Lorenzo
Family Income Brackets in San Lorenzo
According to the San Lorenzo family income data, there are 1,473 families falling into the $100,000 to $149,999 income range, which is the most common income bracket and makes up 22.2% of all families. Conversely, the $10,000 to $14,999 income bracket is the least frequent group with only 40 families (0.6%) belonging to this category.
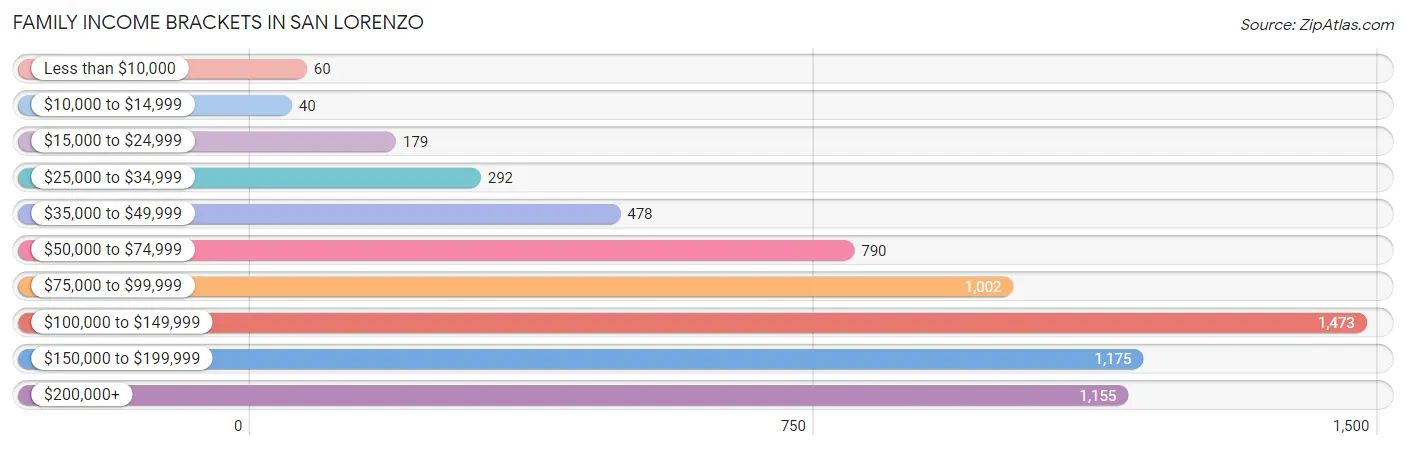
| Income Bracket | # Families | % Families |
| Less than $10,000 | 60 | 0.9% |
| $10,000 to $14,999 | 40 | 0.6% |
| $15,000 to $24,999 | 179 | 2.7% |
| $25,000 to $34,999 | 292 | 4.4% |
| $35,000 to $49,999 | 478 | 7.2% |
| $50,000 to $74,999 | 790 | 11.9% |
| $75,000 to $99,999 | 1,002 | 15.1% |
| $100,000 to $149,999 | 1,473 | 22.2% |
| $150,000 to $199,999 | 1,175 | 17.7% |
| $200,000+ | 1,155 | 17.4% |
Family Income by Famaliy Size in San Lorenzo
7+ person families (252 | 3.8%) account for the highest median family income in San Lorenzo with $246,630 per family, while 3-person families (1,428 | 21.5%) have the highest median income of $44,583 per family member.
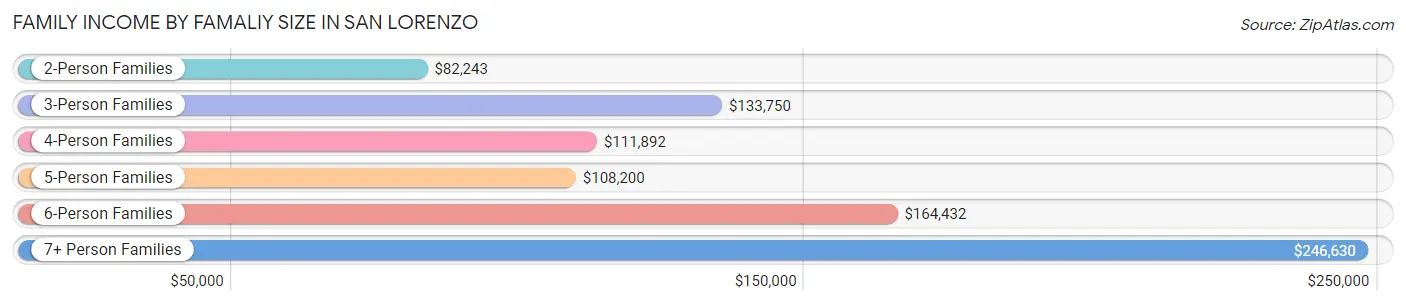
| Income Bracket | # Families | Median Income |
| 2-Person Families | 2,085 (31.4%) | $82,243 |
| 3-Person Families | 1,428 (21.5%) | $133,750 |
| 4-Person Families | 1,734 (26.1%) | $111,892 |
| 5-Person Families | 810 (12.2%) | $108,200 |
| 6-Person Families | 327 (4.9%) | $164,432 |
| 7+ Person Families | 252 (3.8%) | $246,630 |
| Total | 6,636 (100.0%) | $109,464 |
Family Income by Number of Earners in San Lorenzo
The median family income in San Lorenzo is $109,464, with families comprising 3+ earners (1,600) having the highest median family income of $169,902, while families with no earners (631) have the lowest median family income of $63,229, accounting for 24.1% and 9.5% of families, respectively.
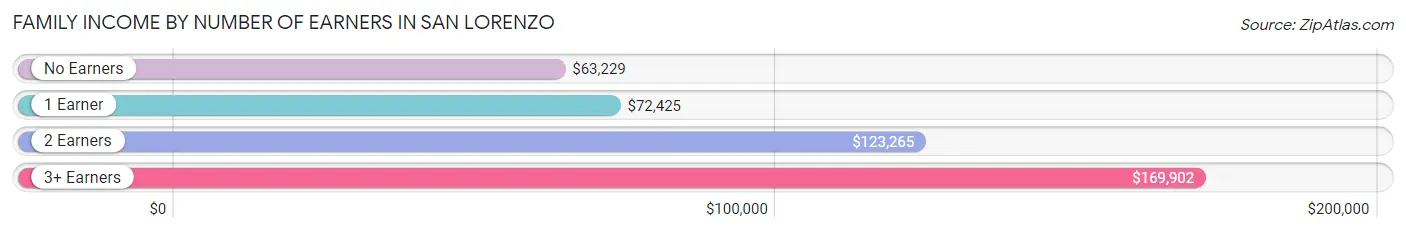
| Number of Earners | # Families | Median Income |
| No Earners | 631 (9.5%) | $63,229 |
| 1 Earner | 1,855 (28.0%) | $72,425 |
| 2 Earners | 2,550 (38.4%) | $123,265 |
| 3+ Earners | 1,600 (24.1%) | $169,902 |
| Total | 6,636 (100.0%) | $109,464 |
Household Income in San Lorenzo
Household Income Brackets in San Lorenzo
With 1,885 households falling in the category, the $100,000 to $149,999 income range is the most frequent in San Lorenzo, accounting for 21.5% of all households. In contrast, only 175 households (2.0%) fall into the less than $10,000 income bracket, making it the least populous group.
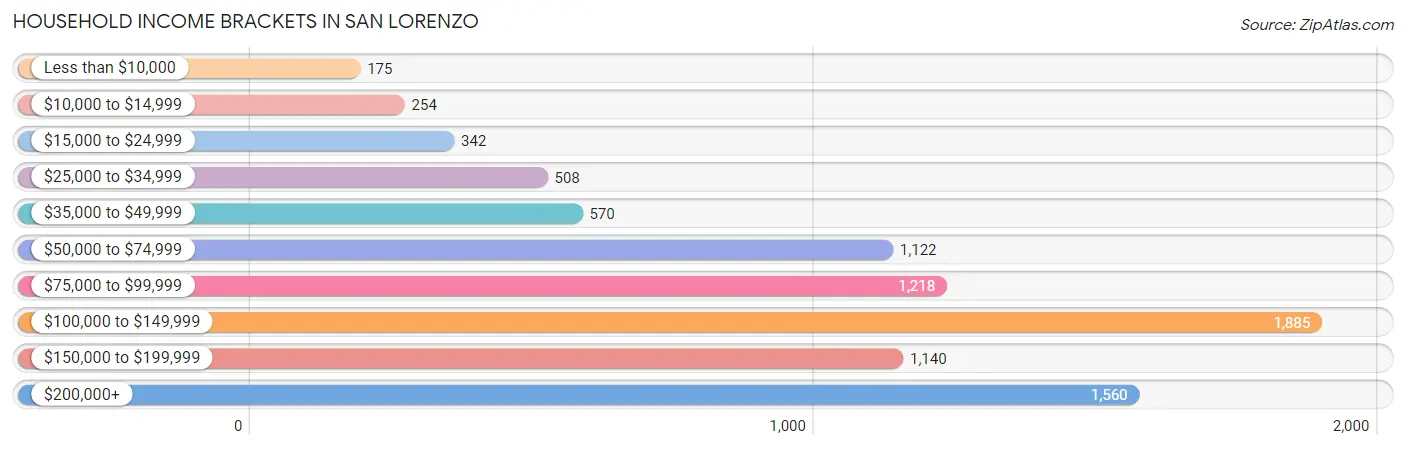
| Income Bracket | # Households | % Households |
| Less than $10,000 | 175 | 2.0% |
| $10,000 to $14,999 | 254 | 2.9% |
| $15,000 to $24,999 | 342 | 3.9% |
| $25,000 to $34,999 | 508 | 5.8% |
| $35,000 to $49,999 | 570 | 6.5% |
| $50,000 to $74,999 | 1,122 | 12.8% |
| $75,000 to $99,999 | 1,218 | 13.9% |
| $100,000 to $149,999 | 1,885 | 21.5% |
| $150,000 to $199,999 | 1,140 | 13.0% |
| $200,000+ | 1,560 | 17.8% |
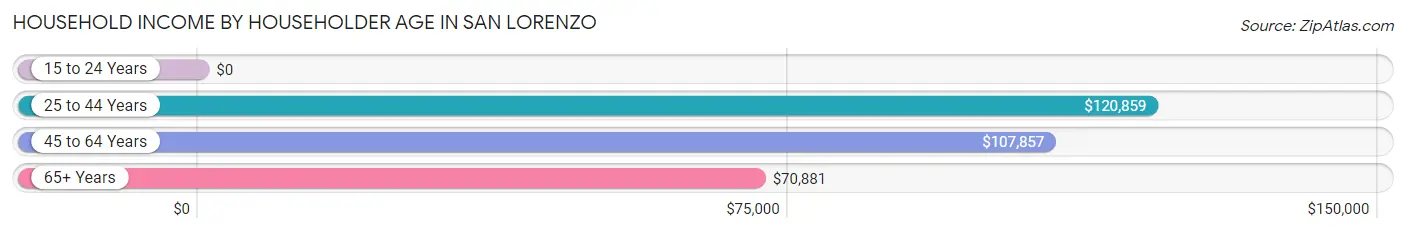
Household Income by Householder Age in San Lorenzo
The median household income in San Lorenzo is $102,860, with the highest median household income of $120,859 found in the 25 to 44 years age bracket for the primary householder. A total of 2,336 households (26.7%) fall into this category. Meanwhile, the 15 to 24 years age bracket for the primary householder has the lowest median household income of $0, with 21 households (0.2%) in this group.
| Income Bracket | # Households | Median Income |
| 15 to 24 Years | 21 (0.2%) | $0 |
| 25 to 44 Years | 2,336 (26.7%) | $120,859 |
| 45 to 64 Years | 3,948 (45.0%) | $107,857 |
| 65+ Years | 2,461 (28.1%) | $70,881 |
| Total | 8,766 (100.0%) | $102,860 |
Poverty in San Lorenzo
Income Below Poverty by Sex and Age in San Lorenzo
With 5.4% poverty level for males and 6.2% for females among the residents of San Lorenzo, 15 year old males and 75 year old and over females are the most vulnerable to poverty, with 33 males (20.1%) and 161 females (14.4%) in their respective age groups living below the poverty level.
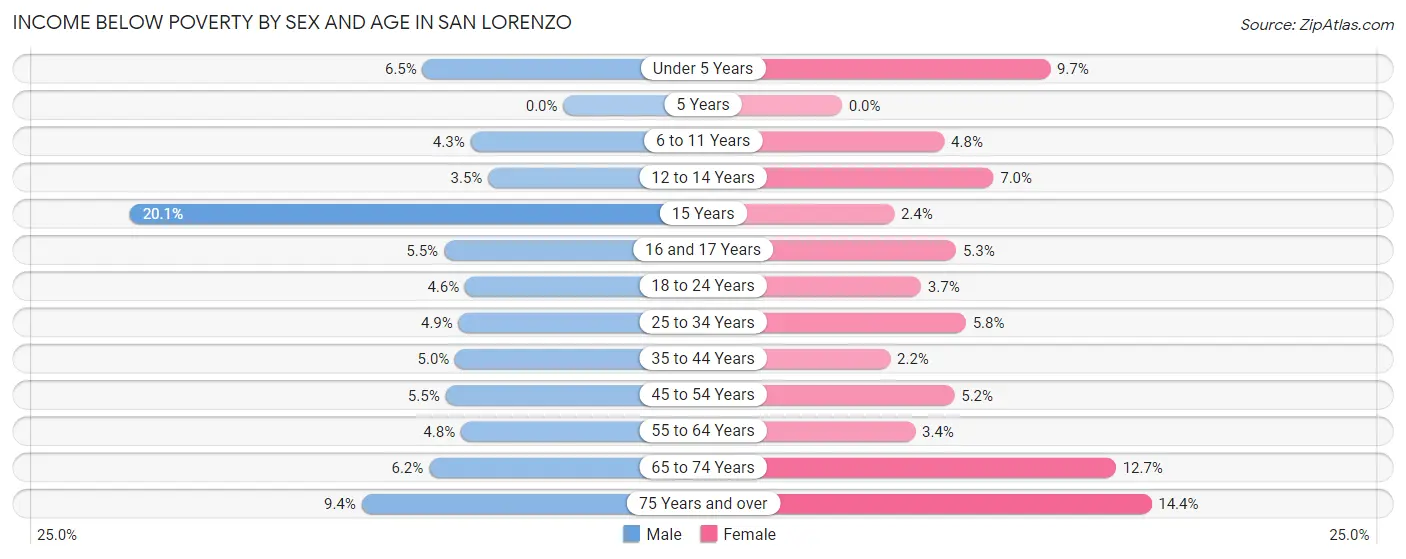
| Age Bracket | Male | Female |
| Under 5 Years | 61 (6.5%) | 69 (9.7%) |
| 5 Years | 0 (0.0%) | 0 (0.0%) |
| 6 to 11 Years | 44 (4.3%) | 35 (4.8%) |
| 12 to 14 Years | 13 (3.5%) | 36 (7.0%) |
| 15 Years | 33 (20.1%) | 5 (2.4%) |
| 16 and 17 Years | 19 (5.5%) | 15 (5.3%) |
| 18 to 24 Years | 46 (4.6%) | 43 (3.7%) |
| 25 to 34 Years | 126 (4.9%) | 124 (5.8%) |
| 35 to 44 Years | 93 (5.0%) | 42 (2.2%) |
| 45 to 54 Years | 111 (5.5%) | 108 (5.2%) |
| 55 to 64 Years | 110 (4.8%) | 75 (3.4%) |
| 65 to 74 Years | 86 (6.2%) | 197 (12.7%) |
| 75 Years and over | 56 (9.4%) | 161 (14.4%) |
| Total | 798 (5.4%) | 910 (6.2%) |
Income Above Poverty by Sex and Age in San Lorenzo
According to the poverty statistics in San Lorenzo, males aged 5 years and females aged 5 years are the age groups that are most secure financially, with 100.0% of males and 100.0% of females in these age groups living above the poverty line.
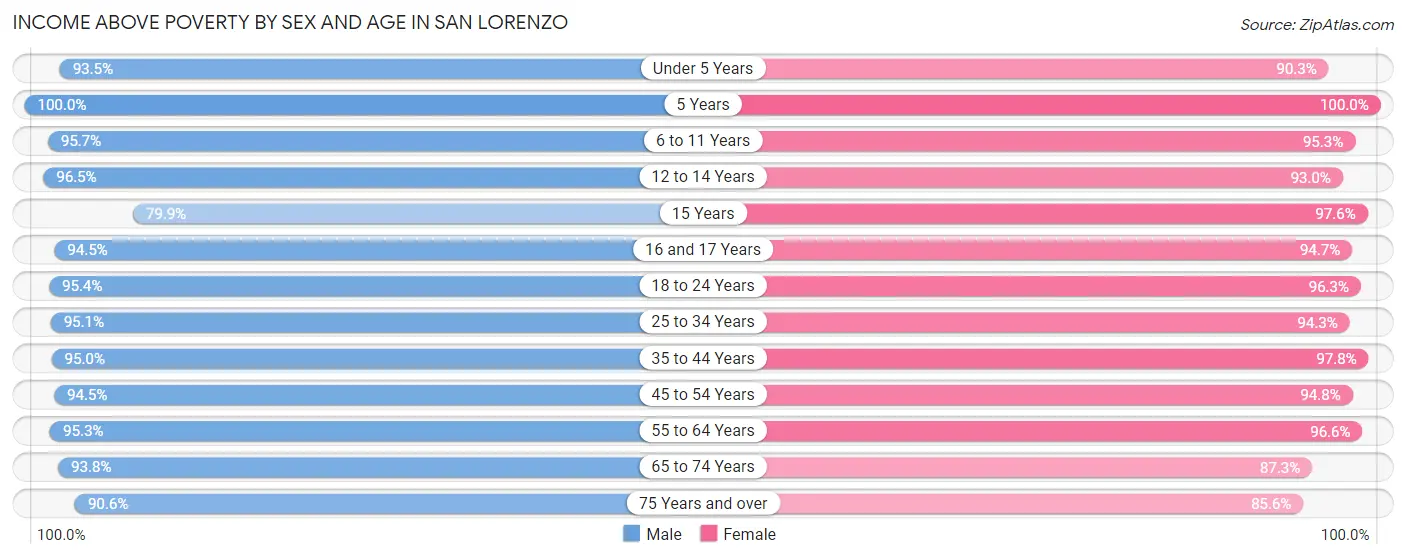
| Age Bracket | Male | Female |
| Under 5 Years | 873 (93.5%) | 645 (90.3%) |
| 5 Years | 135 (100.0%) | 181 (100.0%) |
| 6 to 11 Years | 976 (95.7%) | 702 (95.3%) |
| 12 to 14 Years | 359 (96.5%) | 476 (93.0%) |
| 15 Years | 131 (79.9%) | 202 (97.6%) |
| 16 and 17 Years | 324 (94.5%) | 268 (94.7%) |
| 18 to 24 Years | 962 (95.4%) | 1,129 (96.3%) |
| 25 to 34 Years | 2,468 (95.1%) | 2,033 (94.3%) |
| 35 to 44 Years | 1,759 (95.0%) | 1,830 (97.8%) |
| 45 to 54 Years | 1,920 (94.5%) | 1,961 (94.8%) |
| 55 to 64 Years | 2,208 (95.3%) | 2,134 (96.6%) |
| 65 to 74 Years | 1,294 (93.8%) | 1,353 (87.3%) |
| 75 Years and over | 542 (90.6%) | 960 (85.6%) |
| Total | 13,951 (94.6%) | 13,874 (93.8%) |
Income Below Poverty Among Married-Couple Families in San Lorenzo
The poverty statistics for married-couple families in San Lorenzo show that 3.1% or 155 of the total 5,002 families live below the poverty line. Families with 3 or 4 children have the highest poverty rate of 7.8%, comprising of 26 families. On the other hand, families with 5 or more children have the lowest poverty rate of 0.0%, which includes 0 families.
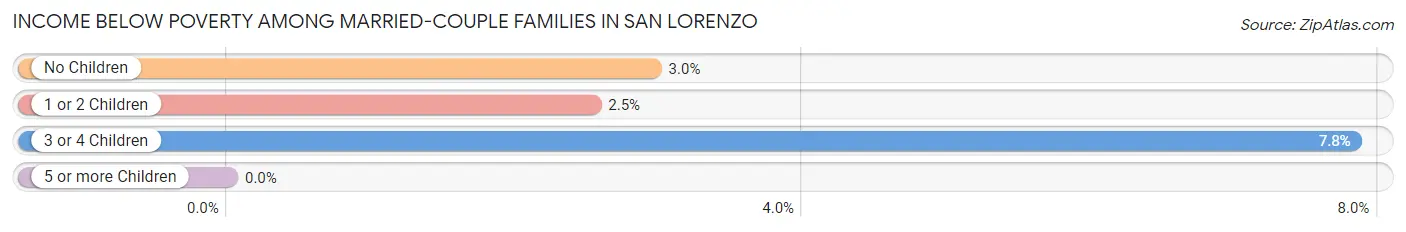
| Children | Above Poverty | Below Poverty |
| No Children | 2,569 (97.1%) | 78 (2.9%) |
| 1 or 2 Children | 1,966 (97.5%) | 51 (2.5%) |
| 3 or 4 Children | 306 (92.2%) | 26 (7.8%) |
| 5 or more Children | 6 (100.0%) | 0 (0.0%) |
| Total | 4,847 (96.9%) | 155 (3.1%) |
Income Below Poverty Among Single-Parent Households in San Lorenzo
According to the poverty data in San Lorenzo, 3.6% or 19 single-father households and 8.0% or 88 single-mother households are living below the poverty line. Among single-father households, those with 1 or 2 children have the highest poverty rate, with 7 households (3.9%) experiencing poverty. Likewise, among single-mother households, those with 5 or more children have the highest poverty rate, with 18 households (100.0%) falling below the poverty line.
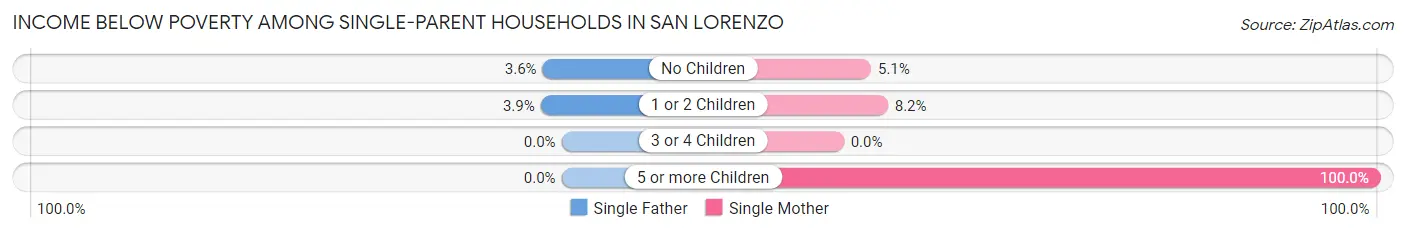
| Children | Single Father | Single Mother |
| No Children | 12 (3.5%) | 28 (5.1%) |
| 1 or 2 Children | 7 (3.9%) | 42 (8.2%) |
| 3 or 4 Children | 0 (0.0%) | 0 (0.0%) |
| 5 or more Children | 0 (0.0%) | 18 (100.0%) |
| Total | 19 (3.6%) | 88 (8.0%) |
Income Below Poverty Among Married-Couple vs Single-Parent Households in San Lorenzo
The poverty data for San Lorenzo shows that 155 of the married-couple family households (3.1%) and 107 of the single-parent households (6.6%) are living below the poverty level. Within the married-couple family households, those with 3 or 4 children have the highest poverty rate, with 26 households (7.8%) falling below the poverty line. Among the single-parent households, those with 5 or more children have the highest poverty rate, with 18 household (66.7%) living below poverty.
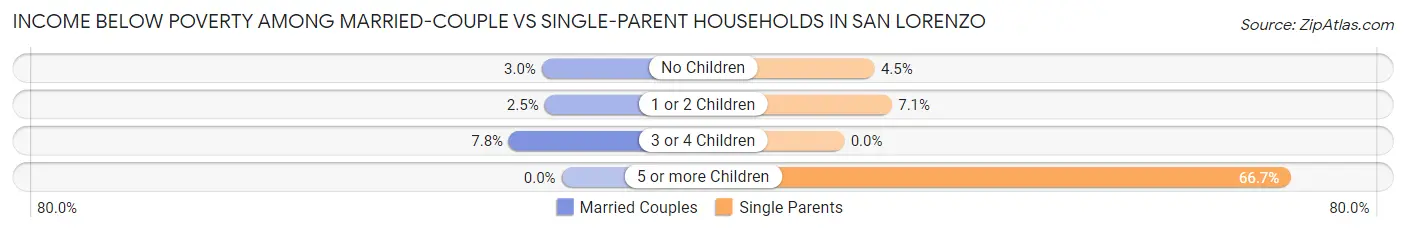
| Children | Married-Couple Families | Single-Parent Households |
| No Children | 78 (2.9%) | 40 (4.5%) |
| 1 or 2 Children | 51 (2.5%) | 49 (7.1%) |
| 3 or 4 Children | 26 (7.8%) | 0 (0.0%) |
| 5 or more Children | 0 (0.0%) | 18 (66.7%) |
| Total | 155 (3.1%) | 107 (6.6%) |
Race in San Lorenzo
The most populous races in San Lorenzo are Hispanic or Latino (11,863 | 39.9%), White / Caucasian (10,167 | 34.2%), and Asian (8,980 | 30.2%).
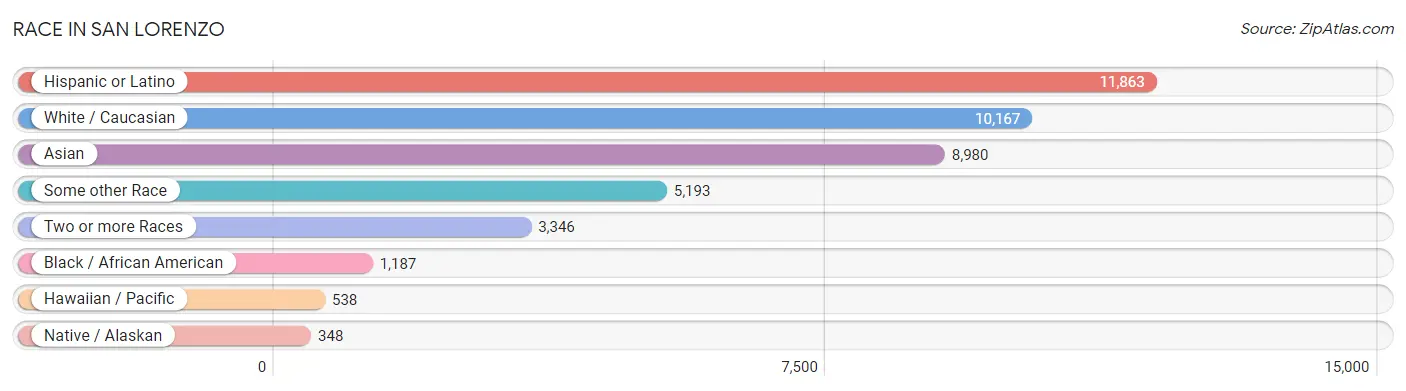
| Race | # Population | % Population |
| Asian | 8,980 | 30.2% |
| Black / African American | 1,187 | 4.0% |
| Hawaiian / Pacific | 538 | 1.8% |
| Hispanic or Latino | 11,863 | 39.9% |
| Native / Alaskan | 348 | 1.2% |
| White / Caucasian | 10,167 | 34.2% |
| Two or more Races | 3,346 | 11.2% |
| Some other Race | 5,193 | 17.4% |
| Total | 29,759 | 100.0% |
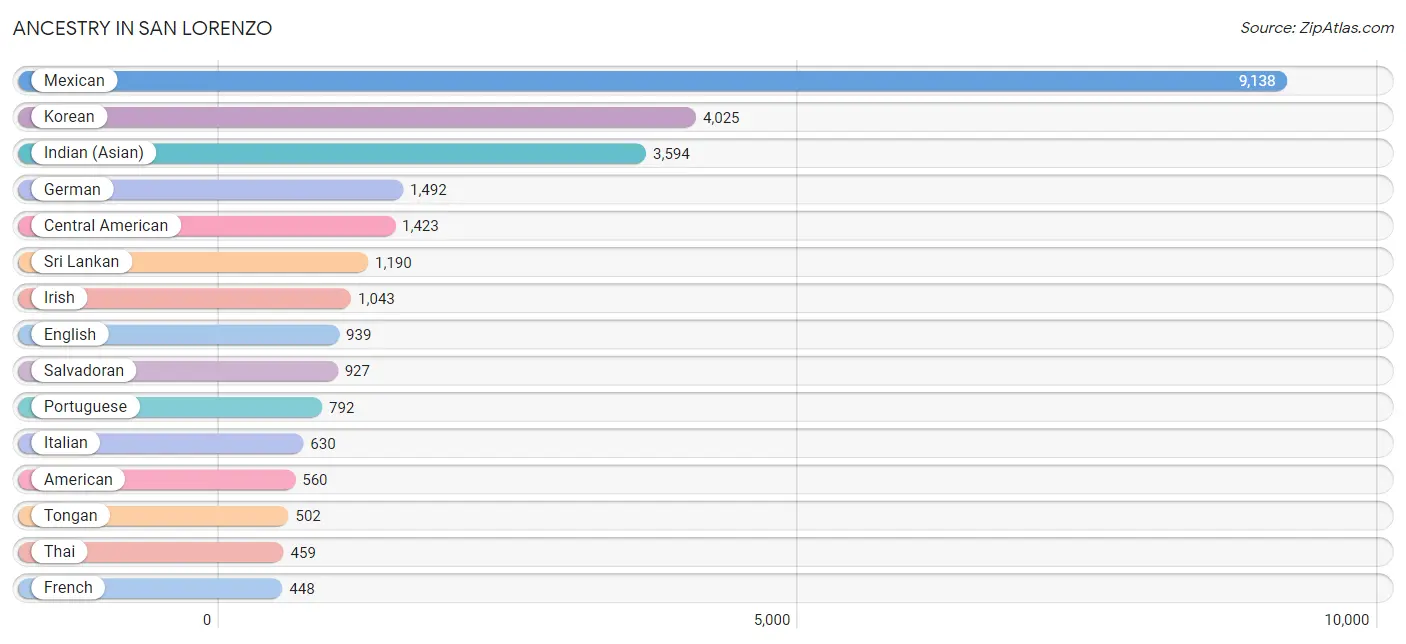
Ancestry in San Lorenzo
The most populous ancestries reported in San Lorenzo are Mexican (9,138 | 30.7%), Korean (4,025 | 13.5%), Indian (Asian) (3,594 | 12.1%), German (1,492 | 5.0%), and Central American (1,423 | 4.8%), together accounting for 66.1% of all San Lorenzo residents.
| Ancestry | # Population | % Population |
| African | 16 | 0.1% |
| American | 560 | 1.9% |
| Arab | 19 | 0.1% |
| Argentinean | 31 | 0.1% |
| Armenian | 20 | 0.1% |
| Assyrian / Chaldean / Syriac | 2 | 0.0% |
| Bangladeshi | 27 | 0.1% |
| Bhutanese | 315 | 1.1% |
| Blackfeet | 10 | 0.0% |
| British | 86 | 0.3% |
| Bulgarian | 15 | 0.1% |
| Burmese | 86 | 0.3% |
| Canadian | 27 | 0.1% |
| Cape Verdean | 19 | 0.1% |
| Celtic | 33 | 0.1% |
| Central American | 1,423 | 4.8% |
| Central American Indian | 45 | 0.2% |
| Cherokee | 45 | 0.2% |
| Colombian | 15 | 0.1% |
| Costa Rican | 11 | 0.0% |
| Croatian | 37 | 0.1% |
| Cuban | 27 | 0.1% |
| Czech | 35 | 0.1% |
| Czechoslovakian | 7 | 0.0% |
| Danish | 18 | 0.1% |
| Dominican | 163 | 0.5% |
| Dutch | 47 | 0.2% |
| Eastern European | 12 | 0.0% |
| Ecuadorian | 2 | 0.0% |
| English | 939 | 3.2% |
| Ethiopian | 12 | 0.0% |
| European | 405 | 1.4% |
| Finnish | 24 | 0.1% |
| French | 448 | 1.5% |
| French Canadian | 23 | 0.1% |
| German | 1,492 | 5.0% |
| Greek | 92 | 0.3% |
| Guatemalan | 167 | 0.6% |
| Haitian | 1 | 0.0% |
| Honduran | 52 | 0.2% |
| Hopi | 9 | 0.0% |
| Hungarian | 20 | 0.1% |
| Icelander | 21 | 0.1% |
| Indian (Asian) | 3,594 | 12.1% |
| Iranian | 16 | 0.1% |
| Irish | 1,043 | 3.5% |
| Italian | 630 | 2.1% |
| Japanese | 66 | 0.2% |
| Kenyan | 28 | 0.1% |
| Korean | 4,025 | 13.5% |
| Lebanese | 8 | 0.0% |
| Lithuanian | 7 | 0.0% |
| Malaysian | 52 | 0.2% |
| Mexican | 9,138 | 30.7% |
| Mexican American Indian | 147 | 0.5% |
| Native Hawaiian | 190 | 0.6% |
| Navajo | 9 | 0.0% |
| Nepalese | 48 | 0.2% |
| Nicaraguan | 266 | 0.9% |
| Nigerian | 5 | 0.0% |
| Northern European | 44 | 0.2% |
| Norwegian | 273 | 0.9% |
| Pakistani | 51 | 0.2% |
| Pennsylvania German | 10 | 0.0% |
| Peruvian | 274 | 0.9% |
| Polish | 97 | 0.3% |
| Portuguese | 792 | 2.7% |
| Puerto Rican | 375 | 1.3% |
| Russian | 97 | 0.3% |
| Salvadoran | 927 | 3.1% |
| Samoan | 110 | 0.4% |
| Scandinavian | 21 | 0.1% |
| Scotch-Irish | 54 | 0.2% |
| Scottish | 192 | 0.6% |
| Serbian | 18 | 0.1% |
| South American | 322 | 1.1% |
| Spaniard | 26 | 0.1% |
| Spanish | 111 | 0.4% |
| Sri Lankan | 1,190 | 4.0% |
| Subsaharan African | 96 | 0.3% |
| Swedish | 191 | 0.6% |
| Swiss | 11 | 0.0% |
| Syrian | 11 | 0.0% |
| Thai | 459 | 1.5% |
| Tongan | 502 | 1.7% |
| Ukrainian | 29 | 0.1% |
| Welsh | 116 | 0.4% |
| Yaqui | 7 | 0.0% |
| Yugoslavian | 23 | 0.1% |
| Yuman | 4 | 0.0% | View All 90 Rows |
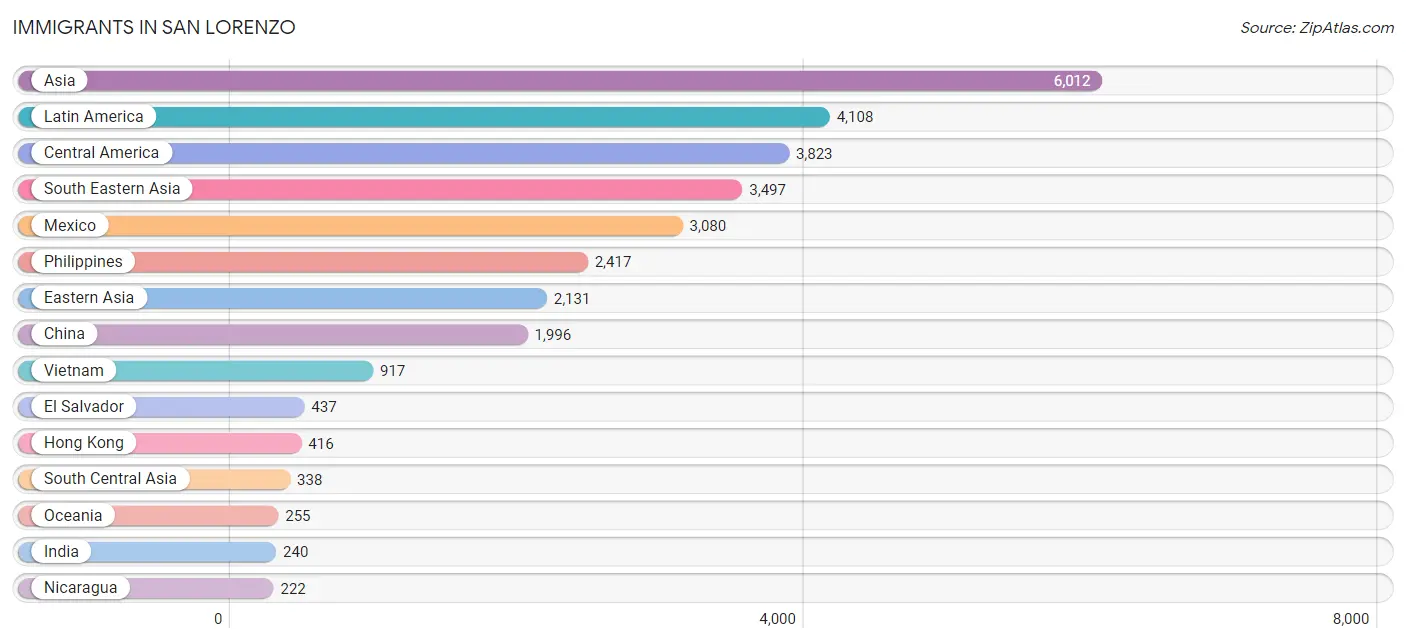
Immigrants in San Lorenzo
The most numerous immigrant groups reported in San Lorenzo came from Asia (6,012 | 20.2%), Latin America (4,108 | 13.8%), Central America (3,823 | 12.9%), South Eastern Asia (3,497 | 11.7%), and Mexico (3,080 | 10.3%), together accounting for 69.0% of all San Lorenzo residents.
| Immigration Origin | # Population | % Population |
| Afghanistan | 40 | 0.1% |
| Africa | 38 | 0.1% |
| Argentina | 15 | 0.1% |
| Armenia | 10 | 0.0% |
| Asia | 6,012 | 20.2% |
| Australia | 5 | 0.0% |
| Azores | 9 | 0.0% |
| Brazil | 89 | 0.3% |
| Bulgaria | 18 | 0.1% |
| Cambodia | 31 | 0.1% |
| Canada | 27 | 0.1% |
| Caribbean | 76 | 0.3% |
| Central America | 3,823 | 12.9% |
| China | 1,996 | 6.7% |
| Colombia | 17 | 0.1% |
| Costa Rica | 11 | 0.0% |
| Croatia | 15 | 0.1% |
| Cuba | 19 | 0.1% |
| Dominican Republic | 57 | 0.2% |
| Eastern Africa | 27 | 0.1% |
| Eastern Asia | 2,131 | 7.2% |
| Eastern Europe | 87 | 0.3% |
| El Salvador | 437 | 1.5% |
| England | 12 | 0.0% |
| Ethiopia | 6 | 0.0% |
| Europe | 202 | 0.7% |
| Fiji | 124 | 0.4% |
| Germany | 52 | 0.2% |
| Guatemala | 41 | 0.1% |
| Honduras | 32 | 0.1% |
| Hong Kong | 416 | 1.4% |
| India | 240 | 0.8% |
| Israel | 8 | 0.0% |
| Italy | 17 | 0.1% |
| Japan | 89 | 0.3% |
| Kazakhstan | 9 | 0.0% |
| Kenya | 21 | 0.1% |
| Korea | 46 | 0.2% |
| Laos | 50 | 0.2% |
| Latin America | 4,108 | 13.8% |
| Lebanon | 8 | 0.0% |
| Malaysia | 20 | 0.1% |
| Mexico | 3,080 | 10.3% |
| Netherlands | 6 | 0.0% |
| Nicaragua | 222 | 0.7% |
| Nigeria | 11 | 0.0% |
| Northern Europe | 12 | 0.0% |
| Oceania | 255 | 0.9% |
| Pakistan | 41 | 0.1% |
| Peru | 88 | 0.3% |
| Philippines | 2,417 | 8.1% |
| Portugal | 28 | 0.1% |
| Russia | 23 | 0.1% |
| Saudi Arabia | 10 | 0.0% |
| South America | 209 | 0.7% |
| South Central Asia | 338 | 1.1% |
| South Eastern Asia | 3,497 | 11.7% |
| Southern Europe | 45 | 0.2% |
| Taiwan | 72 | 0.2% |
| Thailand | 62 | 0.2% |
| Turkey | 10 | 0.0% |
| Ukraine | 31 | 0.1% |
| Uzbekistan | 8 | 0.0% |
| Vietnam | 917 | 3.1% |
| Western Africa | 11 | 0.0% |
| Western Asia | 46 | 0.2% |
| Western Europe | 58 | 0.2% | View All 67 Rows |
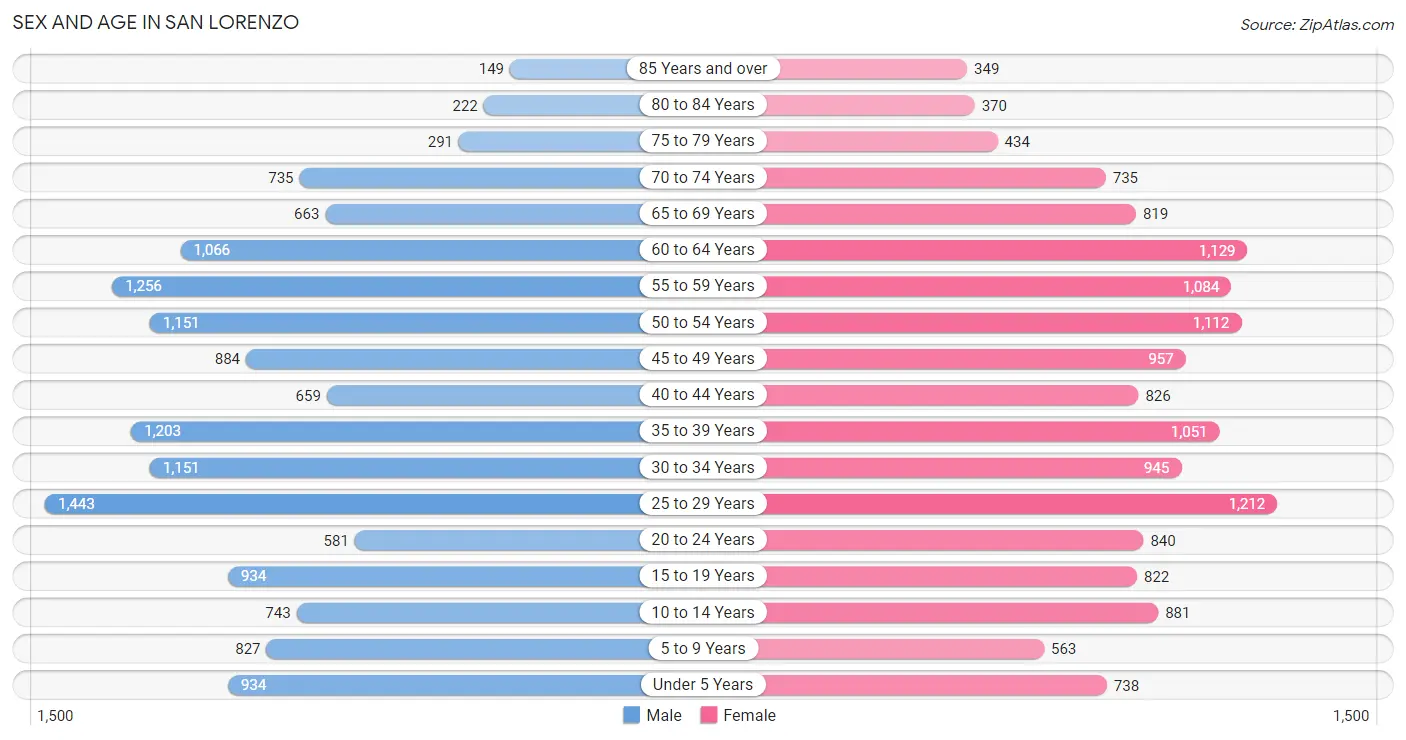
Sex and Age in San Lorenzo
Sex and Age in San Lorenzo
The most populous age groups in San Lorenzo are 25 to 29 Years (1,443 | 9.7%) for men and 25 to 29 Years (1,212 | 8.2%) for women.
| Age Bracket | Male | Female |
| Under 5 Years | 934 (6.3%) | 738 (5.0%) |
| 5 to 9 Years | 827 (5.6%) | 563 (3.8%) |
| 10 to 14 Years | 743 (5.0%) | 881 (5.9%) |
| 15 to 19 Years | 934 (6.3%) | 822 (5.5%) |
| 20 to 24 Years | 581 (3.9%) | 840 (5.7%) |
| 25 to 29 Years | 1,443 (9.7%) | 1,212 (8.2%) |
| 30 to 34 Years | 1,151 (7.7%) | 945 (6.4%) |
| 35 to 39 Years | 1,203 (8.1%) | 1,051 (7.1%) |
| 40 to 44 Years | 659 (4.4%) | 826 (5.6%) |
| 45 to 49 Years | 884 (5.9%) | 957 (6.4%) |
| 50 to 54 Years | 1,151 (7.7%) | 1,112 (7.5%) |
| 55 to 59 Years | 1,256 (8.4%) | 1,084 (7.3%) |
| 60 to 64 Years | 1,066 (7.2%) | 1,129 (7.6%) |
| 65 to 69 Years | 663 (4.4%) | 819 (5.5%) |
| 70 to 74 Years | 735 (4.9%) | 735 (4.9%) |
| 75 to 79 Years | 291 (1.9%) | 434 (2.9%) |
| 80 to 84 Years | 222 (1.5%) | 370 (2.5%) |
| 85 Years and over | 149 (1.0%) | 349 (2.4%) |
| Total | 14,892 (100.0%) | 14,867 (100.0%) |
Families and Households in San Lorenzo
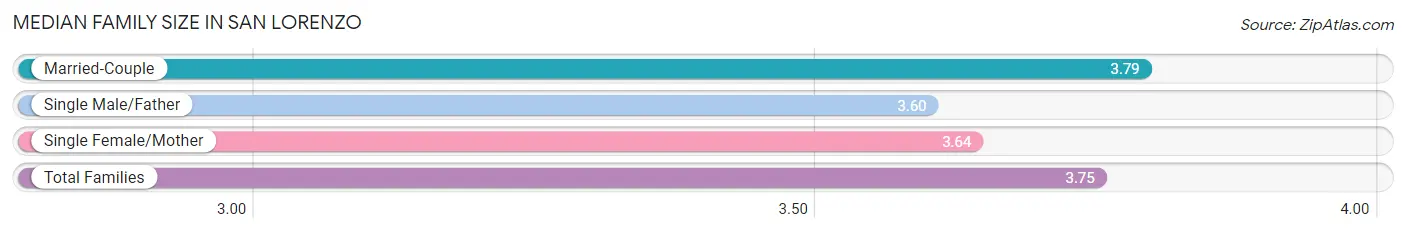
Median Family Size in San Lorenzo
The median family size in San Lorenzo is 3.75 persons per family, with married-couple families (5,002 | 75.4%) accounting for the largest median family size of 3.79 persons per family. On the other hand, single male/father families (527 | 7.9%) represent the smallest median family size with 3.60 persons per family.
| Family Type | # Families | Family Size |
| Married-Couple | 5,002 (75.4%) | 3.79 |
| Single Male/Father | 527 (7.9%) | 3.60 |
| Single Female/Mother | 1,107 (16.7%) | 3.64 |
| Total Families | 6,636 (100.0%) | 3.75 |
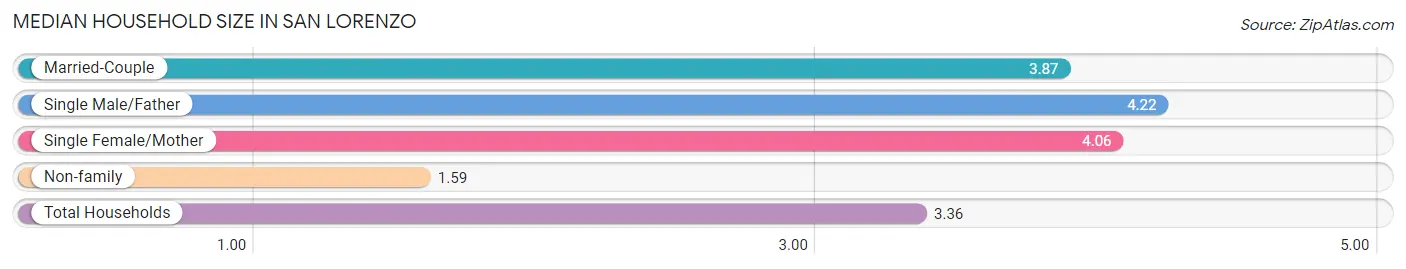
Median Household Size in San Lorenzo
The median household size in San Lorenzo is 3.36 persons per household, with single male/father households (527 | 6.0%) accounting for the largest median household size of 4.22 persons per household. non-family households (2,130 | 24.3%) represent the smallest median household size with 1.59 persons per household.
| Household Type | # Households | Household Size |
| Married-Couple | 5,002 (57.1%) | 3.87 |
| Single Male/Father | 527 (6.0%) | 4.22 |
| Single Female/Mother | 1,107 (12.6%) | 4.06 |
| Non-family | 2,130 (24.3%) | 1.59 |
| Total Households | 8,766 (100.0%) | 3.36 |
Household Size by Marriage Status in San Lorenzo
Out of a total of 8,766 households in San Lorenzo, 6,636 (75.7%) are family households, while 2,130 (24.3%) are nonfamily households. The most numerous type of family households are 2-person households, comprising 1,929, and the most common type of nonfamily households are 1-person households, comprising 1,528.
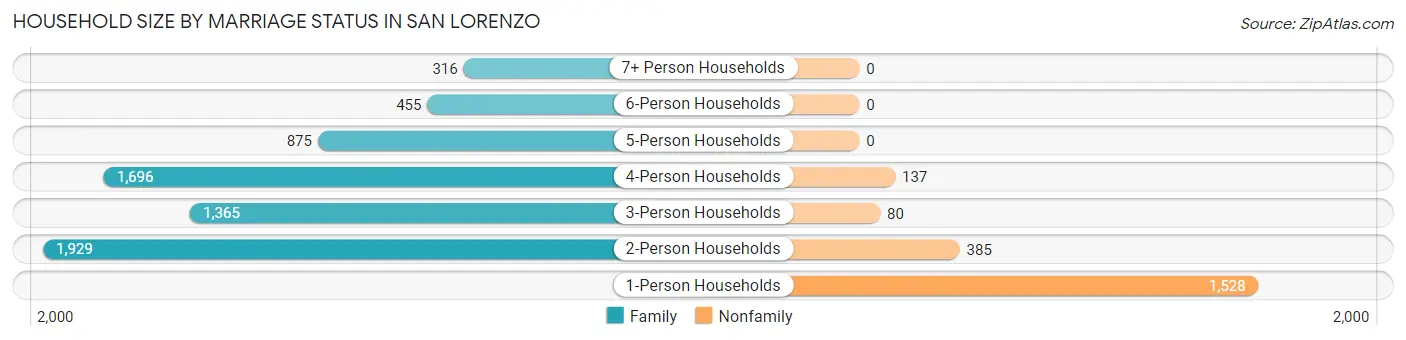
| Household Size | Family Households | Nonfamily Households |
| 1-Person Households | - | 1,528 (17.4%) |
| 2-Person Households | 1,929 (22.0%) | 385 (4.4%) |
| 3-Person Households | 1,365 (15.6%) | 80 (0.9%) |
| 4-Person Households | 1,696 (19.4%) | 137 (1.6%) |
| 5-Person Households | 875 (10.0%) | 0 (0.0%) |
| 6-Person Households | 455 (5.2%) | 0 (0.0%) |
| 7+ Person Households | 316 (3.6%) | 0 (0.0%) |
| Total | 6,636 (75.7%) | 2,130 (24.3%) |
Female Fertility in San Lorenzo
Fertility by Age in San Lorenzo
Average fertility rate in San Lorenzo is 58.0 births per 1,000 women. Women in the age bracket of 20 to 34 years have the highest fertility rate with 81.0 births per 1,000 women. Women in the age bracket of 20 to 34 years acount for 61.3% of all women with births.
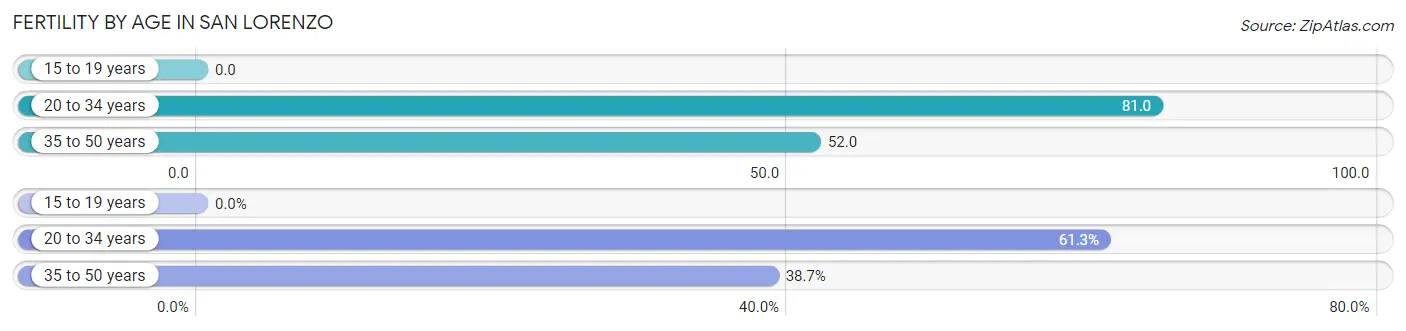
| Age Bracket | Women with Births | Births / 1,000 Women |
| 15 to 19 years | 0 (0.0%) | 0.0 |
| 20 to 34 years | 242 (61.3%) | 81.0 |
| 35 to 50 years | 153 (38.7%) | 52.0 |
| Total | 395 (100.0%) | 58.0 |
Fertility by Age by Marriage Status in San Lorenzo
58.5% of women with births (395) in San Lorenzo are married. The highest percentage of unmarried women with births falls into 35 to 50 years age bracket with 56.9% of them unmarried at the time of birth, while the lowest percentage of unmarried women with births belong to 20 to 34 years age bracket with 31.8% of them unmarried.
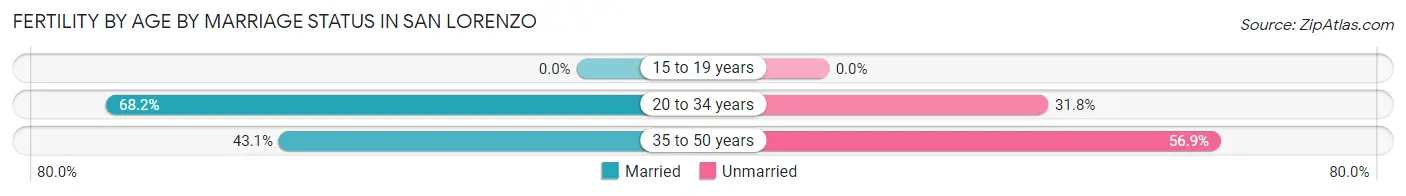
| Age Bracket | Married | Unmarried |
| 15 to 19 years | 0 (0.0%) | 0 (0.0%) |
| 20 to 34 years | 165 (68.2%) | 77 (31.8%) |
| 35 to 50 years | 66 (43.1%) | 87 (56.9%) |
| Total | 231 (58.5%) | 164 (41.5%) |
Fertility by Education in San Lorenzo
Average fertility rate in San Lorenzo is 58.0 births per 1,000 women. Women with the education attainment of bachelor's degree have the highest fertility rate of 105.0 births per 1,000 women, while women with the education attainment of graduate degree have the lowest fertility at 12.0 births per 1,000 women. Women with the education attainment of bachelor's degree represent 49.4% of all women with births.
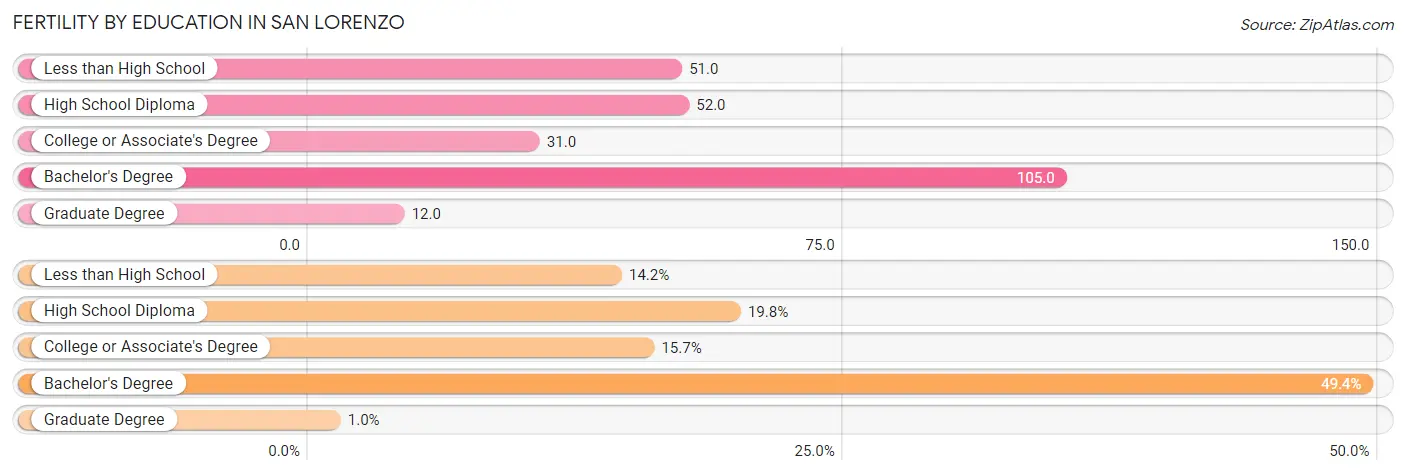
| Educational Attainment | Women with Births | Births / 1,000 Women |
| Less than High School | 56 (14.2%) | 51.0 |
| High School Diploma | 78 (19.8%) | 52.0 |
| College or Associate's Degree | 62 (15.7%) | 31.0 |
| Bachelor's Degree | 195 (49.4%) | 105.0 |
| Graduate Degree | 4 (1.0%) | 12.0 |
| Total | 395 (100.0%) | 58.0 |
Fertility by Education by Marriage Status in San Lorenzo
41.5% of women with births in San Lorenzo are unmarried. Women with the educational attainment of graduate degree are most likely to be married with 100.0% of them married at childbirth, while women with the educational attainment of bachelor's degree are least likely to be married with 62.6% of them unmarried at childbirth.
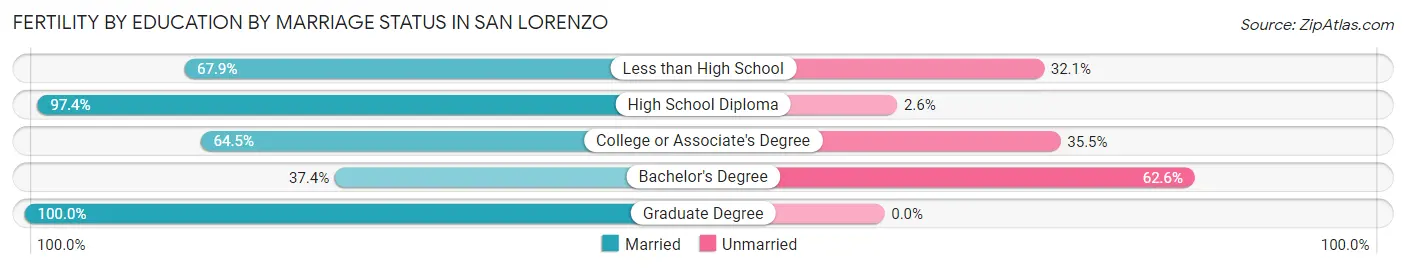
| Educational Attainment | Married | Unmarried |
| Less than High School | 38 (67.9%) | 18 (32.1%) |
| High School Diploma | 76 (97.4%) | 2 (2.6%) |
| College or Associate's Degree | 40 (64.5%) | 22 (35.5%) |
| Bachelor's Degree | 73 (37.4%) | 122 (62.6%) |
| Graduate Degree | 4 (100.0%) | 0 (0.0%) |
| Total | 231 (58.5%) | 164 (41.5%) |
Employment Characteristics in San Lorenzo
Employment by Class of Employer in San Lorenzo
Among the 14,349 employed individuals in San Lorenzo, private company employees (10,098 | 70.4%), local government employees (1,109 | 7.7%), and not-for-profit organizations (921 | 6.4%) make up the most common classes of employment.
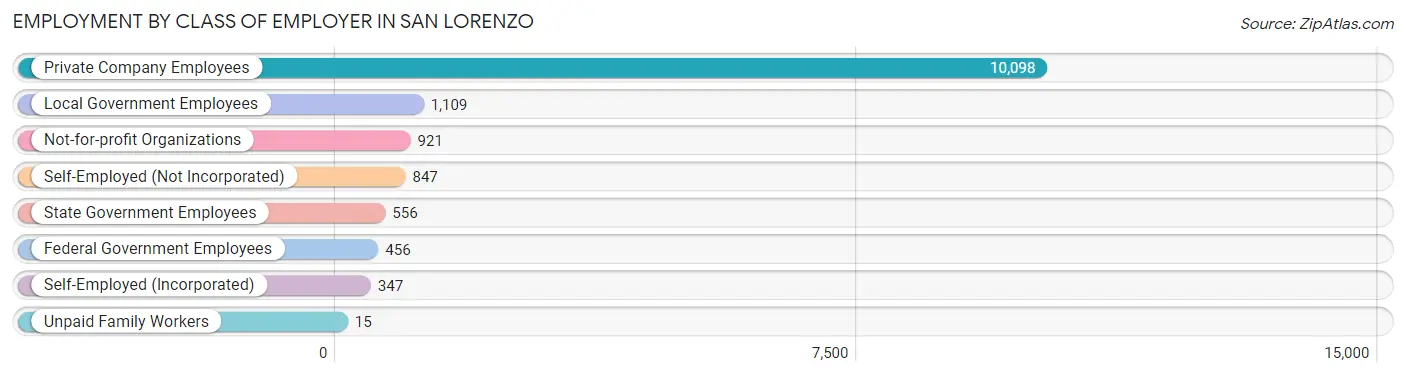
| Employer Class | # Employees | % Employees |
| Private Company Employees | 10,098 | 70.4% |
| Self-Employed (Incorporated) | 347 | 2.4% |
| Self-Employed (Not Incorporated) | 847 | 5.9% |
| Not-for-profit Organizations | 921 | 6.4% |
| Local Government Employees | 1,109 | 7.7% |
| State Government Employees | 556 | 3.9% |
| Federal Government Employees | 456 | 3.2% |
| Unpaid Family Workers | 15 | 0.1% |
| Total | 14,349 | 100.0% |
Employment Status by Age in San Lorenzo
According to the labor force statistics for San Lorenzo, out of the total population over 16 years of age (24,702), 65.5% or 16,180 individuals are in the labor force, with 5.5% or 890 of them unemployed. The age group with the highest labor force participation rate is 25 to 29 years, with 86.8% or 2,305 individuals in the labor force. Within the labor force, the 75 years and over age range has the highest percentage of unemployed individuals, with 16.1% or 19 of them being unemployed.
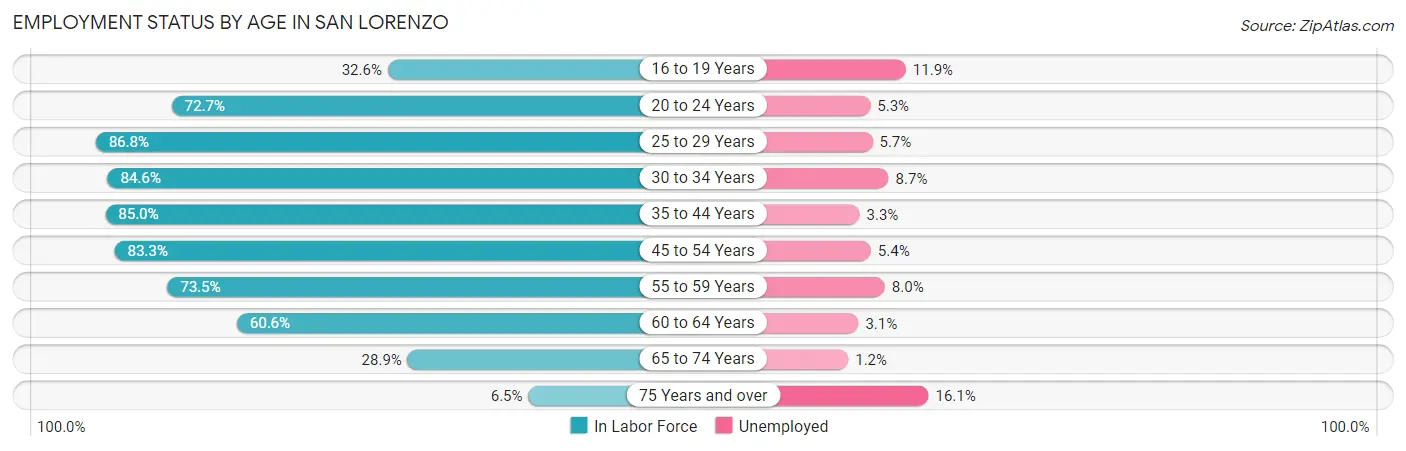
| Age Bracket | In Labor Force | Unemployed |
| 16 to 19 Years | 452 (32.6%) | 54 (11.9%) |
| 20 to 24 Years | 1,033 (72.7%) | 55 (5.3%) |
| 25 to 29 Years | 2,305 (86.8%) | 131 (5.7%) |
| 30 to 34 Years | 1,773 (84.6%) | 154 (8.7%) |
| 35 to 44 Years | 3,178 (85.0%) | 105 (3.3%) |
| 45 to 54 Years | 3,419 (83.3%) | 185 (5.4%) |
| 55 to 59 Years | 1,720 (73.5%) | 138 (8.0%) |
| 60 to 64 Years | 1,330 (60.6%) | 41 (3.1%) |
| 65 to 74 Years | 853 (28.9%) | 10 (1.2%) |
| 75 Years and over | 118 (6.5%) | 19 (16.1%) |
| Total | 16,180 (65.5%) | 890 (5.5%) |
Employment Status by Educational Attainment in San Lorenzo
According to labor force statistics for San Lorenzo, 80.1% of individuals (13,720) out of the total population between 25 and 64 years of age (17,129) are in the labor force, with 5.5% or 755 of them being unemployed. The group with the highest labor force participation rate are those with the educational attainment of bachelor's degree or higher, with 86.8% or 4,069 individuals in the labor force. Within the labor force, individuals with bachelor's degree or higher education have the highest percentage of unemployment, with 6.6% or 269 of them being unemployed.
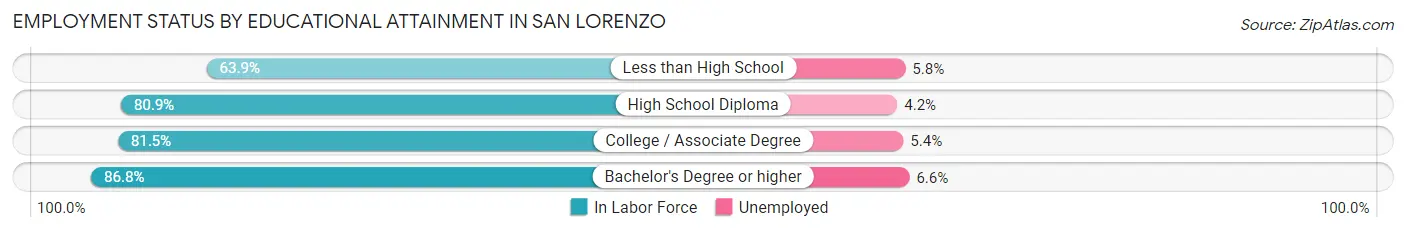
| Educational Attainment | In Labor Force | Unemployed |
| Less than High School | 1,642 (63.9%) | 149 (5.8%) |
| High School Diploma | 3,501 (80.9%) | 182 (4.2%) |
| College / Associate Degree | 4,518 (81.5%) | 299 (5.4%) |
| Bachelor's Degree or higher | 4,069 (86.8%) | 309 (6.6%) |
| Total | 13,720 (80.1%) | 942 (5.5%) |
Employment Occupations by Sex in San Lorenzo
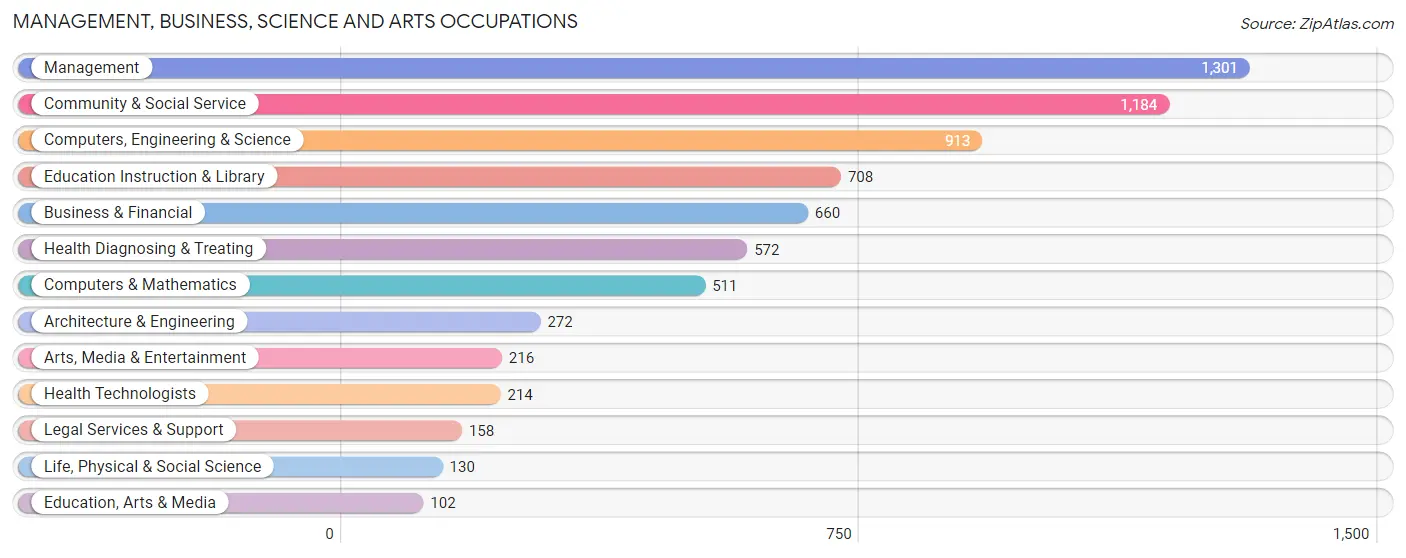
Management, Business, Science and Arts Occupations
The most common Management, Business, Science and Arts occupations in San Lorenzo are Management (1,301 | 8.5%), Community & Social Service (1,184 | 7.7%), Computers, Engineering & Science (913 | 6.0%), Education Instruction & Library (708 | 4.6%), and Business & Financial (660 | 4.3%).
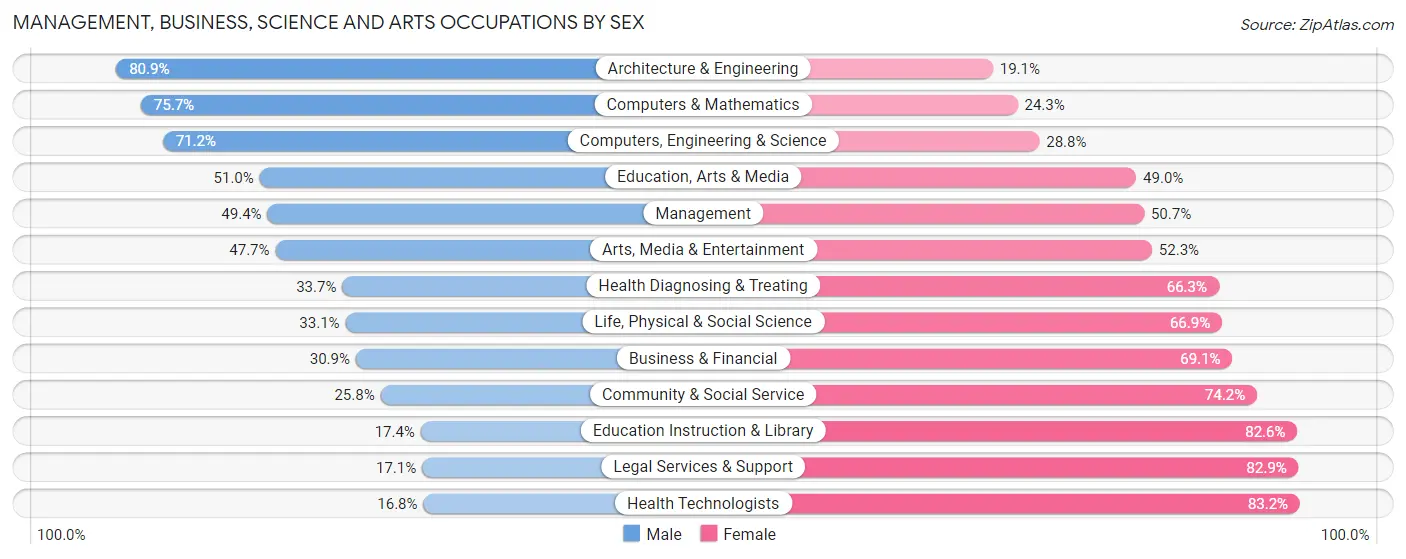
Management, Business, Science and Arts Occupations by Sex
Within the Management, Business, Science and Arts occupations in San Lorenzo, the most male-oriented occupations are Architecture & Engineering (80.9%), Computers & Mathematics (75.7%), and Computers, Engineering & Science (71.2%), while the most female-oriented occupations are Health Technologists (83.2%), Legal Services & Support (82.9%), and Education Instruction & Library (82.6%).
| Occupation | Male | Female |
| Management | 642 (49.3%) | 659 (50.6%) |
| Business & Financial | 204 (30.9%) | 456 (69.1%) |
| Computers, Engineering & Science | 650 (71.2%) | 263 (28.8%) |
| Computers & Mathematics | 387 (75.7%) | 124 (24.3%) |
| Architecture & Engineering | 220 (80.9%) | 52 (19.1%) |
| Life, Physical & Social Science | 43 (33.1%) | 87 (66.9%) |
| Community & Social Service | 305 (25.8%) | 879 (74.2%) |
| Education, Arts & Media | 52 (51.0%) | 50 (49.0%) |
| Legal Services & Support | 27 (17.1%) | 131 (82.9%) |
| Education Instruction & Library | 123 (17.4%) | 585 (82.6%) |
| Arts, Media & Entertainment | 103 (47.7%) | 113 (52.3%) |
| Health Diagnosing & Treating | 193 (33.7%) | 379 (66.3%) |
| Health Technologists | 36 (16.8%) | 178 (83.2%) |
| Total (Category) | 1,994 (43.1%) | 2,636 (56.9%) |
| Total (Overall) | 8,080 (52.8%) | 7,211 (47.2%) |
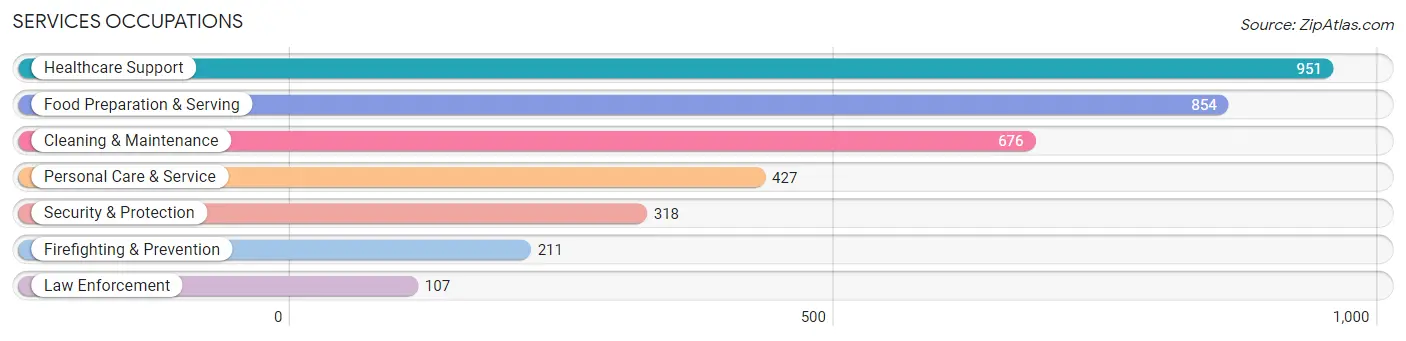
Services Occupations
The most common Services occupations in San Lorenzo are Healthcare Support (951 | 6.2%), Food Preparation & Serving (854 | 5.6%), Cleaning & Maintenance (676 | 4.4%), Personal Care & Service (427 | 2.8%), and Security & Protection (318 | 2.1%).
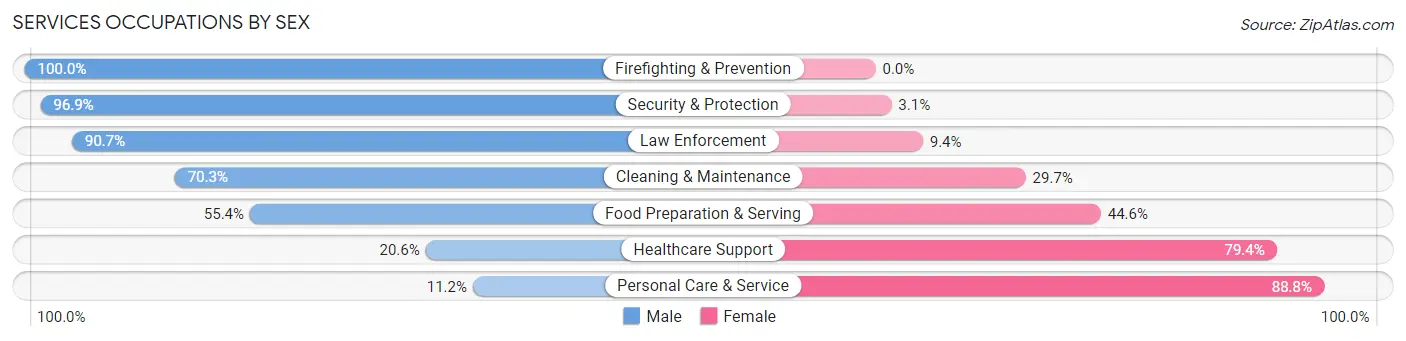
Services Occupations by Sex
Within the Services occupations in San Lorenzo, the most male-oriented occupations are Firefighting & Prevention (100.0%), Security & Protection (96.9%), and Law Enforcement (90.6%), while the most female-oriented occupations are Personal Care & Service (88.8%), Healthcare Support (79.4%), and Food Preparation & Serving (44.6%).
| Occupation | Male | Female |
| Healthcare Support | 196 (20.6%) | 755 (79.4%) |
| Security & Protection | 308 (96.9%) | 10 (3.1%) |
| Firefighting & Prevention | 211 (100.0%) | 0 (0.0%) |
| Law Enforcement | 97 (90.6%) | 10 (9.3%) |
| Food Preparation & Serving | 473 (55.4%) | 381 (44.6%) |
| Cleaning & Maintenance | 475 (70.3%) | 201 (29.7%) |
| Personal Care & Service | 48 (11.2%) | 379 (88.8%) |
| Total (Category) | 1,500 (46.5%) | 1,726 (53.5%) |
| Total (Overall) | 8,080 (52.8%) | 7,211 (47.2%) |
Sales and Office Occupations
The most common Sales and Office occupations in San Lorenzo are Office & Administration (2,347 | 15.3%), and Sales & Related (1,062 | 7.0%).
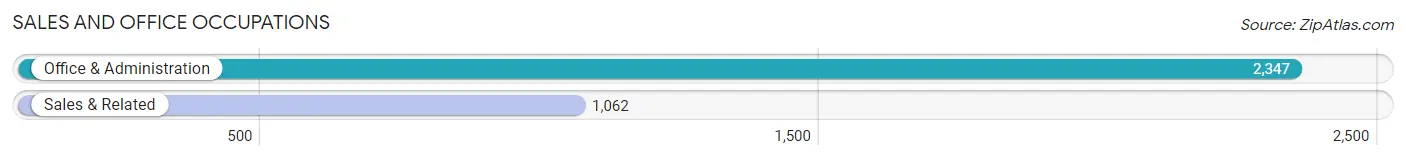
Sales and Office Occupations by Sex
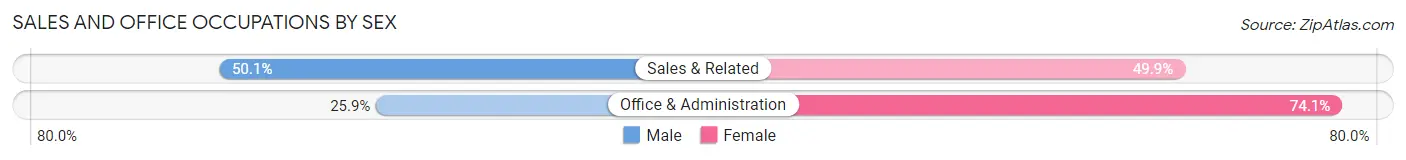
| Occupation | Male | Female |
| Sales & Related | 532 (50.1%) | 530 (49.9%) |
| Office & Administration | 608 (25.9%) | 1,739 (74.1%) |
| Total (Category) | 1,140 (33.4%) | 2,269 (66.6%) |
| Total (Overall) | 8,080 (52.8%) | 7,211 (47.2%) |
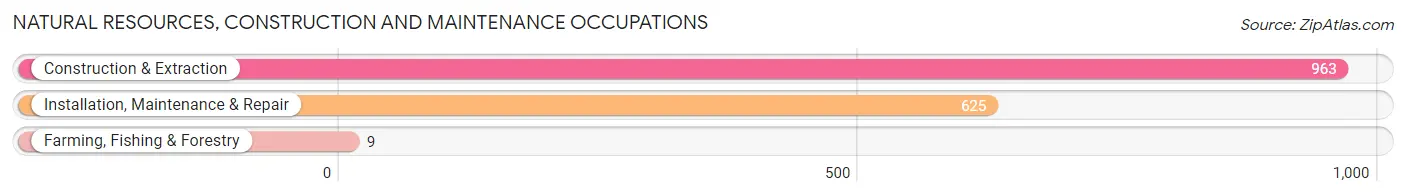
Natural Resources, Construction and Maintenance Occupations
The most common Natural Resources, Construction and Maintenance occupations in San Lorenzo are Construction & Extraction (963 | 6.3%), Installation, Maintenance & Repair (625 | 4.1%), and Farming, Fishing & Forestry (9 | 0.1%).
Natural Resources, Construction and Maintenance Occupations by Sex
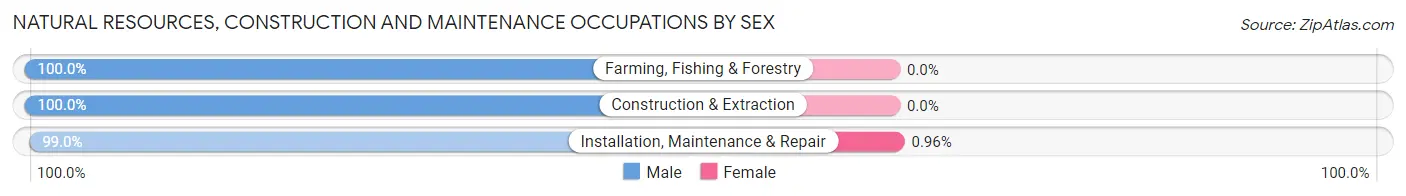
| Occupation | Male | Female |
| Farming, Fishing & Forestry | 9 (100.0%) | 0 (0.0%) |
| Construction & Extraction | 963 (100.0%) | 0 (0.0%) |
| Installation, Maintenance & Repair | 619 (99.0%) | 6 (1.0%) |
| Total (Category) | 1,591 (99.6%) | 6 (0.4%) |
| Total (Overall) | 8,080 (52.8%) | 7,211 (47.2%) |
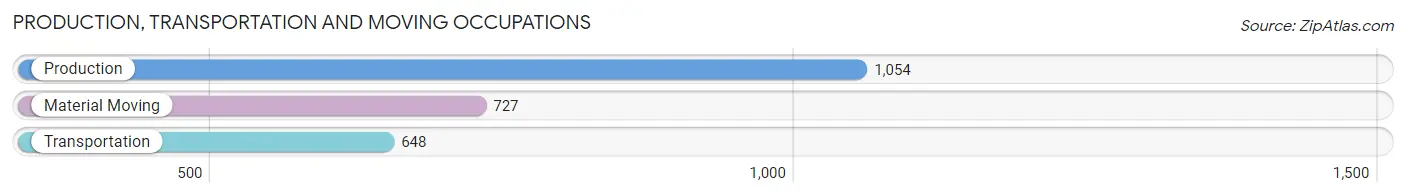
Production, Transportation and Moving Occupations
The most common Production, Transportation and Moving occupations in San Lorenzo are Production (1,054 | 6.9%), Material Moving (727 | 4.8%), and Transportation (648 | 4.2%).
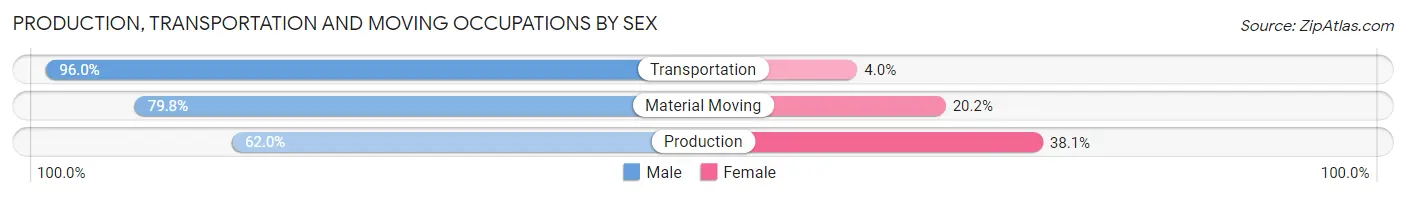
Production, Transportation and Moving Occupations by Sex
| Occupation | Male | Female |
| Production | 653 (62.0%) | 401 (38.1%) |
| Transportation | 622 (96.0%) | 26 (4.0%) |
| Material Moving | 580 (79.8%) | 147 (20.2%) |
| Total (Category) | 1,855 (76.4%) | 574 (23.6%) |
| Total (Overall) | 8,080 (52.8%) | 7,211 (47.2%) |
Employment Industries by Sex in San Lorenzo
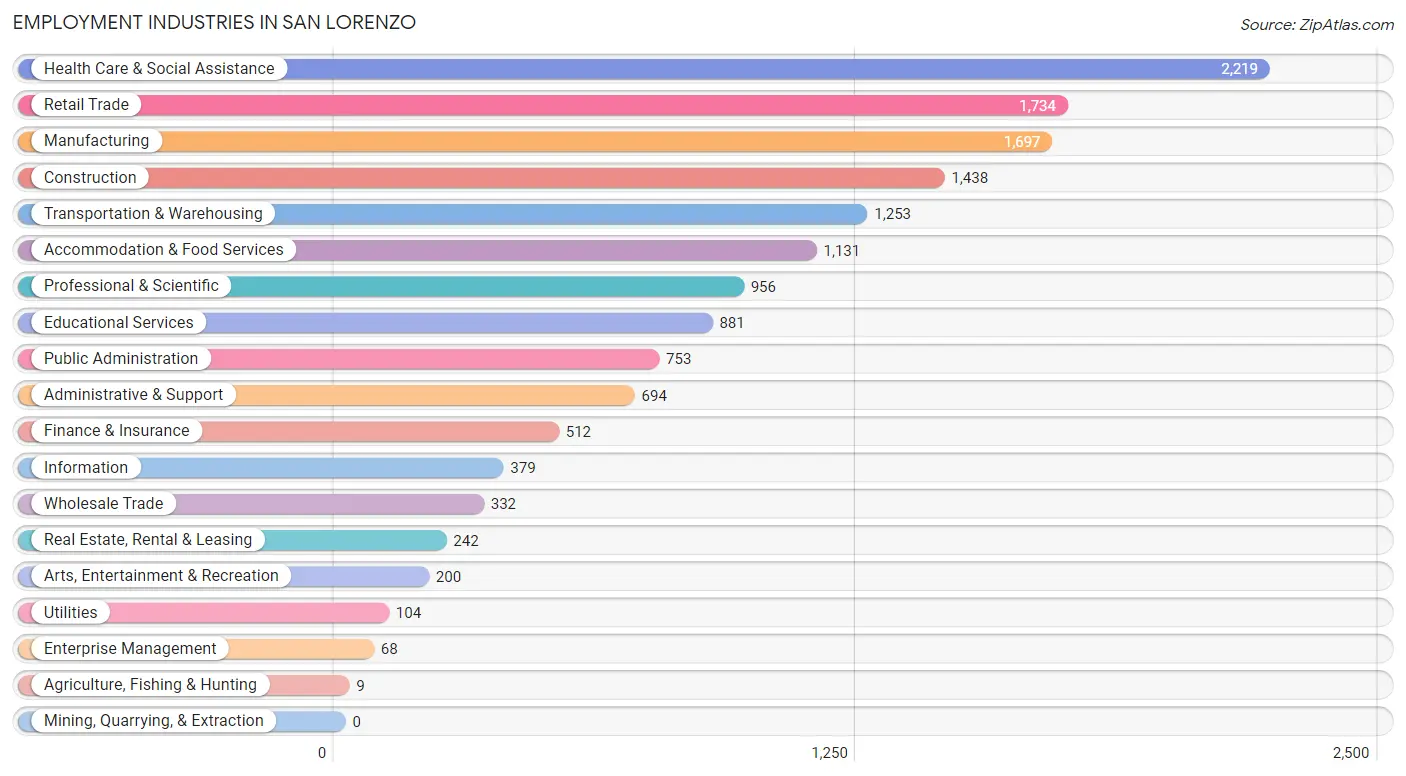
Employment Industries in San Lorenzo
The major employment industries in San Lorenzo include Health Care & Social Assistance (2,219 | 14.5%), Retail Trade (1,734 | 11.3%), Manufacturing (1,697 | 11.1%), Construction (1,438 | 9.4%), and Transportation & Warehousing (1,253 | 8.2%).
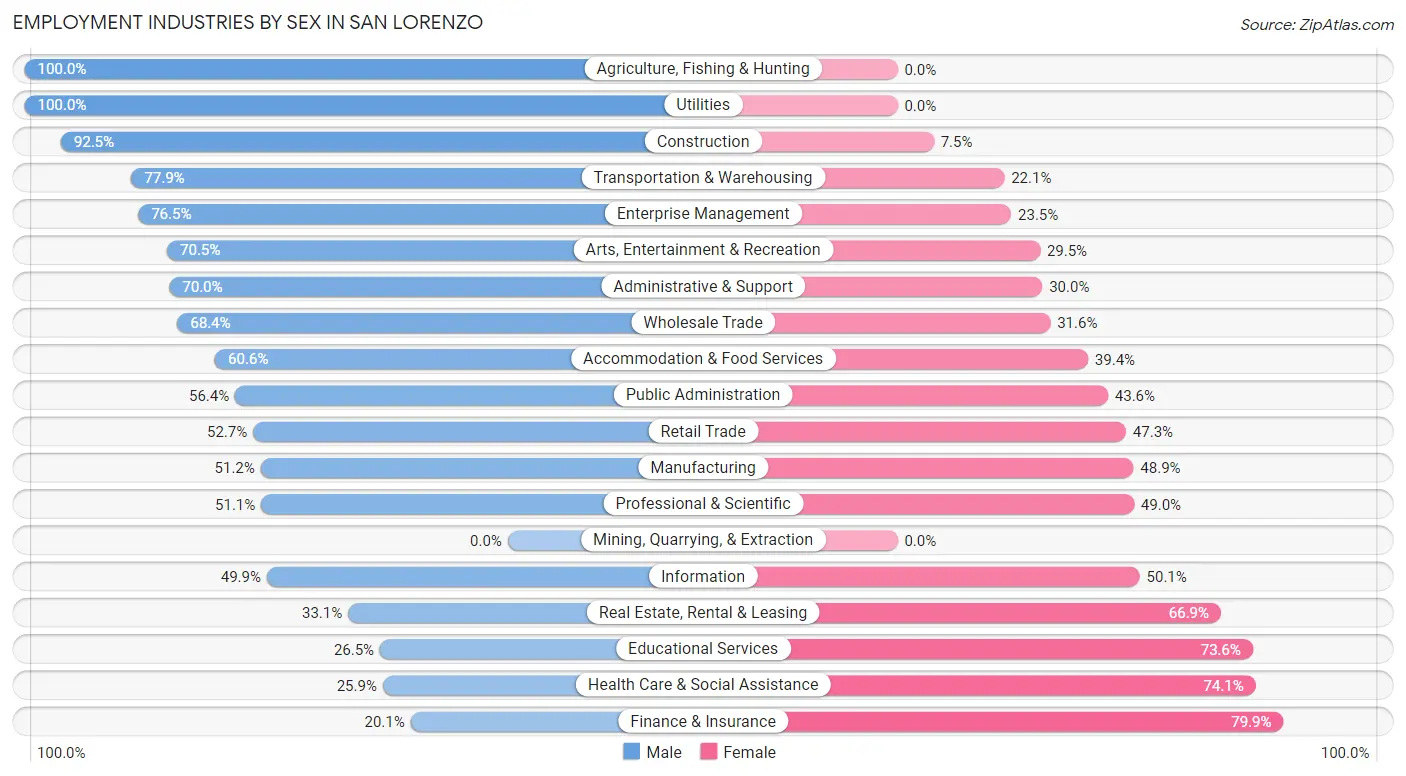
Employment Industries by Sex in San Lorenzo
The San Lorenzo industries that see more men than women are Agriculture, Fishing & Hunting (100.0%), Utilities (100.0%), and Construction (92.5%), whereas the industries that tend to have a higher number of women are Finance & Insurance (79.9%), Health Care & Social Assistance (74.1%), and Educational Services (73.6%).
| Industry | Male | Female |
| Agriculture, Fishing & Hunting | 9 (100.0%) | 0 (0.0%) |
| Mining, Quarrying, & Extraction | 0 (0.0%) | 0 (0.0%) |
| Construction | 1,330 (92.5%) | 108 (7.5%) |
| Manufacturing | 868 (51.1%) | 829 (48.8%) |
| Wholesale Trade | 227 (68.4%) | 105 (31.6%) |
| Retail Trade | 914 (52.7%) | 820 (47.3%) |
| Transportation & Warehousing | 976 (77.9%) | 277 (22.1%) |
| Utilities | 104 (100.0%) | 0 (0.0%) |
| Information | 189 (49.9%) | 190 (50.1%) |
| Finance & Insurance | 103 (20.1%) | 409 (79.9%) |
| Real Estate, Rental & Leasing | 80 (33.1%) | 162 (66.9%) |
| Professional & Scientific | 488 (51.0%) | 468 (48.9%) |
| Enterprise Management | 52 (76.5%) | 16 (23.5%) |
| Administrative & Support | 486 (70.0%) | 208 (30.0%) |
| Educational Services | 233 (26.5%) | 648 (73.6%) |
| Health Care & Social Assistance | 574 (25.9%) | 1,645 (74.1%) |
| Arts, Entertainment & Recreation | 141 (70.5%) | 59 (29.5%) |
| Accommodation & Food Services | 685 (60.6%) | 446 (39.4%) |
| Public Administration | 425 (56.4%) | 328 (43.6%) |
| Total | 8,080 (52.8%) | 7,211 (47.2%) |
Education in San Lorenzo
School Enrollment in San Lorenzo
The most common levels of schooling among the 6,506 students in San Lorenzo are college / undergraduate (1,722 | 26.5%), high school (1,268 | 19.5%), and middle school (1,263 | 19.4%).
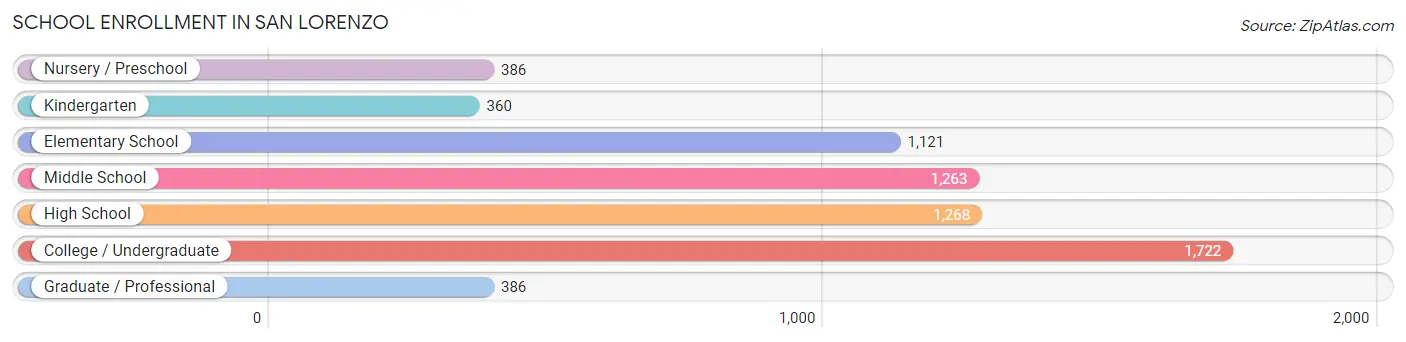
| School Level | # Students | % Students |
| Nursery / Preschool | 386 | 5.9% |
| Kindergarten | 360 | 5.5% |
| Elementary School | 1,121 | 17.2% |
| Middle School | 1,263 | 19.4% |
| High School | 1,268 | 19.5% |
| College / Undergraduate | 1,722 | 26.5% |
| Graduate / Professional | 386 | 5.9% |
| Total | 6,506 | 100.0% |
School Enrollment by Age by Funding Source in San Lorenzo
Out of a total of 6,506 students who are enrolled in schools in San Lorenzo, 820 (12.6%) attend a private institution, while the remaining 5,686 (87.4%) are enrolled in public schools. The age group of 3 to 4 year olds has the highest likelihood of being enrolled in private schools, with 105 (27.2% in the age bracket) enrolled. Conversely, the age group of 20 to 24 year olds has the lowest likelihood of being enrolled in a private school, with 680 (98.8% in the age bracket) attending a public institution.
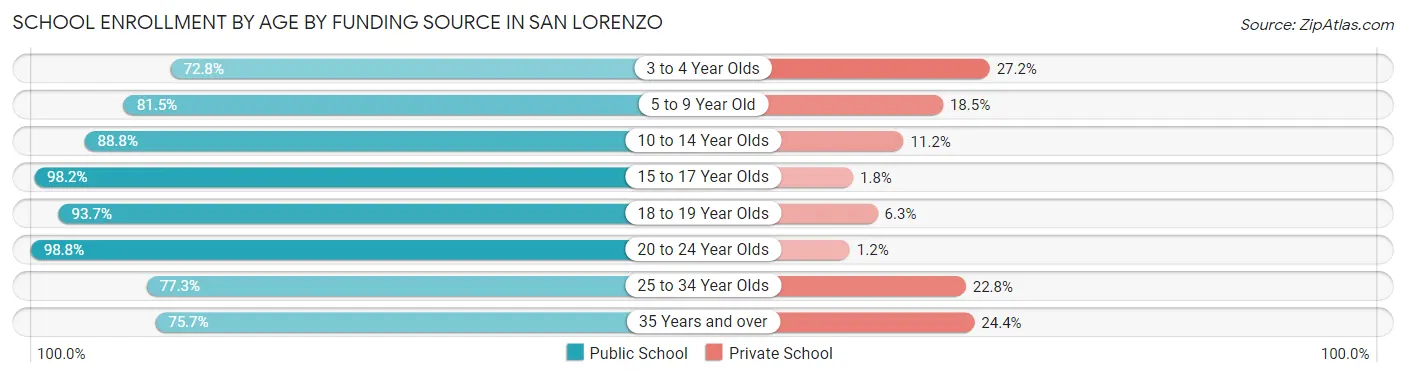
| Age Bracket | Public School | Private School |
| 3 to 4 Year Olds | 281 (72.8%) | 105 (27.2%) |
| 5 to 9 Year Old | 1,053 (81.5%) | 239 (18.5%) |
| 10 to 14 Year Olds | 1,431 (88.8%) | 180 (11.2%) |
| 15 to 17 Year Olds | 948 (98.2%) | 17 (1.8%) |
| 18 to 19 Year Olds | 518 (93.7%) | 35 (6.3%) |
| 20 to 24 Year Olds | 680 (98.8%) | 8 (1.2%) |
| 25 to 34 Year Olds | 394 (77.2%) | 116 (22.8%) |
| 35 Years and over | 379 (75.6%) | 122 (24.3%) |
| Total | 5,686 (87.4%) | 820 (12.6%) |
Educational Attainment by Field of Study in San Lorenzo
Business (1,058 | 17.6%), science & technology (735 | 12.2%), engineering (599 | 9.9%), social sciences (508 | 8.4%), and education (483 | 8.0%) are the most common fields of study among 6,026 individuals in San Lorenzo who have obtained a bachelor's degree or higher.
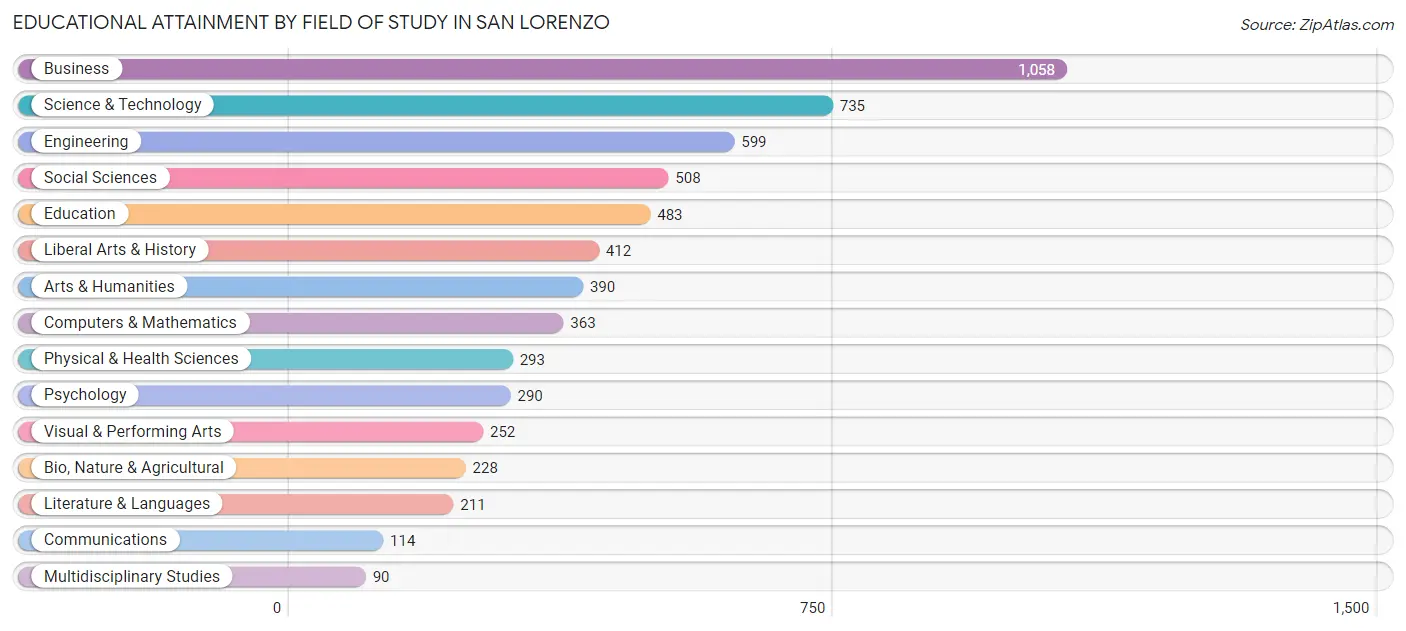
| Field of Study | # Graduates | % Graduates |
| Computers & Mathematics | 363 | 6.0% |
| Bio, Nature & Agricultural | 228 | 3.8% |
| Physical & Health Sciences | 293 | 4.9% |
| Psychology | 290 | 4.8% |
| Social Sciences | 508 | 8.4% |
| Engineering | 599 | 9.9% |
| Multidisciplinary Studies | 90 | 1.5% |
| Science & Technology | 735 | 12.2% |
| Business | 1,058 | 17.6% |
| Education | 483 | 8.0% |
| Literature & Languages | 211 | 3.5% |
| Liberal Arts & History | 412 | 6.8% |
| Visual & Performing Arts | 252 | 4.2% |
| Communications | 114 | 1.9% |
| Arts & Humanities | 390 | 6.5% |
| Total | 6,026 | 100.0% |
Transportation & Commute in San Lorenzo
Vehicle Availability by Sex in San Lorenzo
The most prevalent vehicle ownership categories in San Lorenzo are males with 2 vehicles (2,432, accounting for 31.9%) and females with 2 vehicles (2,353, making up 36.2%).
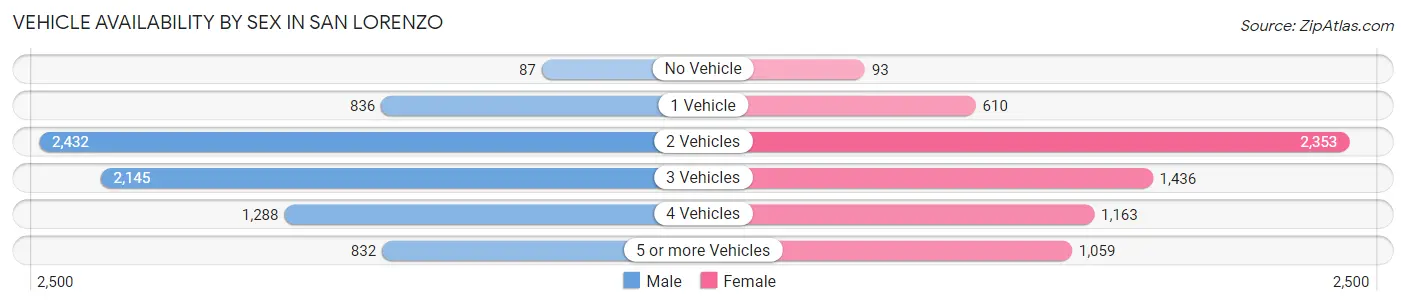
| Vehicles Available | Male | Female |
| No Vehicle | 87 (1.1%) | 93 (1.4%) |
| 1 Vehicle | 836 (11.0%) | 610 (9.1%) |
| 2 Vehicles | 2,432 (31.9%) | 2,353 (35.0%) |
| 3 Vehicles | 2,145 (28.1%) | 1,436 (21.4%) |
| 4 Vehicles | 1,288 (16.9%) | 1,163 (17.3%) |
| 5 or more Vehicles | 832 (10.9%) | 1,059 (15.8%) |
| Total | 7,620 (100.0%) | 6,714 (100.0%) |
Commute Time in San Lorenzo
The most frequently occuring commute durations in San Lorenzo are 15 to 19 minutes (2,248 commuters, 16.9%), 30 to 34 minutes (2,102 commuters, 15.8%), and 45 to 59 minutes (1,812 commuters, 13.7%).
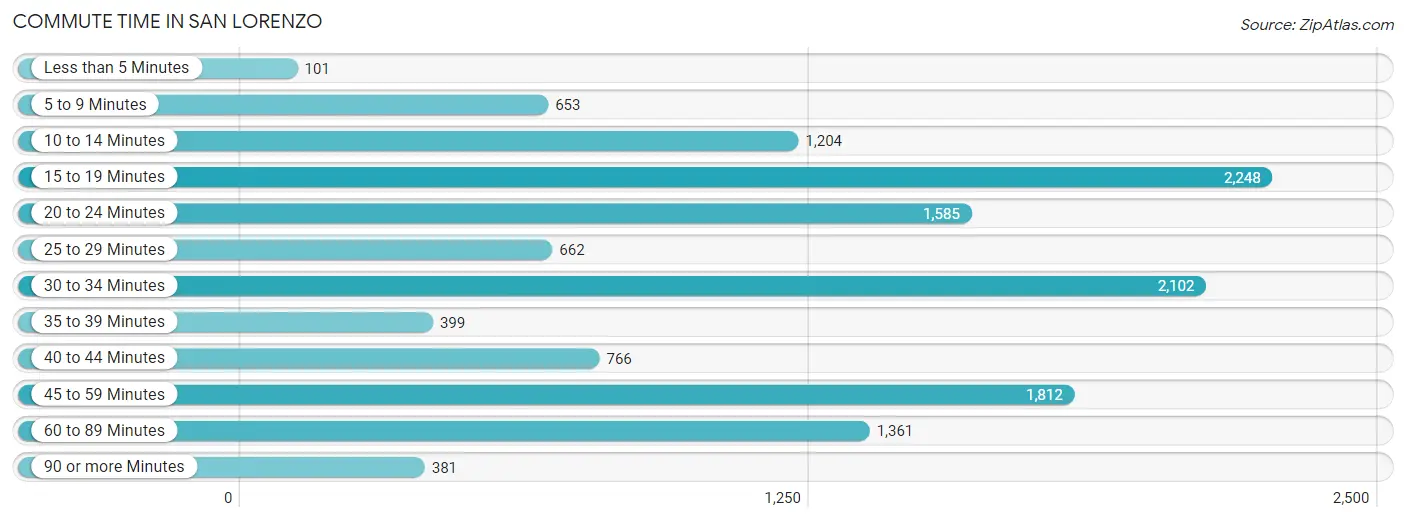
| Commute Time | # Commuters | % Commuters |
| Less than 5 Minutes | 101 | 0.8% |
| 5 to 9 Minutes | 653 | 4.9% |
| 10 to 14 Minutes | 1,204 | 9.1% |
| 15 to 19 Minutes | 2,248 | 16.9% |
| 20 to 24 Minutes | 1,585 | 11.9% |
| 25 to 29 Minutes | 662 | 5.0% |
| 30 to 34 Minutes | 2,102 | 15.8% |
| 35 to 39 Minutes | 399 | 3.0% |
| 40 to 44 Minutes | 766 | 5.8% |
| 45 to 59 Minutes | 1,812 | 13.7% |
| 60 to 89 Minutes | 1,361 | 10.2% |
| 90 or more Minutes | 381 | 2.9% |
Commute Time by Sex in San Lorenzo
The most common commute times in San Lorenzo are 45 to 59 minutes (1,181 commuters, 16.6%) for males and 15 to 19 minutes (1,236 commuters, 20.1%) for females.
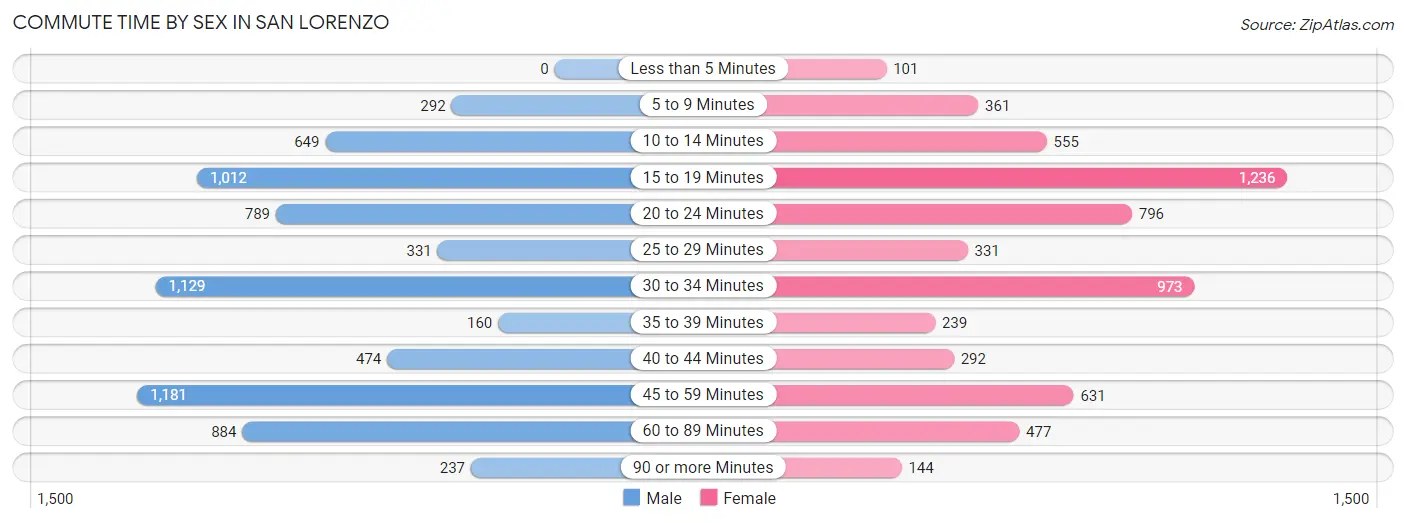
| Commute Time | Male | Female |
| Less than 5 Minutes | 0 (0.0%) | 101 (1.7%) |
| 5 to 9 Minutes | 292 (4.1%) | 361 (5.9%) |
| 10 to 14 Minutes | 649 (9.1%) | 555 (9.0%) |
| 15 to 19 Minutes | 1,012 (14.2%) | 1,236 (20.1%) |
| 20 to 24 Minutes | 789 (11.1%) | 796 (13.0%) |
| 25 to 29 Minutes | 331 (4.6%) | 331 (5.4%) |
| 30 to 34 Minutes | 1,129 (15.8%) | 973 (15.9%) |
| 35 to 39 Minutes | 160 (2.2%) | 239 (3.9%) |
| 40 to 44 Minutes | 474 (6.6%) | 292 (4.8%) |
| 45 to 59 Minutes | 1,181 (16.6%) | 631 (10.3%) |
| 60 to 89 Minutes | 884 (12.4%) | 477 (7.8%) |
| 90 or more Minutes | 237 (3.3%) | 144 (2.4%) |
Time of Departure to Work by Sex in San Lorenzo
The most frequent times of departure to work in San Lorenzo are 12:00 AM to 4:59 AM (905, 12.7%) for males and 7:00 AM to 7:29 AM (995, 16.2%) for females.
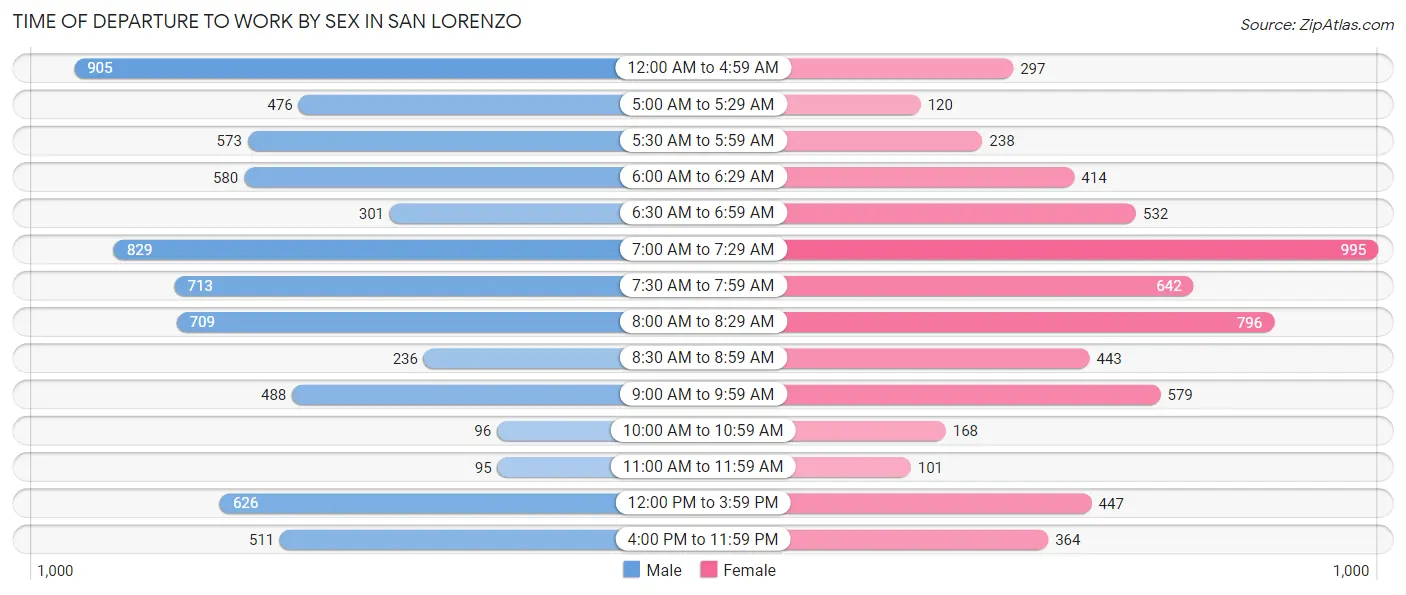
| Time of Departure | Male | Female |
| 12:00 AM to 4:59 AM | 905 (12.7%) | 297 (4.8%) |
| 5:00 AM to 5:29 AM | 476 (6.7%) | 120 (2.0%) |
| 5:30 AM to 5:59 AM | 573 (8.0%) | 238 (3.9%) |
| 6:00 AM to 6:29 AM | 580 (8.1%) | 414 (6.8%) |
| 6:30 AM to 6:59 AM | 301 (4.2%) | 532 (8.7%) |
| 7:00 AM to 7:29 AM | 829 (11.6%) | 995 (16.2%) |
| 7:30 AM to 7:59 AM | 713 (10.0%) | 642 (10.5%) |
| 8:00 AM to 8:29 AM | 709 (9.9%) | 796 (13.0%) |
| 8:30 AM to 8:59 AM | 236 (3.3%) | 443 (7.2%) |
| 9:00 AM to 9:59 AM | 488 (6.8%) | 579 (9.4%) |
| 10:00 AM to 10:59 AM | 96 (1.3%) | 168 (2.7%) |
| 11:00 AM to 11:59 AM | 95 (1.3%) | 101 (1.7%) |
| 12:00 PM to 3:59 PM | 626 (8.8%) | 447 (7.3%) |
| 4:00 PM to 11:59 PM | 511 (7.2%) | 364 (5.9%) |
| Total | 7,138 (100.0%) | 6,136 (100.0%) |
Housing Occupancy in San Lorenzo
Occupancy by Ownership in San Lorenzo
Of the total 8,766 dwellings in San Lorenzo, owner-occupied units account for 5,863 (66.9%), while renter-occupied units make up 2,903 (33.1%).
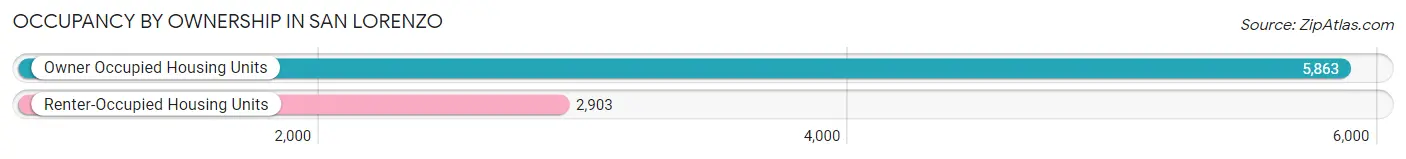
| Occupancy | # Housing Units | % Housing Units |
| Owner Occupied Housing Units | 5,863 | 66.9% |
| Renter-Occupied Housing Units | 2,903 | 33.1% |
| Total Occupied Housing Units | 8,766 | 100.0% |
Occupancy by Household Size in San Lorenzo
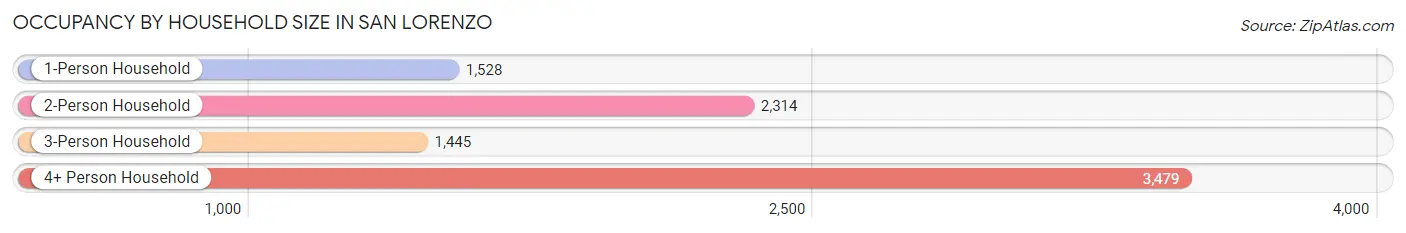
| Household Size | # Housing Units | % Housing Units |
| 1-Person Household | 1,528 | 17.4% |
| 2-Person Household | 2,314 | 26.4% |
| 3-Person Household | 1,445 | 16.5% |
| 4+ Person Household | 3,479 | 39.7% |
| Total Housing Units | 8,766 | 100.0% |
Occupancy by Ownership by Household Size in San Lorenzo
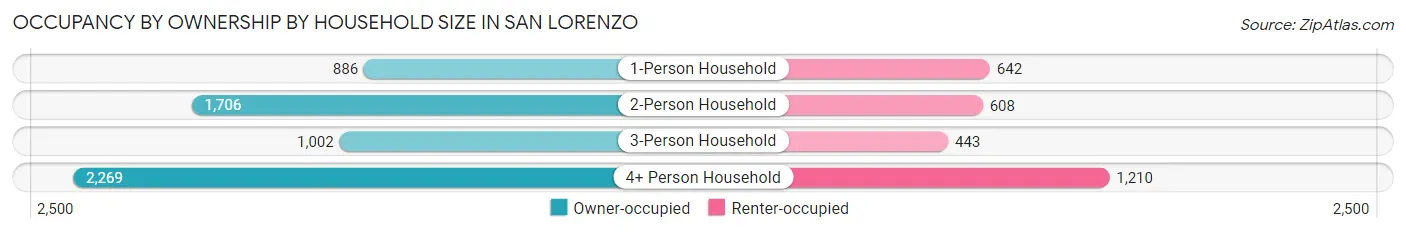
| Household Size | Owner-occupied | Renter-occupied |
| 1-Person Household | 886 (58.0%) | 642 (42.0%) |
| 2-Person Household | 1,706 (73.7%) | 608 (26.3%) |
| 3-Person Household | 1,002 (69.3%) | 443 (30.7%) |
| 4+ Person Household | 2,269 (65.2%) | 1,210 (34.8%) |
| Total Housing Units | 5,863 (66.9%) | 2,903 (33.1%) |
Occupancy by Educational Attainment in San Lorenzo
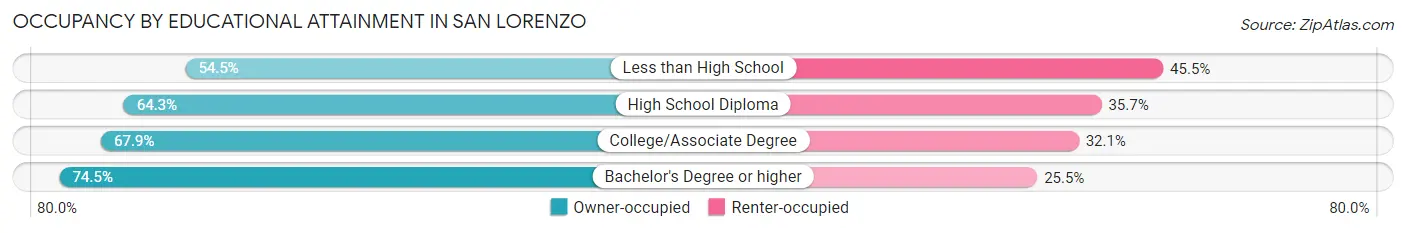
| Household Size | Owner-occupied | Renter-occupied |
| Less than High School | 639 (54.5%) | 534 (45.5%) |
| High School Diploma | 1,498 (64.3%) | 833 (35.7%) |
| College/Associate Degree | 1,980 (67.9%) | 937 (32.1%) |
| Bachelor's Degree or higher | 1,746 (74.5%) | 599 (25.5%) |
Occupancy by Age of Householder in San Lorenzo
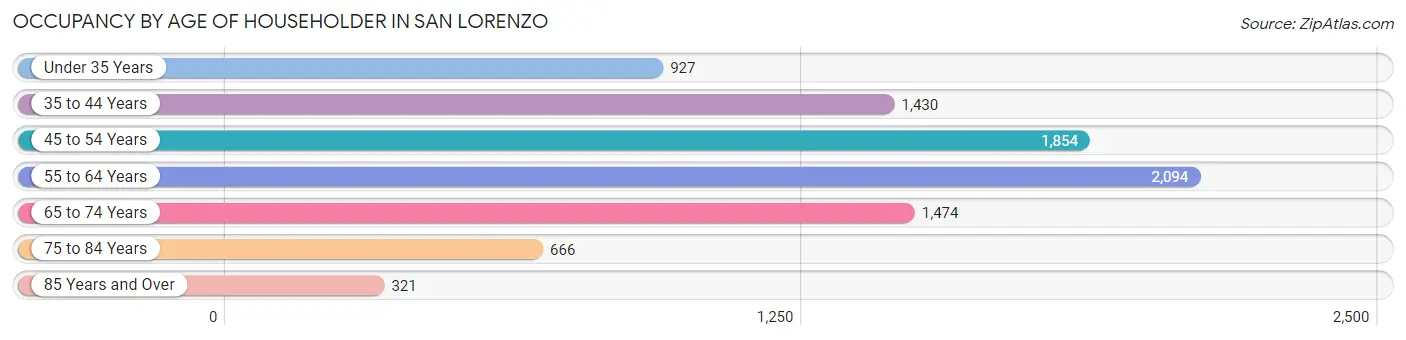
| Age Bracket | # Households | % Households |
| Under 35 Years | 927 | 10.6% |
| 35 to 44 Years | 1,430 | 16.3% |
| 45 to 54 Years | 1,854 | 21.1% |
| 55 to 64 Years | 2,094 | 23.9% |
| 65 to 74 Years | 1,474 | 16.8% |
| 75 to 84 Years | 666 | 7.6% |
| 85 Years and Over | 321 | 3.7% |
| Total | 8,766 | 100.0% |
Housing Finances in San Lorenzo
Median Income by Occupancy in San Lorenzo
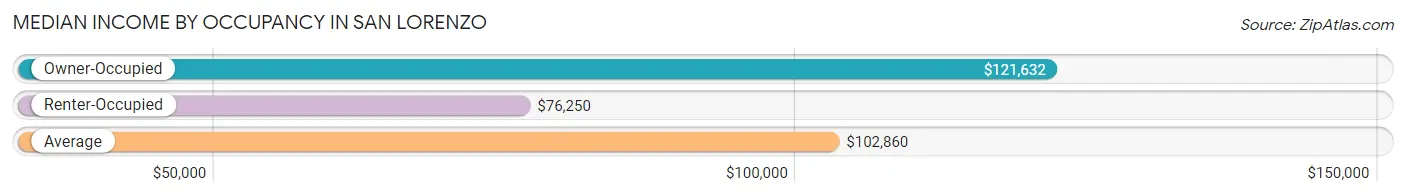
| Occupancy Type | # Households | Median Income |
| Owner-Occupied | 5,863 (66.9%) | $121,632 |
| Renter-Occupied | 2,903 (33.1%) | $76,250 |
| Average | 8,766 (100.0%) | $102,860 |
Occupancy by Householder Income Bracket in San Lorenzo
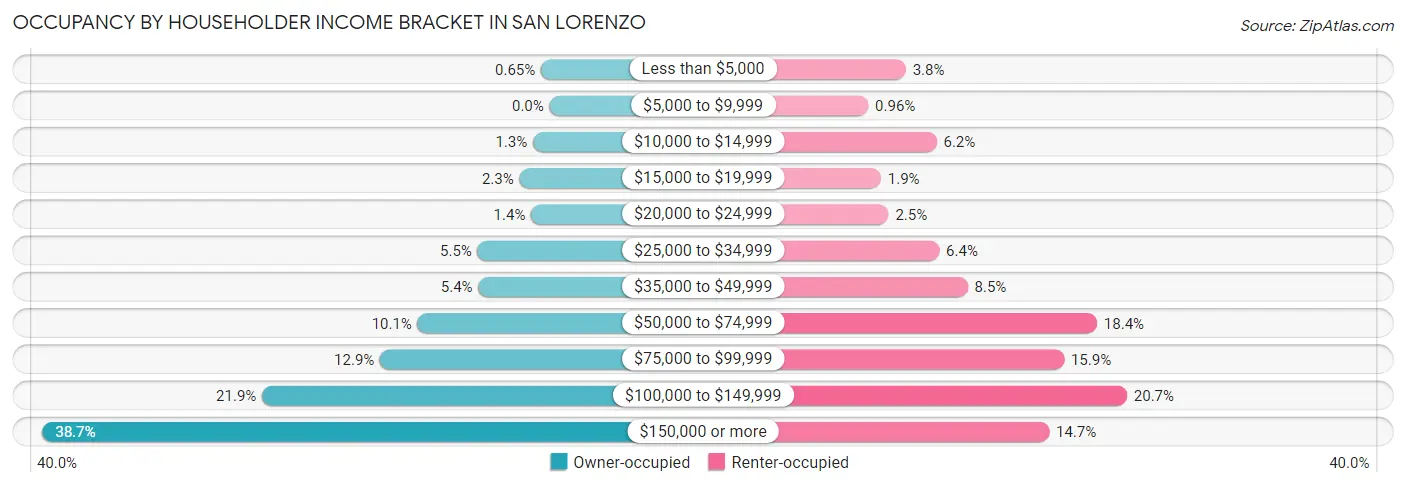
| Income Bracket | Owner-occupied | Renter-occupied |
| Less than $5,000 | 38 (0.6%) | 111 (3.8%) |
| $5,000 to $9,999 | 0 (0.0%) | 28 (1.0%) |
| $10,000 to $14,999 | 74 (1.3%) | 179 (6.2%) |
| $15,000 to $19,999 | 134 (2.3%) | 56 (1.9%) |
| $20,000 to $24,999 | 82 (1.4%) | 73 (2.5%) |
| $25,000 to $34,999 | 321 (5.5%) | 185 (6.4%) |
| $35,000 to $49,999 | 318 (5.4%) | 248 (8.5%) |
| $50,000 to $74,999 | 589 (10.1%) | 534 (18.4%) |
| $75,000 to $99,999 | 757 (12.9%) | 461 (15.9%) |
| $100,000 to $149,999 | 1,284 (21.9%) | 600 (20.7%) |
| $150,000 or more | 2,266 (38.7%) | 428 (14.7%) |
| Total | 5,863 (100.0%) | 2,903 (100.0%) |
Monthly Housing Cost Tiers in San Lorenzo
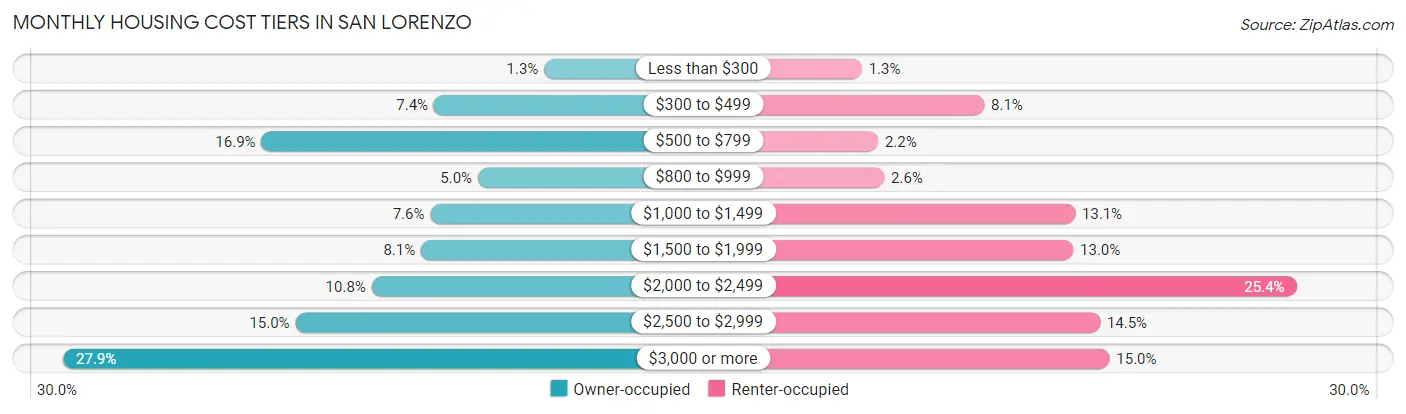
| Monthly Cost | Owner-occupied | Renter-occupied |
| Less than $300 | 76 (1.3%) | 39 (1.3%) |
| $300 to $499 | 433 (7.4%) | 235 (8.1%) |
| $500 to $799 | 992 (16.9%) | 65 (2.2%) |
| $800 to $999 | 291 (5.0%) | 75 (2.6%) |
| $1,000 to $1,499 | 445 (7.6%) | 381 (13.1%) |
| $1,500 to $1,999 | 475 (8.1%) | 378 (13.0%) |
| $2,000 to $2,499 | 635 (10.8%) | 736 (25.4%) |
| $2,500 to $2,999 | 882 (15.0%) | 421 (14.5%) |
| $3,000 or more | 1,634 (27.9%) | 436 (15.0%) |
| Total | 5,863 (100.0%) | 2,903 (100.0%) |
Physical Housing Characteristics in San Lorenzo
Housing Structures in San Lorenzo
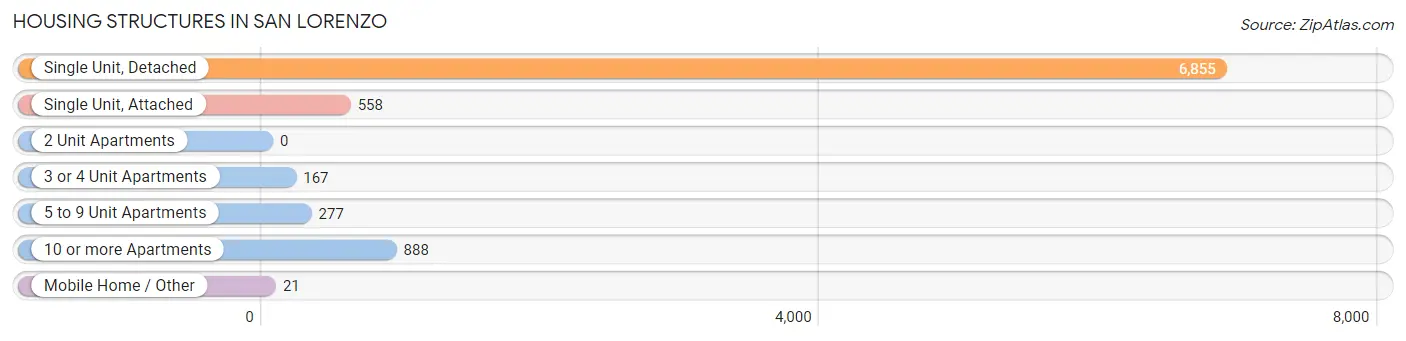
| Structure Type | # Housing Units | % Housing Units |
| Single Unit, Detached | 6,855 | 78.2% |
| Single Unit, Attached | 558 | 6.4% |
| 2 Unit Apartments | 0 | 0.0% |
| 3 or 4 Unit Apartments | 167 | 1.9% |
| 5 to 9 Unit Apartments | 277 | 3.2% |
| 10 or more Apartments | 888 | 10.1% |
| Mobile Home / Other | 21 | 0.2% |
| Total | 8,766 | 100.0% |
Housing Structures by Occupancy in San Lorenzo
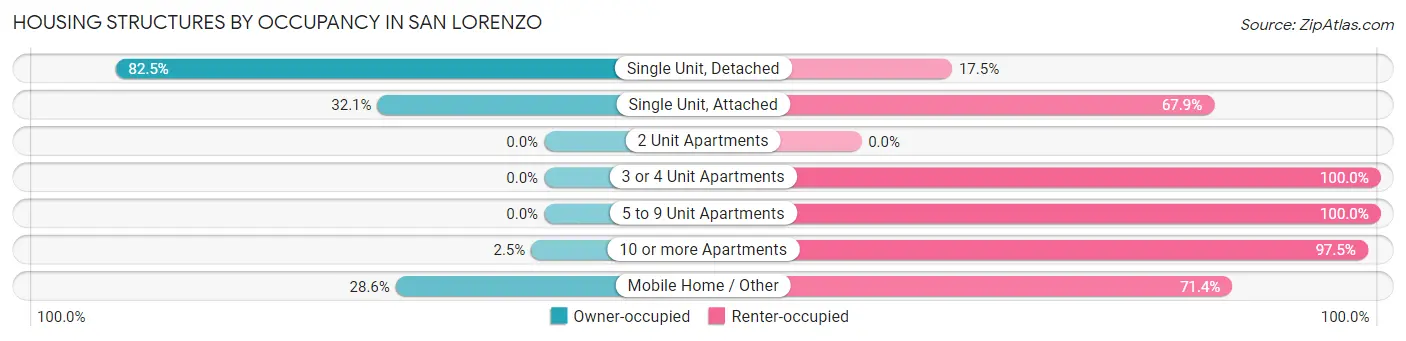
| Structure Type | Owner-occupied | Renter-occupied |
| Single Unit, Detached | 5,656 (82.5%) | 1,199 (17.5%) |
| Single Unit, Attached | 179 (32.1%) | 379 (67.9%) |
| 2 Unit Apartments | 0 (0.0%) | 0 (0.0%) |
| 3 or 4 Unit Apartments | 0 (0.0%) | 167 (100.0%) |
| 5 to 9 Unit Apartments | 0 (0.0%) | 277 (100.0%) |
| 10 or more Apartments | 22 (2.5%) | 866 (97.5%) |
| Mobile Home / Other | 6 (28.6%) | 15 (71.4%) |
| Total | 5,863 (66.9%) | 2,903 (33.1%) |
Housing Structures by Number of Rooms in San Lorenzo
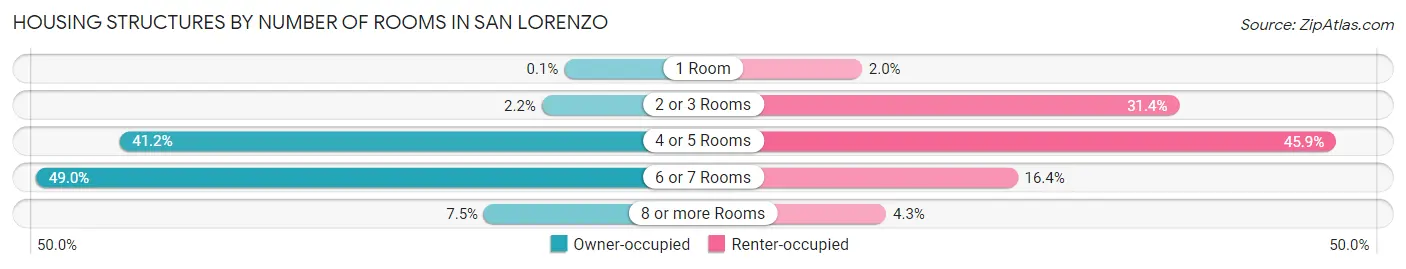
| Number of Rooms | Owner-occupied | Renter-occupied |
| 1 Room | 6 (0.1%) | 59 (2.0%) |
| 2 or 3 Rooms | 128 (2.2%) | 911 (31.4%) |
| 4 or 5 Rooms | 2,418 (41.2%) | 1,332 (45.9%) |
| 6 or 7 Rooms | 2,870 (48.9%) | 477 (16.4%) |
| 8 or more Rooms | 441 (7.5%) | 124 (4.3%) |
| Total | 5,863 (100.0%) | 2,903 (100.0%) |
Housing Structure by Heating Type in San Lorenzo
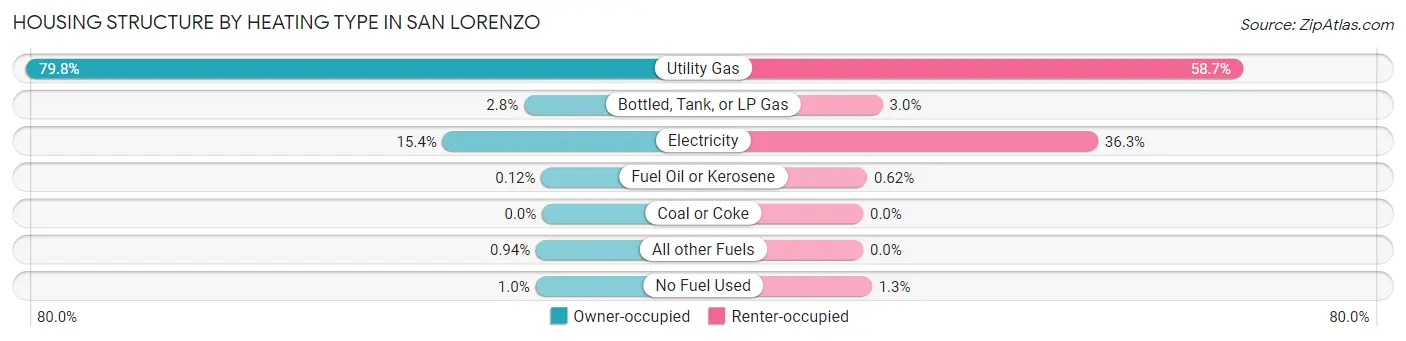
| Heating Type | Owner-occupied | Renter-occupied |
| Utility Gas | 4,676 (79.7%) | 1,704 (58.7%) |
| Bottled, Tank, or LP Gas | 164 (2.8%) | 88 (3.0%) |
| Electricity | 901 (15.4%) | 1,054 (36.3%) |
| Fuel Oil or Kerosene | 7 (0.1%) | 18 (0.6%) |
| Coal or Coke | 0 (0.0%) | 0 (0.0%) |
| All other Fuels | 55 (0.9%) | 0 (0.0%) |
| No Fuel Used | 60 (1.0%) | 39 (1.3%) |
| Total | 5,863 (100.0%) | 2,903 (100.0%) |
Household Vehicle Usage in San Lorenzo
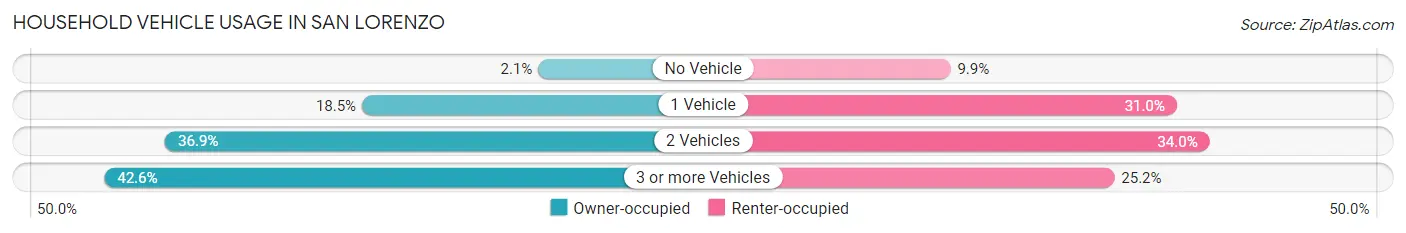
| Vehicles per Household | Owner-occupied | Renter-occupied |
| No Vehicle | 121 (2.1%) | 286 (9.9%) |
| 1 Vehicle | 1,085 (18.5%) | 899 (31.0%) |
| 2 Vehicles | 2,162 (36.9%) | 988 (34.0%) |
| 3 or more Vehicles | 2,495 (42.6%) | 730 (25.2%) |
| Total | 5,863 (100.0%) | 2,903 (100.0%) |
Real Estate & Mortgages in San Lorenzo
Real Estate and Mortgage Overview in San Lorenzo
| Characteristic | Without Mortgage | With Mortgage |
| Housing Units | 1,874 | 3,989 |
| Median Property Value | $767,100 | $809,000 |
| Median Household Income | $82,917 | $1,815 |
| Monthly Housing Costs | $659 | $1,634 |
| Real Estate Taxes | $4,167 | $2 |
Property Value by Mortgage Status in San Lorenzo
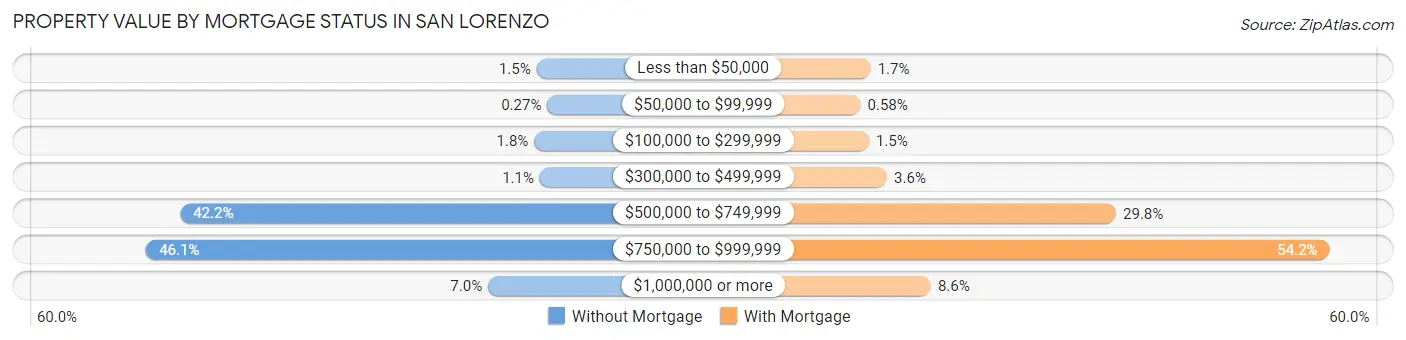
| Property Value | Without Mortgage | With Mortgage |
| Less than $50,000 | 28 (1.5%) | 69 (1.7%) |
| $50,000 to $99,999 | 5 (0.3%) | 23 (0.6%) |
| $100,000 to $299,999 | 33 (1.8%) | 61 (1.5%) |
| $300,000 to $499,999 | 21 (1.1%) | 144 (3.6%) |
| $500,000 to $749,999 | 791 (42.2%) | 1,188 (29.8%) |
| $750,000 to $999,999 | 864 (46.1%) | 2,160 (54.1%) |
| $1,000,000 or more | 132 (7.0%) | 344 (8.6%) |
| Total | 1,874 (100.0%) | 3,989 (100.0%) |
Household Income by Mortgage Status in San Lorenzo
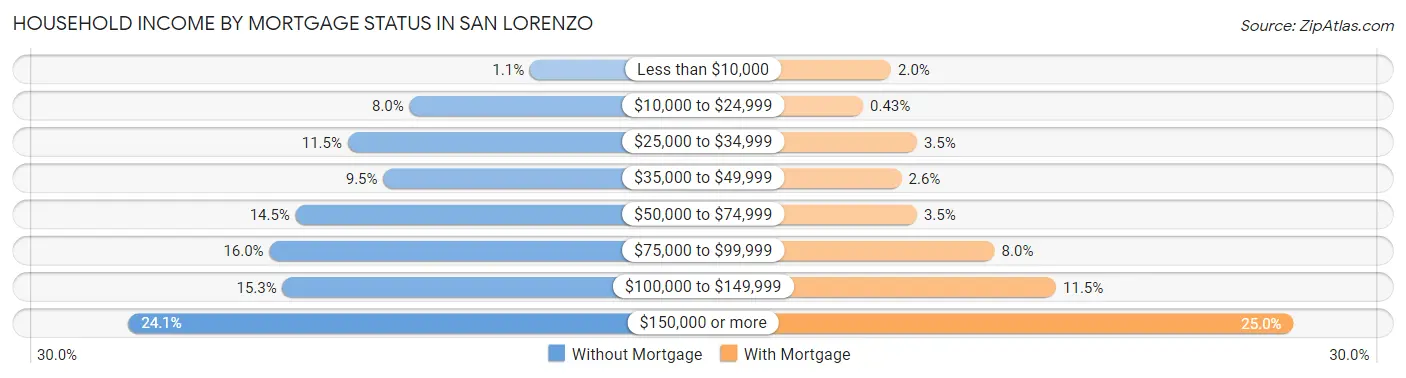
| Household Income | Without Mortgage | With Mortgage |
| Less than $10,000 | 21 (1.1%) | 81 (2.0%) |
| $10,000 to $24,999 | 150 (8.0%) | 17 (0.4%) |
| $25,000 to $34,999 | 216 (11.5%) | 140 (3.5%) |
| $35,000 to $49,999 | 178 (9.5%) | 105 (2.6%) |
| $50,000 to $74,999 | 272 (14.5%) | 140 (3.5%) |
| $75,000 to $99,999 | 300 (16.0%) | 317 (8.0%) |
| $100,000 to $149,999 | 286 (15.3%) | 457 (11.5%) |
| $150,000 or more | 451 (24.1%) | 998 (25.0%) |
| Total | 1,874 (100.0%) | 3,989 (100.0%) |
Property Value to Household Income Ratio in San Lorenzo
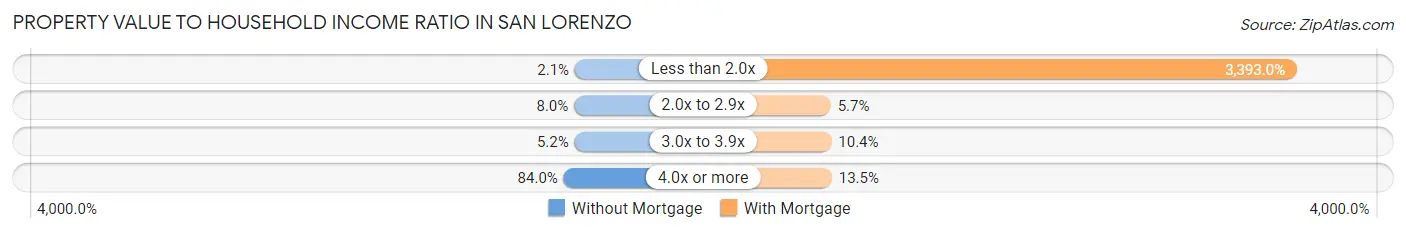
| Value-to-Income Ratio | Without Mortgage | With Mortgage |
| Less than 2.0x | 40 (2.1%) | 135,347 (3,393.0%) |
| 2.0x to 2.9x | 150 (8.0%) | 226 (5.7%) |
| 3.0x to 3.9x | 97 (5.2%) | 413 (10.3%) |
| 4.0x or more | 1,574 (84.0%) | 540 (13.5%) |
| Total | 1,874 (100.0%) | 3,989 (100.0%) |
Real Estate Taxes by Mortgage Status in San Lorenzo
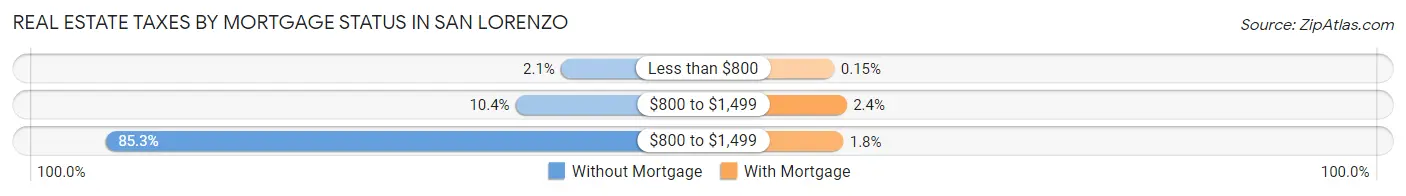
| Property Taxes | Without Mortgage | With Mortgage |
| Less than $800 | 39 (2.1%) | 6 (0.2%) |
| $800 to $1,499 | 194 (10.3%) | 96 (2.4%) |
| $800 to $1,499 | 1,598 (85.3%) | 71 (1.8%) |
| Total | 1,874 (100.0%) | 3,989 (100.0%) |
Health & Disability in San Lorenzo
Health Insurance Coverage by Age in San Lorenzo
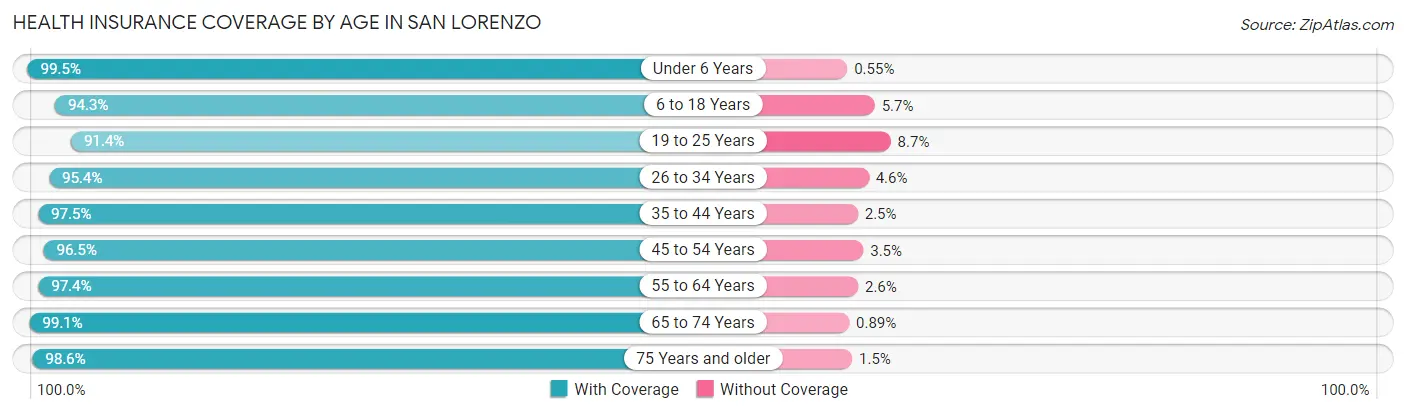
| Age Bracket | With Coverage | Without Coverage |
| Under 6 Years | 1,977 (99.5%) | 11 (0.5%) |
| 6 to 18 Years | 3,905 (94.3%) | 235 (5.7%) |
| 19 to 25 Years | 2,059 (91.3%) | 195 (8.6%) |
| 26 to 34 Years | 4,039 (95.4%) | 193 (4.6%) |
| 35 to 44 Years | 3,630 (97.5%) | 94 (2.5%) |
| 45 to 54 Years | 3,955 (96.5%) | 145 (3.5%) |
| 55 to 64 Years | 4,411 (97.4%) | 116 (2.6%) |
| 65 to 74 Years | 2,904 (99.1%) | 26 (0.9%) |
| 75 Years and older | 1,694 (98.6%) | 25 (1.5%) |
| Total | 28,574 (96.5%) | 1,040 (3.5%) |
Health Insurance Coverage by Citizenship Status in San Lorenzo
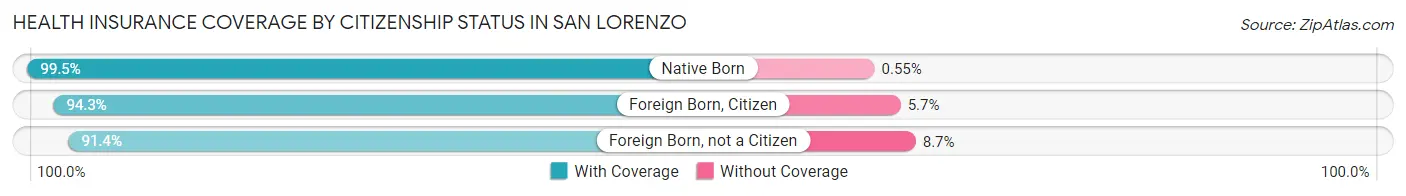
| Citizenship Status | With Coverage | Without Coverage |
| Native Born | 1,977 (99.5%) | 11 (0.5%) |
| Foreign Born, Citizen | 3,905 (94.3%) | 235 (5.7%) |
| Foreign Born, not a Citizen | 2,059 (91.3%) | 195 (8.6%) |
Health Insurance Coverage by Household Income in San Lorenzo
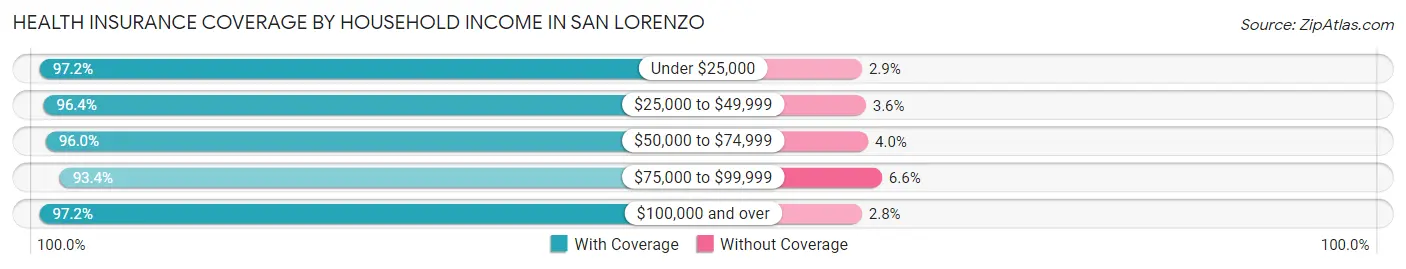
| Household Income | With Coverage | Without Coverage |
| Under $25,000 | 1,193 (97.2%) | 35 (2.9%) |
| $25,000 to $49,999 | 2,382 (96.4%) | 88 (3.6%) |
| $50,000 to $74,999 | 2,837 (96.0%) | 118 (4.0%) |
| $75,000 to $99,999 | 3,874 (93.4%) | 273 (6.6%) |
| $100,000 and over | 18,112 (97.2%) | 525 (2.8%) |
Public vs Private Health Insurance Coverage by Age in San Lorenzo
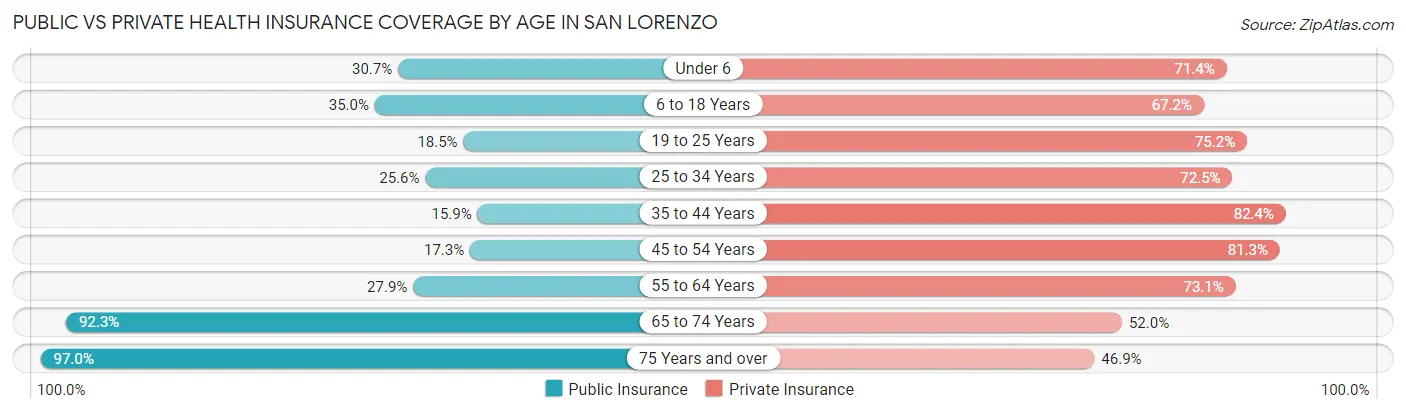
| Age Bracket | Public Insurance | Private Insurance |
| Under 6 | 610 (30.7%) | 1,420 (71.4%) |
| 6 to 18 Years | 1,449 (35.0%) | 2,782 (67.2%) |
| 19 to 25 Years | 418 (18.5%) | 1,695 (75.2%) |
| 25 to 34 Years | 1,084 (25.6%) | 3,068 (72.5%) |
| 35 to 44 Years | 593 (15.9%) | 3,069 (82.4%) |
| 45 to 54 Years | 710 (17.3%) | 3,333 (81.3%) |
| 55 to 64 Years | 1,262 (27.9%) | 3,309 (73.1%) |
| 65 to 74 Years | 2,705 (92.3%) | 1,524 (52.0%) |
| 75 Years and over | 1,668 (97.0%) | 806 (46.9%) |
| Total | 10,499 (35.4%) | 21,006 (70.9%) |
Disability Status by Sex by Age in San Lorenzo
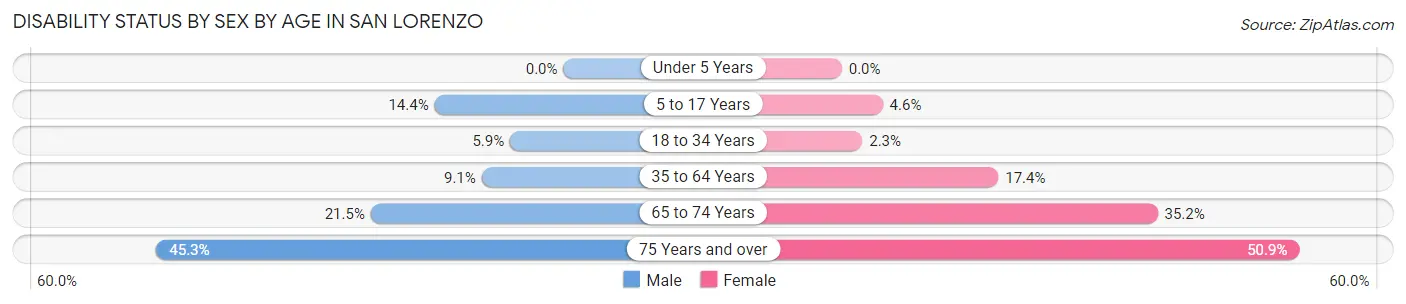
| Age Bracket | Male | Female |
| Under 5 Years | 0 (0.0%) | 0 (0.0%) |
| 5 to 17 Years | 298 (14.3%) | 88 (4.5%) |
| 18 to 34 Years | 214 (5.9%) | 76 (2.3%) |
| 35 to 64 Years | 564 (9.1%) | 1,072 (17.4%) |
| 65 to 74 Years | 296 (21.4%) | 545 (35.2%) |
| 75 Years and over | 271 (45.3%) | 571 (50.9%) |
Disability Class by Sex by Age in San Lorenzo
Disability Class: Hearing Difficulty
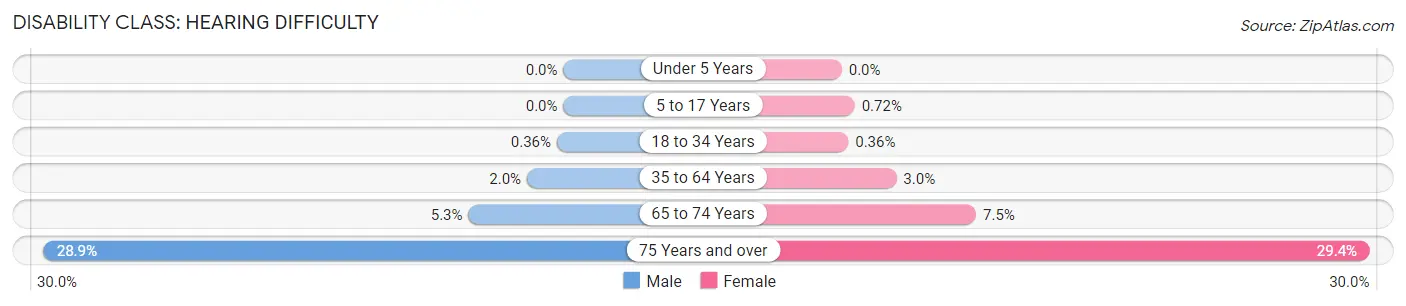
| Age Bracket | Male | Female |
| Under 5 Years | 0 (0.0%) | 0 (0.0%) |
| 5 to 17 Years | 0 (0.0%) | 14 (0.7%) |
| 18 to 34 Years | 13 (0.4%) | 12 (0.4%) |
| 35 to 64 Years | 126 (2.0%) | 187 (3.0%) |
| 65 to 74 Years | 73 (5.3%) | 116 (7.5%) |
| 75 Years and over | 173 (28.9%) | 329 (29.3%) |
Disability Class: Vision Difficulty
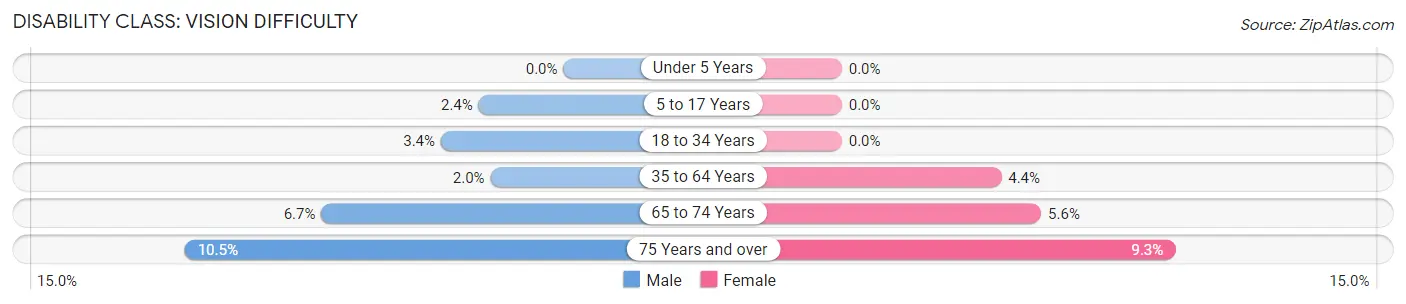
| Age Bracket | Male | Female |
| Under 5 Years | 0 (0.0%) | 0 (0.0%) |
| 5 to 17 Years | 49 (2.4%) | 0 (0.0%) |
| 18 to 34 Years | 123 (3.4%) | 0 (0.0%) |
| 35 to 64 Years | 126 (2.0%) | 273 (4.4%) |
| 65 to 74 Years | 93 (6.7%) | 86 (5.6%) |
| 75 Years and over | 63 (10.5%) | 104 (9.3%) |
Disability Class: Cognitive Difficulty
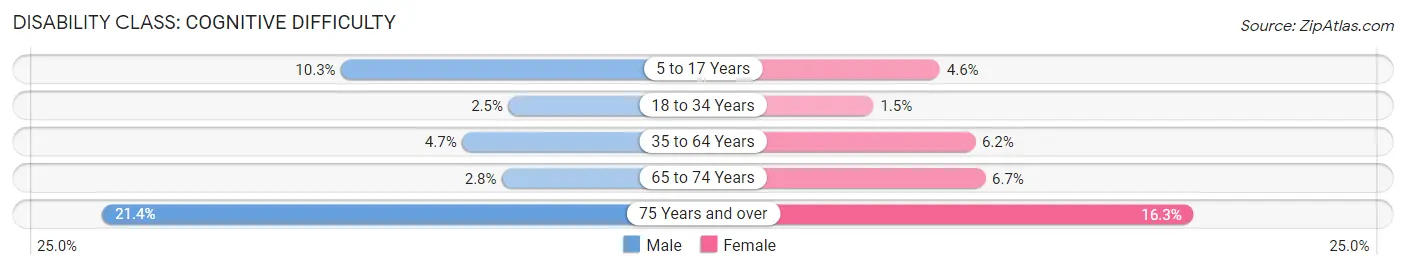
| Age Bracket | Male | Female |
| 5 to 17 Years | 214 (10.3%) | 88 (4.5%) |
| 18 to 34 Years | 91 (2.5%) | 49 (1.5%) |
| 35 to 64 Years | 290 (4.7%) | 380 (6.2%) |
| 65 to 74 Years | 39 (2.8%) | 103 (6.7%) |
| 75 Years and over | 128 (21.4%) | 183 (16.3%) |
Disability Class: Ambulatory Difficulty
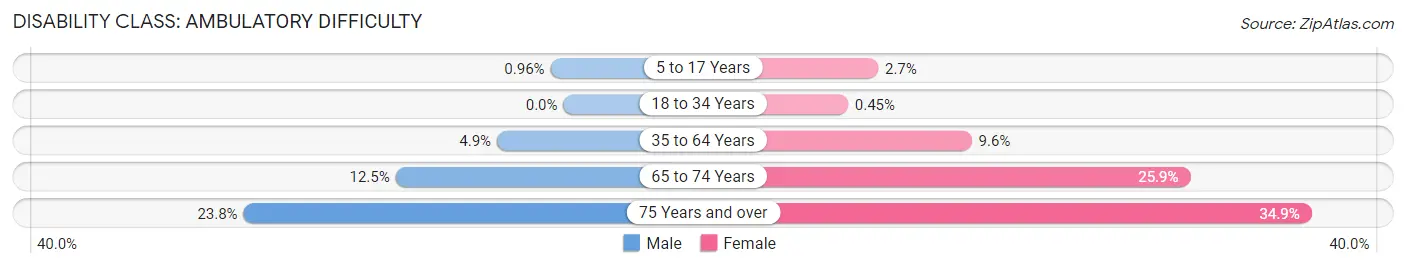
| Age Bracket | Male | Female |
| 5 to 17 Years | 20 (1.0%) | 52 (2.7%) |
| 18 to 34 Years | 0 (0.0%) | 15 (0.4%) |
| 35 to 64 Years | 306 (4.9%) | 593 (9.6%) |
| 65 to 74 Years | 172 (12.5%) | 401 (25.9%) |
| 75 Years and over | 142 (23.7%) | 391 (34.9%) |
Disability Class: Self-Care Difficulty
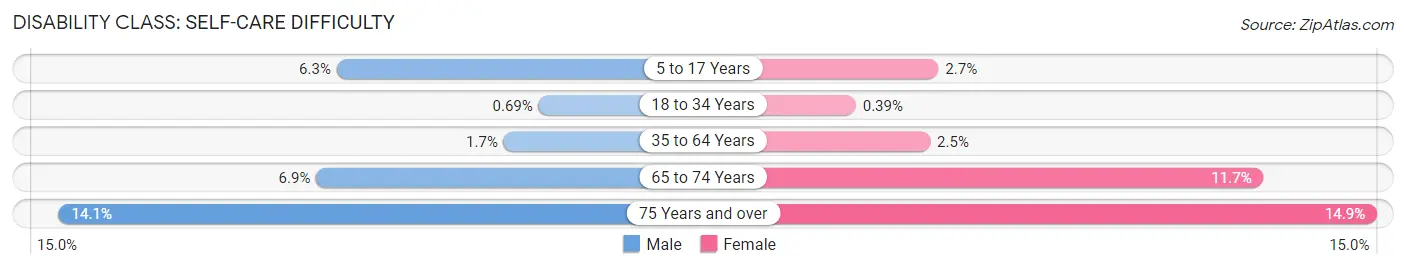
| Age Bracket | Male | Female |
| 5 to 17 Years | 131 (6.3%) | 52 (2.7%) |
| 18 to 34 Years | 25 (0.7%) | 13 (0.4%) |
| 35 to 64 Years | 103 (1.7%) | 151 (2.5%) |
| 65 to 74 Years | 95 (6.9%) | 182 (11.7%) |
| 75 Years and over | 84 (14.1%) | 167 (14.9%) |
Technology Access in San Lorenzo
Computing Device Access in San Lorenzo
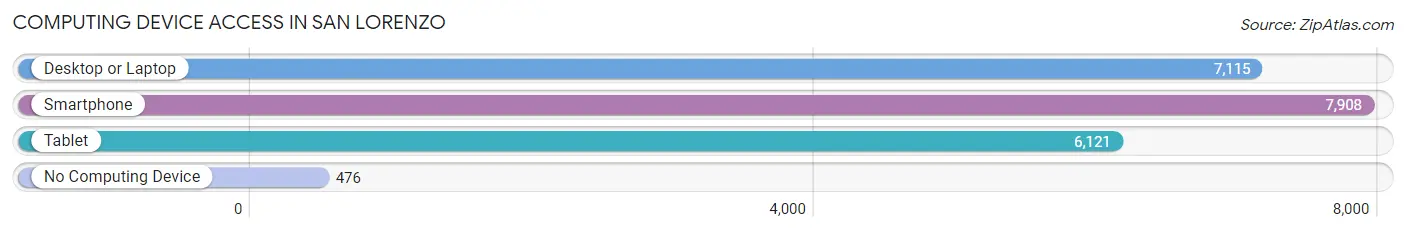
| Device Type | # Households | % Households |
| Desktop or Laptop | 7,115 | 81.2% |
| Smartphone | 7,908 | 90.2% |
| Tablet | 6,121 | 69.8% |
| No Computing Device | 476 | 5.4% |
| Total | 8,766 | 100.0% |
Internet Access in San Lorenzo
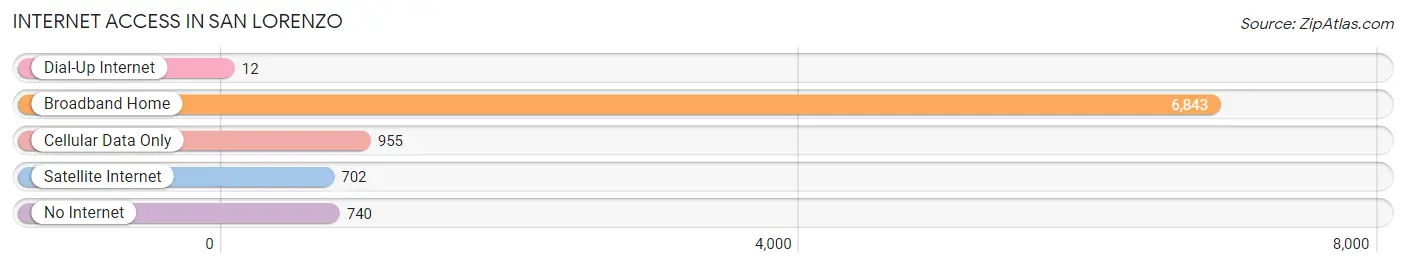
| Internet Type | # Households | % Households |
| Dial-Up Internet | 12 | 0.1% |
| Broadband Home | 6,843 | 78.1% |
| Cellular Data Only | 955 | 10.9% |
| Satellite Internet | 702 | 8.0% |
| No Internet | 740 | 8.4% |
| Total | 8,766 | 100.0% |
San Lorenzo Summary
History
San Lorenzo is a census-designated place located in Alameda County, California. It is situated in the San Francisco Bay Area and is part of the East Bay region. The area was originally inhabited by the Ohlone people, who were the first inhabitants of the area. The first European settlers arrived in the area in the late 1700s, and the area was eventually incorporated into the Rancho San Lorenzo land grant in 1834.
The area was originally known as “Coyote” and was a small farming community. In the late 1800s, the area began to grow and develop as a result of the construction of the San Francisco and San Jose Railroad. This allowed for the transportation of goods and people to and from the area. The area was eventually renamed San Lorenzo in 1874, and the town was officially incorporated in 1925.
Geography
San Lorenzo is located in Alameda County, California, and is situated in the San Francisco Bay Area. It is bordered by Hayward to the north, San Leandro to the east, and Castro Valley to the south. The area is located at an elevation of about 50 feet above sea level. The total area of San Lorenzo is 4.2 square miles, and the population was estimated to be 24,817 in 2019.
The climate in San Lorenzo is mild and temperate, with warm summers and cool winters. The average annual temperature is around 60 degrees Fahrenheit, and the average annual precipitation is around 20 inches.
Economy
San Lorenzo’s economy is largely based on retail and services. The area is home to several large retail stores, including Target, Walmart, and Home Depot. There are also several restaurants and other businesses in the area.
The area is also home to several industrial and manufacturing businesses, including the San Lorenzo Manufacturing Company, which produces a variety of products, including furniture, clothing, and electronics.
Demographics
As of 2019, the population of San Lorenzo was estimated to be 24,817. The racial makeup of the area was 44.3% White, 4.2% African American, 0.7% Native American, 28.2% Asian, 0.3% Pacific Islander, and 22.3% from other races. The median household income in San Lorenzo was $76,845 in 2019. The median age of the population was 38.7 years.
The area is also home to a large Hispanic population, with 44.3% of the population identifying as Hispanic or Latino. The majority of the population speaks English as their primary language, with Spanish being the second most common language spoken.
Conclusion
San Lorenzo is a census-designated place located in Alameda County, California. It is situated in the San Francisco Bay Area and is part of the East Bay region. The area was originally inhabited by the Ohlone people, and was eventually incorporated into the Rancho San Lorenzo land grant in 1834. The area was originally known as “Coyote” and was a small farming community. In the late 1800s, the area began to grow and develop as a result of the construction of the San Francisco and San Jose Railroad. The population of San Lorenzo was estimated to be 24,817 in 2019, and the median household income was $76,845. The area is home to several large retail stores, industrial and manufacturing businesses, and a large Hispanic population.
Common Questions
What is Per Capita Income in San Lorenzo?
Per Capita income in San Lorenzo is $39,145.
What is the Median Family Income in San Lorenzo?
Median Family Income in San Lorenzo is $109,464.
What is the Median Household income in San Lorenzo?
Median Household Income in San Lorenzo is $102,860.
What is Income or Wage Gap in San Lorenzo?
Income or Wage Gap in San Lorenzo is 23.7%.
Women in San Lorenzo earn 76.3 cents for every dollar earned by a man.
What is Inequality or Gini Index in San Lorenzo?
Inequality or Gini Index in San Lorenzo is 0.39.
What is the Total Population of San Lorenzo?
Total Population of San Lorenzo is 29,759.
What is the Total Male Population of San Lorenzo?
Total Male Population of San Lorenzo is 14,892.
What is the Total Female Population of San Lorenzo?
Total Female Population of San Lorenzo is 14,867.
What is the Ratio of Males per 100 Females in San Lorenzo?
There are 100.17 Males per 100 Females in San Lorenzo.
What is the Ratio of Females per 100 Males in San Lorenzo?
There are 99.83 Females per 100 Males in San Lorenzo.
What is the Median Population Age in San Lorenzo?
Median Population Age in San Lorenzo is 40.1 Years.
What is the Average Family Size in San Lorenzo
Average Family Size in San Lorenzo is 3.8 People.
What is the Average Household Size in San Lorenzo
Average Household Size in San Lorenzo is 3.4 People.
How Large is the Labor Force in San Lorenzo?
There are 16,180 People in the Labor Forcein in San Lorenzo.
What is the Percentage of People in the Labor Force in San Lorenzo?
65.5% of People are in the Labor Force in San Lorenzo.
What is the Unemployment Rate in San Lorenzo?
Unemployment Rate in San Lorenzo is 5.5%.