San Joaquin, CA Map & Demographics
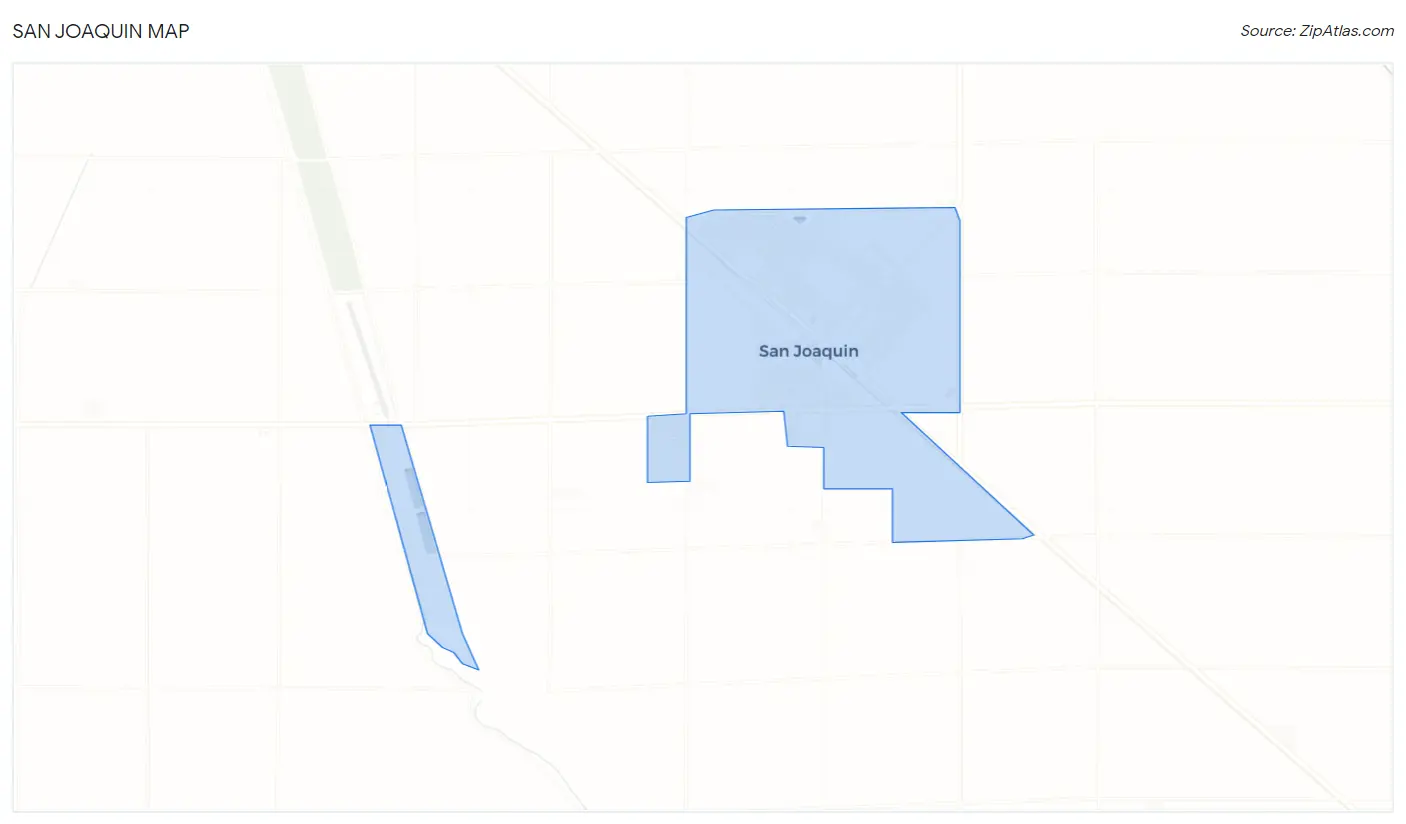
San Joaquin Map
San Joaquin Overview
$13,002
PER CAPITA INCOME
$47,875
AVG FAMILY INCOME
$43,750
AVG HOUSEHOLD INCOME
26.3%
WAGE / INCOME GAP [ % ]
73.7¢/ $1
WAGE / INCOME GAP [ $ ]
$7,706
FAMILY INCOME DEFICIT
0.43
INEQUALITY / GINI INDEX
3,725
TOTAL POPULATION
1,785
MALE POPULATION
1,940
FEMALE POPULATION
92.01
MALES / 100 FEMALES
108.68
FEMALES / 100 MALES
24.5
MEDIAN AGE
4.8
AVG FAMILY SIZE
4.6
AVG HOUSEHOLD SIZE
1,264
LABOR FORCE [ PEOPLE ]
52.5%
PERCENT IN LABOR FORCE
18.9%
UNEMPLOYMENT RATE
San Joaquin Zip Codes
San Joaquin Area Codes
Income in San Joaquin
Income Overview in San Joaquin
Per Capita Income in San Joaquin is $13,002, while median incomes of families and households are $47,875 and $43,750 respectively.
| Characteristic | Number | Measure |
| Per Capita Income | 3,725 | $13,002 |
| Median Family Income | 737 | $47,875 |
| Mean Family Income | 737 | $60,422 |
| Median Household Income | 812 | $43,750 |
| Mean Household Income | 812 | $58,907 |
| Income Deficit | 737 | $7,706 |
| Wage / Income Gap (%) | 3,725 | 26.30% |
| Wage / Income Gap ($) | 3,725 | 73.70¢ per $1 |
| Gini / Inequality Index | 3,725 | 0.43 |
Earnings by Sex in San Joaquin
Average Earnings in San Joaquin are $22,209, $26,360 for men and $19,427 for women, a difference of 26.3%.
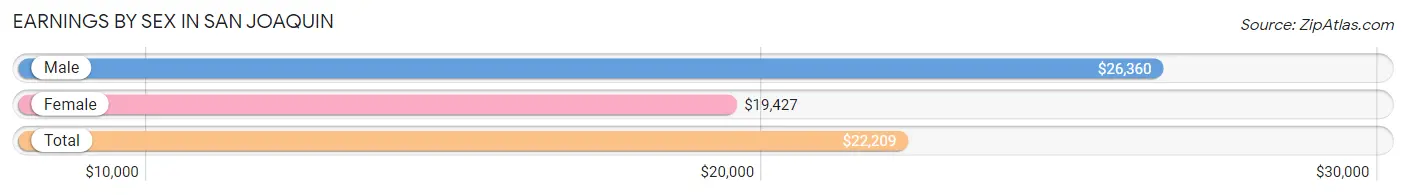
| Sex | Number | Average Earnings |
| Male | 871 (62.3%) | $26,360 |
| Female | 528 (37.7%) | $19,427 |
| Total | 1,399 (100.0%) | $22,209 |
Earnings by Sex by Income Bracket in San Joaquin
The most common earnings brackets in San Joaquin are $25,000 to $29,999 for men (168 | 19.3%) and $20,000 to $22,499 for women (93 | 17.6%).
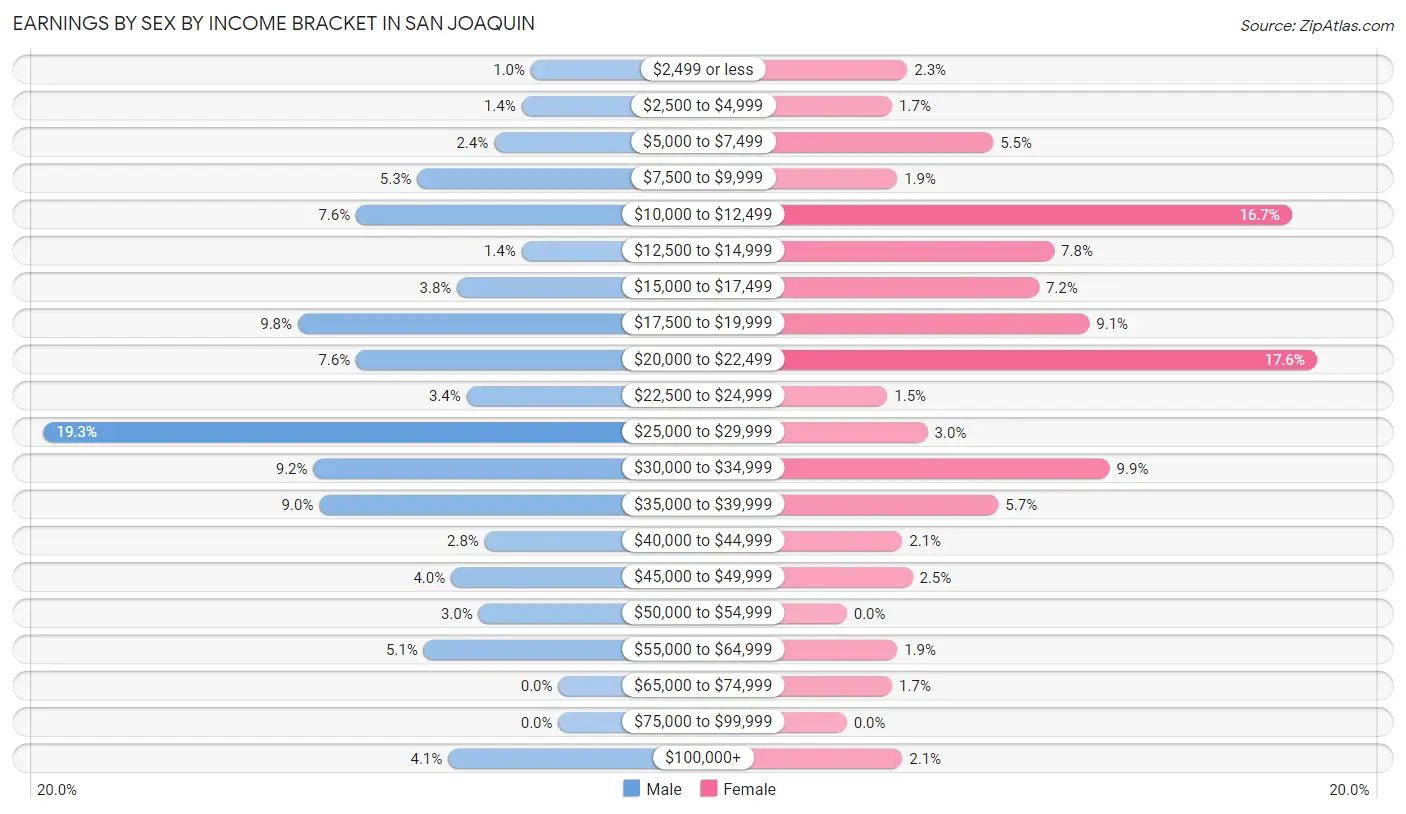
| Income | Male | Female |
| $2,499 or less | 9 (1.0%) | 12 (2.3%) |
| $2,500 to $4,999 | 12 (1.4%) | 9 (1.7%) |
| $5,000 to $7,499 | 21 (2.4%) | 29 (5.5%) |
| $7,500 to $9,999 | 46 (5.3%) | 10 (1.9%) |
| $10,000 to $12,499 | 66 (7.6%) | 88 (16.7%) |
| $12,500 to $14,999 | 12 (1.4%) | 41 (7.8%) |
| $15,000 to $17,499 | 33 (3.8%) | 38 (7.2%) |
| $17,500 to $19,999 | 85 (9.8%) | 48 (9.1%) |
| $20,000 to $22,499 | 66 (7.6%) | 93 (17.6%) |
| $22,500 to $24,999 | 30 (3.4%) | 8 (1.5%) |
| $25,000 to $29,999 | 168 (19.3%) | 16 (3.0%) |
| $30,000 to $34,999 | 80 (9.2%) | 52 (9.9%) |
| $35,000 to $39,999 | 78 (9.0%) | 30 (5.7%) |
| $40,000 to $44,999 | 24 (2.8%) | 11 (2.1%) |
| $45,000 to $49,999 | 35 (4.0%) | 13 (2.5%) |
| $50,000 to $54,999 | 26 (3.0%) | 0 (0.0%) |
| $55,000 to $64,999 | 44 (5.1%) | 10 (1.9%) |
| $65,000 to $74,999 | 0 (0.0%) | 9 (1.7%) |
| $75,000 to $99,999 | 0 (0.0%) | 0 (0.0%) |
| $100,000+ | 36 (4.1%) | 11 (2.1%) |
| Total | 871 (100.0%) | 528 (100.0%) |
Earnings by Sex by Educational Attainment in San Joaquin
Average earnings in San Joaquin are $28,371 for men and $18,906 for women, a difference of 33.4%. Men with an educational attainment of high school diploma enjoy the highest average annual earnings of $33,095, while those with less than high school education earn the least with $27,157. Women with an educational attainment of high school diploma earn the most with the average annual earnings of $20,327, while those with less than high school education have the smallest earnings of $12,955.
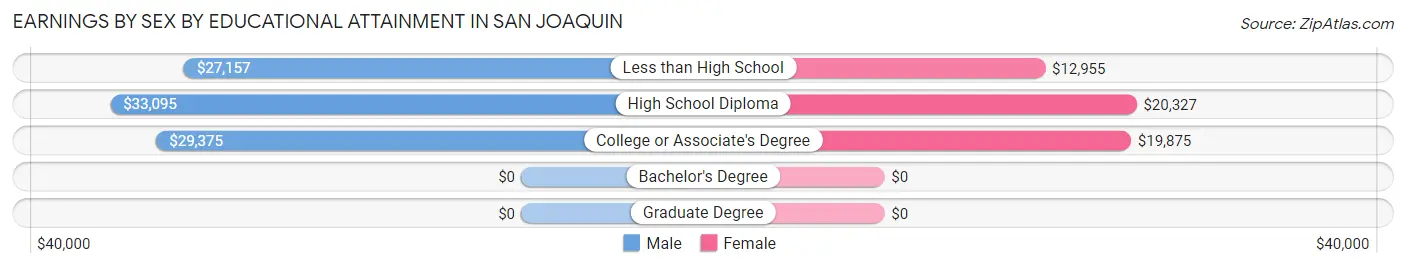
| Educational Attainment | Male Income | Female Income |
| Less than High School | $27,157 | $12,955 |
| High School Diploma | $33,095 | $20,327 |
| College or Associate's Degree | $29,375 | $19,875 |
| Bachelor's Degree | - | - |
| Graduate Degree | - | - |
| Total | $28,371 | $18,906 |
Family Income in San Joaquin
Family Income Brackets in San Joaquin
According to the San Joaquin family income data, there are 211 families falling into the $50,000 to $74,999 income range, which is the most common income bracket and makes up 28.6% of all families. Conversely, the less than $10,000 income bracket is the least frequent group with only 11 families (1.5%) belonging to this category.
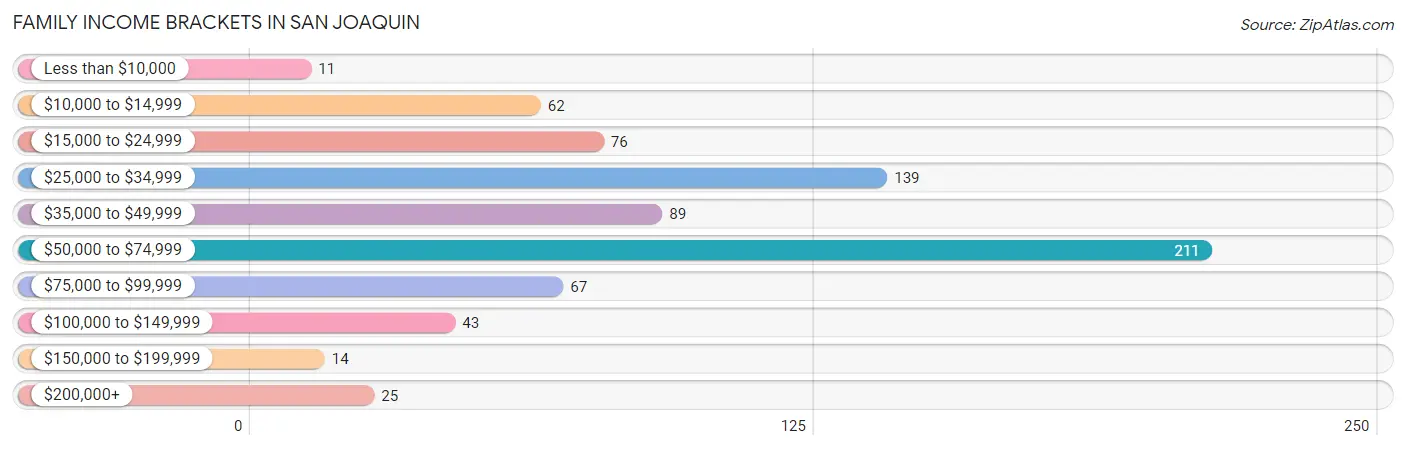
| Income Bracket | # Families | % Families |
| Less than $10,000 | 11 | 1.5% |
| $10,000 to $14,999 | 62 | 8.4% |
| $15,000 to $24,999 | 76 | 10.3% |
| $25,000 to $34,999 | 139 | 18.9% |
| $35,000 to $49,999 | 89 | 12.1% |
| $50,000 to $74,999 | 211 | 28.6% |
| $75,000 to $99,999 | 67 | 9.1% |
| $100,000 to $149,999 | 43 | 5.8% |
| $150,000 to $199,999 | 14 | 1.9% |
| $200,000+ | 25 | 3.4% |
Family Income by Famaliy Size in San Joaquin
6-person families (100 | 13.6%) account for the highest median family income in San Joaquin with $66,667 per family, while 3-person families (118 | 16.0%) have the highest median income of $17,765 per family member.
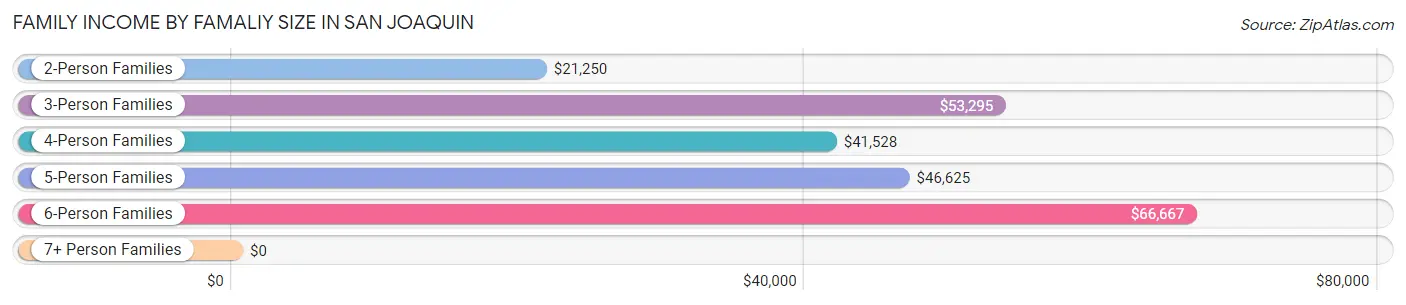
| Income Bracket | # Families | Median Income |
| 2-Person Families | 78 (10.6%) | $21,250 |
| 3-Person Families | 118 (16.0%) | $53,295 |
| 4-Person Families | 146 (19.8%) | $41,528 |
| 5-Person Families | 227 (30.8%) | $46,625 |
| 6-Person Families | 100 (13.6%) | $66,667 |
| 7+ Person Families | 68 (9.2%) | $0 |
| Total | 737 (100.0%) | $47,875 |
Family Income by Number of Earners in San Joaquin
The median family income in San Joaquin is $47,875, with families comprising 3+ earners (140) having the highest median family income of $81,429, while families with no earners (83) have the lowest median family income of $14,315, accounting for 19.0% and 11.3% of families, respectively.
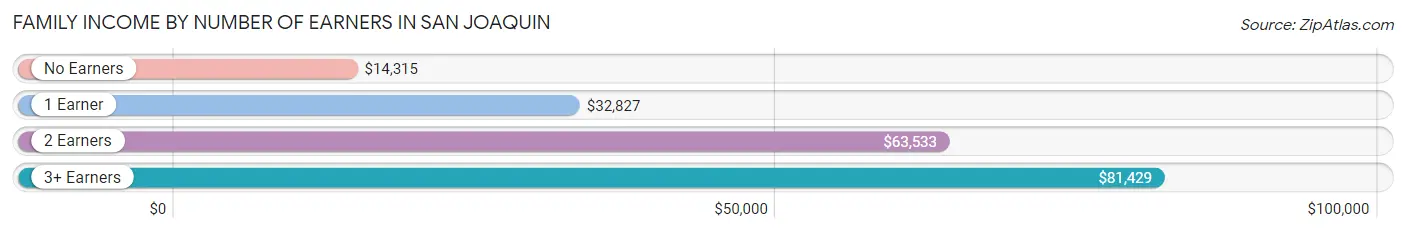
| Number of Earners | # Families | Median Income |
| No Earners | 83 (11.3%) | $14,315 |
| 1 Earner | 301 (40.8%) | $32,827 |
| 2 Earners | 213 (28.9%) | $63,533 |
| 3+ Earners | 140 (19.0%) | $81,429 |
| Total | 737 (100.0%) | $47,875 |
Household Income in San Joaquin
Household Income Brackets in San Joaquin
With 210 households falling in the category, the $50,000 to $74,999 income range is the most frequent in San Joaquin, accounting for 25.9% of all households. In contrast, only 14 households (1.7%) fall into the $150,000 to $199,999 income bracket, making it the least populous group.
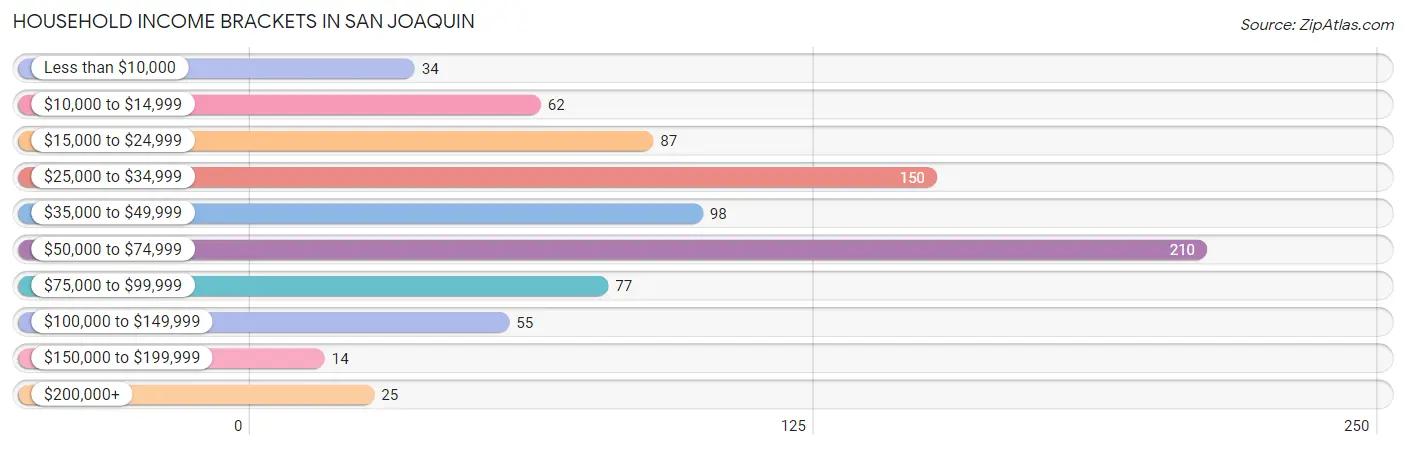
| Income Bracket | # Households | % Households |
| Less than $10,000 | 34 | 4.2% |
| $10,000 to $14,999 | 62 | 7.6% |
| $15,000 to $24,999 | 87 | 10.7% |
| $25,000 to $34,999 | 150 | 18.5% |
| $35,000 to $49,999 | 98 | 12.1% |
| $50,000 to $74,999 | 210 | 25.9% |
| $75,000 to $99,999 | 77 | 9.5% |
| $100,000 to $149,999 | 55 | 6.8% |
| $150,000 to $199,999 | 14 | 1.7% |
| $200,000+ | 25 | 3.1% |
Household Income by Householder Age in San Joaquin
The median household income in San Joaquin is $43,750, with the highest median household income of $64,882 found in the 45 to 64 years age bracket for the primary householder. A total of 303 households (37.3%) fall into this category. Meanwhile, the 15 to 24 years age bracket for the primary householder has the lowest median household income of $0, with 38 households (4.7%) in this group.
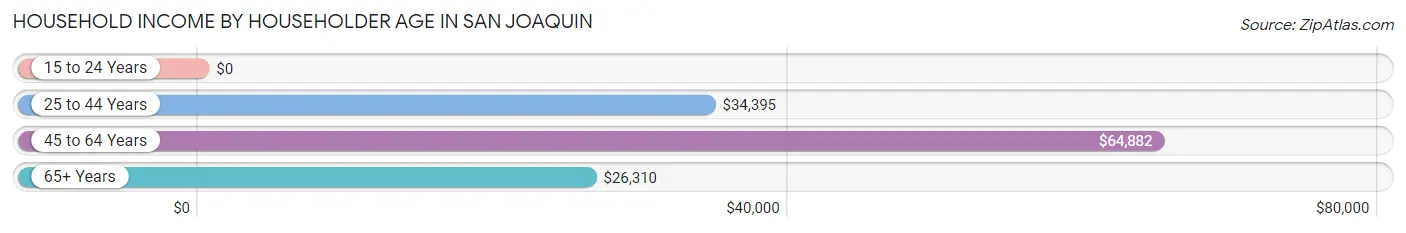
| Income Bracket | # Households | Median Income |
| 15 to 24 Years | 38 (4.7%) | $0 |
| 25 to 44 Years | 387 (47.7%) | $34,395 |
| 45 to 64 Years | 303 (37.3%) | $64,882 |
| 65+ Years | 84 (10.3%) | $26,310 |
| Total | 812 (100.0%) | $43,750 |
Poverty in San Joaquin
Income Below Poverty by Sex and Age in San Joaquin
With 30.3% poverty level for males and 35.9% for females among the residents of San Joaquin, 5 year old males and under 5 year old females are the most vulnerable to poverty, with 36 males (100.0%) and 138 females (52.1%) in their respective age groups living below the poverty level.
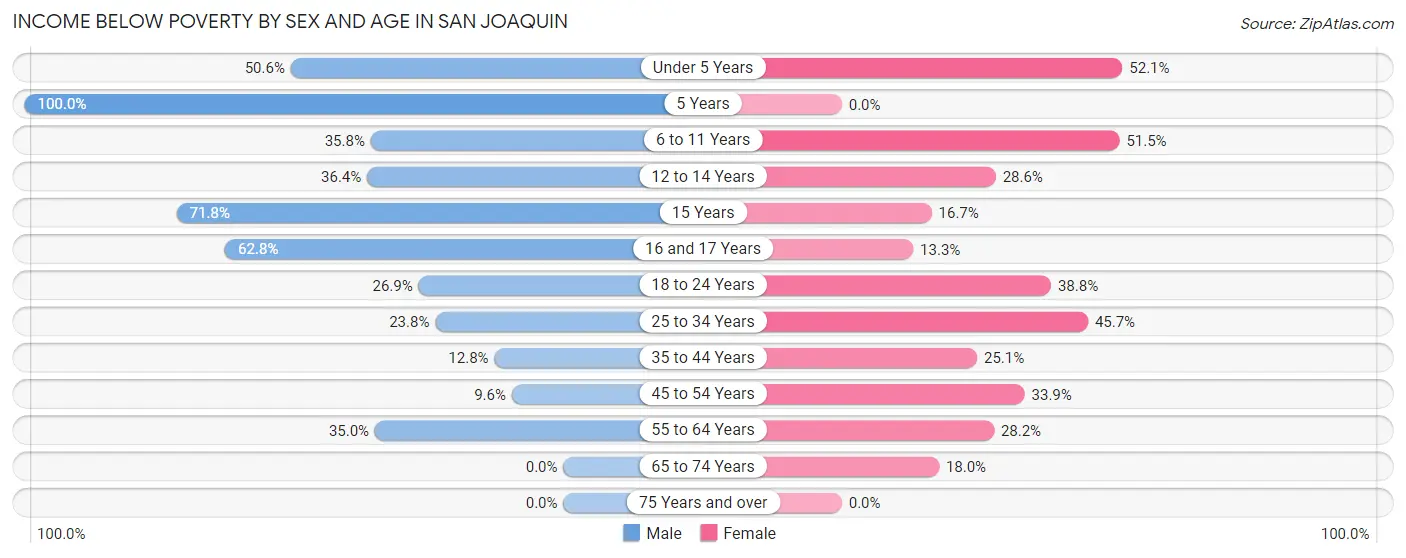
| Age Bracket | Male | Female |
| Under 5 Years | 85 (50.6%) | 138 (52.1%) |
| 5 Years | 36 (100.0%) | 0 (0.0%) |
| 6 to 11 Years | 74 (35.7%) | 134 (51.5%) |
| 12 to 14 Years | 55 (36.4%) | 36 (28.6%) |
| 15 Years | 28 (71.8%) | 11 (16.7%) |
| 16 and 17 Years | 27 (62.8%) | 11 (13.3%) |
| 18 to 24 Years | 68 (26.9%) | 80 (38.8%) |
| 25 to 34 Years | 68 (23.8%) | 122 (45.7%) |
| 35 to 44 Years | 32 (12.8%) | 60 (25.1%) |
| 45 to 54 Years | 11 (9.6%) | 57 (33.9%) |
| 55 to 64 Years | 57 (35.0%) | 37 (28.2%) |
| 65 to 74 Years | 0 (0.0%) | 11 (18.0%) |
| 75 Years and over | 0 (0.0%) | 0 (0.0%) |
| Total | 541 (30.3%) | 697 (35.9%) |
Income Above Poverty by Sex and Age in San Joaquin
According to the poverty statistics in San Joaquin, males aged 65 to 74 years and females aged 75 years and over are the age groups that are most secure financially, with 100.0% of males and 100.0% of females in these age groups living above the poverty line.
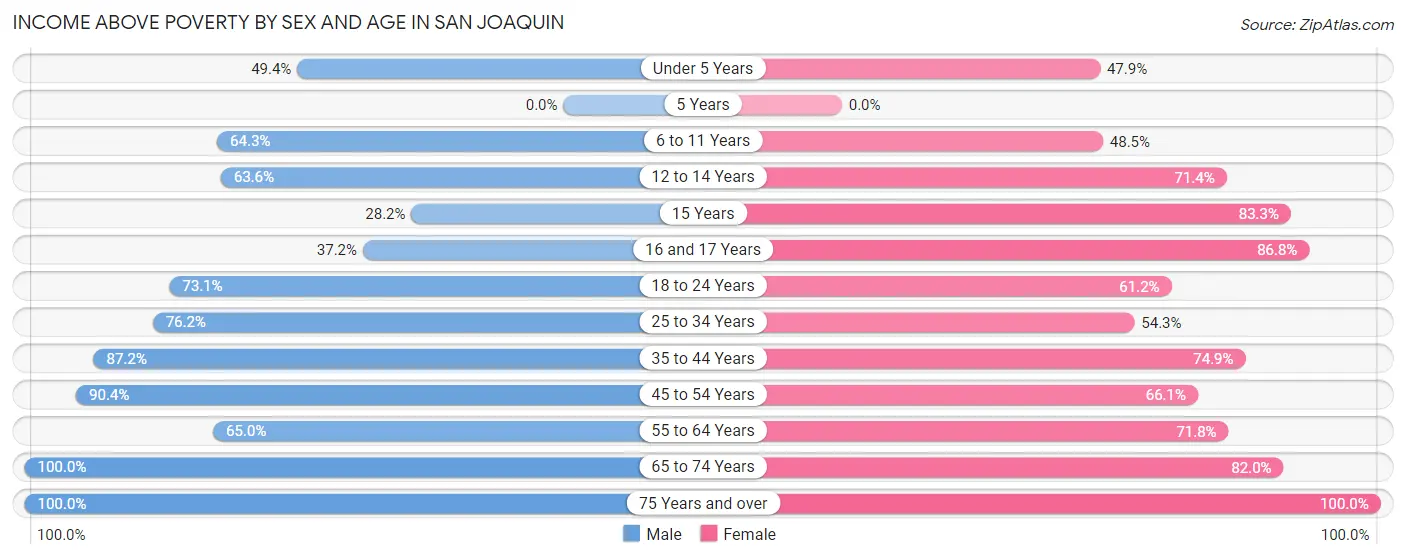
| Age Bracket | Male | Female |
| Under 5 Years | 83 (49.4%) | 127 (47.9%) |
| 5 Years | 0 (0.0%) | 0 (0.0%) |
| 6 to 11 Years | 133 (64.2%) | 126 (48.5%) |
| 12 to 14 Years | 96 (63.6%) | 90 (71.4%) |
| 15 Years | 11 (28.2%) | 55 (83.3%) |
| 16 and 17 Years | 16 (37.2%) | 72 (86.8%) |
| 18 to 24 Years | 185 (73.1%) | 126 (61.2%) |
| 25 to 34 Years | 218 (76.2%) | 145 (54.3%) |
| 35 to 44 Years | 218 (87.2%) | 179 (74.9%) |
| 45 to 54 Years | 104 (90.4%) | 111 (66.1%) |
| 55 to 64 Years | 106 (65.0%) | 94 (71.8%) |
| 65 to 74 Years | 32 (100.0%) | 50 (82.0%) |
| 75 Years and over | 42 (100.0%) | 68 (100.0%) |
| Total | 1,244 (69.7%) | 1,243 (64.1%) |
Income Below Poverty Among Married-Couple Families in San Joaquin
The poverty statistics for married-couple families in San Joaquin show that 30.7% or 157 of the total 511 families live below the poverty line. Families with 3 or 4 children have the highest poverty rate of 45.5%, comprising of 92 families. On the other hand, families with no children have the lowest poverty rate of 18.9%, which includes 20 families.
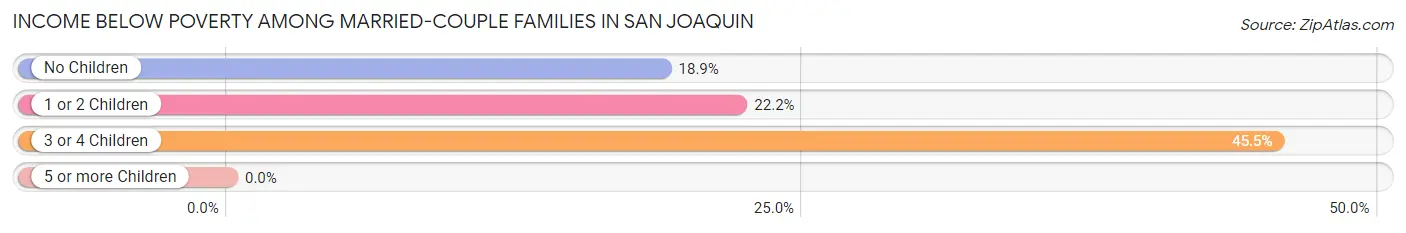
| Children | Above Poverty | Below Poverty |
| No Children | 86 (81.1%) | 20 (18.9%) |
| 1 or 2 Children | 158 (77.8%) | 45 (22.2%) |
| 3 or 4 Children | 110 (54.5%) | 92 (45.5%) |
| 5 or more Children | 0 (0.0%) | 0 (0.0%) |
| Total | 354 (69.3%) | 157 (30.7%) |
Income Below Poverty Among Single-Parent Households in San Joaquin
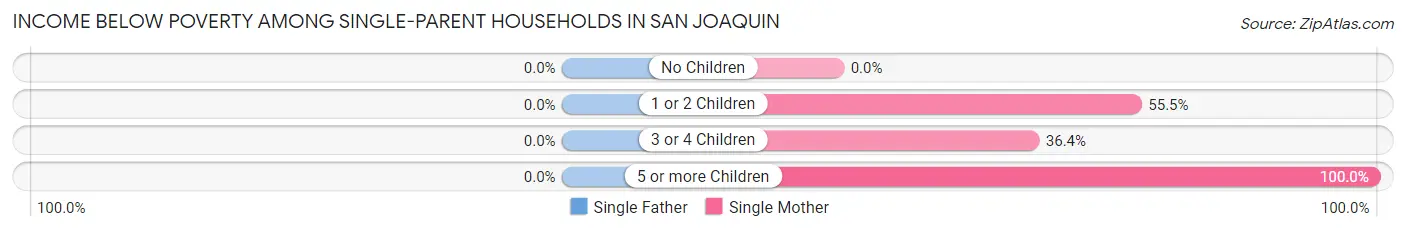
| Children | Single Father | Single Mother |
| No Children | 0 (0.0%) | 0 (0.0%) |
| 1 or 2 Children | 0 (0.0%) | 61 (55.4%) |
| 3 or 4 Children | 0 (0.0%) | 20 (36.4%) |
| 5 or more Children | 0 (0.0%) | 9 (100.0%) |
| Total | 0 (0.0%) | 90 (46.6%) |
Income Below Poverty Among Married-Couple vs Single-Parent Households in San Joaquin
The poverty data for San Joaquin shows that 157 of the married-couple family households (30.7%) and 90 of the single-parent households (39.8%) are living below the poverty level. Within the married-couple family households, those with 3 or 4 children have the highest poverty rate, with 92 households (45.5%) falling below the poverty line. Among the single-parent households, those with 5 or more children have the highest poverty rate, with 9 household (100.0%) living below poverty.
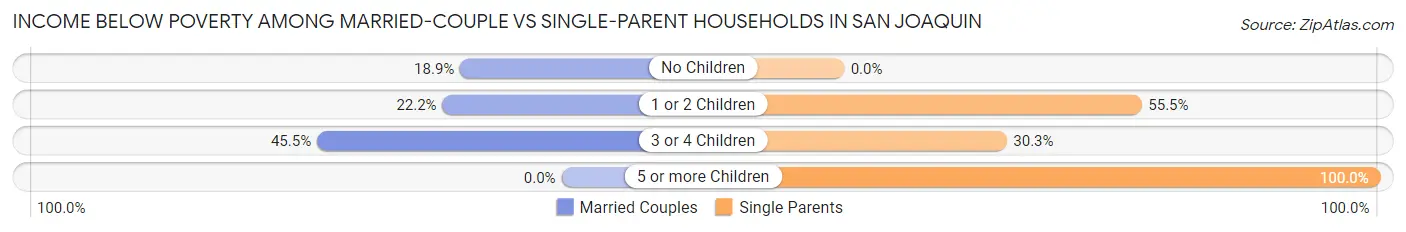
| Children | Married-Couple Families | Single-Parent Households |
| No Children | 20 (18.9%) | 0 (0.0%) |
| 1 or 2 Children | 45 (22.2%) | 61 (55.4%) |
| 3 or 4 Children | 92 (45.5%) | 20 (30.3%) |
| 5 or more Children | 0 (0.0%) | 9 (100.0%) |
| Total | 157 (30.7%) | 90 (39.8%) |
Race in San Joaquin
The most populous races in San Joaquin are Hispanic or Latino (3,539 | 95.0%), Some other Race (1,739 | 46.7%), and White / Caucasian (1,290 | 34.6%).
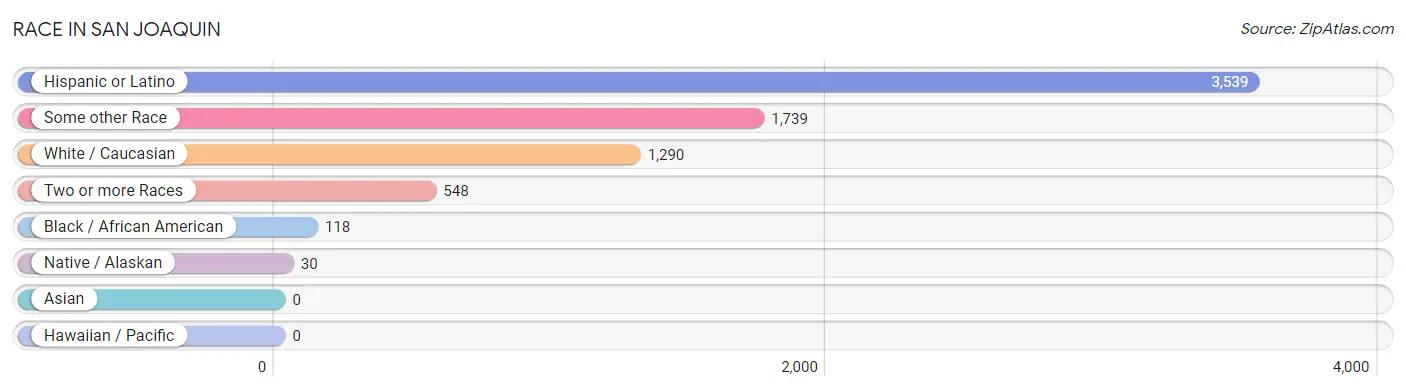
| Race | # Population | % Population |
| Asian | 0 | 0.0% |
| Black / African American | 118 | 3.2% |
| Hawaiian / Pacific | 0 | 0.0% |
| Hispanic or Latino | 3,539 | 95.0% |
| Native / Alaskan | 30 | 0.8% |
| White / Caucasian | 1,290 | 34.6% |
| Two or more Races | 548 | 14.7% |
| Some other Race | 1,739 | 46.7% |
| Total | 3,725 | 100.0% |
Ancestry in San Joaquin
The most populous ancestries reported in San Joaquin are Mexican (3,539 | 95.0%), Choctaw (48 | 1.3%), German (48 | 1.3%), and Arab (32 | 0.9%), together accounting for 98.5% of all San Joaquin residents.
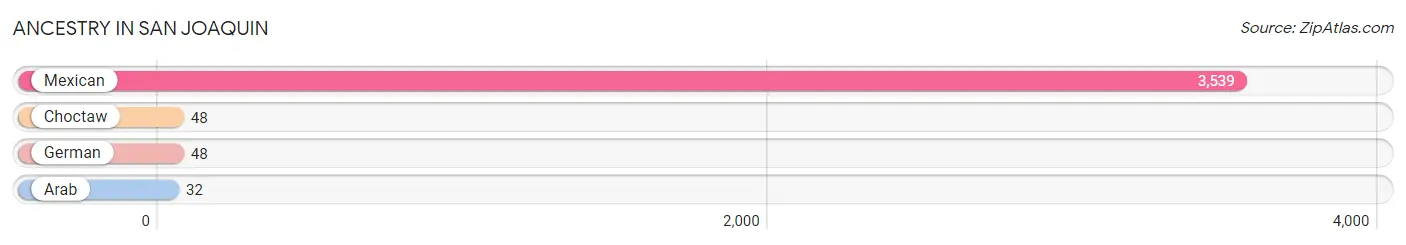
| Ancestry | # Population | % Population |
| Arab | 32 | 0.9% |
| Choctaw | 48 | 1.3% |
| German | 48 | 1.3% |
| Mexican | 3,539 | 95.0% | View All 4 Rows |
Immigrants in San Joaquin
The most numerous immigrant groups reported in San Joaquin came from Central America (1,436 | 38.6%), Latin America (1,436 | 38.6%), Mexico (1,436 | 38.6%), Asia (19 | 0.5%), and Western Asia (19 | 0.5%), together accounting for 116.7% of all San Joaquin residents.
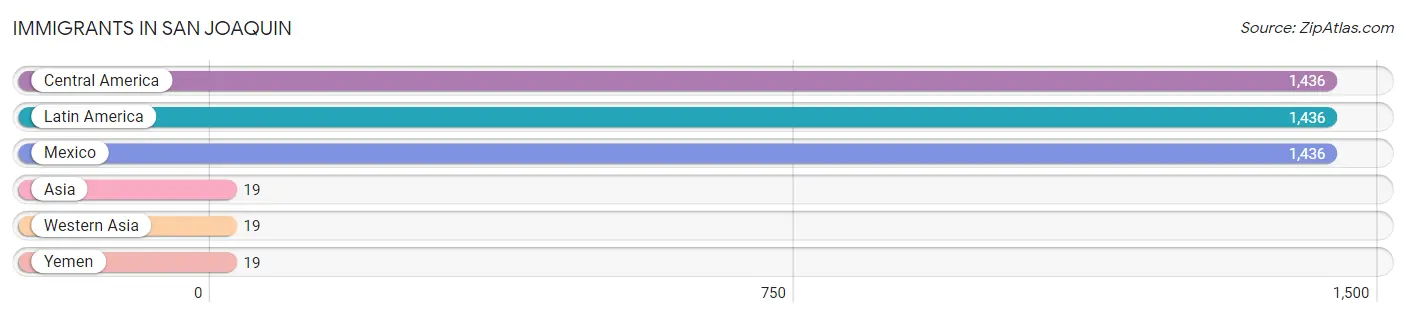
| Immigration Origin | # Population | % Population |
| Asia | 19 | 0.5% |
| Central America | 1,436 | 38.6% |
| Latin America | 1,436 | 38.6% |
| Mexico | 1,436 | 38.6% |
| Western Asia | 19 | 0.5% |
| Yemen | 19 | 0.5% | View All 6 Rows |
Sex and Age in San Joaquin
Sex and Age in San Joaquin
The most populous age groups in San Joaquin are 10 to 14 Years (218 | 12.2%) for men and Under 5 Years (265 | 13.7%) for women.
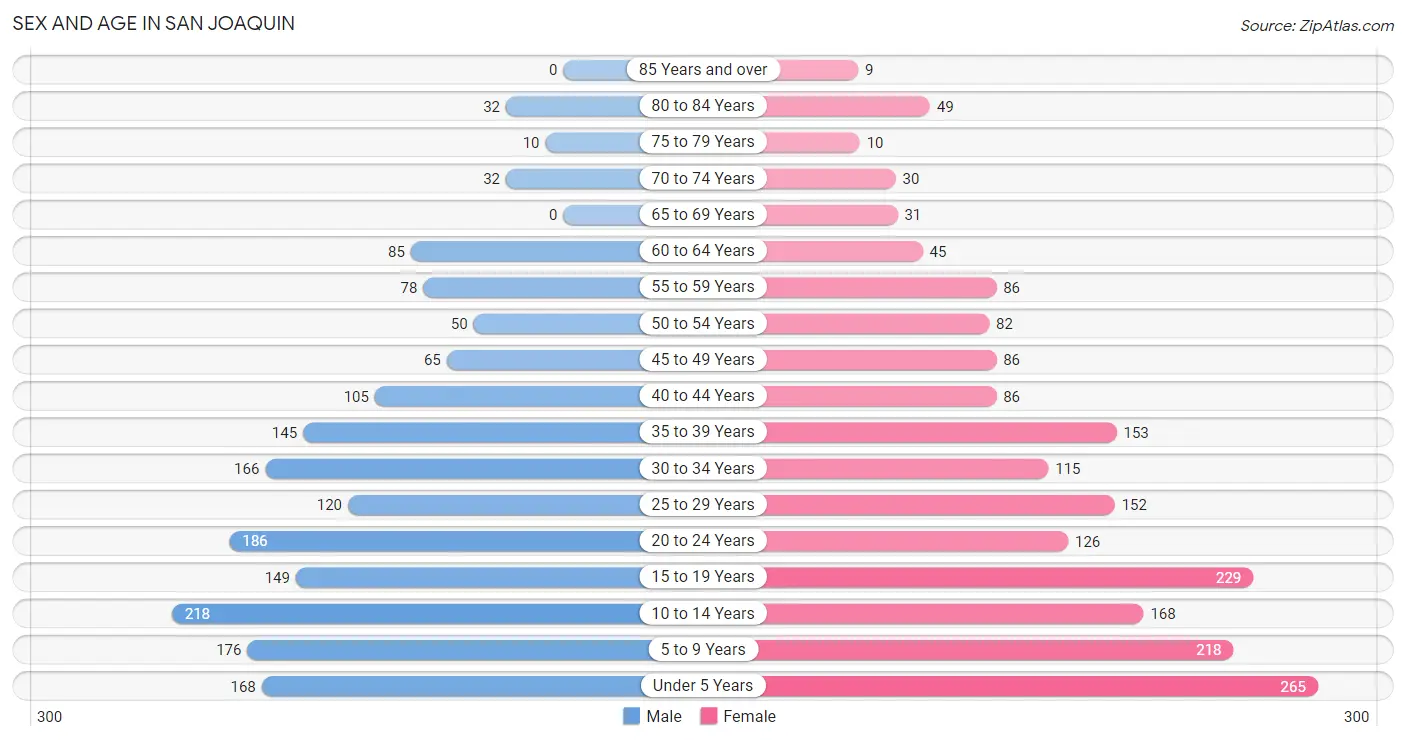
| Age Bracket | Male | Female |
| Under 5 Years | 168 (9.4%) | 265 (13.7%) |
| 5 to 9 Years | 176 (9.9%) | 218 (11.2%) |
| 10 to 14 Years | 218 (12.2%) | 168 (8.7%) |
| 15 to 19 Years | 149 (8.4%) | 229 (11.8%) |
| 20 to 24 Years | 186 (10.4%) | 126 (6.5%) |
| 25 to 29 Years | 120 (6.7%) | 152 (7.8%) |
| 30 to 34 Years | 166 (9.3%) | 115 (5.9%) |
| 35 to 39 Years | 145 (8.1%) | 153 (7.9%) |
| 40 to 44 Years | 105 (5.9%) | 86 (4.4%) |
| 45 to 49 Years | 65 (3.6%) | 86 (4.4%) |
| 50 to 54 Years | 50 (2.8%) | 82 (4.2%) |
| 55 to 59 Years | 78 (4.4%) | 86 (4.4%) |
| 60 to 64 Years | 85 (4.8%) | 45 (2.3%) |
| 65 to 69 Years | 0 (0.0%) | 31 (1.6%) |
| 70 to 74 Years | 32 (1.8%) | 30 (1.5%) |
| 75 to 79 Years | 10 (0.6%) | 10 (0.5%) |
| 80 to 84 Years | 32 (1.8%) | 49 (2.5%) |
| 85 Years and over | 0 (0.0%) | 9 (0.5%) |
| Total | 1,785 (100.0%) | 1,940 (100.0%) |
Families and Households in San Joaquin
Median Family Size in San Joaquin
The median family size in San Joaquin is 4.80 persons per family, with married-couple families (511 | 69.3%) accounting for the largest median family size of 5.13 persons per family. On the other hand, single male/father families (33 | 4.5%) represent the smallest median family size with 3.73 persons per family.
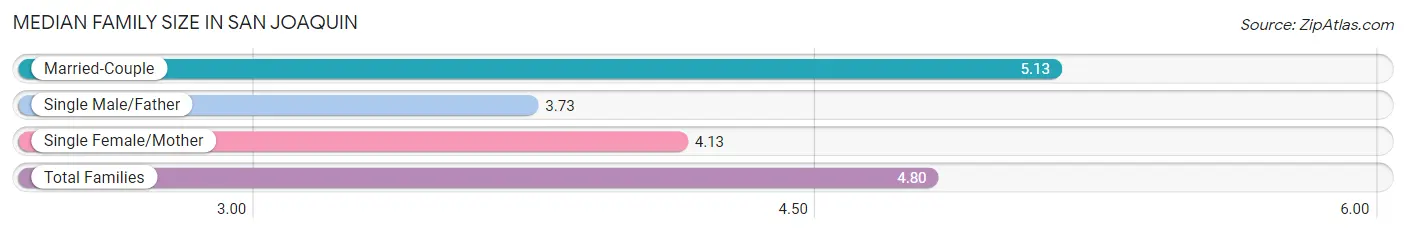
| Family Type | # Families | Family Size |
| Married-Couple | 511 (69.3%) | 5.13 |
| Single Male/Father | 33 (4.5%) | 3.73 |
| Single Female/Mother | 193 (26.2%) | 4.13 |
| Total Families | 737 (100.0%) | 4.80 |
Median Household Size in San Joaquin
The median household size in San Joaquin is 4.59 persons per household, with married-couple households (511 | 62.9%) accounting for the largest median household size of 5.13 persons per household. non-family households (75 | 9.2%) represent the smallest median household size with 1.52 persons per household.
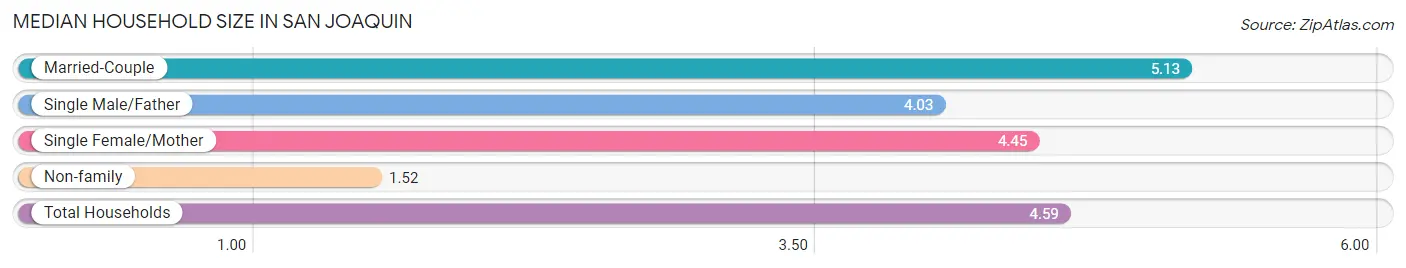
| Household Type | # Households | Household Size |
| Married-Couple | 511 (62.9%) | 5.13 |
| Single Male/Father | 33 (4.1%) | 4.03 |
| Single Female/Mother | 193 (23.8%) | 4.45 |
| Non-family | 75 (9.2%) | 1.52 |
| Total Households | 812 (100.0%) | 4.59 |
Household Size by Marriage Status in San Joaquin
Out of a total of 812 households in San Joaquin, 737 (90.8%) are family households, while 75 (9.2%) are nonfamily households. The most numerous type of family households are 5-person households, comprising 235, and the most common type of nonfamily households are 1-person households, comprising 63.
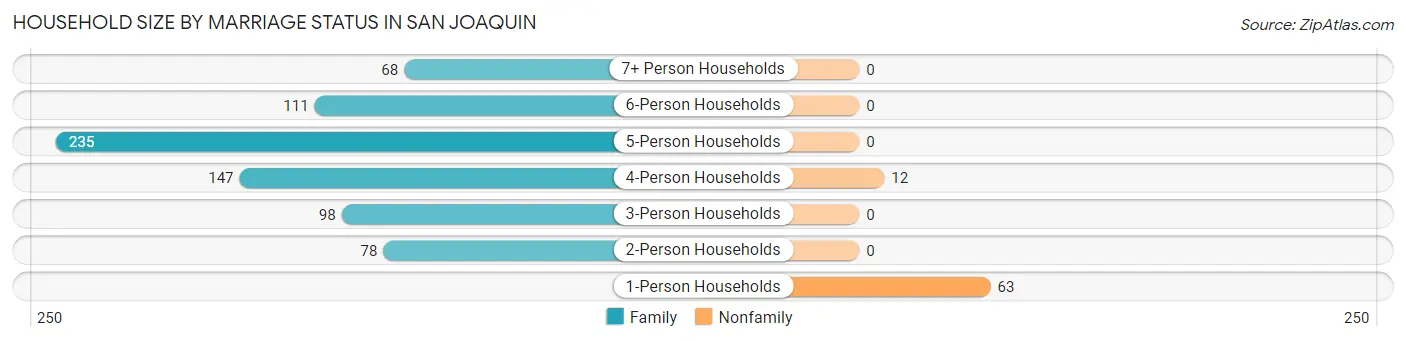
| Household Size | Family Households | Nonfamily Households |
| 1-Person Households | - | 63 (7.8%) |
| 2-Person Households | 78 (9.6%) | 0 (0.0%) |
| 3-Person Households | 98 (12.1%) | 0 (0.0%) |
| 4-Person Households | 147 (18.1%) | 12 (1.5%) |
| 5-Person Households | 235 (28.9%) | 0 (0.0%) |
| 6-Person Households | 111 (13.7%) | 0 (0.0%) |
| 7+ Person Households | 68 (8.4%) | 0 (0.0%) |
| Total | 737 (90.8%) | 75 (9.2%) |
Female Fertility in San Joaquin
Fertility by Age in San Joaquin
Average fertility rate in San Joaquin is 99.0 births per 1,000 women. Women in the age bracket of 20 to 34 years have the highest fertility rate with 219.0 births per 1,000 women. Women in the age bracket of 20 to 34 years acount for 90.5% of all women with births.
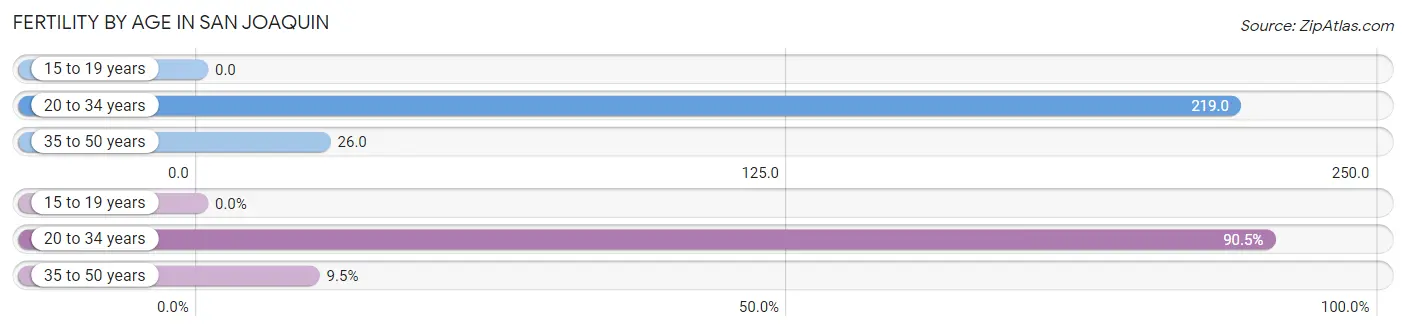
| Age Bracket | Women with Births | Births / 1,000 Women |
| 15 to 19 years | 0 (0.0%) | 0.0 |
| 20 to 34 years | 86 (90.5%) | 219.0 |
| 35 to 50 years | 9 (9.5%) | 26.0 |
| Total | 95 (100.0%) | 99.0 |
Fertility by Age by Marriage Status in San Joaquin
89.5% of women with births (95) in San Joaquin are married. The highest percentage of unmarried women with births falls into 20 to 34 years age bracket with 11.6% of them unmarried at the time of birth, while the lowest percentage of unmarried women with births belong to 35 to 50 years age bracket with 0.0% of them unmarried.
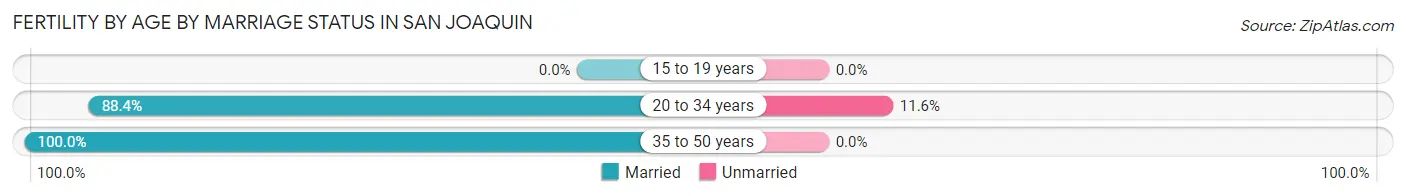
| Age Bracket | Married | Unmarried |
| 15 to 19 years | 0 (0.0%) | 0 (0.0%) |
| 20 to 34 years | 76 (88.4%) | 10 (11.6%) |
| 35 to 50 years | 9 (100.0%) | 0 (0.0%) |
| Total | 85 (89.5%) | 10 (10.5%) |
Fertility by Education in San Joaquin
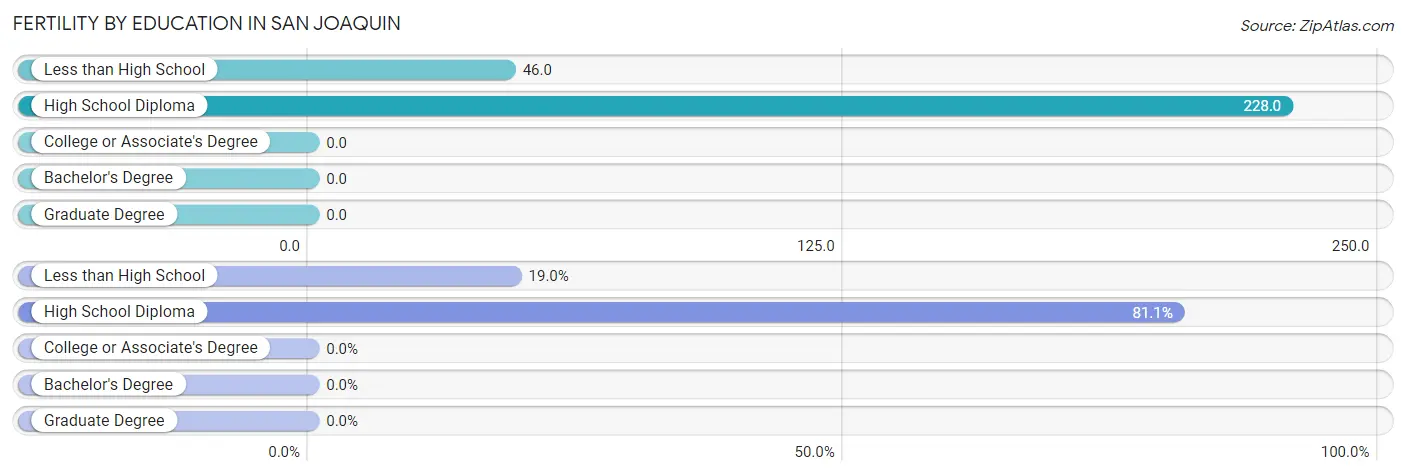
| Educational Attainment | Women with Births | Births / 1,000 Women |
| Less than High School | 18 (19.0%) | 46.0 |
| High School Diploma | 77 (81.0%) | 228.0 |
| College or Associate's Degree | 0 (0.0%) | 0.0 |
| Bachelor's Degree | 0 (0.0%) | 0.0 |
| Graduate Degree | 0 (0.0%) | 0.0 |
| Total | 95 (100.0%) | 99.0 |
Fertility by Education by Marriage Status in San Joaquin
10.5% of women with births in San Joaquin are unmarried. Women with the educational attainment of less than high school are most likely to be married with 100.0% of them married at childbirth, while women with the educational attainment of high school diploma are least likely to be married with 13.0% of them unmarried at childbirth.

| Educational Attainment | Married | Unmarried |
| Less than High School | 18 (100.0%) | 0 (0.0%) |
| High School Diploma | 67 (87.0%) | 10 (13.0%) |
| College or Associate's Degree | 0 (0.0%) | 0 (0.0%) |
| Bachelor's Degree | 0 (0.0%) | 0 (0.0%) |
| Graduate Degree | 0 (0.0%) | 0 (0.0%) |
| Total | 85 (89.5%) | 10 (10.5%) |
Employment Characteristics in San Joaquin
Employment by Class of Employer in San Joaquin
Among the 961 employed individuals in San Joaquin, private company employees (821 | 85.4%), state government employees (56 | 5.8%), and local government employees (46 | 4.8%) make up the most common classes of employment.
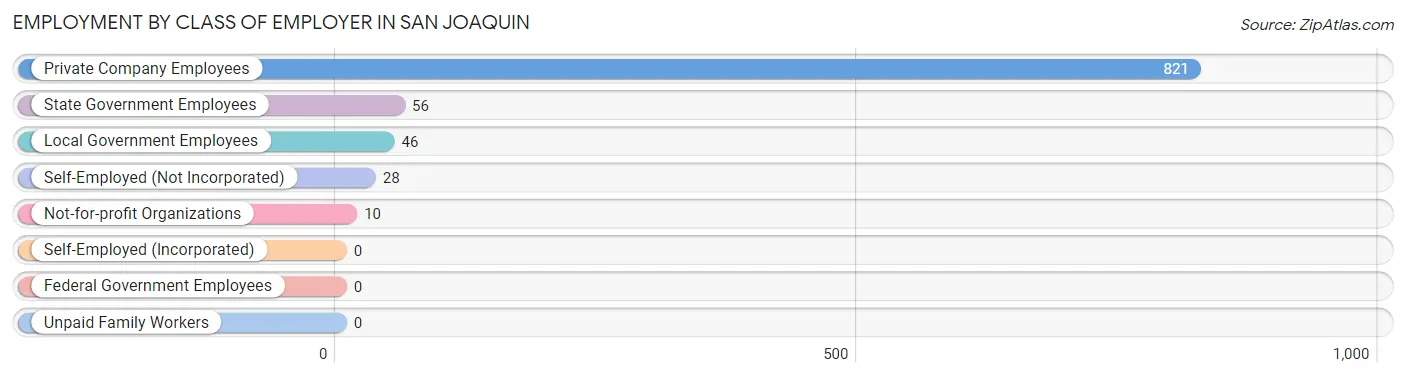
| Employer Class | # Employees | % Employees |
| Private Company Employees | 821 | 85.4% |
| Self-Employed (Incorporated) | 0 | 0.0% |
| Self-Employed (Not Incorporated) | 28 | 2.9% |
| Not-for-profit Organizations | 10 | 1.0% |
| Local Government Employees | 46 | 4.8% |
| State Government Employees | 56 | 5.8% |
| Federal Government Employees | 0 | 0.0% |
| Unpaid Family Workers | 0 | 0.0% |
| Total | 961 | 100.0% |
Employment Status by Age in San Joaquin
According to the labor force statistics for San Joaquin, out of the total population over 16 years of age (2,407), 52.5% or 1,264 individuals are in the labor force, with 18.9% or 239 of them unemployed. The age group with the highest labor force participation rate is 30 to 34 years, with 77.2% or 217 individuals in the labor force. Within the labor force, the 16 to 19 years age range has the highest percentage of unemployed individuals, with 64.3% or 18 of them being unemployed.
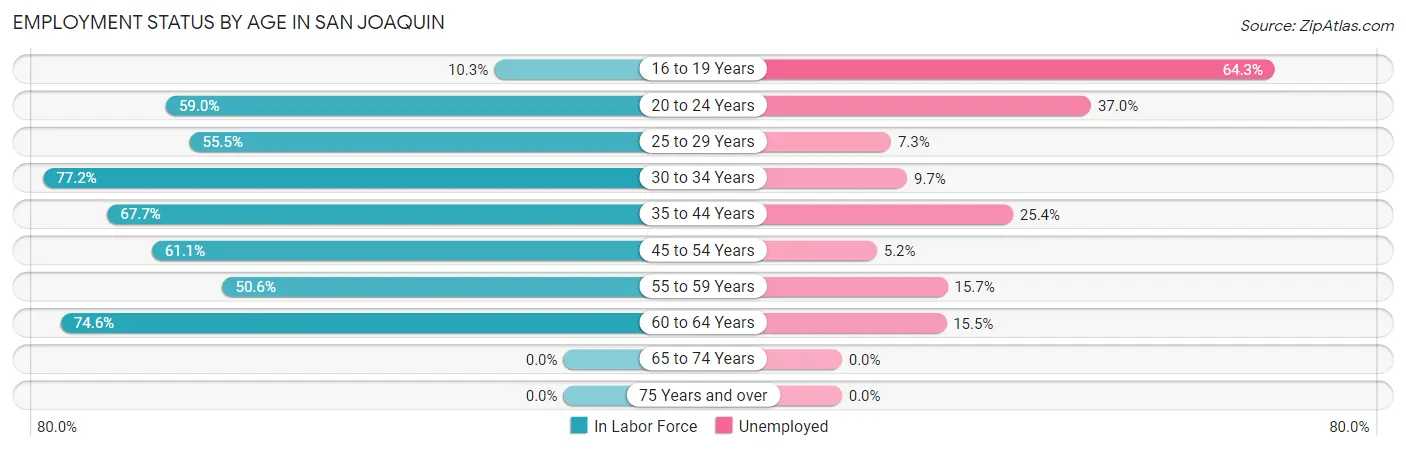
| Age Bracket | In Labor Force | Unemployed |
| 16 to 19 Years | 28 (10.3%) | 18 (64.3%) |
| 20 to 24 Years | 184 (59.0%) | 68 (37.0%) |
| 25 to 29 Years | 151 (55.5%) | 11 (7.3%) |
| 30 to 34 Years | 217 (77.2%) | 21 (9.7%) |
| 35 to 44 Years | 331 (67.7%) | 84 (25.4%) |
| 45 to 54 Years | 173 (61.1%) | 9 (5.2%) |
| 55 to 59 Years | 83 (50.6%) | 13 (15.7%) |
| 60 to 64 Years | 97 (74.6%) | 15 (15.5%) |
| 65 to 74 Years | 0 (0.0%) | 0 (0.0%) |
| 75 Years and over | 0 (0.0%) | 0 (0.0%) |
| Total | 1,264 (52.5%) | 239 (18.9%) |
Employment Status by Educational Attainment in San Joaquin
According to labor force statistics for San Joaquin, 65.0% of individuals (1,052) out of the total population between 25 and 64 years of age (1,619) are in the labor force, with 14.5% or 153 of them being unemployed. The group with the highest labor force participation rate are those with the educational attainment of bachelor's degree or higher, with 100.0% or 49 individuals in the labor force. Within the labor force, individuals with less than high school education have the highest percentage of unemployment, with 15.9% or 80 of them being unemployed.
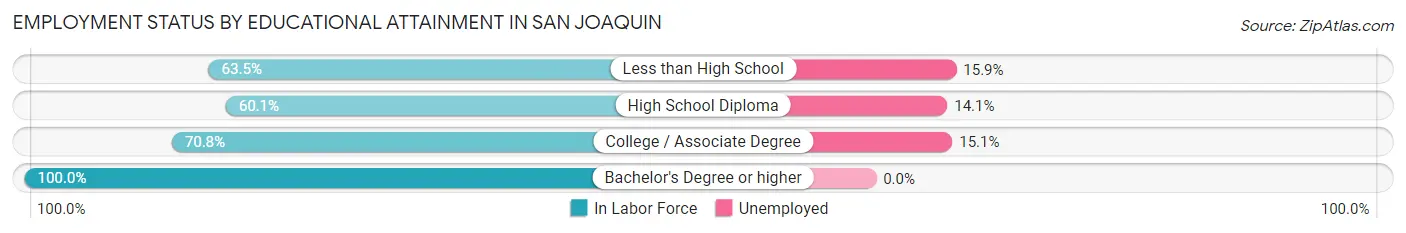
| Educational Attainment | In Labor Force | Unemployed |
| Less than High School | 502 (63.5%) | 126 (15.9%) |
| High School Diploma | 283 (60.1%) | 66 (14.1%) |
| College / Associate Degree | 218 (70.8%) | 47 (15.1%) |
| Bachelor's Degree or higher | 49 (100.0%) | 0 (0.0%) |
| Total | 1,052 (65.0%) | 235 (14.5%) |
Employment Occupations by Sex in San Joaquin
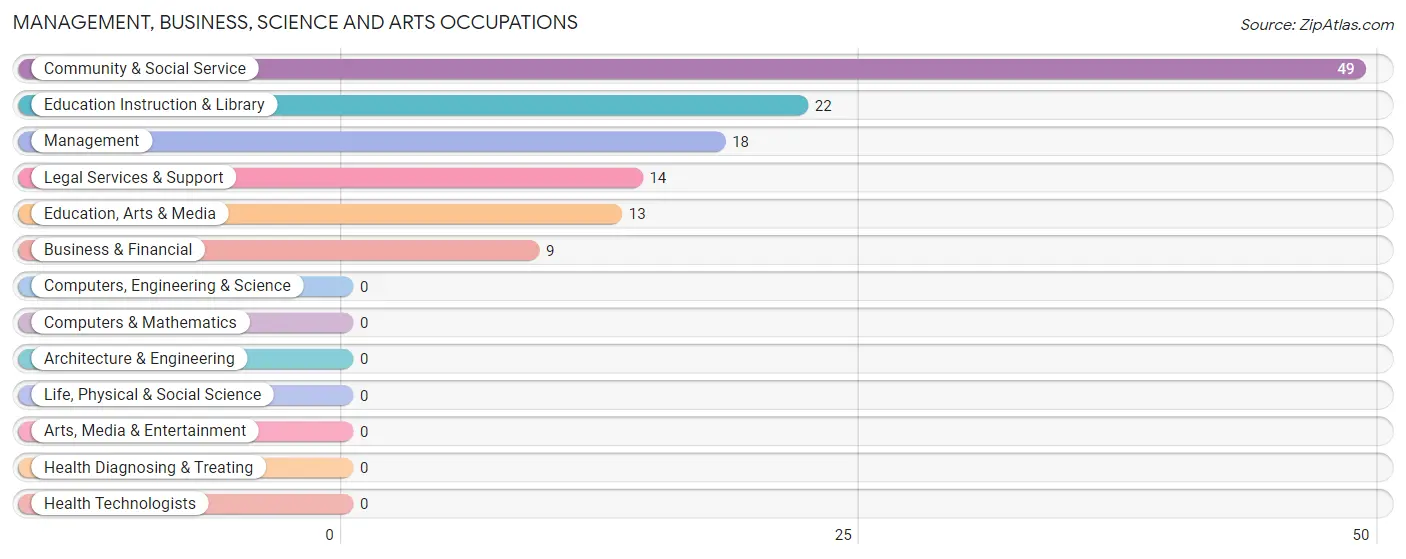
Management, Business, Science and Arts Occupations
The most common Management, Business, Science and Arts occupations in San Joaquin are Community & Social Service (49 | 4.8%), Education Instruction & Library (22 | 2.1%), Management (18 | 1.8%), Legal Services & Support (14 | 1.4%), and Education, Arts & Media (13 | 1.3%).
Management, Business, Science and Arts Occupations by Sex
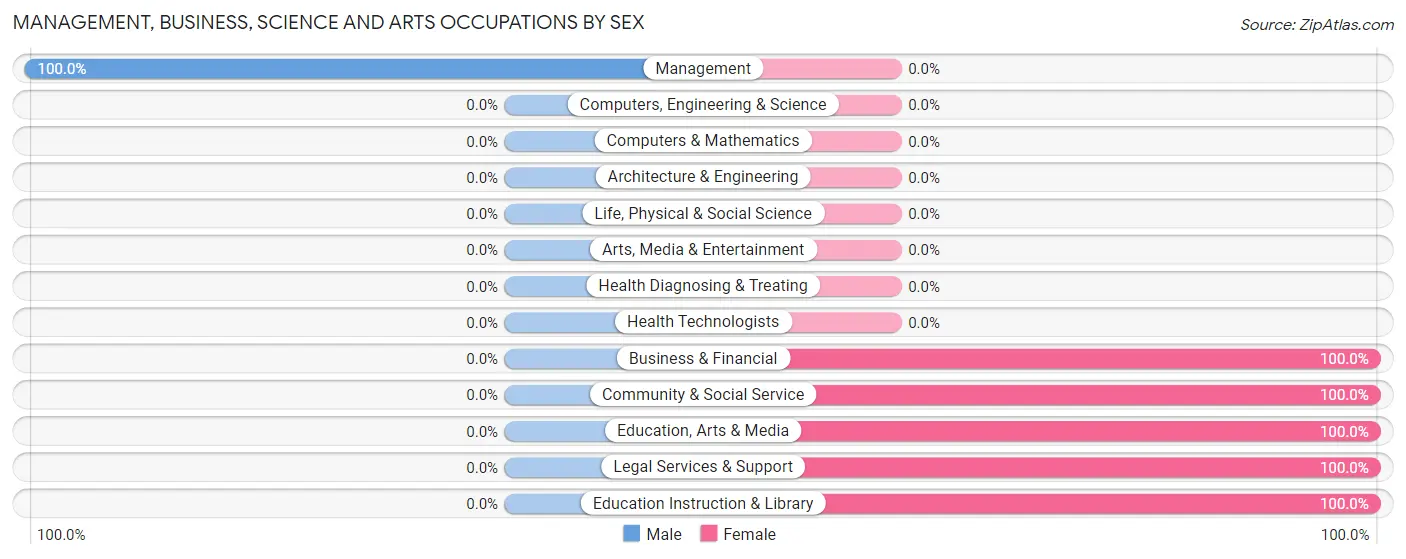
| Occupation | Male | Female |
| Management | 18 (100.0%) | 0 (0.0%) |
| Business & Financial | 0 (0.0%) | 9 (100.0%) |
| Computers, Engineering & Science | 0 (0.0%) | 0 (0.0%) |
| Computers & Mathematics | 0 (0.0%) | 0 (0.0%) |
| Architecture & Engineering | 0 (0.0%) | 0 (0.0%) |
| Life, Physical & Social Science | 0 (0.0%) | 0 (0.0%) |
| Community & Social Service | 0 (0.0%) | 49 (100.0%) |
| Education, Arts & Media | 0 (0.0%) | 13 (100.0%) |
| Legal Services & Support | 0 (0.0%) | 14 (100.0%) |
| Education Instruction & Library | 0 (0.0%) | 22 (100.0%) |
| Arts, Media & Entertainment | 0 (0.0%) | 0 (0.0%) |
| Health Diagnosing & Treating | 0 (0.0%) | 0 (0.0%) |
| Health Technologists | 0 (0.0%) | 0 (0.0%) |
| Total (Category) | 18 (23.7%) | 58 (76.3%) |
| Total (Overall) | 714 (69.7%) | 311 (30.3%) |
Services Occupations
The most common Services occupations in San Joaquin are Food Preparation & Serving (55 | 5.4%), Healthcare Support (52 | 5.1%), and Cleaning & Maintenance (18 | 1.8%).

Services Occupations by Sex
Within the Services occupations in San Joaquin, the most male-oriented occupations are Cleaning & Maintenance (100.0%), and Food Preparation & Serving (56.4%), while the most female-oriented occupations are Healthcare Support (100.0%), and Food Preparation & Serving (43.6%).
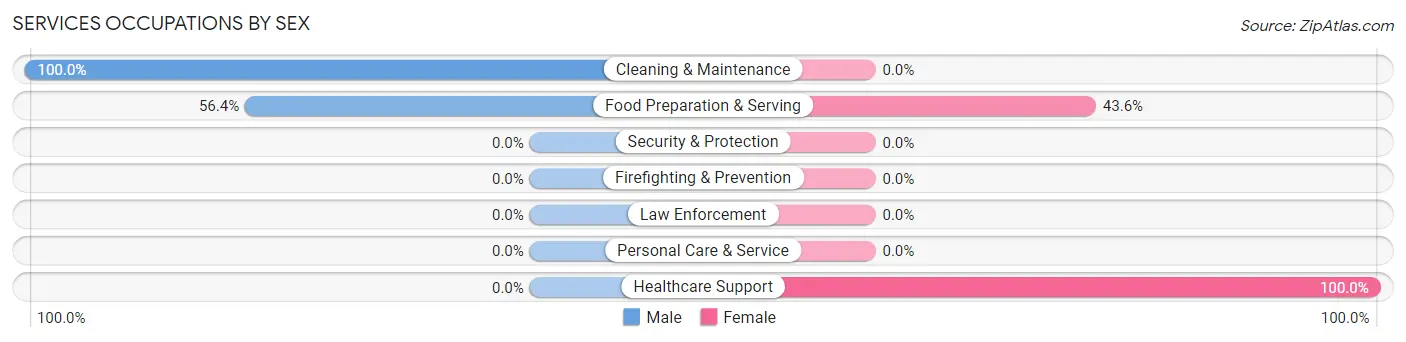
| Occupation | Male | Female |
| Healthcare Support | 0 (0.0%) | 52 (100.0%) |
| Security & Protection | 0 (0.0%) | 0 (0.0%) |
| Firefighting & Prevention | 0 (0.0%) | 0 (0.0%) |
| Law Enforcement | 0 (0.0%) | 0 (0.0%) |
| Food Preparation & Serving | 31 (56.4%) | 24 (43.6%) |
| Cleaning & Maintenance | 18 (100.0%) | 0 (0.0%) |
| Personal Care & Service | 0 (0.0%) | 0 (0.0%) |
| Total (Category) | 49 (39.2%) | 76 (60.8%) |
| Total (Overall) | 714 (69.7%) | 311 (30.3%) |
Sales and Office Occupations
The most common Sales and Office occupations in San Joaquin are Sales & Related (112 | 10.9%), and Office & Administration (82 | 8.0%).
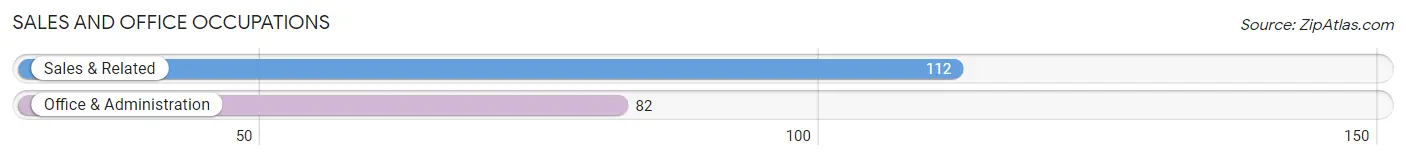
Sales and Office Occupations by Sex
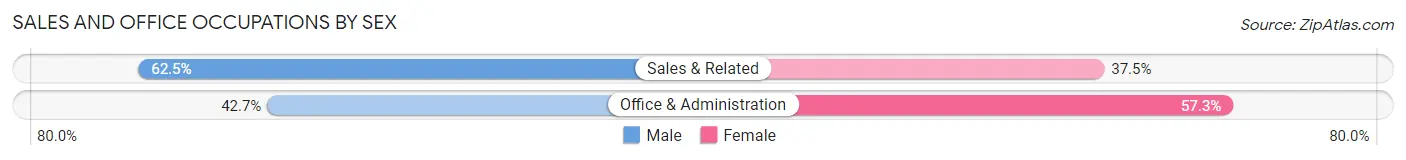
| Occupation | Male | Female |
| Sales & Related | 70 (62.5%) | 42 (37.5%) |
| Office & Administration | 35 (42.7%) | 47 (57.3%) |
| Total (Category) | 105 (54.1%) | 89 (45.9%) |
| Total (Overall) | 714 (69.7%) | 311 (30.3%) |
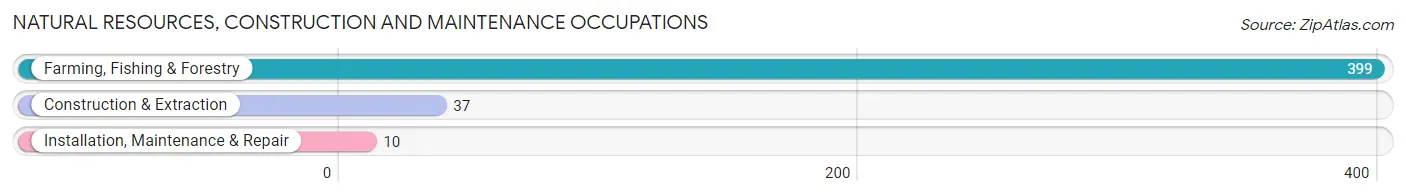
Natural Resources, Construction and Maintenance Occupations
The most common Natural Resources, Construction and Maintenance occupations in San Joaquin are Farming, Fishing & Forestry (399 | 38.9%), Construction & Extraction (37 | 3.6%), and Installation, Maintenance & Repair (10 | 1.0%).
Natural Resources, Construction and Maintenance Occupations by Sex
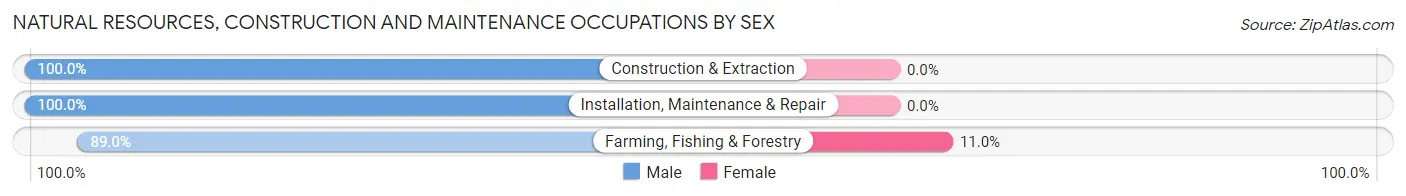
| Occupation | Male | Female |
| Farming, Fishing & Forestry | 355 (89.0%) | 44 (11.0%) |
| Construction & Extraction | 37 (100.0%) | 0 (0.0%) |
| Installation, Maintenance & Repair | 10 (100.0%) | 0 (0.0%) |
| Total (Category) | 402 (90.1%) | 44 (9.9%) |
| Total (Overall) | 714 (69.7%) | 311 (30.3%) |
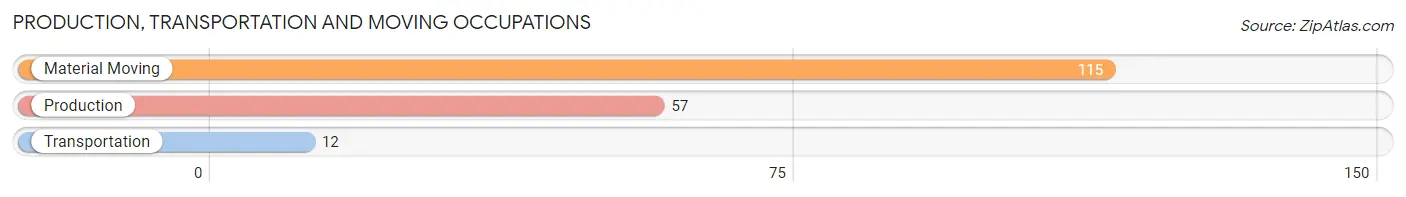
Production, Transportation and Moving Occupations
The most common Production, Transportation and Moving occupations in San Joaquin are Material Moving (115 | 11.2%), Production (57 | 5.6%), and Transportation (12 | 1.2%).
Production, Transportation and Moving Occupations by Sex
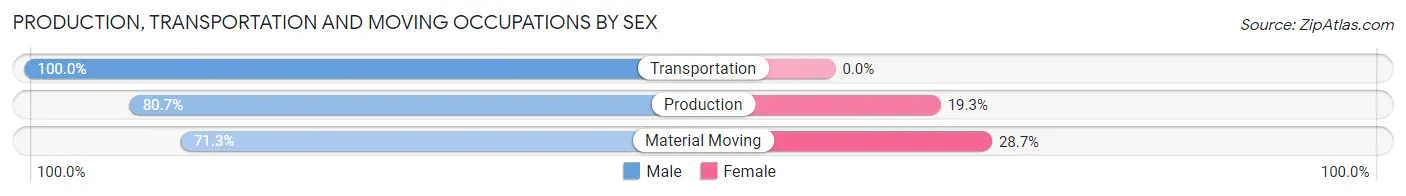
| Occupation | Male | Female |
| Production | 46 (80.7%) | 11 (19.3%) |
| Transportation | 12 (100.0%) | 0 (0.0%) |
| Material Moving | 82 (71.3%) | 33 (28.7%) |
| Total (Category) | 140 (76.1%) | 44 (23.9%) |
| Total (Overall) | 714 (69.7%) | 311 (30.3%) |
Employment Industries by Sex in San Joaquin
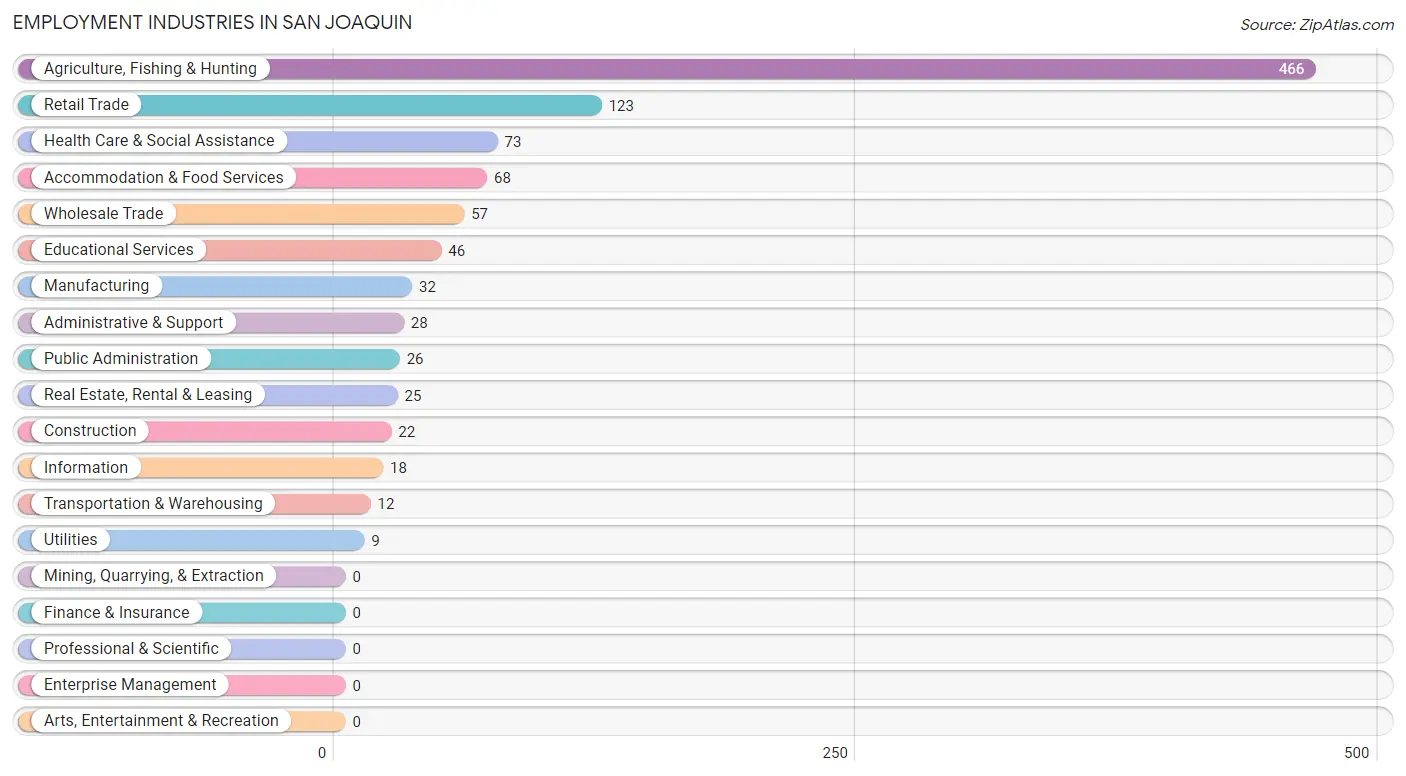
Employment Industries in San Joaquin
The major employment industries in San Joaquin include Agriculture, Fishing & Hunting (466 | 45.5%), Retail Trade (123 | 12.0%), Health Care & Social Assistance (73 | 7.1%), Accommodation & Food Services (68 | 6.6%), and Wholesale Trade (57 | 5.6%).
Employment Industries by Sex in San Joaquin
The San Joaquin industries that see more men than women are Construction (100.0%), Manufacturing (100.0%), and Transportation & Warehousing (100.0%), whereas the industries that tend to have a higher number of women are Educational Services (100.0%), Health Care & Social Assistance (100.0%), and Public Administration (100.0%).
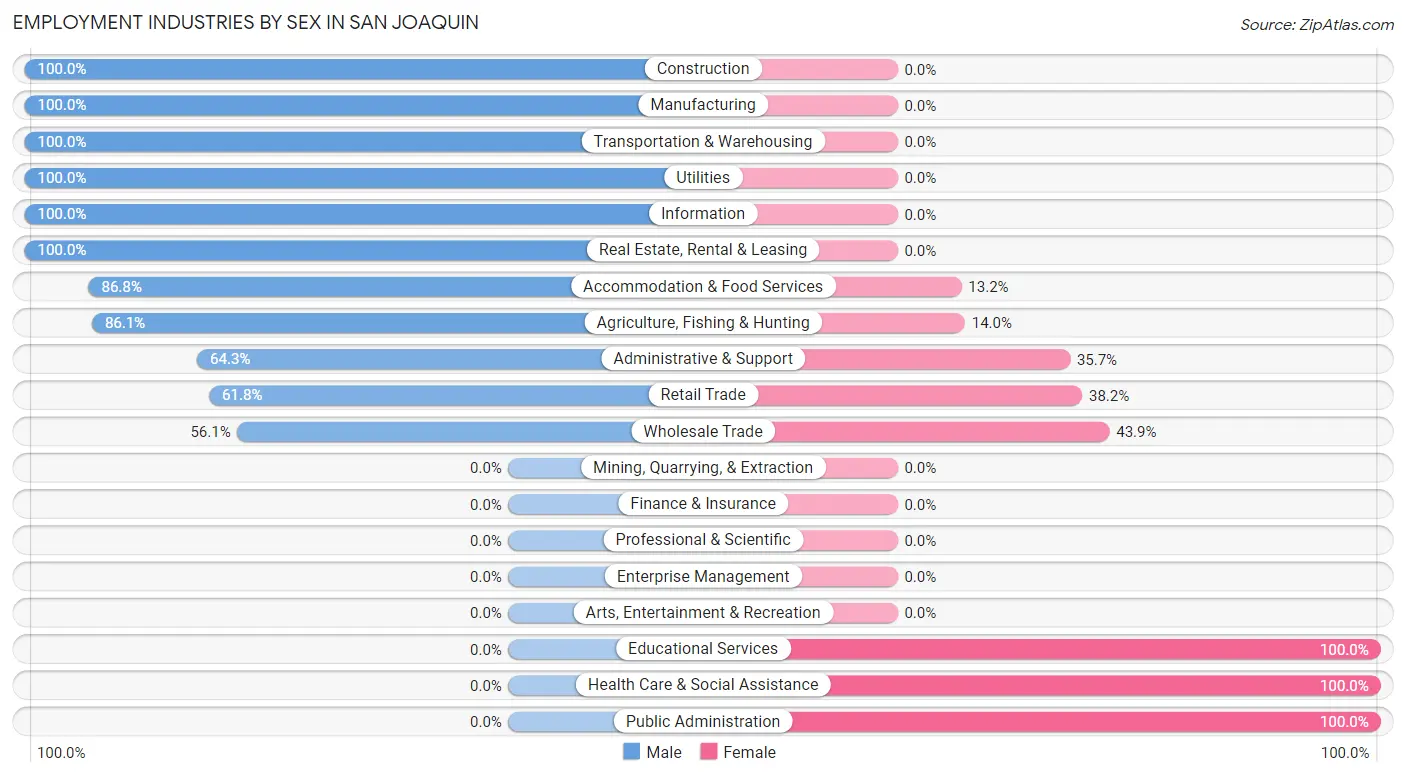
| Industry | Male | Female |
| Agriculture, Fishing & Hunting | 401 (86.1%) | 65 (14.0%) |
| Mining, Quarrying, & Extraction | 0 (0.0%) | 0 (0.0%) |
| Construction | 22 (100.0%) | 0 (0.0%) |
| Manufacturing | 32 (100.0%) | 0 (0.0%) |
| Wholesale Trade | 32 (56.1%) | 25 (43.9%) |
| Retail Trade | 76 (61.8%) | 47 (38.2%) |
| Transportation & Warehousing | 12 (100.0%) | 0 (0.0%) |
| Utilities | 9 (100.0%) | 0 (0.0%) |
| Information | 18 (100.0%) | 0 (0.0%) |
| Finance & Insurance | 0 (0.0%) | 0 (0.0%) |
| Real Estate, Rental & Leasing | 25 (100.0%) | 0 (0.0%) |
| Professional & Scientific | 0 (0.0%) | 0 (0.0%) |
| Enterprise Management | 0 (0.0%) | 0 (0.0%) |
| Administrative & Support | 18 (64.3%) | 10 (35.7%) |
| Educational Services | 0 (0.0%) | 46 (100.0%) |
| Health Care & Social Assistance | 0 (0.0%) | 73 (100.0%) |
| Arts, Entertainment & Recreation | 0 (0.0%) | 0 (0.0%) |
| Accommodation & Food Services | 59 (86.8%) | 9 (13.2%) |
| Public Administration | 0 (0.0%) | 26 (100.0%) |
| Total | 714 (69.7%) | 311 (30.3%) |
Education in San Joaquin
School Enrollment in San Joaquin
The most common levels of schooling among the 1,188 students in San Joaquin are high school (423 | 35.6%), elementary school (309 | 26.0%), and middle school (211 | 17.8%).
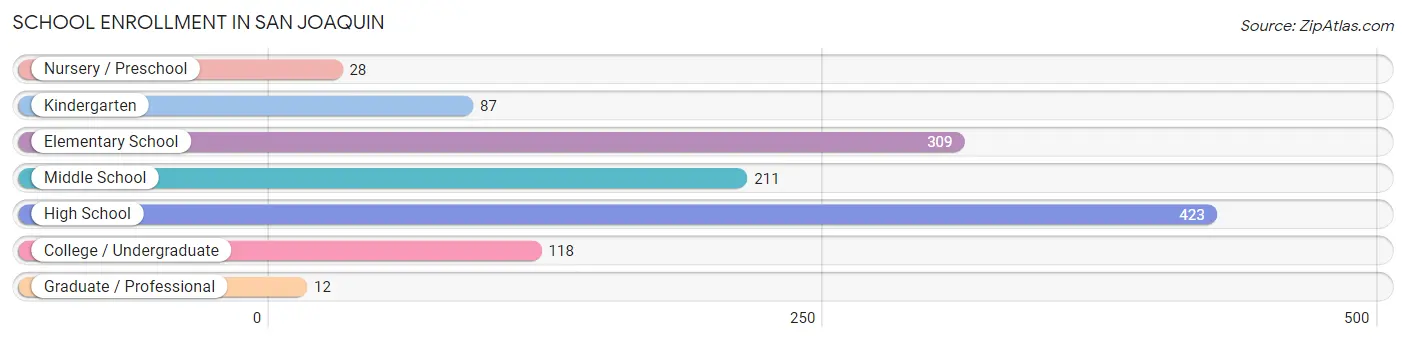
| School Level | # Students | % Students |
| Nursery / Preschool | 28 | 2.4% |
| Kindergarten | 87 | 7.3% |
| Elementary School | 309 | 26.0% |
| Middle School | 211 | 17.8% |
| High School | 423 | 35.6% |
| College / Undergraduate | 118 | 9.9% |
| Graduate / Professional | 12 | 1.0% |
| Total | 1,188 | 100.0% |
School Enrollment by Age by Funding Source in San Joaquin
Out of a total of 1,188 students who are enrolled in schools in San Joaquin, 14 (1.2%) attend a private institution, while the remaining 1,174 (98.8%) are enrolled in public schools. The age group of 35 years and over has the highest likelihood of being enrolled in private schools, with 14 (100.0% in the age bracket) enrolled. Conversely, the age group of 3 to 4 year olds has the lowest likelihood of being enrolled in a private school, with 28 (100.0% in the age bracket) attending a public institution.
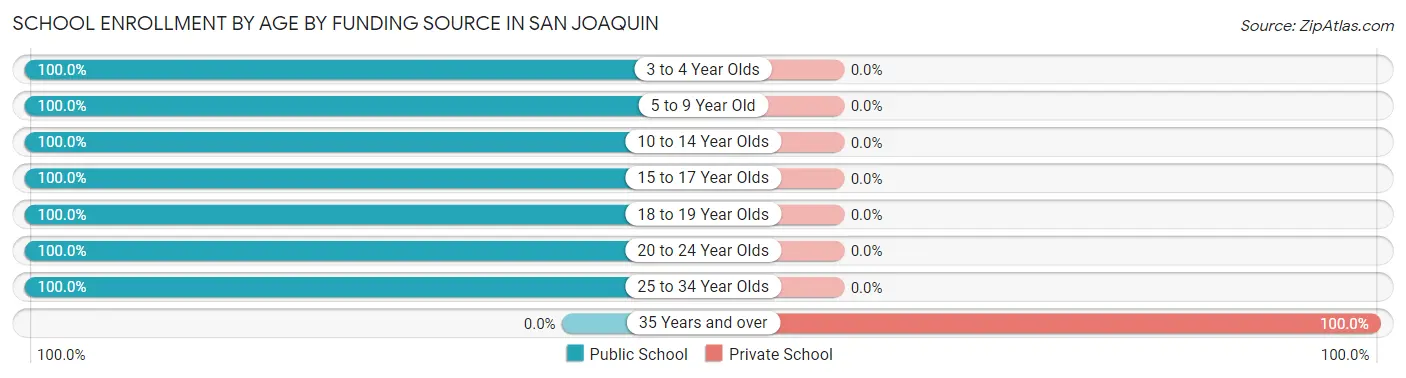
| Age Bracket | Public School | Private School |
| 3 to 4 Year Olds | 28 (100.0%) | 0 (0.0%) |
| 5 to 9 Year Old | 377 (100.0%) | 0 (0.0%) |
| 10 to 14 Year Olds | 376 (100.0%) | 0 (0.0%) |
| 15 to 17 Year Olds | 213 (100.0%) | 0 (0.0%) |
| 18 to 19 Year Olds | 107 (100.0%) | 0 (0.0%) |
| 20 to 24 Year Olds | 52 (100.0%) | 0 (0.0%) |
| 25 to 34 Year Olds | 21 (100.0%) | 0 (0.0%) |
| 35 Years and over | 0 (0.0%) | 14 (100.0%) |
| Total | 1,174 (98.8%) | 14 (1.2%) |
Educational Attainment by Field of Study in San Joaquin
Engineering (25 | 51.0%), multidisciplinary studies (13 | 26.5%), and business (11 | 22.5%) are the most common fields of study among 49 individuals in San Joaquin who have obtained a bachelor's degree or higher.
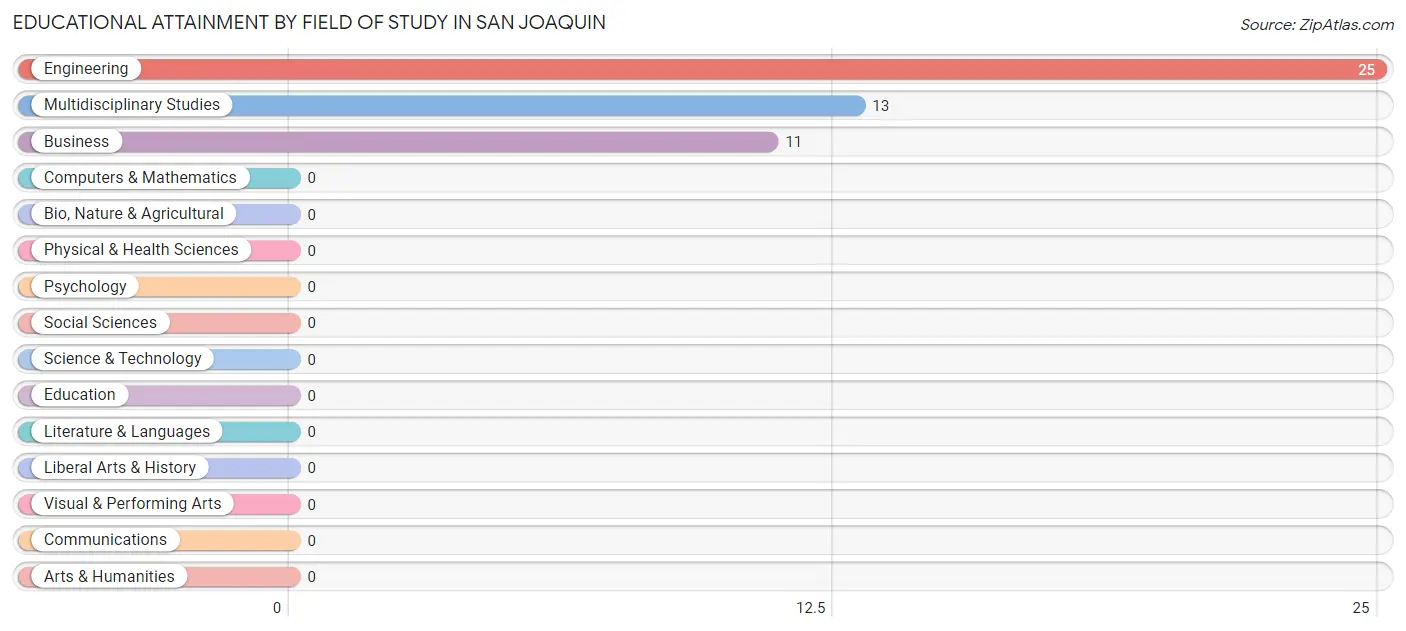
| Field of Study | # Graduates | % Graduates |
| Computers & Mathematics | 0 | 0.0% |
| Bio, Nature & Agricultural | 0 | 0.0% |
| Physical & Health Sciences | 0 | 0.0% |
| Psychology | 0 | 0.0% |
| Social Sciences | 0 | 0.0% |
| Engineering | 25 | 51.0% |
| Multidisciplinary Studies | 13 | 26.5% |
| Science & Technology | 0 | 0.0% |
| Business | 11 | 22.5% |
| Education | 0 | 0.0% |
| Literature & Languages | 0 | 0.0% |
| Liberal Arts & History | 0 | 0.0% |
| Visual & Performing Arts | 0 | 0.0% |
| Communications | 0 | 0.0% |
| Arts & Humanities | 0 | 0.0% |
| Total | 49 | 100.0% |
Transportation & Commute in San Joaquin
Vehicle Availability by Sex in San Joaquin
The most prevalent vehicle ownership categories in San Joaquin are males with 3 vehicles (233, accounting for 35.8%) and females with 3 vehicles (142, making up 74.9%).
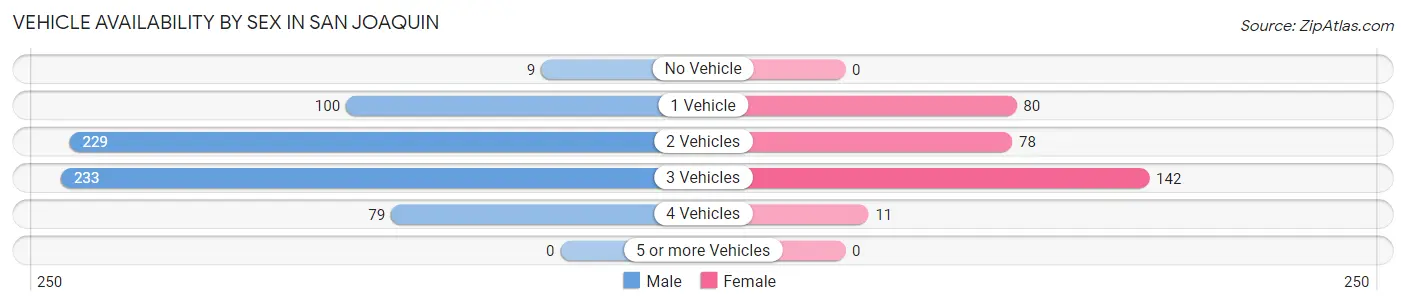
| Vehicles Available | Male | Female |
| No Vehicle | 9 (1.4%) | 0 (0.0%) |
| 1 Vehicle | 100 (15.4%) | 80 (25.7%) |
| 2 Vehicles | 229 (35.2%) | 78 (25.1%) |
| 3 Vehicles | 233 (35.8%) | 142 (45.7%) |
| 4 Vehicles | 79 (12.1%) | 11 (3.5%) |
| 5 or more Vehicles | 0 (0.0%) | 0 (0.0%) |
| Total | 650 (100.0%) | 311 (100.0%) |
Commute Time in San Joaquin
The most frequently occuring commute durations in San Joaquin are 20 to 24 minutes (168 commuters, 18.7%), 30 to 34 minutes (165 commuters, 18.4%), and 5 to 9 minutes (133 commuters, 14.8%).
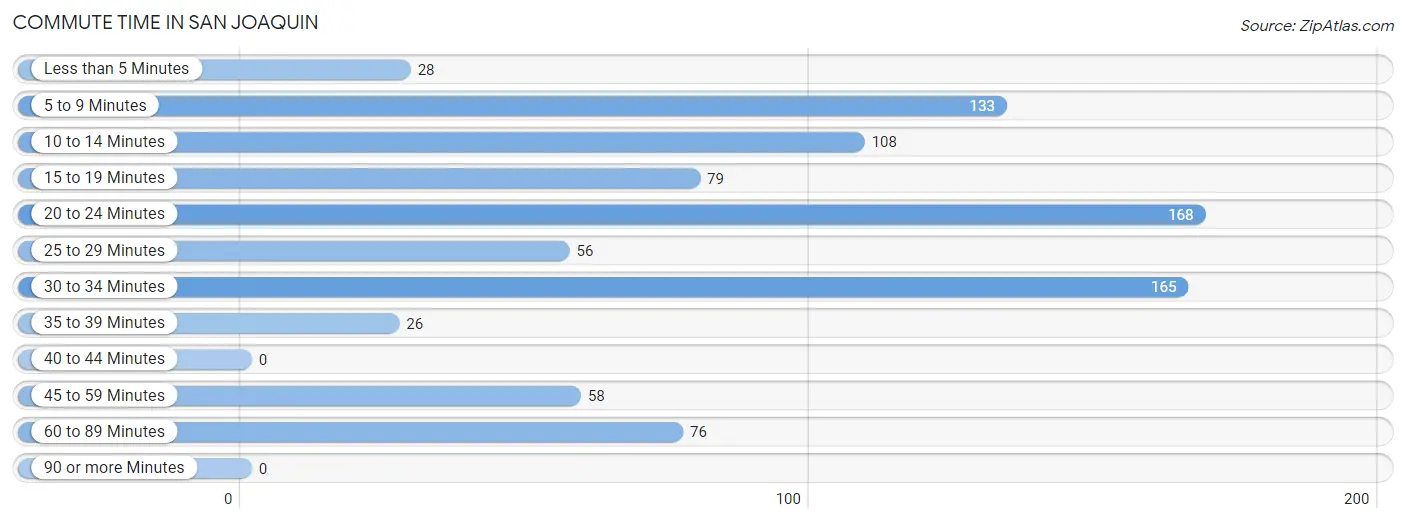
| Commute Time | # Commuters | % Commuters |
| Less than 5 Minutes | 28 | 3.1% |
| 5 to 9 Minutes | 133 | 14.8% |
| 10 to 14 Minutes | 108 | 12.0% |
| 15 to 19 Minutes | 79 | 8.8% |
| 20 to 24 Minutes | 168 | 18.7% |
| 25 to 29 Minutes | 56 | 6.2% |
| 30 to 34 Minutes | 165 | 18.4% |
| 35 to 39 Minutes | 26 | 2.9% |
| 40 to 44 Minutes | 0 | 0.0% |
| 45 to 59 Minutes | 58 | 6.5% |
| 60 to 89 Minutes | 76 | 8.5% |
| 90 or more Minutes | 0 | 0.0% |
Commute Time by Sex in San Joaquin
The most common commute times in San Joaquin are 30 to 34 minutes (121 commuters, 19.2%) for males and 20 to 24 minutes (71 commuters, 26.8%) for females.
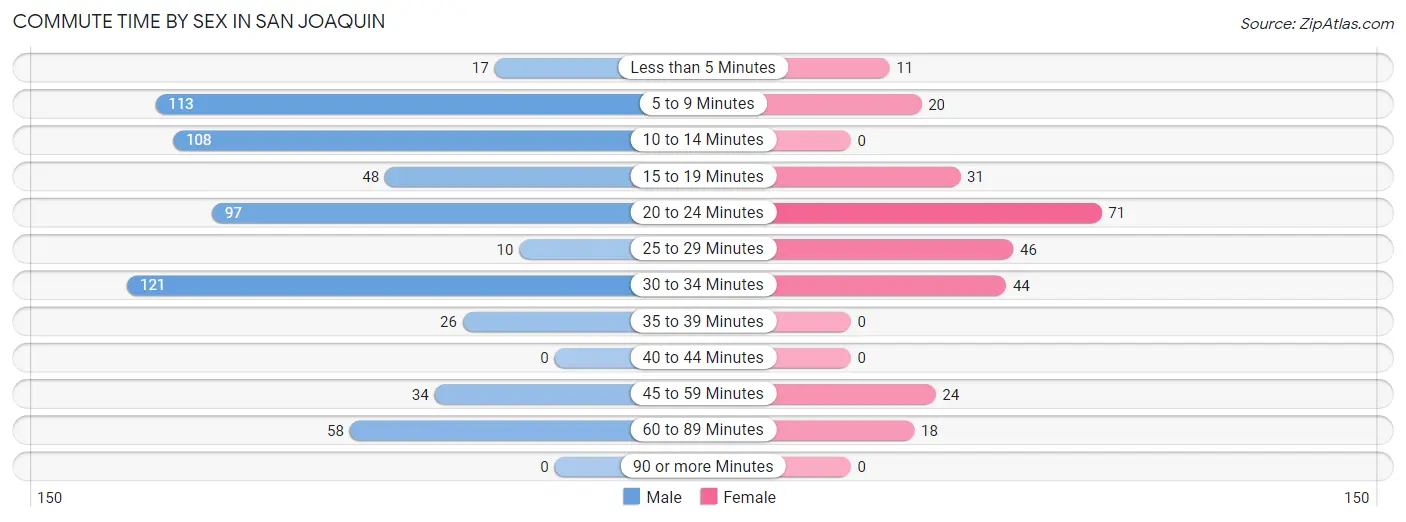
| Commute Time | Male | Female |
| Less than 5 Minutes | 17 (2.7%) | 11 (4.2%) |
| 5 to 9 Minutes | 113 (17.9%) | 20 (7.5%) |
| 10 to 14 Minutes | 108 (17.1%) | 0 (0.0%) |
| 15 to 19 Minutes | 48 (7.6%) | 31 (11.7%) |
| 20 to 24 Minutes | 97 (15.3%) | 71 (26.8%) |
| 25 to 29 Minutes | 10 (1.6%) | 46 (17.4%) |
| 30 to 34 Minutes | 121 (19.2%) | 44 (16.6%) |
| 35 to 39 Minutes | 26 (4.1%) | 0 (0.0%) |
| 40 to 44 Minutes | 0 (0.0%) | 0 (0.0%) |
| 45 to 59 Minutes | 34 (5.4%) | 24 (9.1%) |
| 60 to 89 Minutes | 58 (9.2%) | 18 (6.8%) |
| 90 or more Minutes | 0 (0.0%) | 0 (0.0%) |
Time of Departure to Work by Sex in San Joaquin
The most frequent times of departure to work in San Joaquin are 6:00 AM to 6:29 AM (204, 32.3%) for males and 6:30 AM to 6:59 AM (70, 26.4%) for females.
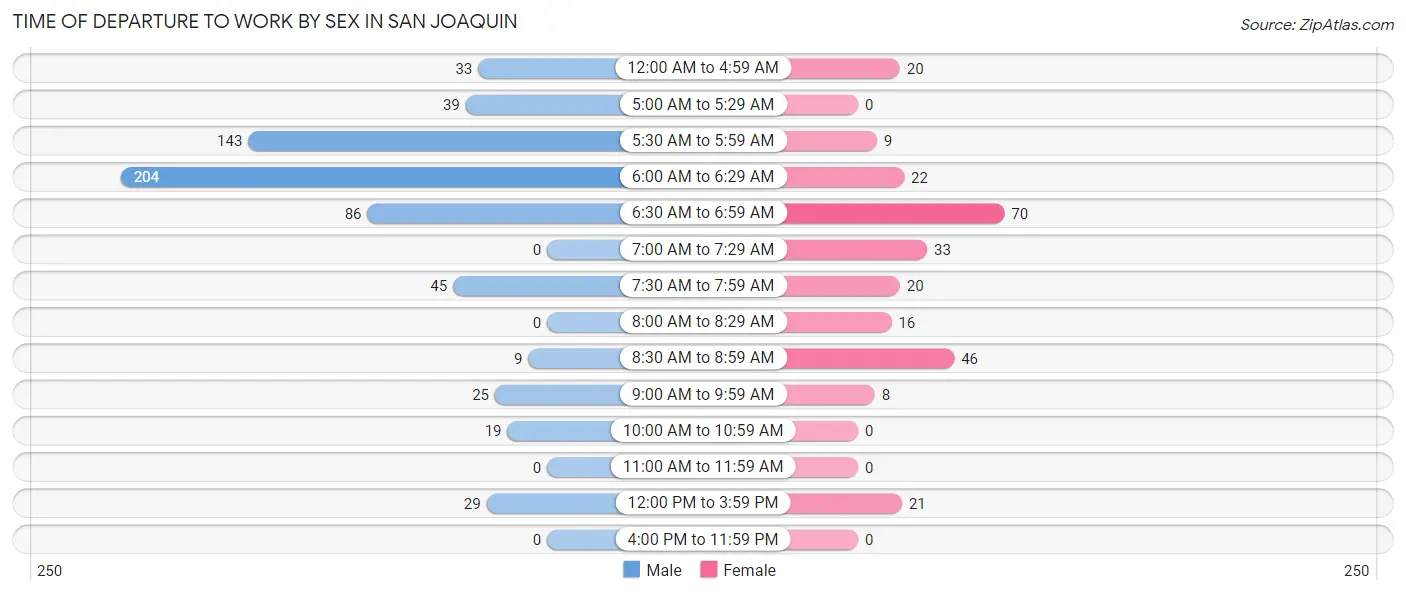
| Time of Departure | Male | Female |
| 12:00 AM to 4:59 AM | 33 (5.2%) | 20 (7.5%) |
| 5:00 AM to 5:29 AM | 39 (6.2%) | 0 (0.0%) |
| 5:30 AM to 5:59 AM | 143 (22.6%) | 9 (3.4%) |
| 6:00 AM to 6:29 AM | 204 (32.3%) | 22 (8.3%) |
| 6:30 AM to 6:59 AM | 86 (13.6%) | 70 (26.4%) |
| 7:00 AM to 7:29 AM | 0 (0.0%) | 33 (12.4%) |
| 7:30 AM to 7:59 AM | 45 (7.1%) | 20 (7.5%) |
| 8:00 AM to 8:29 AM | 0 (0.0%) | 16 (6.0%) |
| 8:30 AM to 8:59 AM | 9 (1.4%) | 46 (17.4%) |
| 9:00 AM to 9:59 AM | 25 (4.0%) | 8 (3.0%) |
| 10:00 AM to 10:59 AM | 19 (3.0%) | 0 (0.0%) |
| 11:00 AM to 11:59 AM | 0 (0.0%) | 0 (0.0%) |
| 12:00 PM to 3:59 PM | 29 (4.6%) | 21 (7.9%) |
| 4:00 PM to 11:59 PM | 0 (0.0%) | 0 (0.0%) |
| Total | 632 (100.0%) | 265 (100.0%) |
Housing Occupancy in San Joaquin
Occupancy by Ownership in San Joaquin
Of the total 812 dwellings in San Joaquin, owner-occupied units account for 304 (37.4%), while renter-occupied units make up 508 (62.6%).
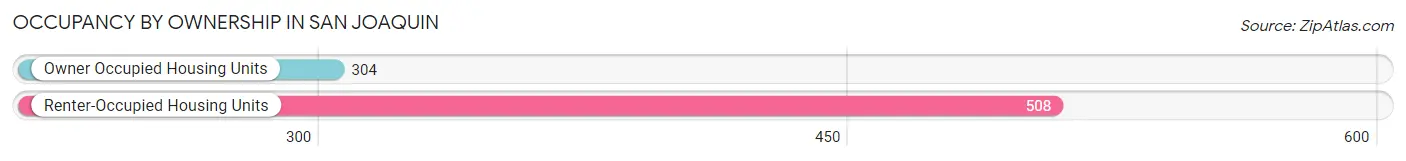
| Occupancy | # Housing Units | % Housing Units |
| Owner Occupied Housing Units | 304 | 37.4% |
| Renter-Occupied Housing Units | 508 | 62.6% |
| Total Occupied Housing Units | 812 | 100.0% |
Occupancy by Household Size in San Joaquin
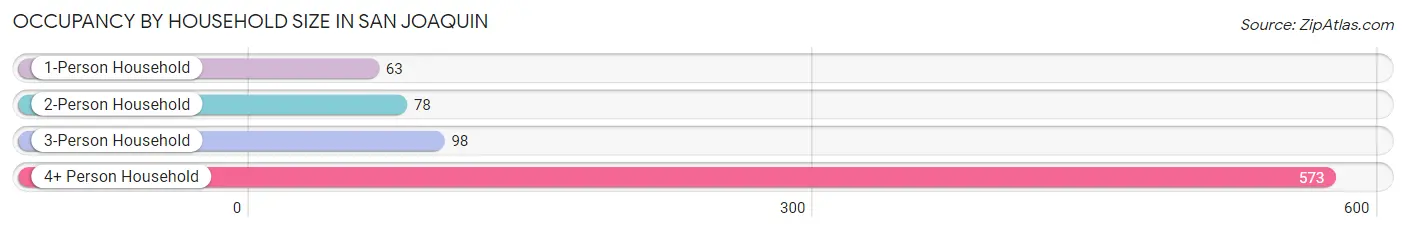
| Household Size | # Housing Units | % Housing Units |
| 1-Person Household | 63 | 7.8% |
| 2-Person Household | 78 | 9.6% |
| 3-Person Household | 98 | 12.1% |
| 4+ Person Household | 573 | 70.6% |
| Total Housing Units | 812 | 100.0% |
Occupancy by Ownership by Household Size in San Joaquin
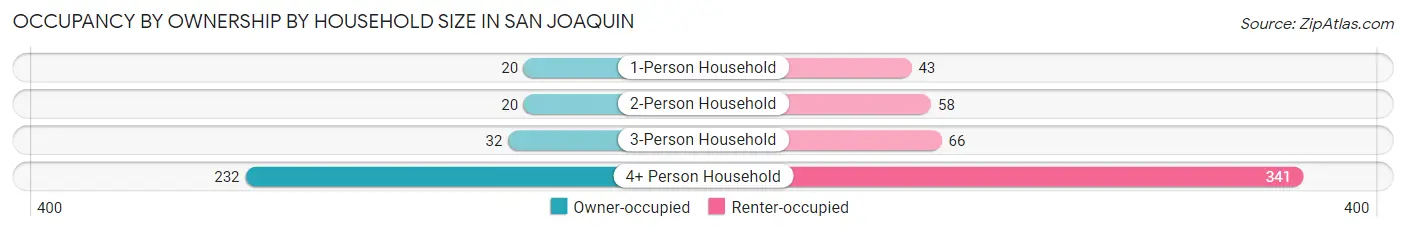
| Household Size | Owner-occupied | Renter-occupied |
| 1-Person Household | 20 (31.8%) | 43 (68.2%) |
| 2-Person Household | 20 (25.6%) | 58 (74.4%) |
| 3-Person Household | 32 (32.7%) | 66 (67.3%) |
| 4+ Person Household | 232 (40.5%) | 341 (59.5%) |
| Total Housing Units | 304 (37.4%) | 508 (62.6%) |
Occupancy by Educational Attainment in San Joaquin
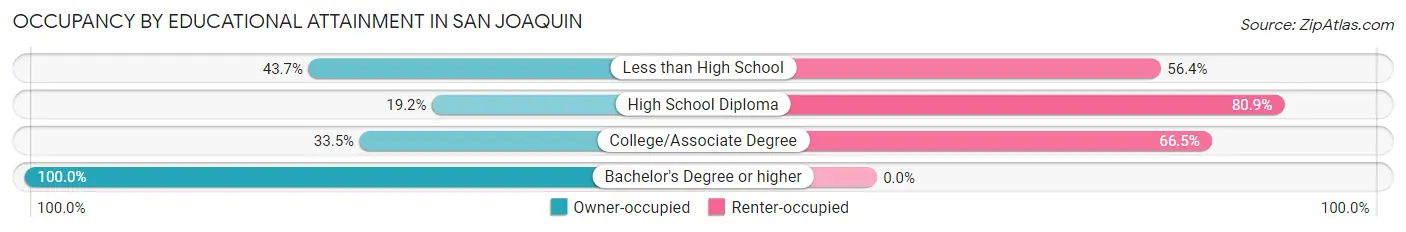
| Household Size | Owner-occupied | Renter-occupied |
| Less than High School | 182 (43.6%) | 235 (56.4%) |
| High School Diploma | 36 (19.2%) | 152 (80.8%) |
| College/Associate Degree | 61 (33.5%) | 121 (66.5%) |
| Bachelor's Degree or higher | 25 (100.0%) | 0 (0.0%) |
Occupancy by Age of Householder in San Joaquin
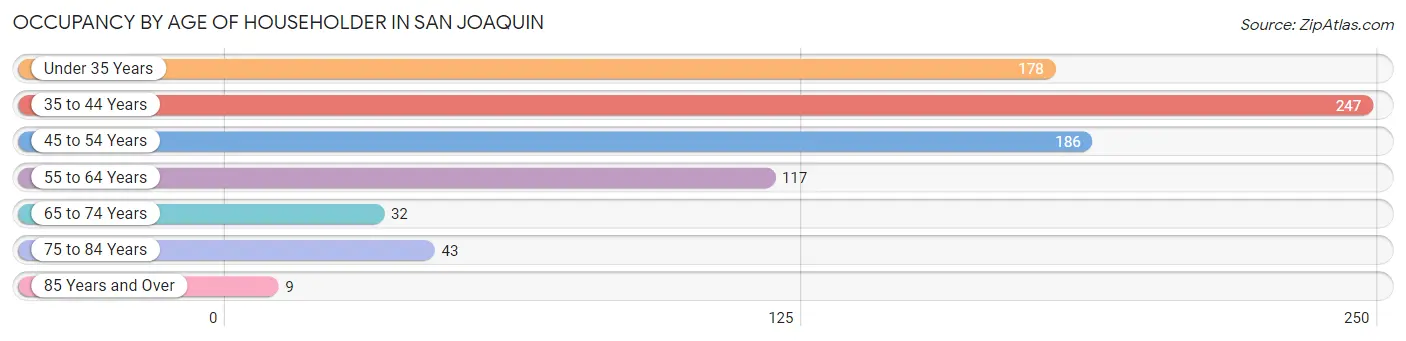
| Age Bracket | # Households | % Households |
| Under 35 Years | 178 | 21.9% |
| 35 to 44 Years | 247 | 30.4% |
| 45 to 54 Years | 186 | 22.9% |
| 55 to 64 Years | 117 | 14.4% |
| 65 to 74 Years | 32 | 3.9% |
| 75 to 84 Years | 43 | 5.3% |
| 85 Years and Over | 9 | 1.1% |
| Total | 812 | 100.0% |
Housing Finances in San Joaquin
Median Income by Occupancy in San Joaquin
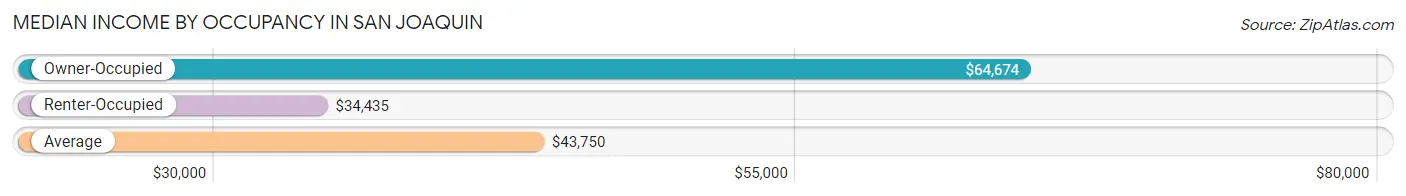
| Occupancy Type | # Households | Median Income |
| Owner-Occupied | 304 (37.4%) | $64,674 |
| Renter-Occupied | 508 (62.6%) | $34,435 |
| Average | 812 (100.0%) | $43,750 |
Occupancy by Householder Income Bracket in San Joaquin
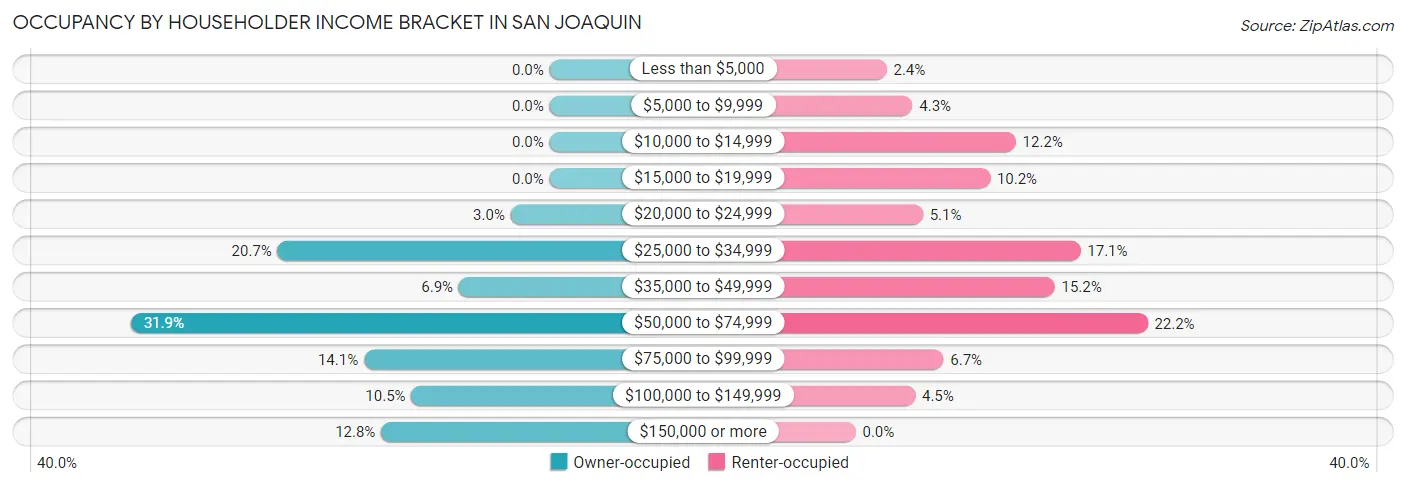
| Income Bracket | Owner-occupied | Renter-occupied |
| Less than $5,000 | 0 (0.0%) | 12 (2.4%) |
| $5,000 to $9,999 | 0 (0.0%) | 22 (4.3%) |
| $10,000 to $14,999 | 0 (0.0%) | 62 (12.2%) |
| $15,000 to $19,999 | 0 (0.0%) | 52 (10.2%) |
| $20,000 to $24,999 | 9 (3.0%) | 26 (5.1%) |
| $25,000 to $34,999 | 63 (20.7%) | 87 (17.1%) |
| $35,000 to $49,999 | 21 (6.9%) | 77 (15.2%) |
| $50,000 to $74,999 | 97 (31.9%) | 113 (22.2%) |
| $75,000 to $99,999 | 43 (14.1%) | 34 (6.7%) |
| $100,000 to $149,999 | 32 (10.5%) | 23 (4.5%) |
| $150,000 or more | 39 (12.8%) | 0 (0.0%) |
| Total | 304 (100.0%) | 508 (100.0%) |
Monthly Housing Cost Tiers in San Joaquin
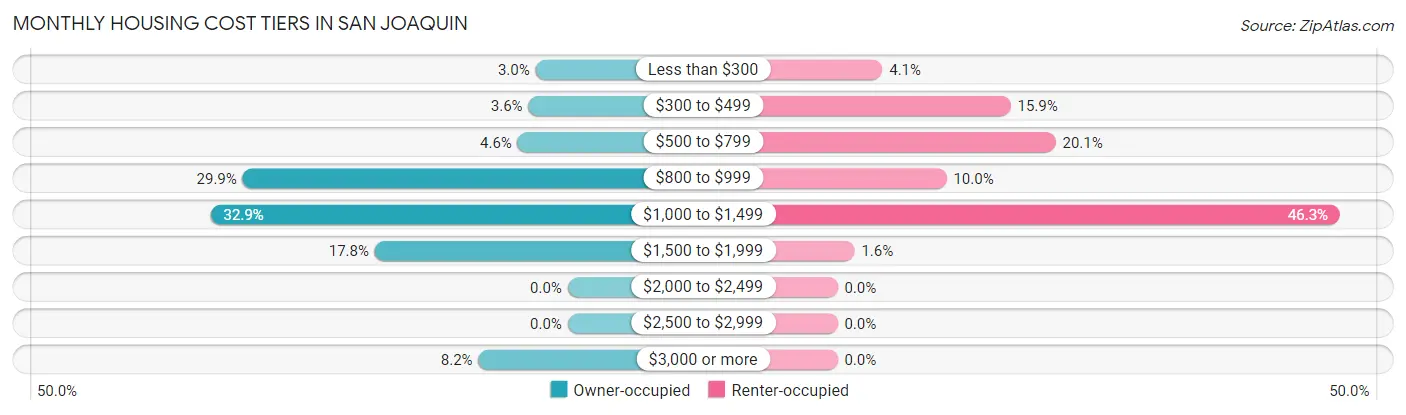
| Monthly Cost | Owner-occupied | Renter-occupied |
| Less than $300 | 9 (3.0%) | 21 (4.1%) |
| $300 to $499 | 11 (3.6%) | 81 (15.9%) |
| $500 to $799 | 14 (4.6%) | 102 (20.1%) |
| $800 to $999 | 91 (29.9%) | 51 (10.0%) |
| $1,000 to $1,499 | 100 (32.9%) | 235 (46.3%) |
| $1,500 to $1,999 | 54 (17.8%) | 8 (1.6%) |
| $2,000 to $2,499 | 0 (0.0%) | 0 (0.0%) |
| $2,500 to $2,999 | 0 (0.0%) | 0 (0.0%) |
| $3,000 or more | 25 (8.2%) | 0 (0.0%) |
| Total | 304 (100.0%) | 508 (100.0%) |
Physical Housing Characteristics in San Joaquin
Housing Structures in San Joaquin
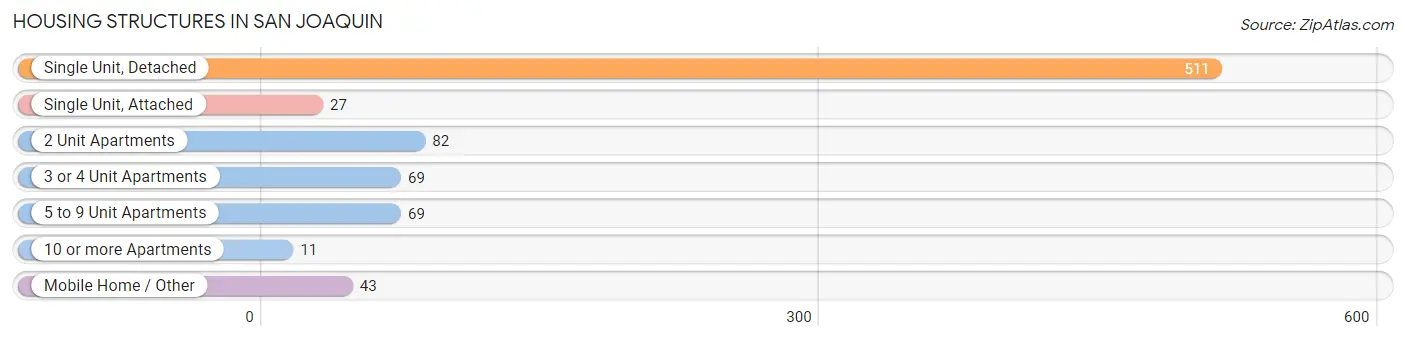
| Structure Type | # Housing Units | % Housing Units |
| Single Unit, Detached | 511 | 62.9% |
| Single Unit, Attached | 27 | 3.3% |
| 2 Unit Apartments | 82 | 10.1% |
| 3 or 4 Unit Apartments | 69 | 8.5% |
| 5 to 9 Unit Apartments | 69 | 8.5% |
| 10 or more Apartments | 11 | 1.3% |
| Mobile Home / Other | 43 | 5.3% |
| Total | 812 | 100.0% |
Housing Structures by Occupancy in San Joaquin
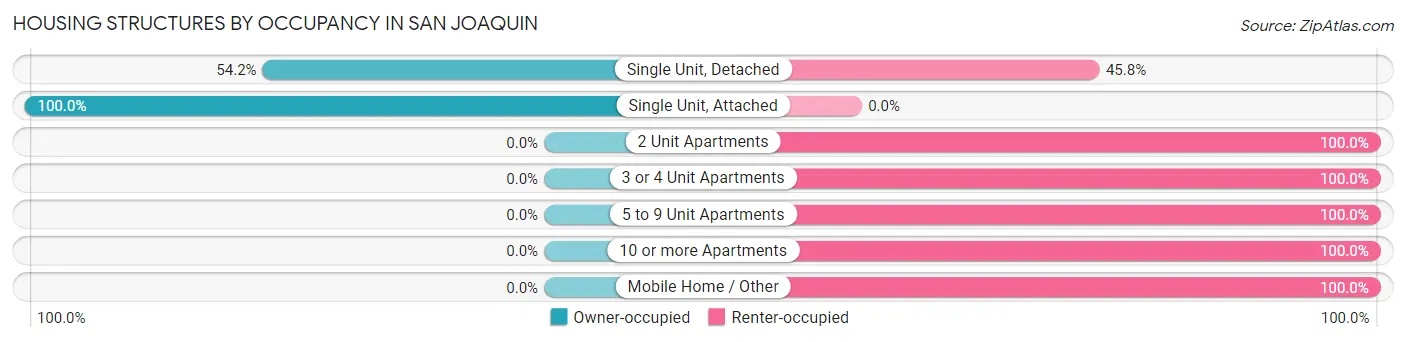
| Structure Type | Owner-occupied | Renter-occupied |
| Single Unit, Detached | 277 (54.2%) | 234 (45.8%) |
| Single Unit, Attached | 27 (100.0%) | 0 (0.0%) |
| 2 Unit Apartments | 0 (0.0%) | 82 (100.0%) |
| 3 or 4 Unit Apartments | 0 (0.0%) | 69 (100.0%) |
| 5 to 9 Unit Apartments | 0 (0.0%) | 69 (100.0%) |
| 10 or more Apartments | 0 (0.0%) | 11 (100.0%) |
| Mobile Home / Other | 0 (0.0%) | 43 (100.0%) |
| Total | 304 (37.4%) | 508 (62.6%) |
Housing Structures by Number of Rooms in San Joaquin
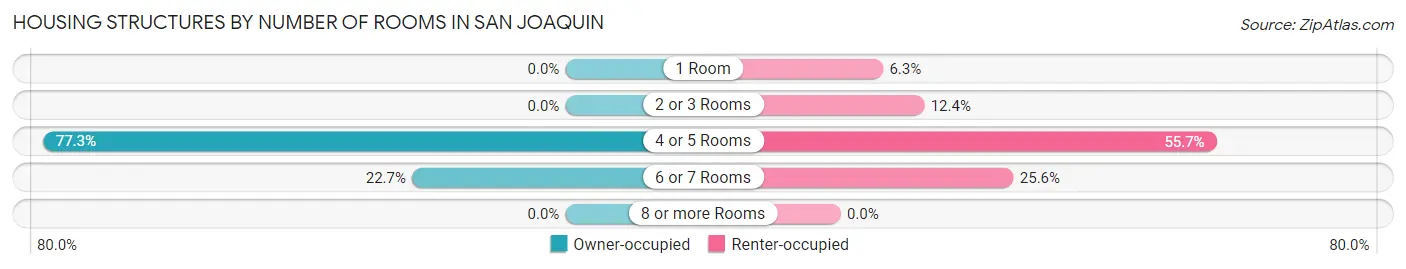
| Number of Rooms | Owner-occupied | Renter-occupied |
| 1 Room | 0 (0.0%) | 32 (6.3%) |
| 2 or 3 Rooms | 0 (0.0%) | 63 (12.4%) |
| 4 or 5 Rooms | 235 (77.3%) | 283 (55.7%) |
| 6 or 7 Rooms | 69 (22.7%) | 130 (25.6%) |
| 8 or more Rooms | 0 (0.0%) | 0 (0.0%) |
| Total | 304 (100.0%) | 508 (100.0%) |
Housing Structure by Heating Type in San Joaquin
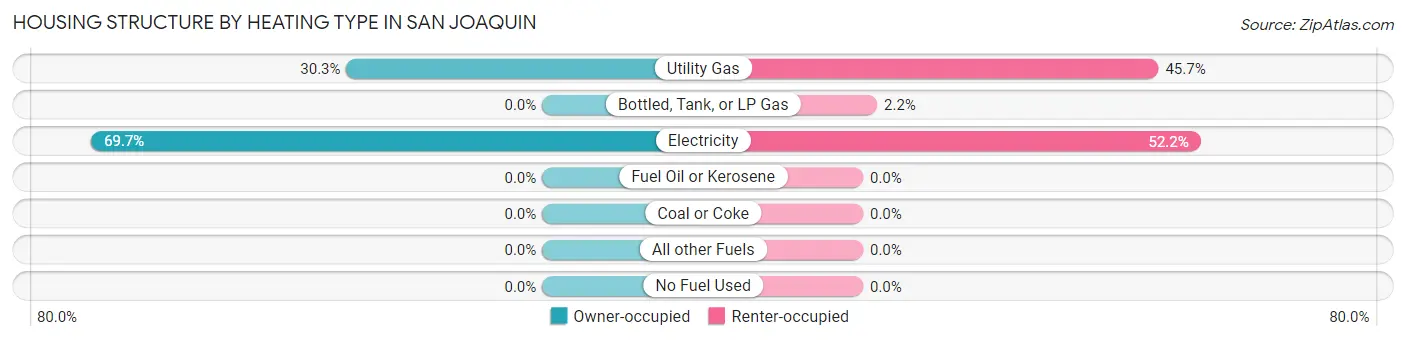
| Heating Type | Owner-occupied | Renter-occupied |
| Utility Gas | 92 (30.3%) | 232 (45.7%) |
| Bottled, Tank, or LP Gas | 0 (0.0%) | 11 (2.2%) |
| Electricity | 212 (69.7%) | 265 (52.2%) |
| Fuel Oil or Kerosene | 0 (0.0%) | 0 (0.0%) |
| Coal or Coke | 0 (0.0%) | 0 (0.0%) |
| All other Fuels | 0 (0.0%) | 0 (0.0%) |
| No Fuel Used | 0 (0.0%) | 0 (0.0%) |
| Total | 304 (100.0%) | 508 (100.0%) |
Household Vehicle Usage in San Joaquin
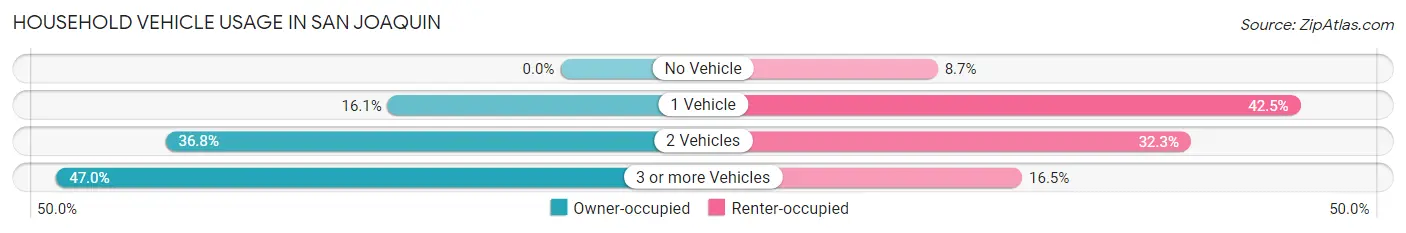
| Vehicles per Household | Owner-occupied | Renter-occupied |
| No Vehicle | 0 (0.0%) | 44 (8.7%) |
| 1 Vehicle | 49 (16.1%) | 216 (42.5%) |
| 2 Vehicles | 112 (36.8%) | 164 (32.3%) |
| 3 or more Vehicles | 143 (47.0%) | 84 (16.5%) |
| Total | 304 (100.0%) | 508 (100.0%) |
Real Estate & Mortgages in San Joaquin
Real Estate and Mortgage Overview in San Joaquin
| Characteristic | Without Mortgage | With Mortgage |
| Housing Units | 20 | 284 |
| Median Property Value | - | - |
| Median Household Income | - | - |
| Monthly Housing Costs | - | - |
| Real Estate Taxes | - | - |
Property Value by Mortgage Status in San Joaquin
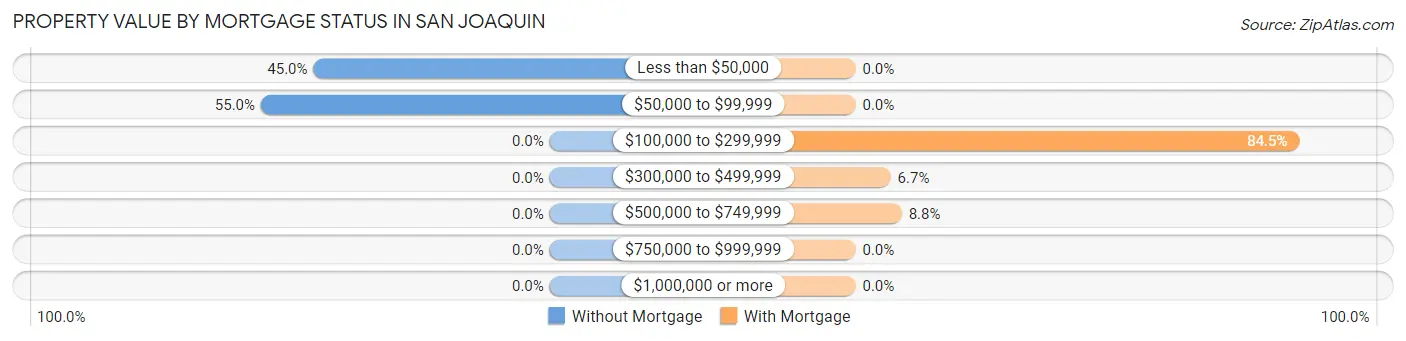
| Property Value | Without Mortgage | With Mortgage |
| Less than $50,000 | 9 (45.0%) | 0 (0.0%) |
| $50,000 to $99,999 | 11 (55.0%) | 0 (0.0%) |
| $100,000 to $299,999 | 0 (0.0%) | 240 (84.5%) |
| $300,000 to $499,999 | 0 (0.0%) | 19 (6.7%) |
| $500,000 to $749,999 | 0 (0.0%) | 25 (8.8%) |
| $750,000 to $999,999 | 0 (0.0%) | 0 (0.0%) |
| $1,000,000 or more | 0 (0.0%) | 0 (0.0%) |
| Total | 20 (100.0%) | 284 (100.0%) |
Household Income by Mortgage Status in San Joaquin
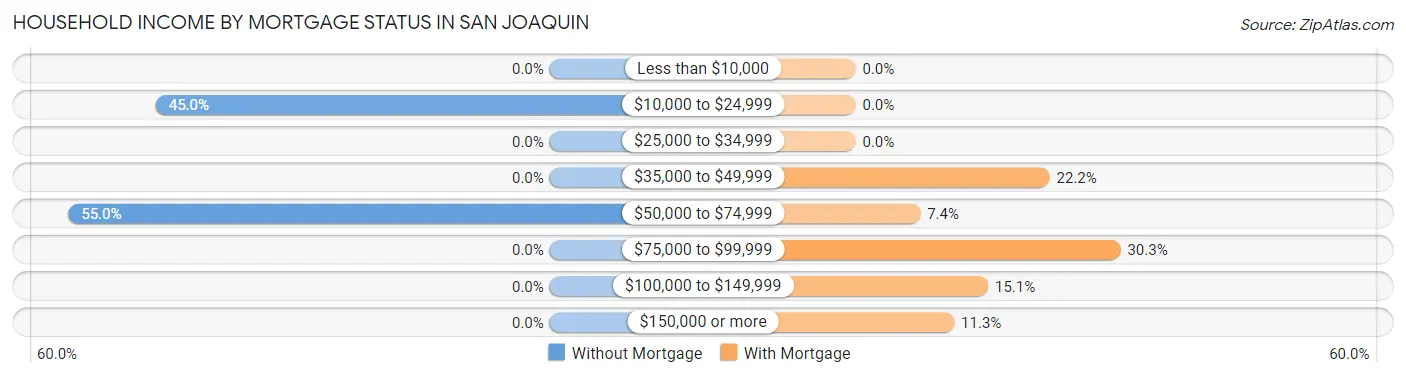
| Household Income | Without Mortgage | With Mortgage |
| Less than $10,000 | 0 (0.0%) | 0 (0.0%) |
| $10,000 to $24,999 | 9 (45.0%) | 0 (0.0%) |
| $25,000 to $34,999 | 0 (0.0%) | 0 (0.0%) |
| $35,000 to $49,999 | 0 (0.0%) | 63 (22.2%) |
| $50,000 to $74,999 | 11 (55.0%) | 21 (7.4%) |
| $75,000 to $99,999 | 0 (0.0%) | 86 (30.3%) |
| $100,000 to $149,999 | 0 (0.0%) | 43 (15.1%) |
| $150,000 or more | 0 (0.0%) | 32 (11.3%) |
| Total | 20 (100.0%) | 284 (100.0%) |
Property Value to Household Income Ratio in San Joaquin
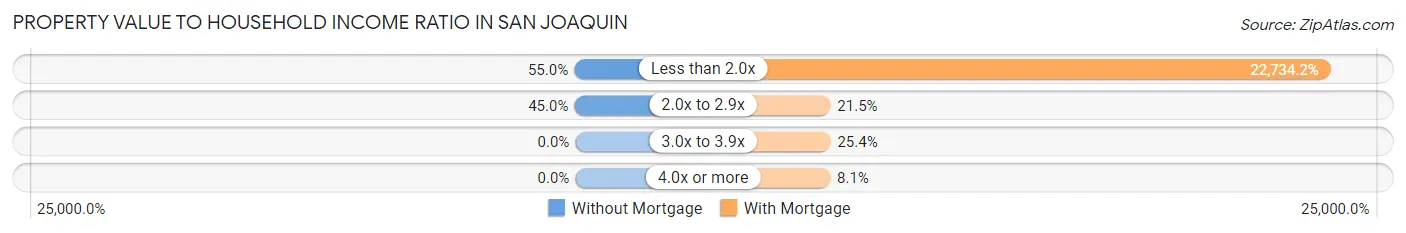
| Value-to-Income Ratio | Without Mortgage | With Mortgage |
| Less than 2.0x | 11 (55.0%) | 64,565 (22,734.1%) |
| 2.0x to 2.9x | 9 (45.0%) | 61 (21.5%) |
| 3.0x to 3.9x | 0 (0.0%) | 72 (25.4%) |
| 4.0x or more | 0 (0.0%) | 23 (8.1%) |
| Total | 20 (100.0%) | 284 (100.0%) |
Real Estate Taxes by Mortgage Status in San Joaquin
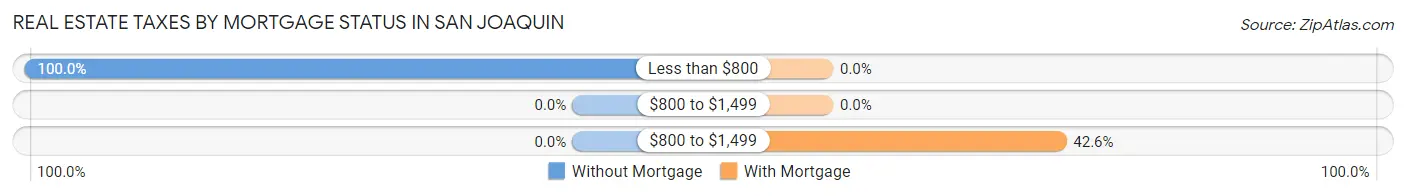
| Property Taxes | Without Mortgage | With Mortgage |
| Less than $800 | 20 (100.0%) | 0 (0.0%) |
| $800 to $1,499 | 0 (0.0%) | 0 (0.0%) |
| $800 to $1,499 | 0 (0.0%) | 121 (42.6%) |
| Total | 20 (100.0%) | 284 (100.0%) |
Health & Disability in San Joaquin
Health Insurance Coverage by Age in San Joaquin
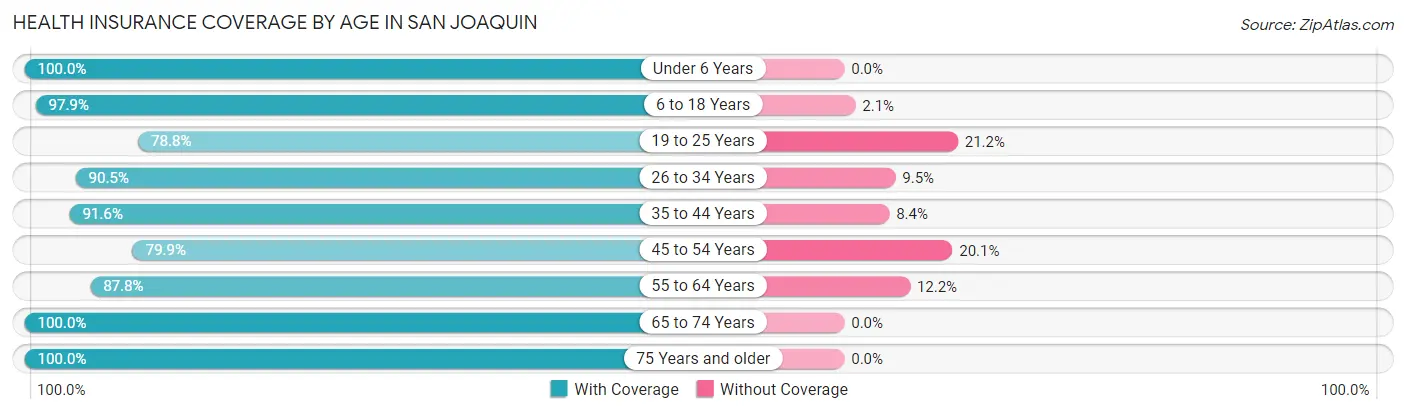
| Age Bracket | With Coverage | Without Coverage |
| Under 6 Years | 469 (100.0%) | 0 (0.0%) |
| 6 to 18 Years | 997 (97.9%) | 21 (2.1%) |
| 19 to 25 Years | 350 (78.8%) | 94 (21.2%) |
| 26 to 34 Years | 475 (90.5%) | 50 (9.5%) |
| 35 to 44 Years | 448 (91.6%) | 41 (8.4%) |
| 45 to 54 Years | 226 (79.9%) | 57 (20.1%) |
| 55 to 64 Years | 258 (87.8%) | 36 (12.2%) |
| 65 to 74 Years | 93 (100.0%) | 0 (0.0%) |
| 75 Years and older | 110 (100.0%) | 0 (0.0%) |
| Total | 3,426 (92.0%) | 299 (8.0%) |
Health Insurance Coverage by Citizenship Status in San Joaquin
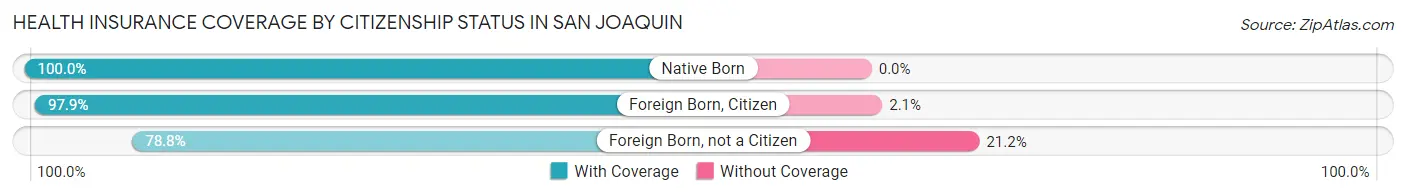
| Citizenship Status | With Coverage | Without Coverage |
| Native Born | 469 (100.0%) | 0 (0.0%) |
| Foreign Born, Citizen | 997 (97.9%) | 21 (2.1%) |
| Foreign Born, not a Citizen | 350 (78.8%) | 94 (21.2%) |
Health Insurance Coverage by Household Income in San Joaquin
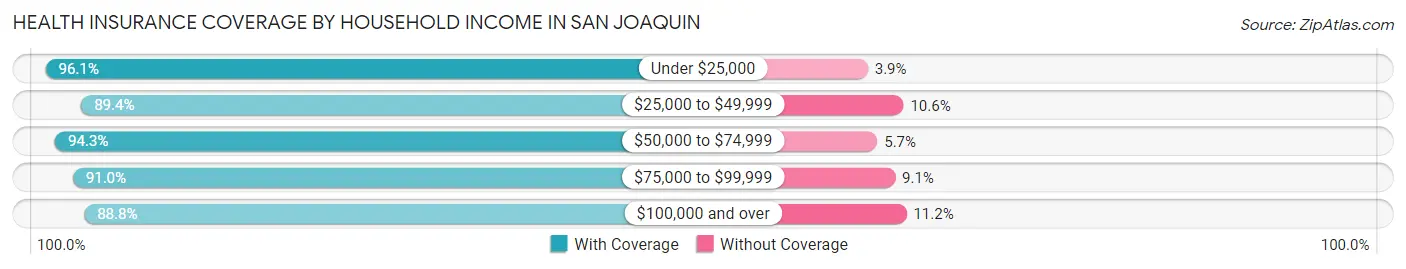
| Household Income | With Coverage | Without Coverage |
| Under $25,000 | 513 (96.1%) | 21 (3.9%) |
| $25,000 to $49,999 | 1,027 (89.4%) | 122 (10.6%) |
| $50,000 to $74,999 | 1,089 (94.3%) | 66 (5.7%) |
| $75,000 to $99,999 | 392 (90.9%) | 39 (9.0%) |
| $100,000 and over | 405 (88.8%) | 51 (11.2%) |
Public vs Private Health Insurance Coverage by Age in San Joaquin
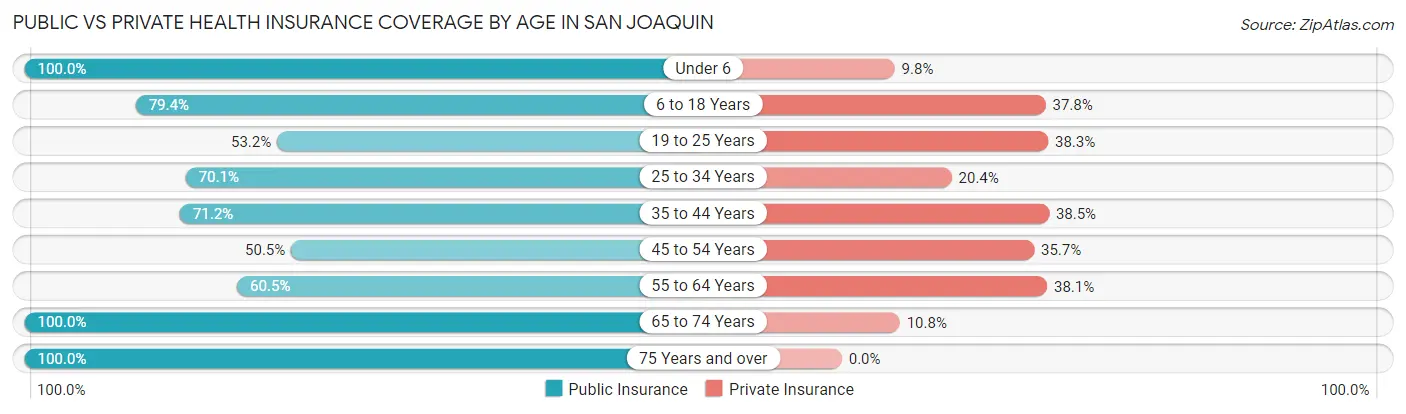
| Age Bracket | Public Insurance | Private Insurance |
| Under 6 | 469 (100.0%) | 46 (9.8%) |
| 6 to 18 Years | 808 (79.4%) | 385 (37.8%) |
| 19 to 25 Years | 236 (53.1%) | 170 (38.3%) |
| 25 to 34 Years | 368 (70.1%) | 107 (20.4%) |
| 35 to 44 Years | 348 (71.2%) | 188 (38.5%) |
| 45 to 54 Years | 143 (50.5%) | 101 (35.7%) |
| 55 to 64 Years | 178 (60.5%) | 112 (38.1%) |
| 65 to 74 Years | 93 (100.0%) | 10 (10.7%) |
| 75 Years and over | 110 (100.0%) | 0 (0.0%) |
| Total | 2,753 (73.9%) | 1,119 (30.0%) |
Disability Status by Sex by Age in San Joaquin
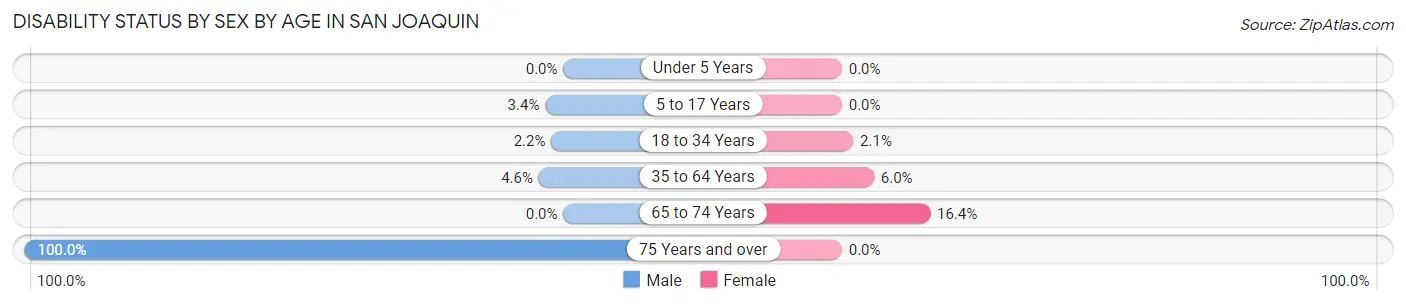
| Age Bracket | Male | Female |
| Under 5 Years | 0 (0.0%) | 0 (0.0%) |
| 5 to 17 Years | 16 (3.4%) | 0 (0.0%) |
| 18 to 34 Years | 12 (2.2%) | 10 (2.1%) |
| 35 to 64 Years | 24 (4.5%) | 32 (5.9%) |
| 65 to 74 Years | 0 (0.0%) | 10 (16.4%) |
| 75 Years and over | 42 (100.0%) | 0 (0.0%) |
Disability Class by Sex by Age in San Joaquin
Disability Class: Hearing Difficulty
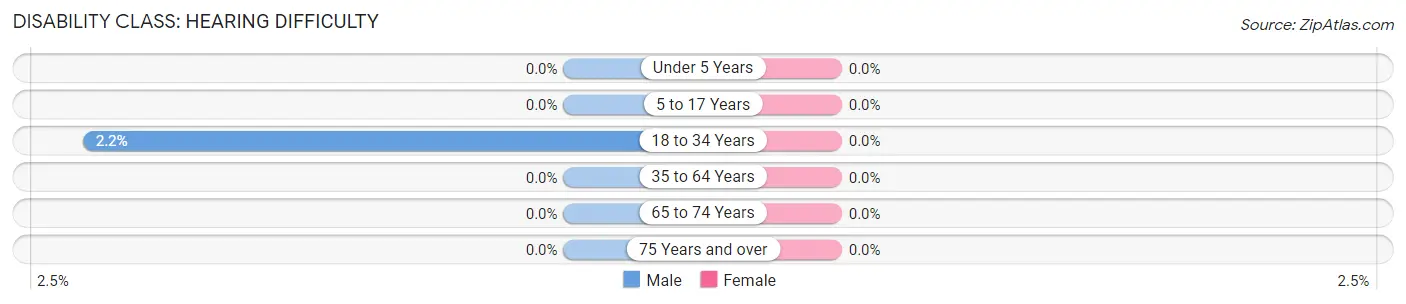
| Age Bracket | Male | Female |
| Under 5 Years | 0 (0.0%) | 0 (0.0%) |
| 5 to 17 Years | 0 (0.0%) | 0 (0.0%) |
| 18 to 34 Years | 12 (2.2%) | 0 (0.0%) |
| 35 to 64 Years | 0 (0.0%) | 0 (0.0%) |
| 65 to 74 Years | 0 (0.0%) | 0 (0.0%) |
| 75 Years and over | 0 (0.0%) | 0 (0.0%) |
Disability Class: Vision Difficulty
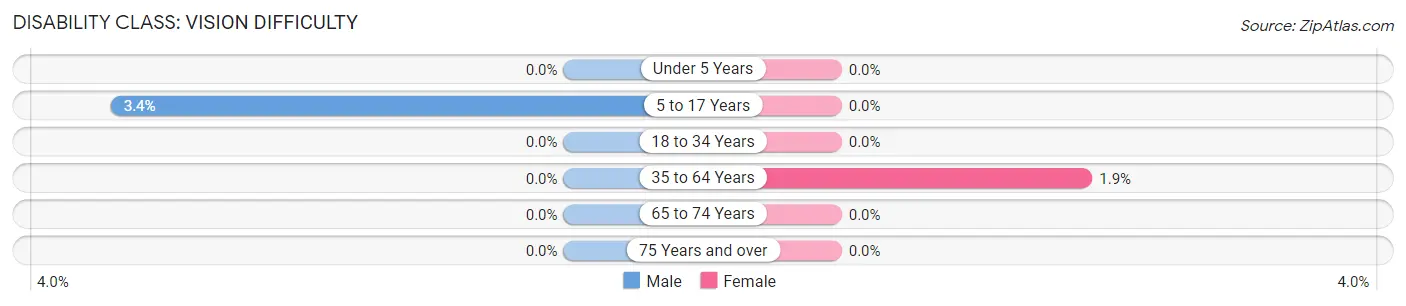
| Age Bracket | Male | Female |
| Under 5 Years | 0 (0.0%) | 0 (0.0%) |
| 5 to 17 Years | 16 (3.4%) | 0 (0.0%) |
| 18 to 34 Years | 0 (0.0%) | 0 (0.0%) |
| 35 to 64 Years | 0 (0.0%) | 10 (1.9%) |
| 65 to 74 Years | 0 (0.0%) | 0 (0.0%) |
| 75 Years and over | 0 (0.0%) | 0 (0.0%) |
Disability Class: Cognitive Difficulty
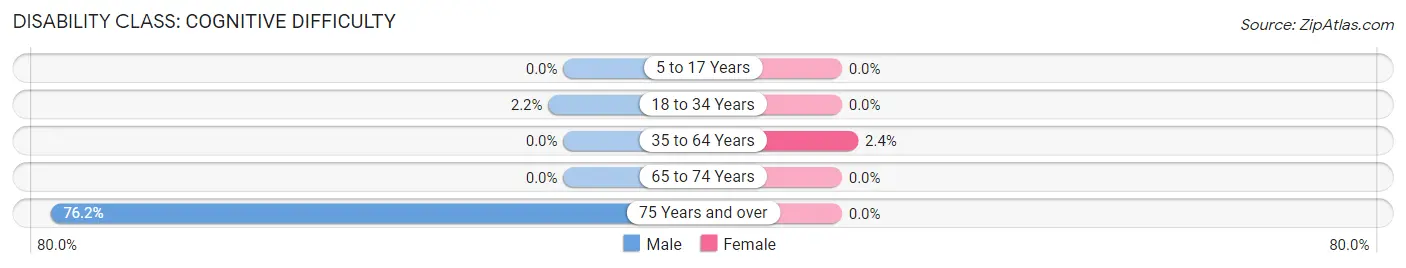
| Age Bracket | Male | Female |
| 5 to 17 Years | 0 (0.0%) | 0 (0.0%) |
| 18 to 34 Years | 12 (2.2%) | 0 (0.0%) |
| 35 to 64 Years | 0 (0.0%) | 13 (2.4%) |
| 65 to 74 Years | 0 (0.0%) | 0 (0.0%) |
| 75 Years and over | 32 (76.2%) | 0 (0.0%) |
Disability Class: Ambulatory Difficulty
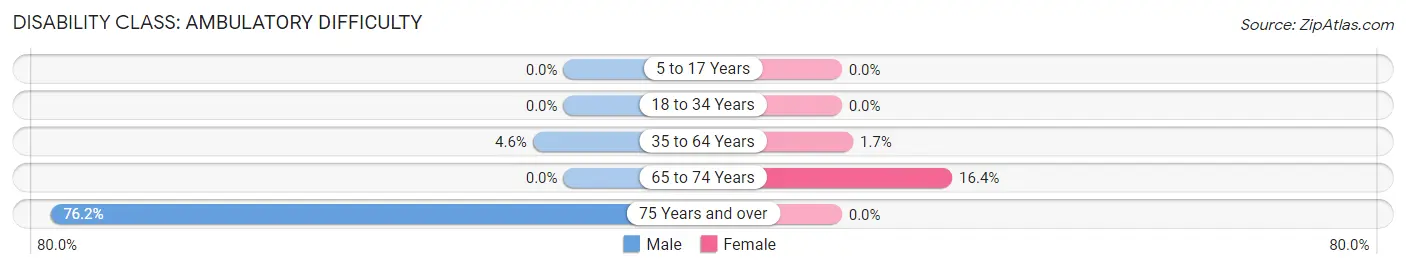
| Age Bracket | Male | Female |
| 5 to 17 Years | 0 (0.0%) | 0 (0.0%) |
| 18 to 34 Years | 0 (0.0%) | 0 (0.0%) |
| 35 to 64 Years | 24 (4.5%) | 9 (1.7%) |
| 65 to 74 Years | 0 (0.0%) | 10 (16.4%) |
| 75 Years and over | 32 (76.2%) | 0 (0.0%) |
Disability Class: Self-Care Difficulty
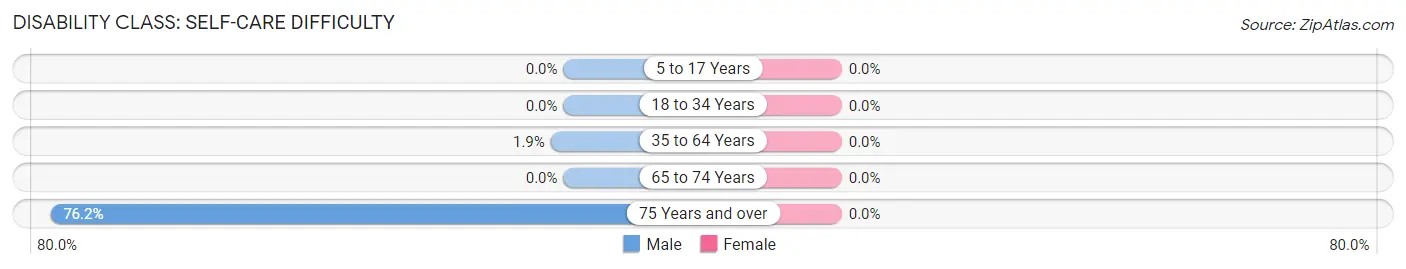
| Age Bracket | Male | Female |
| 5 to 17 Years | 0 (0.0%) | 0 (0.0%) |
| 18 to 34 Years | 0 (0.0%) | 0 (0.0%) |
| 35 to 64 Years | 10 (1.9%) | 0 (0.0%) |
| 65 to 74 Years | 0 (0.0%) | 0 (0.0%) |
| 75 Years and over | 32 (76.2%) | 0 (0.0%) |
Technology Access in San Joaquin
Computing Device Access in San Joaquin
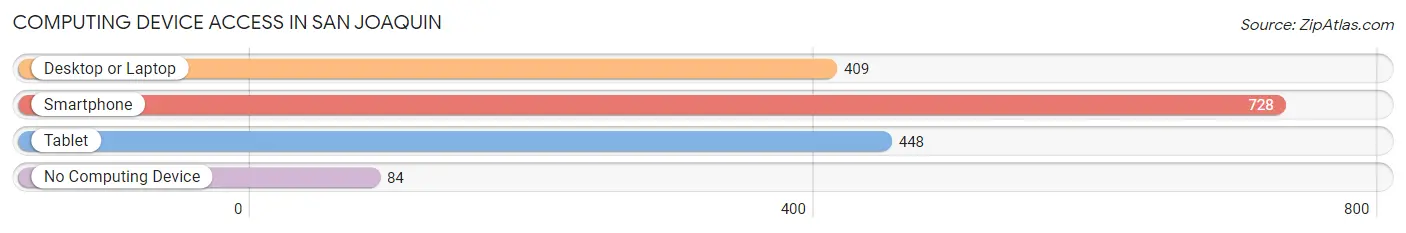
| Device Type | # Households | % Households |
| Desktop or Laptop | 409 | 50.4% |
| Smartphone | 728 | 89.7% |
| Tablet | 448 | 55.2% |
| No Computing Device | 84 | 10.3% |
| Total | 812 | 100.0% |
Internet Access in San Joaquin
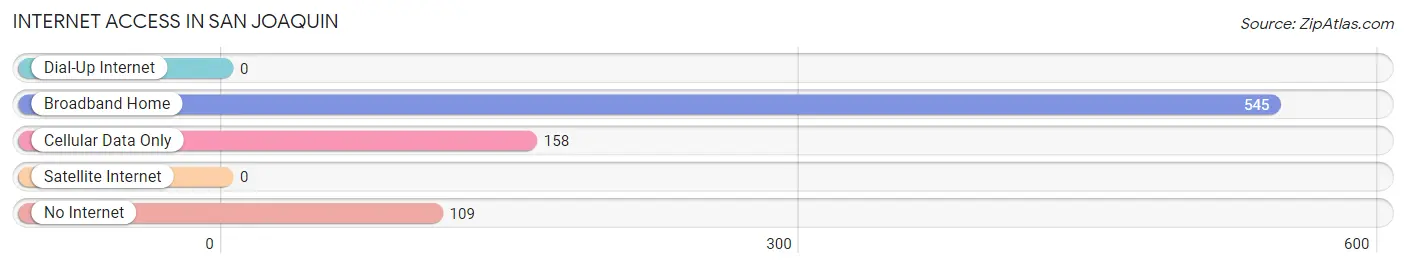
| Internet Type | # Households | % Households |
| Dial-Up Internet | 0 | 0.0% |
| Broadband Home | 545 | 67.1% |
| Cellular Data Only | 158 | 19.5% |
| Satellite Internet | 0 | 0.0% |
| No Internet | 109 | 13.4% |
| Total | 812 | 100.0% |
San Joaquin Summary
San Joaquin is a county located in the Central Valley of California, United States. It is the largest county in the state by population and the eighth-most populous county in the United States. The county seat is Stockton, which is the largest city in the county. San Joaquin County is located in the heart of the Central Valley, an agricultural region that produces a variety of crops, including grapes, almonds, tomatoes, and cotton.
History
San Joaquin County was formed in 1855 from parts of Calaveras and Tuolumne counties. It was named after the San Joaquin River, which runs through the county. The county was originally inhabited by the Yokuts and Miwok Native American tribes. The first European settlers arrived in the area in the early 1800s, and the county was officially established in 1855.
Geography
San Joaquin County is located in the Central Valley of California, between the Sierra Nevada Mountains to the east and the Coast Range to the west. The county covers an area of 1,426 square miles, making it the largest county in California by area. The county is bordered by Stanislaus County to the north, Merced County to the south, Calaveras County to the east, and Contra Costa County to the west. The county is divided into five regions: the Delta, the Stockton Metropolitan Area, the San Joaquin Valley, the foothills, and the Sierra Nevada.
The Delta region is located in the northern part of the county and is home to the San Joaquin River and its tributaries. The Stockton Metropolitan Area is located in the central part of the county and is home to the cities of Stockton, Lodi, and Tracy. The San Joaquin Valley is located in the southern part of the county and is home to the cities of Manteca, Lathrop, and Ripon. The foothills are located in the eastern part of the county and are home to the cities of Escalon, Lodi, and Galt. The Sierra Nevada is located in the western part of the county and is home to the cities of Jackson, Valley Springs, and Copperopolis.
Economy
San Joaquin County is a major agricultural center, producing a variety of crops, including grapes, almonds, tomatoes, and cotton. The county is also home to a number of manufacturing and technology companies, including Intel, E&J Gallo Winery, and Foster Farms. The county is also home to a number of military bases, including the Stockton Army Depot and the Tracy Naval Air Station.
Demographics
As of the 2010 census, San Joaquin County had a population of 685,306. The racial makeup of the county was 57.2% White, 5.3% African American, 1.2% Native American, 11.2% Asian, 0.4% Pacific Islander, and 24.7% from other races. Hispanic or Latino of any race were 44.3% of the population.
The median household income in the county was $56,811 and the median family income was $64,919. The per capita income was $25,845. About 14.2% of the population was below the poverty line.
San Joaquin County is home to a diverse population, with a variety of cultures and backgrounds. The county is home to a large Hispanic population, as well as a large Asian population. The county is also home to a large number of military personnel and veterans.
Common Questions
What is Per Capita Income in San Joaquin?
Per Capita income in San Joaquin is $13,002.
What is the Median Family Income in San Joaquin?
Median Family Income in San Joaquin is $47,875.
What is the Median Household income in San Joaquin?
Median Household Income in San Joaquin is $43,750.
What is Income or Wage Gap in San Joaquin?
Income or Wage Gap in San Joaquin is 26.3%.
Women in San Joaquin earn 73.7 cents for every dollar earned by a man.
What is Family Income Deficit in San Joaquin?
Family Income Deficit in San Joaquin is $7,706.
Families that are below poverty line in San Joaquin earn $7,706 less on average than the poverty threshold level.
What is Inequality or Gini Index in San Joaquin?
Inequality or Gini Index in San Joaquin is 0.43.
What is the Total Population of San Joaquin?
Total Population of San Joaquin is 3,725.
What is the Total Male Population of San Joaquin?
Total Male Population of San Joaquin is 1,785.
What is the Total Female Population of San Joaquin?
Total Female Population of San Joaquin is 1,940.
What is the Ratio of Males per 100 Females in San Joaquin?
There are 92.01 Males per 100 Females in San Joaquin.
What is the Ratio of Females per 100 Males in San Joaquin?
There are 108.68 Females per 100 Males in San Joaquin.
What is the Median Population Age in San Joaquin?
Median Population Age in San Joaquin is 24.5 Years.
What is the Average Family Size in San Joaquin
Average Family Size in San Joaquin is 4.8 People.
What is the Average Household Size in San Joaquin
Average Household Size in San Joaquin is 4.6 People.
How Large is the Labor Force in San Joaquin?
There are 1,264 People in the Labor Forcein in San Joaquin.
What is the Percentage of People in the Labor Force in San Joaquin?
52.5% of People are in the Labor Force in San Joaquin.
What is the Unemployment Rate in San Joaquin?
Unemployment Rate in San Joaquin is 18.9%.