Zip Codes with the Highest Percentage of Population Employed in Agriculture, Fishing & Hunting in San Francisco, CA
RELATED REPORTS & OPTIONS
Agriculture, Fishing & Hunting
San Francisco
Compare Zip Codes
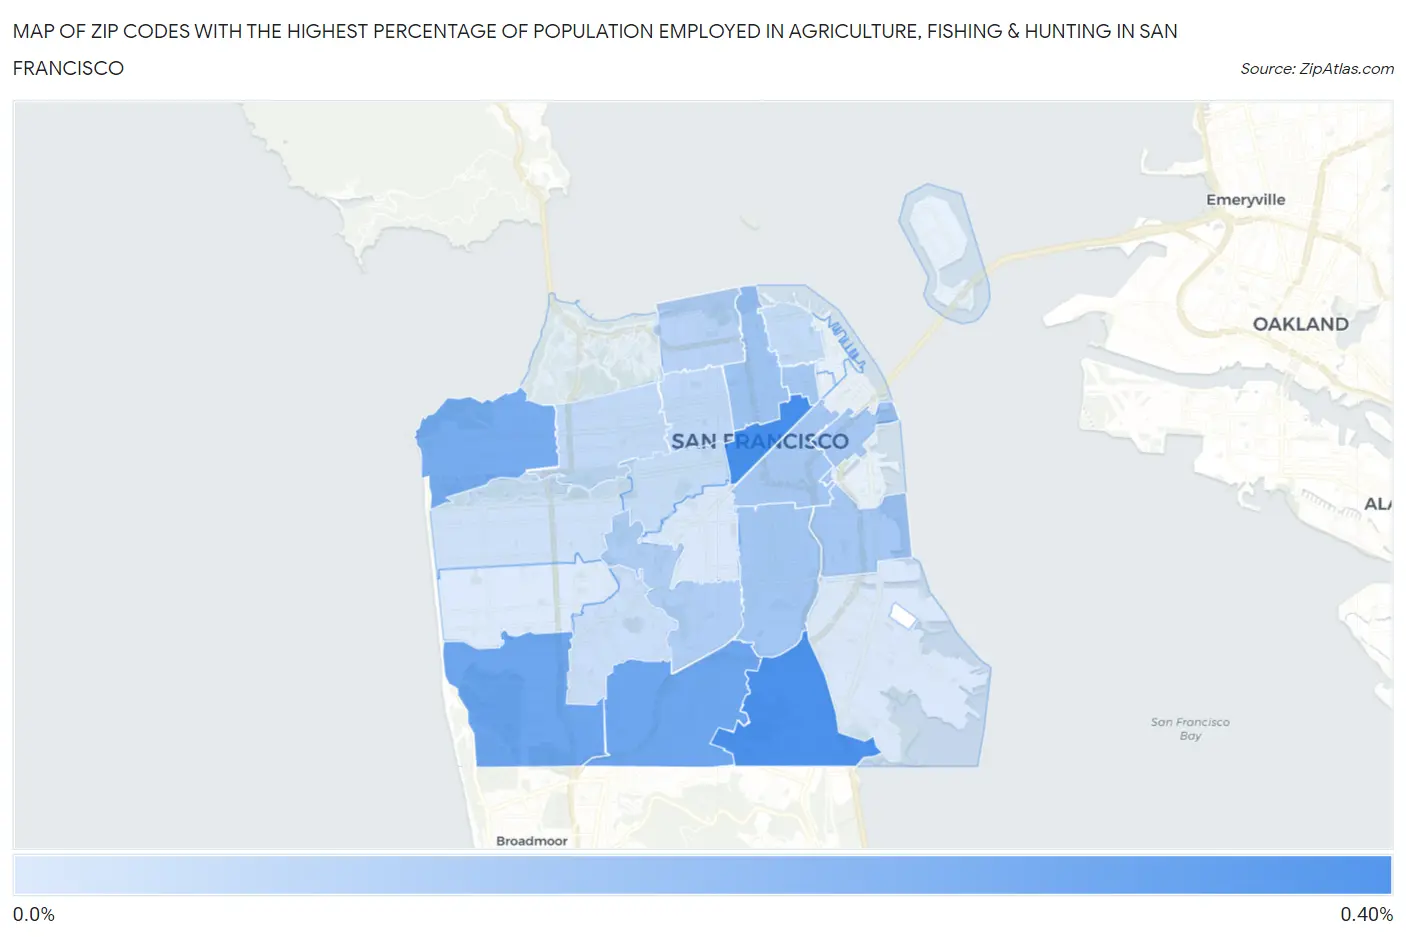
Map of Zip Codes with the Highest Percentage of Population Employed in Agriculture, Fishing & Hunting in San Francisco
0.0%
0.40%
Zip Codes with the Highest Percentage of Population Employed in Agriculture, Fishing & Hunting in San Francisco, CA
| Zip Code | % Employed | vs State | vs National | |
| 1. | 94102 | 0.39% | 2.0%(-1.59)#1,042 | 1.2%(-0.805)#20,214 |
| 2. | 94134 | 0.38% | 2.0%(-1.60)#1,051 | 1.2%(-0.815)#20,300 |
| 3. | 94132 | 0.30% | 2.0%(-1.68)#1,120 | 1.2%(-0.897)#21,151 |
| 4. | 94112 | 0.30% | 2.0%(-1.69)#1,122 | 1.2%(-0.899)#21,171 |
| 5. | 94121 | 0.28% | 2.0%(-1.71)#1,140 | 1.2%(-0.922)#21,447 |
| 6. | 94109 | 0.18% | 2.0%(-1.80)#1,239 | 1.2%(-1.02)#22,553 |
| 7. | 94110 | 0.18% | 2.0%(-1.81)#1,245 | 1.2%(-1.02)#22,648 |
| 8. | 94108 | 0.17% | 2.0%(-1.82)#1,257 | 1.2%(-1.03)#22,744 |
| 9. | 94107 | 0.17% | 2.0%(-1.82)#1,258 | 1.2%(-1.03)#22,757 |
| 10. | 94103 | 0.17% | 2.0%(-1.82)#1,260 | 1.2%(-1.03)#22,793 |
| 11. | 94131 | 0.15% | 2.0%(-1.84)#1,275 | 1.2%(-1.05)#23,034 |
| 12. | 94123 | 0.13% | 2.0%(-1.86)#1,296 | 1.2%(-1.07)#23,326 |
| 13. | 94115 | 0.10% | 2.0%(-1.88)#1,325 | 1.2%(-1.09)#23,601 |
| 14. | 94118 | 0.10% | 2.0%(-1.88)#1,330 | 1.2%(-1.10)#23,635 |
| 15. | 94133 | 0.096% | 2.0%(-1.89)#1,344 | 1.2%(-1.10)#23,734 |
| 16. | 94117 | 0.089% | 2.0%(-1.90)#1,349 | 1.2%(-1.11)#23,830 |
| 17. | 94127 | 0.081% | 2.0%(-1.90)#1,361 | 1.2%(-1.12)#23,947 |
| 18. | 94122 | 0.067% | 2.0%(-1.92)#1,375 | 1.2%(-1.13)#24,146 |
| 19. | 94114 | 0.044% | 2.0%(-1.94)#1,393 | 1.2%(-1.16)#24,410 |
| 20. | 94124 | 0.041% | 2.0%(-1.94)#1,396 | 1.2%(-1.16)#24,436 |
| 21. | 94116 | 0.036% | 2.0%(-1.95)#1,399 | 1.2%(-1.16)#24,491 |
1
Common Questions
What are the Top 10 Zip Codes with the Highest Percentage of Population Employed in Agriculture, Fishing & Hunting in San Francisco, CA?
Top 10 Zip Codes with the Highest Percentage of Population Employed in Agriculture, Fishing & Hunting in San Francisco, CA are:
What zip code has the Highest Percentage of Population Employed in Agriculture, Fishing & Hunting in San Francisco, CA?
94102 has the Highest Percentage of Population Employed in Agriculture, Fishing & Hunting in San Francisco, CA with 0.39%.
What is the Percentage of Population Employed in Agriculture, Fishing & Hunting in San Francisco, CA?
Percentage of Population Employed in Agriculture, Fishing & Hunting in San Francisco is 0.16%.
What is the Percentage of Population Employed in Agriculture, Fishing & Hunting in California?
Percentage of Population Employed in Agriculture, Fishing & Hunting in California is 2.0%.
What is the Percentage of Population Employed in Agriculture, Fishing & Hunting in the United States?
Percentage of Population Employed in Agriculture, Fishing & Hunting in the United States is 1.2%.