Rough And Ready, CA Map & Demographics
Rough And Ready Map

Rough And Ready Overview
$35,624
PER CAPITA INCOME
$56,364
AVG FAMILY INCOME
0.37
INEQUALITY / GINI INDEX
623
TOTAL POPULATION
334
MALE POPULATION
289
FEMALE POPULATION
115.57
MALES / 100 FEMALES
86.53
FEMALES / 100 MALES
60.5
MEDIAN AGE
3.0
AVG FAMILY SIZE
2.0
AVG HOUSEHOLD SIZE
183
LABOR FORCE [ PEOPLE ]
36.5%
PERCENT IN LABOR FORCE
4.4%
UNEMPLOYMENT RATE
Rough And Ready Zip Codes
Rough And Ready Area Codes
Income in Rough And Ready
Income Overview in Rough And Ready
| Characteristic | Number | Measure |
| Per Capita Income | 623 | $35,624 |
| Median Family Income | 132 | $56,364 |
| Mean Family Income | 132 | $79,067 |
| Median Household Income | 318 | $0 |
| Mean Household Income | 318 | $64,502 |
| Income Deficit | 132 | $0 |
| Wage / Income Gap (%) | 623 | 0.00% |
| Wage / Income Gap ($) | 623 | 100.00¢ per $1 |
| Gini / Inequality Index | 623 | 0.37 |
Earnings by Sex in Rough And Ready
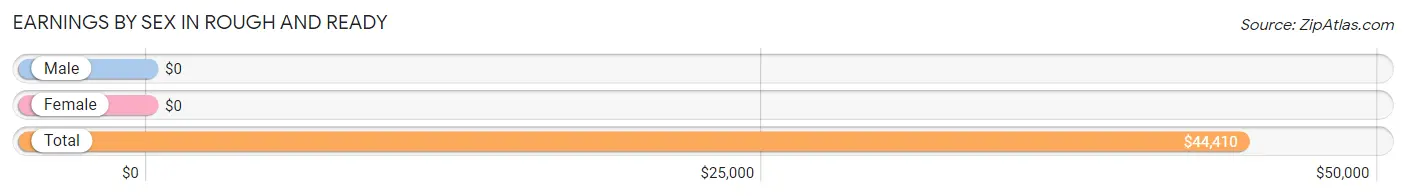
| Sex | Number | Average Earnings |
| Male | 82 (44.8%) | $0 |
| Female | 101 (55.2%) | $0 |
| Total | 183 (100.0%) | $44,410 |
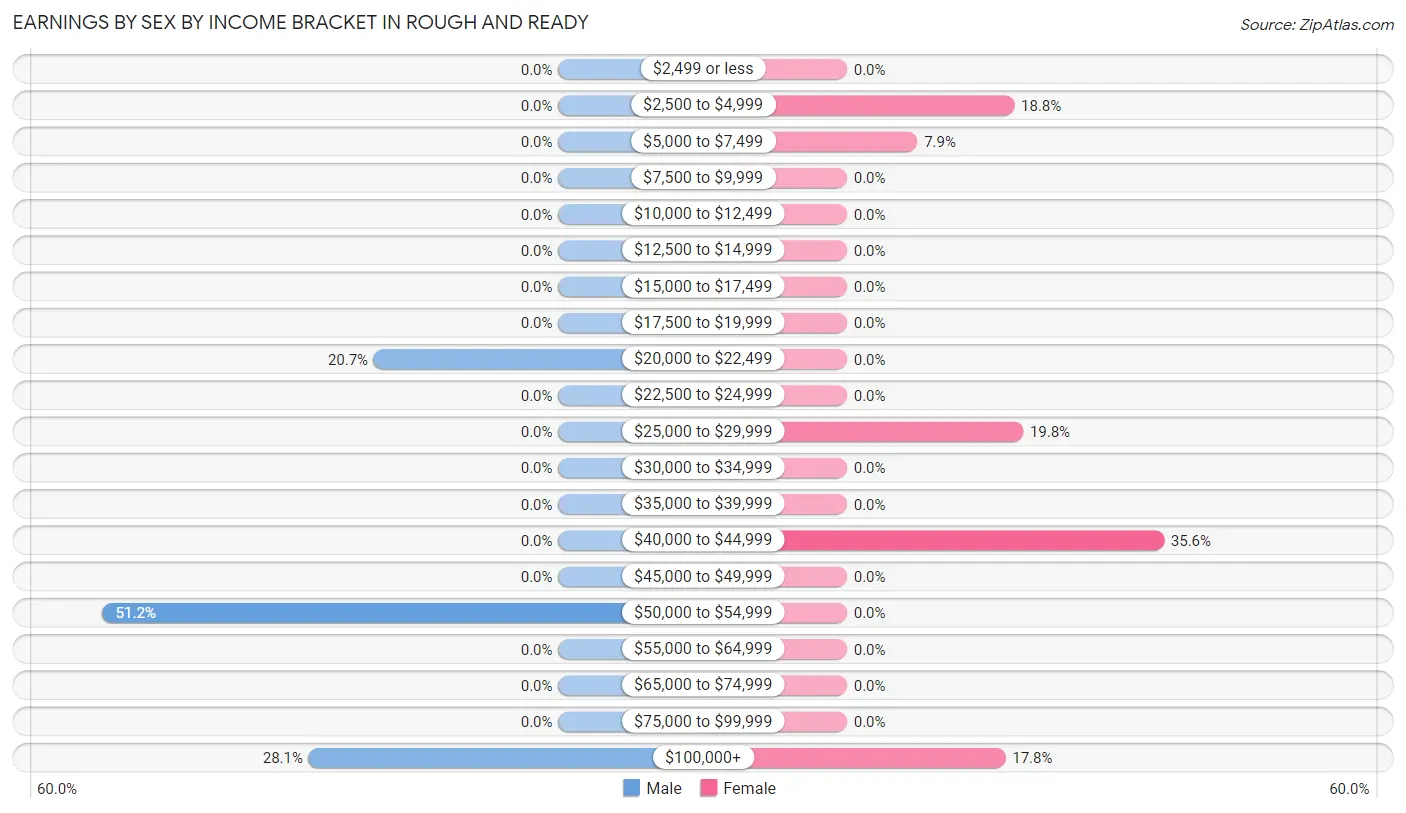
Earnings by Sex by Income Bracket in Rough And Ready
The most common earnings brackets in Rough And Ready are $50,000 to $54,999 for men (42 | 51.2%) and $40,000 to $44,999 for women (36 | 35.6%).
| Income | Male | Female |
| $2,499 or less | 0 (0.0%) | 0 (0.0%) |
| $2,500 to $4,999 | 0 (0.0%) | 19 (18.8%) |
| $5,000 to $7,499 | 0 (0.0%) | 8 (7.9%) |
| $7,500 to $9,999 | 0 (0.0%) | 0 (0.0%) |
| $10,000 to $12,499 | 0 (0.0%) | 0 (0.0%) |
| $12,500 to $14,999 | 0 (0.0%) | 0 (0.0%) |
| $15,000 to $17,499 | 0 (0.0%) | 0 (0.0%) |
| $17,500 to $19,999 | 0 (0.0%) | 0 (0.0%) |
| $20,000 to $22,499 | 17 (20.7%) | 0 (0.0%) |
| $22,500 to $24,999 | 0 (0.0%) | 0 (0.0%) |
| $25,000 to $29,999 | 0 (0.0%) | 20 (19.8%) |
| $30,000 to $34,999 | 0 (0.0%) | 0 (0.0%) |
| $35,000 to $39,999 | 0 (0.0%) | 0 (0.0%) |
| $40,000 to $44,999 | 0 (0.0%) | 36 (35.6%) |
| $45,000 to $49,999 | 0 (0.0%) | 0 (0.0%) |
| $50,000 to $54,999 | 42 (51.2%) | 0 (0.0%) |
| $55,000 to $64,999 | 0 (0.0%) | 0 (0.0%) |
| $65,000 to $74,999 | 0 (0.0%) | 0 (0.0%) |
| $75,000 to $99,999 | 0 (0.0%) | 0 (0.0%) |
| $100,000+ | 23 (28.1%) | 18 (17.8%) |
| Total | 82 (100.0%) | 101 (100.0%) |
Earnings by Sex by Educational Attainment in Rough And Ready
| Educational Attainment | Male Income | Female Income |
| Less than High School | - | - |
| High School Diploma | - | - |
| College or Associate's Degree | - | - |
| Bachelor's Degree | - | - |
| Graduate Degree | - | - |
| Total | - | - |
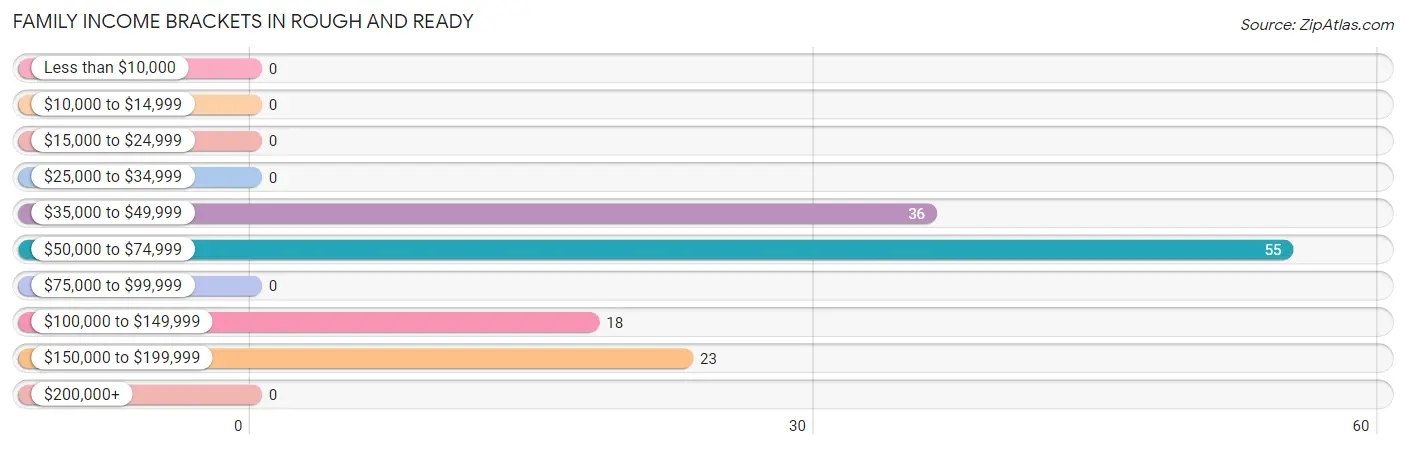
Family Income in Rough And Ready
Family Income Brackets in Rough And Ready
According to the Rough And Ready family income data, there are 55 families falling into the $50,000 to $74,999 income range, which is the most common income bracket and makes up 41.7% of all families.
| Income Bracket | # Families | % Families |
| Less than $10,000 | 0 | 0.0% |
| $10,000 to $14,999 | 0 | 0.0% |
| $15,000 to $24,999 | 0 | 0.0% |
| $25,000 to $34,999 | 0 | 0.0% |
| $35,000 to $49,999 | 36 | 27.3% |
| $50,000 to $74,999 | 55 | 41.7% |
| $75,000 to $99,999 | 0 | 0.0% |
| $100,000 to $149,999 | 18 | 13.6% |
| $150,000 to $199,999 | 23 | 17.4% |
| $200,000+ | 0 | 0.0% |
Family Income by Famaliy Size in Rough And Ready
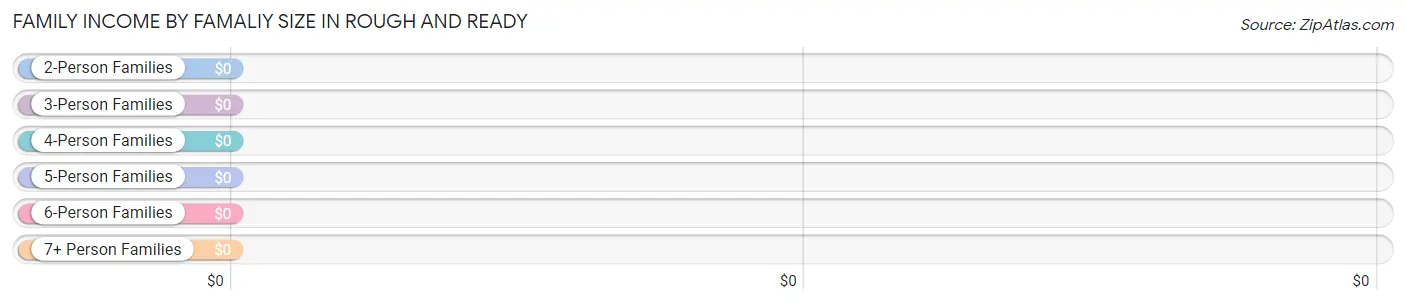
| Income Bracket | # Families | Median Income |
| 2-Person Families | 73 (55.3%) | $0 |
| 3-Person Families | 59 (44.7%) | $0 |
| 4-Person Families | 0 (0.0%) | $0 |
| 5-Person Families | 0 (0.0%) | $0 |
| 6-Person Families | 0 (0.0%) | $0 |
| 7+ Person Families | 0 (0.0%) | $0 |
| Total | 132 (100.0%) | $56,364 |
Family Income by Number of Earners in Rough And Ready
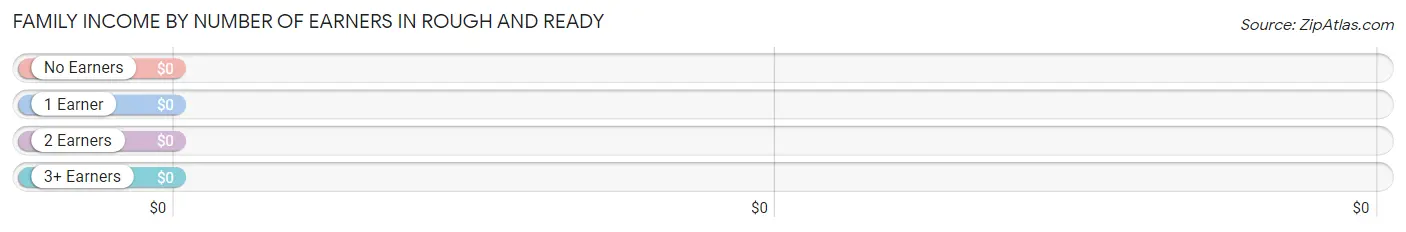
| Number of Earners | # Families | Median Income |
| No Earners | 55 (41.7%) | $0 |
| 1 Earner | 54 (40.9%) | $0 |
| 2 Earners | 23 (17.4%) | $0 |
| 3+ Earners | 0 (0.0%) | $0 |
| Total | 132 (100.0%) | $56,364 |
Household Income in Rough And Ready
Household Income Brackets in Rough And Ready
With 92 households falling in the category, the $75,000 to $99,999 income range is the most frequent in Rough And Ready, accounting for 28.9% of all households.
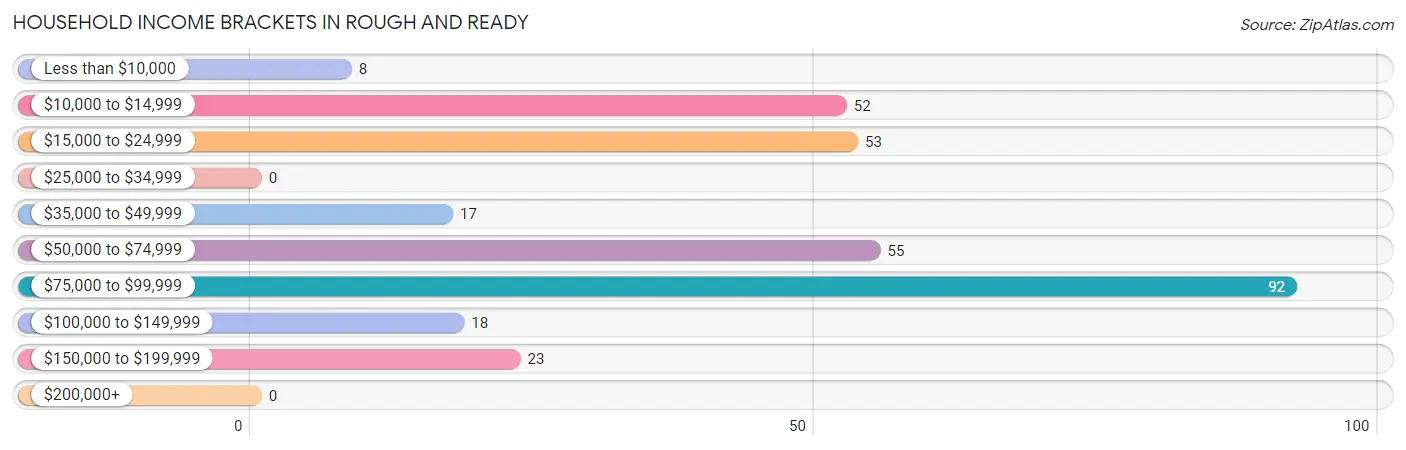
| Income Bracket | # Households | % Households |
| Less than $10,000 | 8 | 2.5% |
| $10,000 to $14,999 | 52 | 16.4% |
| $15,000 to $24,999 | 53 | 16.7% |
| $25,000 to $34,999 | 0 | 0.0% |
| $35,000 to $49,999 | 17 | 5.3% |
| $50,000 to $74,999 | 55 | 17.3% |
| $75,000 to $99,999 | 92 | 28.9% |
| $100,000 to $149,999 | 18 | 5.7% |
| $150,000 to $199,999 | 23 | 7.2% |
| $200,000+ | 0 | 0.0% |
Household Income by Householder Age in Rough And Ready
The median household income in Rough And Ready is $0, with the highest median household income of $56,318 found in the 65+ years age bracket for the primary householder. A total of 164 households (51.6%) fall into this category.
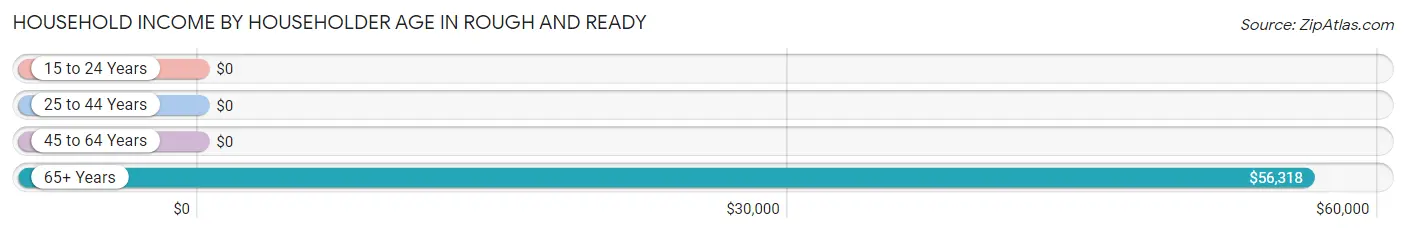
| Income Bracket | # Households | Median Income |
| 15 to 24 Years | 0 (0.0%) | $0 |
| 25 to 44 Years | 36 (11.3%) | $0 |
| 45 to 64 Years | 118 (37.1%) | $0 |
| 65+ Years | 164 (51.6%) | $56,318 |
| Total | 318 (100.0%) | $0 |
Poverty in Rough And Ready
Income Below Poverty by Sex and Age in Rough And Ready
With 15.6% poverty level for males and 2.8% for females among the residents of Rough And Ready, 55 to 64 year old males and 55 to 64 year old females are the most vulnerable to poverty, with 52 males (75.4%) and 8 females (100.0%) in their respective age groups living below the poverty level.
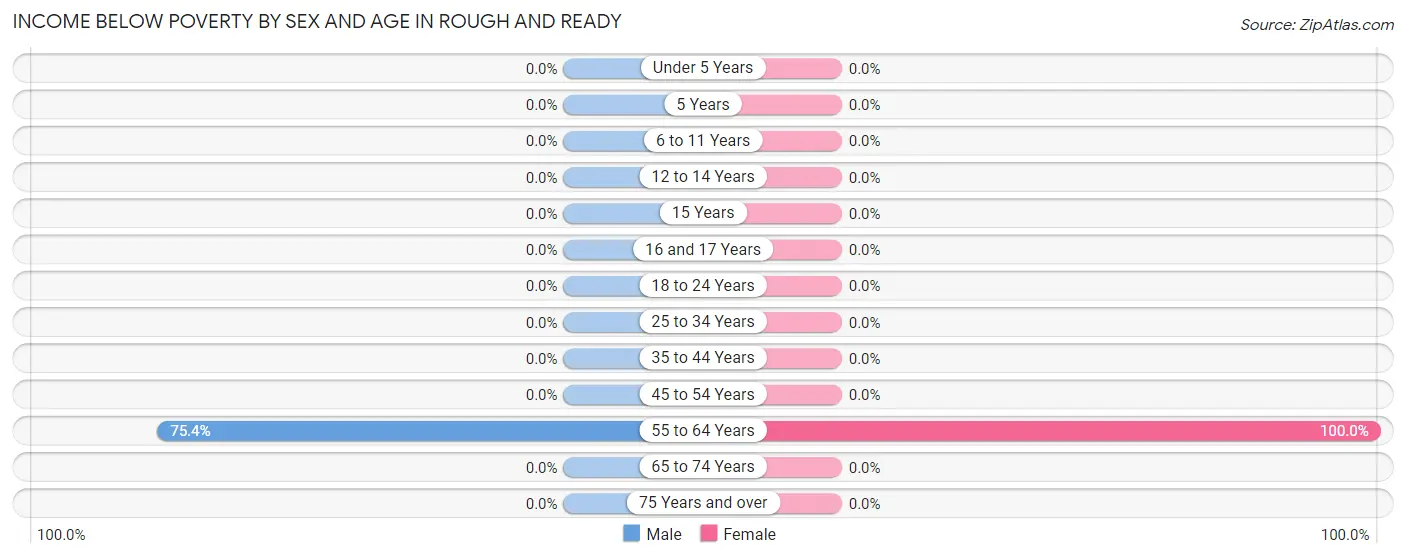
| Age Bracket | Male | Female |
| Under 5 Years | 0 (0.0%) | 0 (0.0%) |
| 5 Years | 0 (0.0%) | 0 (0.0%) |
| 6 to 11 Years | 0 (0.0%) | 0 (0.0%) |
| 12 to 14 Years | 0 (0.0%) | 0 (0.0%) |
| 15 Years | 0 (0.0%) | 0 (0.0%) |
| 16 and 17 Years | 0 (0.0%) | 0 (0.0%) |
| 18 to 24 Years | 0 (0.0%) | 0 (0.0%) |
| 25 to 34 Years | 0 (0.0%) | 0 (0.0%) |
| 35 to 44 Years | 0 (0.0%) | 0 (0.0%) |
| 45 to 54 Years | 0 (0.0%) | 0 (0.0%) |
| 55 to 64 Years | 52 (75.4%) | 8 (100.0%) |
| 65 to 74 Years | 0 (0.0%) | 0 (0.0%) |
| 75 Years and over | 0 (0.0%) | 0 (0.0%) |
| Total | 52 (15.6%) | 8 (2.8%) |
Income Above Poverty by Sex and Age in Rough And Ready
According to the poverty statistics in Rough And Ready, males aged 15 years and females aged 12 to 14 years are the age groups that are most secure financially, with 100.0% of males and 100.0% of females in these age groups living above the poverty line.
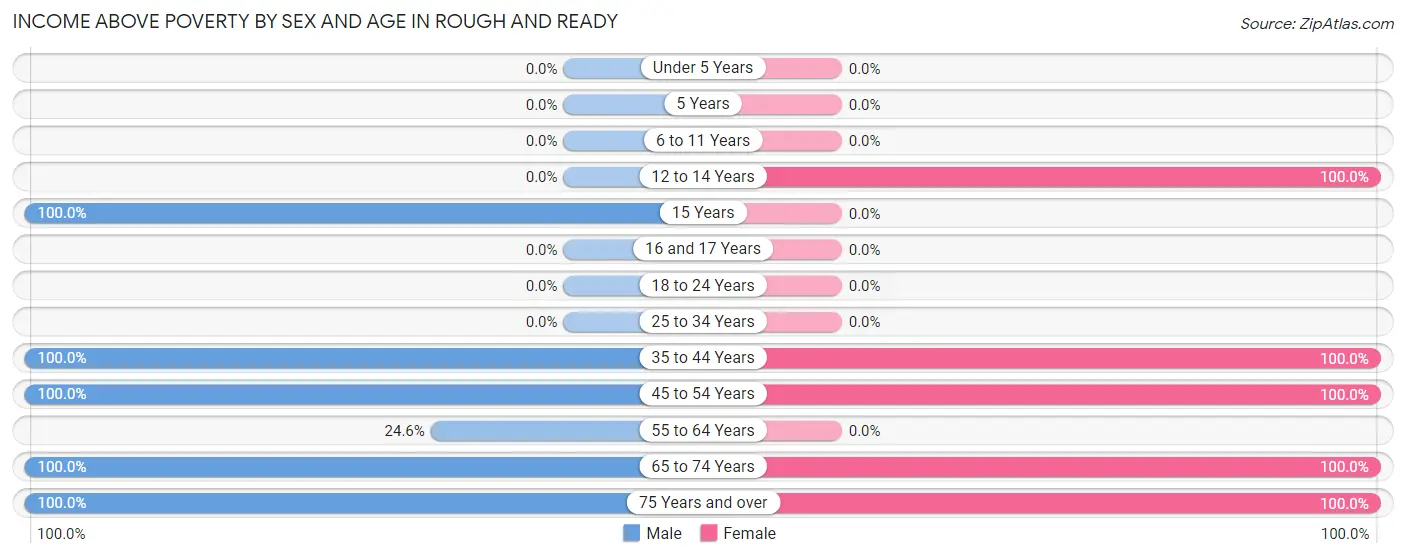
| Age Bracket | Male | Female |
| Under 5 Years | 0 (0.0%) | 0 (0.0%) |
| 5 Years | 0 (0.0%) | 0 (0.0%) |
| 6 to 11 Years | 0 (0.0%) | 0 (0.0%) |
| 12 to 14 Years | 0 (0.0%) | 60 (100.0%) |
| 15 Years | 61 (100.0%) | 0 (0.0%) |
| 16 and 17 Years | 0 (0.0%) | 0 (0.0%) |
| 18 to 24 Years | 0 (0.0%) | 0 (0.0%) |
| 25 to 34 Years | 0 (0.0%) | 0 (0.0%) |
| 35 to 44 Years | 42 (100.0%) | 36 (100.0%) |
| 45 to 54 Years | 41 (100.0%) | 20 (100.0%) |
| 55 to 64 Years | 17 (24.6%) | 0 (0.0%) |
| 65 to 74 Years | 17 (100.0%) | 93 (100.0%) |
| 75 Years and over | 104 (100.0%) | 72 (100.0%) |
| Total | 282 (84.4%) | 281 (97.2%) |
Income Below Poverty Among Married-Couple Families in Rough And Ready
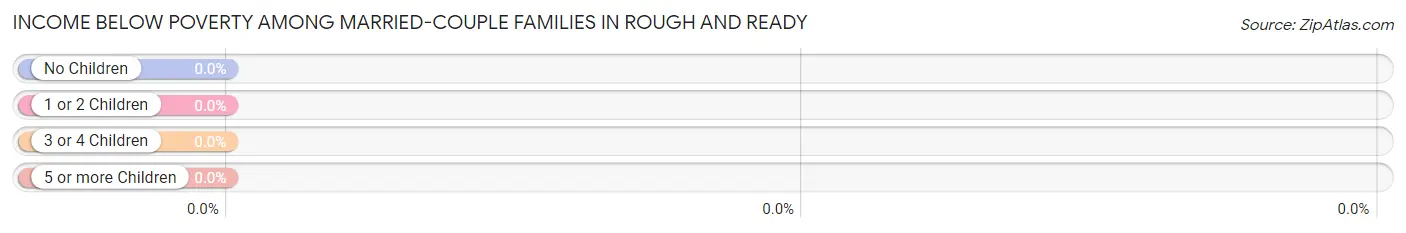
| Children | Above Poverty | Below Poverty |
| No Children | 18 (100.0%) | 0 (0.0%) |
| 1 or 2 Children | 23 (100.0%) | 0 (0.0%) |
| 3 or 4 Children | 0 (0.0%) | 0 (0.0%) |
| 5 or more Children | 0 (0.0%) | 0 (0.0%) |
| Total | 41 (100.0%) | 0 (0.0%) |
Income Below Poverty Among Single-Parent Households in Rough And Ready
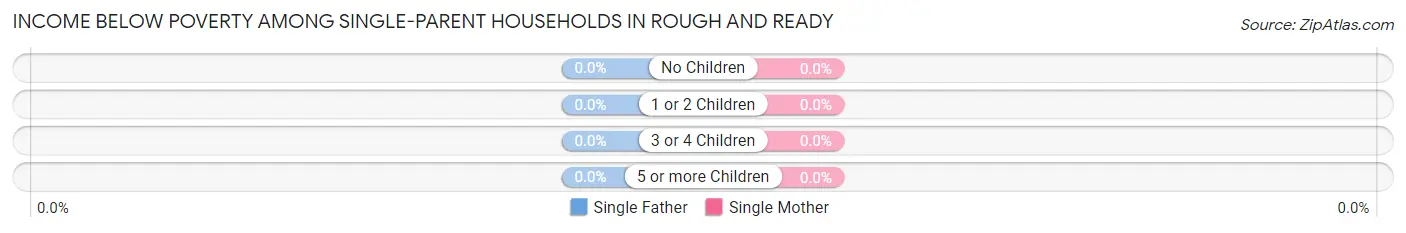
| Children | Single Father | Single Mother |
| No Children | 0 (0.0%) | 0 (0.0%) |
| 1 or 2 Children | 0 (0.0%) | 0 (0.0%) |
| 3 or 4 Children | 0 (0.0%) | 0 (0.0%) |
| 5 or more Children | 0 (0.0%) | 0 (0.0%) |
| Total | 0 (0.0%) | 0 (0.0%) |
Income Below Poverty Among Married-Couple vs Single-Parent Households in Rough And Ready
| Children | Married-Couple Families | Single-Parent Households |
| No Children | 0 (0.0%) | 0 (0.0%) |
| 1 or 2 Children | 0 (0.0%) | 0 (0.0%) |
| 3 or 4 Children | 0 (0.0%) | 0 (0.0%) |
| 5 or more Children | 0 (0.0%) | 0 (0.0%) |
| Total | 0 (0.0%) | 0 (0.0%) |
Race in Rough And Ready
The most populous races in Rough And Ready are , and White / Caucasian (623 | 100.0%).
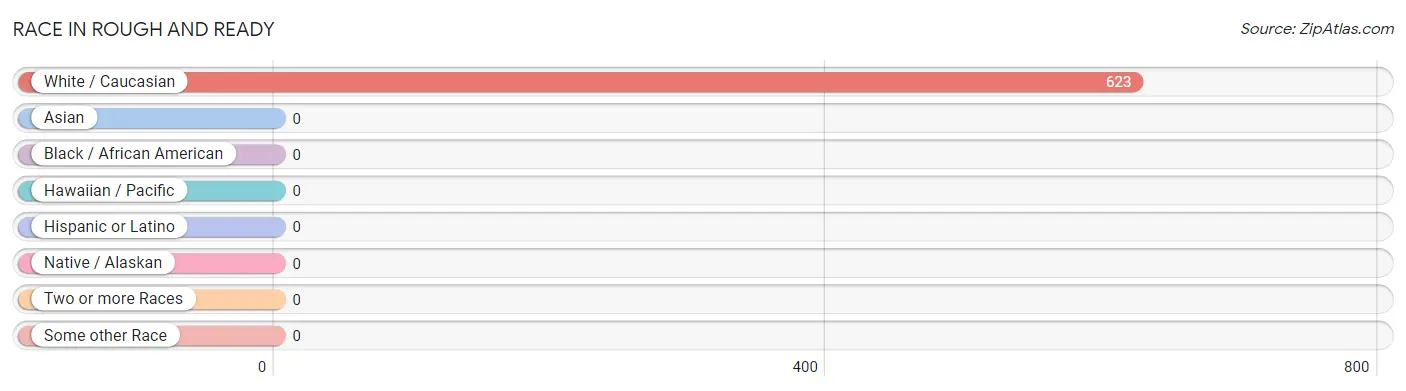
| Race | # Population | % Population |
| Asian | 0 | 0.0% |
| Black / African American | 0 | 0.0% |
| Hawaiian / Pacific | 0 | 0.0% |
| Hispanic or Latino | 0 | 0.0% |
| Native / Alaskan | 0 | 0.0% |
| White / Caucasian | 623 | 100.0% |
| Two or more Races | 0 | 0.0% |
| Some other Race | 0 | 0.0% |
| Total | 623 | 100.0% |
Ancestry in Rough And Ready
The most populous ancestries reported in Rough And Ready are American (176 | 28.2%), Irish (61 | 9.8%), Italian (59 | 9.5%), German (57 | 9.1%), and English (26 | 4.2%), together accounting for 60.8% of all Rough And Ready residents.
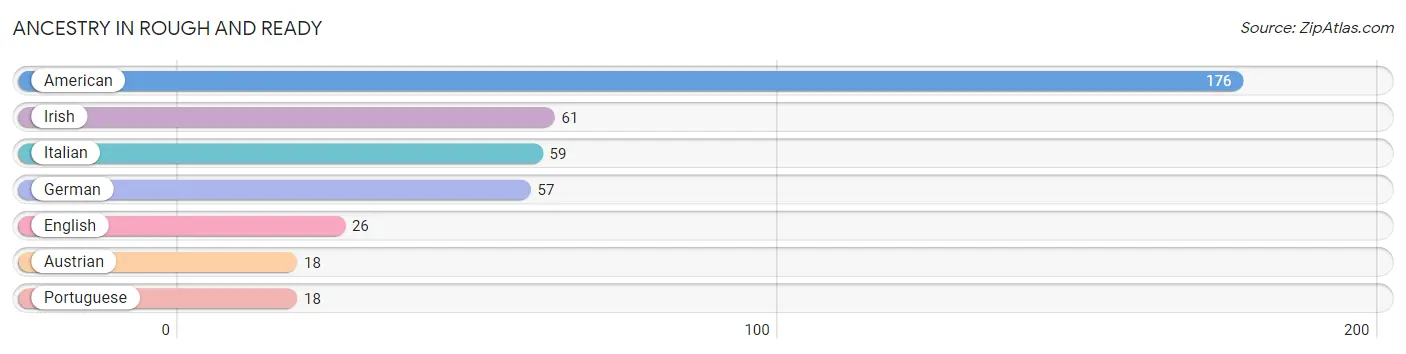
| Ancestry | # Population | % Population |
| American | 176 | 28.2% |
| Austrian | 18 | 2.9% |
| English | 26 | 4.2% |
| German | 57 | 9.1% |
| Irish | 61 | 9.8% |
| Italian | 59 | 9.5% |
| Portuguese | 18 | 2.9% | View All 7 Rows |
Immigrants in Rough And Ready

| Immigration Origin | # Population | % Population | View All 0 Rows |
Sex and Age in Rough And Ready
Sex and Age in Rough And Ready
The most populous age groups in Rough And Ready are 75 to 79 Years (104 | 31.1%) for men and 70 to 74 Years (74 | 25.6%) for women.
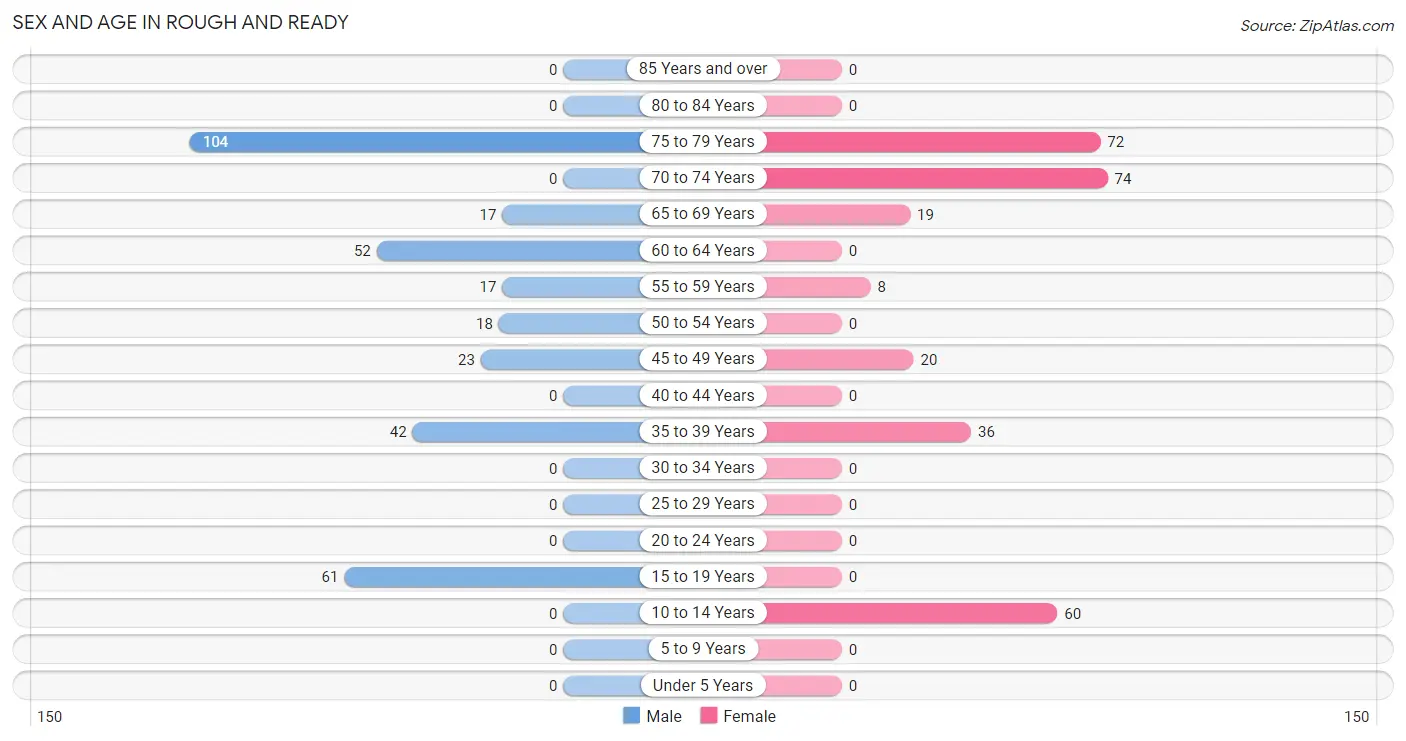
| Age Bracket | Male | Female |
| Under 5 Years | 0 (0.0%) | 0 (0.0%) |
| 5 to 9 Years | 0 (0.0%) | 0 (0.0%) |
| 10 to 14 Years | 0 (0.0%) | 60 (20.8%) |
| 15 to 19 Years | 61 (18.3%) | 0 (0.0%) |
| 20 to 24 Years | 0 (0.0%) | 0 (0.0%) |
| 25 to 29 Years | 0 (0.0%) | 0 (0.0%) |
| 30 to 34 Years | 0 (0.0%) | 0 (0.0%) |
| 35 to 39 Years | 42 (12.6%) | 36 (12.5%) |
| 40 to 44 Years | 0 (0.0%) | 0 (0.0%) |
| 45 to 49 Years | 23 (6.9%) | 20 (6.9%) |
| 50 to 54 Years | 18 (5.4%) | 0 (0.0%) |
| 55 to 59 Years | 17 (5.1%) | 8 (2.8%) |
| 60 to 64 Years | 52 (15.6%) | 0 (0.0%) |
| 65 to 69 Years | 17 (5.1%) | 19 (6.6%) |
| 70 to 74 Years | 0 (0.0%) | 74 (25.6%) |
| 75 to 79 Years | 104 (31.1%) | 72 (24.9%) |
| 80 to 84 Years | 0 (0.0%) | 0 (0.0%) |
| 85 Years and over | 0 (0.0%) | 0 (0.0%) |
| Total | 334 (100.0%) | 289 (100.0%) |
Families and Households in Rough And Ready
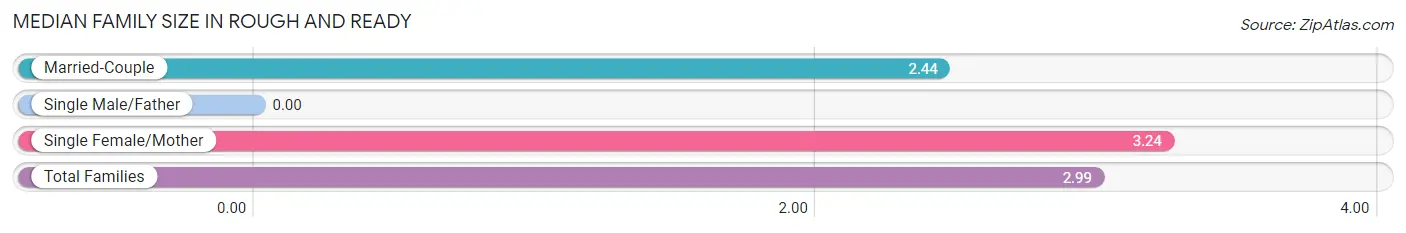
Median Family Size in Rough And Ready
| Family Type | # Families | Family Size |
| Married-Couple | 41 (31.1%) | 2.44 |
| Single Male/Father | 0 (0.0%) | - |
| Single Female/Mother | 91 (68.9%) | 3.24 |
| Total Families | 132 (100.0%) | 2.99 |
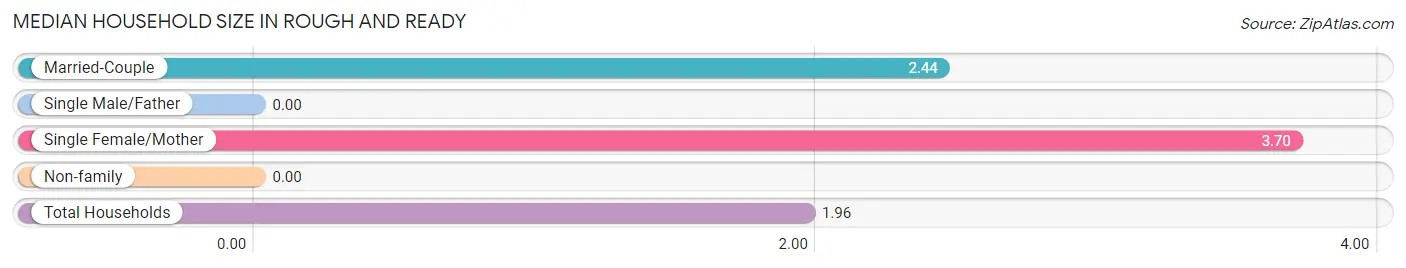
Median Household Size in Rough And Ready
| Household Type | # Households | Household Size |
| Married-Couple | 41 (12.9%) | 2.44 |
| Single Male/Father | 0 (0.0%) | - |
| Single Female/Mother | 91 (28.6%) | 3.70 |
| Non-family | 186 (58.5%) | - |
| Total Households | 318 (100.0%) | 1.96 |
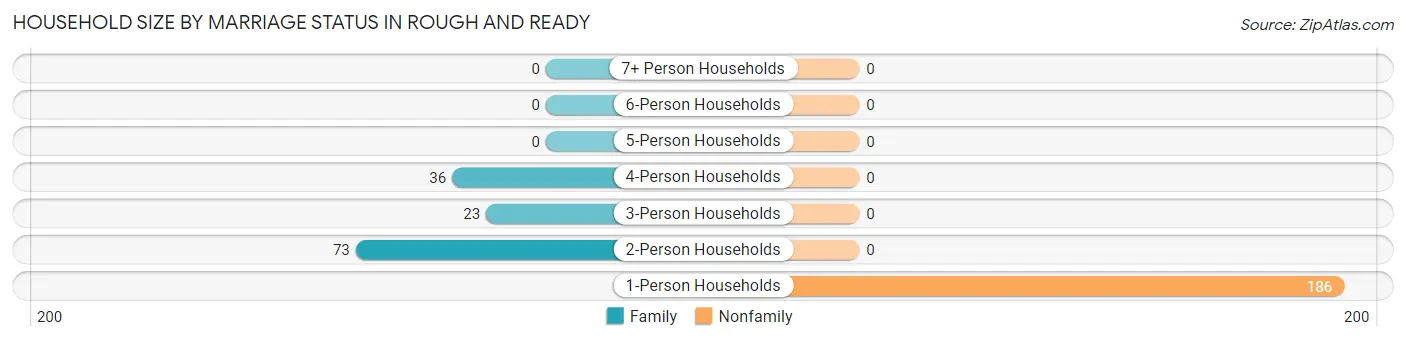
Household Size by Marriage Status in Rough And Ready
Out of a total of 318 households in Rough And Ready, 132 (41.5%) are family households, while 186 (58.5%) are nonfamily households. The most numerous type of family households are 2-person households, comprising 73, and the most common type of nonfamily households are 1-person households, comprising 186.
| Household Size | Family Households | Nonfamily Households |
| 1-Person Households | - | 186 (58.5%) |
| 2-Person Households | 73 (23.0%) | 0 (0.0%) |
| 3-Person Households | 23 (7.2%) | 0 (0.0%) |
| 4-Person Households | 36 (11.3%) | 0 (0.0%) |
| 5-Person Households | 0 (0.0%) | 0 (0.0%) |
| 6-Person Households | 0 (0.0%) | 0 (0.0%) |
| 7+ Person Households | 0 (0.0%) | 0 (0.0%) |
| Total | 132 (41.5%) | 186 (58.5%) |
Female Fertility in Rough And Ready
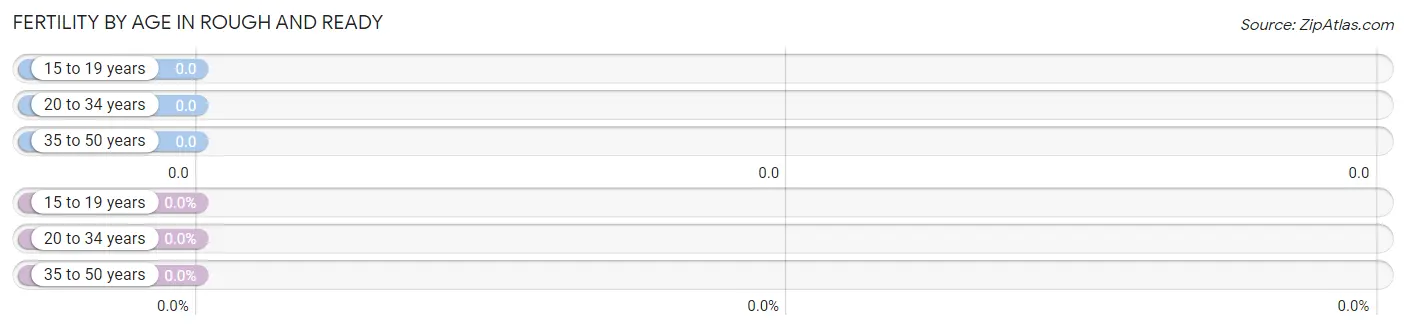
Fertility by Age in Rough And Ready
| Age Bracket | Women with Births | Births / 1,000 Women |
| 15 to 19 years | 0 (0.0%) | 0.0 |
| 20 to 34 years | 0 (0.0%) | 0.0 |
| 35 to 50 years | 0 (0.0%) | 0.0 |
| Total | 0 (0.0%) | 0.0 |
Fertility by Age by Marriage Status in Rough And Ready
| Age Bracket | Married | Unmarried |
| 15 to 19 years | 0 (0.0%) | 0 (0.0%) |
| 20 to 34 years | 0 (0.0%) | 0 (0.0%) |
| 35 to 50 years | 0 (0.0%) | 0 (0.0%) |
| Total | 0 (0.0%) | 0 (0.0%) |
Fertility by Education in Rough And Ready
| Educational Attainment | Women with Births | Births / 1,000 Women |
| Less than High School | 0 (0.0%) | 0.0 |
| High School Diploma | 0 (0.0%) | 0.0 |
| College or Associate's Degree | 0 (0.0%) | 0.0 |
| Bachelor's Degree | 0 (0.0%) | 0.0 |
| Graduate Degree | 0 (0.0%) | 0.0 |
| Total | 0 (0.0%) | 0.0 |
Fertility by Education by Marriage Status in Rough And Ready
| Educational Attainment | Married | Unmarried |
| Less than High School | 0 (0.0%) | 0 (0.0%) |
| High School Diploma | 0 (0.0%) | 0 (0.0%) |
| College or Associate's Degree | 0 (0.0%) | 0 (0.0%) |
| Bachelor's Degree | 0 (0.0%) | 0 (0.0%) |
| Graduate Degree | 0 (0.0%) | 0 (0.0%) |
| Total | 0 (0.0%) | 0 (0.0%) |
Employment Characteristics in Rough And Ready
Employment by Class of Employer in Rough And Ready
Among the 175 employed individuals in Rough And Ready, private company employees (137 | 78.3%), self-employed (not incorporated) (20 | 11.4%), and not-for-profit organizations (18 | 10.3%) make up the most common classes of employment.
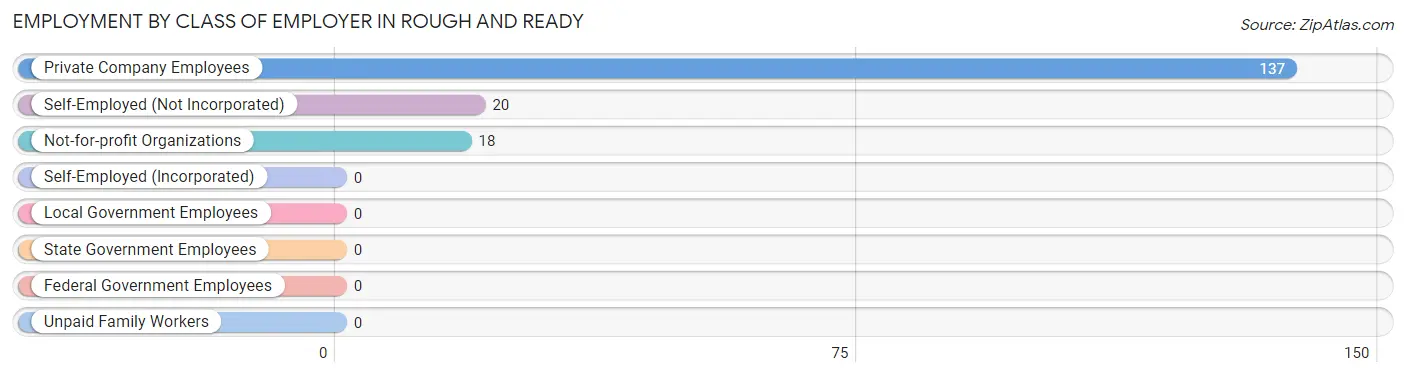
| Employer Class | # Employees | % Employees |
| Private Company Employees | 137 | 78.3% |
| Self-Employed (Incorporated) | 0 | 0.0% |
| Self-Employed (Not Incorporated) | 20 | 11.4% |
| Not-for-profit Organizations | 18 | 10.3% |
| Local Government Employees | 0 | 0.0% |
| State Government Employees | 0 | 0.0% |
| Federal Government Employees | 0 | 0.0% |
| Unpaid Family Workers | 0 | 0.0% |
| Total | 175 | 100.0% |
Employment Status by Age in Rough And Ready
According to the labor force statistics for Rough And Ready, out of the total population over 16 years of age (502), 36.5% or 183 individuals are in the labor force, with 4.4% or 8 of them unemployed. The age group with the highest labor force participation rate is 35 to 44 years, with 100.0% or 78 individuals in the labor force. Within the labor force, the 55 to 59 years age range has the highest percentage of unemployed individuals, with 32.0% or 8 of them being unemployed.
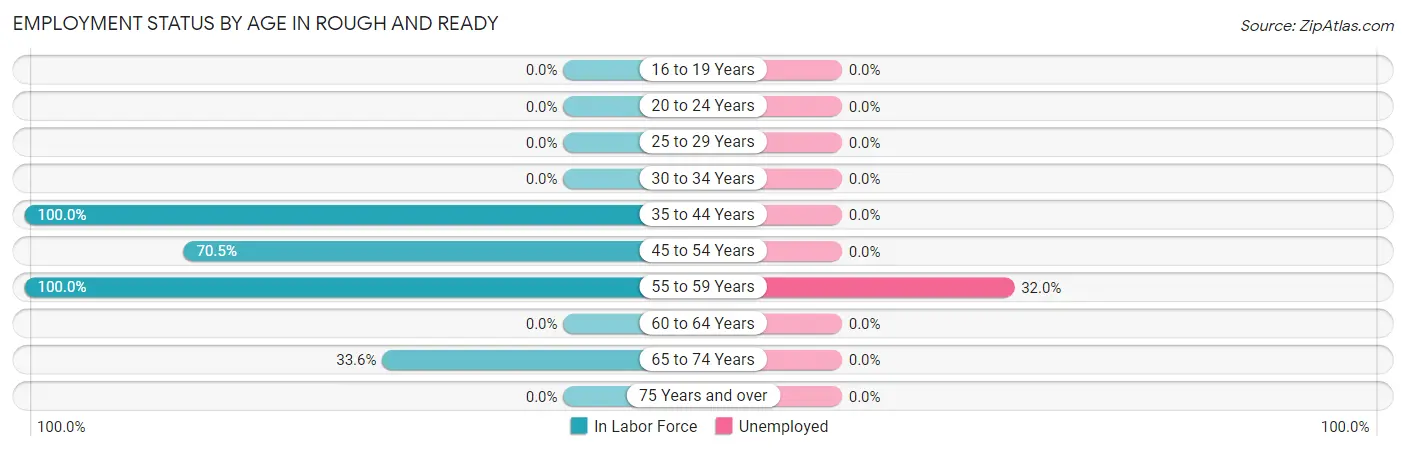
| Age Bracket | In Labor Force | Unemployed |
| 16 to 19 Years | 0 (0.0%) | 0 (0.0%) |
| 20 to 24 Years | 0 (0.0%) | 0 (0.0%) |
| 25 to 29 Years | 0 (0.0%) | 0 (0.0%) |
| 30 to 34 Years | 0 (0.0%) | 0 (0.0%) |
| 35 to 44 Years | 78 (100.0%) | 0 (0.0%) |
| 45 to 54 Years | 43 (70.5%) | 0 (0.0%) |
| 55 to 59 Years | 25 (100.0%) | 8 (32.0%) |
| 60 to 64 Years | 0 (0.0%) | 0 (0.0%) |
| 65 to 74 Years | 37 (33.6%) | 0 (0.0%) |
| 75 Years and over | 0 (0.0%) | 0 (0.0%) |
| Total | 183 (36.5%) | 8 (4.4%) |
Employment Status by Educational Attainment in Rough And Ready
According to labor force statistics for Rough And Ready, 67.6% of individuals (146) out of the total population between 25 and 64 years of age (216) are in the labor force, with 5.5% or 8 of them being unemployed. The group with the highest labor force participation rate are those with the educational attainment of college / associate degree, with 100.0% or 62 individuals in the labor force. Within the labor force, individuals with high school diploma education have the highest percentage of unemployment, with 9.5% or 8 of them being unemployed.
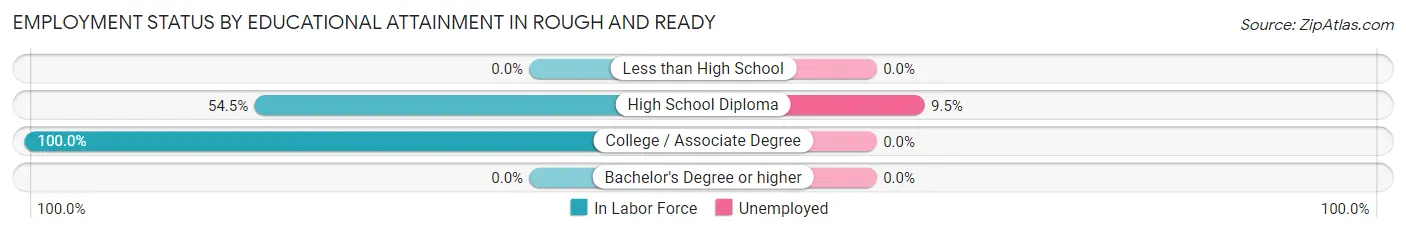
| Educational Attainment | In Labor Force | Unemployed |
| Less than High School | 0 (0.0%) | 0 (0.0%) |
| High School Diploma | 84 (54.5%) | 15 (9.5%) |
| College / Associate Degree | 62 (100.0%) | 0 (0.0%) |
| Bachelor's Degree or higher | 0 (0.0%) | 0 (0.0%) |
| Total | 146 (67.6%) | 12 (5.5%) |
Employment Occupations by Sex in Rough And Ready
Management, Business, Science and Arts Occupations
The most common Management, Business, Science and Arts occupations in Rough And Ready are , and Management (139 | 79.4%).
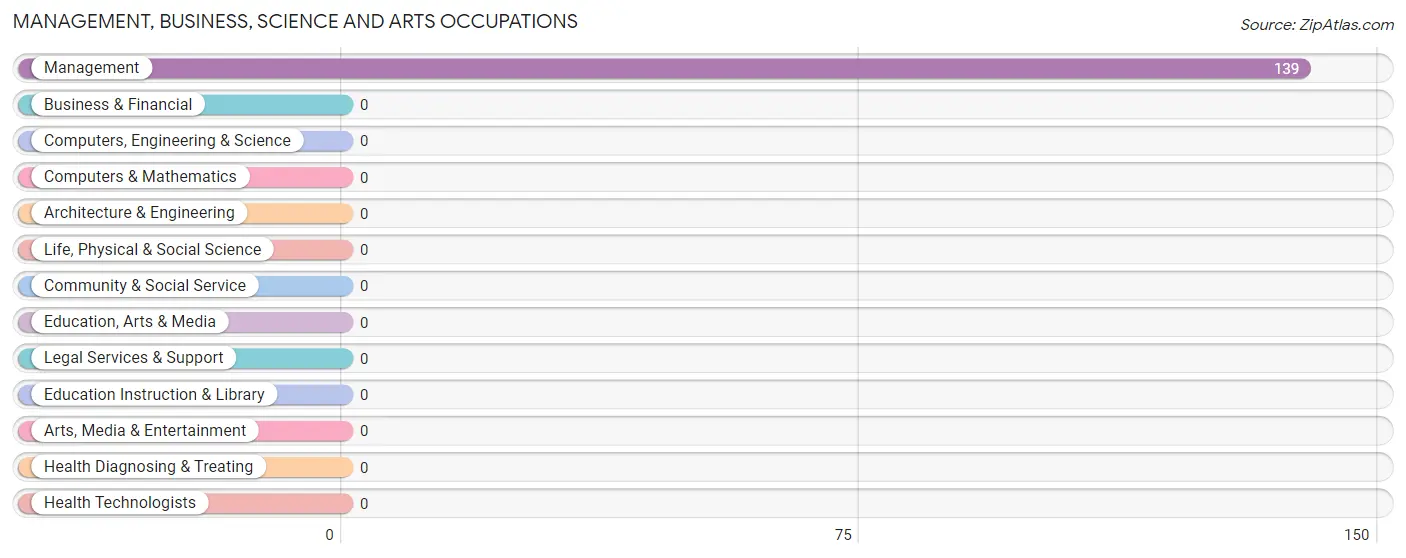
Management, Business, Science and Arts Occupations by Sex
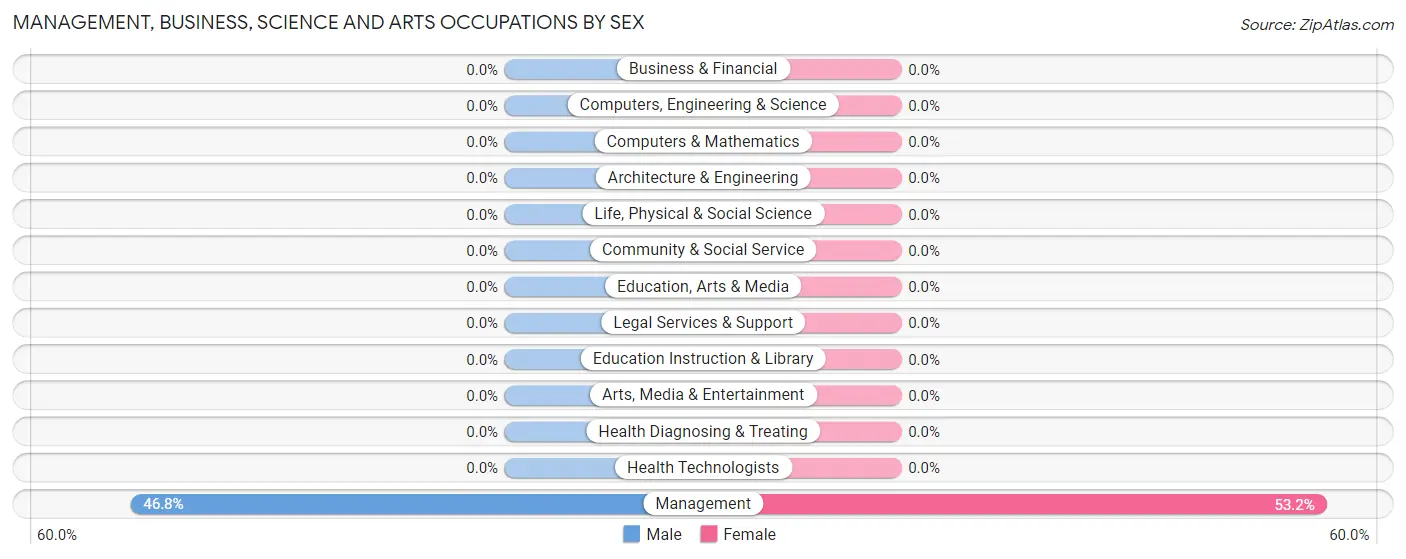
| Occupation | Male | Female |
| Management | 65 (46.8%) | 74 (53.2%) |
| Business & Financial | 0 (0.0%) | 0 (0.0%) |
| Computers, Engineering & Science | 0 (0.0%) | 0 (0.0%) |
| Computers & Mathematics | 0 (0.0%) | 0 (0.0%) |
| Architecture & Engineering | 0 (0.0%) | 0 (0.0%) |
| Life, Physical & Social Science | 0 (0.0%) | 0 (0.0%) |
| Community & Social Service | 0 (0.0%) | 0 (0.0%) |
| Education, Arts & Media | 0 (0.0%) | 0 (0.0%) |
| Legal Services & Support | 0 (0.0%) | 0 (0.0%) |
| Education Instruction & Library | 0 (0.0%) | 0 (0.0%) |
| Arts, Media & Entertainment | 0 (0.0%) | 0 (0.0%) |
| Health Diagnosing & Treating | 0 (0.0%) | 0 (0.0%) |
| Health Technologists | 0 (0.0%) | 0 (0.0%) |
| Total (Category) | 65 (46.8%) | 74 (53.2%) |
| Total (Overall) | 82 (46.9%) | 93 (53.1%) |
Services Occupations
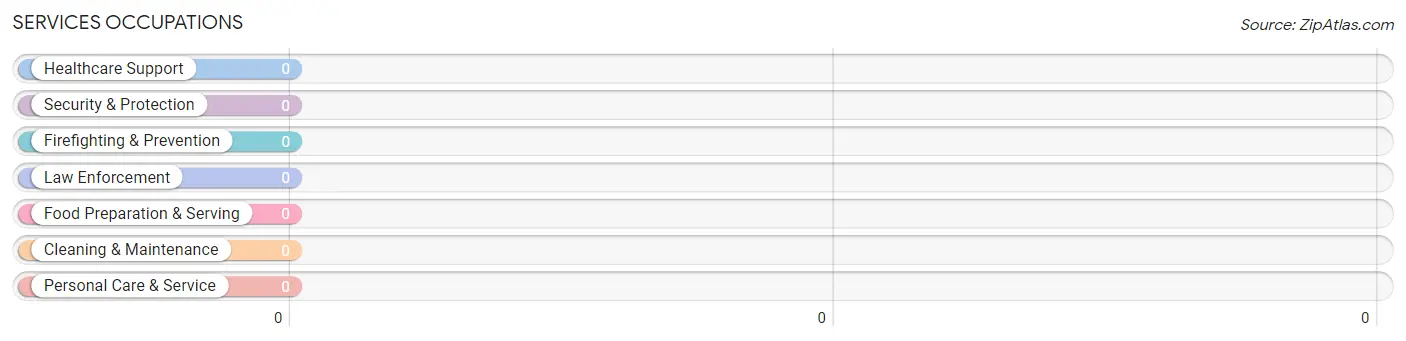
Services Occupations by Sex

| Occupation | Male | Female |
| Healthcare Support | 0 (0.0%) | 0 (0.0%) |
| Security & Protection | 0 (0.0%) | 0 (0.0%) |
| Firefighting & Prevention | 0 (0.0%) | 0 (0.0%) |
| Law Enforcement | 0 (0.0%) | 0 (0.0%) |
| Food Preparation & Serving | 0 (0.0%) | 0 (0.0%) |
| Cleaning & Maintenance | 0 (0.0%) | 0 (0.0%) |
| Personal Care & Service | 0 (0.0%) | 0 (0.0%) |
| Total (Category) | 0 (0.0%) | 0 (0.0%) |
| Total (Overall) | 82 (46.9%) | 93 (53.1%) |
Sales and Office Occupations
The most common Sales and Office occupations in Rough And Ready are , and Office & Administration (19 | 10.9%).
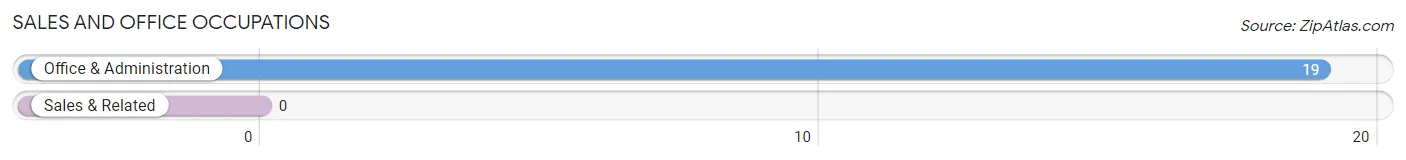
Sales and Office Occupations by Sex
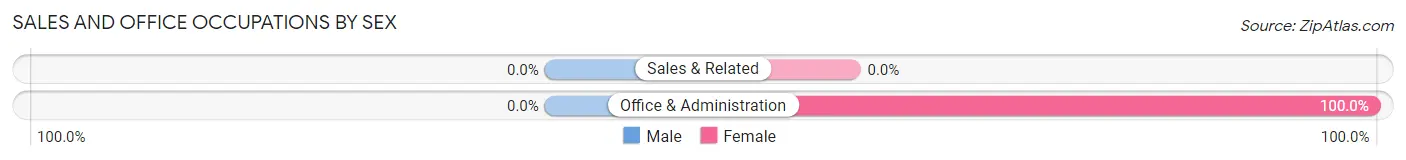
| Occupation | Male | Female |
| Sales & Related | 0 (0.0%) | 0 (0.0%) |
| Office & Administration | 0 (0.0%) | 19 (100.0%) |
| Total (Category) | 0 (0.0%) | 19 (100.0%) |
| Total (Overall) | 82 (46.9%) | 93 (53.1%) |
Natural Resources, Construction and Maintenance Occupations
The most common Natural Resources, Construction and Maintenance occupations in Rough And Ready are , and Installation, Maintenance & Repair (17 | 9.7%).
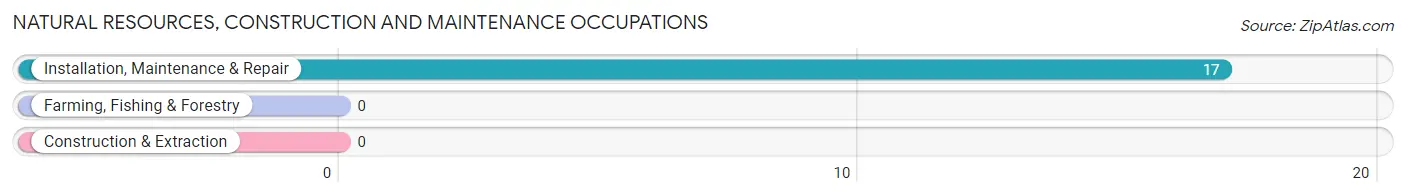
Natural Resources, Construction and Maintenance Occupations by Sex
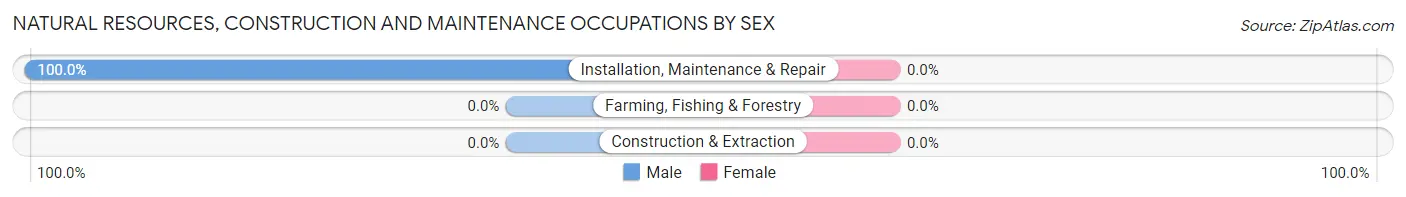
| Occupation | Male | Female |
| Farming, Fishing & Forestry | 0 (0.0%) | 0 (0.0%) |
| Construction & Extraction | 0 (0.0%) | 0 (0.0%) |
| Installation, Maintenance & Repair | 17 (100.0%) | 0 (0.0%) |
| Total (Category) | 17 (100.0%) | 0 (0.0%) |
| Total (Overall) | 82 (46.9%) | 93 (53.1%) |
Production, Transportation and Moving Occupations
Production, Transportation and Moving Occupations by Sex
| Occupation | Male | Female |
| Production | 0 (0.0%) | 0 (0.0%) |
| Transportation | 0 (0.0%) | 0 (0.0%) |
| Material Moving | 0 (0.0%) | 0 (0.0%) |
| Total (Category) | 0 (0.0%) | 0 (0.0%) |
| Total (Overall) | 82 (46.9%) | 93 (53.1%) |
Employment Industries by Sex in Rough And Ready
Employment Industries in Rough And Ready
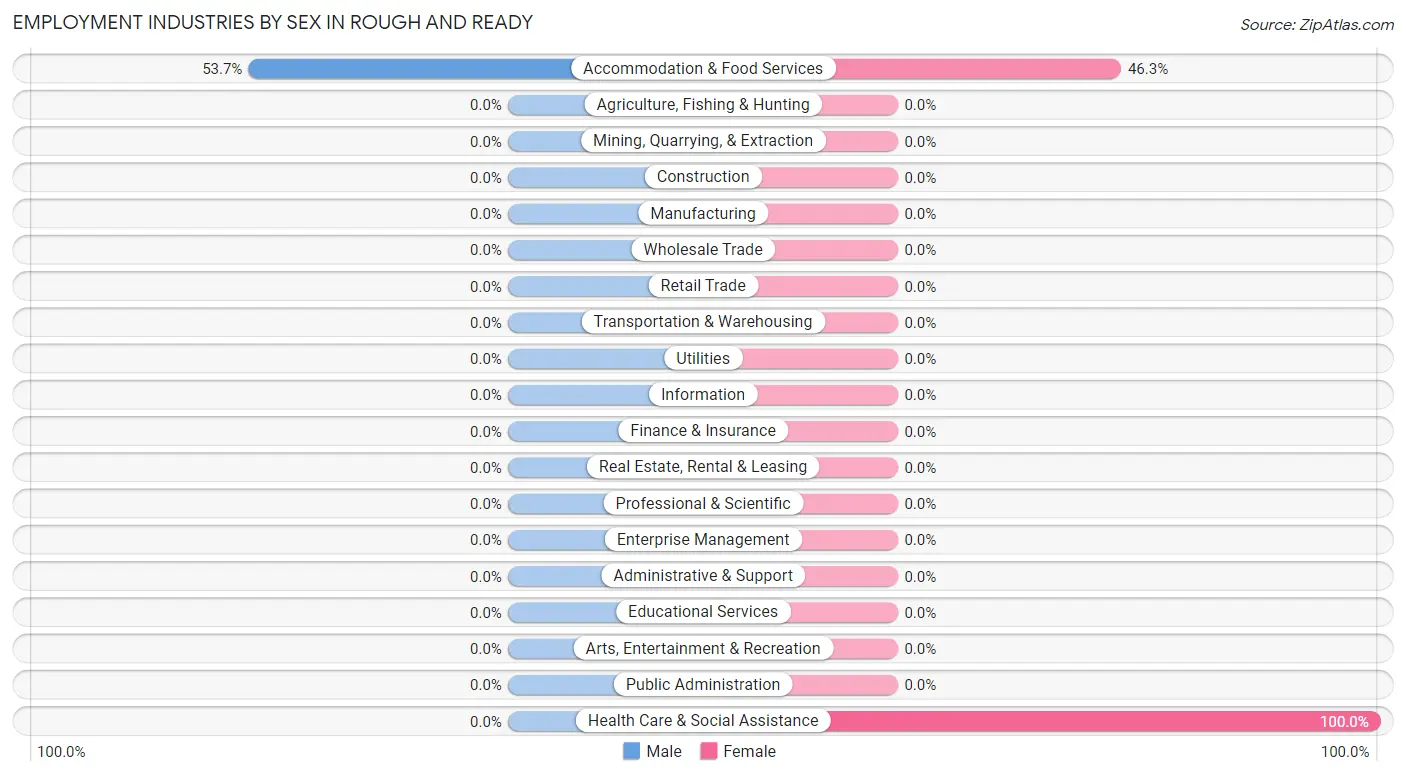
The major employment industries in Rough And Ready include Accommodation & Food Services (121 | 69.1%), and Health Care & Social Assistance (18 | 10.3%).
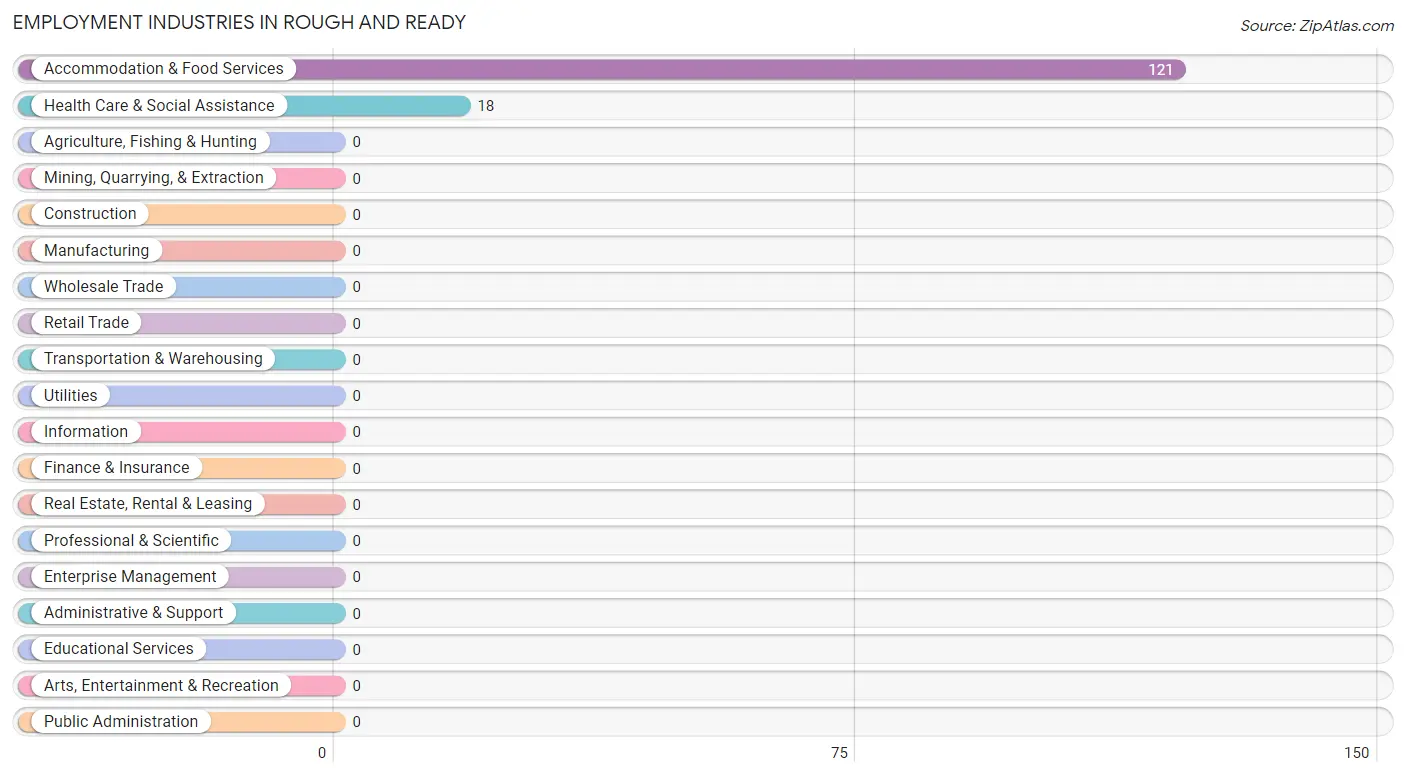
Employment Industries by Sex in Rough And Ready
| Industry | Male | Female |
| Agriculture, Fishing & Hunting | 0 (0.0%) | 0 (0.0%) |
| Mining, Quarrying, & Extraction | 0 (0.0%) | 0 (0.0%) |
| Construction | 0 (0.0%) | 0 (0.0%) |
| Manufacturing | 0 (0.0%) | 0 (0.0%) |
| Wholesale Trade | 0 (0.0%) | 0 (0.0%) |
| Retail Trade | 0 (0.0%) | 0 (0.0%) |
| Transportation & Warehousing | 0 (0.0%) | 0 (0.0%) |
| Utilities | 0 (0.0%) | 0 (0.0%) |
| Information | 0 (0.0%) | 0 (0.0%) |
| Finance & Insurance | 0 (0.0%) | 0 (0.0%) |
| Real Estate, Rental & Leasing | 0 (0.0%) | 0 (0.0%) |
| Professional & Scientific | 0 (0.0%) | 0 (0.0%) |
| Enterprise Management | 0 (0.0%) | 0 (0.0%) |
| Administrative & Support | 0 (0.0%) | 0 (0.0%) |
| Educational Services | 0 (0.0%) | 0 (0.0%) |
| Health Care & Social Assistance | 0 (0.0%) | 18 (100.0%) |
| Arts, Entertainment & Recreation | 0 (0.0%) | 0 (0.0%) |
| Accommodation & Food Services | 65 (53.7%) | 56 (46.3%) |
| Public Administration | 0 (0.0%) | 0 (0.0%) |
| Total | 82 (46.9%) | 93 (53.1%) |
Education in Rough And Ready
School Enrollment in Rough And Ready
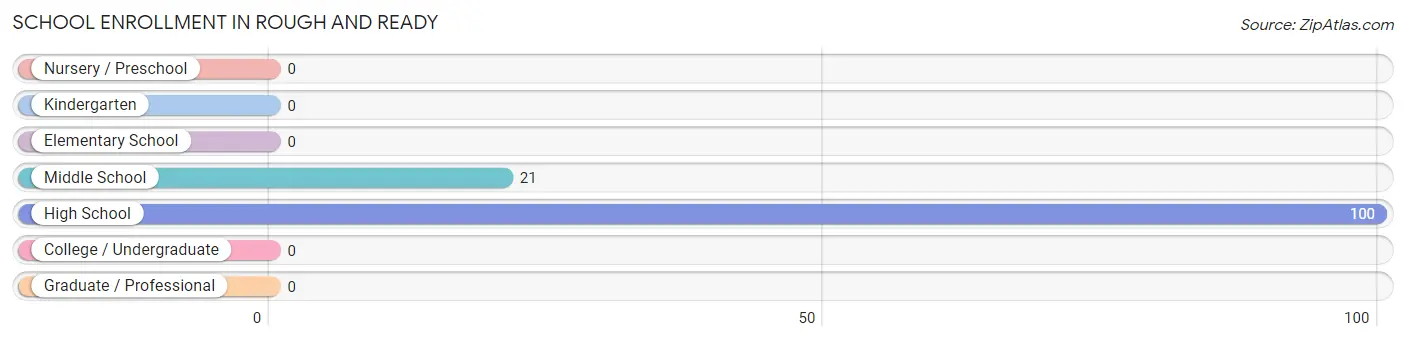
The most common levels of schooling among the 121 students in Rough And Ready are high school (100 | 82.6%), and middle school (21 | 17.4%).
| School Level | # Students | % Students |
| Nursery / Preschool | 0 | 0.0% |
| Kindergarten | 0 | 0.0% |
| Elementary School | 0 | 0.0% |
| Middle School | 21 | 17.4% |
| High School | 100 | 82.6% |
| College / Undergraduate | 0 | 0.0% |
| Graduate / Professional | 0 | 0.0% |
| Total | 121 | 100.0% |
School Enrollment by Age by Funding Source in Rough And Ready
| Age Bracket | Public School | Private School |
| 3 to 4 Year Olds | 0 (0.0%) | 0 (0.0%) |
| 5 to 9 Year Old | 0 (0.0%) | 0 (0.0%) |
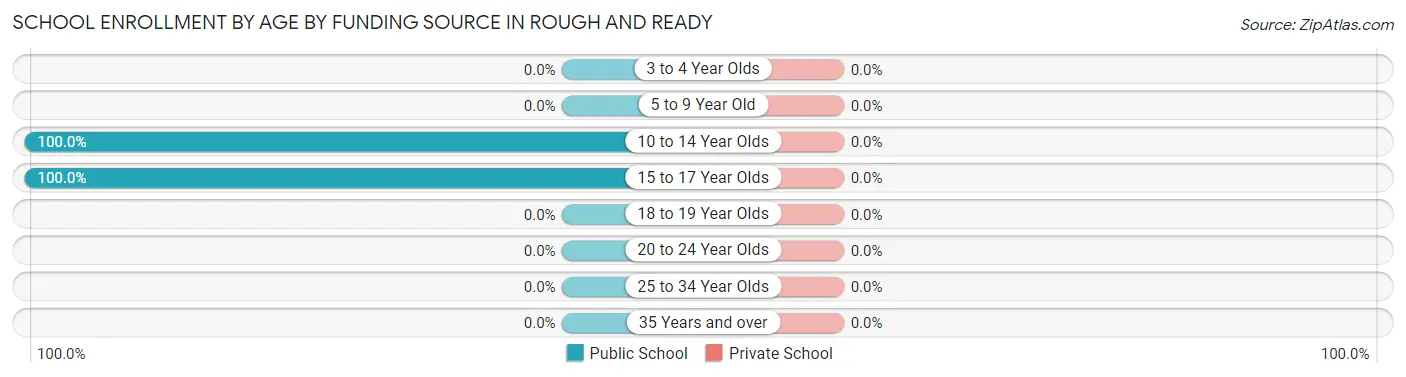
| 10 to 14 Year Olds | 60 (100.0%) | 0 (0.0%) |
| 15 to 17 Year Olds | 61 (100.0%) | 0 (0.0%) |
| 18 to 19 Year Olds | 0 (0.0%) | 0 (0.0%) |
| 20 to 24 Year Olds | 0 (0.0%) | 0 (0.0%) |
| 25 to 34 Year Olds | 0 (0.0%) | 0 (0.0%) |
| 35 Years and over | 0 (0.0%) | 0 (0.0%) |
| Total | 121 (100.0%) | 0 (0.0%) |
Educational Attainment by Field of Study in Rough And Ready
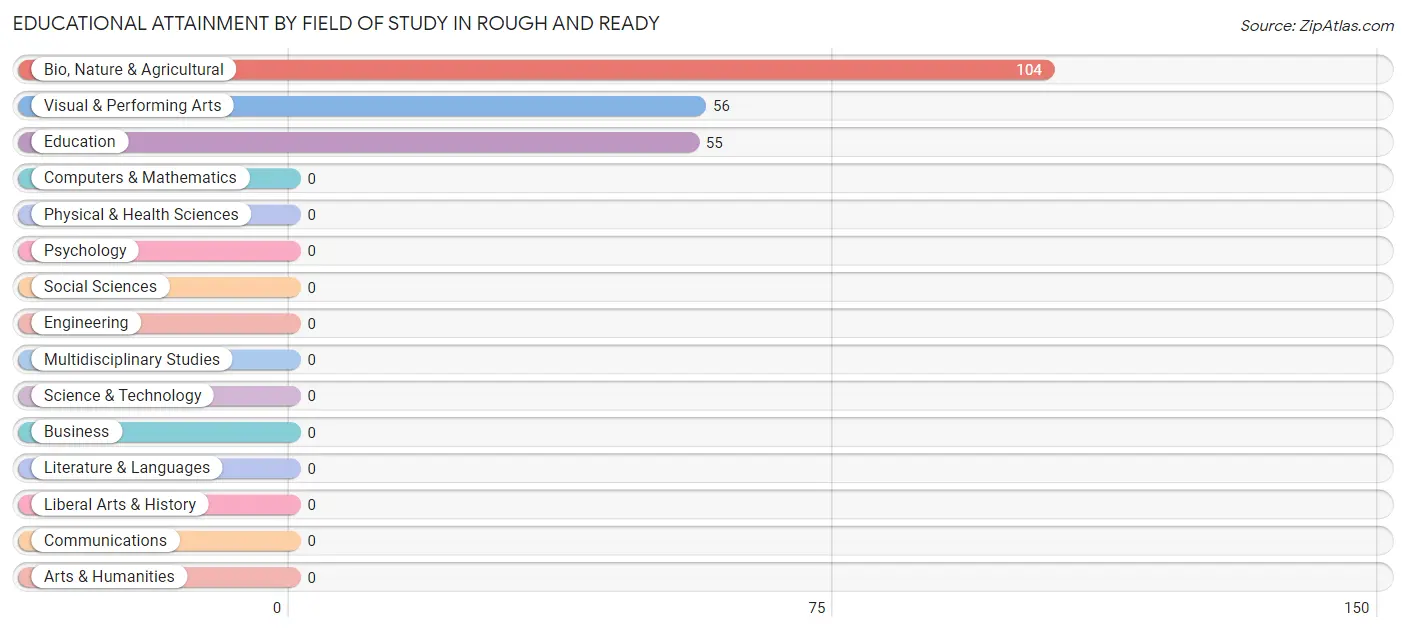
Bio, nature & agricultural (104 | 48.4%), visual & performing arts (56 | 26.1%), and education (55 | 25.6%) are the most common fields of study among 215 individuals in Rough And Ready who have obtained a bachelor's degree or higher.
| Field of Study | # Graduates | % Graduates |
| Computers & Mathematics | 0 | 0.0% |
| Bio, Nature & Agricultural | 104 | 48.4% |
| Physical & Health Sciences | 0 | 0.0% |
| Psychology | 0 | 0.0% |
| Social Sciences | 0 | 0.0% |
| Engineering | 0 | 0.0% |
| Multidisciplinary Studies | 0 | 0.0% |
| Science & Technology | 0 | 0.0% |
| Business | 0 | 0.0% |
| Education | 55 | 25.6% |
| Literature & Languages | 0 | 0.0% |
| Liberal Arts & History | 0 | 0.0% |
| Visual & Performing Arts | 56 | 26.1% |
| Communications | 0 | 0.0% |
| Arts & Humanities | 0 | 0.0% |
| Total | 215 | 100.0% |
Transportation & Commute in Rough And Ready
Vehicle Availability by Sex in Rough And Ready
The most prevalent vehicle ownership categories in Rough And Ready are males with 2 vehicles (82, accounting for 100.0%) and females with 2 vehicles (74, making up 88.2%).
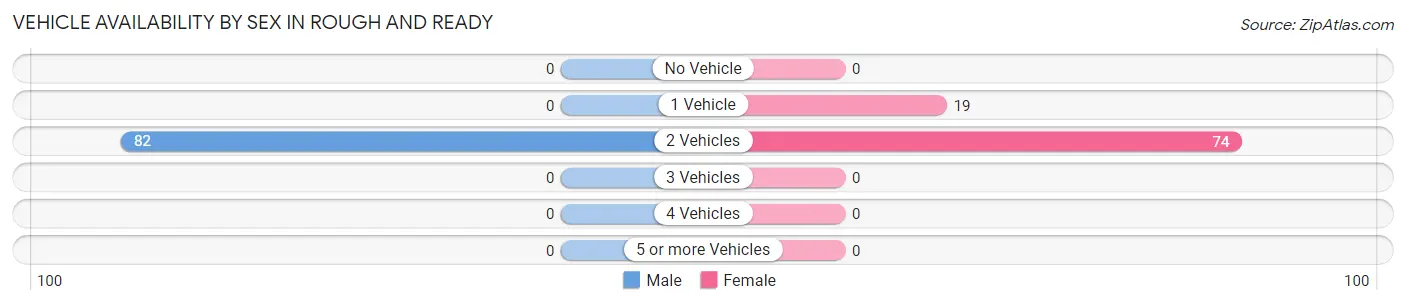
| Vehicles Available | Male | Female |
| No Vehicle | 0 (0.0%) | 0 (0.0%) |
| 1 Vehicle | 0 (0.0%) | 19 (20.4%) |
| 2 Vehicles | 82 (100.0%) | 74 (79.6%) |
| 3 Vehicles | 0 (0.0%) | 0 (0.0%) |
| 4 Vehicles | 0 (0.0%) | 0 (0.0%) |
| 5 or more Vehicles | 0 (0.0%) | 0 (0.0%) |
| Total | 82 (100.0%) | 93 (100.0%) |
Commute Time in Rough And Ready
The most frequently occuring commute durations in Rough And Ready are 15 to 19 minutes (96 commuters, 61.5%), 10 to 14 minutes (43 commuters, 27.6%), and 20 to 24 minutes (17 commuters, 10.9%).
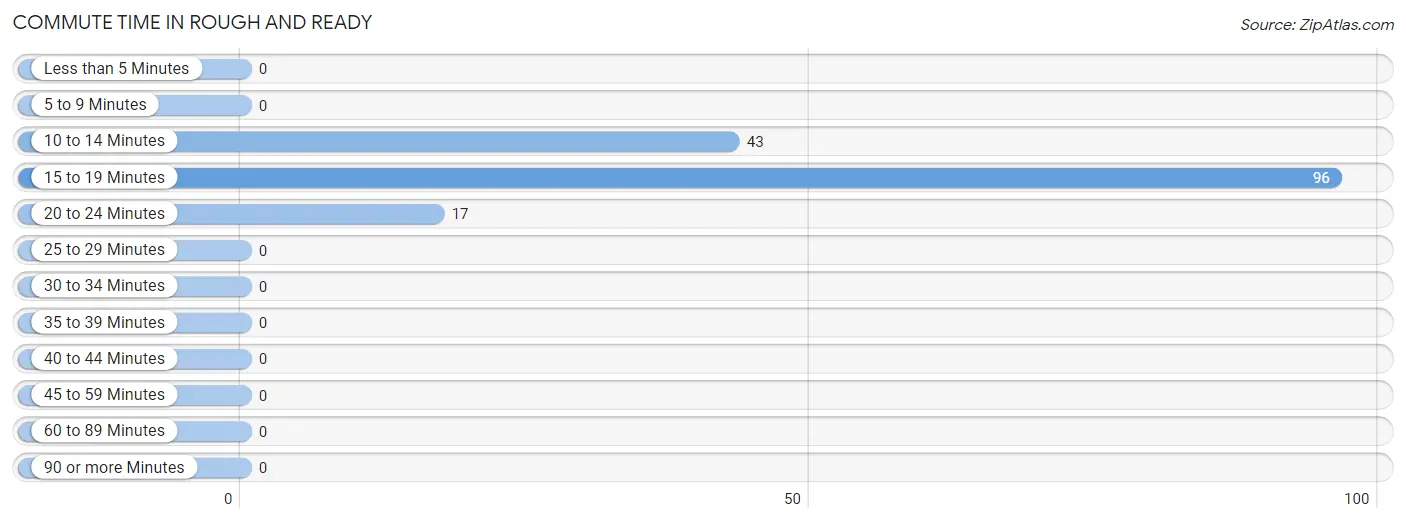
| Commute Time | # Commuters | % Commuters |
| Less than 5 Minutes | 0 | 0.0% |
| 5 to 9 Minutes | 0 | 0.0% |
| 10 to 14 Minutes | 43 | 27.6% |
| 15 to 19 Minutes | 96 | 61.5% |
| 20 to 24 Minutes | 17 | 10.9% |
| 25 to 29 Minutes | 0 | 0.0% |
| 30 to 34 Minutes | 0 | 0.0% |
| 35 to 39 Minutes | 0 | 0.0% |
| 40 to 44 Minutes | 0 | 0.0% |
| 45 to 59 Minutes | 0 | 0.0% |
| 60 to 89 Minutes | 0 | 0.0% |
| 90 or more Minutes | 0 | 0.0% |
Commute Time by Sex in Rough And Ready
The most common commute times in Rough And Ready are 15 to 19 minutes (42 commuters, 51.2%) for males and 15 to 19 minutes (54 commuters, 73.0%) for females.
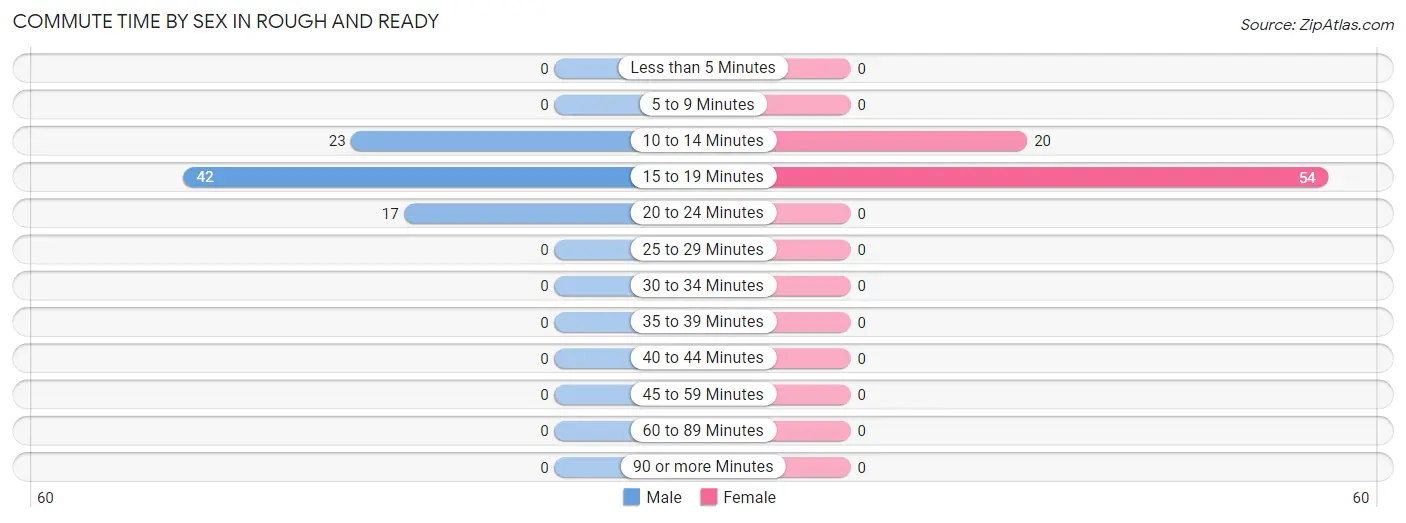
| Commute Time | Male | Female |
| Less than 5 Minutes | 0 (0.0%) | 0 (0.0%) |
| 5 to 9 Minutes | 0 (0.0%) | 0 (0.0%) |
| 10 to 14 Minutes | 23 (28.1%) | 20 (27.0%) |
| 15 to 19 Minutes | 42 (51.2%) | 54 (73.0%) |
| 20 to 24 Minutes | 17 (20.7%) | 0 (0.0%) |
| 25 to 29 Minutes | 0 (0.0%) | 0 (0.0%) |
| 30 to 34 Minutes | 0 (0.0%) | 0 (0.0%) |
| 35 to 39 Minutes | 0 (0.0%) | 0 (0.0%) |
| 40 to 44 Minutes | 0 (0.0%) | 0 (0.0%) |
| 45 to 59 Minutes | 0 (0.0%) | 0 (0.0%) |
| 60 to 89 Minutes | 0 (0.0%) | 0 (0.0%) |
| 90 or more Minutes | 0 (0.0%) | 0 (0.0%) |
Time of Departure to Work by Sex in Rough And Ready
The most frequent times of departure to work in Rough And Ready are 7:30 AM to 7:59 AM (42, 51.2%) for males and 12:00 PM to 3:59 PM (36, 48.6%) for females.
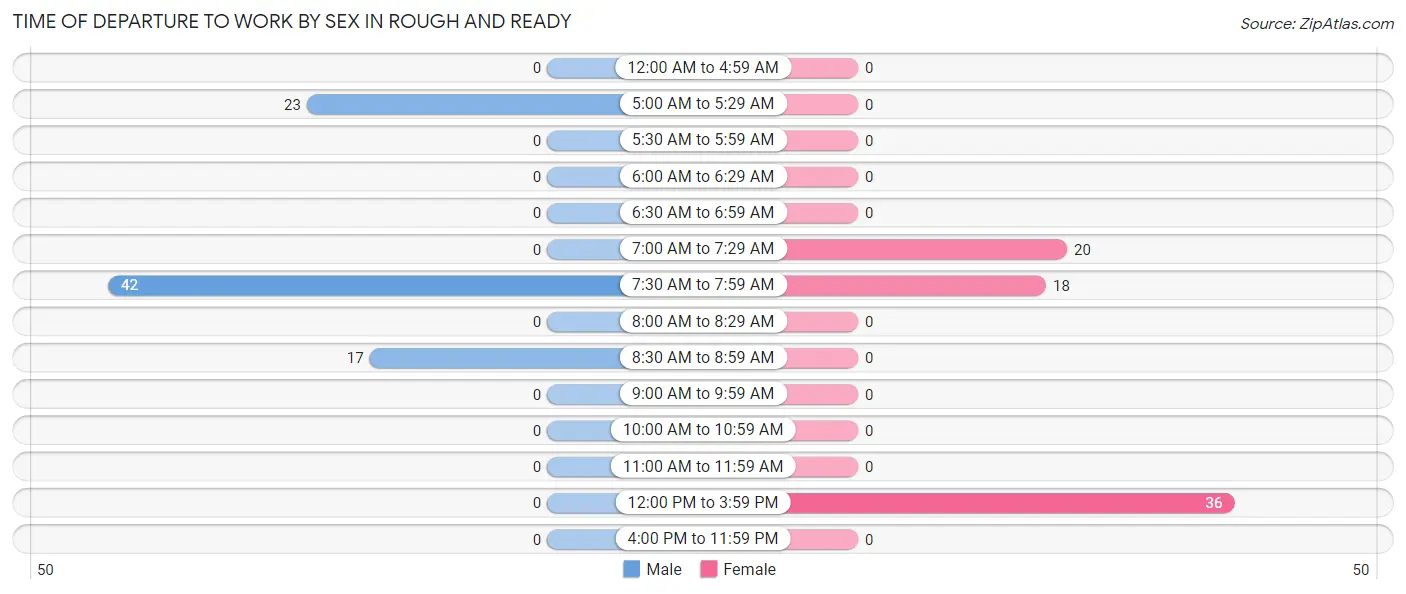
| Time of Departure | Male | Female |
| 12:00 AM to 4:59 AM | 0 (0.0%) | 0 (0.0%) |
| 5:00 AM to 5:29 AM | 23 (28.1%) | 0 (0.0%) |
| 5:30 AM to 5:59 AM | 0 (0.0%) | 0 (0.0%) |
| 6:00 AM to 6:29 AM | 0 (0.0%) | 0 (0.0%) |
| 6:30 AM to 6:59 AM | 0 (0.0%) | 0 (0.0%) |
| 7:00 AM to 7:29 AM | 0 (0.0%) | 20 (27.0%) |
| 7:30 AM to 7:59 AM | 42 (51.2%) | 18 (24.3%) |
| 8:00 AM to 8:29 AM | 0 (0.0%) | 0 (0.0%) |
| 8:30 AM to 8:59 AM | 17 (20.7%) | 0 (0.0%) |
| 9:00 AM to 9:59 AM | 0 (0.0%) | 0 (0.0%) |
| 10:00 AM to 10:59 AM | 0 (0.0%) | 0 (0.0%) |
| 11:00 AM to 11:59 AM | 0 (0.0%) | 0 (0.0%) |
| 12:00 PM to 3:59 PM | 0 (0.0%) | 36 (48.6%) |
| 4:00 PM to 11:59 PM | 0 (0.0%) | 0 (0.0%) |
| Total | 82 (100.0%) | 74 (100.0%) |
Housing Occupancy in Rough And Ready
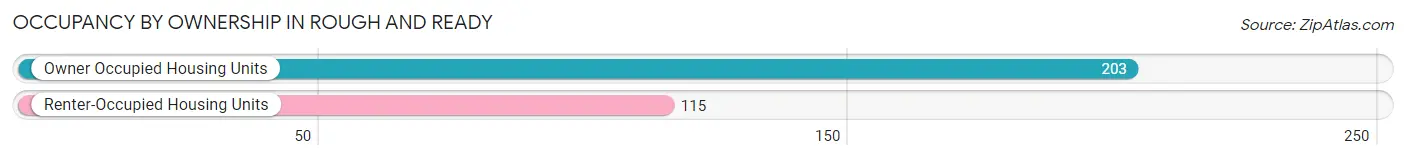
Occupancy by Ownership in Rough And Ready
Of the total 318 dwellings in Rough And Ready, owner-occupied units account for 203 (63.8%), while renter-occupied units make up 115 (36.2%).
| Occupancy | # Housing Units | % Housing Units |
| Owner Occupied Housing Units | 203 | 63.8% |
| Renter-Occupied Housing Units | 115 | 36.2% |
| Total Occupied Housing Units | 318 | 100.0% |
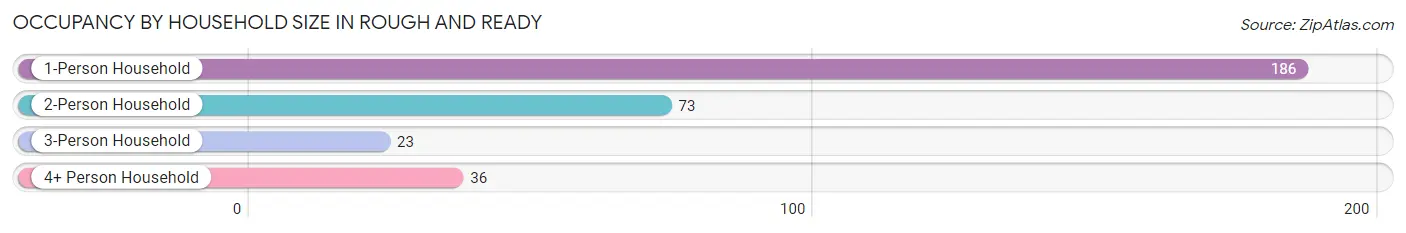
Occupancy by Household Size in Rough And Ready
| Household Size | # Housing Units | % Housing Units |
| 1-Person Household | 186 | 58.5% |
| 2-Person Household | 73 | 23.0% |
| 3-Person Household | 23 | 7.2% |
| 4+ Person Household | 36 | 11.3% |
| Total Housing Units | 318 | 100.0% |
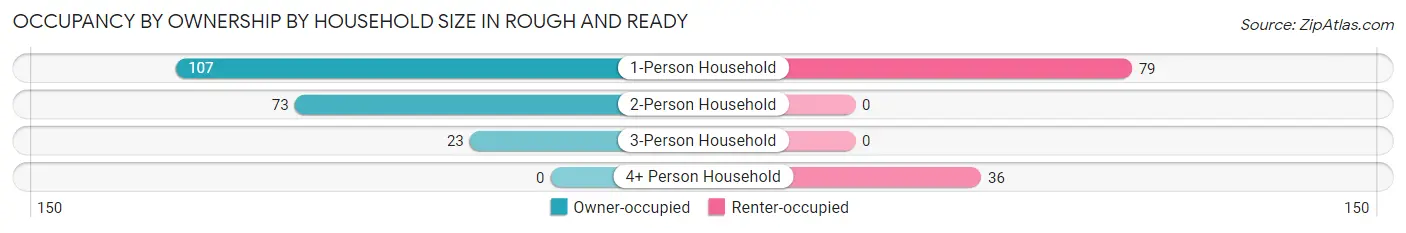
Occupancy by Ownership by Household Size in Rough And Ready
| Household Size | Owner-occupied | Renter-occupied |
| 1-Person Household | 107 (57.5%) | 79 (42.5%) |
| 2-Person Household | 73 (100.0%) | 0 (0.0%) |
| 3-Person Household | 23 (100.0%) | 0 (0.0%) |
| 4+ Person Household | 0 (0.0%) | 36 (100.0%) |
| Total Housing Units | 203 (63.8%) | 115 (36.2%) |
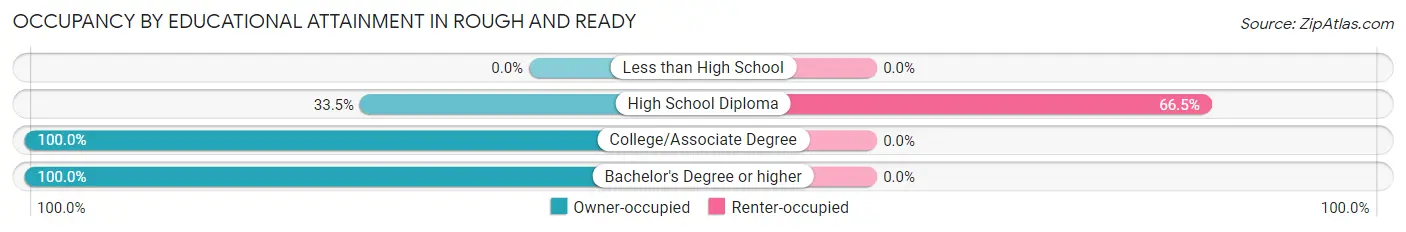
Occupancy by Educational Attainment in Rough And Ready
| Household Size | Owner-occupied | Renter-occupied |
| Less than High School | 0 (0.0%) | 0 (0.0%) |
| High School Diploma | 58 (33.5%) | 115 (66.5%) |
| College/Associate Degree | 34 (100.0%) | 0 (0.0%) |
| Bachelor's Degree or higher | 111 (100.0%) | 0 (0.0%) |
Occupancy by Age of Householder in Rough And Ready
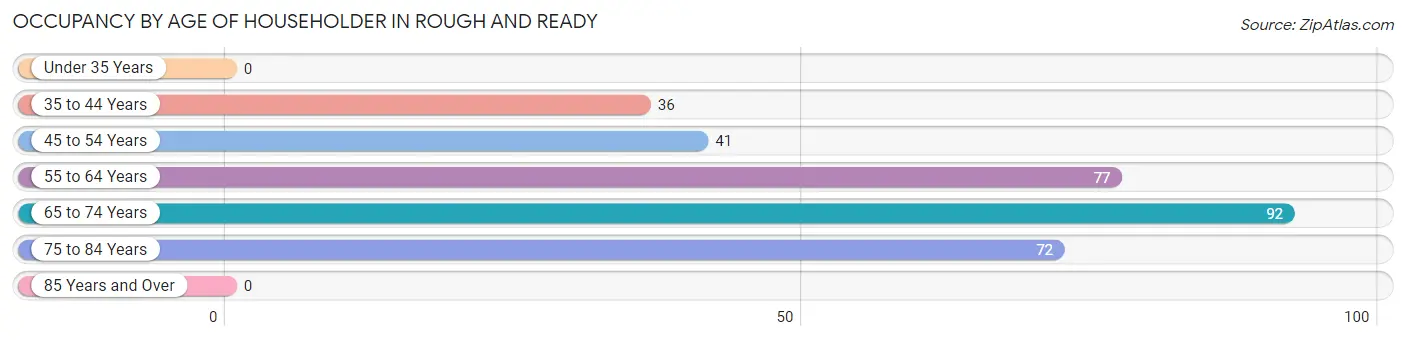
| Age Bracket | # Households | % Households |
| Under 35 Years | 0 | 0.0% |
| 35 to 44 Years | 36 | 11.3% |
| 45 to 54 Years | 41 | 12.9% |
| 55 to 64 Years | 77 | 24.2% |
| 65 to 74 Years | 92 | 28.9% |
| 75 to 84 Years | 72 | 22.6% |
| 85 Years and Over | 0 | 0.0% |
| Total | 318 | 100.0% |
Housing Finances in Rough And Ready
Median Income by Occupancy in Rough And Ready
| Occupancy Type | # Households | Median Income |
| Owner-Occupied | 203 (63.8%) | $0 |
| Renter-Occupied | 115 (36.2%) | $0 |
| Average | 318 (100.0%) | $0 |
Occupancy by Householder Income Bracket in Rough And Ready
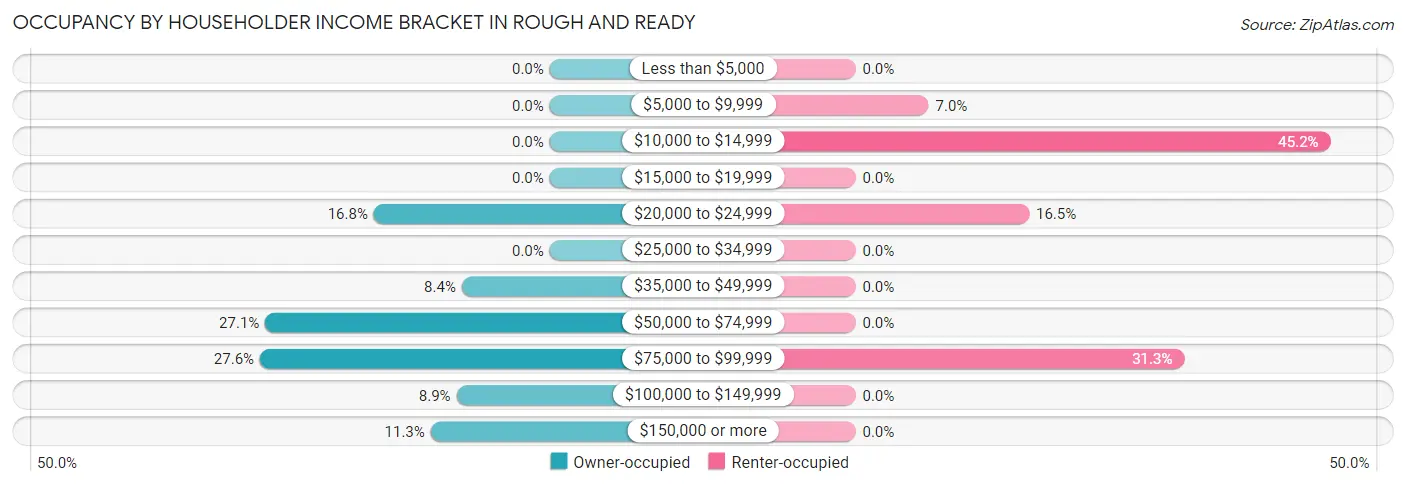
| Income Bracket | Owner-occupied | Renter-occupied |
| Less than $5,000 | 0 (0.0%) | 0 (0.0%) |
| $5,000 to $9,999 | 0 (0.0%) | 8 (7.0%) |
| $10,000 to $14,999 | 0 (0.0%) | 52 (45.2%) |
| $15,000 to $19,999 | 0 (0.0%) | 0 (0.0%) |
| $20,000 to $24,999 | 34 (16.8%) | 19 (16.5%) |
| $25,000 to $34,999 | 0 (0.0%) | 0 (0.0%) |
| $35,000 to $49,999 | 17 (8.4%) | 0 (0.0%) |
| $50,000 to $74,999 | 55 (27.1%) | 0 (0.0%) |
| $75,000 to $99,999 | 56 (27.6%) | 36 (31.3%) |
| $100,000 to $149,999 | 18 (8.9%) | 0 (0.0%) |
| $150,000 or more | 23 (11.3%) | 0 (0.0%) |
| Total | 203 (100.0%) | 115 (100.0%) |
Monthly Housing Cost Tiers in Rough And Ready
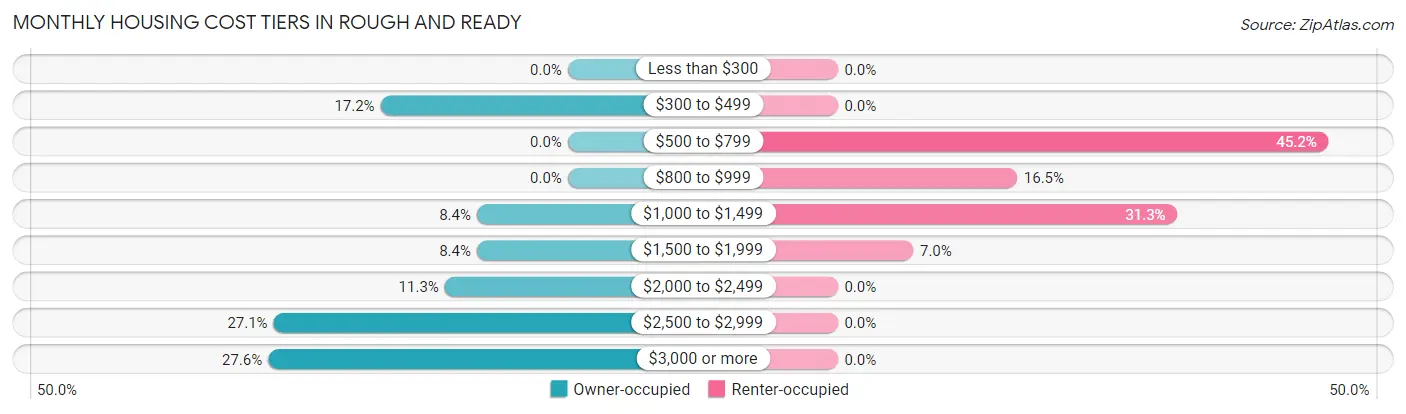
| Monthly Cost | Owner-occupied | Renter-occupied |
| Less than $300 | 0 (0.0%) | 0 (0.0%) |
| $300 to $499 | 35 (17.2%) | 0 (0.0%) |
| $500 to $799 | 0 (0.0%) | 52 (45.2%) |
| $800 to $999 | 0 (0.0%) | 19 (16.5%) |
| $1,000 to $1,499 | 17 (8.4%) | 36 (31.3%) |
| $1,500 to $1,999 | 17 (8.4%) | 8 (7.0%) |
| $2,000 to $2,499 | 23 (11.3%) | 0 (0.0%) |
| $2,500 to $2,999 | 55 (27.1%) | 0 (0.0%) |
| $3,000 or more | 56 (27.6%) | 0 (0.0%) |
| Total | 203 (100.0%) | 115 (100.0%) |
Physical Housing Characteristics in Rough And Ready
Housing Structures in Rough And Ready
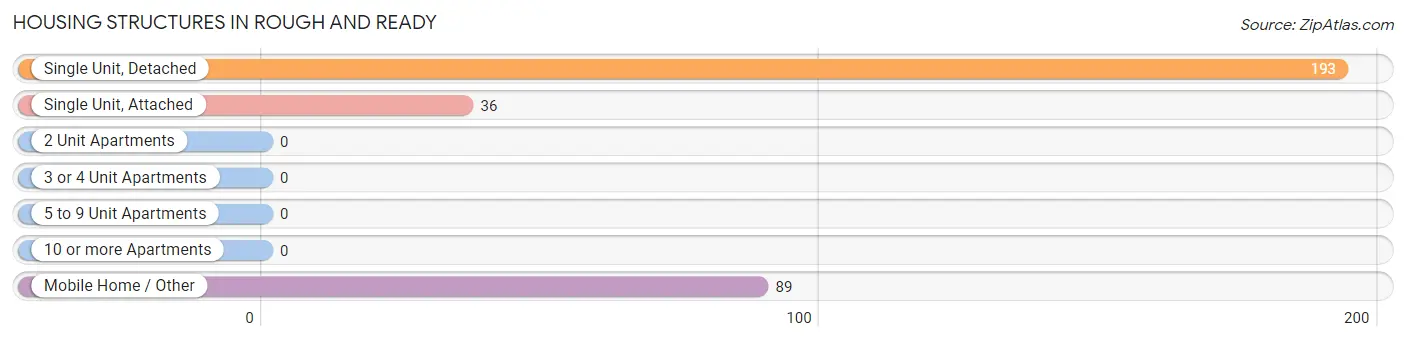
| Structure Type | # Housing Units | % Housing Units |
| Single Unit, Detached | 193 | 60.7% |
| Single Unit, Attached | 36 | 11.3% |
| 2 Unit Apartments | 0 | 0.0% |
| 3 or 4 Unit Apartments | 0 | 0.0% |
| 5 to 9 Unit Apartments | 0 | 0.0% |
| 10 or more Apartments | 0 | 0.0% |
| Mobile Home / Other | 89 | 28.0% |
| Total | 318 | 100.0% |
Housing Structures by Occupancy in Rough And Ready
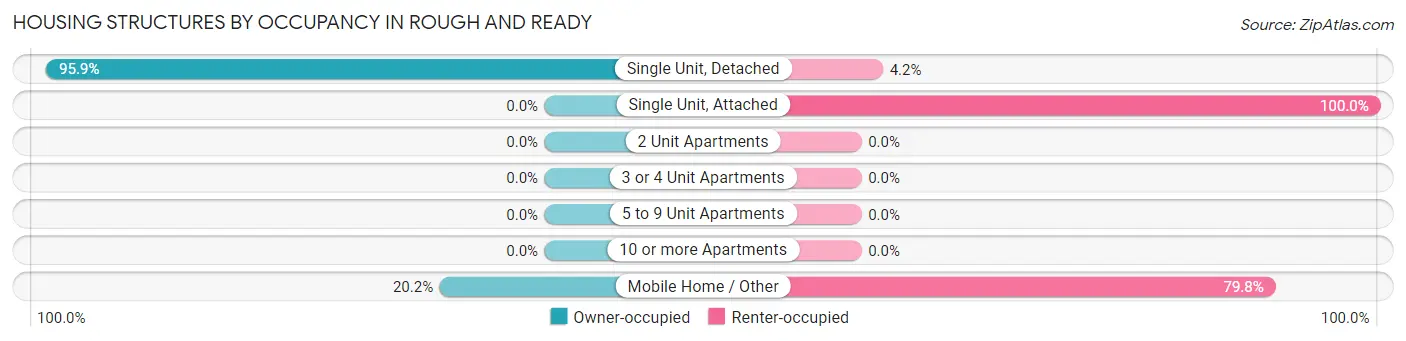
| Structure Type | Owner-occupied | Renter-occupied |
| Single Unit, Detached | 185 (95.9%) | 8 (4.2%) |
| Single Unit, Attached | 0 (0.0%) | 36 (100.0%) |
| 2 Unit Apartments | 0 (0.0%) | 0 (0.0%) |
| 3 or 4 Unit Apartments | 0 (0.0%) | 0 (0.0%) |
| 5 to 9 Unit Apartments | 0 (0.0%) | 0 (0.0%) |
| 10 or more Apartments | 0 (0.0%) | 0 (0.0%) |
| Mobile Home / Other | 18 (20.2%) | 71 (79.8%) |
| Total | 203 (63.8%) | 115 (36.2%) |
Housing Structures by Number of Rooms in Rough And Ready
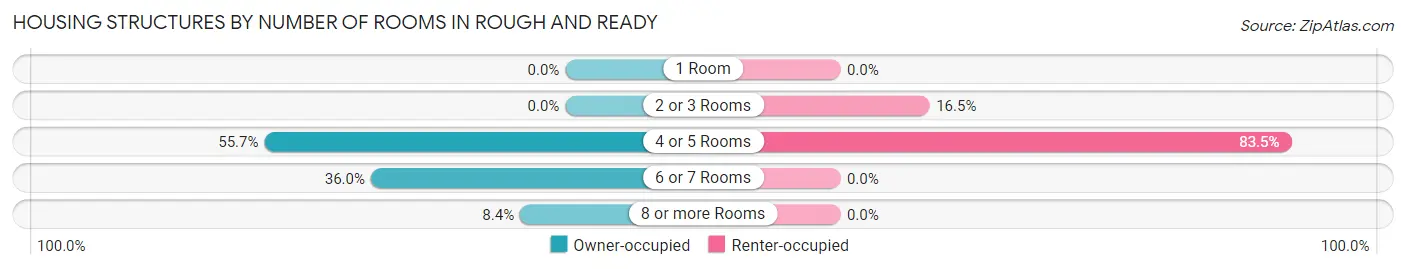
| Number of Rooms | Owner-occupied | Renter-occupied |
| 1 Room | 0 (0.0%) | 0 (0.0%) |
| 2 or 3 Rooms | 0 (0.0%) | 19 (16.5%) |
| 4 or 5 Rooms | 113 (55.7%) | 96 (83.5%) |
| 6 or 7 Rooms | 73 (36.0%) | 0 (0.0%) |
| 8 or more Rooms | 17 (8.4%) | 0 (0.0%) |
| Total | 203 (100.0%) | 115 (100.0%) |
Housing Structure by Heating Type in Rough And Ready
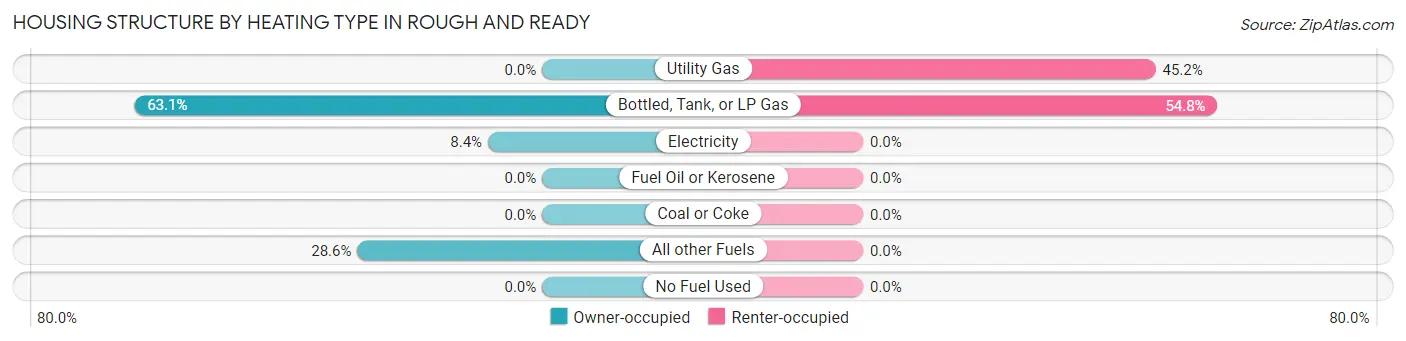
| Heating Type | Owner-occupied | Renter-occupied |
| Utility Gas | 0 (0.0%) | 52 (45.2%) |
| Bottled, Tank, or LP Gas | 128 (63.0%) | 63 (54.8%) |
| Electricity | 17 (8.4%) | 0 (0.0%) |
| Fuel Oil or Kerosene | 0 (0.0%) | 0 (0.0%) |
| Coal or Coke | 0 (0.0%) | 0 (0.0%) |
| All other Fuels | 58 (28.6%) | 0 (0.0%) |
| No Fuel Used | 0 (0.0%) | 0 (0.0%) |
| Total | 203 (100.0%) | 115 (100.0%) |
Household Vehicle Usage in Rough And Ready
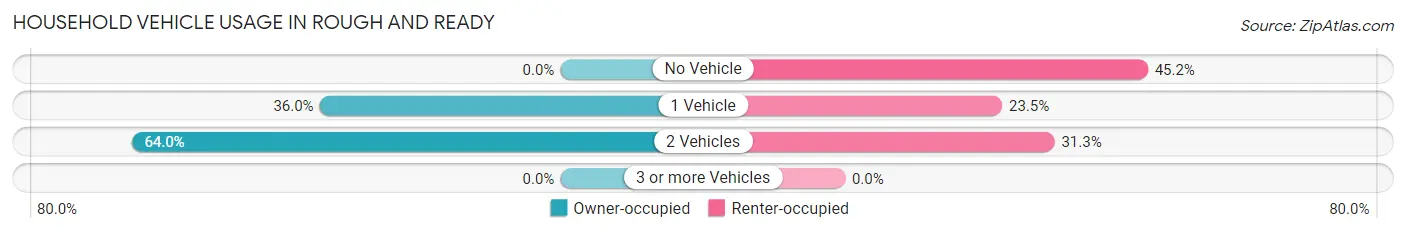
| Vehicles per Household | Owner-occupied | Renter-occupied |
| No Vehicle | 0 (0.0%) | 52 (45.2%) |
| 1 Vehicle | 73 (36.0%) | 27 (23.5%) |
| 2 Vehicles | 130 (64.0%) | 36 (31.3%) |
| 3 or more Vehicles | 0 (0.0%) | 0 (0.0%) |
| Total | 203 (100.0%) | 115 (100.0%) |
Real Estate & Mortgages in Rough And Ready
Real Estate and Mortgage Overview in Rough And Ready
| Characteristic | Without Mortgage | With Mortgage |
| Housing Units | 35 | 168 |
| Median Property Value | - | - |
| Median Household Income | - | - |
| Monthly Housing Costs | - | - |
| Real Estate Taxes | - | - |
Property Value by Mortgage Status in Rough And Ready
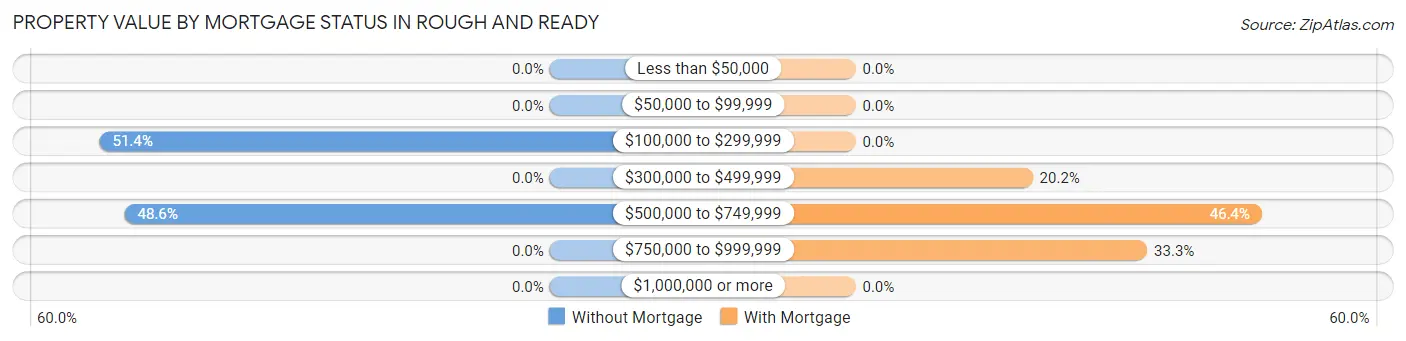
| Property Value | Without Mortgage | With Mortgage |
| Less than $50,000 | 0 (0.0%) | 0 (0.0%) |
| $50,000 to $99,999 | 0 (0.0%) | 0 (0.0%) |
| $100,000 to $299,999 | 18 (51.4%) | 0 (0.0%) |
| $300,000 to $499,999 | 0 (0.0%) | 34 (20.2%) |
| $500,000 to $749,999 | 17 (48.6%) | 78 (46.4%) |
| $750,000 to $999,999 | 0 (0.0%) | 56 (33.3%) |
| $1,000,000 or more | 0 (0.0%) | 0 (0.0%) |
| Total | 35 (100.0%) | 168 (100.0%) |
Household Income by Mortgage Status in Rough And Ready
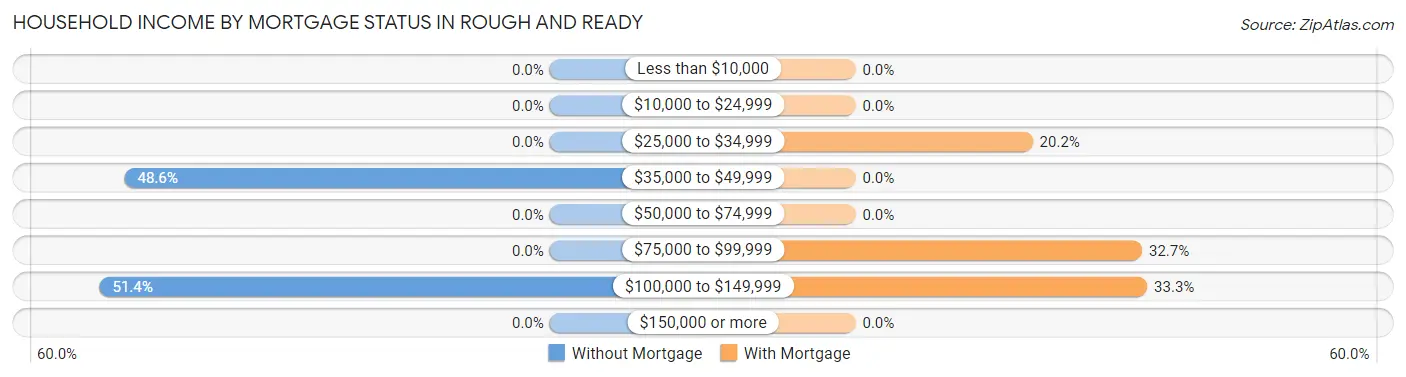
| Household Income | Without Mortgage | With Mortgage |
| Less than $10,000 | 0 (0.0%) | 0 (0.0%) |
| $10,000 to $24,999 | 0 (0.0%) | 0 (0.0%) |
| $25,000 to $34,999 | 0 (0.0%) | 34 (20.2%) |
| $35,000 to $49,999 | 17 (48.6%) | 0 (0.0%) |
| $50,000 to $74,999 | 0 (0.0%) | 0 (0.0%) |
| $75,000 to $99,999 | 0 (0.0%) | 55 (32.7%) |
| $100,000 to $149,999 | 18 (51.4%) | 56 (33.3%) |
| $150,000 or more | 0 (0.0%) | 0 (0.0%) |
| Total | 35 (100.0%) | 168 (100.0%) |
Property Value to Household Income Ratio in Rough And Ready
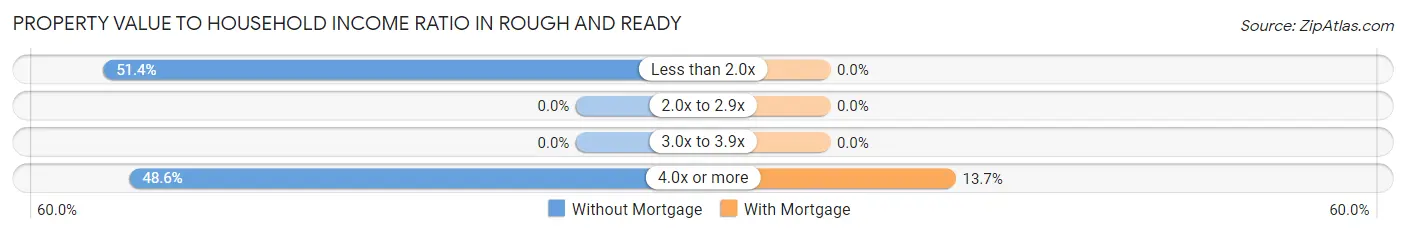
| Value-to-Income Ratio | Without Mortgage | With Mortgage |
| Less than 2.0x | 18 (51.4%) | 0 (0.0%) |
| 2.0x to 2.9x | 0 (0.0%) | 0 (0.0%) |
| 3.0x to 3.9x | 0 (0.0%) | 0 (0.0%) |
| 4.0x or more | 17 (48.6%) | 23 (13.7%) |
| Total | 35 (100.0%) | 168 (100.0%) |
Real Estate Taxes by Mortgage Status in Rough And Ready
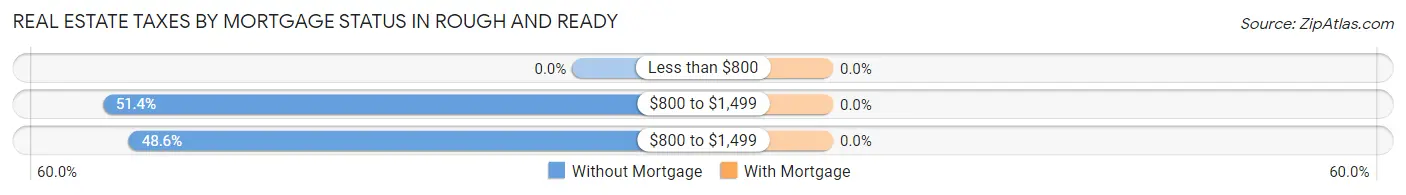
| Property Taxes | Without Mortgage | With Mortgage |
| Less than $800 | 0 (0.0%) | 0 (0.0%) |
| $800 to $1,499 | 18 (51.4%) | 0 (0.0%) |
| $800 to $1,499 | 17 (48.6%) | 0 (0.0%) |
| Total | 35 (100.0%) | 168 (100.0%) |
Health & Disability in Rough And Ready
Health Insurance Coverage by Age in Rough And Ready
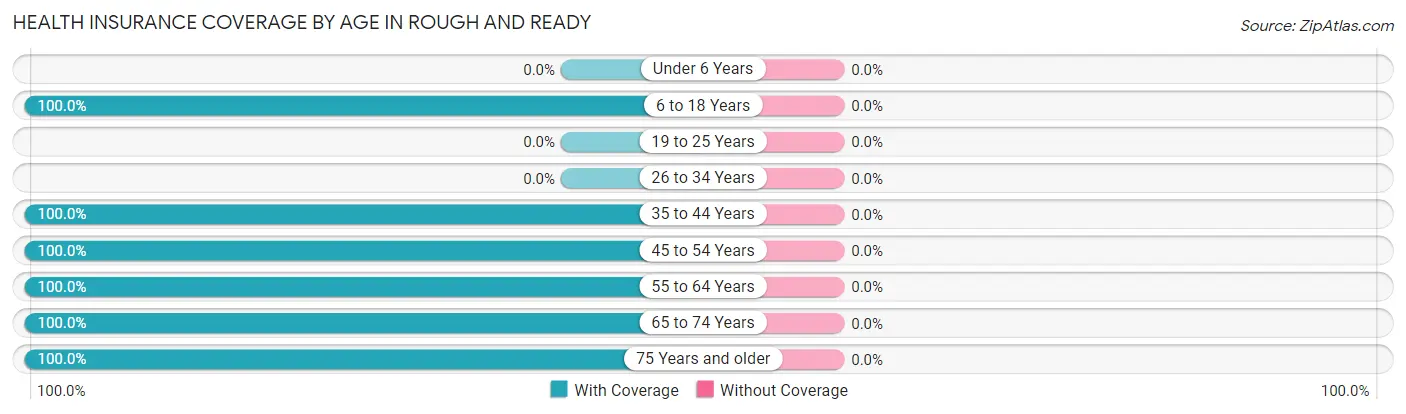
| Age Bracket | With Coverage | Without Coverage |
| Under 6 Years | 0 (0.0%) | 0 (0.0%) |
| 6 to 18 Years | 121 (100.0%) | 0 (0.0%) |
| 19 to 25 Years | 0 (0.0%) | 0 (0.0%) |
| 26 to 34 Years | 0 (0.0%) | 0 (0.0%) |
| 35 to 44 Years | 78 (100.0%) | 0 (0.0%) |
| 45 to 54 Years | 61 (100.0%) | 0 (0.0%) |
| 55 to 64 Years | 77 (100.0%) | 0 (0.0%) |
| 65 to 74 Years | 110 (100.0%) | 0 (0.0%) |
| 75 Years and older | 176 (100.0%) | 0 (0.0%) |
| Total | 623 (100.0%) | 0 (0.0%) |
Health Insurance Coverage by Citizenship Status in Rough And Ready
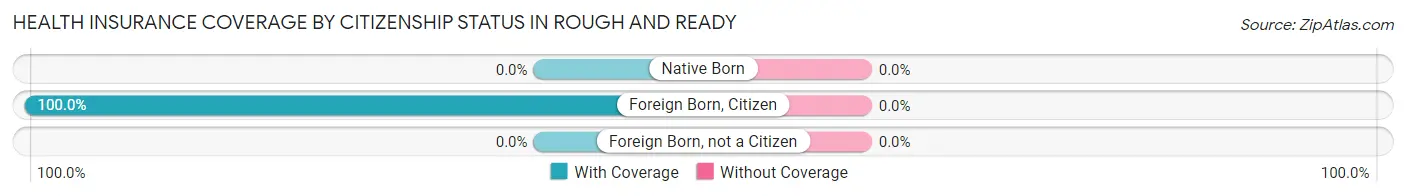
| Citizenship Status | With Coverage | Without Coverage |
| Native Born | 0 (0.0%) | 0 (0.0%) |
| Foreign Born, Citizen | 121 (100.0%) | 0 (0.0%) |
| Foreign Born, not a Citizen | 0 (0.0%) | 0 (0.0%) |
Health Insurance Coverage by Household Income in Rough And Ready
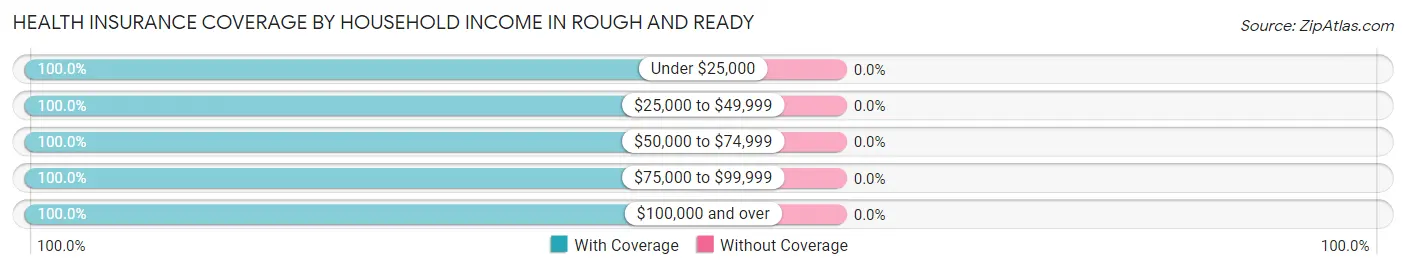
| Household Income | With Coverage | Without Coverage |
| Under $25,000 | 113 (100.0%) | 0 (0.0%) |
| $25,000 to $49,999 | 17 (100.0%) | 0 (0.0%) |
| $50,000 to $74,999 | 159 (100.0%) | 0 (0.0%) |
| $75,000 to $99,999 | 234 (100.0%) | 0 (0.0%) |
| $100,000 and over | 100 (100.0%) | 0 (0.0%) |
Public vs Private Health Insurance Coverage by Age in Rough And Ready
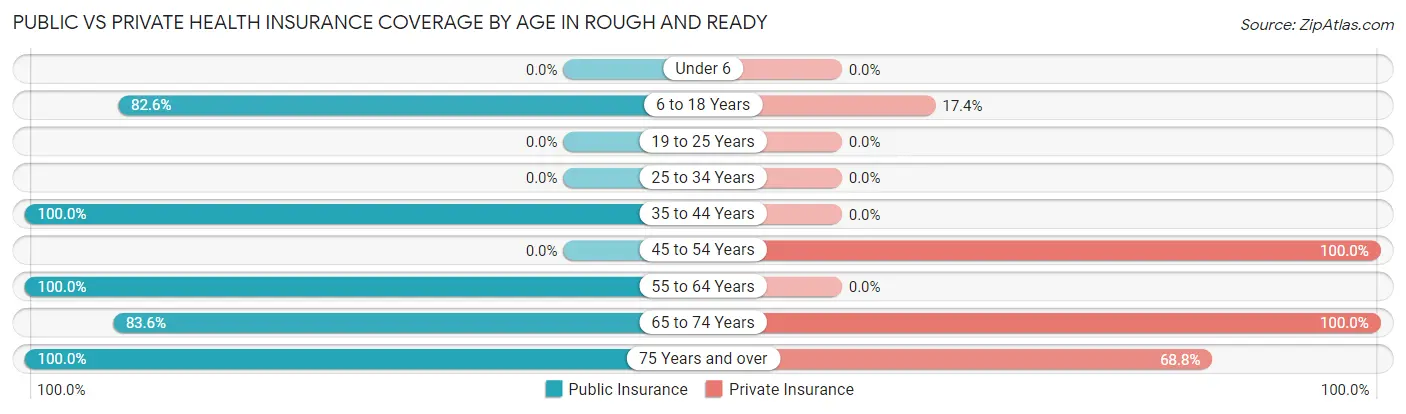
| Age Bracket | Public Insurance | Private Insurance |
| Under 6 | 0 (0.0%) | 0 (0.0%) |
| 6 to 18 Years | 100 (82.6%) | 21 (17.4%) |
| 19 to 25 Years | 0 (0.0%) | 0 (0.0%) |
| 25 to 34 Years | 0 (0.0%) | 0 (0.0%) |
| 35 to 44 Years | 78 (100.0%) | 0 (0.0%) |
| 45 to 54 Years | 0 (0.0%) | 61 (100.0%) |
| 55 to 64 Years | 77 (100.0%) | 0 (0.0%) |
| 65 to 74 Years | 92 (83.6%) | 110 (100.0%) |
| 75 Years and over | 176 (100.0%) | 121 (68.8%) |
| Total | 523 (84.0%) | 313 (50.2%) |
Disability Status by Sex by Age in Rough And Ready
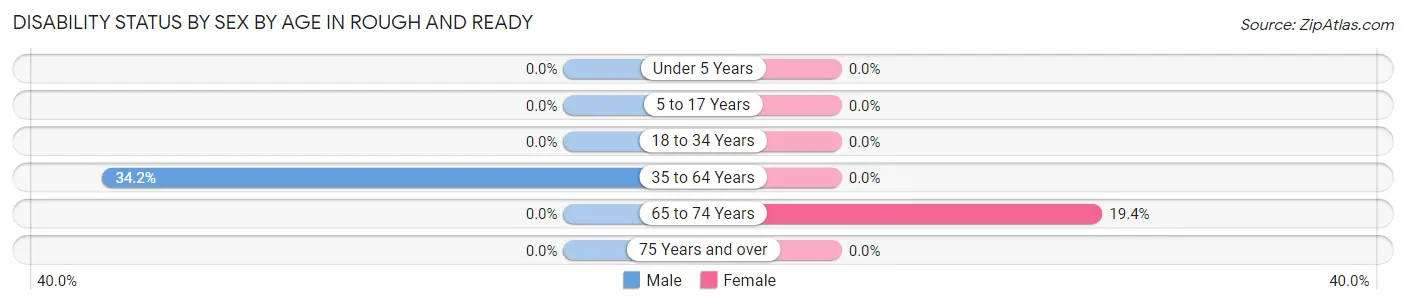
| Age Bracket | Male | Female |
| Under 5 Years | 0 (0.0%) | 0 (0.0%) |
| 5 to 17 Years | 0 (0.0%) | 0 (0.0%) |
| 18 to 34 Years | 0 (0.0%) | 0 (0.0%) |
| 35 to 64 Years | 52 (34.2%) | 0 (0.0%) |
| 65 to 74 Years | 0 (0.0%) | 18 (19.4%) |
| 75 Years and over | 0 (0.0%) | 0 (0.0%) |
Disability Class by Sex by Age in Rough And Ready
Disability Class: Hearing Difficulty

| Age Bracket | Male | Female |
| Under 5 Years | 0 (0.0%) | 0 (0.0%) |
| 5 to 17 Years | 0 (0.0%) | 0 (0.0%) |
| 18 to 34 Years | 0 (0.0%) | 0 (0.0%) |
| 35 to 64 Years | 0 (0.0%) | 0 (0.0%) |
| 65 to 74 Years | 0 (0.0%) | 0 (0.0%) |
| 75 Years and over | 0 (0.0%) | 0 (0.0%) |
Disability Class: Vision Difficulty
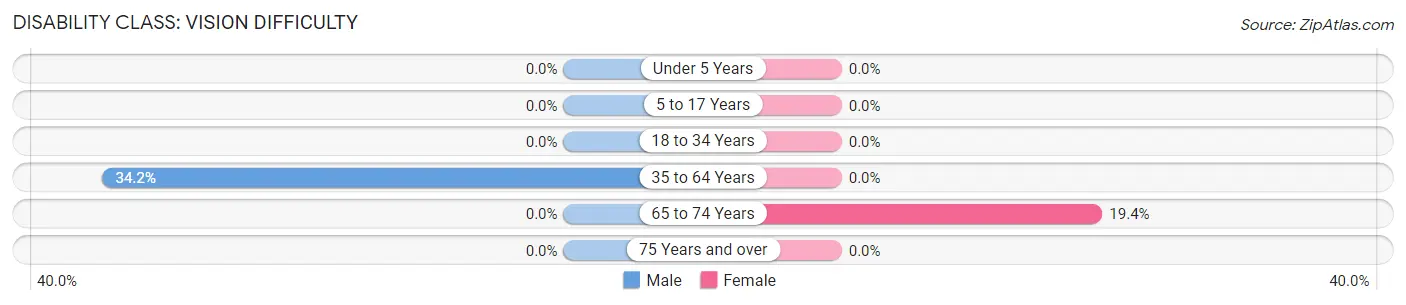
| Age Bracket | Male | Female |
| Under 5 Years | 0 (0.0%) | 0 (0.0%) |
| 5 to 17 Years | 0 (0.0%) | 0 (0.0%) |
| 18 to 34 Years | 0 (0.0%) | 0 (0.0%) |
| 35 to 64 Years | 52 (34.2%) | 0 (0.0%) |
| 65 to 74 Years | 0 (0.0%) | 18 (19.4%) |
| 75 Years and over | 0 (0.0%) | 0 (0.0%) |
Disability Class: Cognitive Difficulty
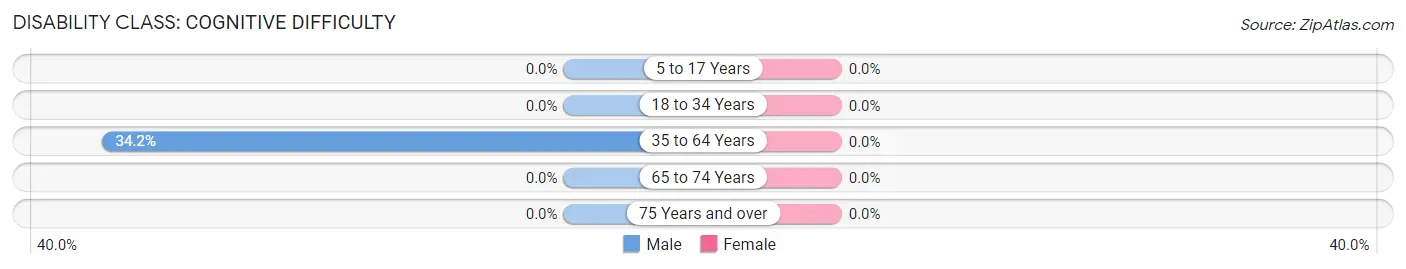
| Age Bracket | Male | Female |
| 5 to 17 Years | 0 (0.0%) | 0 (0.0%) |
| 18 to 34 Years | 0 (0.0%) | 0 (0.0%) |
| 35 to 64 Years | 52 (34.2%) | 0 (0.0%) |
| 65 to 74 Years | 0 (0.0%) | 0 (0.0%) |
| 75 Years and over | 0 (0.0%) | 0 (0.0%) |
Disability Class: Ambulatory Difficulty
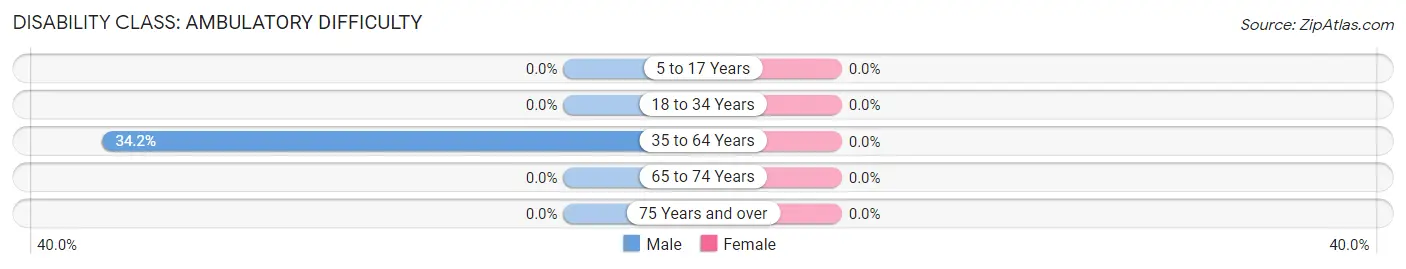
| Age Bracket | Male | Female |
| 5 to 17 Years | 0 (0.0%) | 0 (0.0%) |
| 18 to 34 Years | 0 (0.0%) | 0 (0.0%) |
| 35 to 64 Years | 52 (34.2%) | 0 (0.0%) |
| 65 to 74 Years | 0 (0.0%) | 0 (0.0%) |
| 75 Years and over | 0 (0.0%) | 0 (0.0%) |
Disability Class: Self-Care Difficulty
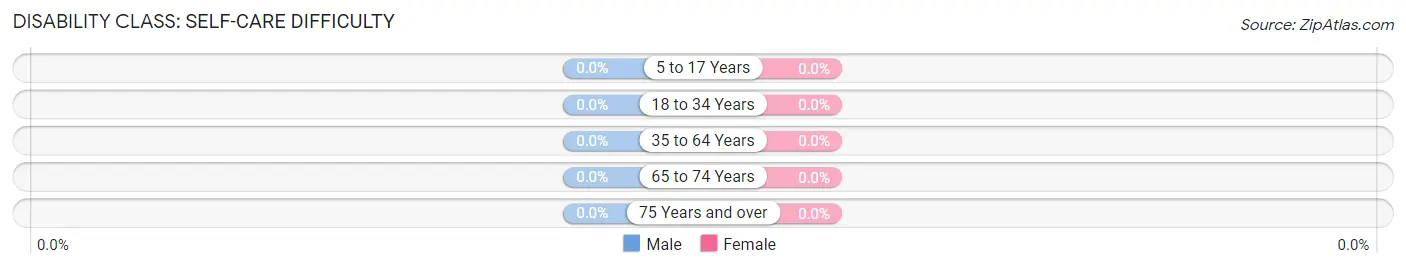
| Age Bracket | Male | Female |
| 5 to 17 Years | 0 (0.0%) | 0 (0.0%) |
| 18 to 34 Years | 0 (0.0%) | 0 (0.0%) |
| 35 to 64 Years | 0 (0.0%) | 0 (0.0%) |
| 65 to 74 Years | 0 (0.0%) | 0 (0.0%) |
| 75 Years and over | 0 (0.0%) | 0 (0.0%) |
Technology Access in Rough And Ready
Computing Device Access in Rough And Ready
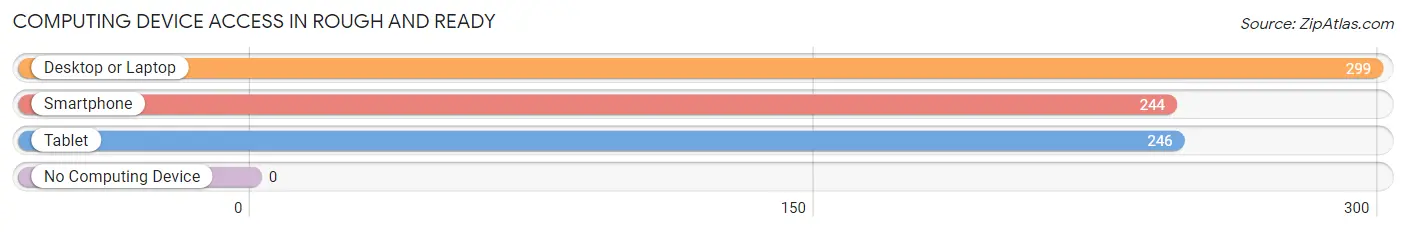
| Device Type | # Households | % Households |
| Desktop or Laptop | 299 | 94.0% |
| Smartphone | 244 | 76.7% |
| Tablet | 246 | 77.4% |
| No Computing Device | 0 | 0.0% |
| Total | 318 | 100.0% |
Internet Access in Rough And Ready
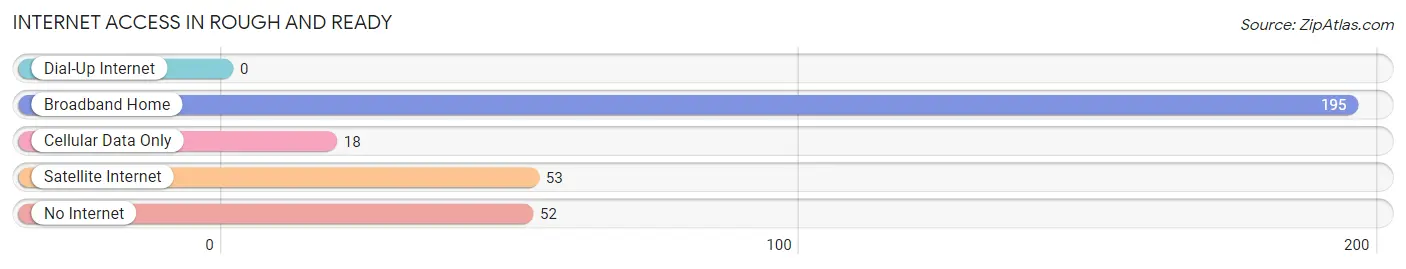
| Internet Type | # Households | % Households |
| Dial-Up Internet | 0 | 0.0% |
| Broadband Home | 195 | 61.3% |
| Cellular Data Only | 18 | 5.7% |
| Satellite Internet | 53 | 16.7% |
| No Internet | 52 | 16.4% |
| Total | 318 | 100.0% |
Rough And Ready Summary
Rough and Ready is a small unincorporated community located in Nevada County, California. It is situated in the Sierra Nevada foothills, approximately 10 miles northeast of Nevada City and 20 miles south of Grass Valley. The town was founded in 1849 by a group of miners who named it after General Zachary Taylor, who was nicknamed “Old Rough and Ready”. The town was a major gold mining center during the California Gold Rush and was home to several thousand people at its peak.
History
Rough and Ready was founded in 1849 by a group of miners who named it after General Zachary Taylor, who was nicknamed “Old Rough and Ready”. The town was a major gold mining center during the California Gold Rush and was home to several thousand people at its peak. The town was also home to a number of businesses, including a hotel, saloon, blacksmith shop, and general store.
In 1851, the town was incorporated as a municipality and elected its first mayor, William B. Ide. Ide was a leader of the California Republic, a short-lived independent state that declared its independence from Mexico in 1846. Ide was also the first president of the California Republic.
In 1852, the town was the site of the first California State Fair. The fair was held in a large tent and featured a variety of exhibits, including a display of gold nuggets.
In 1856, the town was the site of the first California State Constitutional Convention. The convention was held in a large tent and resulted in the adoption of the first California Constitution.
In 1857, the town was the site of the first California State Legislature. The legislature was held in a large tent and resulted in the adoption of the first California State Constitution.
In 1858, the town was the site of the first California State Supreme Court. The court was held in a large tent and resulted in the adoption of the first California State Supreme Court.
In 1859, the town was the site of the first California State Capitol. The capitol was held in a large tent and resulted in the adoption of the first California State Capitol.
In 1860, the town was the site of the first California State University. The university was held in a large tent and resulted in the adoption of the first California State University.
In 1861, the town was the site of the first California State Bank. The bank was held in a large tent and resulted in the adoption of the first California State Bank.
In 1862, the town was the site of the first California State Prison. The prison was held in a large tent and resulted in the adoption of the first California State Prison.
In 1863, the town was the site of the first California State Fair. The fair was held in a large tent and featured a variety of exhibits, including a display of gold nuggets.
In 1864, the town was the site of the first California State Legislature. The legislature was held in a large tent and resulted in the adoption of the first California State Constitution.
In 1865, the town was the site of the first California State Supreme Court. The court was held in a large tent and resulted in the adoption of the first California State Supreme Court.
In 1866, the town was the site of the first California State Capitol. The capitol was held in a large tent and resulted in the adoption of the first California State Capitol.
In 1867, the town was the site of the first California State University. The university was held in a large tent and resulted in the adoption of the first California State University.
In 1868, the town was the site of the first California State Bank. The bank was held in a large tent and resulted in the adoption of the first California State Bank.
In 1869, the town was the site of the first California State Prison. The prison was held in a large tent and resulted in the adoption of the first California State Prison.
In 1870, the town was the site of the first California State Fair. The fair was held in a large tent and featured a variety of exhibits, including a display of gold nuggets.
In 1871, the town was the site of the first California State Legislature. The legislature was held in a large tent and resulted in the adoption of the first California State Constitution.
In 1872, the town was the site of the first California State Supreme Court. The court was held in a large tent and resulted in the adoption of the first California State Supreme Court.
In 1873, the town was the site of the first California State Capitol. The capitol was held in a large tent and resulted in the adoption of the first California State Capitol.
In 1874, the town was the site of the first California State University. The university was held in a large tent and resulted in the adoption of the first California State University.
In 1875, the town was the site of the first California State Bank. The bank was held in a large tent and resulted in the adoption of the first California State Bank.
In 1876, the town was the site of the first California State Prison. The prison was held in a large tent and resulted in the adoption of the first California State Prison.
Geography
Rough and Ready is located in the Sierra Nevada foothills, approximately 10 miles northeast of Nevada City and 20 miles south of Grass Valley. The town is situated at an elevation of 2,400 feet and is surrounded by rolling hills and oak woodlands. The town is located in the Bear River watershed and is home to several creeks, including the Rough and Ready Creek, which flows through the town.
Economy
Rough and Ready is a small, rural community with a population of approximately 1,000 people. The town is home to a variety of small businesses, including a general store, a gas station, a restaurant, and a few small shops. The town is also home to a number of small farms and ranches, which produce a variety of crops, including hay, apples, and walnuts.
Demographics
As of the 2010 census, the population of Rough and Ready was 1,025. The racial makeup of the town was 94.3% White, 0.7% African American, 0.7% Native American, 0.7% Asian, 0.3% Pacific Islander, 0.7% from other races, and 2.3% from two or more races. Hispanic or Latino of any race were 4.3% of the population.
The median household income in Rough and Ready was $45,000, and the median family income was $50,000. The per capita income for the town was $20,000. About 10.7% of families and 14.3% of the population were below the poverty line, including 18.2% of those under age 18 and 8.3% of those age 65 or over.
Common Questions
What is Per Capita Income in Rough And Ready?
Per Capita income in Rough And Ready is $35,624.
What is the Median Family Income in Rough And Ready?
Median Family Income in Rough And Ready is $56,364.
What is Inequality or Gini Index in Rough And Ready?
Inequality or Gini Index in Rough And Ready is 0.37.
What is the Total Population of Rough And Ready?
Total Population of Rough And Ready is 623.
What is the Total Male Population of Rough And Ready?
Total Male Population of Rough And Ready is 334.
What is the Total Female Population of Rough And Ready?
Total Female Population of Rough And Ready is 289.
What is the Ratio of Males per 100 Females in Rough And Ready?
There are 115.57 Males per 100 Females in Rough And Ready.
What is the Ratio of Females per 100 Males in Rough And Ready?
There are 86.53 Females per 100 Males in Rough And Ready.
What is the Median Population Age in Rough And Ready?
Median Population Age in Rough And Ready is 60.5 Years.
What is the Average Family Size in Rough And Ready
Average Family Size in Rough And Ready is 3.0 People.
What is the Average Household Size in Rough And Ready
Average Household Size in Rough And Ready is 2.0 People.
How Large is the Labor Force in Rough And Ready?
There are 183 People in the Labor Forcein in Rough And Ready.
What is the Percentage of People in the Labor Force in Rough And Ready?
36.5% of People are in the Labor Force in Rough And Ready.
What is the Unemployment Rate in Rough And Ready?
Unemployment Rate in Rough And Ready is 4.4%.