Rose Hills, CA Map & Demographics
Rose Hills Map
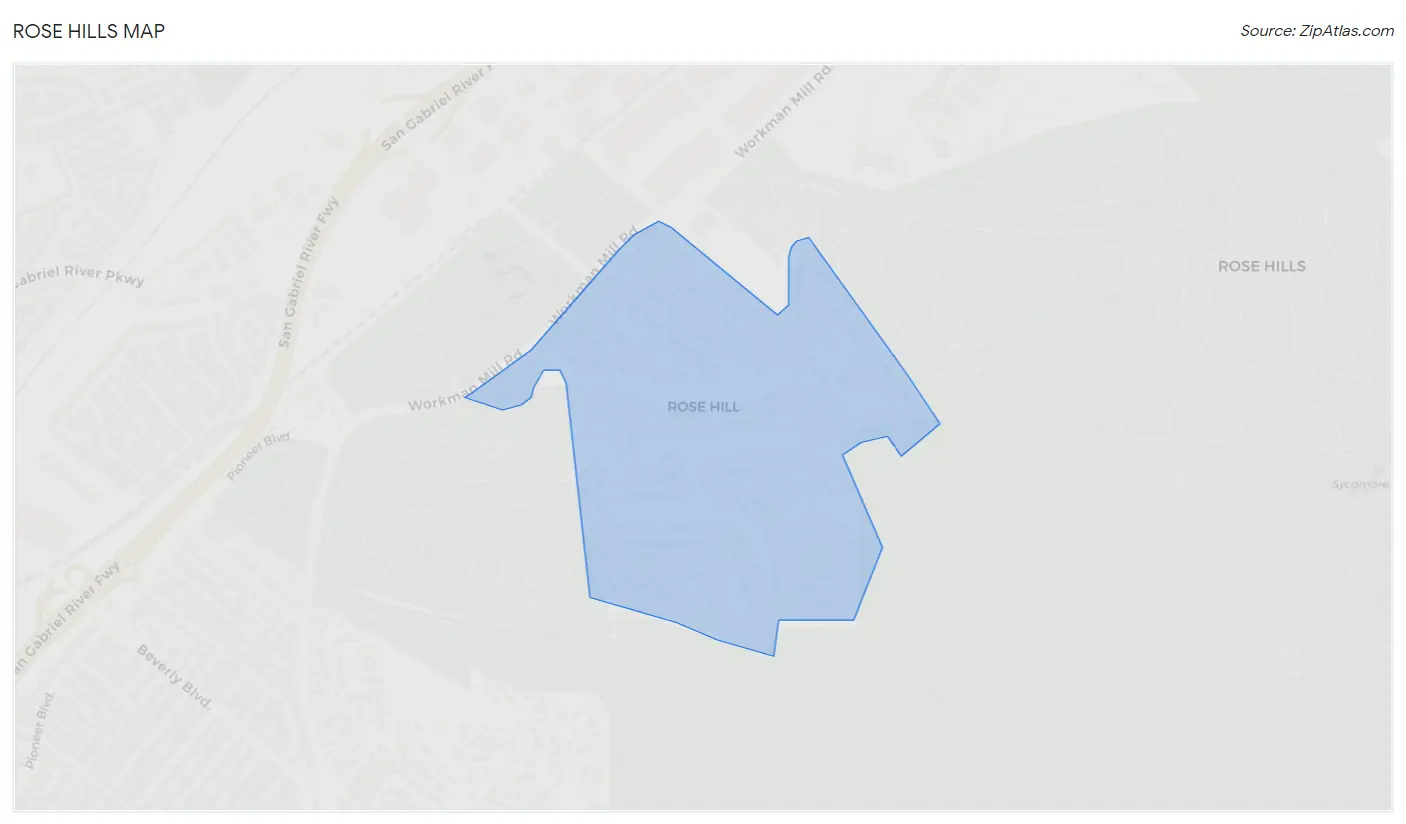
Rose Hills Overview
$61,192
PER CAPITA INCOME
$160,094
AVG FAMILY INCOME
$139,615
AVG HOUSEHOLD INCOME
34.1%
WAGE / INCOME GAP [ % ]
65.9¢/ $1
WAGE / INCOME GAP [ $ ]
0.36
INEQUALITY / GINI INDEX
2,718
TOTAL POPULATION
1,320
MALE POPULATION
1,398
FEMALE POPULATION
94.42
MALES / 100 FEMALES
105.91
FEMALES / 100 MALES
52.2
MEDIAN AGE
3.0
AVG FAMILY SIZE
2.6
AVG HOUSEHOLD SIZE
1,562
LABOR FORCE [ PEOPLE ]
65.2%
PERCENT IN LABOR FORCE
2.4%
UNEMPLOYMENT RATE
Income in Rose Hills
Income Overview in Rose Hills
Per Capita Income in Rose Hills is $61,192, while median incomes of families and households are $160,094 and $139,615 respectively.
| Characteristic | Number | Measure |
| Per Capita Income | 2,718 | $61,192 |
| Median Family Income | 781 | $160,094 |
| Mean Family Income | 781 | $160,792 |
| Median Household Income | 1,050 | $139,615 |
| Mean Household Income | 1,050 | $155,630 |
| Income Deficit | 781 | $0 |
| Wage / Income Gap (%) | 2,718 | 34.09% |
| Wage / Income Gap ($) | 2,718 | 65.91¢ per $1 |
| Gini / Inequality Index | 2,718 | 0.36 |
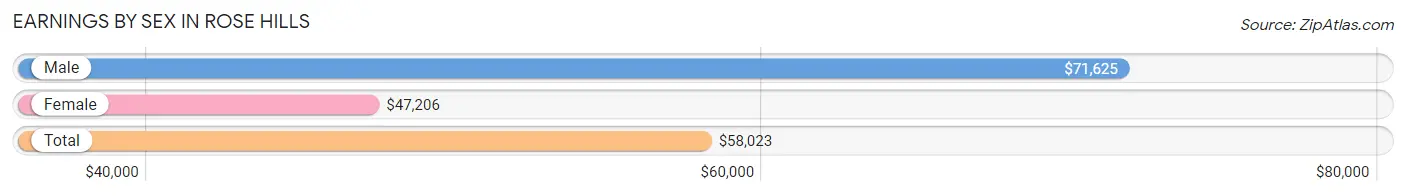
Earnings by Sex in Rose Hills
Average Earnings in Rose Hills are $58,023, $71,625 for men and $47,206 for women, a difference of 34.1%.
| Sex | Number | Average Earnings |
| Male | 925 (54.6%) | $71,625 |
| Female | 768 (45.4%) | $47,206 |
| Total | 1,693 (100.0%) | $58,023 |
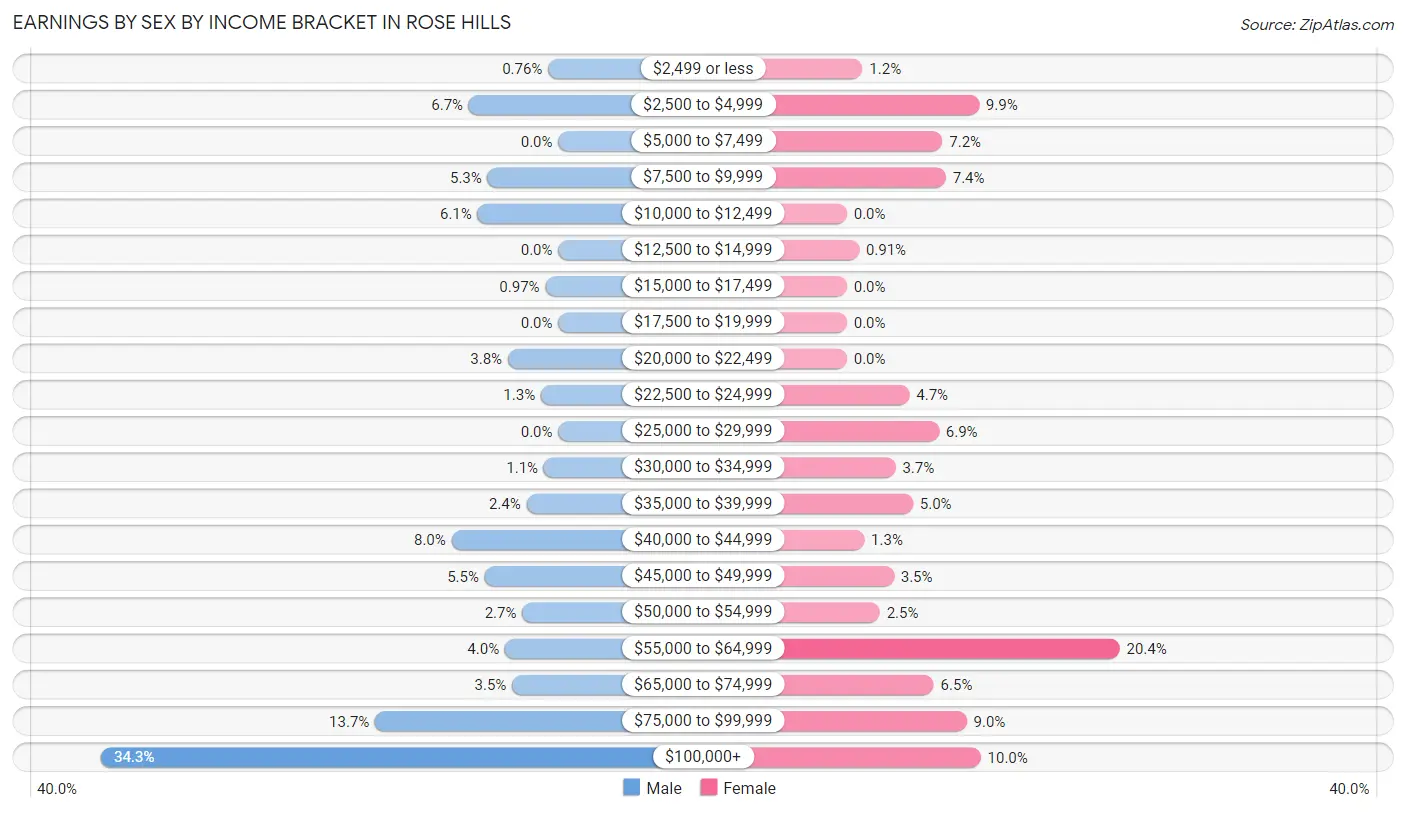
Earnings by Sex by Income Bracket in Rose Hills
The most common earnings brackets in Rose Hills are $100,000+ for men (317 | 34.3%) and $55,000 to $64,999 for women (157 | 20.4%).
| Income | Male | Female |
| $2,499 or less | 7 (0.8%) | 9 (1.2%) |
| $2,500 to $4,999 | 62 (6.7%) | 76 (9.9%) |
| $5,000 to $7,499 | 0 (0.0%) | 55 (7.2%) |
| $7,500 to $9,999 | 49 (5.3%) | 57 (7.4%) |
| $10,000 to $12,499 | 56 (6.0%) | 0 (0.0%) |
| $12,500 to $14,999 | 0 (0.0%) | 7 (0.9%) |
| $15,000 to $17,499 | 9 (1.0%) | 0 (0.0%) |
| $17,500 to $19,999 | 0 (0.0%) | 0 (0.0%) |
| $20,000 to $22,499 | 35 (3.8%) | 0 (0.0%) |
| $22,500 to $24,999 | 12 (1.3%) | 36 (4.7%) |
| $25,000 to $29,999 | 0 (0.0%) | 53 (6.9%) |
| $30,000 to $34,999 | 10 (1.1%) | 28 (3.6%) |
| $35,000 to $39,999 | 22 (2.4%) | 38 (5.0%) |
| $40,000 to $44,999 | 74 (8.0%) | 10 (1.3%) |
| $45,000 to $49,999 | 51 (5.5%) | 27 (3.5%) |
| $50,000 to $54,999 | 25 (2.7%) | 19 (2.5%) |
| $55,000 to $64,999 | 37 (4.0%) | 157 (20.4%) |
| $65,000 to $74,999 | 32 (3.5%) | 50 (6.5%) |
| $75,000 to $99,999 | 127 (13.7%) | 69 (9.0%) |
| $100,000+ | 317 (34.3%) | 77 (10.0%) |
| Total | 925 (100.0%) | 768 (100.0%) |
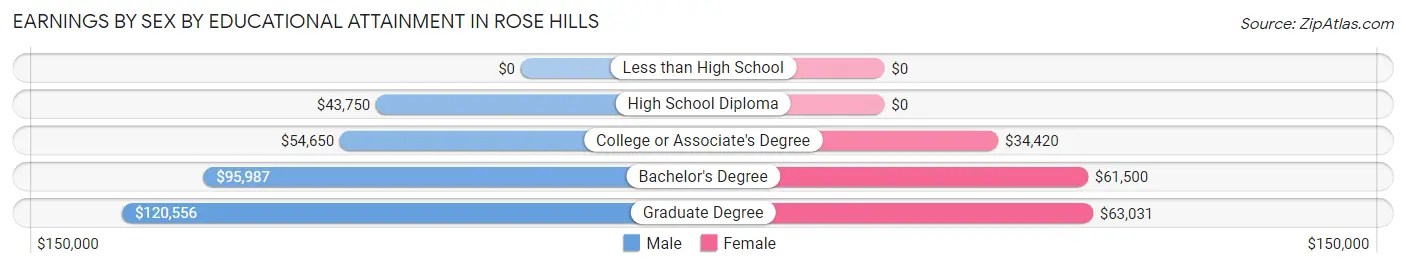
Earnings by Sex by Educational Attainment in Rose Hills
Average earnings in Rose Hills are $76,076 for men and $55,313 for women, a difference of 27.3%. Men with an educational attainment of graduate degree enjoy the highest average annual earnings of $120,556, while those with high school diploma education earn the least with $43,750. Women with an educational attainment of graduate degree earn the most with the average annual earnings of $63,031, while those with college or associate's degree education have the smallest earnings of $34,420.
| Educational Attainment | Male Income | Female Income |
| Less than High School | - | - |
| High School Diploma | $43,750 | $0 |
| College or Associate's Degree | $54,650 | $34,420 |
| Bachelor's Degree | $95,987 | $61,500 |
| Graduate Degree | $120,556 | $63,031 |
| Total | $76,076 | $55,313 |
Family Income in Rose Hills
Family Income Brackets in Rose Hills
According to the Rose Hills family income data, there are 214 families falling into the $150,000 to $199,999 income range, which is the most common income bracket and makes up 27.4% of all families.
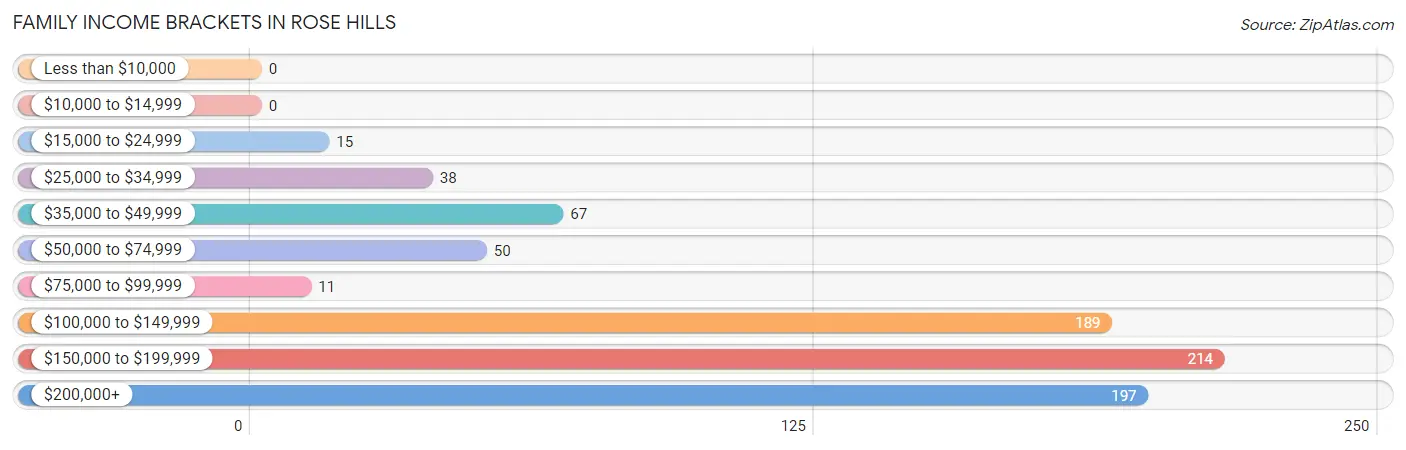
| Income Bracket | # Families | % Families |
| Less than $10,000 | 0 | 0.0% |
| $10,000 to $14,999 | 0 | 0.0% |
| $15,000 to $24,999 | 15 | 1.9% |
| $25,000 to $34,999 | 38 | 4.9% |
| $35,000 to $49,999 | 67 | 8.6% |
| $50,000 to $74,999 | 50 | 6.4% |
| $75,000 to $99,999 | 11 | 1.4% |
| $100,000 to $149,999 | 189 | 24.2% |
| $150,000 to $199,999 | 214 | 27.4% |
| $200,000+ | 197 | 25.2% |
Family Income by Famaliy Size in Rose Hills
4-person families (144 | 18.4%) account for the highest median family income in Rose Hills with $201,806 per family, while 2-person families (315 | 40.3%) have the highest median income of $54,700 per family member.
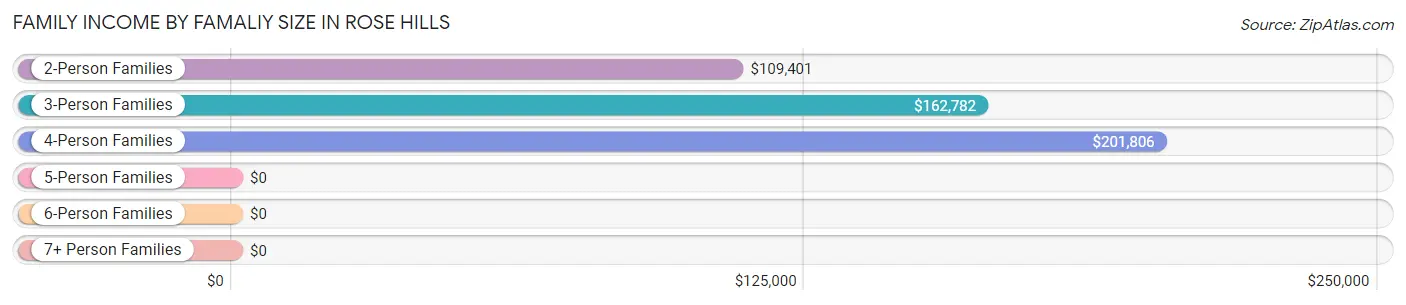
| Income Bracket | # Families | Median Income |
| 2-Person Families | 315 (40.3%) | $109,401 |
| 3-Person Families | 273 (35.0%) | $162,782 |
| 4-Person Families | 144 (18.4%) | $201,806 |
| 5-Person Families | 49 (6.3%) | $0 |
| 6-Person Families | 0 (0.0%) | $0 |
| 7+ Person Families | 0 (0.0%) | $0 |
| Total | 781 (100.0%) | $160,094 |
Family Income by Number of Earners in Rose Hills
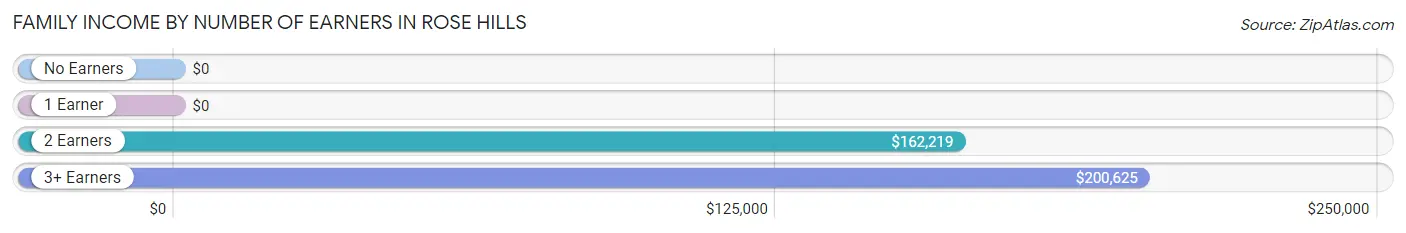
| Number of Earners | # Families | Median Income |
| No Earners | 119 (15.2%) | $0 |
| 1 Earner | 144 (18.4%) | $0 |
| 2 Earners | 375 (48.0%) | $162,219 |
| 3+ Earners | 143 (18.3%) | $200,625 |
| Total | 781 (100.0%) | $160,094 |
Household Income in Rose Hills
Household Income Brackets in Rose Hills
With 250 households falling in the category, the $150,000 to $199,999 income range is the most frequent in Rose Hills, accounting for 23.8% of all households.
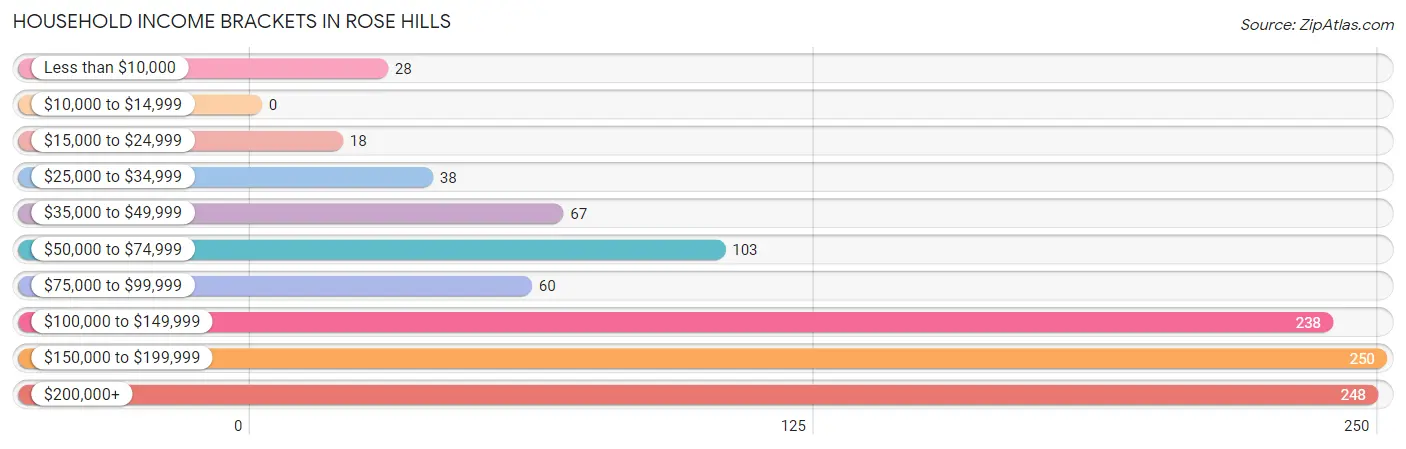
| Income Bracket | # Households | % Households |
| Less than $10,000 | 28 | 2.7% |
| $10,000 to $14,999 | 0 | 0.0% |
| $15,000 to $24,999 | 18 | 1.7% |
| $25,000 to $34,999 | 38 | 3.6% |
| $35,000 to $49,999 | 67 | 6.4% |
| $50,000 to $74,999 | 103 | 9.8% |
| $75,000 to $99,999 | 60 | 5.7% |
| $100,000 to $149,999 | 238 | 22.7% |
| $150,000 to $199,999 | 250 | 23.8% |
| $200,000+ | 248 | 23.6% |
Household Income by Householder Age in Rose Hills
The median household income in Rose Hills is $139,615, with the highest median household income of $162,344 found in the 45 to 64 years age bracket for the primary householder. A total of 497 households (47.3%) fall into this category.
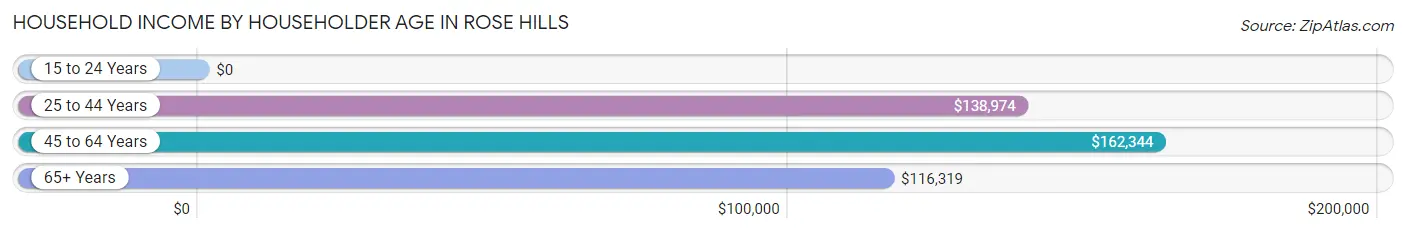
| Income Bracket | # Households | Median Income |
| 15 to 24 Years | 0 (0.0%) | $0 |
| 25 to 44 Years | 190 (18.1%) | $138,974 |
| 45 to 64 Years | 497 (47.3%) | $162,344 |
| 65+ Years | 363 (34.6%) | $116,319 |
| Total | 1,050 (100.0%) | $139,615 |
Poverty in Rose Hills
Income Below Poverty by Sex and Age in Rose Hills
With 2.3% poverty level for males and 5.2% for females among the residents of Rose Hills, 18 to 24 year old males and 18 to 24 year old females are the most vulnerable to poverty, with 8 males (10.8%) and 9 females (26.5%) in their respective age groups living below the poverty level.
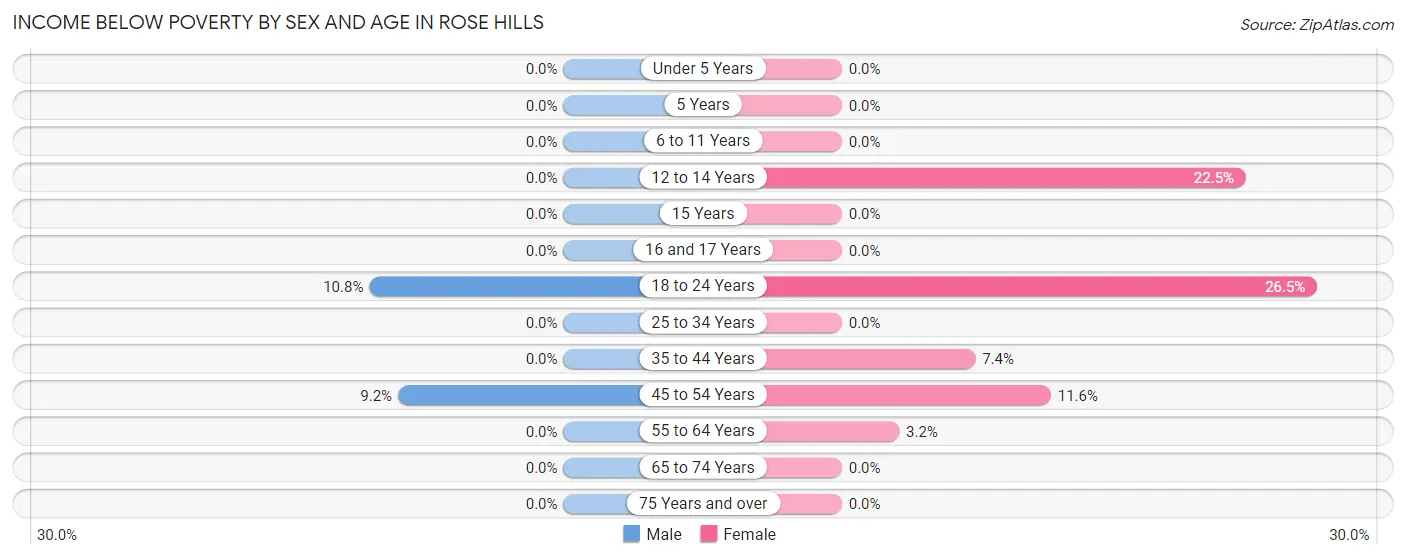
| Age Bracket | Male | Female |
| Under 5 Years | 0 (0.0%) | 0 (0.0%) |
| 5 Years | 0 (0.0%) | 0 (0.0%) |
| 6 to 11 Years | 0 (0.0%) | 0 (0.0%) |
| 12 to 14 Years | 0 (0.0%) | 9 (22.5%) |
| 15 Years | 0 (0.0%) | 0 (0.0%) |
| 16 and 17 Years | 0 (0.0%) | 0 (0.0%) |
| 18 to 24 Years | 8 (10.8%) | 9 (26.5%) |
| 25 to 34 Years | 0 (0.0%) | 0 (0.0%) |
| 35 to 44 Years | 0 (0.0%) | 13 (7.4%) |
| 45 to 54 Years | 22 (9.2%) | 34 (11.6%) |
| 55 to 64 Years | 0 (0.0%) | 8 (3.2%) |
| 65 to 74 Years | 0 (0.0%) | 0 (0.0%) |
| 75 Years and over | 0 (0.0%) | 0 (0.0%) |
| Total | 30 (2.3%) | 73 (5.2%) |
Income Above Poverty by Sex and Age in Rose Hills
According to the poverty statistics in Rose Hills, males aged under 5 years and females aged under 5 years are the age groups that are most secure financially, with 100.0% of males and 100.0% of females in these age groups living above the poverty line.
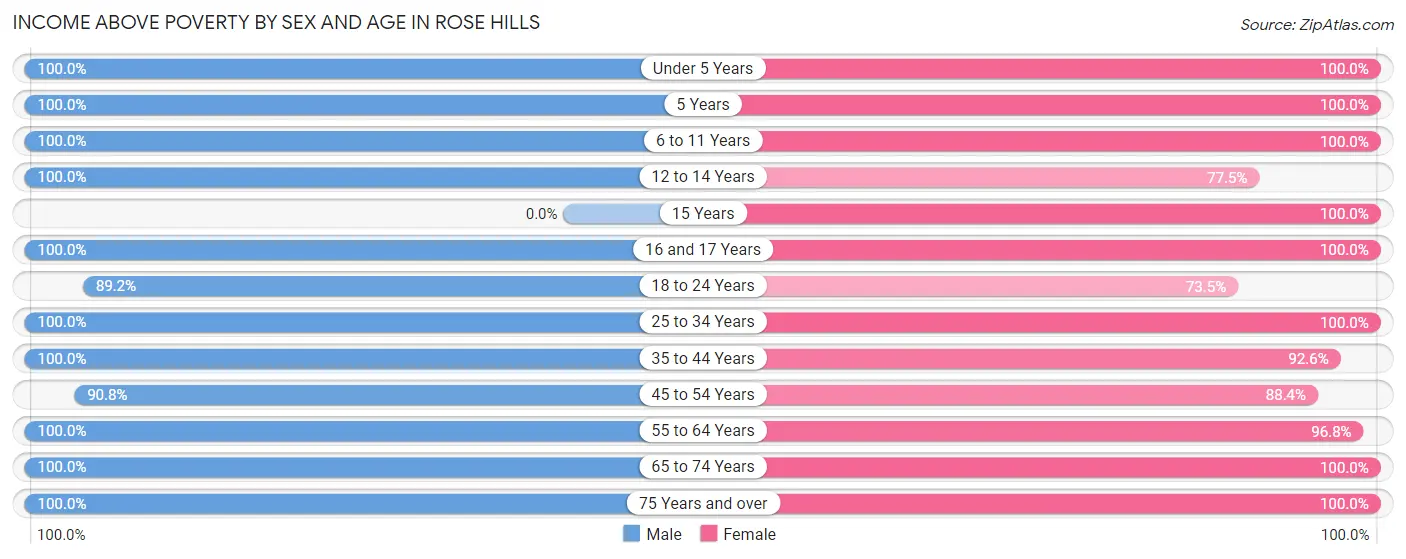
| Age Bracket | Male | Female |
| Under 5 Years | 30 (100.0%) | 36 (100.0%) |
| 5 Years | 11 (100.0%) | 14 (100.0%) |
| 6 to 11 Years | 41 (100.0%) | 122 (100.0%) |
| 12 to 14 Years | 23 (100.0%) | 31 (77.5%) |
| 15 Years | 0 (0.0%) | 6 (100.0%) |
| 16 and 17 Years | 6 (100.0%) | 40 (100.0%) |
| 18 to 24 Years | 66 (89.2%) | 25 (73.5%) |
| 25 to 34 Years | 175 (100.0%) | 64 (100.0%) |
| 35 to 44 Years | 175 (100.0%) | 162 (92.6%) |
| 45 to 54 Years | 217 (90.8%) | 258 (88.4%) |
| 55 to 64 Years | 210 (100.0%) | 243 (96.8%) |
| 65 to 74 Years | 247 (100.0%) | 210 (100.0%) |
| 75 Years and over | 89 (100.0%) | 114 (100.0%) |
| Total | 1,290 (97.7%) | 1,325 (94.8%) |
Income Below Poverty Among Married-Couple Families in Rose Hills
The poverty statistics for married-couple families in Rose Hills show that 1.4% or 9 of the total 663 families live below the poverty line. Families with 1 or 2 children have the highest poverty rate of 4.4%, comprising of 9 families. On the other hand, families with no children have the lowest poverty rate of 0.0%, which includes 0 families.
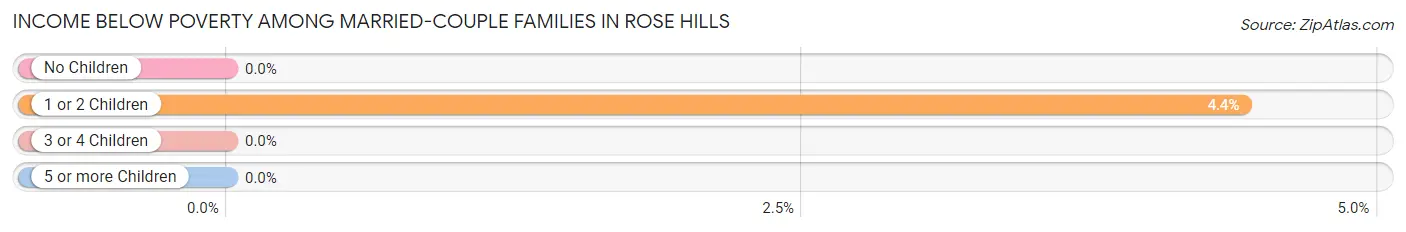
| Children | Above Poverty | Below Poverty |
| No Children | 459 (100.0%) | 0 (0.0%) |
| 1 or 2 Children | 195 (95.6%) | 9 (4.4%) |
| 3 or 4 Children | 0 (0.0%) | 0 (0.0%) |
| 5 or more Children | 0 (0.0%) | 0 (0.0%) |
| Total | 654 (98.6%) | 9 (1.4%) |
Income Below Poverty Among Single-Parent Households in Rose Hills
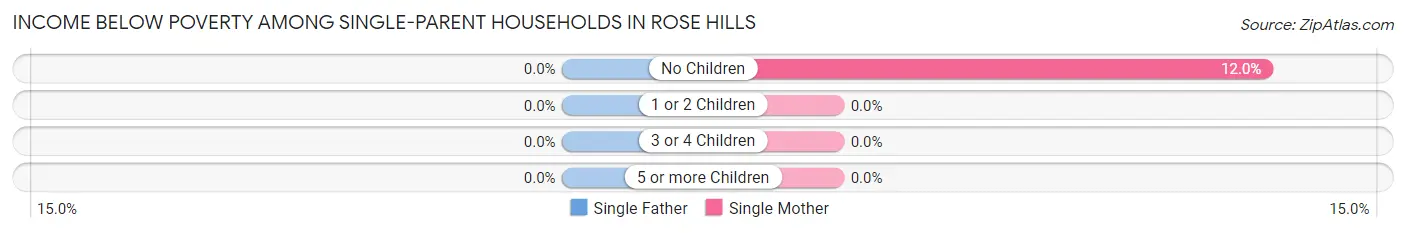
| Children | Single Father | Single Mother |
| No Children | 0 (0.0%) | 6 (12.0%) |
| 1 or 2 Children | 0 (0.0%) | 0 (0.0%) |
| 3 or 4 Children | 0 (0.0%) | 0 (0.0%) |
| 5 or more Children | 0 (0.0%) | 0 (0.0%) |
| Total | 0 (0.0%) | 6 (11.8%) |
Income Below Poverty Among Married-Couple vs Single-Parent Households in Rose Hills
The poverty data for Rose Hills shows that 9 of the married-couple family households (1.4%) and 6 of the single-parent households (5.1%) are living below the poverty level. Within the married-couple family households, those with 1 or 2 children have the highest poverty rate, with 9 households (4.4%) falling below the poverty line. Among the single-parent households, those with no children have the highest poverty rate, with 6 household (6.9%) living below poverty.
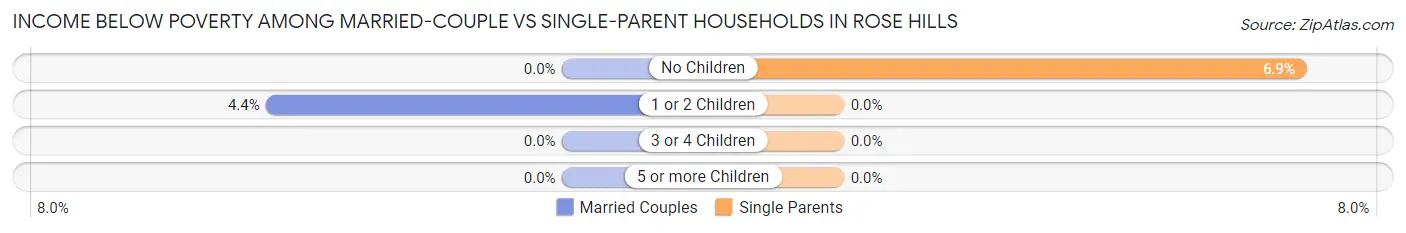
| Children | Married-Couple Families | Single-Parent Households |
| No Children | 0 (0.0%) | 6 (6.9%) |
| 1 or 2 Children | 9 (4.4%) | 0 (0.0%) |
| 3 or 4 Children | 0 (0.0%) | 0 (0.0%) |
| 5 or more Children | 0 (0.0%) | 0 (0.0%) |
| Total | 9 (1.4%) | 6 (5.1%) |
Race in Rose Hills
The most populous races in Rose Hills are Hispanic or Latino (1,521 | 56.0%), White / Caucasian (1,188 | 43.7%), and Two or more Races (569 | 20.9%).
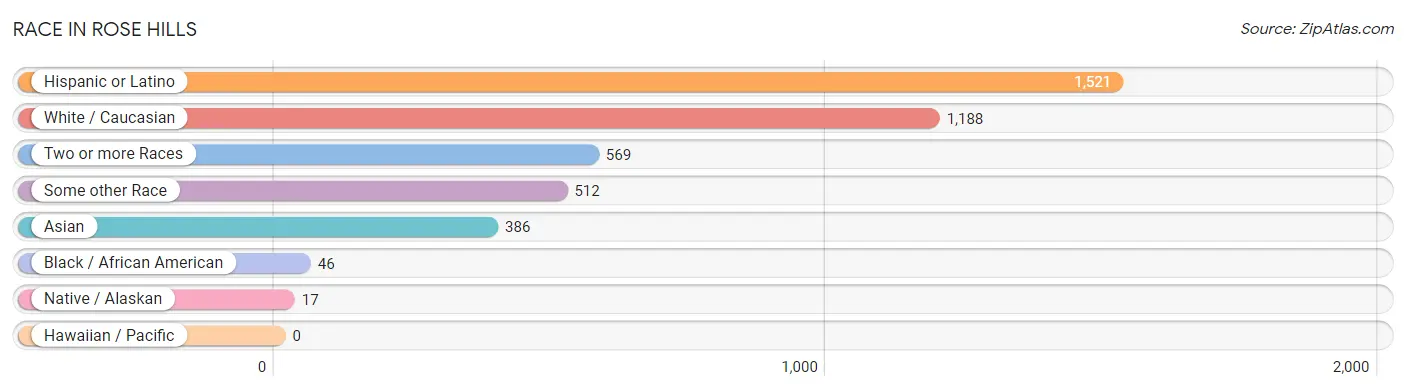
| Race | # Population | % Population |
| Asian | 386 | 14.2% |
| Black / African American | 46 | 1.7% |
| Hawaiian / Pacific | 0 | 0.0% |
| Hispanic or Latino | 1,521 | 56.0% |
| Native / Alaskan | 17 | 0.6% |
| White / Caucasian | 1,188 | 43.7% |
| Two or more Races | 569 | 20.9% |
| Some other Race | 512 | 18.8% |
| Total | 2,718 | 100.0% |
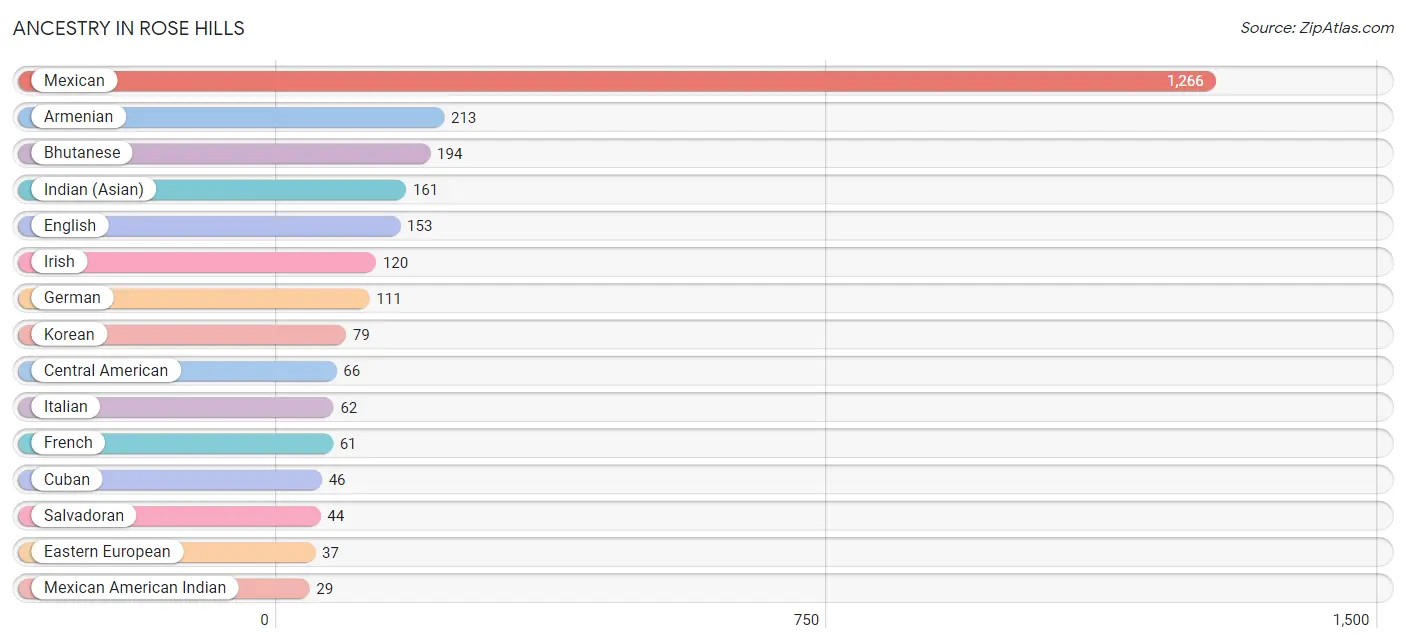
Ancestry in Rose Hills
The most populous ancestries reported in Rose Hills are Mexican (1,266 | 46.6%), Armenian (213 | 7.8%), Bhutanese (194 | 7.1%), Indian (Asian) (161 | 5.9%), and English (153 | 5.6%), together accounting for 73.1% of all Rose Hills residents.
| Ancestry | # Population | % Population |
| American | 27 | 1.0% |
| Apache | 12 | 0.4% |
| Armenian | 213 | 7.8% |
| Bhutanese | 194 | 7.1% |
| British | 6 | 0.2% |
| Central American | 66 | 2.4% |
| Central American Indian | 12 | 0.4% |
| Cuban | 46 | 1.7% |
| Eastern European | 37 | 1.4% |
| Ecuadorian | 11 | 0.4% |
| English | 153 | 5.6% |
| French | 61 | 2.2% |
| German | 111 | 4.1% |
| Guatemalan | 17 | 0.6% |
| Honduran | 5 | 0.2% |
| Indian (Asian) | 161 | 5.9% |
| Irish | 120 | 4.4% |
| Italian | 62 | 2.3% |
| Japanese | 14 | 0.5% |
| Korean | 79 | 2.9% |
| Mexican | 1,266 | 46.6% |
| Mexican American Indian | 29 | 1.1% |
| Norwegian | 12 | 0.4% |
| Peruvian | 6 | 0.2% |
| Polish | 8 | 0.3% |
| Portuguese | 10 | 0.4% |
| Puerto Rican | 20 | 0.7% |
| Salvadoran | 44 | 1.6% |
| South American | 17 | 0.6% |
| Spaniard | 26 | 1.0% |
| Spanish | 25 | 0.9% |
| Sri Lankan | 18 | 0.7% | View All 32 Rows |
Immigrants in Rose Hills
The most numerous immigrant groups reported in Rose Hills came from Latin America (229 | 8.4%), Central America (212 | 7.8%), Mexico (172 | 6.3%), Asia (44 | 1.6%), and El Salvador (26 | 1.0%), together accounting for 25.1% of all Rose Hills residents.
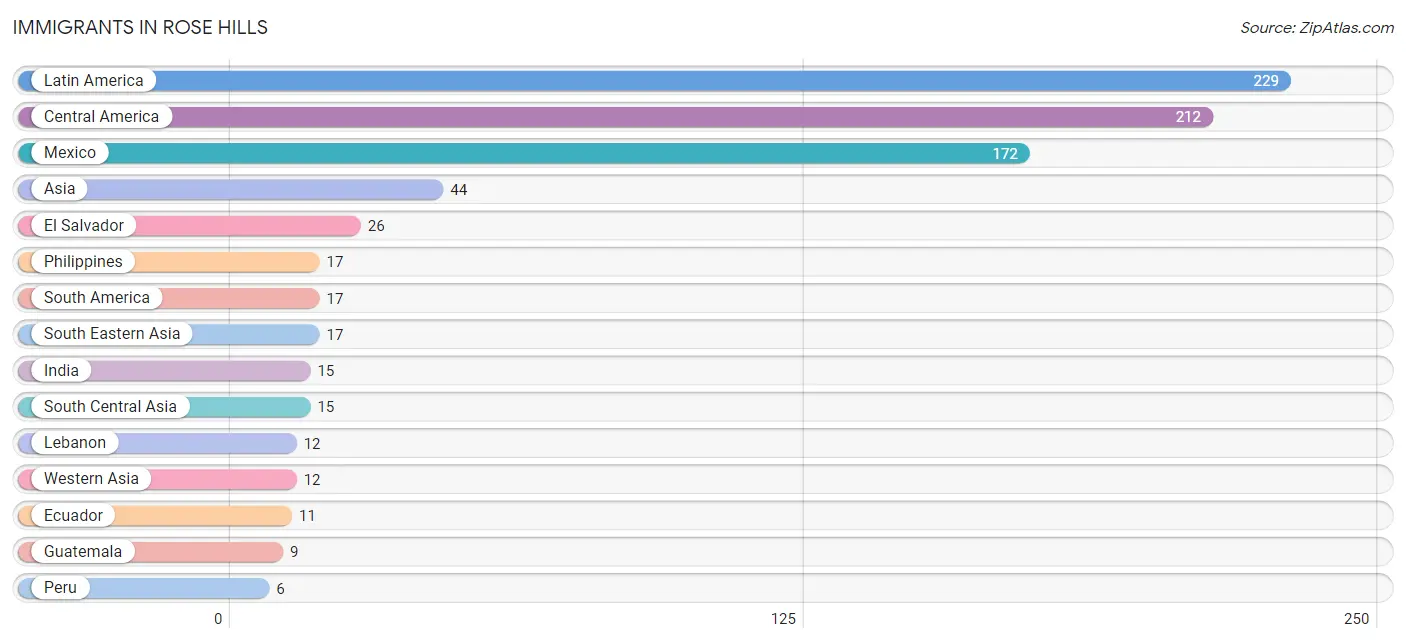
| Immigration Origin | # Population | % Population |
| Asia | 44 | 1.6% |
| Central America | 212 | 7.8% |
| Ecuador | 11 | 0.4% |
| El Salvador | 26 | 1.0% |
| Guatemala | 9 | 0.3% |
| Honduras | 5 | 0.2% |
| India | 15 | 0.5% |
| Latin America | 229 | 8.4% |
| Lebanon | 12 | 0.4% |
| Mexico | 172 | 6.3% |
| Peru | 6 | 0.2% |
| Philippines | 17 | 0.6% |
| South America | 17 | 0.6% |
| South Central Asia | 15 | 0.5% |
| South Eastern Asia | 17 | 0.6% |
| Western Asia | 12 | 0.4% | View All 16 Rows |
Sex and Age in Rose Hills
Sex and Age in Rose Hills
The most populous age groups in Rose Hills are 50 to 54 Years (168 | 12.7%) for men and 60 to 64 Years (181 | 13.0%) for women.
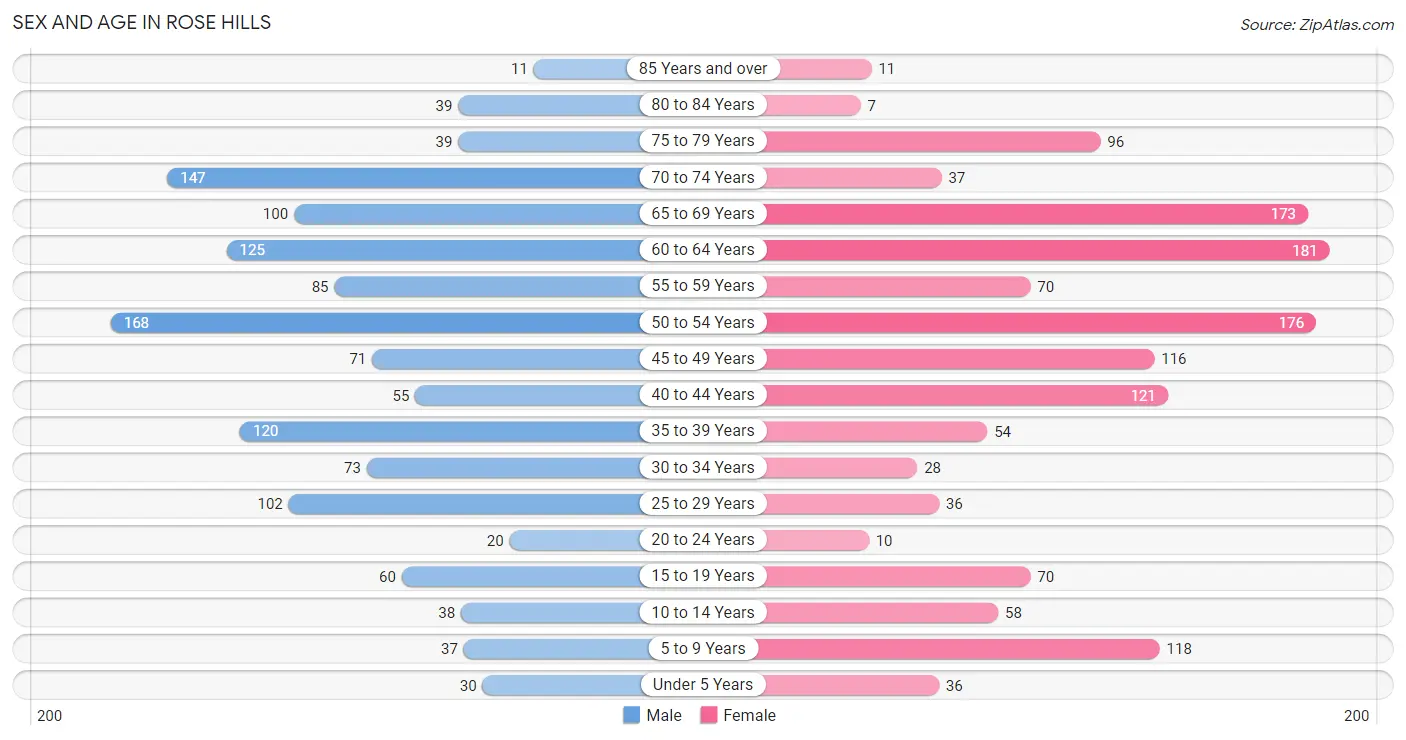
| Age Bracket | Male | Female |
| Under 5 Years | 30 (2.3%) | 36 (2.6%) |
| 5 to 9 Years | 37 (2.8%) | 118 (8.4%) |
| 10 to 14 Years | 38 (2.9%) | 58 (4.2%) |
| 15 to 19 Years | 60 (4.5%) | 70 (5.0%) |
| 20 to 24 Years | 20 (1.5%) | 10 (0.7%) |
| 25 to 29 Years | 102 (7.7%) | 36 (2.6%) |
| 30 to 34 Years | 73 (5.5%) | 28 (2.0%) |
| 35 to 39 Years | 120 (9.1%) | 54 (3.9%) |
| 40 to 44 Years | 55 (4.2%) | 121 (8.7%) |
| 45 to 49 Years | 71 (5.4%) | 116 (8.3%) |
| 50 to 54 Years | 168 (12.7%) | 176 (12.6%) |
| 55 to 59 Years | 85 (6.4%) | 70 (5.0%) |
| 60 to 64 Years | 125 (9.5%) | 181 (13.0%) |
| 65 to 69 Years | 100 (7.6%) | 173 (12.4%) |
| 70 to 74 Years | 147 (11.1%) | 37 (2.6%) |
| 75 to 79 Years | 39 (2.9%) | 96 (6.9%) |
| 80 to 84 Years | 39 (2.9%) | 7 (0.5%) |
| 85 Years and over | 11 (0.8%) | 11 (0.8%) |
| Total | 1,320 (100.0%) | 1,398 (100.0%) |
Families and Households in Rose Hills
Median Family Size in Rose Hills
The median family size in Rose Hills is 3.00 persons per family, with married-couple families (663 | 84.9%) accounting for the largest median family size of 3.06 persons per family. On the other hand, single female/mother families (51 | 6.5%) represent the smallest median family size with 2.29 persons per family.
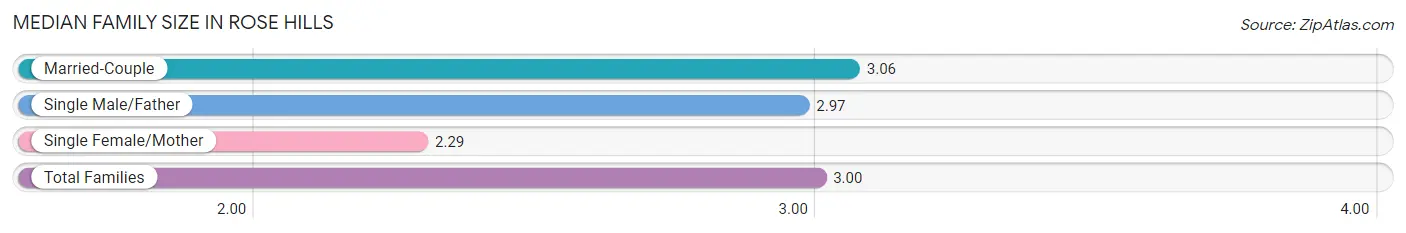
| Family Type | # Families | Family Size |
| Married-Couple | 663 (84.9%) | 3.06 |
| Single Male/Father | 67 (8.6%) | 2.97 |
| Single Female/Mother | 51 (6.5%) | 2.29 |
| Total Families | 781 (100.0%) | 3.00 |
Median Household Size in Rose Hills
The median household size in Rose Hills is 2.59 persons per household, with single male/father households (67 | 6.4%) accounting for the largest median household size of 3.16 persons per household. non-family households (269 | 25.6%) represent the smallest median household size with 1.21 persons per household.
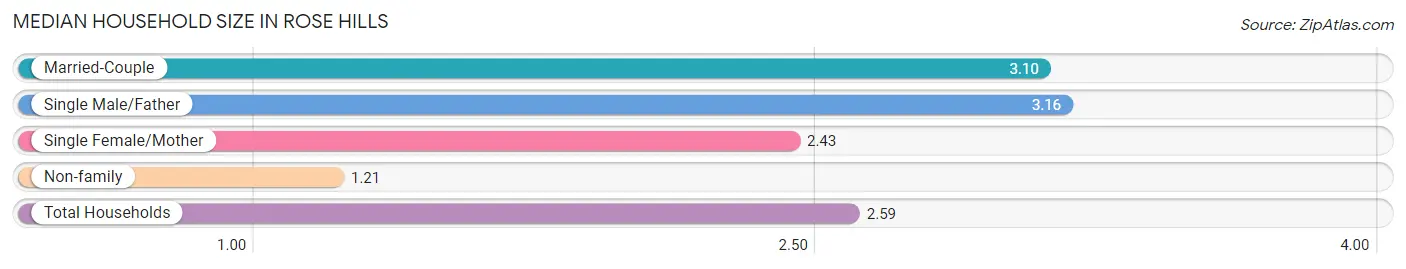
| Household Type | # Households | Household Size |
| Married-Couple | 663 (63.1%) | 3.10 |
| Single Male/Father | 67 (6.4%) | 3.16 |
| Single Female/Mother | 51 (4.9%) | 2.43 |
| Non-family | 269 (25.6%) | 1.21 |
| Total Households | 1,050 (100.0%) | 2.59 |
Household Size by Marriage Status in Rose Hills
Out of a total of 1,050 households in Rose Hills, 781 (74.4%) are family households, while 269 (25.6%) are nonfamily households. The most numerous type of family households are 2-person households, comprising 309, and the most common type of nonfamily households are 1-person households, comprising 214.
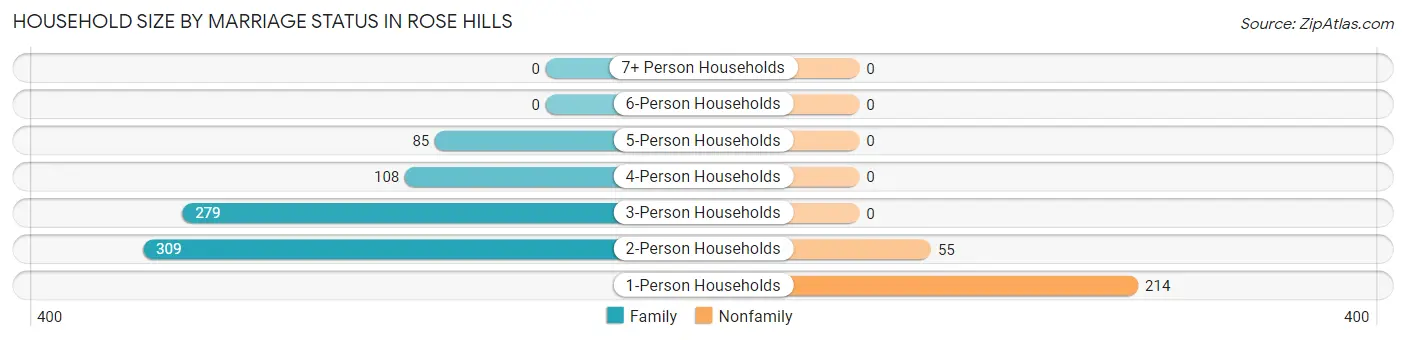
| Household Size | Family Households | Nonfamily Households |
| 1-Person Households | - | 214 (20.4%) |
| 2-Person Households | 309 (29.4%) | 55 (5.2%) |
| 3-Person Households | 279 (26.6%) | 0 (0.0%) |
| 4-Person Households | 108 (10.3%) | 0 (0.0%) |
| 5-Person Households | 85 (8.1%) | 0 (0.0%) |
| 6-Person Households | 0 (0.0%) | 0 (0.0%) |
| 7+ Person Households | 0 (0.0%) | 0 (0.0%) |
| Total | 781 (74.4%) | 269 (25.6%) |
Female Fertility in Rose Hills
Fertility by Age in Rose Hills
Average fertility rate in Rose Hills is 9.0 births per 1,000 women. Women in the age bracket of 35 to 50 years have the highest fertility rate with 13.0 births per 1,000 women. Women in the age bracket of 35 to 50 years acount for 100.0% of all women with births.
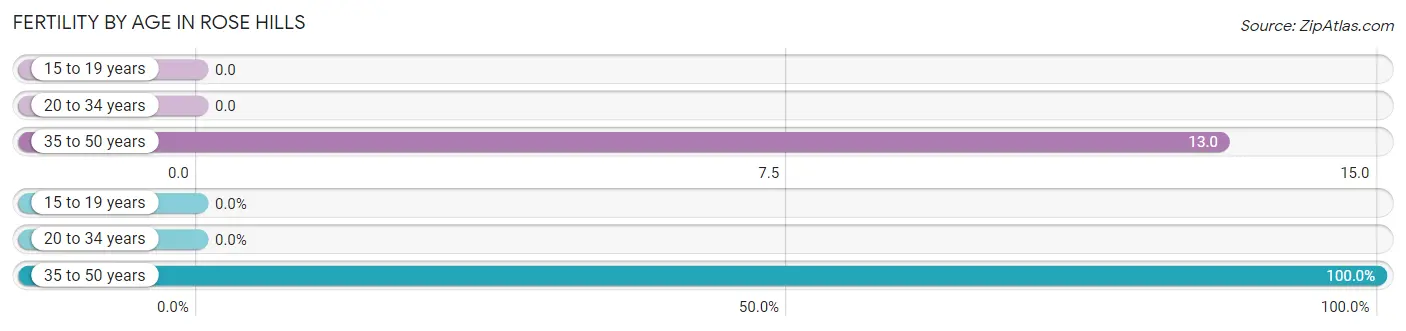
| Age Bracket | Women with Births | Births / 1,000 Women |
| 15 to 19 years | 0 (0.0%) | 0.0 |
| 20 to 34 years | 0 (0.0%) | 0.0 |
| 35 to 50 years | 4 (100.0%) | 13.0 |
| Total | 4 (100.0%) | 9.0 |
Fertility by Age by Marriage Status in Rose Hills
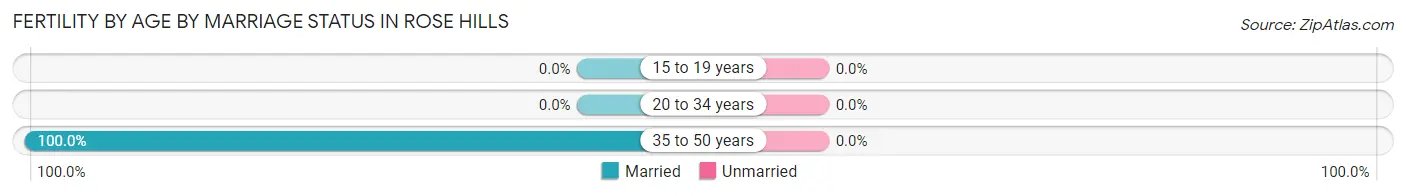
| Age Bracket | Married | Unmarried |
| 15 to 19 years | 0 (0.0%) | 0 (0.0%) |
| 20 to 34 years | 0 (0.0%) | 0 (0.0%) |
| 35 to 50 years | 4 (100.0%) | 0 (0.0%) |
| Total | 4 (100.0%) | 0 (0.0%) |
Fertility by Education in Rose Hills
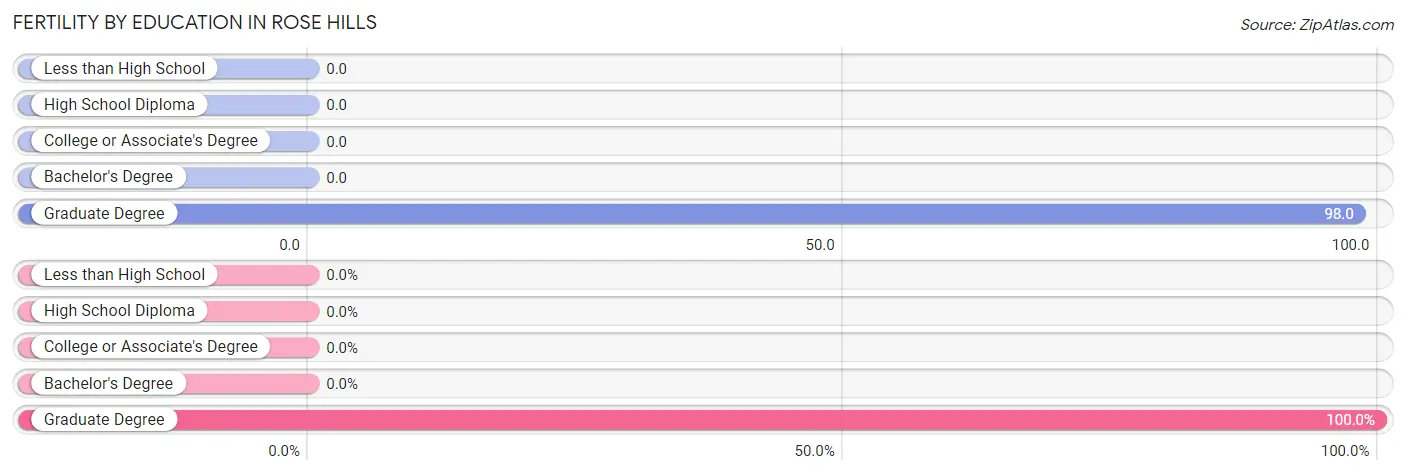
| Educational Attainment | Women with Births | Births / 1,000 Women |
| Less than High School | 0 (0.0%) | 0.0 |
| High School Diploma | 0 (0.0%) | 0.0 |
| College or Associate's Degree | 0 (0.0%) | 0.0 |
| Bachelor's Degree | 0 (0.0%) | 0.0 |
| Graduate Degree | 4 (100.0%) | 98.0 |
| Total | 4 (100.0%) | 9.0 |
Fertility by Education by Marriage Status in Rose Hills
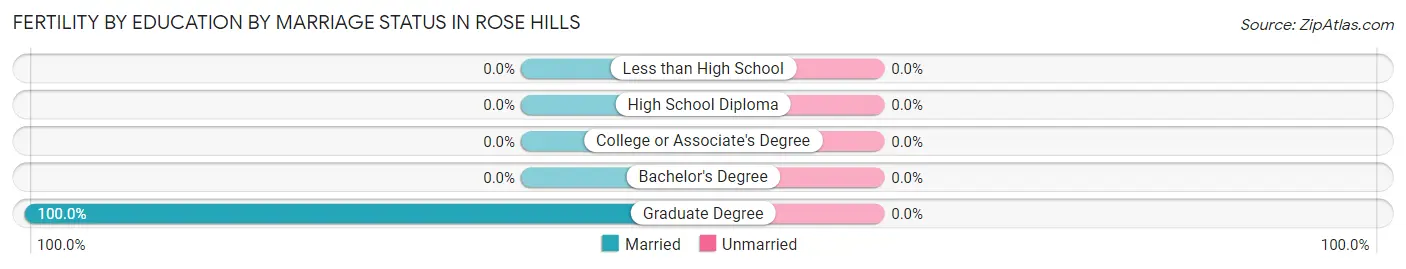
| Educational Attainment | Married | Unmarried |
| Less than High School | 0 (0.0%) | 0 (0.0%) |
| High School Diploma | 0 (0.0%) | 0 (0.0%) |
| College or Associate's Degree | 0 (0.0%) | 0 (0.0%) |
| Bachelor's Degree | 0 (0.0%) | 0 (0.0%) |
| Graduate Degree | 4 (100.0%) | 0 (0.0%) |
| Total | 4 (100.0%) | 0 (0.0%) |
Employment Characteristics in Rose Hills
Employment by Class of Employer in Rose Hills
Among the 1,497 employed individuals in Rose Hills, private company employees (830 | 55.4%), local government employees (251 | 16.8%), and self-employed (not incorporated) (149 | 10.0%) make up the most common classes of employment.
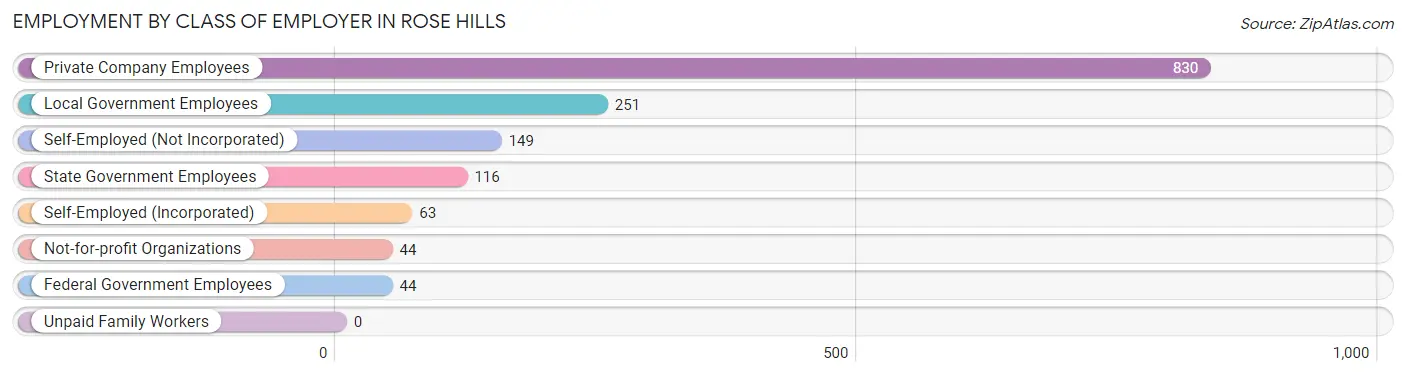
| Employer Class | # Employees | % Employees |
| Private Company Employees | 830 | 55.4% |
| Self-Employed (Incorporated) | 63 | 4.2% |
| Self-Employed (Not Incorporated) | 149 | 10.0% |
| Not-for-profit Organizations | 44 | 2.9% |
| Local Government Employees | 251 | 16.8% |
| State Government Employees | 116 | 7.7% |
| Federal Government Employees | 44 | 2.9% |
| Unpaid Family Workers | 0 | 0.0% |
| Total | 1,497 | 100.0% |
Employment Status by Age in Rose Hills
According to the labor force statistics for Rose Hills, out of the total population over 16 years of age (2,395), 65.2% or 1,562 individuals are in the labor force, with 2.4% or 37 of them unemployed. The age group with the highest labor force participation rate is 55 to 59 years, with 94.8% or 147 individuals in the labor force. Within the labor force, the 65 to 74 years age range has the highest percentage of unemployed individuals, with 21.8% or 37 of them being unemployed.
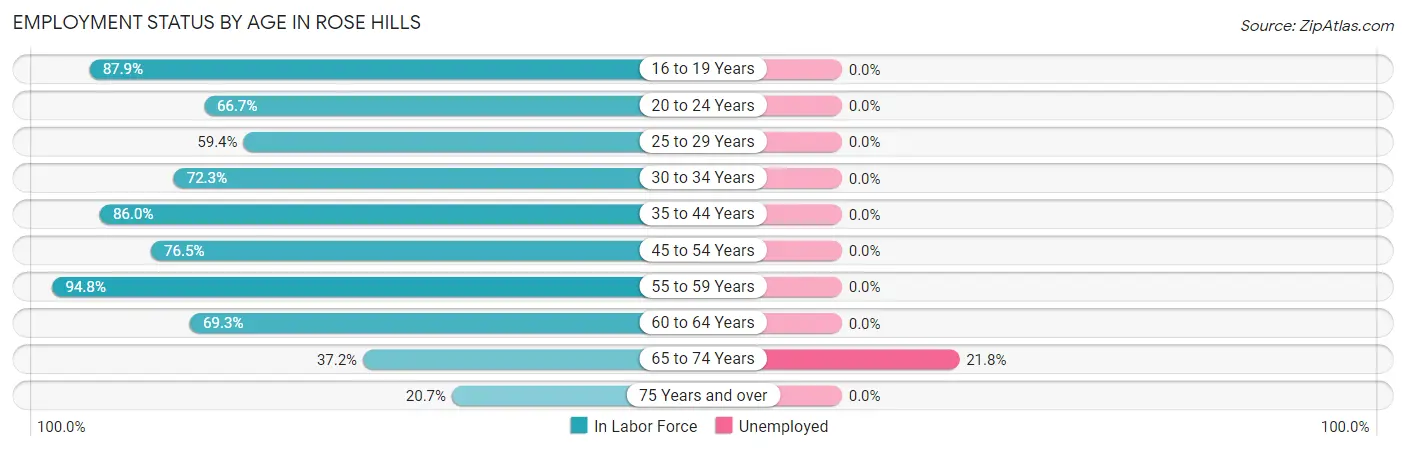
| Age Bracket | In Labor Force | Unemployed |
| 16 to 19 Years | 109 (87.9%) | 0 (0.0%) |
| 20 to 24 Years | 20 (66.7%) | 0 (0.0%) |
| 25 to 29 Years | 82 (59.4%) | 0 (0.0%) |
| 30 to 34 Years | 73 (72.3%) | 0 (0.0%) |
| 35 to 44 Years | 301 (86.0%) | 0 (0.0%) |
| 45 to 54 Years | 406 (76.5%) | 0 (0.0%) |
| 55 to 59 Years | 147 (94.8%) | 0 (0.0%) |
| 60 to 64 Years | 212 (69.3%) | 0 (0.0%) |
| 65 to 74 Years | 170 (37.2%) | 37 (21.8%) |
| 75 Years and over | 42 (20.7%) | 0 (0.0%) |
| Total | 1,562 (65.2%) | 37 (2.4%) |
Employment Status by Educational Attainment in Rose Hills
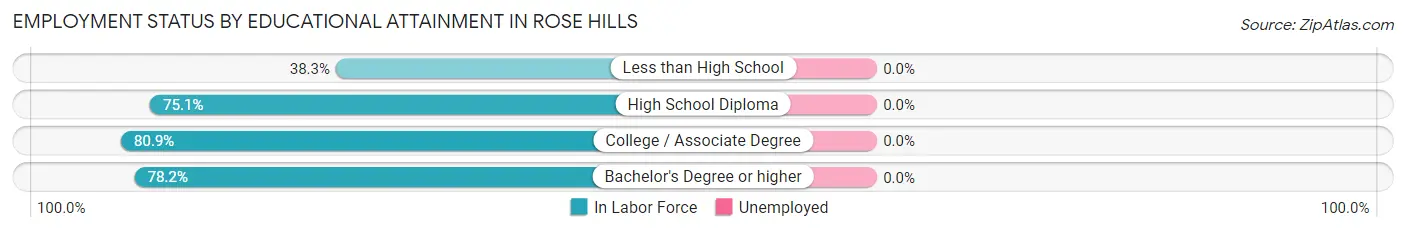
| Educational Attainment | In Labor Force | Unemployed |
| Less than High School | 18 (38.3%) | 0 (0.0%) |
| High School Diploma | 257 (75.1%) | 0 (0.0%) |
| College / Associate Degree | 403 (80.9%) | 0 (0.0%) |
| Bachelor's Degree or higher | 543 (78.2%) | 0 (0.0%) |
| Total | 1,221 (77.2%) | 0 (0.0%) |
Employment Occupations by Sex in Rose Hills
Management, Business, Science and Arts Occupations
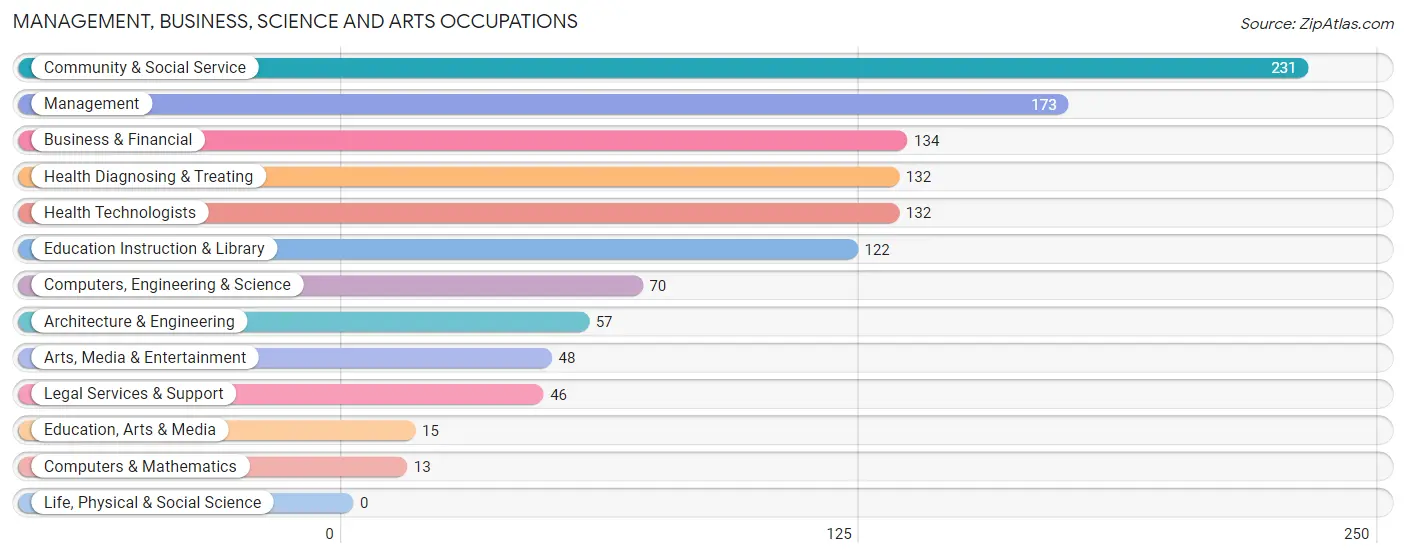
The most common Management, Business, Science and Arts occupations in Rose Hills are Community & Social Service (231 | 15.1%), Management (173 | 11.3%), Business & Financial (134 | 8.8%), Health Diagnosing & Treating (132 | 8.7%), and Health Technologists (132 | 8.7%).
Management, Business, Science and Arts Occupations by Sex
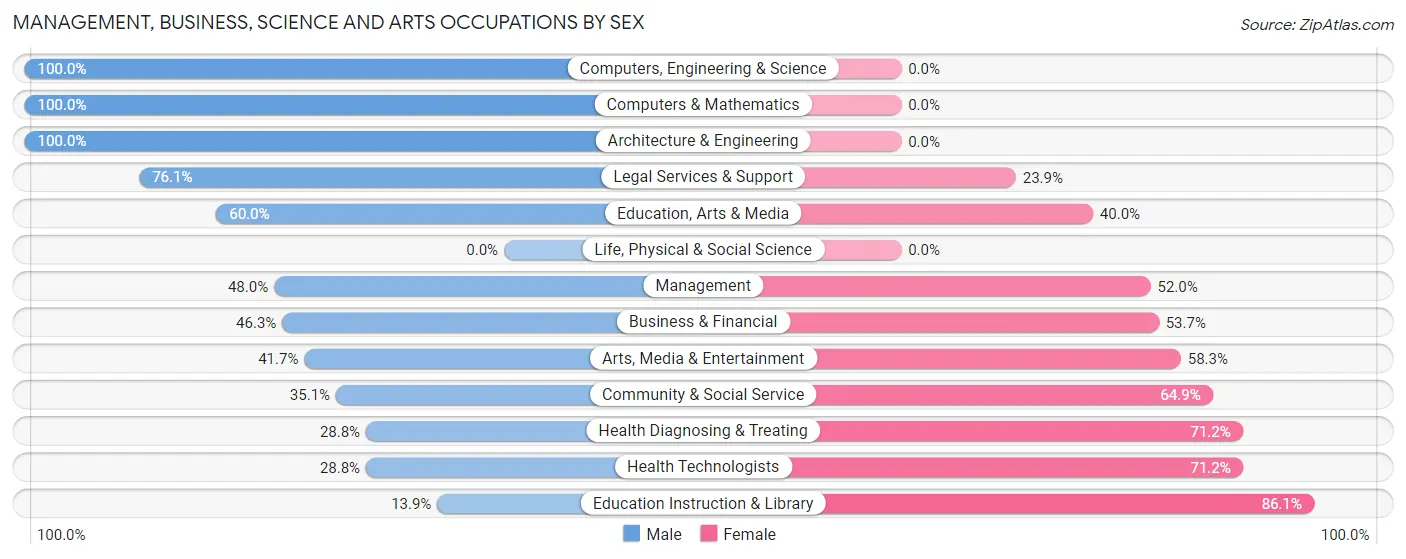
Within the Management, Business, Science and Arts occupations in Rose Hills, the most male-oriented occupations are Computers, Engineering & Science (100.0%), Computers & Mathematics (100.0%), and Architecture & Engineering (100.0%), while the most female-oriented occupations are Education Instruction & Library (86.1%), Health Diagnosing & Treating (71.2%), and Health Technologists (71.2%).
| Occupation | Male | Female |
| Management | 83 (48.0%) | 90 (52.0%) |
| Business & Financial | 62 (46.3%) | 72 (53.7%) |
| Computers, Engineering & Science | 70 (100.0%) | 0 (0.0%) |
| Computers & Mathematics | 13 (100.0%) | 0 (0.0%) |
| Architecture & Engineering | 57 (100.0%) | 0 (0.0%) |
| Life, Physical & Social Science | 0 (0.0%) | 0 (0.0%) |
| Community & Social Service | 81 (35.1%) | 150 (64.9%) |
| Education, Arts & Media | 9 (60.0%) | 6 (40.0%) |
| Legal Services & Support | 35 (76.1%) | 11 (23.9%) |
| Education Instruction & Library | 17 (13.9%) | 105 (86.1%) |
| Arts, Media & Entertainment | 20 (41.7%) | 28 (58.3%) |
| Health Diagnosing & Treating | 38 (28.8%) | 94 (71.2%) |
| Health Technologists | 38 (28.8%) | 94 (71.2%) |
| Total (Category) | 334 (45.1%) | 406 (54.9%) |
| Total (Overall) | 786 (51.5%) | 739 (48.5%) |
Services Occupations
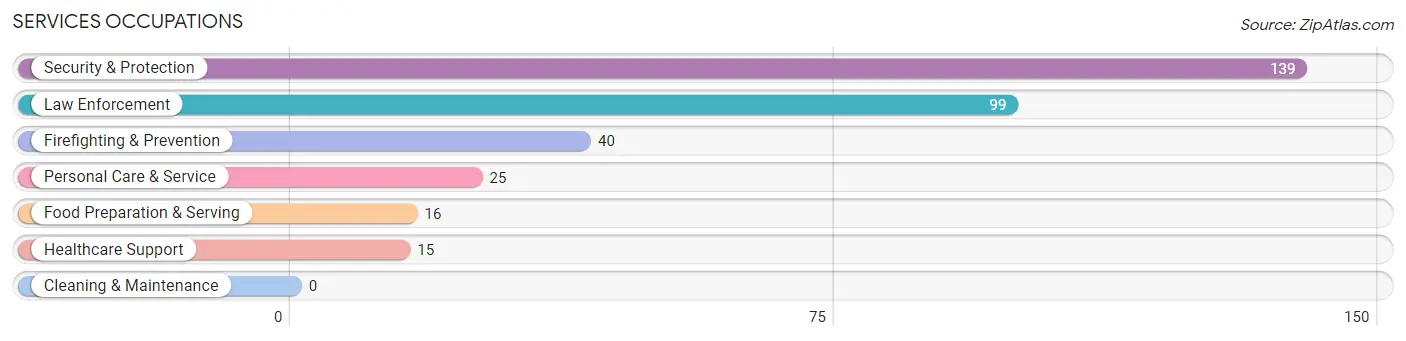
The most common Services occupations in Rose Hills are Security & Protection (139 | 9.1%), Law Enforcement (99 | 6.5%), Firefighting & Prevention (40 | 2.6%), Personal Care & Service (25 | 1.6%), and Food Preparation & Serving (16 | 1.1%).
Services Occupations by Sex
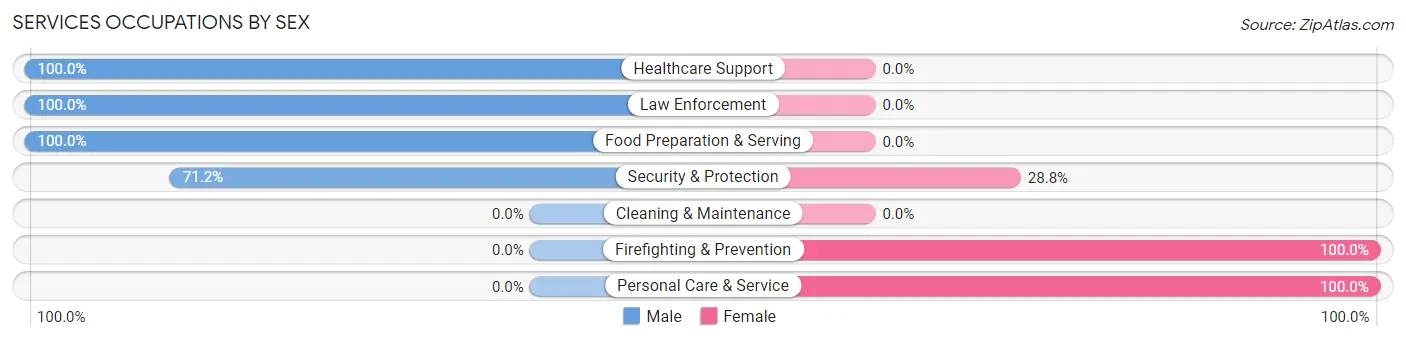
Within the Services occupations in Rose Hills, the most male-oriented occupations are Healthcare Support (100.0%), Law Enforcement (100.0%), and Food Preparation & Serving (100.0%), while the most female-oriented occupations are Firefighting & Prevention (100.0%), Personal Care & Service (100.0%), and Security & Protection (28.8%).
| Occupation | Male | Female |
| Healthcare Support | 15 (100.0%) | 0 (0.0%) |
| Security & Protection | 99 (71.2%) | 40 (28.8%) |
| Firefighting & Prevention | 0 (0.0%) | 40 (100.0%) |
| Law Enforcement | 99 (100.0%) | 0 (0.0%) |
| Food Preparation & Serving | 16 (100.0%) | 0 (0.0%) |
| Cleaning & Maintenance | 0 (0.0%) | 0 (0.0%) |
| Personal Care & Service | 0 (0.0%) | 25 (100.0%) |
| Total (Category) | 130 (66.7%) | 65 (33.3%) |
| Total (Overall) | 786 (51.5%) | 739 (48.5%) |
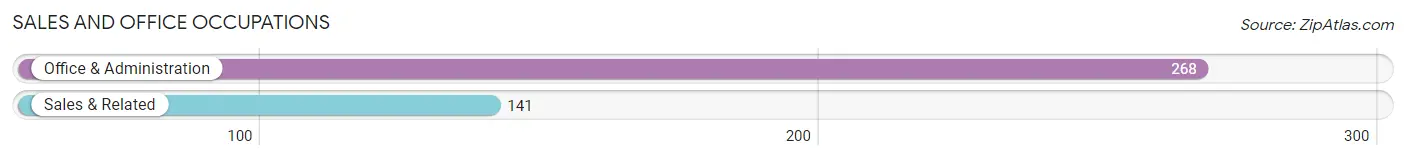
Sales and Office Occupations
The most common Sales and Office occupations in Rose Hills are Office & Administration (268 | 17.6%), and Sales & Related (141 | 9.2%).
Sales and Office Occupations by Sex
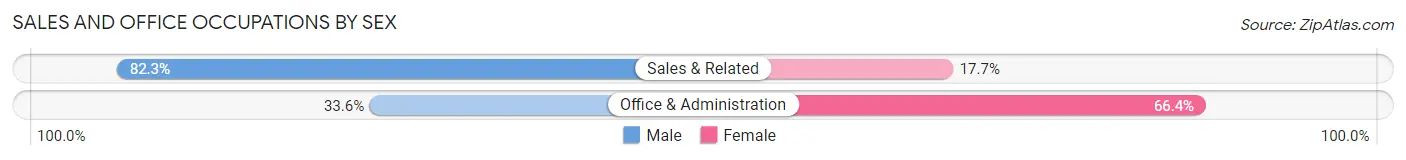
| Occupation | Male | Female |
| Sales & Related | 116 (82.3%) | 25 (17.7%) |
| Office & Administration | 90 (33.6%) | 178 (66.4%) |
| Total (Category) | 206 (50.4%) | 203 (49.6%) |
| Total (Overall) | 786 (51.5%) | 739 (48.5%) |
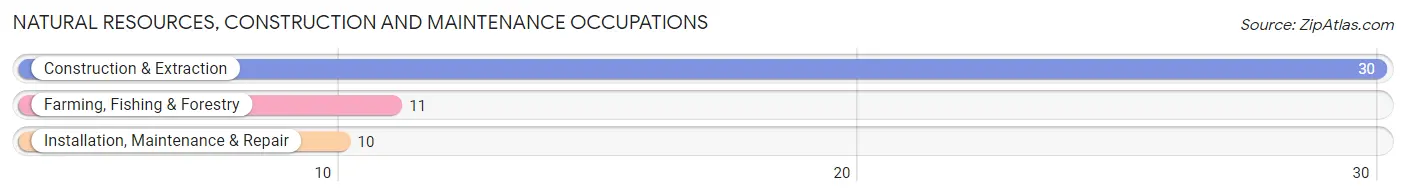
Natural Resources, Construction and Maintenance Occupations
The most common Natural Resources, Construction and Maintenance occupations in Rose Hills are Construction & Extraction (30 | 2.0%), Farming, Fishing & Forestry (11 | 0.7%), and Installation, Maintenance & Repair (10 | 0.7%).
Natural Resources, Construction and Maintenance Occupations by Sex
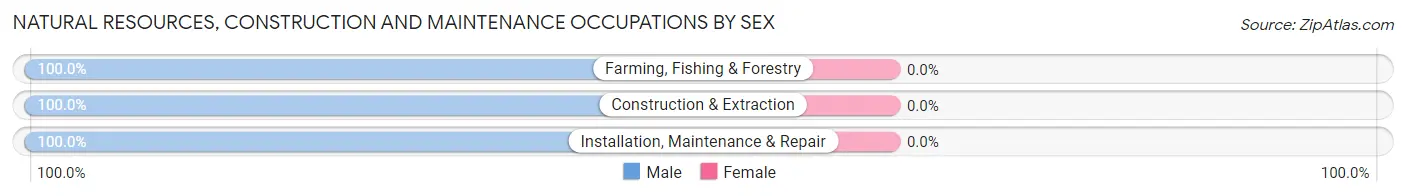
| Occupation | Male | Female |
| Farming, Fishing & Forestry | 11 (100.0%) | 0 (0.0%) |
| Construction & Extraction | 30 (100.0%) | 0 (0.0%) |
| Installation, Maintenance & Repair | 10 (100.0%) | 0 (0.0%) |
| Total (Category) | 51 (100.0%) | 0 (0.0%) |
| Total (Overall) | 786 (51.5%) | 739 (48.5%) |
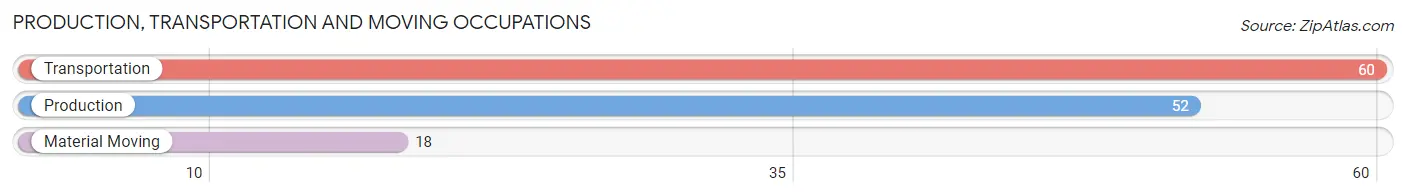
Production, Transportation and Moving Occupations
The most common Production, Transportation and Moving occupations in Rose Hills are Transportation (60 | 3.9%), Production (52 | 3.4%), and Material Moving (18 | 1.2%).
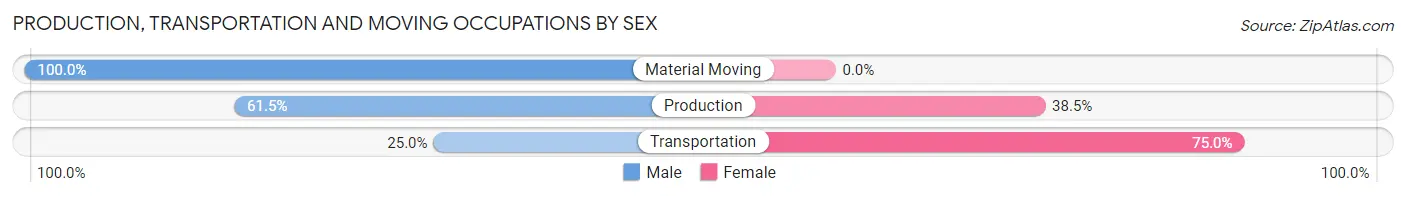
Production, Transportation and Moving Occupations by Sex
| Occupation | Male | Female |
| Production | 32 (61.5%) | 20 (38.5%) |
| Transportation | 15 (25.0%) | 45 (75.0%) |
| Material Moving | 18 (100.0%) | 0 (0.0%) |
| Total (Category) | 65 (50.0%) | 65 (50.0%) |
| Total (Overall) | 786 (51.5%) | 739 (48.5%) |
Employment Industries by Sex in Rose Hills
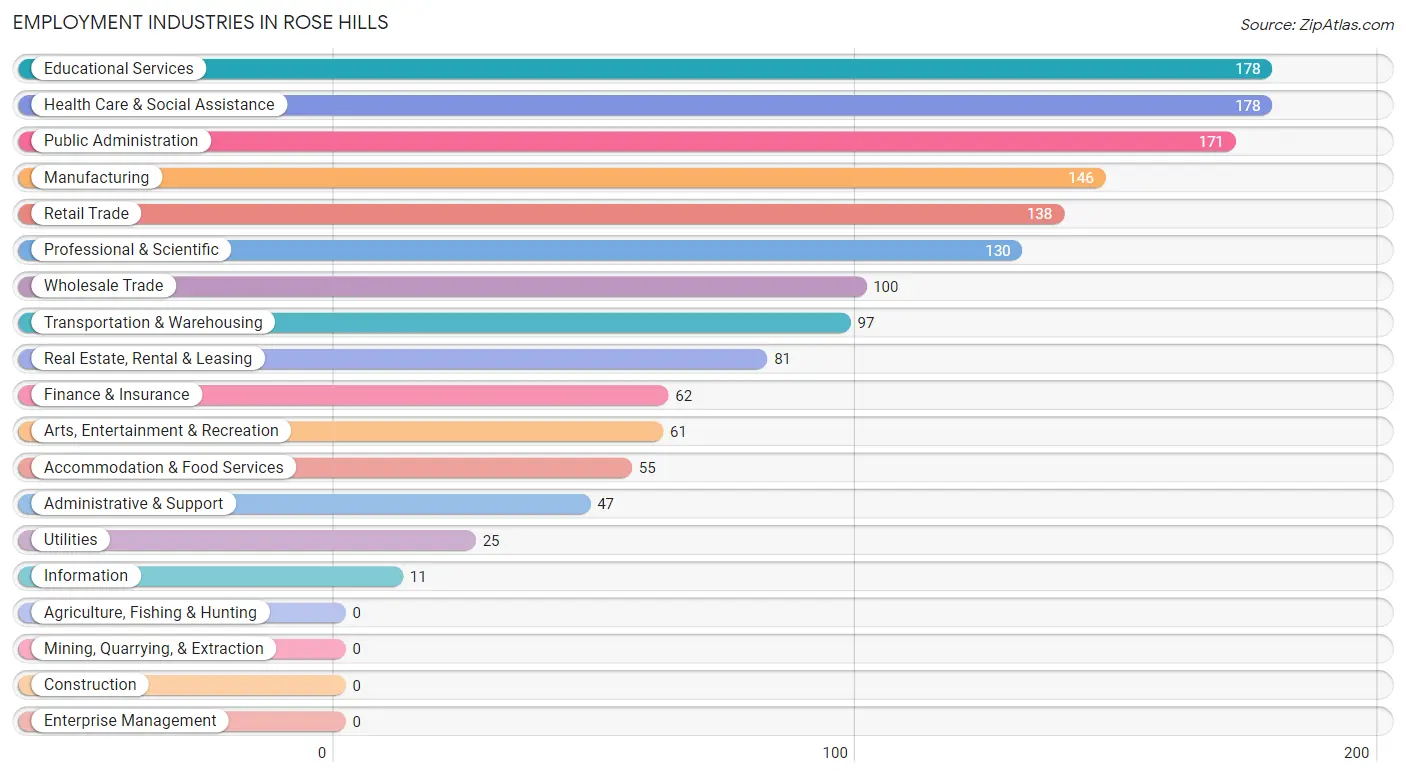
Employment Industries in Rose Hills
The major employment industries in Rose Hills include Educational Services (178 | 11.7%), Health Care & Social Assistance (178 | 11.7%), Public Administration (171 | 11.2%), Manufacturing (146 | 9.6%), and Retail Trade (138 | 9.0%).
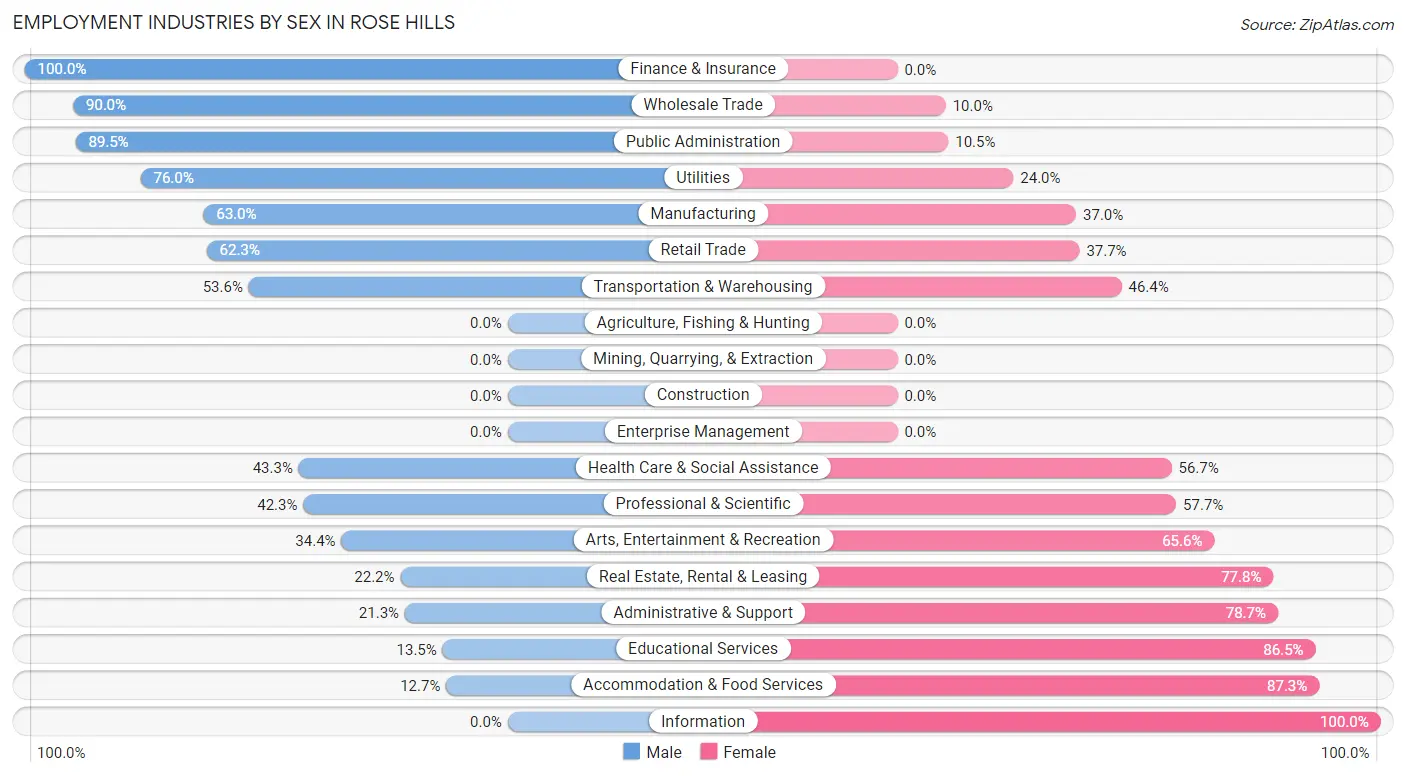
Employment Industries by Sex in Rose Hills
The Rose Hills industries that see more men than women are Finance & Insurance (100.0%), Wholesale Trade (90.0%), and Public Administration (89.5%), whereas the industries that tend to have a higher number of women are Information (100.0%), Accommodation & Food Services (87.3%), and Educational Services (86.5%).
| Industry | Male | Female |
| Agriculture, Fishing & Hunting | 0 (0.0%) | 0 (0.0%) |
| Mining, Quarrying, & Extraction | 0 (0.0%) | 0 (0.0%) |
| Construction | 0 (0.0%) | 0 (0.0%) |
| Manufacturing | 92 (63.0%) | 54 (37.0%) |
| Wholesale Trade | 90 (90.0%) | 10 (10.0%) |
| Retail Trade | 86 (62.3%) | 52 (37.7%) |
| Transportation & Warehousing | 52 (53.6%) | 45 (46.4%) |
| Utilities | 19 (76.0%) | 6 (24.0%) |
| Information | 0 (0.0%) | 11 (100.0%) |
| Finance & Insurance | 62 (100.0%) | 0 (0.0%) |
| Real Estate, Rental & Leasing | 18 (22.2%) | 63 (77.8%) |
| Professional & Scientific | 55 (42.3%) | 75 (57.7%) |
| Enterprise Management | 0 (0.0%) | 0 (0.0%) |
| Administrative & Support | 10 (21.3%) | 37 (78.7%) |
| Educational Services | 24 (13.5%) | 154 (86.5%) |
| Health Care & Social Assistance | 77 (43.3%) | 101 (56.7%) |
| Arts, Entertainment & Recreation | 21 (34.4%) | 40 (65.6%) |
| Accommodation & Food Services | 7 (12.7%) | 48 (87.3%) |
| Public Administration | 153 (89.5%) | 18 (10.5%) |
| Total | 786 (51.5%) | 739 (48.5%) |
Education in Rose Hills
School Enrollment in Rose Hills
The most common levels of schooling among the 535 students in Rose Hills are high school (147 | 27.5%), college / undergraduate (95 | 17.8%), and elementary school (75 | 14.0%).
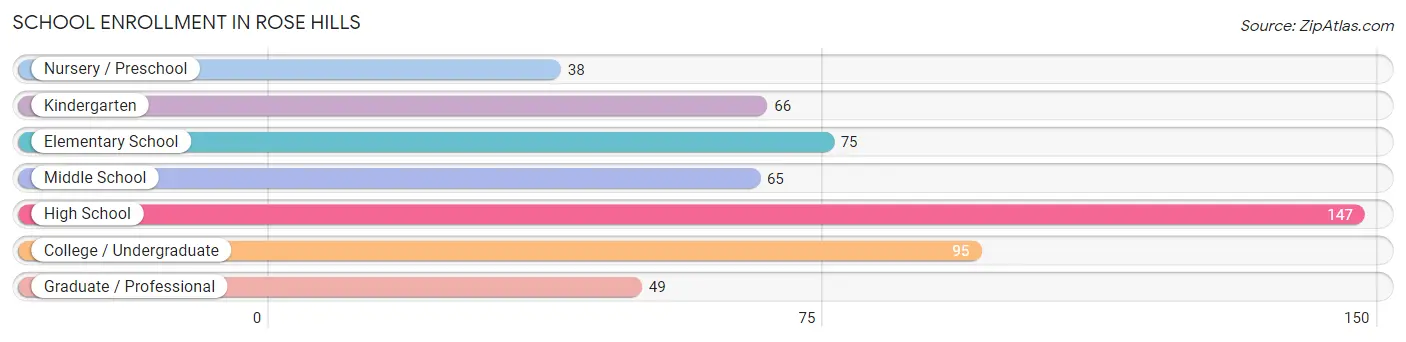
| School Level | # Students | % Students |
| Nursery / Preschool | 38 | 7.1% |
| Kindergarten | 66 | 12.3% |
| Elementary School | 75 | 14.0% |
| Middle School | 65 | 12.1% |
| High School | 147 | 27.5% |
| College / Undergraduate | 95 | 17.8% |
| Graduate / Professional | 49 | 9.2% |
| Total | 535 | 100.0% |
School Enrollment by Age by Funding Source in Rose Hills
Out of a total of 535 students who are enrolled in schools in Rose Hills, 141 (26.4%) attend a private institution, while the remaining 394 (73.6%) are enrolled in public schools. The age group of 3 to 4 year olds has the highest likelihood of being enrolled in private schools, with 23 (95.8% in the age bracket) enrolled. Conversely, the age group of 15 to 17 year olds has the lowest likelihood of being enrolled in a private school, with 52 (100.0% in the age bracket) attending a public institution.
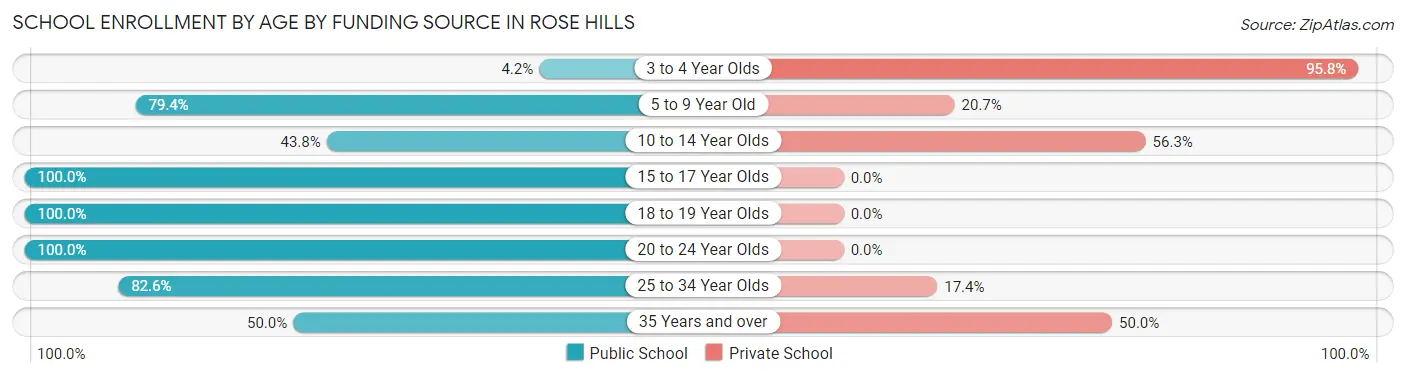
| Age Bracket | Public School | Private School |
| 3 to 4 Year Olds | 1 (4.2%) | 23 (95.8%) |
| 5 to 9 Year Old | 123 (79.3%) | 32 (20.6%) |
| 10 to 14 Year Olds | 42 (43.8%) | 54 (56.2%) |
| 15 to 17 Year Olds | 52 (100.0%) | 0 (0.0%) |
| 18 to 19 Year Olds | 78 (100.0%) | 0 (0.0%) |
| 20 to 24 Year Olds | 10 (100.0%) | 0 (0.0%) |
| 25 to 34 Year Olds | 71 (82.6%) | 15 (17.4%) |
| 35 Years and over | 17 (50.0%) | 17 (50.0%) |
| Total | 394 (73.6%) | 141 (26.4%) |
Educational Attainment by Field of Study in Rose Hills
Business (175 | 17.0%), bio, nature & agricultural (168 | 16.4%), liberal arts & history (134 | 13.1%), social sciences (119 | 11.6%), and engineering (103 | 10.0%) are the most common fields of study among 1,027 individuals in Rose Hills who have obtained a bachelor's degree or higher.
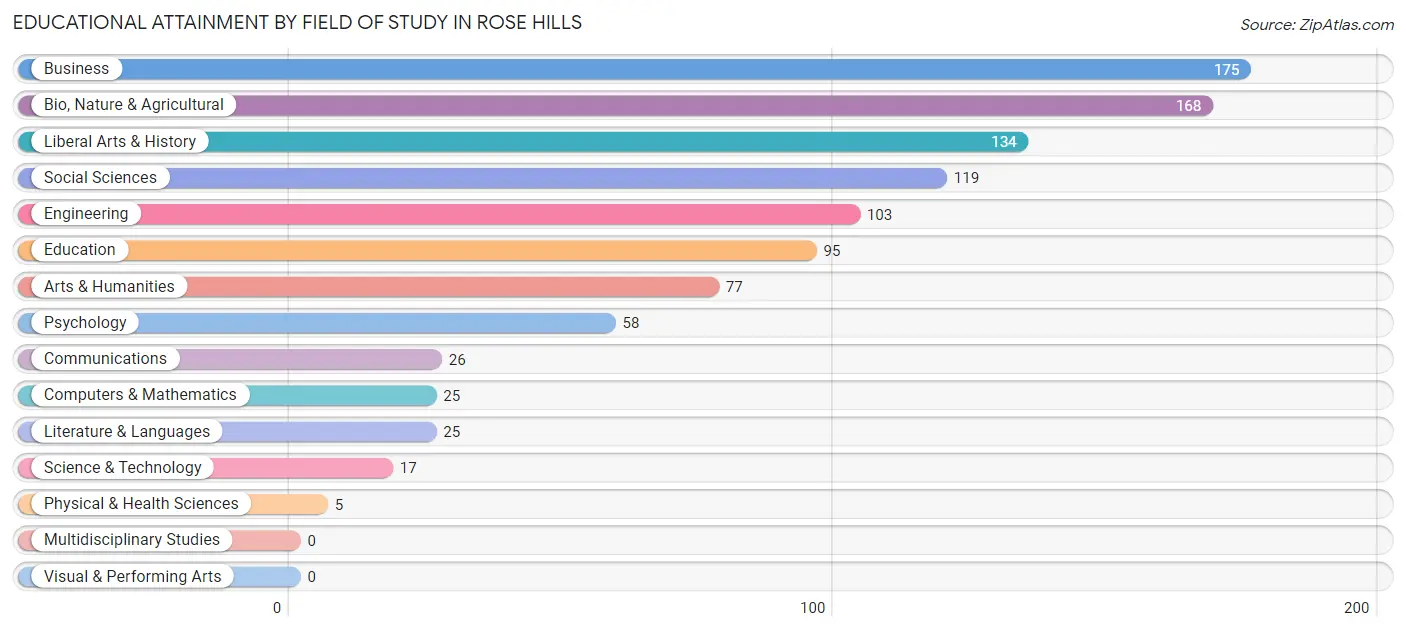
| Field of Study | # Graduates | % Graduates |
| Computers & Mathematics | 25 | 2.4% |
| Bio, Nature & Agricultural | 168 | 16.4% |
| Physical & Health Sciences | 5 | 0.5% |
| Psychology | 58 | 5.7% |
| Social Sciences | 119 | 11.6% |
| Engineering | 103 | 10.0% |
| Multidisciplinary Studies | 0 | 0.0% |
| Science & Technology | 17 | 1.7% |
| Business | 175 | 17.0% |
| Education | 95 | 9.2% |
| Literature & Languages | 25 | 2.4% |
| Liberal Arts & History | 134 | 13.1% |
| Visual & Performing Arts | 0 | 0.0% |
| Communications | 26 | 2.5% |
| Arts & Humanities | 77 | 7.5% |
| Total | 1,027 | 100.0% |
Transportation & Commute in Rose Hills
Vehicle Availability by Sex in Rose Hills
The most prevalent vehicle ownership categories in Rose Hills are males with 3 vehicles (399, accounting for 50.8%) and females with 3 vehicles (327, making up 56.1%).
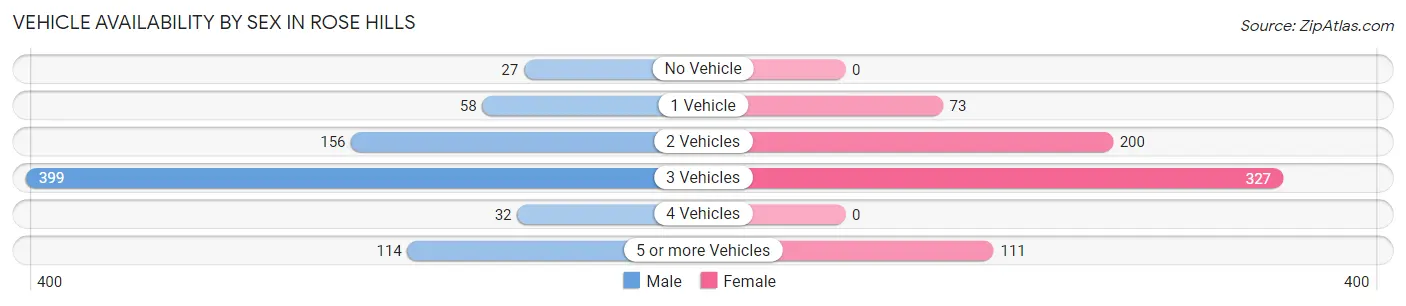
| Vehicles Available | Male | Female |
| No Vehicle | 27 (3.4%) | 0 (0.0%) |
| 1 Vehicle | 58 (7.4%) | 73 (10.3%) |
| 2 Vehicles | 156 (19.9%) | 200 (28.1%) |
| 3 Vehicles | 399 (50.8%) | 327 (46.0%) |
| 4 Vehicles | 32 (4.1%) | 0 (0.0%) |
| 5 or more Vehicles | 114 (14.5%) | 111 (15.6%) |
| Total | 786 (100.0%) | 711 (100.0%) |
Commute Time in Rose Hills
The most frequently occuring commute durations in Rose Hills are 20 to 24 minutes (324 commuters, 24.2%), 45 to 59 minutes (313 commuters, 23.3%), and 30 to 34 minutes (274 commuters, 20.4%).
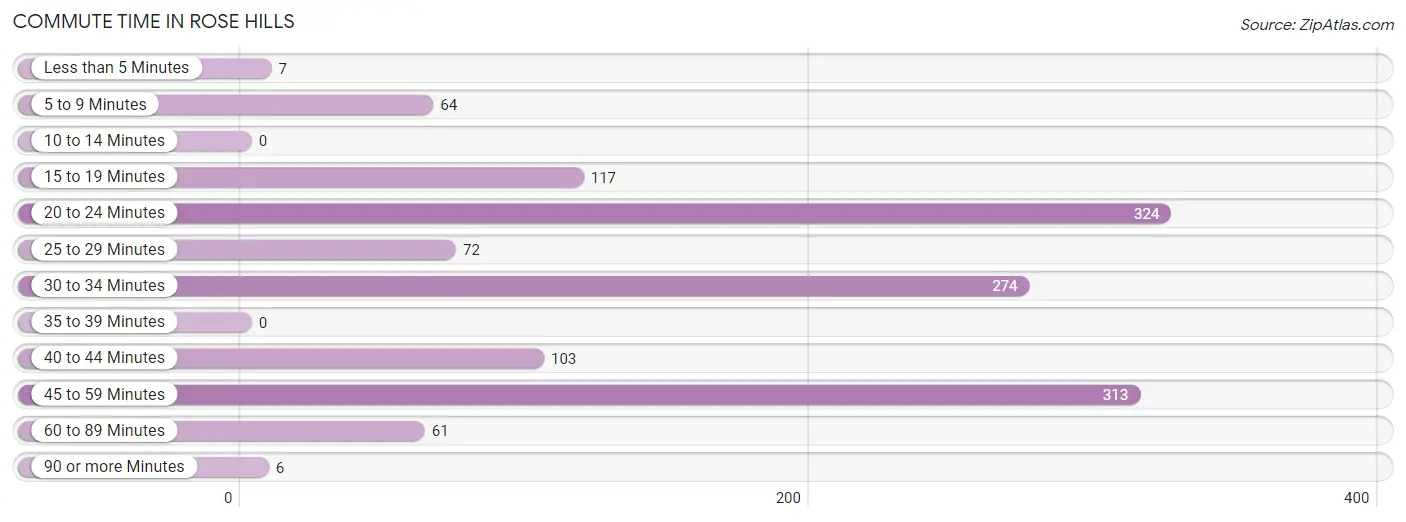
| Commute Time | # Commuters | % Commuters |
| Less than 5 Minutes | 7 | 0.5% |
| 5 to 9 Minutes | 64 | 4.8% |
| 10 to 14 Minutes | 0 | 0.0% |
| 15 to 19 Minutes | 117 | 8.7% |
| 20 to 24 Minutes | 324 | 24.2% |
| 25 to 29 Minutes | 72 | 5.4% |
| 30 to 34 Minutes | 274 | 20.4% |
| 35 to 39 Minutes | 0 | 0.0% |
| 40 to 44 Minutes | 103 | 7.7% |
| 45 to 59 Minutes | 313 | 23.3% |
| 60 to 89 Minutes | 61 | 4.5% |
| 90 or more Minutes | 6 | 0.4% |
Commute Time by Sex in Rose Hills
The most common commute times in Rose Hills are 30 to 34 minutes (212 commuters, 30.4%) for males and 45 to 59 minutes (202 commuters, 31.4%) for females.
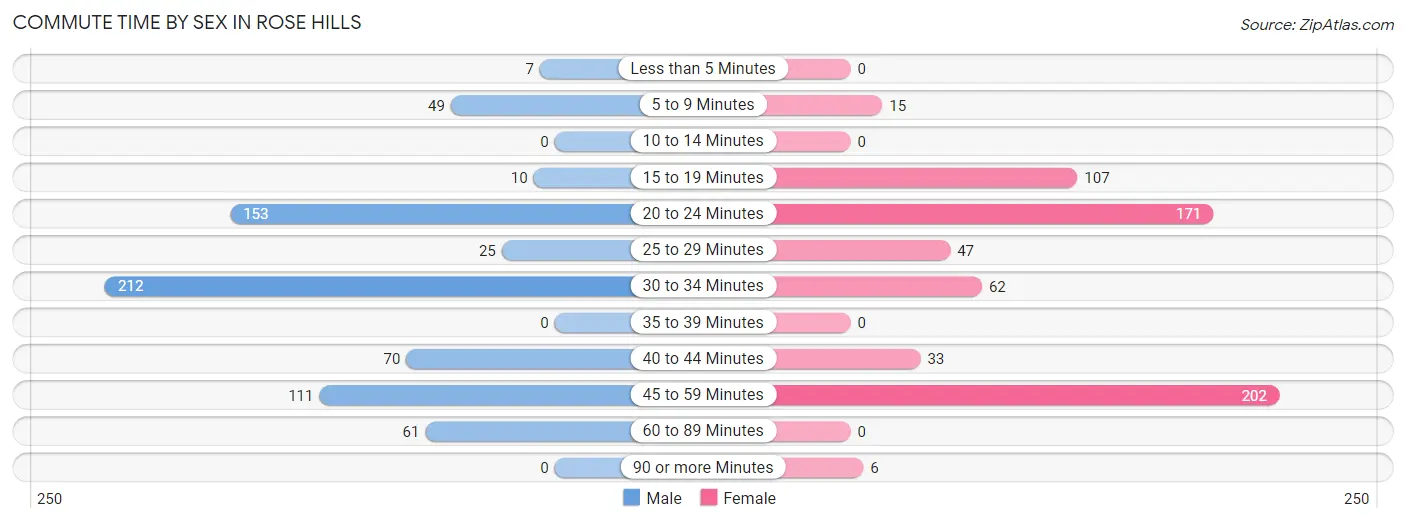
| Commute Time | Male | Female |
| Less than 5 Minutes | 7 (1.0%) | 0 (0.0%) |
| 5 to 9 Minutes | 49 (7.0%) | 15 (2.3%) |
| 10 to 14 Minutes | 0 (0.0%) | 0 (0.0%) |
| 15 to 19 Minutes | 10 (1.4%) | 107 (16.6%) |
| 20 to 24 Minutes | 153 (21.9%) | 171 (26.6%) |
| 25 to 29 Minutes | 25 (3.6%) | 47 (7.3%) |
| 30 to 34 Minutes | 212 (30.4%) | 62 (9.6%) |
| 35 to 39 Minutes | 0 (0.0%) | 0 (0.0%) |
| 40 to 44 Minutes | 70 (10.0%) | 33 (5.1%) |
| 45 to 59 Minutes | 111 (15.9%) | 202 (31.4%) |
| 60 to 89 Minutes | 61 (8.7%) | 0 (0.0%) |
| 90 or more Minutes | 0 (0.0%) | 6 (0.9%) |
Time of Departure to Work by Sex in Rose Hills
The most frequent times of departure to work in Rose Hills are 6:30 AM to 6:59 AM (189, 27.1%) for males and 7:30 AM to 7:59 AM (174, 27.1%) for females.
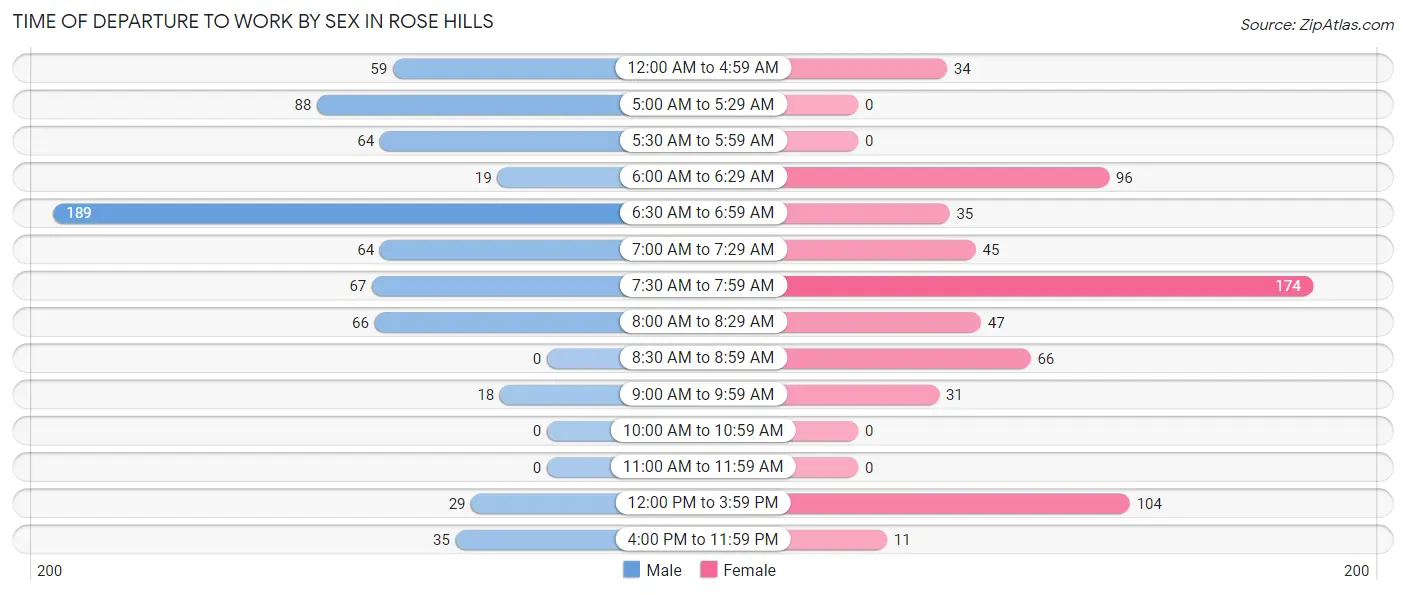
| Time of Departure | Male | Female |
| 12:00 AM to 4:59 AM | 59 (8.5%) | 34 (5.3%) |
| 5:00 AM to 5:29 AM | 88 (12.6%) | 0 (0.0%) |
| 5:30 AM to 5:59 AM | 64 (9.2%) | 0 (0.0%) |
| 6:00 AM to 6:29 AM | 19 (2.7%) | 96 (14.9%) |
| 6:30 AM to 6:59 AM | 189 (27.1%) | 35 (5.4%) |
| 7:00 AM to 7:29 AM | 64 (9.2%) | 45 (7.0%) |
| 7:30 AM to 7:59 AM | 67 (9.6%) | 174 (27.1%) |
| 8:00 AM to 8:29 AM | 66 (9.5%) | 47 (7.3%) |
| 8:30 AM to 8:59 AM | 0 (0.0%) | 66 (10.3%) |
| 9:00 AM to 9:59 AM | 18 (2.6%) | 31 (4.8%) |
| 10:00 AM to 10:59 AM | 0 (0.0%) | 0 (0.0%) |
| 11:00 AM to 11:59 AM | 0 (0.0%) | 0 (0.0%) |
| 12:00 PM to 3:59 PM | 29 (4.2%) | 104 (16.2%) |
| 4:00 PM to 11:59 PM | 35 (5.0%) | 11 (1.7%) |
| Total | 698 (100.0%) | 643 (100.0%) |
Housing Occupancy in Rose Hills
Occupancy by Ownership in Rose Hills
Of the total 1,050 dwellings in Rose Hills, owner-occupied units account for 954 (90.9%), while renter-occupied units make up 96 (9.1%).
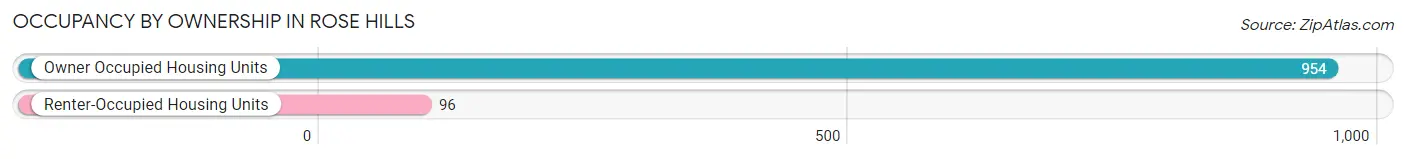
| Occupancy | # Housing Units | % Housing Units |
| Owner Occupied Housing Units | 954 | 90.9% |
| Renter-Occupied Housing Units | 96 | 9.1% |
| Total Occupied Housing Units | 1,050 | 100.0% |
Occupancy by Household Size in Rose Hills
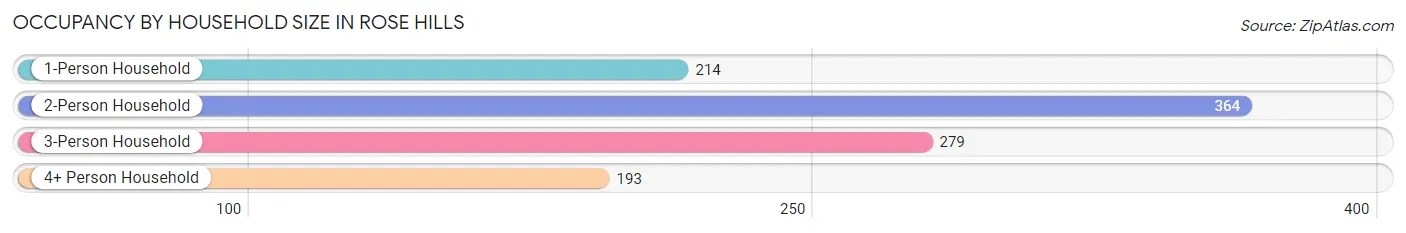
| Household Size | # Housing Units | % Housing Units |
| 1-Person Household | 214 | 20.4% |
| 2-Person Household | 364 | 34.7% |
| 3-Person Household | 279 | 26.6% |
| 4+ Person Household | 193 | 18.4% |
| Total Housing Units | 1,050 | 100.0% |
Occupancy by Ownership by Household Size in Rose Hills
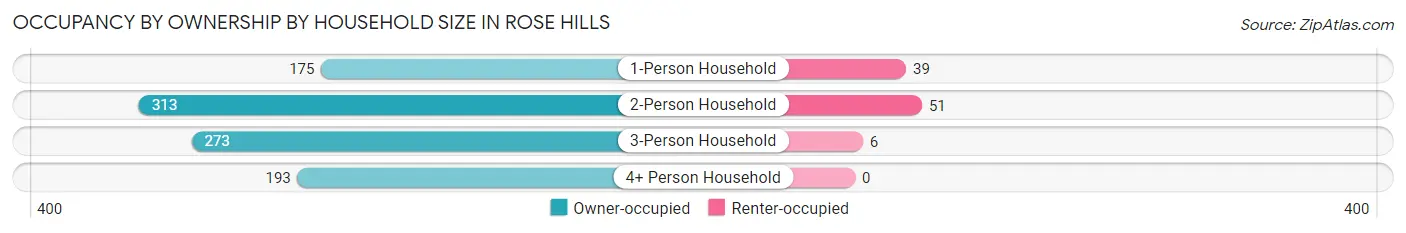
| Household Size | Owner-occupied | Renter-occupied |
| 1-Person Household | 175 (81.8%) | 39 (18.2%) |
| 2-Person Household | 313 (86.0%) | 51 (14.0%) |
| 3-Person Household | 273 (97.9%) | 6 (2.1%) |
| 4+ Person Household | 193 (100.0%) | 0 (0.0%) |
| Total Housing Units | 954 (90.9%) | 96 (9.1%) |
Occupancy by Educational Attainment in Rose Hills
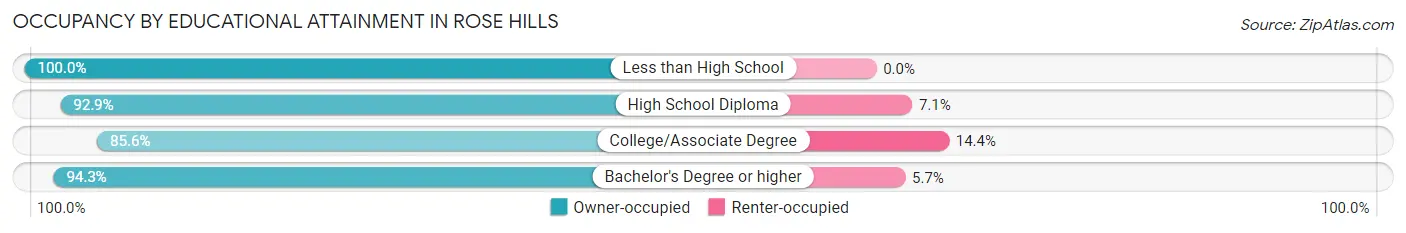
| Household Size | Owner-occupied | Renter-occupied |
| Less than High School | 10 (100.0%) | 0 (0.0%) |
| High School Diploma | 144 (92.9%) | 11 (7.1%) |
| College/Associate Degree | 339 (85.6%) | 57 (14.4%) |
| Bachelor's Degree or higher | 461 (94.3%) | 28 (5.7%) |
Occupancy by Age of Householder in Rose Hills
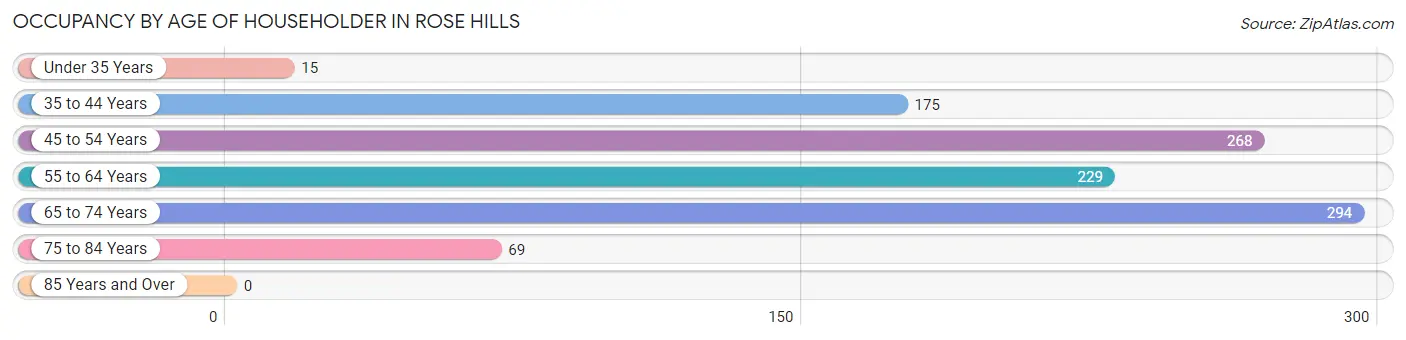
| Age Bracket | # Households | % Households |
| Under 35 Years | 15 | 1.4% |
| 35 to 44 Years | 175 | 16.7% |
| 45 to 54 Years | 268 | 25.5% |
| 55 to 64 Years | 229 | 21.8% |
| 65 to 74 Years | 294 | 28.0% |
| 75 to 84 Years | 69 | 6.6% |
| 85 Years and Over | 0 | 0.0% |
| Total | 1,050 | 100.0% |
Housing Finances in Rose Hills
Median Income by Occupancy in Rose Hills
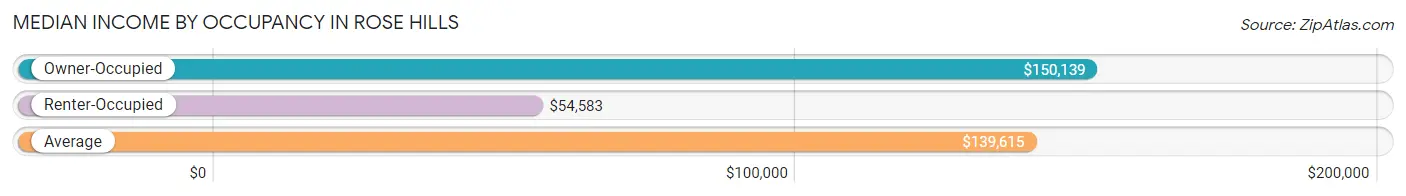
| Occupancy Type | # Households | Median Income |
| Owner-Occupied | 954 (90.9%) | $150,139 |
| Renter-Occupied | 96 (9.1%) | $54,583 |
| Average | 1,050 (100.0%) | $139,615 |
Occupancy by Householder Income Bracket in Rose Hills
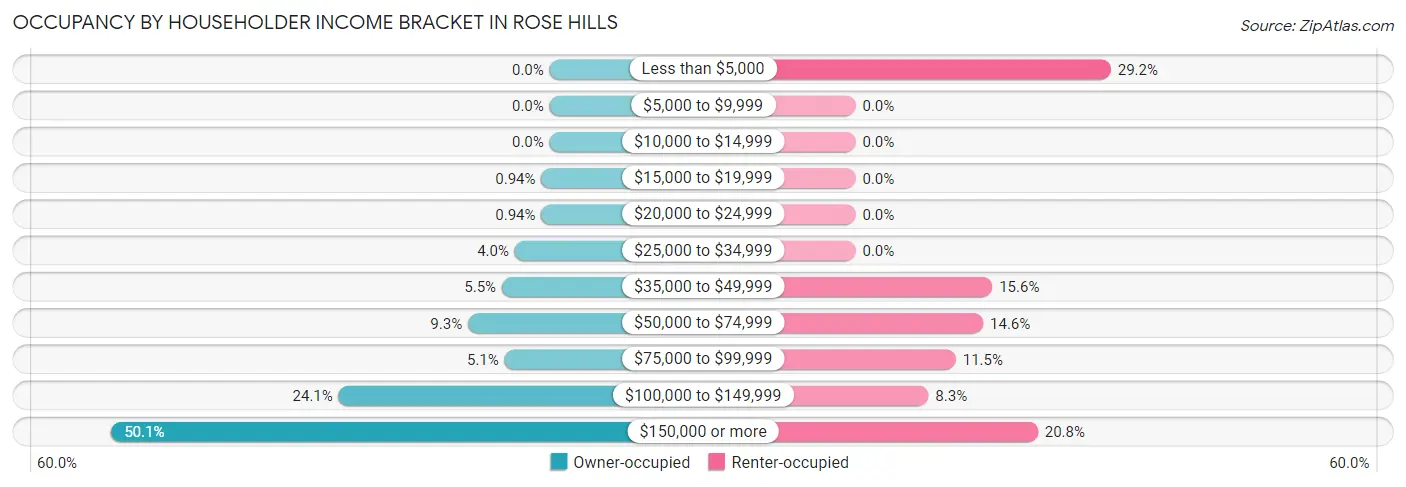
| Income Bracket | Owner-occupied | Renter-occupied |
| Less than $5,000 | 0 (0.0%) | 28 (29.2%) |
| $5,000 to $9,999 | 0 (0.0%) | 0 (0.0%) |
| $10,000 to $14,999 | 0 (0.0%) | 0 (0.0%) |
| $15,000 to $19,999 | 9 (0.9%) | 0 (0.0%) |
| $20,000 to $24,999 | 9 (0.9%) | 0 (0.0%) |
| $25,000 to $34,999 | 38 (4.0%) | 0 (0.0%) |
| $35,000 to $49,999 | 52 (5.4%) | 15 (15.6%) |
| $50,000 to $74,999 | 89 (9.3%) | 14 (14.6%) |
| $75,000 to $99,999 | 49 (5.1%) | 11 (11.5%) |
| $100,000 to $149,999 | 230 (24.1%) | 8 (8.3%) |
| $150,000 or more | 478 (50.1%) | 20 (20.8%) |
| Total | 954 (100.0%) | 96 (100.0%) |
Monthly Housing Cost Tiers in Rose Hills
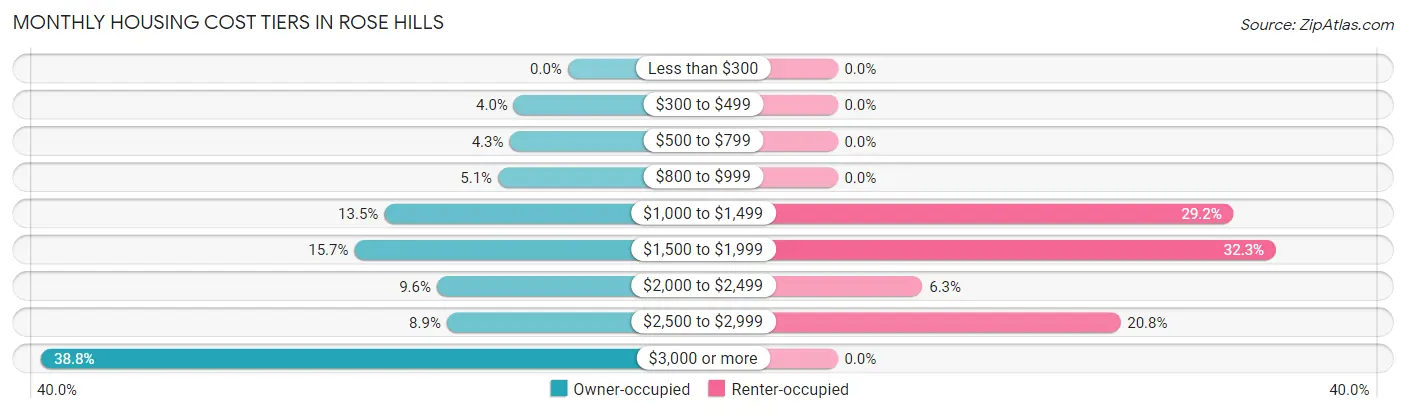
| Monthly Cost | Owner-occupied | Renter-occupied |
| Less than $300 | 0 (0.0%) | 0 (0.0%) |
| $300 to $499 | 38 (4.0%) | 0 (0.0%) |
| $500 to $799 | 41 (4.3%) | 0 (0.0%) |
| $800 to $999 | 49 (5.1%) | 0 (0.0%) |
| $1,000 to $1,499 | 129 (13.5%) | 28 (29.2%) |
| $1,500 to $1,999 | 150 (15.7%) | 31 (32.3%) |
| $2,000 to $2,499 | 92 (9.6%) | 6 (6.2%) |
| $2,500 to $2,999 | 85 (8.9%) | 20 (20.8%) |
| $3,000 or more | 370 (38.8%) | 0 (0.0%) |
| Total | 954 (100.0%) | 96 (100.0%) |
Physical Housing Characteristics in Rose Hills
Housing Structures in Rose Hills
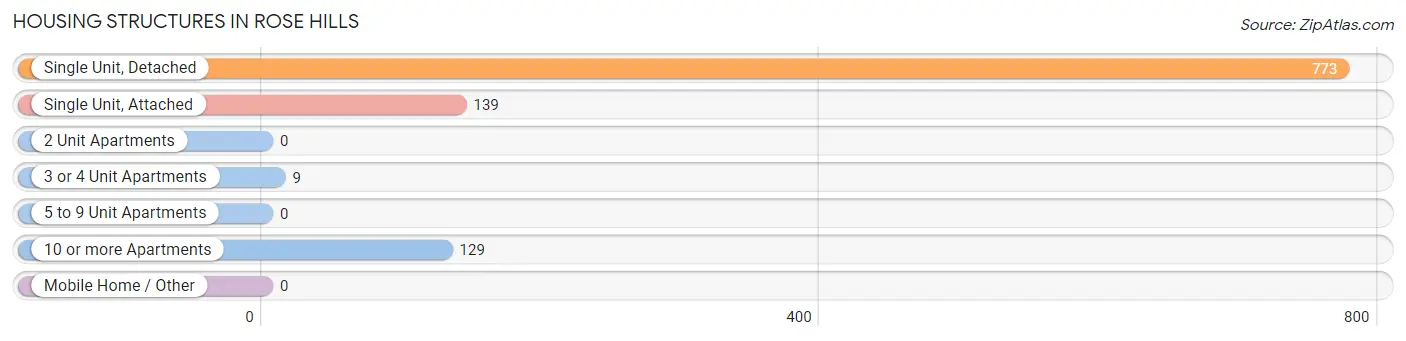
| Structure Type | # Housing Units | % Housing Units |
| Single Unit, Detached | 773 | 73.6% |
| Single Unit, Attached | 139 | 13.2% |
| 2 Unit Apartments | 0 | 0.0% |
| 3 or 4 Unit Apartments | 9 | 0.9% |
| 5 to 9 Unit Apartments | 0 | 0.0% |
| 10 or more Apartments | 129 | 12.3% |
| Mobile Home / Other | 0 | 0.0% |
| Total | 1,050 | 100.0% |
Housing Structures by Occupancy in Rose Hills
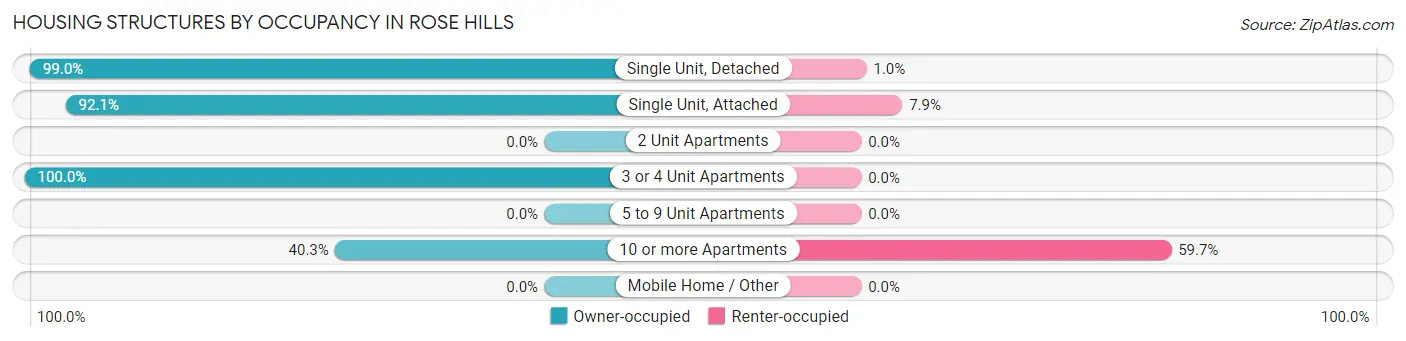
| Structure Type | Owner-occupied | Renter-occupied |
| Single Unit, Detached | 765 (99.0%) | 8 (1.0%) |
| Single Unit, Attached | 128 (92.1%) | 11 (7.9%) |
| 2 Unit Apartments | 0 (0.0%) | 0 (0.0%) |
| 3 or 4 Unit Apartments | 9 (100.0%) | 0 (0.0%) |
| 5 to 9 Unit Apartments | 0 (0.0%) | 0 (0.0%) |
| 10 or more Apartments | 52 (40.3%) | 77 (59.7%) |
| Mobile Home / Other | 0 (0.0%) | 0 (0.0%) |
| Total | 954 (90.9%) | 96 (9.1%) |
Housing Structures by Number of Rooms in Rose Hills
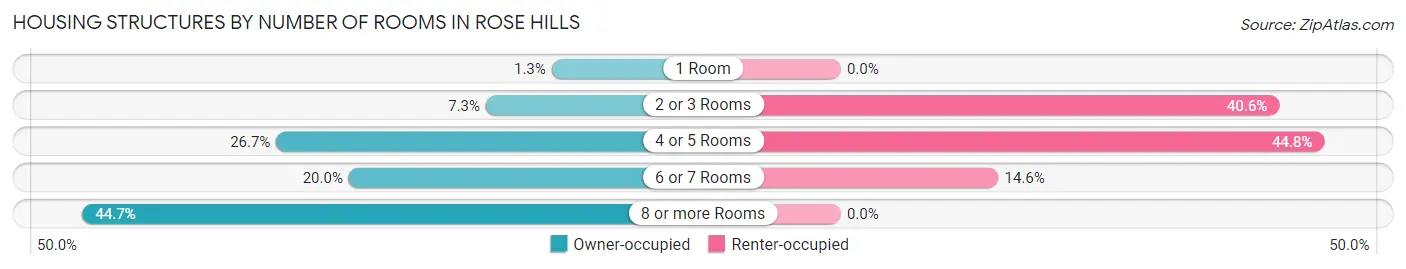
| Number of Rooms | Owner-occupied | Renter-occupied |
| 1 Room | 12 (1.3%) | 0 (0.0%) |
| 2 or 3 Rooms | 70 (7.3%) | 39 (40.6%) |
| 4 or 5 Rooms | 255 (26.7%) | 43 (44.8%) |
| 6 or 7 Rooms | 191 (20.0%) | 14 (14.6%) |
| 8 or more Rooms | 426 (44.7%) | 0 (0.0%) |
| Total | 954 (100.0%) | 96 (100.0%) |
Housing Structure by Heating Type in Rose Hills
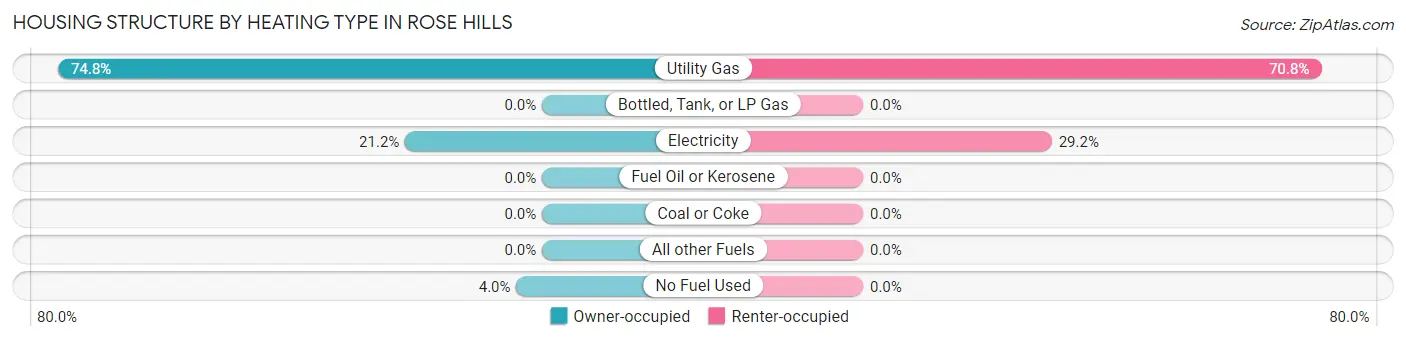
| Heating Type | Owner-occupied | Renter-occupied |
| Utility Gas | 714 (74.8%) | 68 (70.8%) |
| Bottled, Tank, or LP Gas | 0 (0.0%) | 0 (0.0%) |
| Electricity | 202 (21.2%) | 28 (29.2%) |
| Fuel Oil or Kerosene | 0 (0.0%) | 0 (0.0%) |
| Coal or Coke | 0 (0.0%) | 0 (0.0%) |
| All other Fuels | 0 (0.0%) | 0 (0.0%) |
| No Fuel Used | 38 (4.0%) | 0 (0.0%) |
| Total | 954 (100.0%) | 96 (100.0%) |
Household Vehicle Usage in Rose Hills
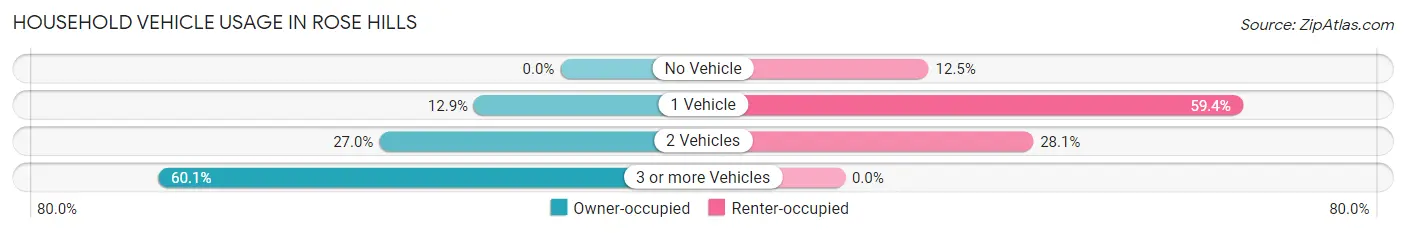
| Vehicles per Household | Owner-occupied | Renter-occupied |
| No Vehicle | 0 (0.0%) | 12 (12.5%) |
| 1 Vehicle | 123 (12.9%) | 57 (59.4%) |
| 2 Vehicles | 258 (27.0%) | 27 (28.1%) |
| 3 or more Vehicles | 573 (60.1%) | 0 (0.0%) |
| Total | 954 (100.0%) | 96 (100.0%) |
Real Estate & Mortgages in Rose Hills
Real Estate and Mortgage Overview in Rose Hills
| Characteristic | Without Mortgage | With Mortgage |
| Housing Units | 204 | 750 |
| Median Property Value | $825,600 | $871,300 |
| Median Household Income | $112,907 | $440 |
| Monthly Housing Costs | $1,006 | $370 |
| Real Estate Taxes | $6,939 | $15 |
Property Value by Mortgage Status in Rose Hills
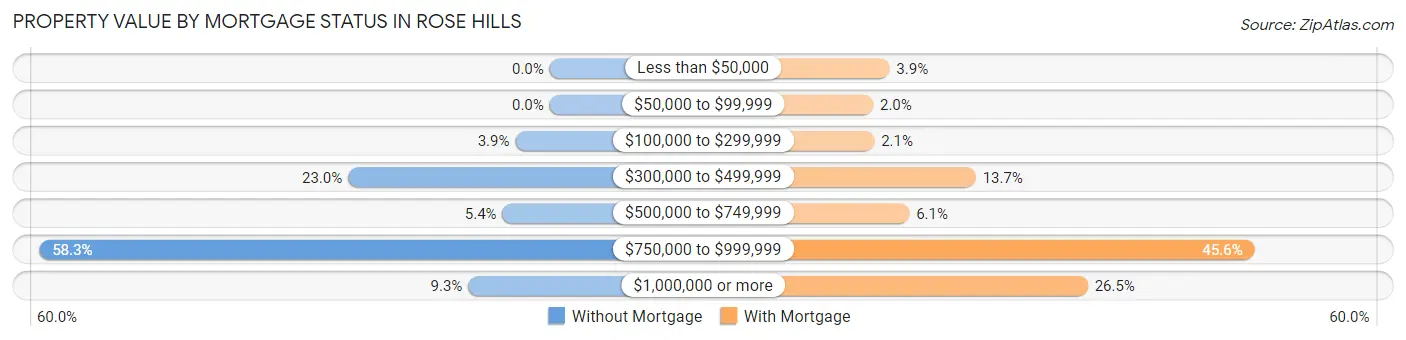
| Property Value | Without Mortgage | With Mortgage |
| Less than $50,000 | 0 (0.0%) | 29 (3.9%) |
| $50,000 to $99,999 | 0 (0.0%) | 15 (2.0%) |
| $100,000 to $299,999 | 8 (3.9%) | 16 (2.1%) |
| $300,000 to $499,999 | 47 (23.0%) | 103 (13.7%) |
| $500,000 to $749,999 | 11 (5.4%) | 46 (6.1%) |
| $750,000 to $999,999 | 119 (58.3%) | 342 (45.6%) |
| $1,000,000 or more | 19 (9.3%) | 199 (26.5%) |
| Total | 204 (100.0%) | 750 (100.0%) |
Household Income by Mortgage Status in Rose Hills
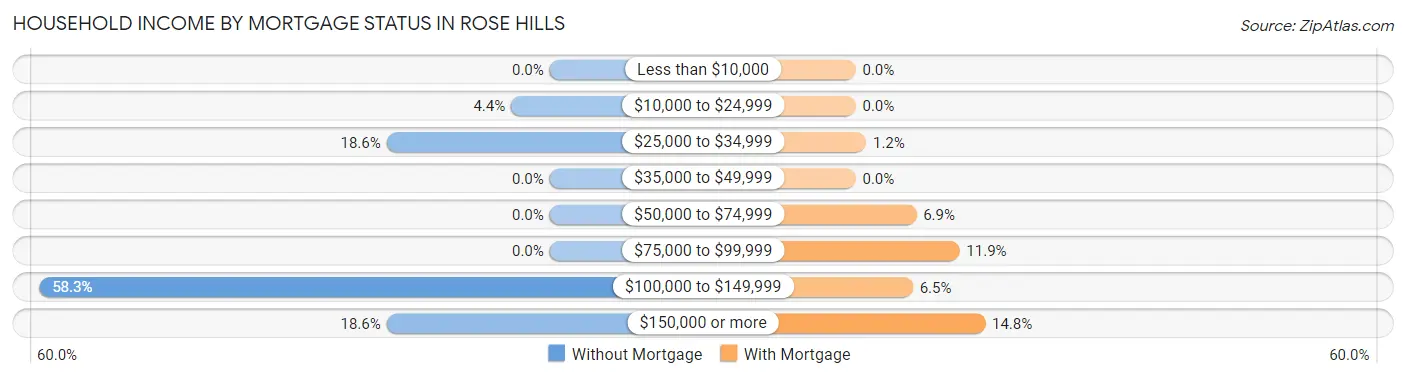
| Household Income | Without Mortgage | With Mortgage |
| Less than $10,000 | 0 (0.0%) | 0 (0.0%) |
| $10,000 to $24,999 | 9 (4.4%) | 0 (0.0%) |
| $25,000 to $34,999 | 38 (18.6%) | 9 (1.2%) |
| $35,000 to $49,999 | 0 (0.0%) | 0 (0.0%) |
| $50,000 to $74,999 | 0 (0.0%) | 52 (6.9%) |
| $75,000 to $99,999 | 0 (0.0%) | 89 (11.9%) |
| $100,000 to $149,999 | 119 (58.3%) | 49 (6.5%) |
| $150,000 or more | 38 (18.6%) | 111 (14.8%) |
| Total | 204 (100.0%) | 750 (100.0%) |
Property Value to Household Income Ratio in Rose Hills
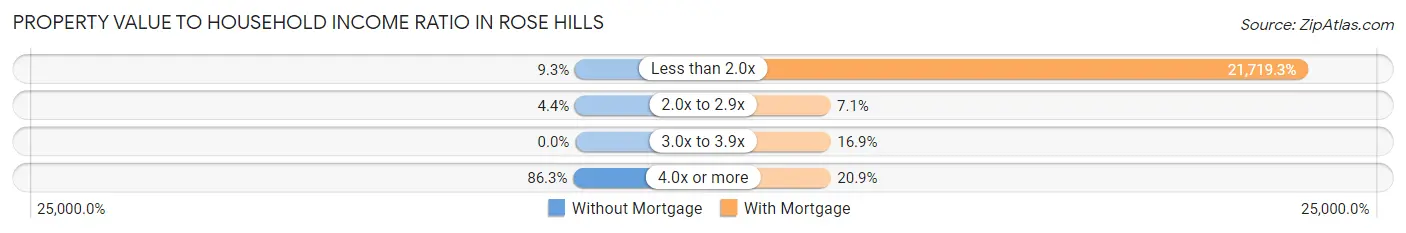
| Value-to-Income Ratio | Without Mortgage | With Mortgage |
| Less than 2.0x | 19 (9.3%) | 162,895 (21,719.3%) |
| 2.0x to 2.9x | 9 (4.4%) | 53 (7.1%) |
| 3.0x to 3.9x | 0 (0.0%) | 127 (16.9%) |
| 4.0x or more | 176 (86.3%) | 157 (20.9%) |
| Total | 204 (100.0%) | 750 (100.0%) |
Real Estate Taxes by Mortgage Status in Rose Hills
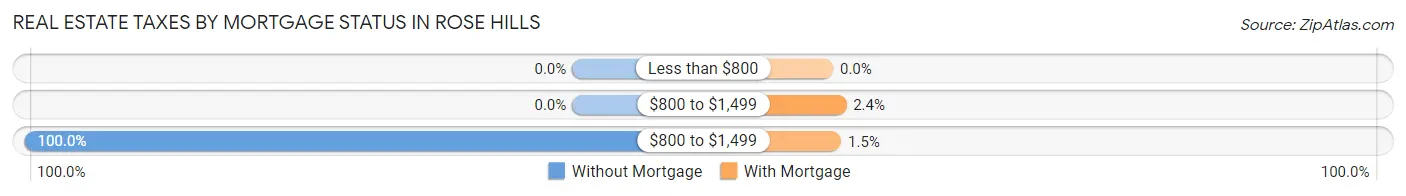
| Property Taxes | Without Mortgage | With Mortgage |
| Less than $800 | 0 (0.0%) | 0 (0.0%) |
| $800 to $1,499 | 0 (0.0%) | 18 (2.4%) |
| $800 to $1,499 | 204 (100.0%) | 11 (1.5%) |
| Total | 204 (100.0%) | 750 (100.0%) |
Health & Disability in Rose Hills
Health Insurance Coverage by Age in Rose Hills
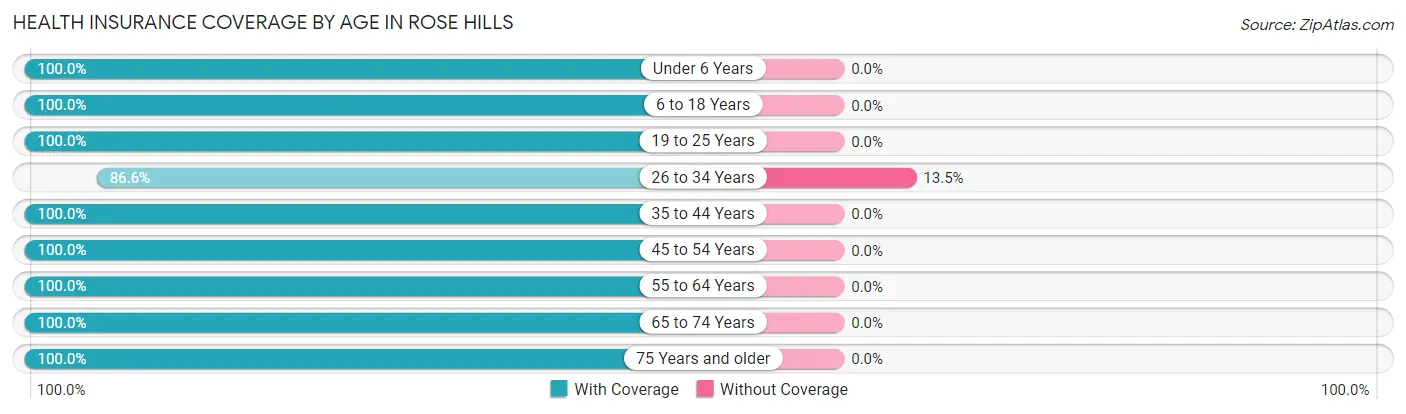
| Age Bracket | With Coverage | Without Coverage |
| Under 6 Years | 91 (100.0%) | 0 (0.0%) |
| 6 to 18 Years | 356 (100.0%) | 0 (0.0%) |
| 19 to 25 Years | 46 (100.0%) | 0 (0.0%) |
| 26 to 34 Years | 193 (86.6%) | 30 (13.5%) |
| 35 to 44 Years | 350 (100.0%) | 0 (0.0%) |
| 45 to 54 Years | 531 (100.0%) | 0 (0.0%) |
| 55 to 64 Years | 461 (100.0%) | 0 (0.0%) |
| 65 to 74 Years | 457 (100.0%) | 0 (0.0%) |
| 75 Years and older | 203 (100.0%) | 0 (0.0%) |
| Total | 2,688 (98.9%) | 30 (1.1%) |
Health Insurance Coverage by Citizenship Status in Rose Hills
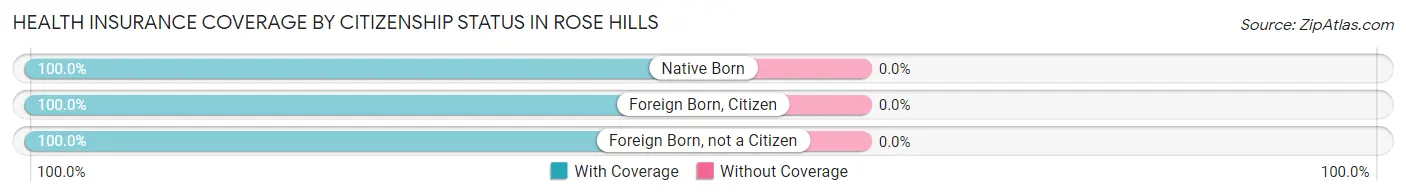
| Citizenship Status | With Coverage | Without Coverage |
| Native Born | 91 (100.0%) | 0 (0.0%) |
| Foreign Born, Citizen | 356 (100.0%) | 0 (0.0%) |
| Foreign Born, not a Citizen | 46 (100.0%) | 0 (0.0%) |
Health Insurance Coverage by Household Income in Rose Hills
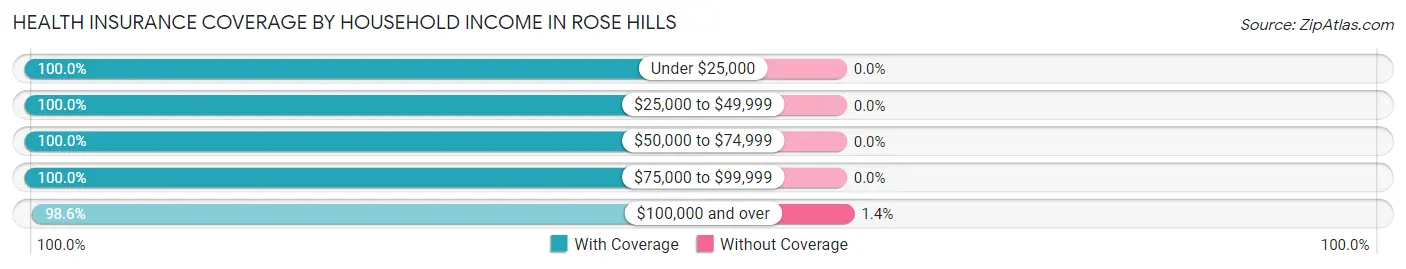
| Household Income | With Coverage | Without Coverage |
| Under $25,000 | 72 (100.0%) | 0 (0.0%) |
| $25,000 to $49,999 | 264 (100.0%) | 0 (0.0%) |
| $50,000 to $74,999 | 198 (100.0%) | 0 (0.0%) |
| $75,000 to $99,999 | 105 (100.0%) | 0 (0.0%) |
| $100,000 and over | 2,049 (98.6%) | 30 (1.4%) |
Public vs Private Health Insurance Coverage by Age in Rose Hills
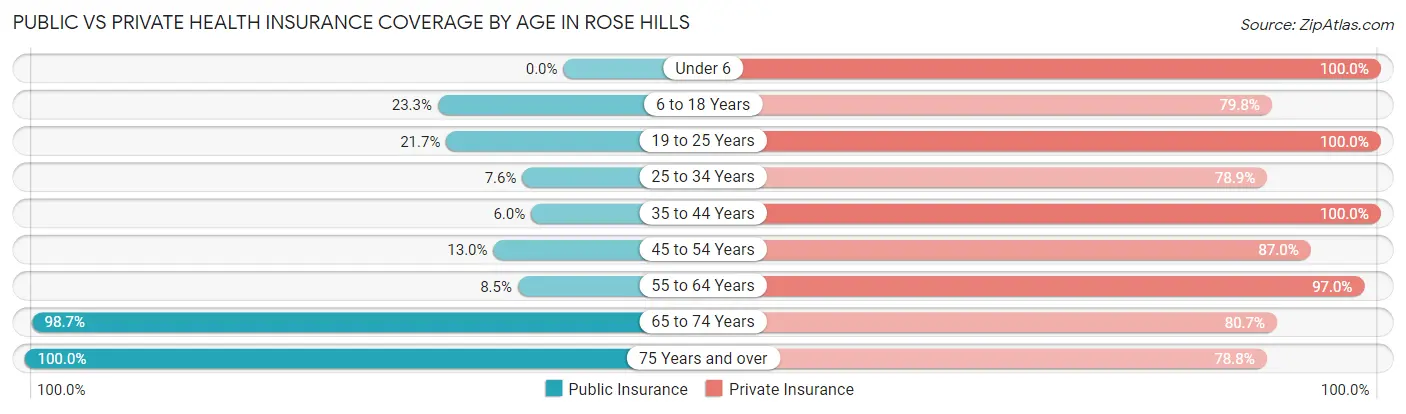
| Age Bracket | Public Insurance | Private Insurance |
| Under 6 | 0 (0.0%) | 91 (100.0%) |
| 6 to 18 Years | 83 (23.3%) | 284 (79.8%) |
| 19 to 25 Years | 10 (21.7%) | 46 (100.0%) |
| 25 to 34 Years | 17 (7.6%) | 176 (78.9%) |
| 35 to 44 Years | 21 (6.0%) | 350 (100.0%) |
| 45 to 54 Years | 69 (13.0%) | 462 (87.0%) |
| 55 to 64 Years | 39 (8.5%) | 447 (97.0%) |
| 65 to 74 Years | 451 (98.7%) | 369 (80.7%) |
| 75 Years and over | 203 (100.0%) | 160 (78.8%) |
| Total | 893 (32.9%) | 2,385 (87.7%) |
Disability Status by Sex by Age in Rose Hills
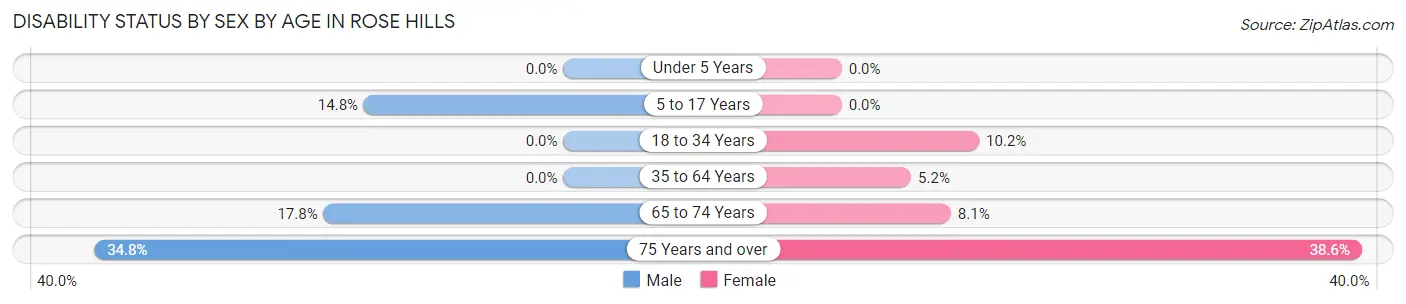
| Age Bracket | Male | Female |
| Under 5 Years | 0 (0.0%) | 0 (0.0%) |
| 5 to 17 Years | 12 (14.8%) | 0 (0.0%) |
| 18 to 34 Years | 0 (0.0%) | 10 (10.2%) |
| 35 to 64 Years | 0 (0.0%) | 37 (5.1%) |
| 65 to 74 Years | 44 (17.8%) | 17 (8.1%) |
| 75 Years and over | 31 (34.8%) | 44 (38.6%) |
Disability Class by Sex by Age in Rose Hills
Disability Class: Hearing Difficulty
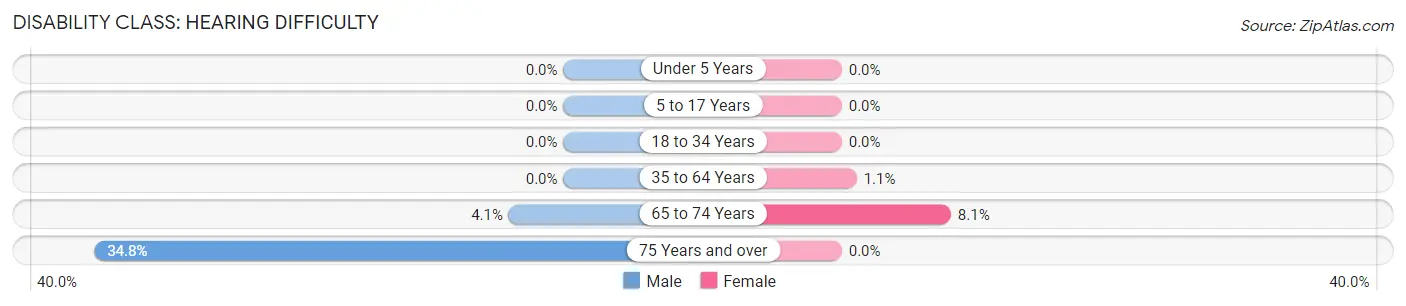
| Age Bracket | Male | Female |
| Under 5 Years | 0 (0.0%) | 0 (0.0%) |
| 5 to 17 Years | 0 (0.0%) | 0 (0.0%) |
| 18 to 34 Years | 0 (0.0%) | 0 (0.0%) |
| 35 to 64 Years | 0 (0.0%) | 8 (1.1%) |
| 65 to 74 Years | 10 (4.1%) | 17 (8.1%) |
| 75 Years and over | 31 (34.8%) | 0 (0.0%) |
Disability Class: Vision Difficulty
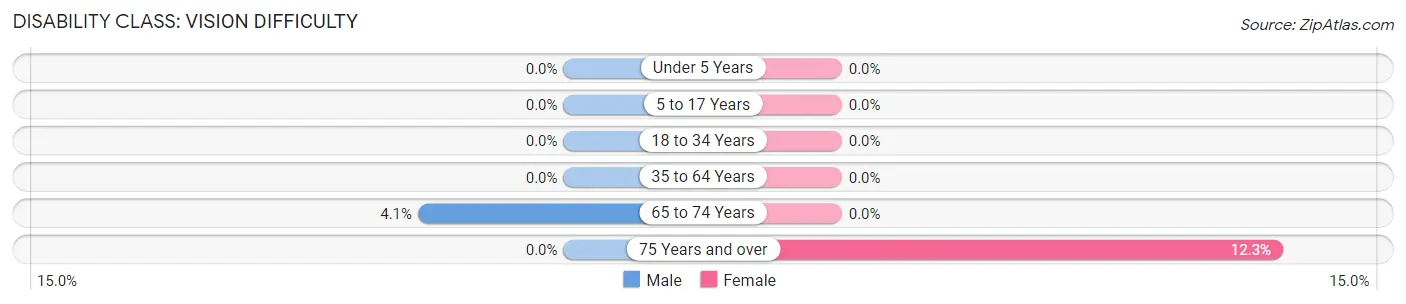
| Age Bracket | Male | Female |
| Under 5 Years | 0 (0.0%) | 0 (0.0%) |
| 5 to 17 Years | 0 (0.0%) | 0 (0.0%) |
| 18 to 34 Years | 0 (0.0%) | 0 (0.0%) |
| 35 to 64 Years | 0 (0.0%) | 0 (0.0%) |
| 65 to 74 Years | 10 (4.1%) | 0 (0.0%) |
| 75 Years and over | 0 (0.0%) | 14 (12.3%) |
Disability Class: Cognitive Difficulty
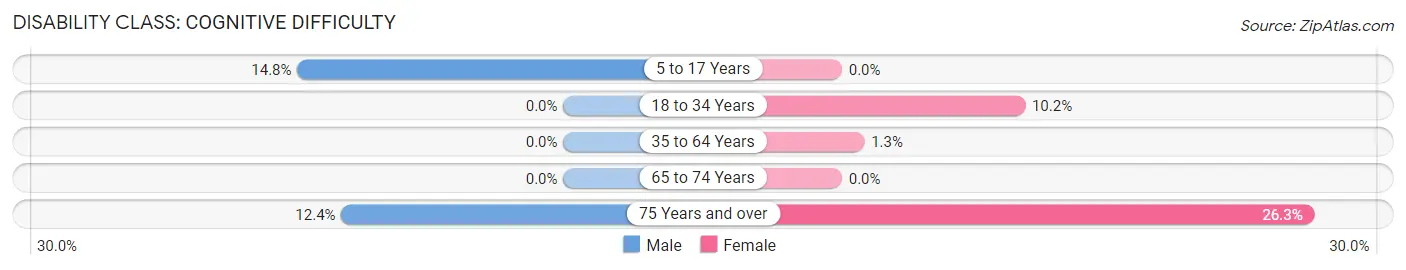
| Age Bracket | Male | Female |
| 5 to 17 Years | 12 (14.8%) | 0 (0.0%) |
| 18 to 34 Years | 0 (0.0%) | 10 (10.2%) |
| 35 to 64 Years | 0 (0.0%) | 9 (1.3%) |
| 65 to 74 Years | 0 (0.0%) | 0 (0.0%) |
| 75 Years and over | 11 (12.4%) | 30 (26.3%) |
Disability Class: Ambulatory Difficulty
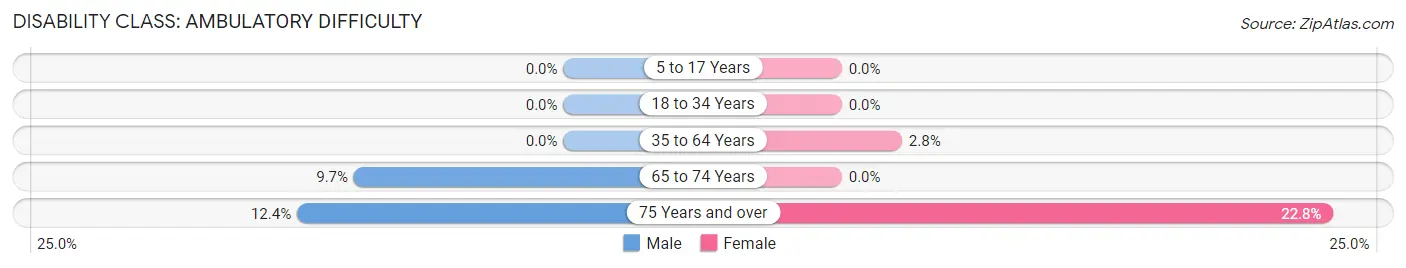
| Age Bracket | Male | Female |
| 5 to 17 Years | 0 (0.0%) | 0 (0.0%) |
| 18 to 34 Years | 0 (0.0%) | 0 (0.0%) |
| 35 to 64 Years | 0 (0.0%) | 20 (2.8%) |
| 65 to 74 Years | 24 (9.7%) | 0 (0.0%) |
| 75 Years and over | 11 (12.4%) | 26 (22.8%) |
Disability Class: Self-Care Difficulty
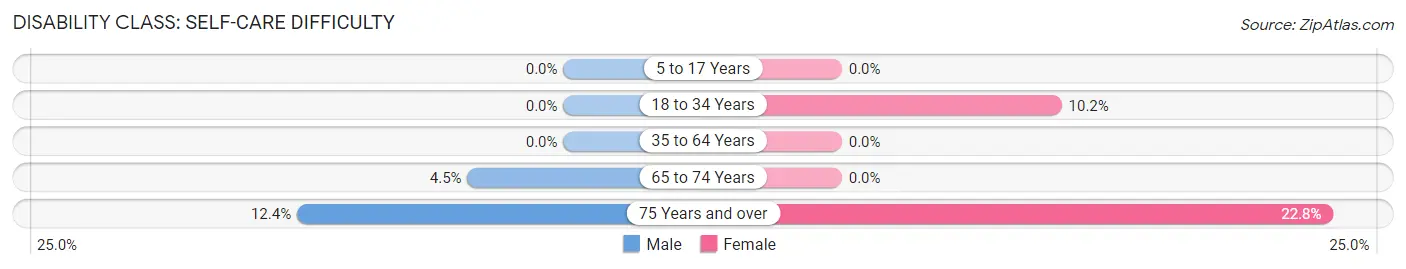
| Age Bracket | Male | Female |
| 5 to 17 Years | 0 (0.0%) | 0 (0.0%) |
| 18 to 34 Years | 0 (0.0%) | 10 (10.2%) |
| 35 to 64 Years | 0 (0.0%) | 0 (0.0%) |
| 65 to 74 Years | 11 (4.4%) | 0 (0.0%) |
| 75 Years and over | 11 (12.4%) | 26 (22.8%) |
Technology Access in Rose Hills
Computing Device Access in Rose Hills
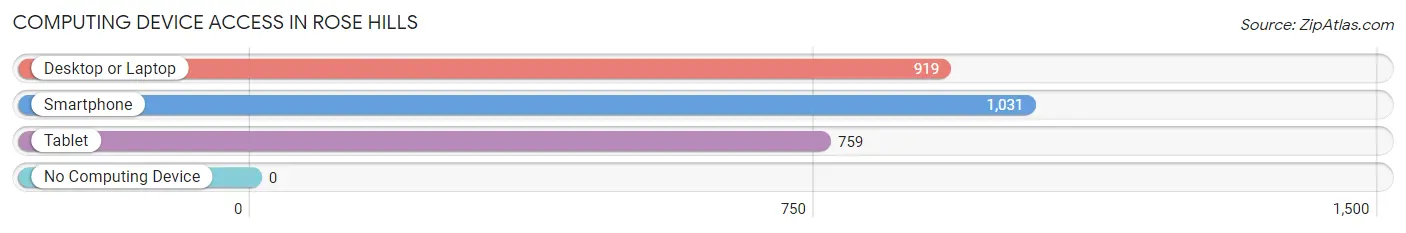
| Device Type | # Households | % Households |
| Desktop or Laptop | 919 | 87.5% |
| Smartphone | 1,031 | 98.2% |
| Tablet | 759 | 72.3% |
| No Computing Device | 0 | 0.0% |
| Total | 1,050 | 100.0% |
Internet Access in Rose Hills
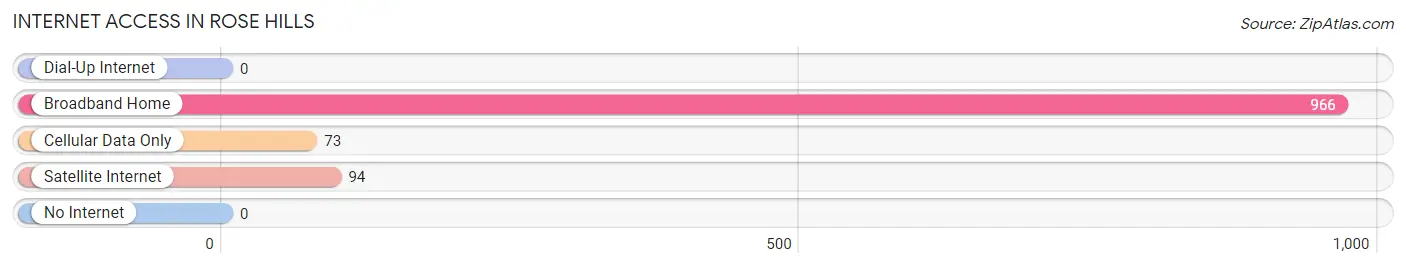
| Internet Type | # Households | % Households |
| Dial-Up Internet | 0 | 0.0% |
| Broadband Home | 966 | 92.0% |
| Cellular Data Only | 73 | 7.0% |
| Satellite Internet | 94 | 8.9% |
| No Internet | 0 | 0.0% |
| Total | 1,050 | 100.0% |
Rose Hills Summary
History
Rose Hills is a small unincorporated community located in Los Angeles County, California. It is situated in the San Gabriel Valley, approximately 20 miles east of downtown Los Angeles. The area was originally inhabited by the Tongva people, who were the original inhabitants of the Los Angeles Basin. The area was first settled by Spanish missionaries in the late 1700s, and the area was later developed as a ranching community in the late 1800s.
The area was named after the Rose Hills family, who were among the first settlers in the area. The Rose Hills family owned a large ranch in the area, and the area was known as Rose Hills Ranch. The ranch was eventually sold to the Los Angeles County in the early 1900s, and the area was developed as a residential community.
Geography
Rose Hills is located in the San Gabriel Valley, approximately 20 miles east of downtown Los Angeles. The area is bordered by the cities of Whittier, La Habra Heights, and La Mirada. The area is situated at an elevation of approximately 500 feet above sea level. The area is characterized by rolling hills and is home to several parks and open spaces.
The climate in Rose Hills is classified as a Mediterranean climate, with hot, dry summers and mild, wet winters. The average annual temperature is approximately 65 degrees Fahrenheit, and the average annual precipitation is approximately 15 inches.
Economy
The economy of Rose Hills is largely based on the service industry. The area is home to several small businesses, including restaurants, retail stores, and professional services. The area is also home to several industrial and manufacturing businesses.
The area is also home to several educational institutions, including Rose Hills Elementary School, Rose Hills High School, and Rose Hills Community College. The area is also home to several churches and religious organizations.
Demographics
As of the 2010 census, the population of Rose Hills was approximately 8,000. The racial makeup of the area was approximately 70% White, 15% Hispanic, 10% Asian, and 5% African American. The median household income in the area was approximately $50,000, and the median home value was approximately $400,000.
Conclusion
Rose Hills is a small unincorporated community located in Los Angeles County, California. The area was originally inhabited by the Tongva people, and was later developed as a ranching community in the late 1800s. The area is characterized by rolling hills and is home to several parks and open spaces. The economy of Rose Hills is largely based on the service industry, and the area is also home to several educational institutions and churches. As of the 2010 census, the population of Rose Hills was approximately 8,000, and the racial makeup of the area was approximately 70% White, 15% Hispanic, 10% Asian, and 5% African American.
Common Questions
What is Per Capita Income in Rose Hills?
Per Capita income in Rose Hills is $61,192.
What is the Median Family Income in Rose Hills?
Median Family Income in Rose Hills is $160,094.
What is the Median Household income in Rose Hills?
Median Household Income in Rose Hills is $139,615.
What is Income or Wage Gap in Rose Hills?
Income or Wage Gap in Rose Hills is 34.1%.
Women in Rose Hills earn 65.9 cents for every dollar earned by a man.
What is Inequality or Gini Index in Rose Hills?
Inequality or Gini Index in Rose Hills is 0.36.
What is the Total Population of Rose Hills?
Total Population of Rose Hills is 2,718.
What is the Total Male Population of Rose Hills?
Total Male Population of Rose Hills is 1,320.
What is the Total Female Population of Rose Hills?
Total Female Population of Rose Hills is 1,398.
What is the Ratio of Males per 100 Females in Rose Hills?
There are 94.42 Males per 100 Females in Rose Hills.
What is the Ratio of Females per 100 Males in Rose Hills?
There are 105.91 Females per 100 Males in Rose Hills.
What is the Median Population Age in Rose Hills?
Median Population Age in Rose Hills is 52.2 Years.
What is the Average Family Size in Rose Hills
Average Family Size in Rose Hills is 3.0 People.
What is the Average Household Size in Rose Hills
Average Household Size in Rose Hills is 2.6 People.
How Large is the Labor Force in Rose Hills?
There are 1,562 People in the Labor Forcein in Rose Hills.
What is the Percentage of People in the Labor Force in Rose Hills?
65.2% of People are in the Labor Force in Rose Hills.
What is the Unemployment Rate in Rose Hills?
Unemployment Rate in Rose Hills is 2.4%.