Rodeo, CA Map & Demographics
Rodeo Map
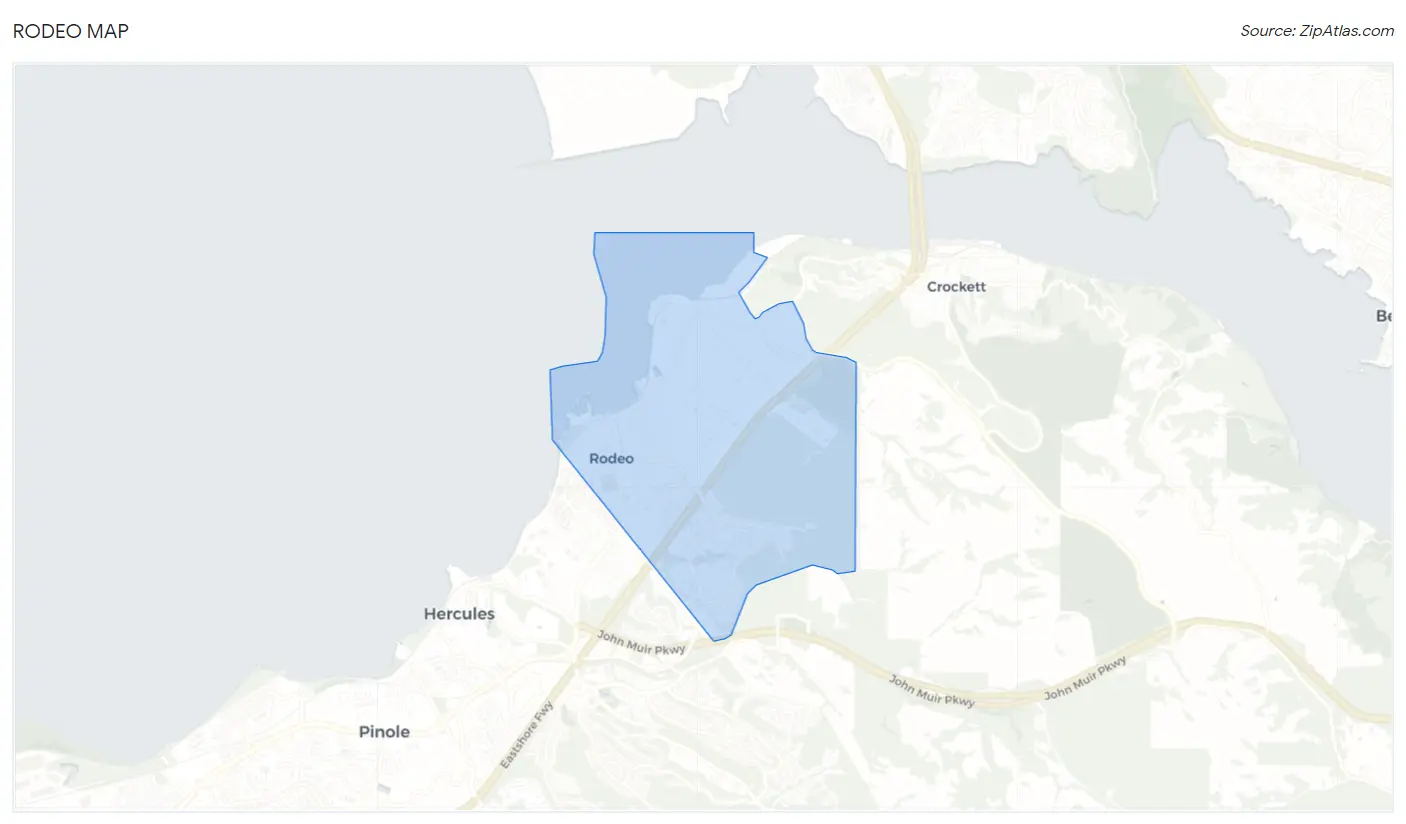
Rodeo Overview
$40,299
PER CAPITA INCOME
$100,769
AVG FAMILY INCOME
$91,875
AVG HOUSEHOLD INCOME
10.2%
WAGE / INCOME GAP [ % ]
89.8¢/ $1
WAGE / INCOME GAP [ $ ]
0.45
INEQUALITY / GINI INDEX
9,334
TOTAL POPULATION
4,633
MALE POPULATION
4,701
FEMALE POPULATION
98.55
MALES / 100 FEMALES
101.47
FEMALES / 100 MALES
39.0
MEDIAN AGE
3.5
AVG FAMILY SIZE
3.0
AVG HOUSEHOLD SIZE
5,017
LABOR FORCE [ PEOPLE ]
65.4%
PERCENT IN LABOR FORCE
7.6%
UNEMPLOYMENT RATE
Rodeo Zip Codes
Rodeo Area Codes
Income in Rodeo
Income Overview in Rodeo
Per Capita Income in Rodeo is $40,299, while median incomes of families and households are $100,769 and $91,875 respectively.
| Characteristic | Number | Measure |
| Per Capita Income | 9,334 | $40,299 |
| Median Family Income | 2,364 | $100,769 |
| Mean Family Income | 2,364 | $124,521 |
| Median Household Income | 3,058 | $91,875 |
| Mean Household Income | 3,058 | $116,602 |
| Income Deficit | 2,364 | $0 |
| Wage / Income Gap (%) | 9,334 | 10.20% |
| Wage / Income Gap ($) | 9,334 | 89.80¢ per $1 |
| Gini / Inequality Index | 9,334 | 0.45 |
Earnings by Sex in Rodeo
Average Earnings in Rodeo are $48,888, $49,907 for men and $44,816 for women, a difference of 10.2%.
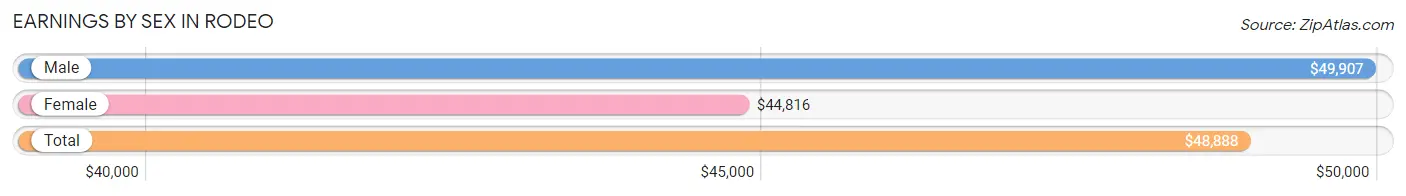
| Sex | Number | Average Earnings |
| Male | 2,814 (56.3%) | $49,907 |
| Female | 2,181 (43.7%) | $44,816 |
| Total | 4,995 (100.0%) | $48,888 |
Earnings by Sex by Income Bracket in Rodeo
The most common earnings brackets in Rodeo are $100,000+ for men (500 | 17.8%) and $100,000+ for women (360 | 16.5%).
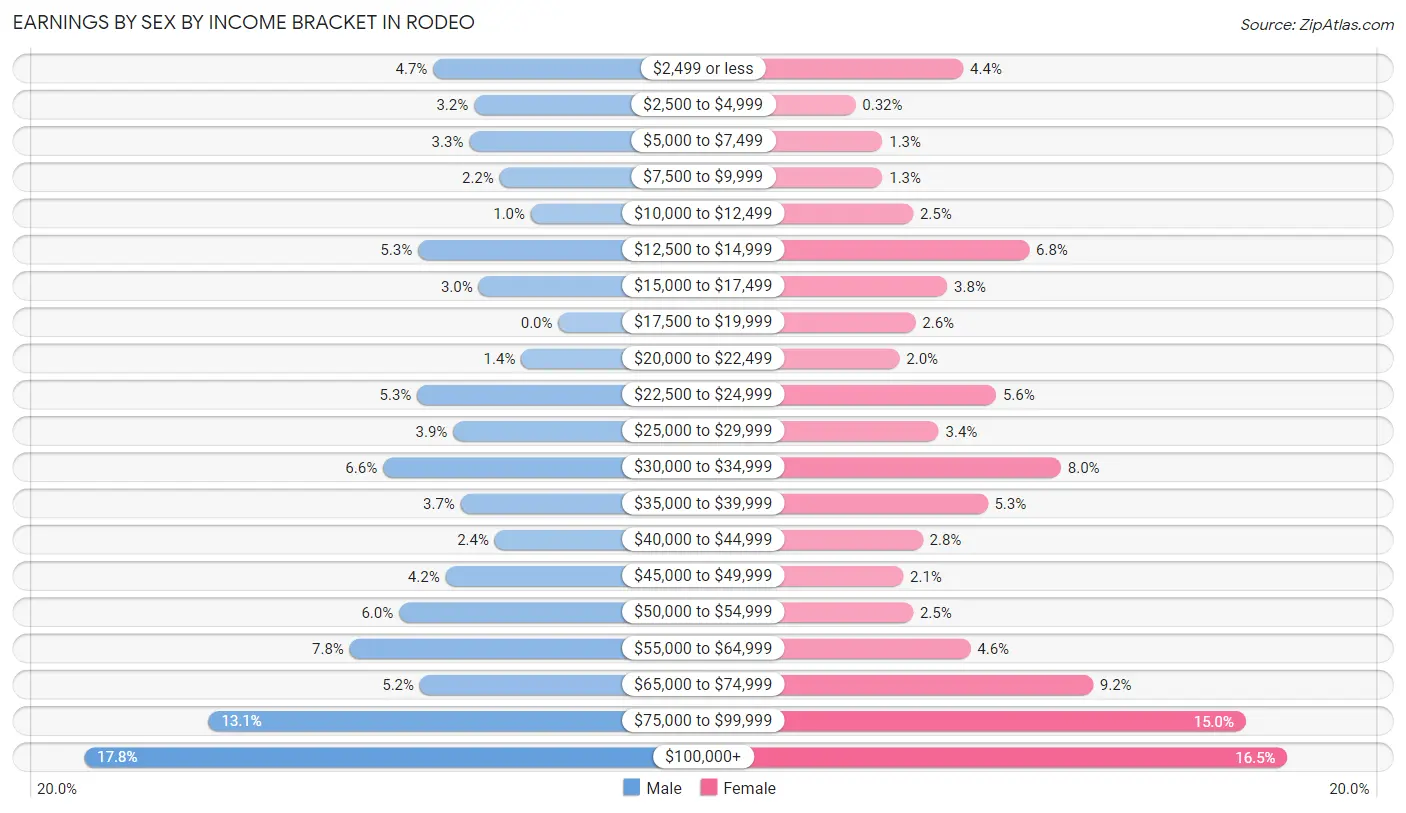
| Income | Male | Female |
| $2,499 or less | 132 (4.7%) | 95 (4.4%) |
| $2,500 to $4,999 | 89 (3.2%) | 7 (0.3%) |
| $5,000 to $7,499 | 94 (3.3%) | 29 (1.3%) |
| $7,500 to $9,999 | 62 (2.2%) | 29 (1.3%) |
| $10,000 to $12,499 | 29 (1.0%) | 54 (2.5%) |
| $12,500 to $14,999 | 148 (5.3%) | 149 (6.8%) |
| $15,000 to $17,499 | 84 (3.0%) | 82 (3.8%) |
| $17,500 to $19,999 | 0 (0.0%) | 56 (2.6%) |
| $20,000 to $22,499 | 39 (1.4%) | 43 (2.0%) |
| $22,500 to $24,999 | 149 (5.3%) | 122 (5.6%) |
| $25,000 to $29,999 | 111 (3.9%) | 75 (3.4%) |
| $30,000 to $34,999 | 185 (6.6%) | 175 (8.0%) |
| $35,000 to $39,999 | 103 (3.7%) | 115 (5.3%) |
| $40,000 to $44,999 | 67 (2.4%) | 62 (2.8%) |
| $45,000 to $49,999 | 119 (4.2%) | 46 (2.1%) |
| $50,000 to $54,999 | 168 (6.0%) | 54 (2.5%) |
| $55,000 to $64,999 | 220 (7.8%) | 101 (4.6%) |
| $65,000 to $74,999 | 146 (5.2%) | 201 (9.2%) |
| $75,000 to $99,999 | 369 (13.1%) | 326 (14.9%) |
| $100,000+ | 500 (17.8%) | 360 (16.5%) |
| Total | 2,814 (100.0%) | 2,181 (100.0%) |
Earnings by Sex by Educational Attainment in Rodeo
Average earnings in Rodeo are $55,885 for men and $55,407 for women, a difference of 0.9%. Men with an educational attainment of college or associate's degree enjoy the highest average annual earnings of $81,616, while those with bachelor's degree education earn the least with $40,444. Women with an educational attainment of bachelor's degree earn the most with the average annual earnings of $77,074, while those with less than high school education have the smallest earnings of $34,391.
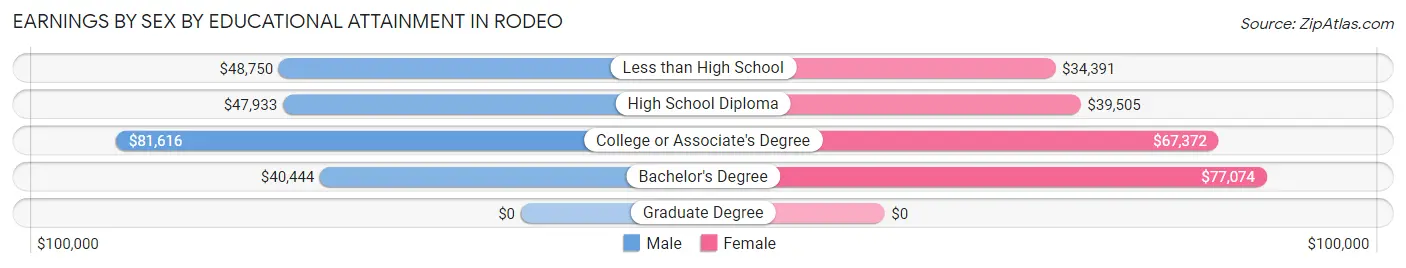
| Educational Attainment | Male Income | Female Income |
| Less than High School | $48,750 | $34,391 |
| High School Diploma | $47,933 | $39,505 |
| College or Associate's Degree | $81,616 | $67,372 |
| Bachelor's Degree | $40,444 | $77,074 |
| Graduate Degree | - | - |
| Total | $55,885 | $55,407 |
Family Income in Rodeo
Family Income Brackets in Rodeo
According to the Rodeo family income data, there are 532 families falling into the $100,000 to $149,999 income range, which is the most common income bracket and makes up 22.5% of all families. Conversely, the $25,000 to $34,999 income bracket is the least frequent group with only 12 families (0.5%) belonging to this category.
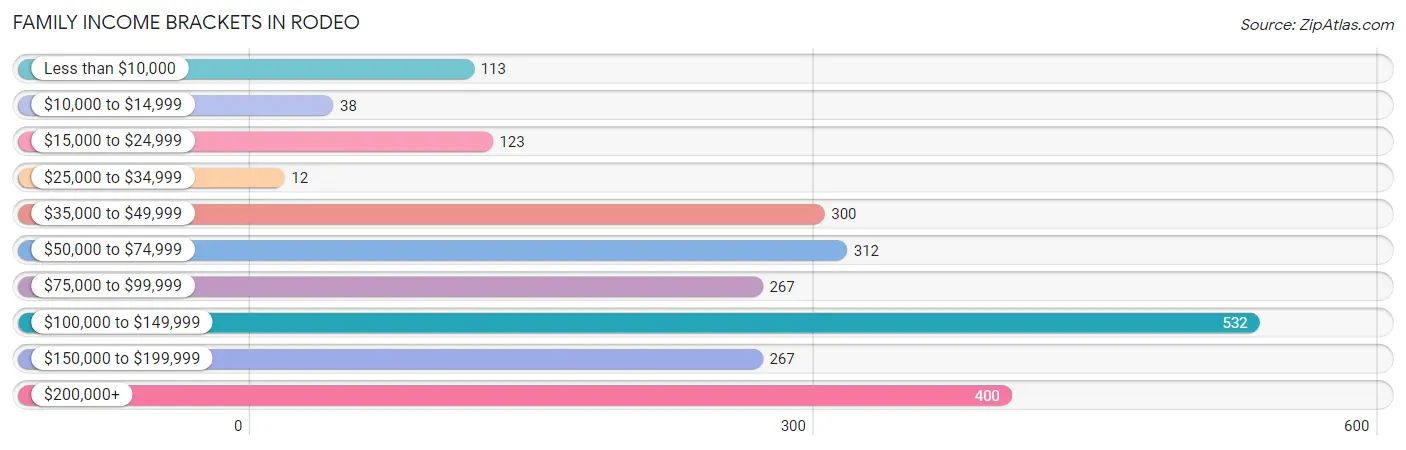
| Income Bracket | # Families | % Families |
| Less than $10,000 | 113 | 4.8% |
| $10,000 to $14,999 | 38 | 1.6% |
| $15,000 to $24,999 | 123 | 5.2% |
| $25,000 to $34,999 | 12 | 0.5% |
| $35,000 to $49,999 | 300 | 12.7% |
| $50,000 to $74,999 | 312 | 13.2% |
| $75,000 to $99,999 | 267 | 11.3% |
| $100,000 to $149,999 | 532 | 22.5% |
| $150,000 to $199,999 | 267 | 11.3% |
| $200,000+ | 400 | 16.9% |
Family Income by Famaliy Size in Rodeo
6-person families (176 | 7.4%) account for the highest median family income in Rodeo with $199,028 per family, while 2-person families (1,071 | 45.3%) have the highest median income of $35,504 per family member.
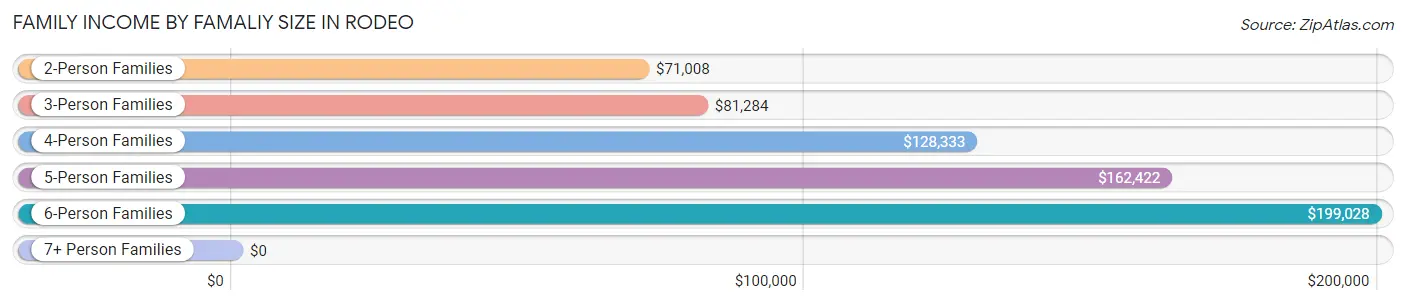
| Income Bracket | # Families | Median Income |
| 2-Person Families | 1,071 (45.3%) | $71,008 |
| 3-Person Families | 506 (21.4%) | $81,284 |
| 4-Person Families | 354 (15.0%) | $128,333 |
| 5-Person Families | 203 (8.6%) | $162,422 |
| 6-Person Families | 176 (7.4%) | $199,028 |
| 7+ Person Families | 54 (2.3%) | $0 |
| Total | 2,364 (100.0%) | $100,769 |
Family Income by Number of Earners in Rodeo
The median family income in Rodeo is $100,769, with families comprising 3+ earners (407) having the highest median family income of $204,010, while families with no earners (418) have the lowest median family income of $55,391, accounting for 17.2% and 17.7% of families, respectively.
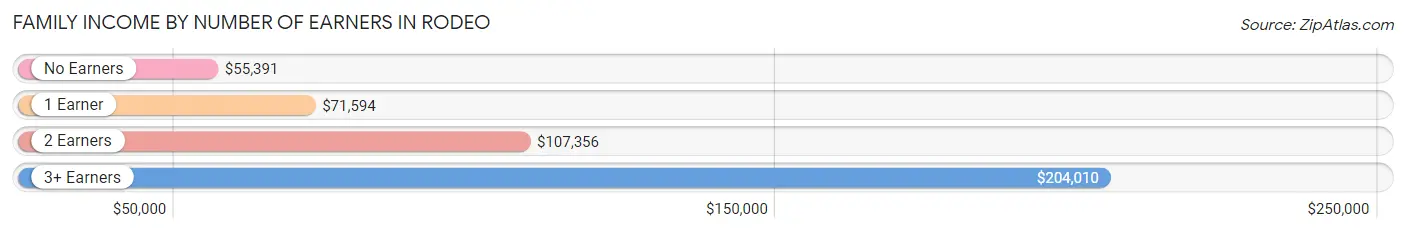
| Number of Earners | # Families | Median Income |
| No Earners | 418 (17.7%) | $55,391 |
| 1 Earner | 665 (28.1%) | $71,594 |
| 2 Earners | 874 (37.0%) | $107,356 |
| 3+ Earners | 407 (17.2%) | $204,010 |
| Total | 2,364 (100.0%) | $100,769 |
Household Income in Rodeo
Household Income Brackets in Rodeo
With 633 households falling in the category, the $100,000 to $149,999 income range is the most frequent in Rodeo, accounting for 20.7% of all households. In contrast, only 83 households (2.7%) fall into the $10,000 to $14,999 income bracket, making it the least populous group.
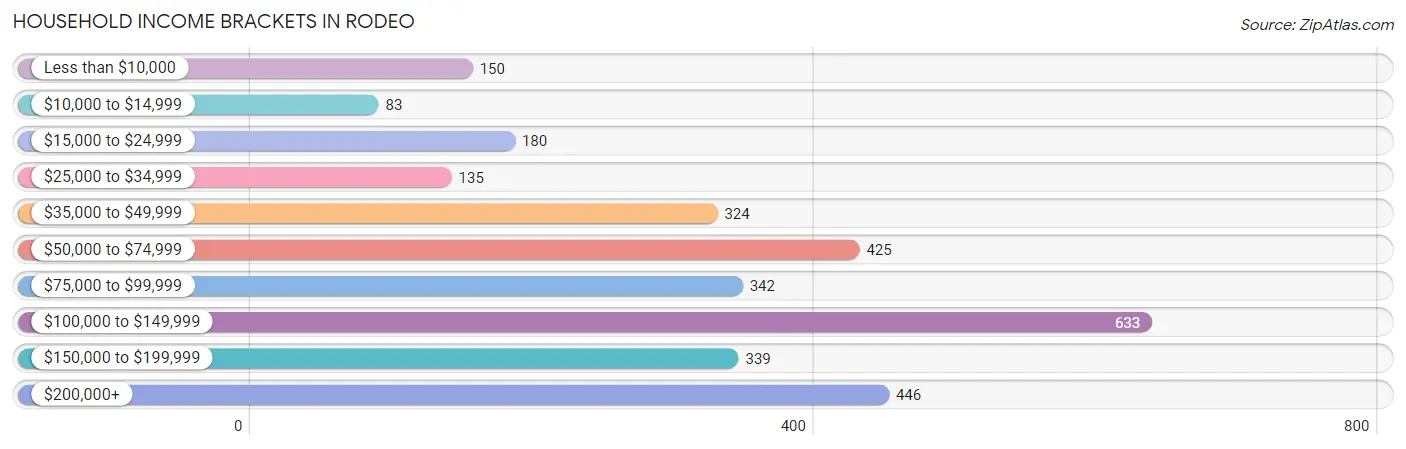
| Income Bracket | # Households | % Households |
| Less than $10,000 | 150 | 4.9% |
| $10,000 to $14,999 | 83 | 2.7% |
| $15,000 to $24,999 | 180 | 5.9% |
| $25,000 to $34,999 | 135 | 4.4% |
| $35,000 to $49,999 | 324 | 10.6% |
| $50,000 to $74,999 | 425 | 13.9% |
| $75,000 to $99,999 | 342 | 11.2% |
| $100,000 to $149,999 | 633 | 20.7% |
| $150,000 to $199,999 | 339 | 11.1% |
| $200,000+ | 446 | 14.6% |
Household Income by Householder Age in Rodeo
The median household income in Rodeo is $91,875, with the highest median household income of $120,417 found in the 45 to 64 years age bracket for the primary householder. A total of 1,111 households (36.3%) fall into this category.
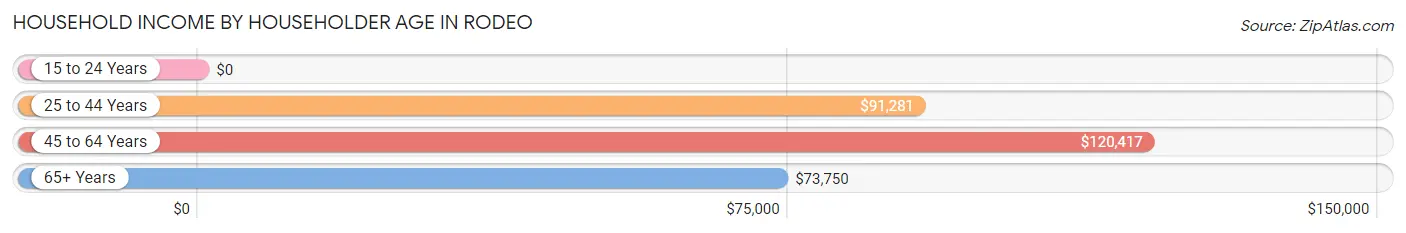
| Income Bracket | # Households | Median Income |
| 15 to 24 Years | 0 (0.0%) | $0 |
| 25 to 44 Years | 1,089 (35.6%) | $91,281 |
| 45 to 64 Years | 1,111 (36.3%) | $120,417 |
| 65+ Years | 858 (28.1%) | $73,750 |
| Total | 3,058 (100.0%) | $91,875 |
Poverty in Rodeo
Income Below Poverty by Sex and Age in Rodeo
With 8.8% poverty level for males and 10.4% for females among the residents of Rodeo, 15 year old males and 15 year old females are the most vulnerable to poverty, with 50 males (80.6%) and 31 females (43.7%) in their respective age groups living below the poverty level.
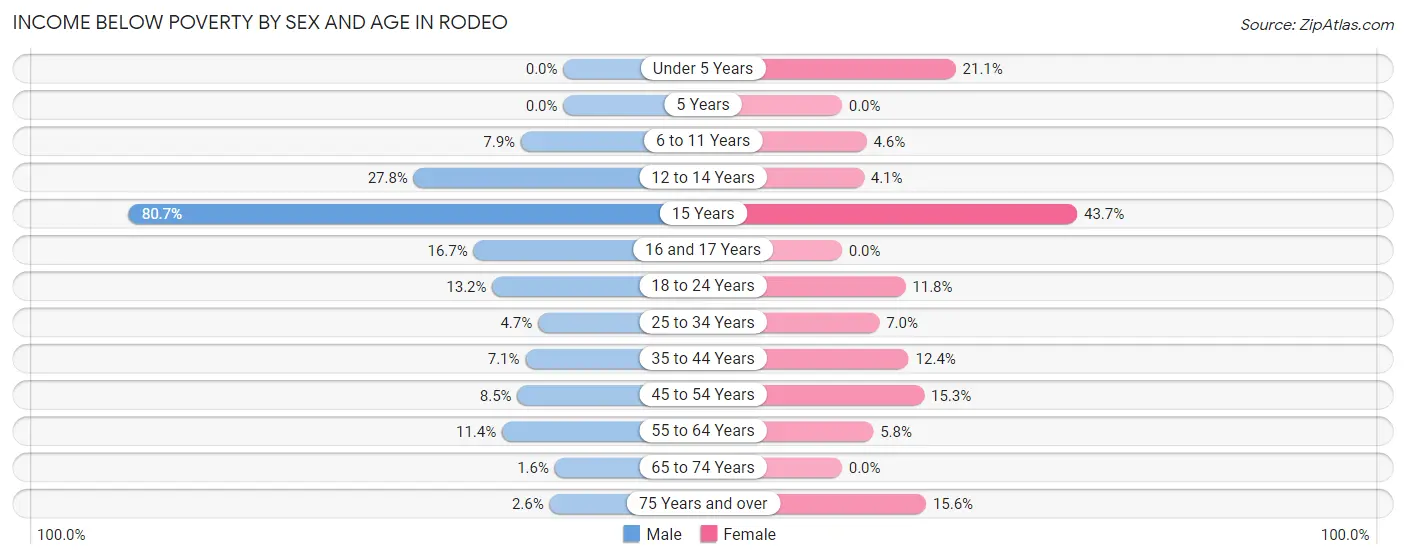
| Age Bracket | Male | Female |
| Under 5 Years | 0 (0.0%) | 82 (21.1%) |
| 5 Years | 0 (0.0%) | 0 (0.0%) |
| 6 to 11 Years | 23 (7.9%) | 14 (4.6%) |
| 12 to 14 Years | 30 (27.8%) | 8 (4.1%) |
| 15 Years | 50 (80.6%) | 31 (43.7%) |
| 16 and 17 Years | 31 (16.7%) | 0 (0.0%) |
| 18 to 24 Years | 68 (13.2%) | 40 (11.8%) |
| 25 to 34 Years | 35 (4.7%) | 37 (7.0%) |
| 35 to 44 Years | 55 (7.0%) | 101 (12.4%) |
| 45 to 54 Years | 39 (8.5%) | 89 (15.3%) |
| 55 to 64 Years | 62 (11.4%) | 31 (5.8%) |
| 65 to 74 Years | 6 (1.6%) | 0 (0.0%) |
| 75 Years and over | 10 (2.6%) | 55 (15.6%) |
| Total | 409 (8.8%) | 488 (10.4%) |
Income Above Poverty by Sex and Age in Rodeo
According to the poverty statistics in Rodeo, males aged under 5 years and females aged 5 years are the age groups that are most secure financially, with 100.0% of males and 100.0% of females in these age groups living above the poverty line.
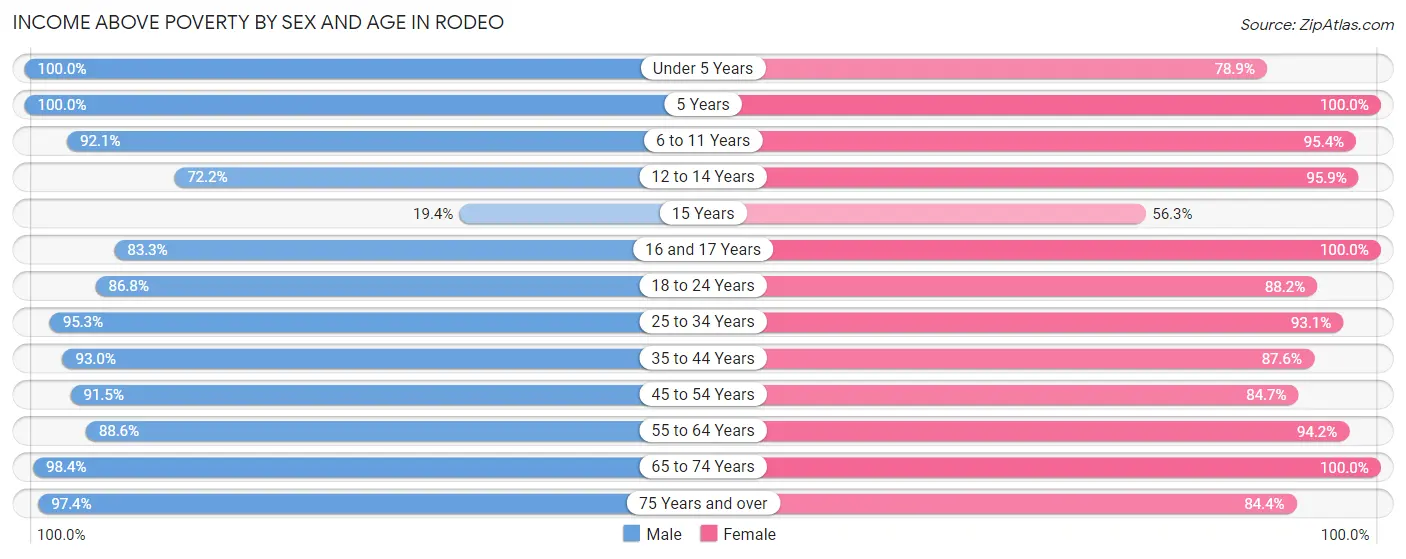
| Age Bracket | Male | Female |
| Under 5 Years | 159 (100.0%) | 306 (78.9%) |
| 5 Years | 10 (100.0%) | 66 (100.0%) |
| 6 to 11 Years | 269 (92.1%) | 292 (95.4%) |
| 12 to 14 Years | 78 (72.2%) | 188 (95.9%) |
| 15 Years | 12 (19.4%) | 40 (56.3%) |
| 16 and 17 Years | 155 (83.3%) | 79 (100.0%) |
| 18 to 24 Years | 448 (86.8%) | 299 (88.2%) |
| 25 to 34 Years | 711 (95.3%) | 495 (93.0%) |
| 35 to 44 Years | 725 (92.9%) | 713 (87.6%) |
| 45 to 54 Years | 418 (91.5%) | 494 (84.7%) |
| 55 to 64 Years | 483 (88.6%) | 500 (94.2%) |
| 65 to 74 Years | 371 (98.4%) | 444 (100.0%) |
| 75 Years and over | 380 (97.4%) | 297 (84.4%) |
| Total | 4,219 (91.2%) | 4,213 (89.6%) |
Income Below Poverty Among Married-Couple Families in Rodeo
The poverty statistics for married-couple families in Rodeo show that 1.9% or 28 of the total 1,476 families live below the poverty line. Families with 1 or 2 children have the highest poverty rate of 3.2%, comprising of 18 families. On the other hand, families with 3 or 4 children have the lowest poverty rate of 0.0%, which includes 0 families.
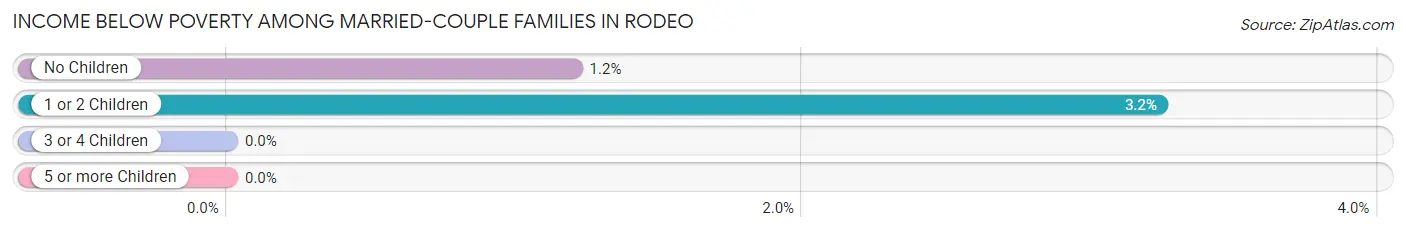
| Children | Above Poverty | Below Poverty |
| No Children | 826 (98.8%) | 10 (1.2%) |
| 1 or 2 Children | 538 (96.8%) | 18 (3.2%) |
| 3 or 4 Children | 84 (100.0%) | 0 (0.0%) |
| 5 or more Children | 0 (0.0%) | 0 (0.0%) |
| Total | 1,448 (98.1%) | 28 (1.9%) |
Income Below Poverty Among Single-Parent Households in Rodeo
According to the poverty data in Rodeo, 5.5% or 17 single-father households and 30.8% or 178 single-mother households are living below the poverty line. Among single-father households, those with 1 or 2 children have the highest poverty rate, with 17 households (32.7%) experiencing poverty. Likewise, among single-mother households, those with 1 or 2 children have the highest poverty rate, with 117 households (44.2%) falling below the poverty line.
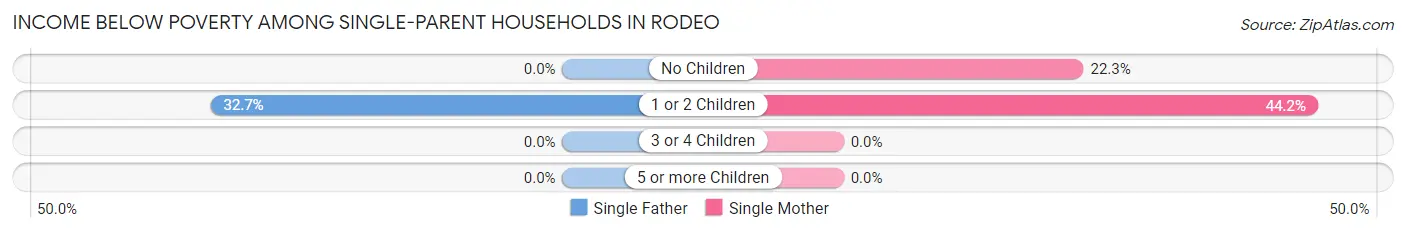
| Children | Single Father | Single Mother |
| No Children | 0 (0.0%) | 61 (22.3%) |
| 1 or 2 Children | 17 (32.7%) | 117 (44.2%) |
| 3 or 4 Children | 0 (0.0%) | 0 (0.0%) |
| 5 or more Children | 0 (0.0%) | 0 (0.0%) |
| Total | 17 (5.5%) | 178 (30.8%) |
Income Below Poverty Among Married-Couple vs Single-Parent Households in Rodeo
The poverty data for Rodeo shows that 28 of the married-couple family households (1.9%) and 195 of the single-parent households (22.0%) are living below the poverty level. Within the married-couple family households, those with 1 or 2 children have the highest poverty rate, with 18 households (3.2%) falling below the poverty line. Among the single-parent households, those with 1 or 2 children have the highest poverty rate, with 134 household (42.3%) living below poverty.
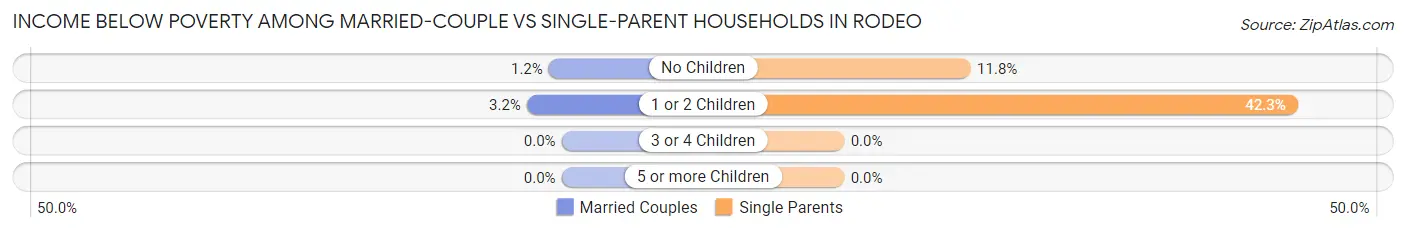
| Children | Married-Couple Families | Single-Parent Households |
| No Children | 10 (1.2%) | 61 (11.8%) |
| 1 or 2 Children | 18 (3.2%) | 134 (42.3%) |
| 3 or 4 Children | 0 (0.0%) | 0 (0.0%) |
| 5 or more Children | 0 (0.0%) | 0 (0.0%) |
| Total | 28 (1.9%) | 195 (22.0%) |
Race in Rodeo
The most populous races in Rodeo are White / Caucasian (2,978 | 31.9%), Hispanic or Latino (2,537 | 27.2%), and Asian (2,134 | 22.9%).
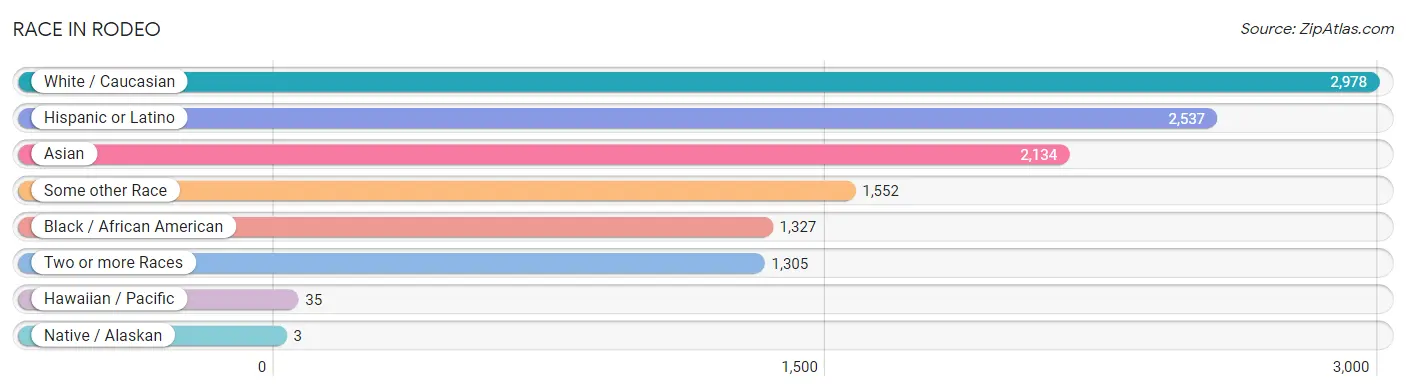
| Race | # Population | % Population |
| Asian | 2,134 | 22.9% |
| Black / African American | 1,327 | 14.2% |
| Hawaiian / Pacific | 35 | 0.4% |
| Hispanic or Latino | 2,537 | 27.2% |
| Native / Alaskan | 3 | 0.0% |
| White / Caucasian | 2,978 | 31.9% |
| Two or more Races | 1,305 | 14.0% |
| Some other Race | 1,552 | 16.6% |
| Total | 9,334 | 100.0% |
Ancestry in Rodeo
The most populous ancestries reported in Rodeo are Korean (1,677 | 18.0%), Mexican (1,592 | 17.1%), German (605 | 6.5%), Irish (542 | 5.8%), and Central American (485 | 5.2%), together accounting for 52.5% of all Rodeo residents.
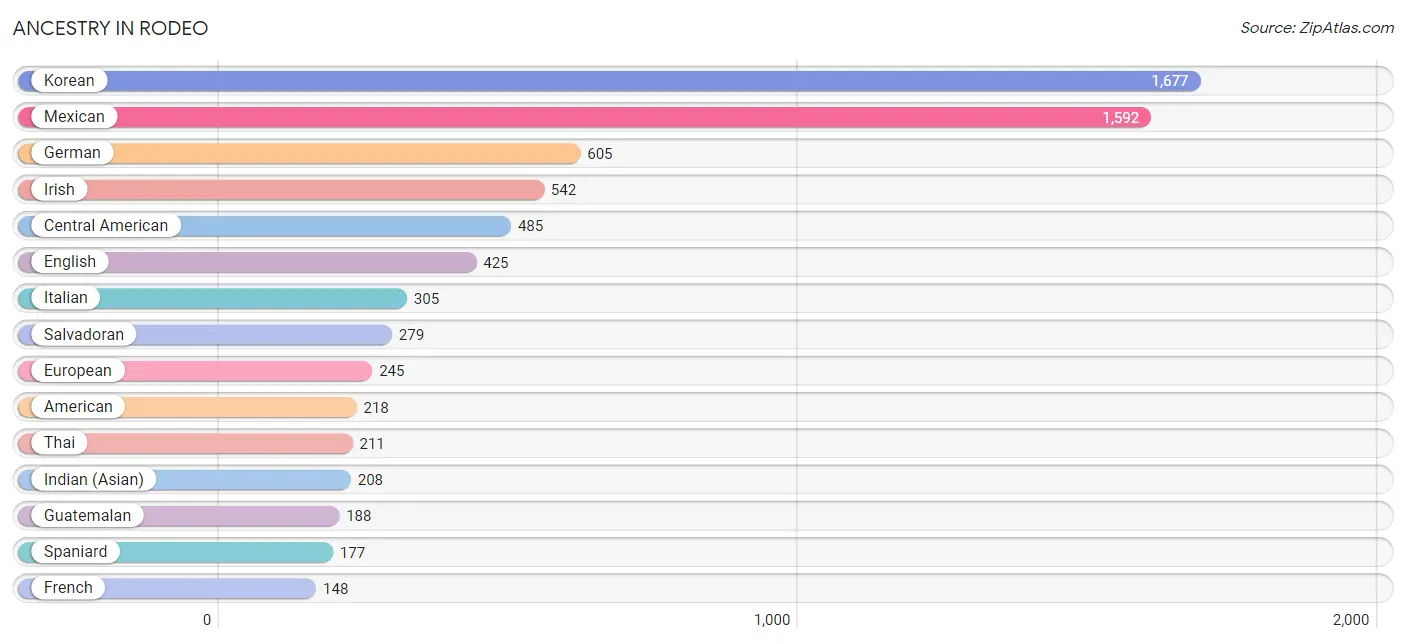
| Ancestry | # Population | % Population |
| American | 218 | 2.3% |
| Arab | 67 | 0.7% |
| Argentinean | 12 | 0.1% |
| Bhutanese | 52 | 0.6% |
| Blackfeet | 14 | 0.2% |
| British | 43 | 0.5% |
| Canadian | 13 | 0.1% |
| Central American | 485 | 5.2% |
| Cherokee | 15 | 0.2% |
| Chippewa | 34 | 0.4% |
| Czech | 23 | 0.3% |
| Danish | 92 | 1.0% |
| Dutch | 130 | 1.4% |
| Ecuadorian | 19 | 0.2% |
| English | 425 | 4.5% |
| Ethiopian | 92 | 1.0% |
| European | 245 | 2.6% |
| French | 148 | 1.6% |
| French Canadian | 10 | 0.1% |
| German | 605 | 6.5% |
| Greek | 31 | 0.3% |
| Guamanian / Chamorro | 92 | 1.0% |
| Guatemalan | 188 | 2.0% |
| Guyanese | 26 | 0.3% |
| Hungarian | 23 | 0.3% |
| Indian (Asian) | 208 | 2.2% |
| Iranian | 25 | 0.3% |
| Irish | 542 | 5.8% |
| Italian | 305 | 3.3% |
| Japanese | 49 | 0.5% |
| Korean | 1,677 | 18.0% |
| Lebanese | 13 | 0.1% |
| Lithuanian | 3 | 0.0% |
| Malaysian | 74 | 0.8% |
| Mexican | 1,592 | 17.1% |
| Native Hawaiian | 98 | 1.1% |
| Nicaraguan | 10 | 0.1% |
| Palestinian | 54 | 0.6% |
| Peruvian | 32 | 0.3% |
| Polish | 24 | 0.3% |
| Portuguese | 83 | 0.9% |
| Puerto Rican | 68 | 0.7% |
| Romanian | 15 | 0.2% |
| Russian | 5 | 0.1% |
| Salvadoran | 279 | 3.0% |
| Scotch-Irish | 54 | 0.6% |
| Scottish | 99 | 1.1% |
| Sioux | 31 | 0.3% |
| Slovak | 5 | 0.1% |
| South American | 63 | 0.7% |
| Spaniard | 177 | 1.9% |
| Spanish | 25 | 0.3% |
| Sri Lankan | 12 | 0.1% |
| Subsaharan African | 114 | 1.2% |
| Swedish | 11 | 0.1% |
| Swiss | 36 | 0.4% |
| Thai | 211 | 2.3% |
| Tongan | 6 | 0.1% | View All 58 Rows |
Immigrants in Rodeo
The most numerous immigrant groups reported in Rodeo came from Asia (1,330 | 14.2%), South Eastern Asia (770 | 8.3%), Philippines (702 | 7.5%), Latin America (678 | 7.3%), and Central America (579 | 6.2%), together accounting for 43.5% of all Rodeo residents.
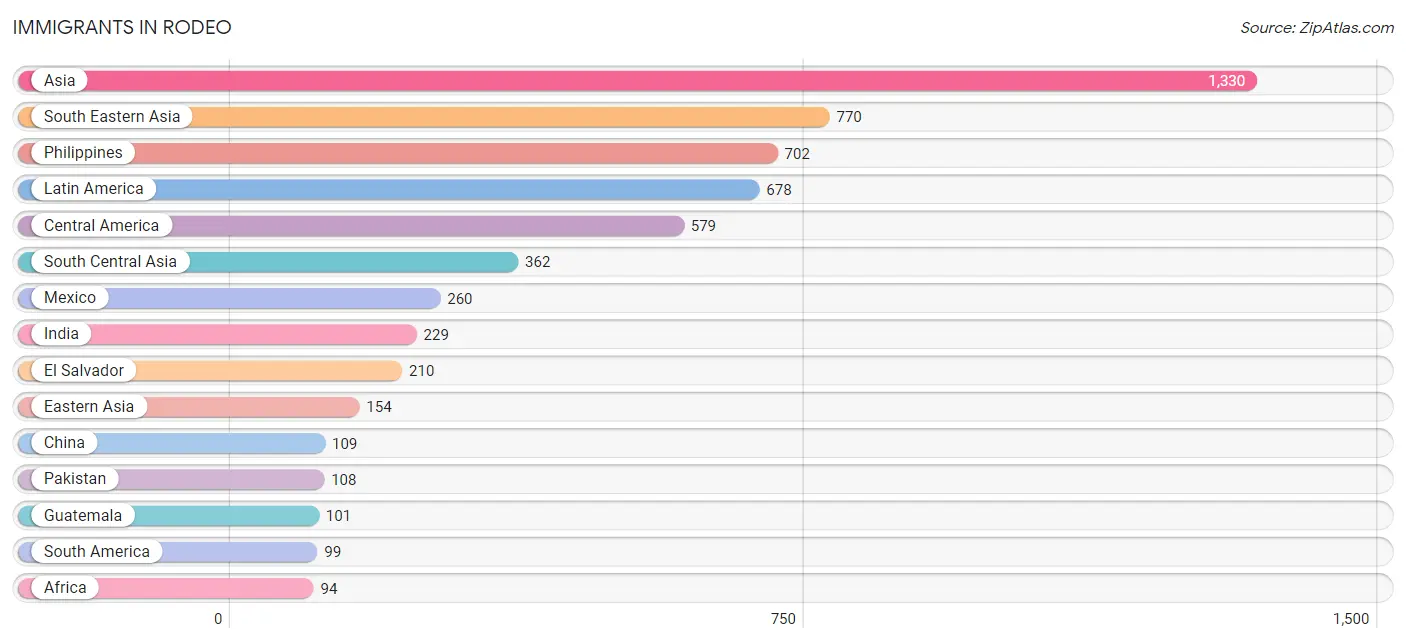
| Immigration Origin | # Population | % Population |
| Africa | 94 | 1.0% |
| Asia | 1,330 | 14.2% |
| Brazil | 10 | 0.1% |
| Cambodia | 4 | 0.0% |
| Central America | 579 | 6.2% |
| China | 109 | 1.2% |
| Czechoslovakia | 14 | 0.2% |
| Eastern Africa | 41 | 0.4% |
| Eastern Asia | 154 | 1.7% |
| Eastern Europe | 14 | 0.2% |
| Ecuador | 19 | 0.2% |
| El Salvador | 210 | 2.2% |
| Ethiopia | 41 | 0.4% |
| Europe | 53 | 0.6% |
| Guatemala | 101 | 1.1% |
| Guyana | 34 | 0.4% |
| Hong Kong | 63 | 0.7% |
| India | 229 | 2.5% |
| Iran | 25 | 0.3% |
| Ireland | 15 | 0.2% |
| Japan | 45 | 0.5% |
| Jordan | 20 | 0.2% |
| Laos | 35 | 0.4% |
| Latin America | 678 | 7.3% |
| Mexico | 260 | 2.8% |
| Nicaragua | 8 | 0.1% |
| Nigeria | 53 | 0.6% |
| Northern Europe | 15 | 0.2% |
| Oceania | 6 | 0.1% |
| Pakistan | 108 | 1.2% |
| Peru | 36 | 0.4% |
| Philippines | 702 | 7.5% |
| Portugal | 24 | 0.3% |
| South America | 99 | 1.1% |
| South Central Asia | 362 | 3.9% |
| South Eastern Asia | 770 | 8.3% |
| Southern Europe | 24 | 0.3% |
| Thailand | 20 | 0.2% |
| Vietnam | 9 | 0.1% |
| Western Africa | 53 | 0.6% |
| Western Asia | 20 | 0.2% | View All 41 Rows |
Sex and Age in Rodeo
Sex and Age in Rodeo
The most populous age groups in Rodeo are 40 to 44 Years (399 | 8.6%) for men and 40 to 44 Years (408 | 8.7%) for women.
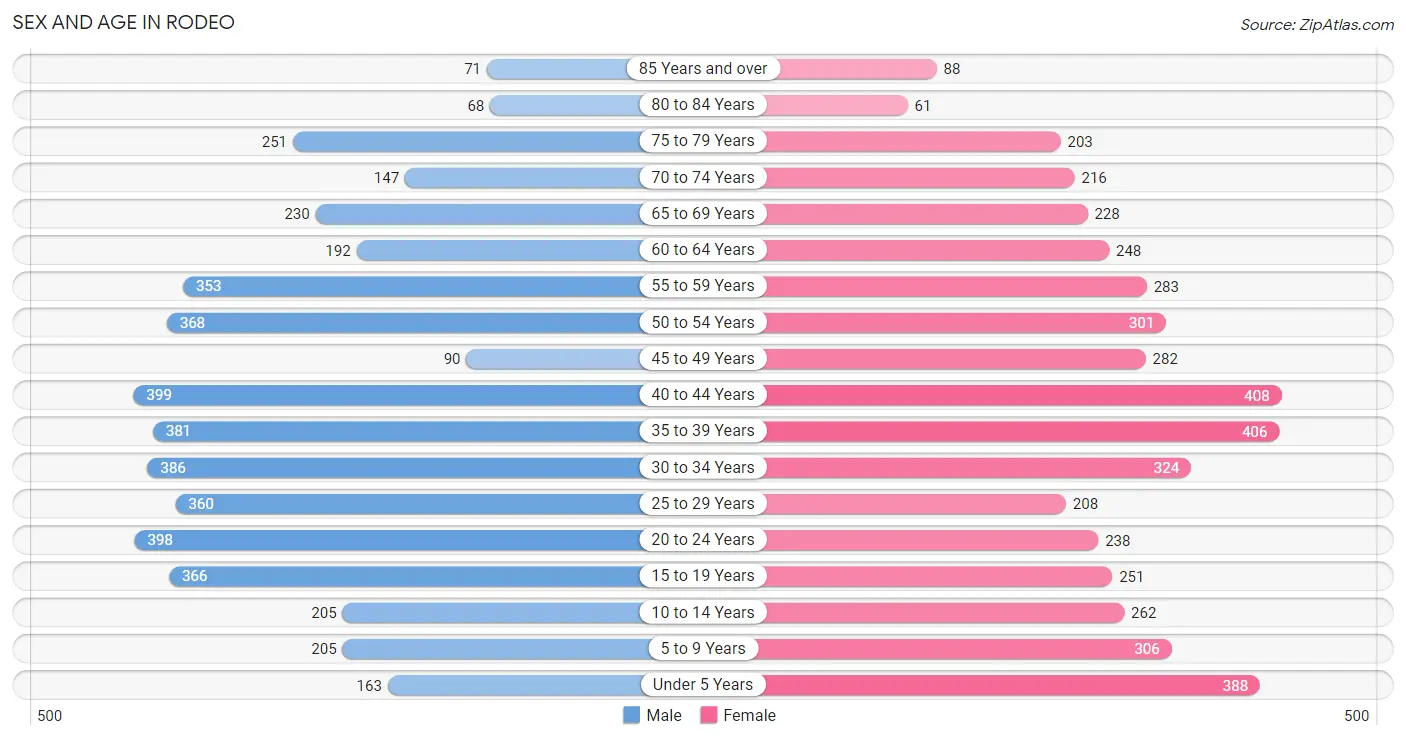
| Age Bracket | Male | Female |
| Under 5 Years | 163 (3.5%) | 388 (8.3%) |
| 5 to 9 Years | 205 (4.4%) | 306 (6.5%) |
| 10 to 14 Years | 205 (4.4%) | 262 (5.6%) |
| 15 to 19 Years | 366 (7.9%) | 251 (5.3%) |
| 20 to 24 Years | 398 (8.6%) | 238 (5.1%) |
| 25 to 29 Years | 360 (7.8%) | 208 (4.4%) |
| 30 to 34 Years | 386 (8.3%) | 324 (6.9%) |
| 35 to 39 Years | 381 (8.2%) | 406 (8.6%) |
| 40 to 44 Years | 399 (8.6%) | 408 (8.7%) |
| 45 to 49 Years | 90 (1.9%) | 282 (6.0%) |
| 50 to 54 Years | 368 (7.9%) | 301 (6.4%) |
| 55 to 59 Years | 353 (7.6%) | 283 (6.0%) |
| 60 to 64 Years | 192 (4.1%) | 248 (5.3%) |
| 65 to 69 Years | 230 (5.0%) | 228 (4.9%) |
| 70 to 74 Years | 147 (3.2%) | 216 (4.6%) |
| 75 to 79 Years | 251 (5.4%) | 203 (4.3%) |
| 80 to 84 Years | 68 (1.5%) | 61 (1.3%) |
| 85 Years and over | 71 (1.5%) | 88 (1.9%) |
| Total | 4,633 (100.0%) | 4,701 (100.0%) |
Families and Households in Rodeo
Median Family Size in Rodeo
The median family size in Rodeo is 3.46 persons per family, with married-couple families (1,476 | 62.4%) accounting for the largest median family size of 3.62 persons per family. On the other hand, single male/father families (310 | 13.1%) represent the smallest median family size with 2.54 persons per family.
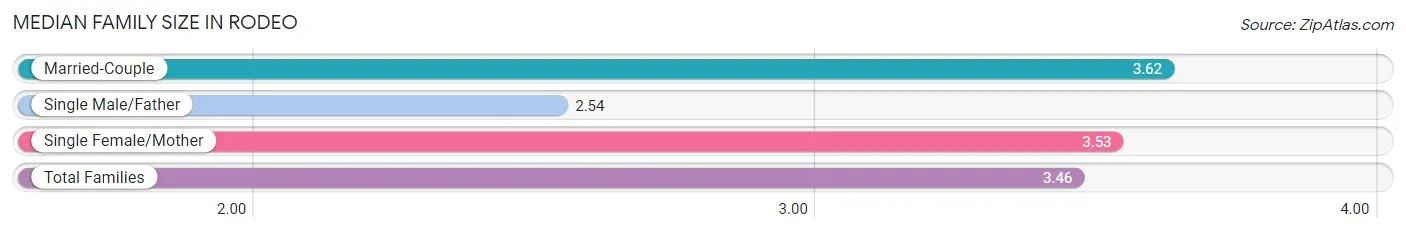
| Family Type | # Families | Family Size |
| Married-Couple | 1,476 (62.4%) | 3.62 |
| Single Male/Father | 310 (13.1%) | 2.54 |
| Single Female/Mother | 578 (24.4%) | 3.53 |
| Total Families | 2,364 (100.0%) | 3.46 |
Median Household Size in Rodeo
The median household size in Rodeo is 3.04 persons per household, with married-couple households (1,476 | 48.3%) accounting for the largest median household size of 3.71 persons per household. non-family households (694 | 22.7%) represent the smallest median household size with 1.27 persons per household.
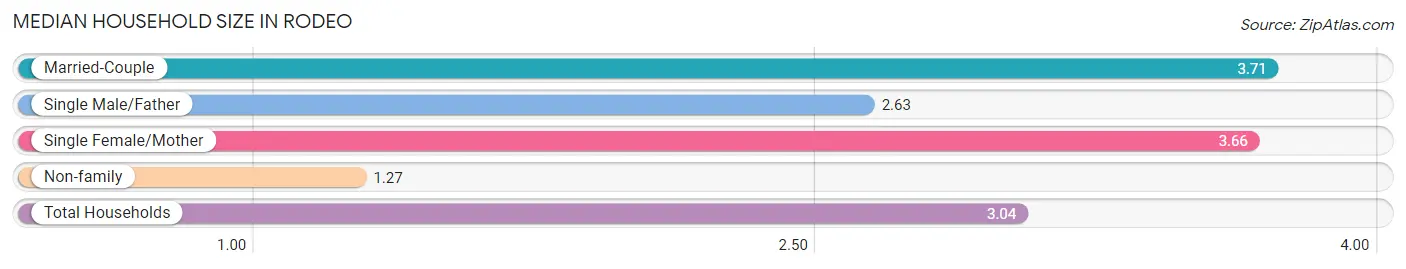
| Household Type | # Households | Household Size |
| Married-Couple | 1,476 (48.3%) | 3.71 |
| Single Male/Father | 310 (10.1%) | 2.63 |
| Single Female/Mother | 578 (18.9%) | 3.66 |
| Non-family | 694 (22.7%) | 1.27 |
| Total Households | 3,058 (100.0%) | 3.04 |
Household Size by Marriage Status in Rodeo
Out of a total of 3,058 households in Rodeo, 2,364 (77.3%) are family households, while 694 (22.7%) are nonfamily households. The most numerous type of family households are 2-person households, comprising 1,000, and the most common type of nonfamily households are 1-person households, comprising 518.
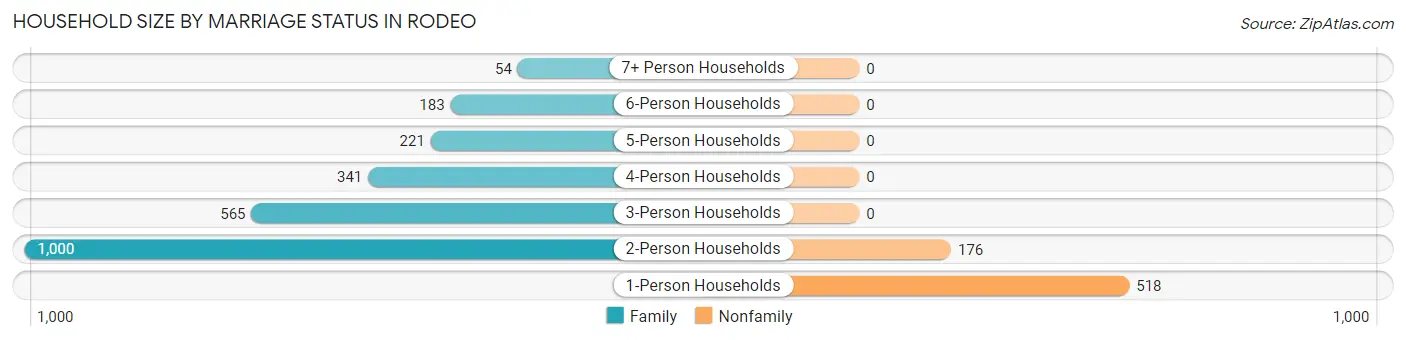
| Household Size | Family Households | Nonfamily Households |
| 1-Person Households | - | 518 (16.9%) |
| 2-Person Households | 1,000 (32.7%) | 176 (5.8%) |
| 3-Person Households | 565 (18.5%) | 0 (0.0%) |
| 4-Person Households | 341 (11.2%) | 0 (0.0%) |
| 5-Person Households | 221 (7.2%) | 0 (0.0%) |
| 6-Person Households | 183 (6.0%) | 0 (0.0%) |
| 7+ Person Households | 54 (1.8%) | 0 (0.0%) |
| Total | 2,364 (77.3%) | 694 (22.7%) |
Female Fertility in Rodeo
Fertility by Age in Rodeo
Average fertility rate in Rodeo is 90.0 births per 1,000 women. Women in the age bracket of 35 to 50 years have the highest fertility rate with 113.0 births per 1,000 women. Women in the age bracket of 35 to 50 years acount for 66.7% of all women with births.
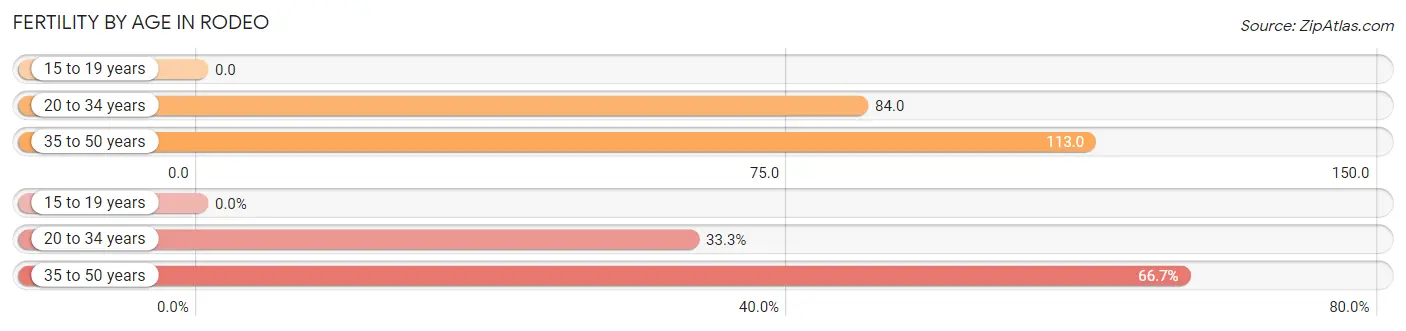
| Age Bracket | Women with Births | Births / 1,000 Women |
| 15 to 19 years | 0 (0.0%) | 0.0 |
| 20 to 34 years | 65 (33.3%) | 84.0 |
| 35 to 50 years | 130 (66.7%) | 113.0 |
| Total | 195 (100.0%) | 90.0 |
Fertility by Age by Marriage Status in Rodeo
67.7% of women with births (195) in Rodeo are married. The highest percentage of unmarried women with births falls into 20 to 34 years age bracket with 64.6% of them unmarried at the time of birth, while the lowest percentage of unmarried women with births belong to 35 to 50 years age bracket with 16.1% of them unmarried.
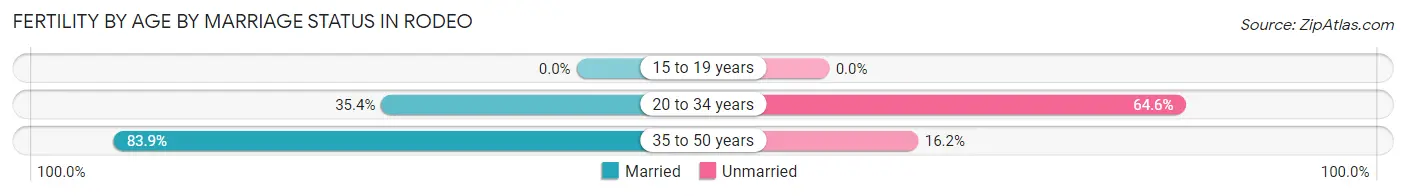
| Age Bracket | Married | Unmarried |
| 15 to 19 years | 0 (0.0%) | 0 (0.0%) |
| 20 to 34 years | 23 (35.4%) | 42 (64.6%) |
| 35 to 50 years | 109 (83.9%) | 21 (16.2%) |
| Total | 132 (67.7%) | 63 (32.3%) |
Fertility by Education in Rodeo
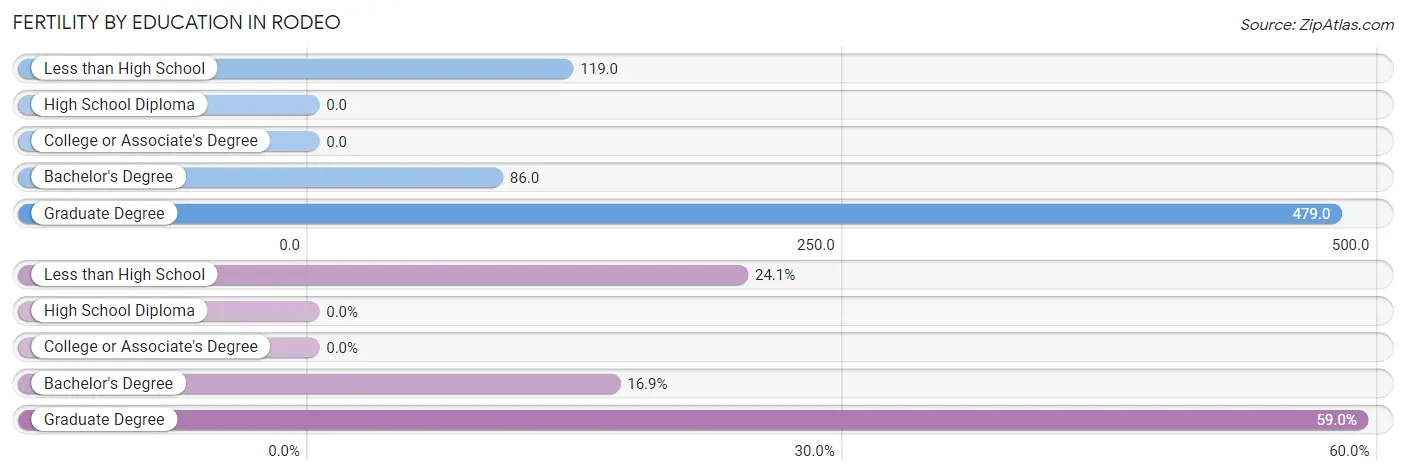
| Educational Attainment | Women with Births | Births / 1,000 Women |
| Less than High School | 47 (24.1%) | 119.0 |
| High School Diploma | 0 (0.0%) | 0.0 |
| College or Associate's Degree | 0 (0.0%) | 0.0 |
| Bachelor's Degree | 33 (16.9%) | 86.0 |
| Graduate Degree | 115 (59.0%) | 479.0 |
| Total | 195 (100.0%) | 90.0 |
Fertility by Education by Marriage Status in Rodeo
32.3% of women with births in Rodeo are unmarried. Women with the educational attainment of bachelor's degree are most likely to be married with 100.0% of them married at childbirth, while women with the educational attainment of less than high school are least likely to be married with 44.7% of them unmarried at childbirth.
| Educational Attainment | Married | Unmarried |
| Less than High School | 26 (55.3%) | 21 (44.7%) |
| High School Diploma | 0 (0.0%) | 0 (0.0%) |
| College or Associate's Degree | 0 (0.0%) | 0 (0.0%) |
| Bachelor's Degree | 33 (100.0%) | 0 (0.0%) |
| Graduate Degree | 73 (63.5%) | 42 (36.5%) |
| Total | 132 (67.7%) | 63 (32.3%) |
Employment Characteristics in Rodeo
Employment by Class of Employer in Rodeo
Among the 4,500 employed individuals in Rodeo, private company employees (2,782 | 61.8%), local government employees (394 | 8.8%), and federal government employees (306 | 6.8%) make up the most common classes of employment.
| Employer Class | # Employees | % Employees |
| Private Company Employees | 2,782 | 61.8% |
| Self-Employed (Incorporated) | 221 | 4.9% |
| Self-Employed (Not Incorporated) | 279 | 6.2% |
| Not-for-profit Organizations | 272 | 6.0% |
| Local Government Employees | 394 | 8.8% |
| State Government Employees | 246 | 5.5% |
| Federal Government Employees | 306 | 6.8% |
| Unpaid Family Workers | 0 | 0.0% |
| Total | 4,500 | 100.0% |
Employment Status by Age in Rodeo
According to the labor force statistics for Rodeo, out of the total population over 16 years of age (7,672), 65.4% or 5,017 individuals are in the labor force, with 7.6% or 381 of them unemployed. The age group with the highest labor force participation rate is 35 to 44 years, with 86.6% or 1,380 individuals in the labor force. Within the labor force, the 20 to 24 years age range has the highest percentage of unemployed individuals, with 35.4% or 164 of them being unemployed.
| Age Bracket | In Labor Force | Unemployed |
| 16 to 19 Years | 192 (39.7%) | 0 (0.0%) |
| 20 to 24 Years | 463 (72.8%) | 164 (35.4%) |
| 25 to 29 Years | 485 (85.4%) | 27 (5.6%) |
| 30 to 34 Years | 580 (81.7%) | 41 (7.1%) |
| 35 to 44 Years | 1,380 (86.6%) | 72 (5.2%) |
| 45 to 54 Years | 762 (73.2%) | 54 (7.1%) |
| 55 to 59 Years | 492 (77.4%) | 0 (0.0%) |
| 60 to 64 Years | 367 (83.4%) | 9 (2.5%) |
| 65 to 74 Years | 236 (28.7%) | 12 (5.1%) |
| 75 Years and over | 58 (7.8%) | 0 (0.0%) |
| Total | 5,017 (65.4%) | 381 (7.6%) |
Employment Status by Educational Attainment in Rodeo
According to labor force statistics for Rodeo, 81.5% of individuals (4,066) out of the total population between 25 and 64 years of age (4,989) are in the labor force, with 5.0% or 203 of them being unemployed. The group with the highest labor force participation rate are those with the educational attainment of bachelor's degree or higher, with 86.5% or 1,272 individuals in the labor force. Within the labor force, individuals with bachelor's degree or higher education have the highest percentage of unemployment, with 8.3% or 106 of them being unemployed.
| Educational Attainment | In Labor Force | Unemployed |
| Less than High School | 601 (73.8%) | 0 (0.0%) |
| High School Diploma | 813 (75.6%) | 0 (0.0%) |
| College / Associate Degree | 1,381 (84.7%) | 116 (7.1%) |
| Bachelor's Degree or higher | 1,272 (86.5%) | 122 (8.3%) |
| Total | 4,066 (81.5%) | 249 (5.0%) |
Employment Occupations by Sex in Rodeo
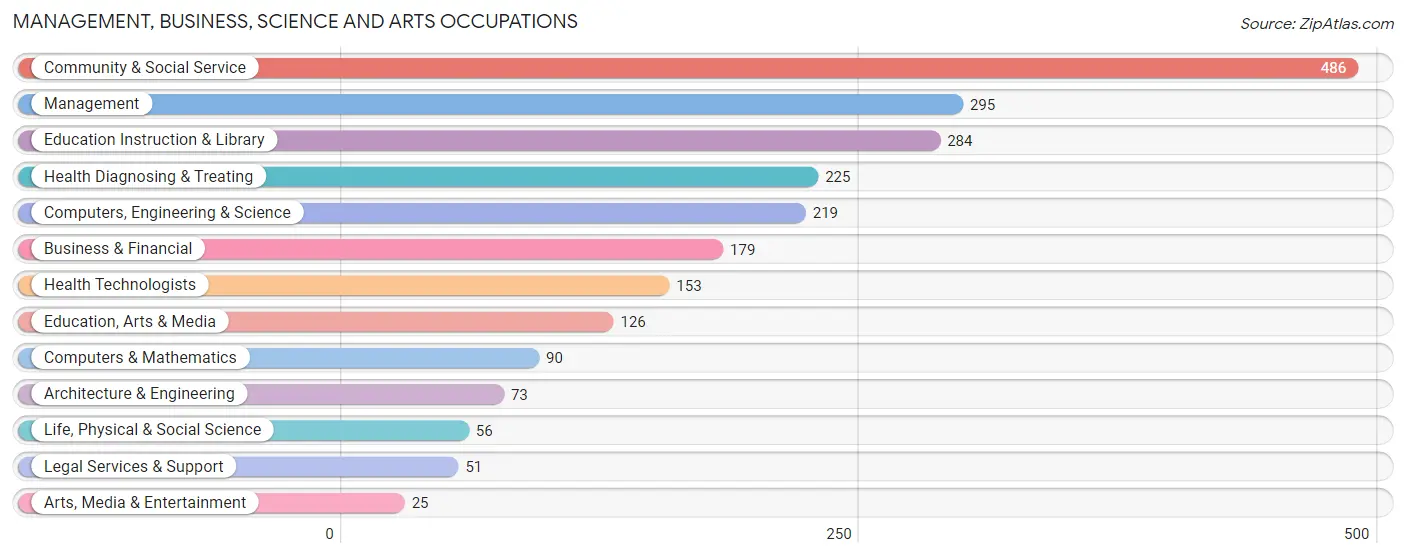
Management, Business, Science and Arts Occupations
The most common Management, Business, Science and Arts occupations in Rodeo are Community & Social Service (486 | 10.5%), Management (295 | 6.4%), Education Instruction & Library (284 | 6.1%), Health Diagnosing & Treating (225 | 4.9%), and Computers, Engineering & Science (219 | 4.7%).
Management, Business, Science and Arts Occupations by Sex
Within the Management, Business, Science and Arts occupations in Rodeo, the most male-oriented occupations are Education, Arts & Media (69.1%), Business & Financial (55.9%), and Computers & Mathematics (52.2%), while the most female-oriented occupations are Arts, Media & Entertainment (100.0%), Life, Physical & Social Science (78.6%), and Health Technologists (73.9%).
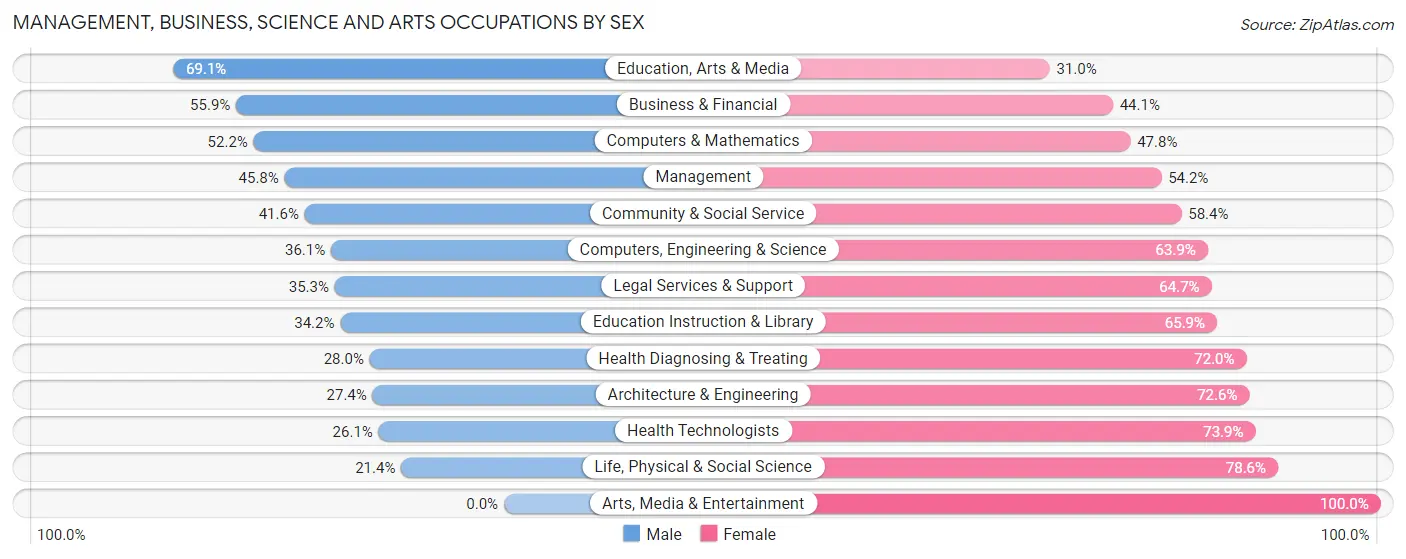
| Occupation | Male | Female |
| Management | 135 (45.8%) | 160 (54.2%) |
| Business & Financial | 100 (55.9%) | 79 (44.1%) |
| Computers, Engineering & Science | 79 (36.1%) | 140 (63.9%) |
| Computers & Mathematics | 47 (52.2%) | 43 (47.8%) |
| Architecture & Engineering | 20 (27.4%) | 53 (72.6%) |
| Life, Physical & Social Science | 12 (21.4%) | 44 (78.6%) |
| Community & Social Service | 202 (41.6%) | 284 (58.4%) |
| Education, Arts & Media | 87 (69.1%) | 39 (30.9%) |
| Legal Services & Support | 18 (35.3%) | 33 (64.7%) |
| Education Instruction & Library | 97 (34.2%) | 187 (65.8%) |
| Arts, Media & Entertainment | 0 (0.0%) | 25 (100.0%) |
| Health Diagnosing & Treating | 63 (28.0%) | 162 (72.0%) |
| Health Technologists | 40 (26.1%) | 113 (73.9%) |
| Total (Category) | 579 (41.2%) | 825 (58.8%) |
| Total (Overall) | 2,649 (57.1%) | 1,987 (42.9%) |
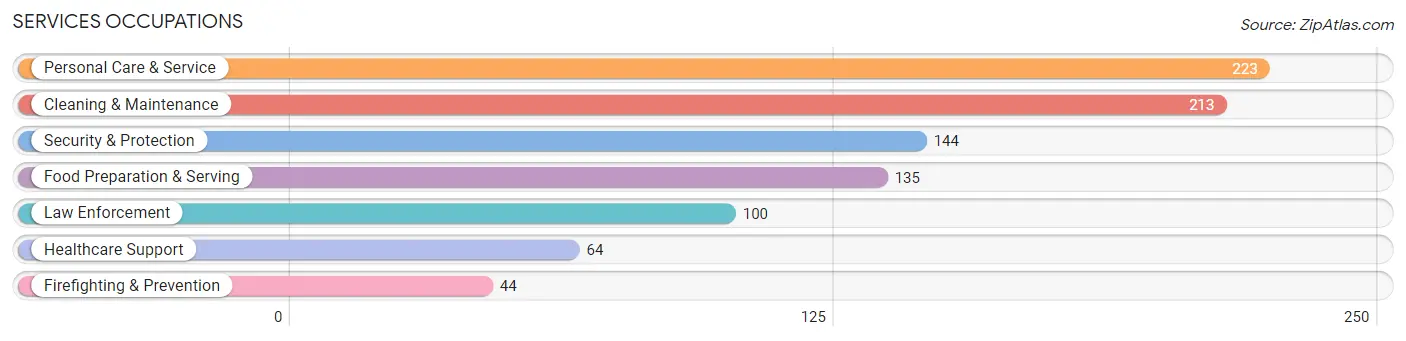
Services Occupations
The most common Services occupations in Rodeo are Personal Care & Service (223 | 4.8%), Cleaning & Maintenance (213 | 4.6%), Security & Protection (144 | 3.1%), Food Preparation & Serving (135 | 2.9%), and Law Enforcement (100 | 2.2%).
Services Occupations by Sex
Within the Services occupations in Rodeo, the most male-oriented occupations are Law Enforcement (100.0%), Security & Protection (76.4%), and Food Preparation & Serving (71.9%), while the most female-oriented occupations are Personal Care & Service (92.4%), Healthcare Support (90.6%), and Firefighting & Prevention (77.3%).
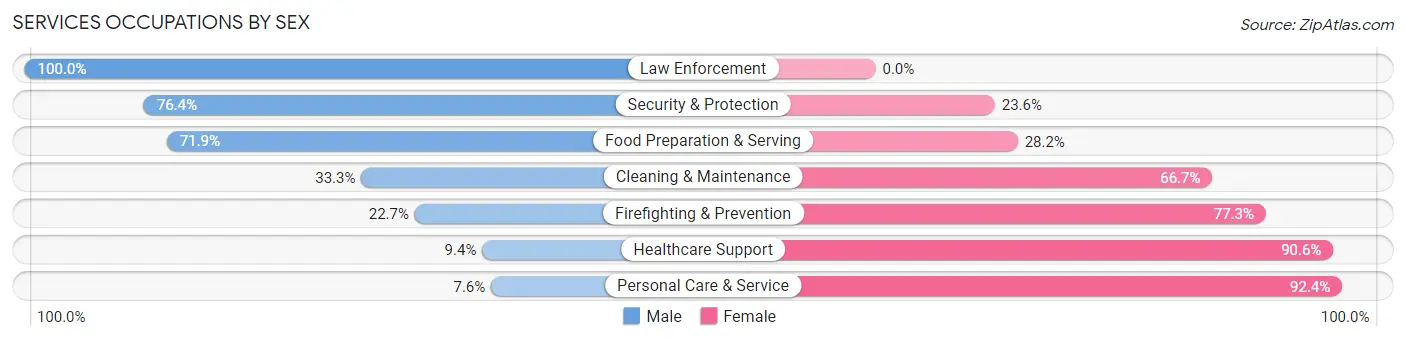
| Occupation | Male | Female |
| Healthcare Support | 6 (9.4%) | 58 (90.6%) |
| Security & Protection | 110 (76.4%) | 34 (23.6%) |
| Firefighting & Prevention | 10 (22.7%) | 34 (77.3%) |
| Law Enforcement | 100 (100.0%) | 0 (0.0%) |
| Food Preparation & Serving | 97 (71.9%) | 38 (28.1%) |
| Cleaning & Maintenance | 71 (33.3%) | 142 (66.7%) |
| Personal Care & Service | 17 (7.6%) | 206 (92.4%) |
| Total (Category) | 301 (38.6%) | 478 (61.4%) |
| Total (Overall) | 2,649 (57.1%) | 1,987 (42.9%) |
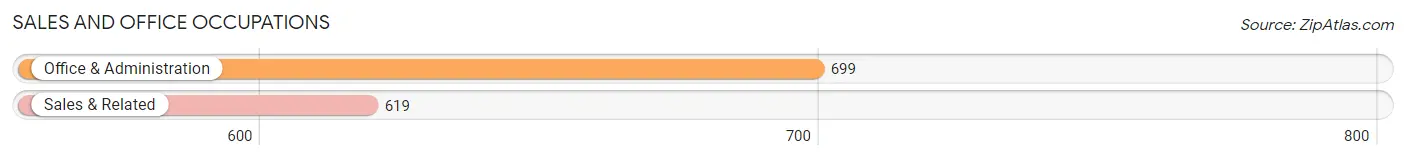
Sales and Office Occupations
The most common Sales and Office occupations in Rodeo are Office & Administration (699 | 15.1%), and Sales & Related (619 | 13.4%).
Sales and Office Occupations by Sex
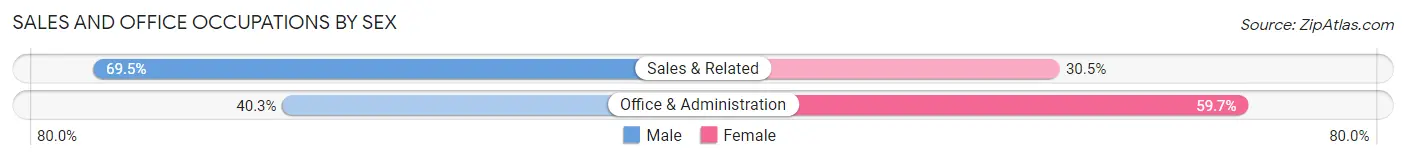
| Occupation | Male | Female |
| Sales & Related | 430 (69.5%) | 189 (30.5%) |
| Office & Administration | 282 (40.3%) | 417 (59.7%) |
| Total (Category) | 712 (54.0%) | 606 (46.0%) |
| Total (Overall) | 2,649 (57.1%) | 1,987 (42.9%) |
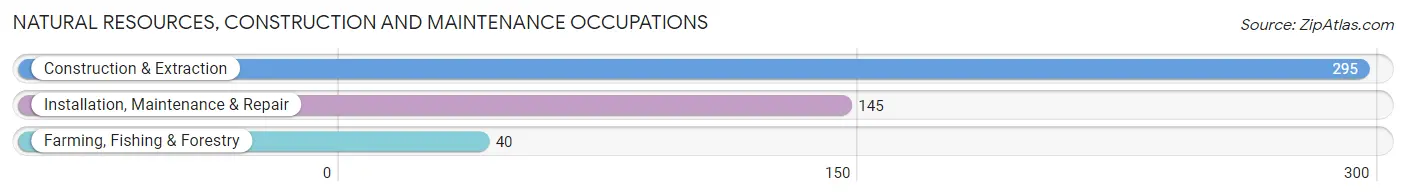
Natural Resources, Construction and Maintenance Occupations
The most common Natural Resources, Construction and Maintenance occupations in Rodeo are Construction & Extraction (295 | 6.4%), Installation, Maintenance & Repair (145 | 3.1%), and Farming, Fishing & Forestry (40 | 0.9%).
Natural Resources, Construction and Maintenance Occupations by Sex
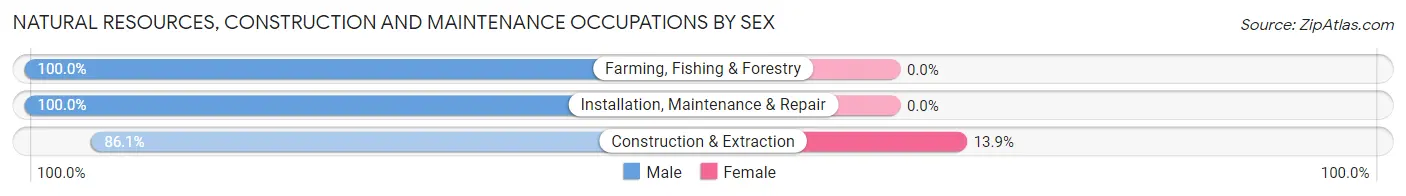
| Occupation | Male | Female |
| Farming, Fishing & Forestry | 40 (100.0%) | 0 (0.0%) |
| Construction & Extraction | 254 (86.1%) | 41 (13.9%) |
| Installation, Maintenance & Repair | 145 (100.0%) | 0 (0.0%) |
| Total (Category) | 439 (91.5%) | 41 (8.5%) |
| Total (Overall) | 2,649 (57.1%) | 1,987 (42.9%) |
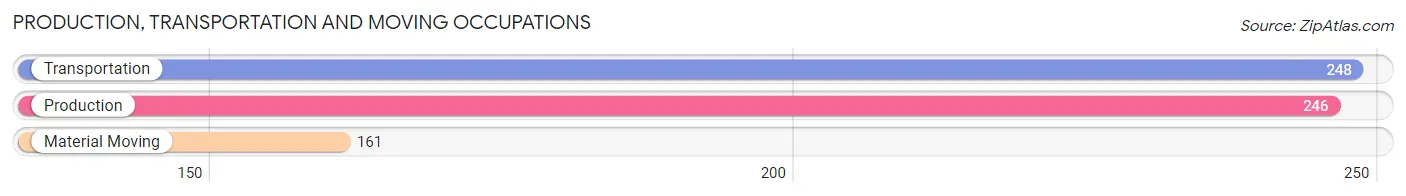
Production, Transportation and Moving Occupations
The most common Production, Transportation and Moving occupations in Rodeo are Transportation (248 | 5.3%), Production (246 | 5.3%), and Material Moving (161 | 3.5%).
Production, Transportation and Moving Occupations by Sex
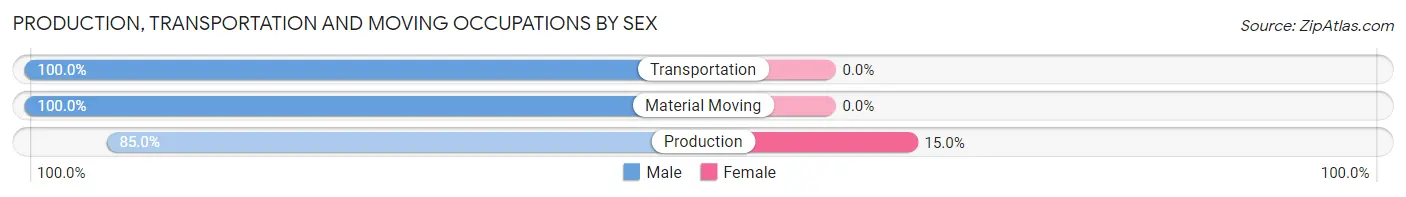
| Occupation | Male | Female |
| Production | 209 (85.0%) | 37 (15.0%) |
| Transportation | 248 (100.0%) | 0 (0.0%) |
| Material Moving | 161 (100.0%) | 0 (0.0%) |
| Total (Category) | 618 (94.4%) | 37 (5.7%) |
| Total (Overall) | 2,649 (57.1%) | 1,987 (42.9%) |
Employment Industries by Sex in Rodeo
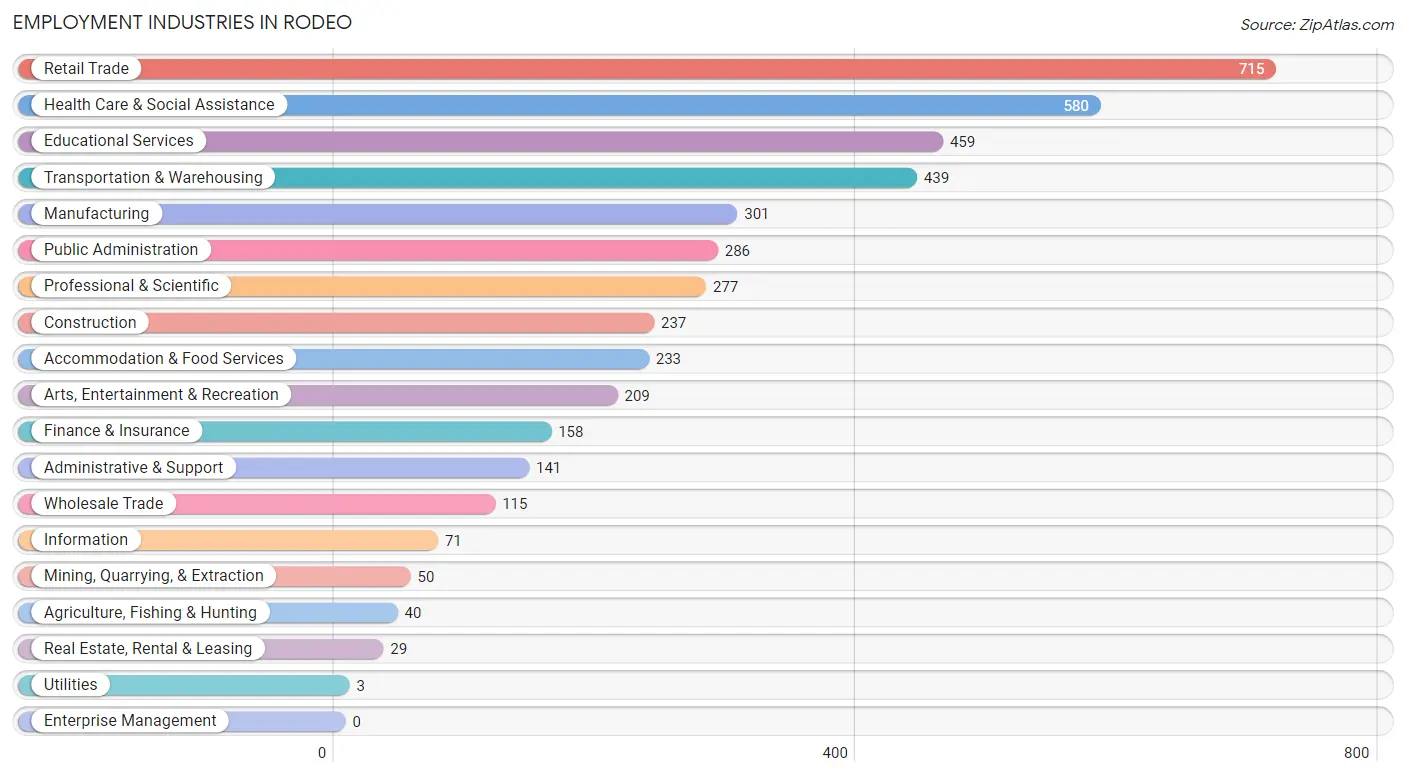
Employment Industries in Rodeo
The major employment industries in Rodeo include Retail Trade (715 | 15.4%), Health Care & Social Assistance (580 | 12.5%), Educational Services (459 | 9.9%), Transportation & Warehousing (439 | 9.5%), and Manufacturing (301 | 6.5%).
Employment Industries by Sex in Rodeo
The Rodeo industries that see more men than women are Agriculture, Fishing & Hunting (100.0%), Mining, Quarrying, & Extraction (100.0%), and Transportation & Warehousing (85.0%), whereas the industries that tend to have a higher number of women are Utilities (100.0%), Arts, Entertainment & Recreation (91.9%), and Health Care & Social Assistance (71.4%).
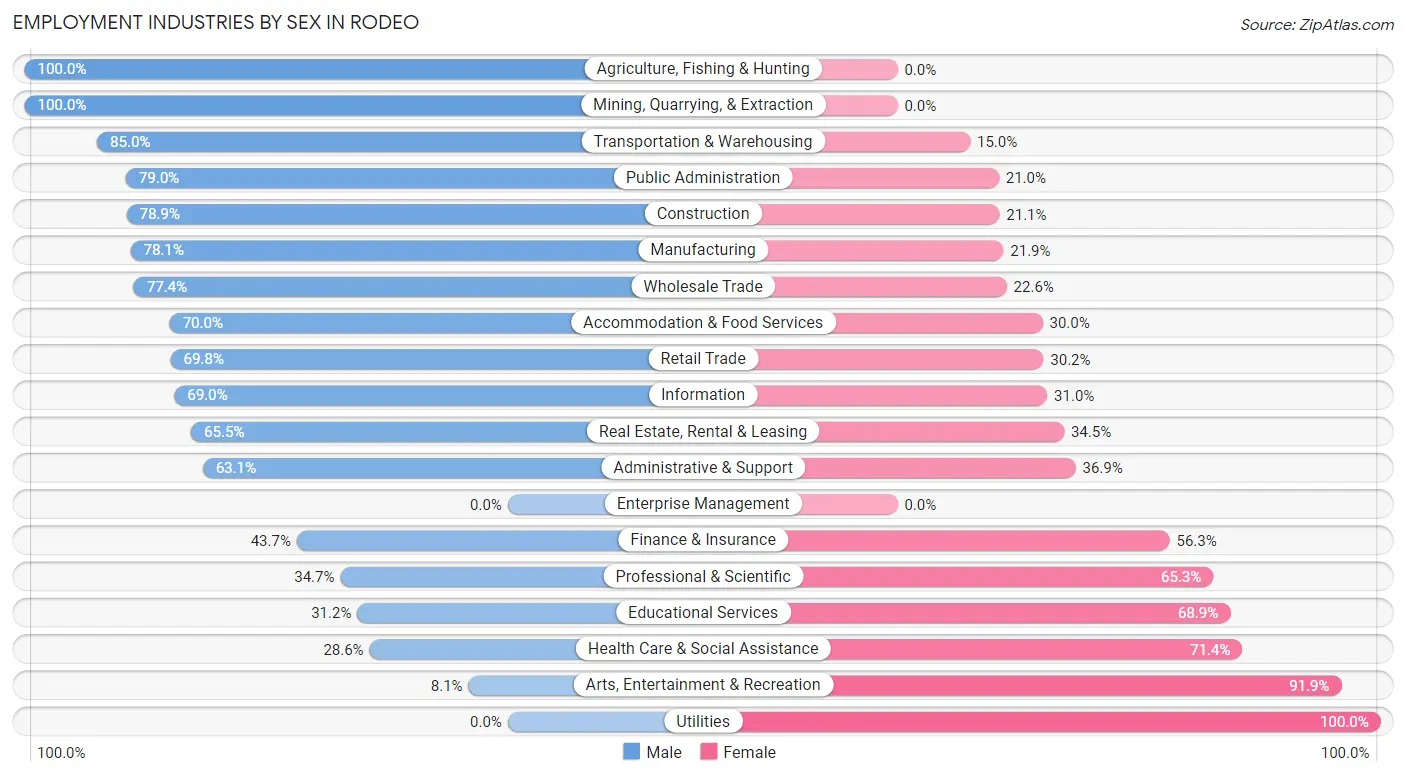
| Industry | Male | Female |
| Agriculture, Fishing & Hunting | 40 (100.0%) | 0 (0.0%) |
| Mining, Quarrying, & Extraction | 50 (100.0%) | 0 (0.0%) |
| Construction | 187 (78.9%) | 50 (21.1%) |
| Manufacturing | 235 (78.1%) | 66 (21.9%) |
| Wholesale Trade | 89 (77.4%) | 26 (22.6%) |
| Retail Trade | 499 (69.8%) | 216 (30.2%) |
| Transportation & Warehousing | 373 (85.0%) | 66 (15.0%) |
| Utilities | 0 (0.0%) | 3 (100.0%) |
| Information | 49 (69.0%) | 22 (31.0%) |
| Finance & Insurance | 69 (43.7%) | 89 (56.3%) |
| Real Estate, Rental & Leasing | 19 (65.5%) | 10 (34.5%) |
| Professional & Scientific | 96 (34.7%) | 181 (65.3%) |
| Enterprise Management | 0 (0.0%) | 0 (0.0%) |
| Administrative & Support | 89 (63.1%) | 52 (36.9%) |
| Educational Services | 143 (31.1%) | 316 (68.9%) |
| Health Care & Social Assistance | 166 (28.6%) | 414 (71.4%) |
| Arts, Entertainment & Recreation | 17 (8.1%) | 192 (91.9%) |
| Accommodation & Food Services | 163 (70.0%) | 70 (30.0%) |
| Public Administration | 226 (79.0%) | 60 (21.0%) |
| Total | 2,649 (57.1%) | 1,987 (42.9%) |
Education in Rodeo
School Enrollment in Rodeo
The most common levels of schooling among the 1,857 students in Rodeo are high school (494 | 26.6%), elementary school (402 | 21.6%), and middle school (384 | 20.7%).
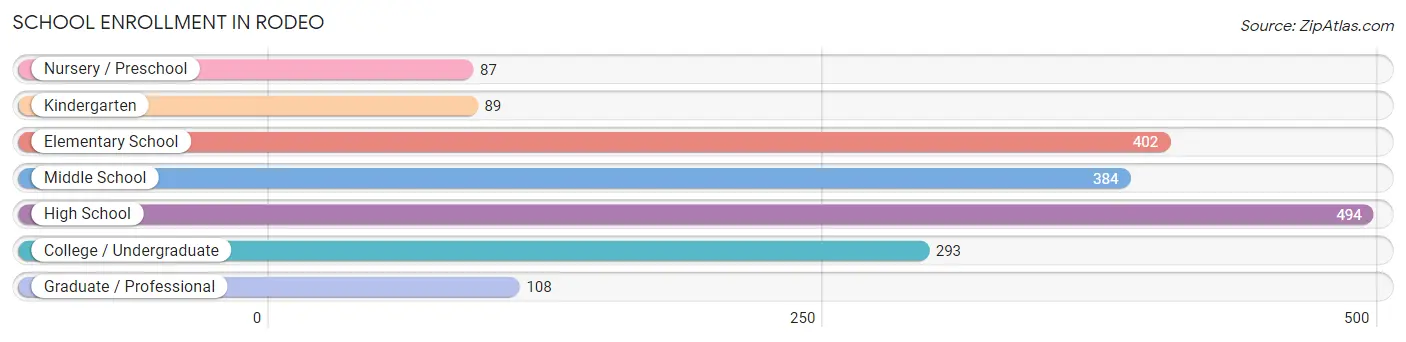
| School Level | # Students | % Students |
| Nursery / Preschool | 87 | 4.7% |
| Kindergarten | 89 | 4.8% |
| Elementary School | 402 | 21.6% |
| Middle School | 384 | 20.7% |
| High School | 494 | 26.6% |
| College / Undergraduate | 293 | 15.8% |
| Graduate / Professional | 108 | 5.8% |
| Total | 1,857 | 100.0% |
School Enrollment by Age by Funding Source in Rodeo
Out of a total of 1,857 students who are enrolled in schools in Rodeo, 277 (14.9%) attend a private institution, while the remaining 1,580 (85.1%) are enrolled in public schools. The age group of 35 years and over has the highest likelihood of being enrolled in private schools, with 62 (64.6% in the age bracket) enrolled. Conversely, the age group of 18 to 19 year olds has the lowest likelihood of being enrolled in a private school, with 163 (98.2% in the age bracket) attending a public institution.
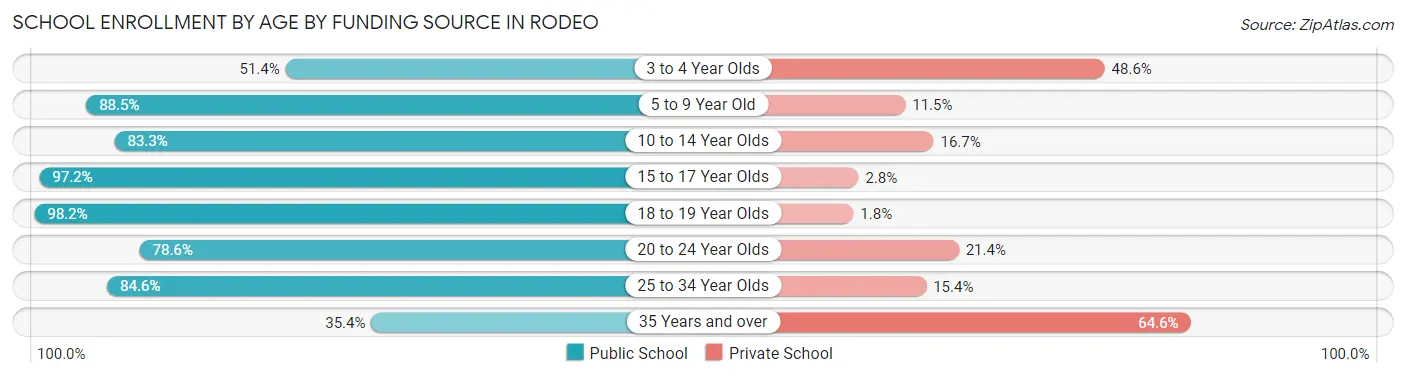
| Age Bracket | Public School | Private School |
| 3 to 4 Year Olds | 37 (51.4%) | 35 (48.6%) |
| 5 to 9 Year Old | 432 (88.5%) | 56 (11.5%) |
| 10 to 14 Year Olds | 373 (83.3%) | 75 (16.7%) |
| 15 to 17 Year Olds | 387 (97.2%) | 11 (2.8%) |
| 18 to 19 Year Olds | 163 (98.2%) | 3 (1.8%) |
| 20 to 24 Year Olds | 77 (78.6%) | 21 (21.4%) |
| 25 to 34 Year Olds | 77 (84.6%) | 14 (15.4%) |
| 35 Years and over | 34 (35.4%) | 62 (64.6%) |
| Total | 1,580 (85.1%) | 277 (14.9%) |
Educational Attainment by Field of Study in Rodeo
Business (521 | 26.5%), engineering (196 | 10.0%), arts & humanities (172 | 8.7%), multidisciplinary studies (166 | 8.4%), and bio, nature & agricultural (154 | 7.8%) are the most common fields of study among 1,970 individuals in Rodeo who have obtained a bachelor's degree or higher.
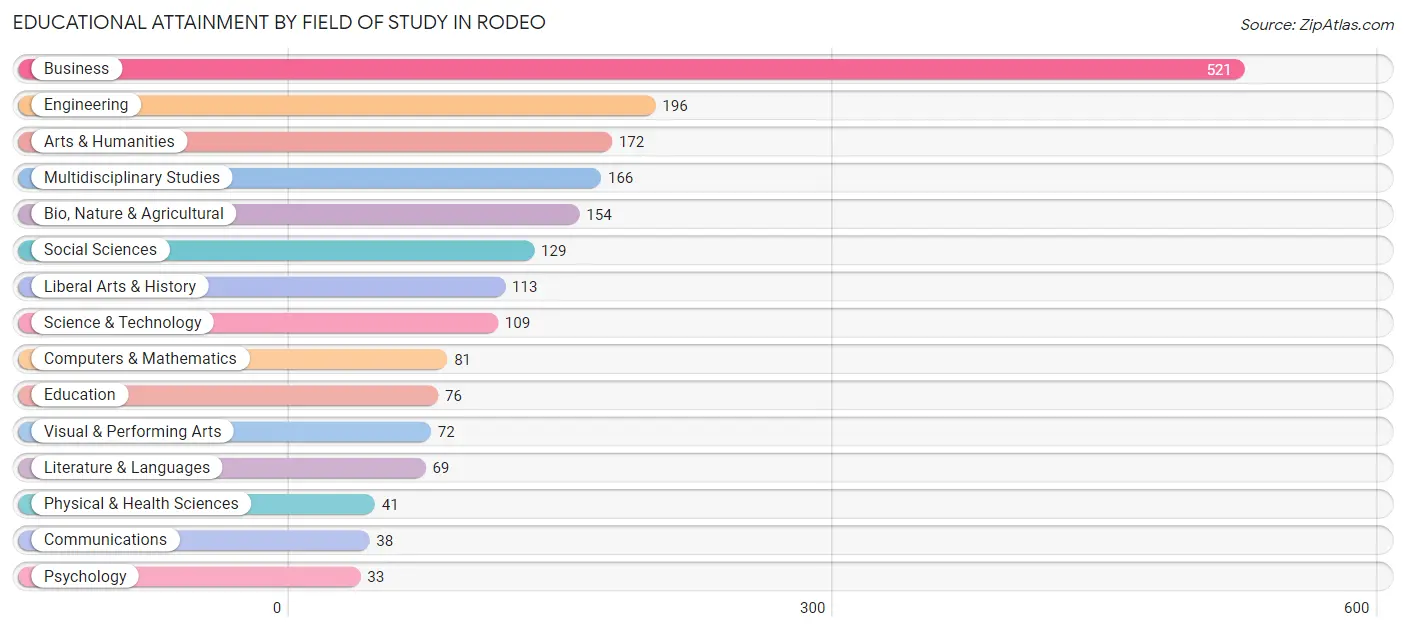
| Field of Study | # Graduates | % Graduates |
| Computers & Mathematics | 81 | 4.1% |
| Bio, Nature & Agricultural | 154 | 7.8% |
| Physical & Health Sciences | 41 | 2.1% |
| Psychology | 33 | 1.7% |
| Social Sciences | 129 | 6.6% |
| Engineering | 196 | 10.0% |
| Multidisciplinary Studies | 166 | 8.4% |
| Science & Technology | 109 | 5.5% |
| Business | 521 | 26.5% |
| Education | 76 | 3.9% |
| Literature & Languages | 69 | 3.5% |
| Liberal Arts & History | 113 | 5.7% |
| Visual & Performing Arts | 72 | 3.6% |
| Communications | 38 | 1.9% |
| Arts & Humanities | 172 | 8.7% |
| Total | 1,970 | 100.0% |
Transportation & Commute in Rodeo
Vehicle Availability by Sex in Rodeo
The most prevalent vehicle ownership categories in Rodeo are males with 2 vehicles (833, accounting for 31.8%) and females with 2 vehicles (557, making up 44.4%).
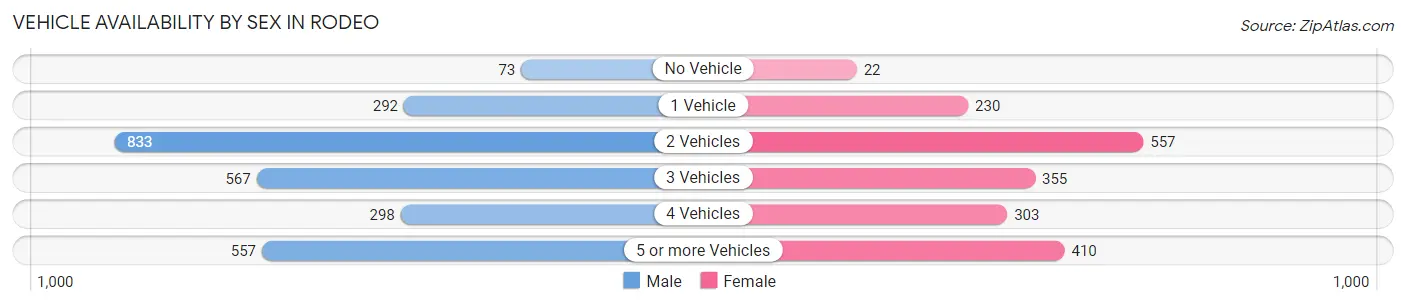
| Vehicles Available | Male | Female |
| No Vehicle | 73 (2.8%) | 22 (1.2%) |
| 1 Vehicle | 292 (11.2%) | 230 (12.2%) |
| 2 Vehicles | 833 (31.8%) | 557 (29.7%) |
| 3 Vehicles | 567 (21.6%) | 355 (18.9%) |
| 4 Vehicles | 298 (11.4%) | 303 (16.1%) |
| 5 or more Vehicles | 557 (21.3%) | 410 (21.8%) |
| Total | 2,620 (100.0%) | 1,877 (100.0%) |
Commute Time in Rodeo
The most frequently occuring commute durations in Rodeo are 30 to 34 minutes (670 commuters, 16.1%), 45 to 59 minutes (601 commuters, 14.4%), and 15 to 19 minutes (468 commuters, 11.2%).
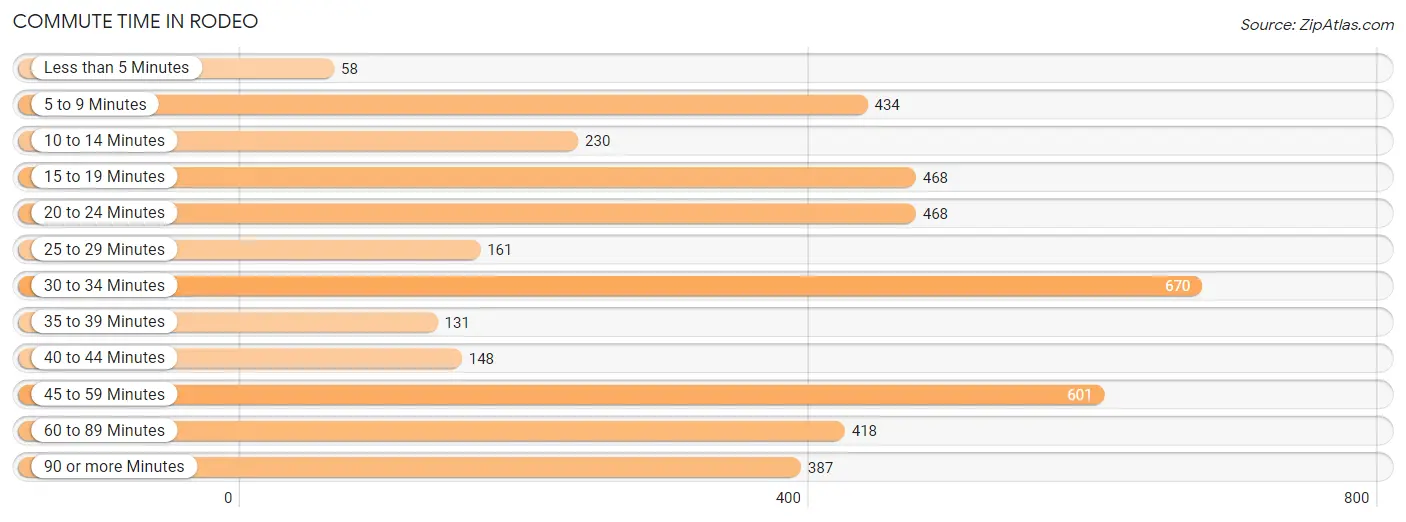
| Commute Time | # Commuters | % Commuters |
| Less than 5 Minutes | 58 | 1.4% |
| 5 to 9 Minutes | 434 | 10.4% |
| 10 to 14 Minutes | 230 | 5.5% |
| 15 to 19 Minutes | 468 | 11.2% |
| 20 to 24 Minutes | 468 | 11.2% |
| 25 to 29 Minutes | 161 | 3.9% |
| 30 to 34 Minutes | 670 | 16.1% |
| 35 to 39 Minutes | 131 | 3.1% |
| 40 to 44 Minutes | 148 | 3.5% |
| 45 to 59 Minutes | 601 | 14.4% |
| 60 to 89 Minutes | 418 | 10.0% |
| 90 or more Minutes | 387 | 9.3% |
Commute Time by Sex in Rodeo
The most common commute times in Rodeo are 45 to 59 minutes (397 commuters, 16.1%) for males and 30 to 34 minutes (274 commuters, 16.1%) for females.
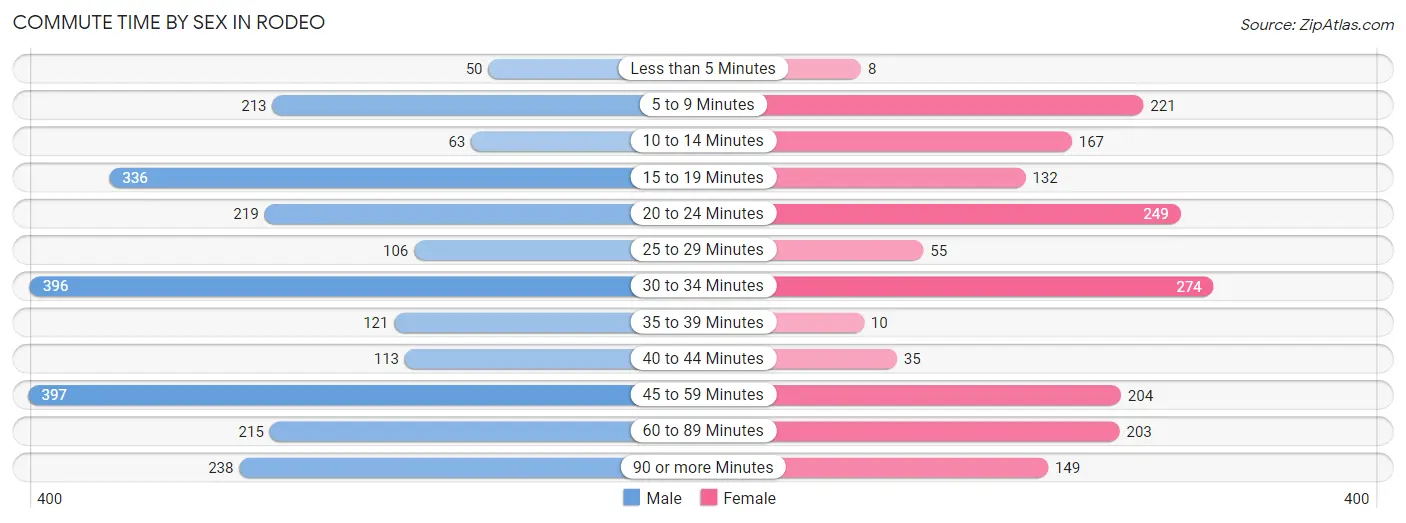
| Commute Time | Male | Female |
| Less than 5 Minutes | 50 (2.0%) | 8 (0.5%) |
| 5 to 9 Minutes | 213 (8.6%) | 221 (13.0%) |
| 10 to 14 Minutes | 63 (2.5%) | 167 (9.8%) |
| 15 to 19 Minutes | 336 (13.6%) | 132 (7.7%) |
| 20 to 24 Minutes | 219 (8.9%) | 249 (14.6%) |
| 25 to 29 Minutes | 106 (4.3%) | 55 (3.2%) |
| 30 to 34 Minutes | 396 (16.1%) | 274 (16.1%) |
| 35 to 39 Minutes | 121 (4.9%) | 10 (0.6%) |
| 40 to 44 Minutes | 113 (4.6%) | 35 (2.1%) |
| 45 to 59 Minutes | 397 (16.1%) | 204 (11.9%) |
| 60 to 89 Minutes | 215 (8.7%) | 203 (11.9%) |
| 90 or more Minutes | 238 (9.7%) | 149 (8.7%) |
Time of Departure to Work by Sex in Rodeo
The most frequent times of departure to work in Rodeo are 12:00 AM to 4:59 AM (394, 16.0%) for males and 12:00 PM to 3:59 PM (392, 23.0%) for females.
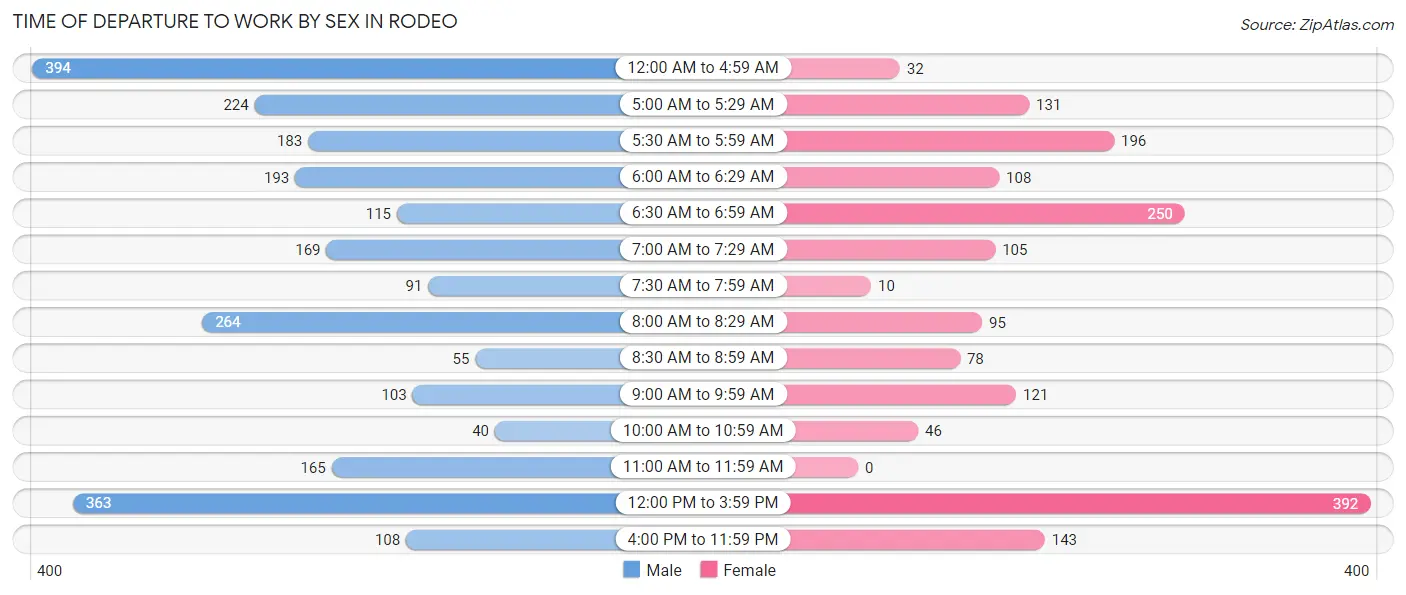
| Time of Departure | Male | Female |
| 12:00 AM to 4:59 AM | 394 (16.0%) | 32 (1.9%) |
| 5:00 AM to 5:29 AM | 224 (9.1%) | 131 (7.7%) |
| 5:30 AM to 5:59 AM | 183 (7.4%) | 196 (11.5%) |
| 6:00 AM to 6:29 AM | 193 (7.8%) | 108 (6.3%) |
| 6:30 AM to 6:59 AM | 115 (4.7%) | 250 (14.6%) |
| 7:00 AM to 7:29 AM | 169 (6.9%) | 105 (6.1%) |
| 7:30 AM to 7:59 AM | 91 (3.7%) | 10 (0.6%) |
| 8:00 AM to 8:29 AM | 264 (10.7%) | 95 (5.6%) |
| 8:30 AM to 8:59 AM | 55 (2.2%) | 78 (4.6%) |
| 9:00 AM to 9:59 AM | 103 (4.2%) | 121 (7.1%) |
| 10:00 AM to 10:59 AM | 40 (1.6%) | 46 (2.7%) |
| 11:00 AM to 11:59 AM | 165 (6.7%) | 0 (0.0%) |
| 12:00 PM to 3:59 PM | 363 (14.7%) | 392 (23.0%) |
| 4:00 PM to 11:59 PM | 108 (4.4%) | 143 (8.4%) |
| Total | 2,467 (100.0%) | 1,707 (100.0%) |
Housing Occupancy in Rodeo
Occupancy by Ownership in Rodeo
Of the total 3,058 dwellings in Rodeo, owner-occupied units account for 1,760 (57.6%), while renter-occupied units make up 1,298 (42.4%).
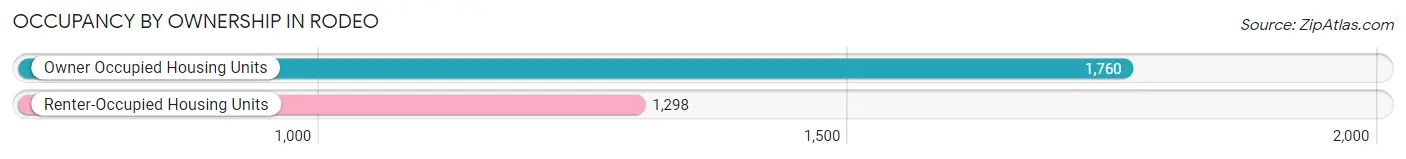
| Occupancy | # Housing Units | % Housing Units |
| Owner Occupied Housing Units | 1,760 | 57.6% |
| Renter-Occupied Housing Units | 1,298 | 42.4% |
| Total Occupied Housing Units | 3,058 | 100.0% |
Occupancy by Household Size in Rodeo
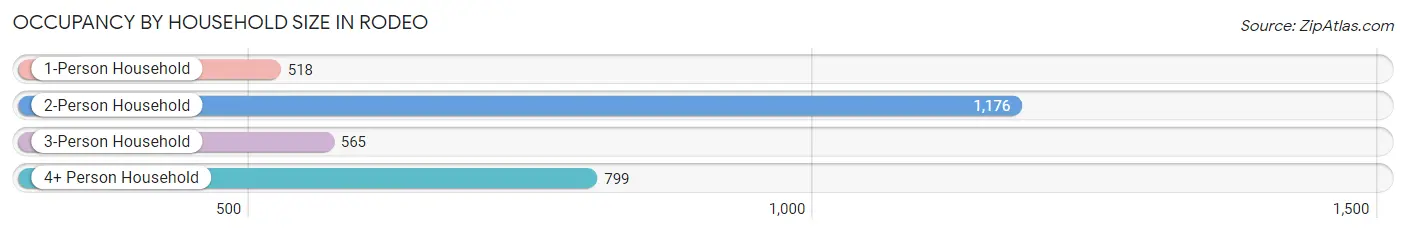
| Household Size | # Housing Units | % Housing Units |
| 1-Person Household | 518 | 16.9% |
| 2-Person Household | 1,176 | 38.5% |
| 3-Person Household | 565 | 18.5% |
| 4+ Person Household | 799 | 26.1% |
| Total Housing Units | 3,058 | 100.0% |
Occupancy by Ownership by Household Size in Rodeo
| Household Size | Owner-occupied | Renter-occupied |
| 1-Person Household | 235 (45.4%) | 283 (54.6%) |
| 2-Person Household | 689 (58.6%) | 487 (41.4%) |
| 3-Person Household | 257 (45.5%) | 308 (54.5%) |
| 4+ Person Household | 579 (72.5%) | 220 (27.5%) |
| Total Housing Units | 1,760 (57.6%) | 1,298 (42.4%) |
Occupancy by Educational Attainment in Rodeo
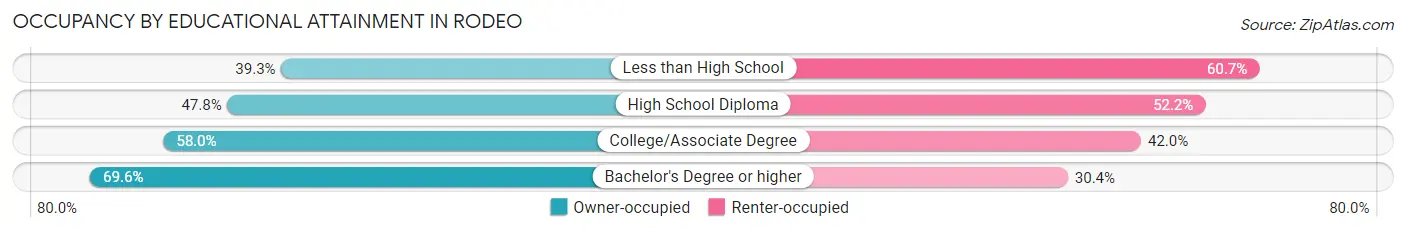
| Household Size | Owner-occupied | Renter-occupied |
| Less than High School | 130 (39.3%) | 201 (60.7%) |
| High School Diploma | 274 (47.8%) | 299 (52.2%) |
| College/Associate Degree | 715 (58.0%) | 518 (42.0%) |
| Bachelor's Degree or higher | 641 (69.6%) | 280 (30.4%) |
Occupancy by Age of Householder in Rodeo
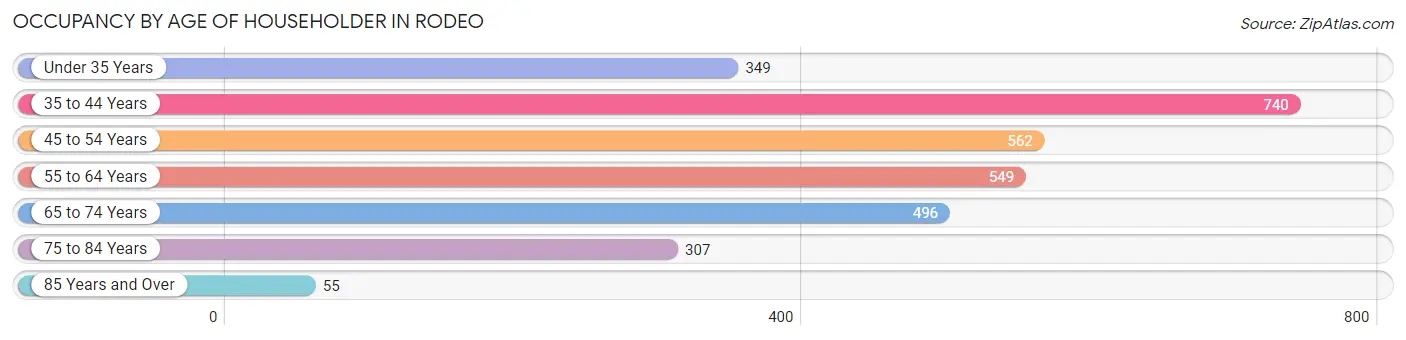
| Age Bracket | # Households | % Households |
| Under 35 Years | 349 | 11.4% |
| 35 to 44 Years | 740 | 24.2% |
| 45 to 54 Years | 562 | 18.4% |
| 55 to 64 Years | 549 | 17.9% |
| 65 to 74 Years | 496 | 16.2% |
| 75 to 84 Years | 307 | 10.0% |
| 85 Years and Over | 55 | 1.8% |
| Total | 3,058 | 100.0% |
Housing Finances in Rodeo
Median Income by Occupancy in Rodeo
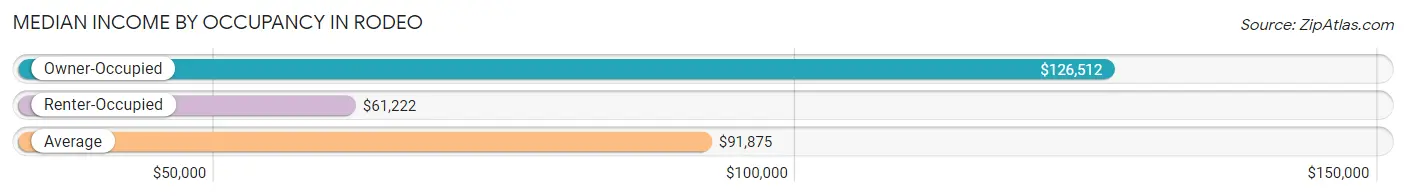
| Occupancy Type | # Households | Median Income |
| Owner-Occupied | 1,760 (57.6%) | $126,512 |
| Renter-Occupied | 1,298 (42.4%) | $61,222 |
| Average | 3,058 (100.0%) | $91,875 |
Occupancy by Householder Income Bracket in Rodeo
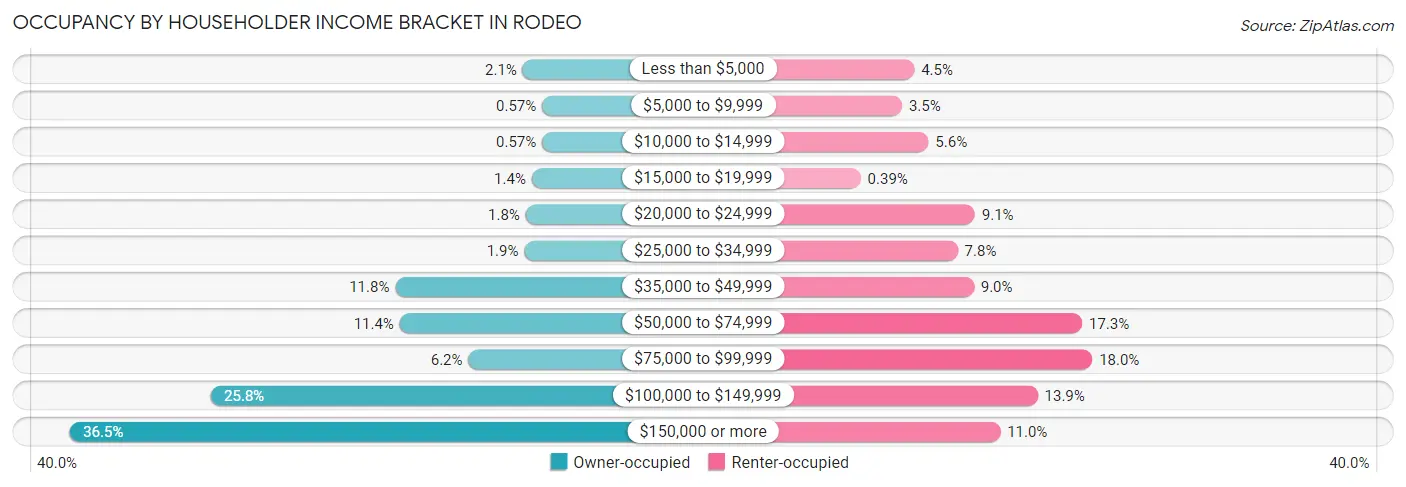
| Income Bracket | Owner-occupied | Renter-occupied |
| Less than $5,000 | 36 (2.1%) | 58 (4.5%) |
| $5,000 to $9,999 | 10 (0.6%) | 46 (3.5%) |
| $10,000 to $14,999 | 10 (0.6%) | 72 (5.6%) |
| $15,000 to $19,999 | 24 (1.4%) | 5 (0.4%) |
| $20,000 to $24,999 | 32 (1.8%) | 118 (9.1%) |
| $25,000 to $34,999 | 34 (1.9%) | 101 (7.8%) |
| $35,000 to $49,999 | 207 (11.8%) | 117 (9.0%) |
| $50,000 to $74,999 | 201 (11.4%) | 224 (17.3%) |
| $75,000 to $99,999 | 109 (6.2%) | 234 (18.0%) |
| $100,000 to $149,999 | 454 (25.8%) | 180 (13.9%) |
| $150,000 or more | 643 (36.5%) | 143 (11.0%) |
| Total | 1,760 (100.0%) | 1,298 (100.0%) |
Monthly Housing Cost Tiers in Rodeo
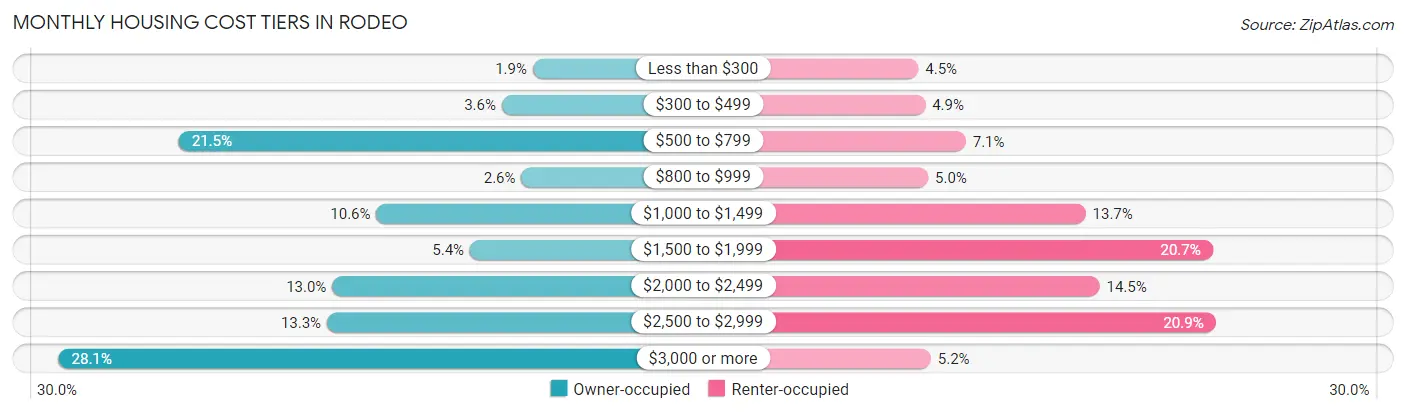
| Monthly Cost | Owner-occupied | Renter-occupied |
| Less than $300 | 34 (1.9%) | 58 (4.5%) |
| $300 to $499 | 64 (3.6%) | 63 (4.9%) |
| $500 to $799 | 378 (21.5%) | 92 (7.1%) |
| $800 to $999 | 45 (2.6%) | 65 (5.0%) |
| $1,000 to $1,499 | 186 (10.6%) | 178 (13.7%) |
| $1,500 to $1,999 | 95 (5.4%) | 269 (20.7%) |
| $2,000 to $2,499 | 229 (13.0%) | 188 (14.5%) |
| $2,500 to $2,999 | 234 (13.3%) | 271 (20.9%) |
| $3,000 or more | 495 (28.1%) | 67 (5.2%) |
| Total | 1,760 (100.0%) | 1,298 (100.0%) |
Physical Housing Characteristics in Rodeo
Housing Structures in Rodeo
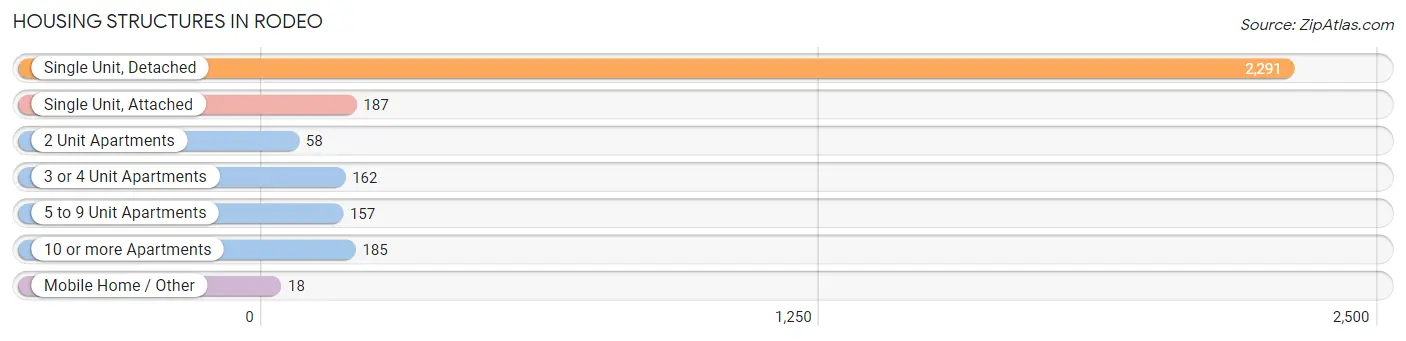
| Structure Type | # Housing Units | % Housing Units |
| Single Unit, Detached | 2,291 | 74.9% |
| Single Unit, Attached | 187 | 6.1% |
| 2 Unit Apartments | 58 | 1.9% |
| 3 or 4 Unit Apartments | 162 | 5.3% |
| 5 to 9 Unit Apartments | 157 | 5.1% |
| 10 or more Apartments | 185 | 6.0% |
| Mobile Home / Other | 18 | 0.6% |
| Total | 3,058 | 100.0% |
Housing Structures by Occupancy in Rodeo
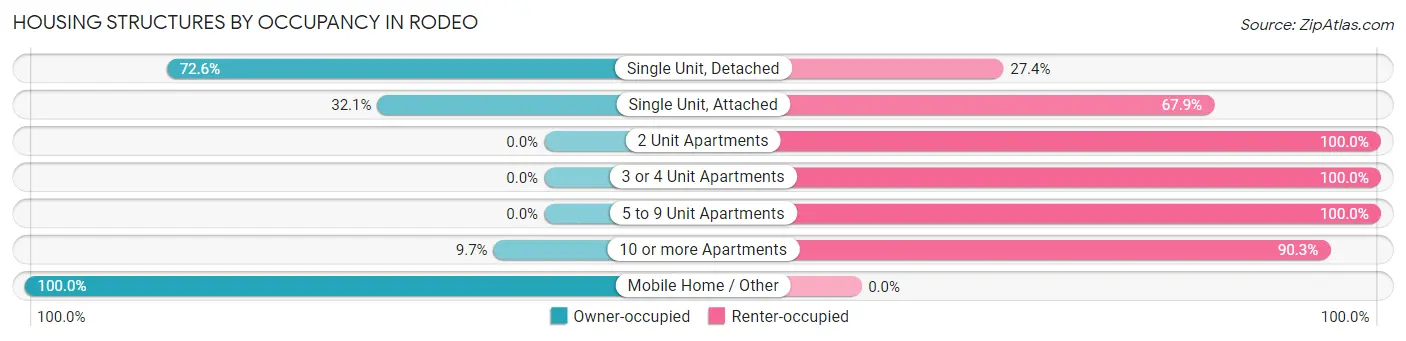
| Structure Type | Owner-occupied | Renter-occupied |
| Single Unit, Detached | 1,664 (72.6%) | 627 (27.4%) |
| Single Unit, Attached | 60 (32.1%) | 127 (67.9%) |
| 2 Unit Apartments | 0 (0.0%) | 58 (100.0%) |
| 3 or 4 Unit Apartments | 0 (0.0%) | 162 (100.0%) |
| 5 to 9 Unit Apartments | 0 (0.0%) | 157 (100.0%) |
| 10 or more Apartments | 18 (9.7%) | 167 (90.3%) |
| Mobile Home / Other | 18 (100.0%) | 0 (0.0%) |
| Total | 1,760 (57.6%) | 1,298 (42.4%) |
Housing Structures by Number of Rooms in Rodeo
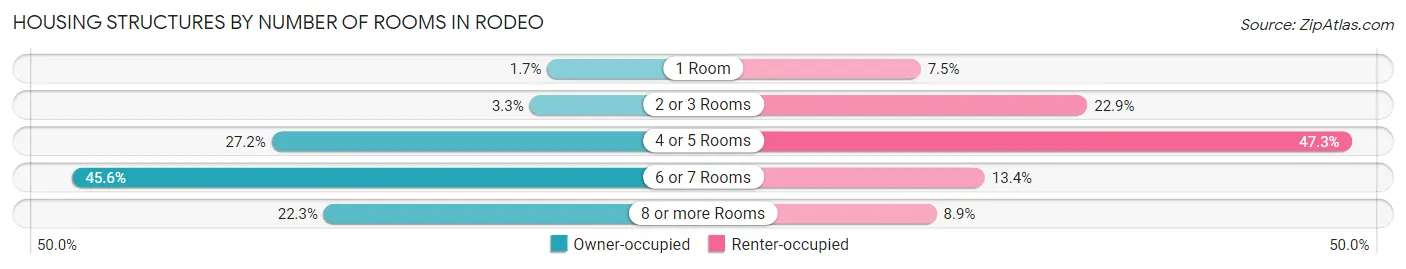
| Number of Rooms | Owner-occupied | Renter-occupied |
| 1 Room | 29 (1.7%) | 97 (7.5%) |
| 2 or 3 Rooms | 58 (3.3%) | 297 (22.9%) |
| 4 or 5 Rooms | 478 (27.2%) | 614 (47.3%) |
| 6 or 7 Rooms | 802 (45.6%) | 174 (13.4%) |
| 8 or more Rooms | 393 (22.3%) | 116 (8.9%) |
| Total | 1,760 (100.0%) | 1,298 (100.0%) |
Housing Structure by Heating Type in Rodeo
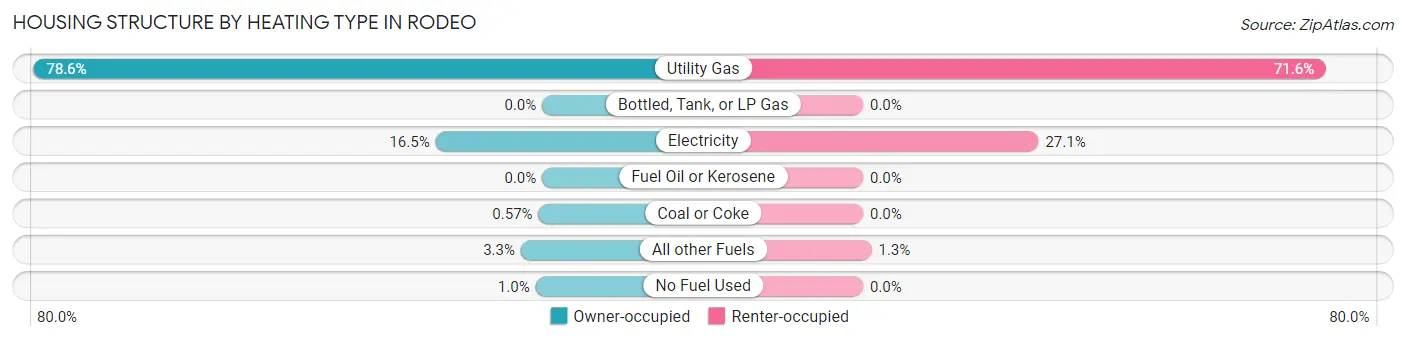
| Heating Type | Owner-occupied | Renter-occupied |
| Utility Gas | 1,384 (78.6%) | 929 (71.6%) |
| Bottled, Tank, or LP Gas | 0 (0.0%) | 0 (0.0%) |
| Electricity | 290 (16.5%) | 352 (27.1%) |
| Fuel Oil or Kerosene | 0 (0.0%) | 0 (0.0%) |
| Coal or Coke | 10 (0.6%) | 0 (0.0%) |
| All other Fuels | 58 (3.3%) | 17 (1.3%) |
| No Fuel Used | 18 (1.0%) | 0 (0.0%) |
| Total | 1,760 (100.0%) | 1,298 (100.0%) |
Household Vehicle Usage in Rodeo
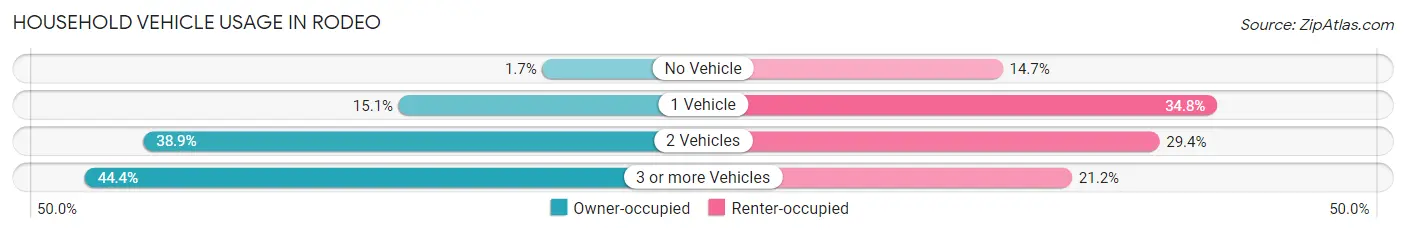
| Vehicles per Household | Owner-occupied | Renter-occupied |
| No Vehicle | 29 (1.7%) | 191 (14.7%) |
| 1 Vehicle | 265 (15.1%) | 451 (34.7%) |
| 2 Vehicles | 685 (38.9%) | 381 (29.3%) |
| 3 or more Vehicles | 781 (44.4%) | 275 (21.2%) |
| Total | 1,760 (100.0%) | 1,298 (100.0%) |
Real Estate & Mortgages in Rodeo
Real Estate and Mortgage Overview in Rodeo
| Characteristic | Without Mortgage | With Mortgage |
| Housing Units | 661 | 1,099 |
| Median Property Value | $602,800 | $637,000 |
| Median Household Income | $99,071 | $501 |
| Monthly Housing Costs | $714 | $428 |
| Real Estate Taxes | $4,487 | $8 |
Property Value by Mortgage Status in Rodeo
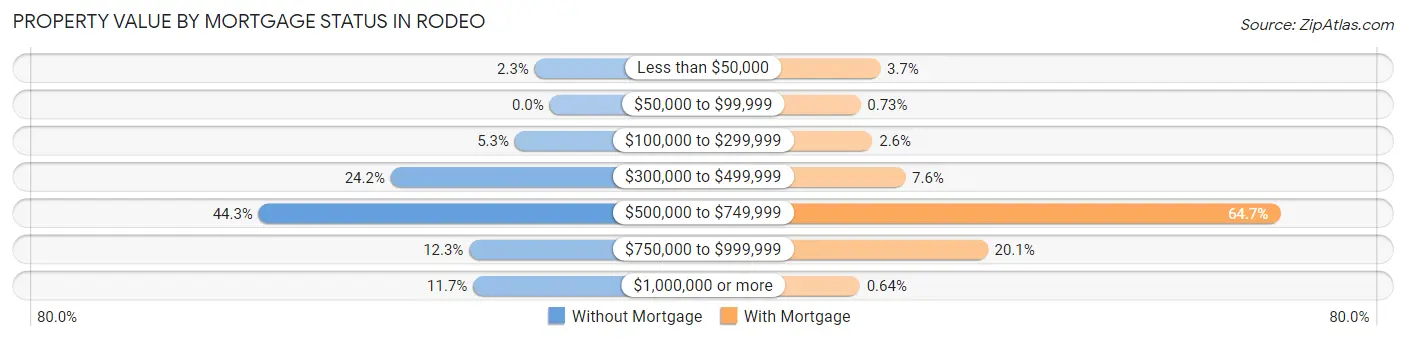
| Property Value | Without Mortgage | With Mortgage |
| Less than $50,000 | 15 (2.3%) | 41 (3.7%) |
| $50,000 to $99,999 | 0 (0.0%) | 8 (0.7%) |
| $100,000 to $299,999 | 35 (5.3%) | 28 (2.5%) |
| $300,000 to $499,999 | 160 (24.2%) | 83 (7.5%) |
| $500,000 to $749,999 | 293 (44.3%) | 711 (64.7%) |
| $750,000 to $999,999 | 81 (12.2%) | 221 (20.1%) |
| $1,000,000 or more | 77 (11.7%) | 7 (0.6%) |
| Total | 661 (100.0%) | 1,099 (100.0%) |
Household Income by Mortgage Status in Rodeo
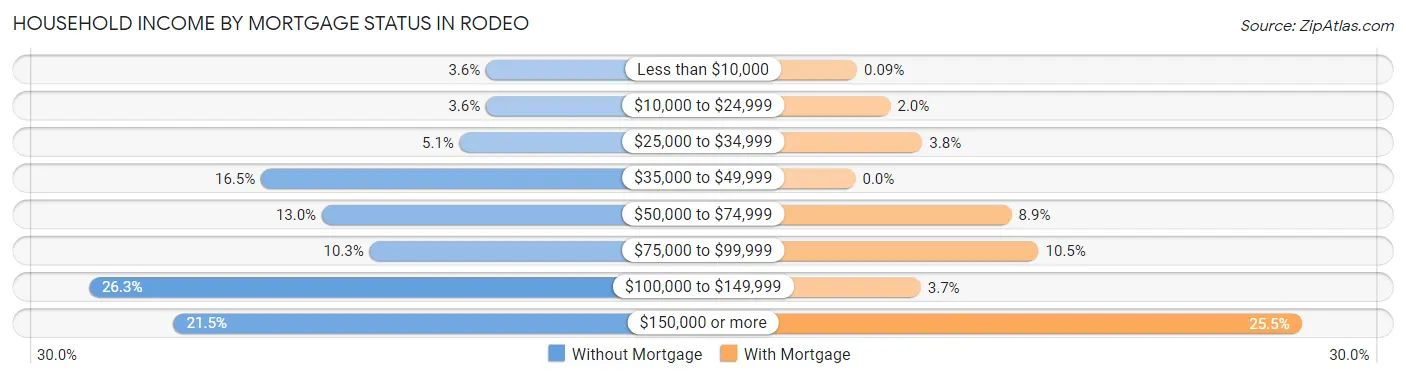
| Household Income | Without Mortgage | With Mortgage |
| Less than $10,000 | 24 (3.6%) | 1 (0.1%) |
| $10,000 to $24,999 | 24 (3.6%) | 22 (2.0%) |
| $25,000 to $34,999 | 34 (5.1%) | 42 (3.8%) |
| $35,000 to $49,999 | 109 (16.5%) | 0 (0.0%) |
| $50,000 to $74,999 | 86 (13.0%) | 98 (8.9%) |
| $75,000 to $99,999 | 68 (10.3%) | 115 (10.5%) |
| $100,000 to $149,999 | 174 (26.3%) | 41 (3.7%) |
| $150,000 or more | 142 (21.5%) | 280 (25.5%) |
| Total | 661 (100.0%) | 1,099 (100.0%) |
Property Value to Household Income Ratio in Rodeo
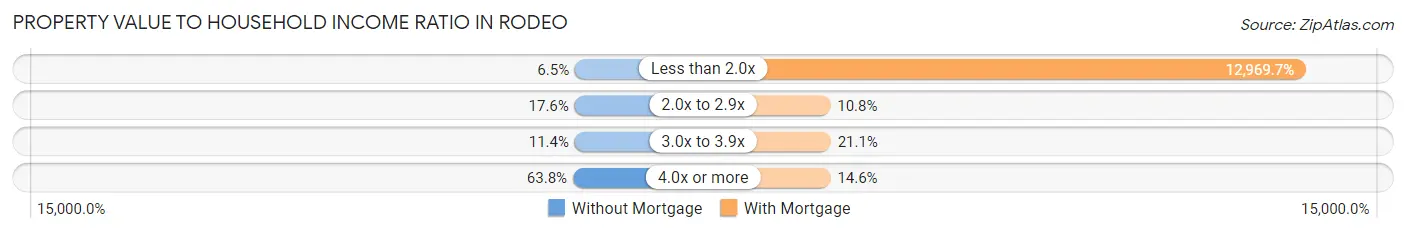
| Value-to-Income Ratio | Without Mortgage | With Mortgage |
| Less than 2.0x | 43 (6.5%) | 142,537 (12,969.7%) |
| 2.0x to 2.9x | 116 (17.5%) | 119 (10.8%) |
| 3.0x to 3.9x | 75 (11.4%) | 232 (21.1%) |
| 4.0x or more | 422 (63.8%) | 160 (14.6%) |
| Total | 661 (100.0%) | 1,099 (100.0%) |
Real Estate Taxes by Mortgage Status in Rodeo

| Property Taxes | Without Mortgage | With Mortgage |
| Less than $800 | 5 (0.8%) | 0 (0.0%) |
| $800 to $1,499 | 10 (1.5%) | 46 (4.2%) |
| $800 to $1,499 | 603 (91.2%) | 28 (2.5%) |
| Total | 661 (100.0%) | 1,099 (100.0%) |
Health & Disability in Rodeo
Health Insurance Coverage by Age in Rodeo
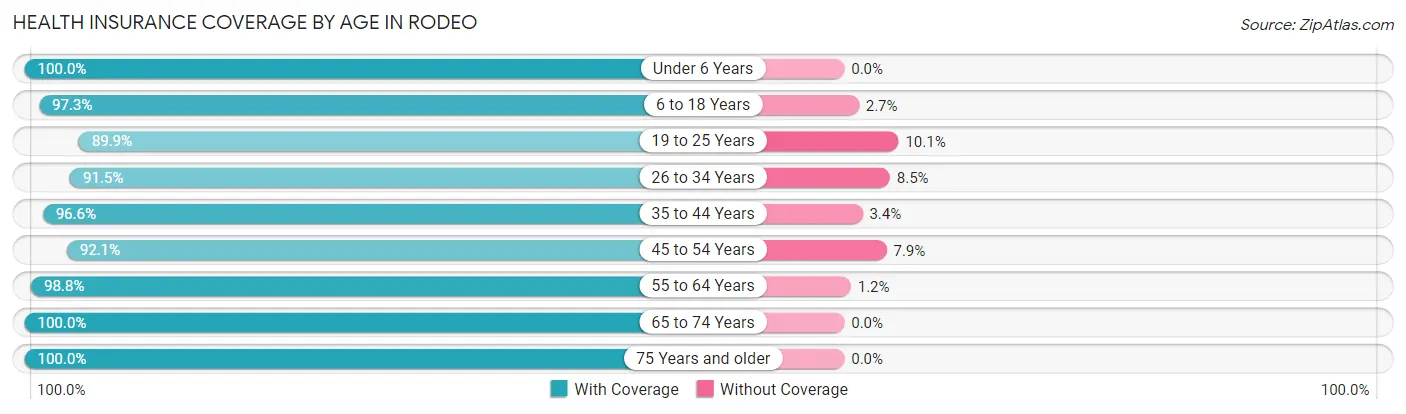
| Age Bracket | With Coverage | Without Coverage |
| Under 6 Years | 627 (100.0%) | 0 (0.0%) |
| 6 to 18 Years | 1,407 (97.3%) | 39 (2.7%) |
| 19 to 25 Years | 791 (89.9%) | 89 (10.1%) |
| 26 to 34 Years | 1,013 (91.5%) | 94 (8.5%) |
| 35 to 44 Years | 1,540 (96.6%) | 54 (3.4%) |
| 45 to 54 Years | 958 (92.1%) | 82 (7.9%) |
| 55 to 64 Years | 1,063 (98.8%) | 13 (1.2%) |
| 65 to 74 Years | 821 (100.0%) | 0 (0.0%) |
| 75 Years and older | 742 (100.0%) | 0 (0.0%) |
| Total | 8,962 (96.0%) | 371 (4.0%) |
Health Insurance Coverage by Citizenship Status in Rodeo
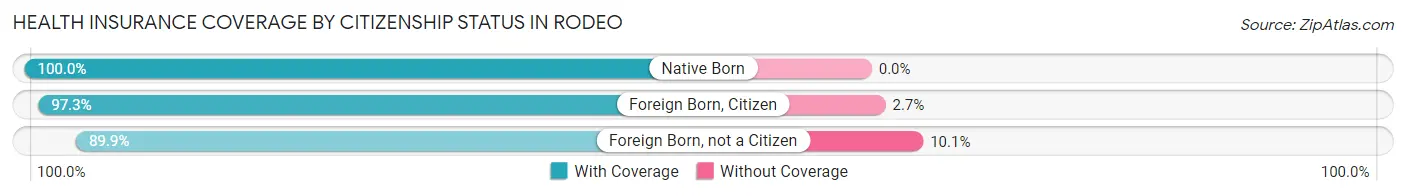
| Citizenship Status | With Coverage | Without Coverage |
| Native Born | 627 (100.0%) | 0 (0.0%) |
| Foreign Born, Citizen | 1,407 (97.3%) | 39 (2.7%) |
| Foreign Born, not a Citizen | 791 (89.9%) | 89 (10.1%) |
Health Insurance Coverage by Household Income in Rodeo
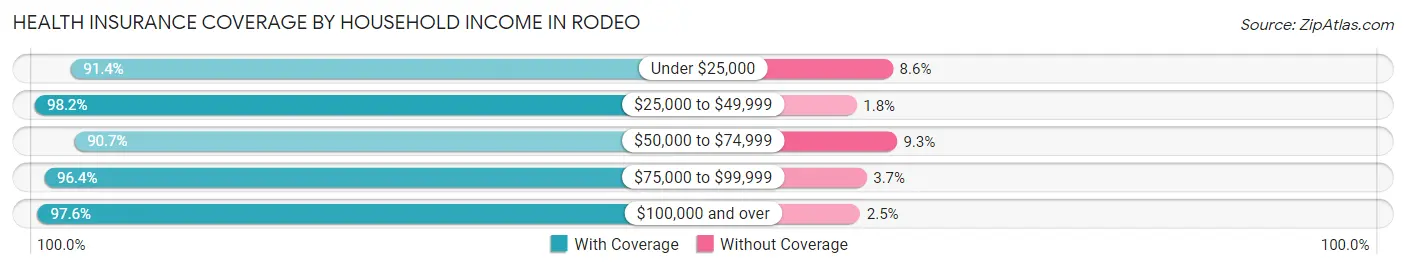
| Household Income | With Coverage | Without Coverage |
| Under $25,000 | 777 (91.4%) | 73 (8.6%) |
| $25,000 to $49,999 | 1,044 (98.2%) | 19 (1.8%) |
| $50,000 to $74,999 | 936 (90.7%) | 96 (9.3%) |
| $75,000 to $99,999 | 870 (96.4%) | 33 (3.6%) |
| $100,000 and over | 5,305 (97.6%) | 133 (2.5%) |
Public vs Private Health Insurance Coverage by Age in Rodeo
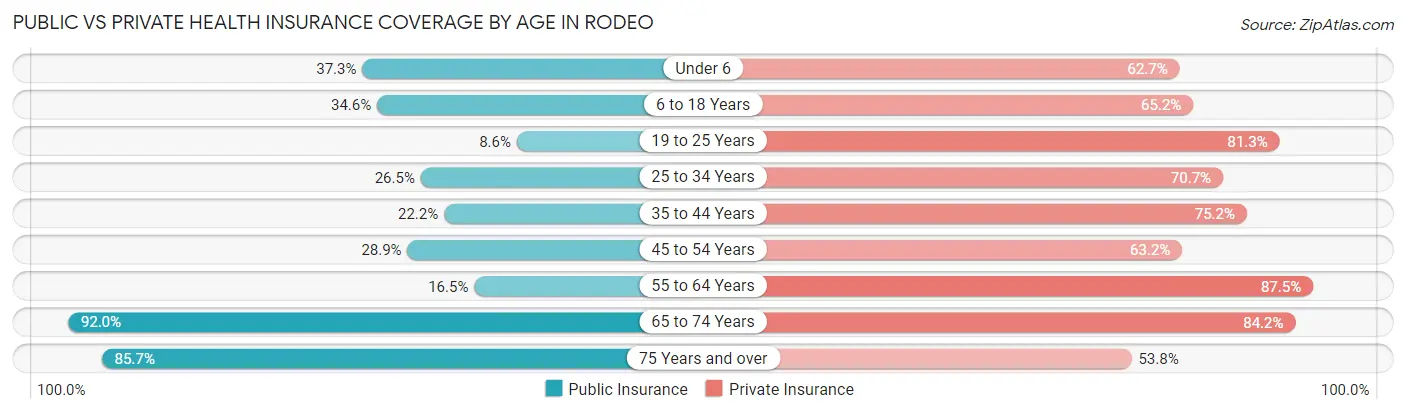
| Age Bracket | Public Insurance | Private Insurance |
| Under 6 | 234 (37.3%) | 393 (62.7%) |
| 6 to 18 Years | 500 (34.6%) | 943 (65.2%) |
| 19 to 25 Years | 76 (8.6%) | 715 (81.2%) |
| 25 to 34 Years | 293 (26.5%) | 783 (70.7%) |
| 35 to 44 Years | 353 (22.2%) | 1,198 (75.2%) |
| 45 to 54 Years | 301 (28.9%) | 657 (63.2%) |
| 55 to 64 Years | 178 (16.5%) | 941 (87.5%) |
| 65 to 74 Years | 755 (92.0%) | 691 (84.2%) |
| 75 Years and over | 636 (85.7%) | 399 (53.8%) |
| Total | 3,326 (35.6%) | 6,720 (72.0%) |
Disability Status by Sex by Age in Rodeo
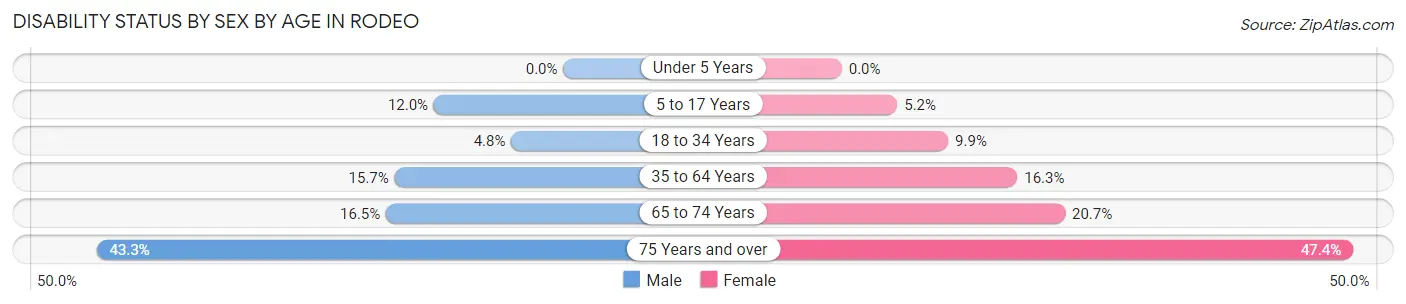
| Age Bracket | Male | Female |
| Under 5 Years | 0 (0.0%) | 0 (0.0%) |
| 5 to 17 Years | 79 (12.0%) | 37 (5.1%) |
| 18 to 34 Years | 61 (4.8%) | 86 (9.9%) |
| 35 to 64 Years | 279 (15.7%) | 314 (16.3%) |
| 65 to 74 Years | 62 (16.5%) | 92 (20.7%) |
| 75 Years and over | 169 (43.3%) | 167 (47.4%) |
Disability Class by Sex by Age in Rodeo
Disability Class: Hearing Difficulty
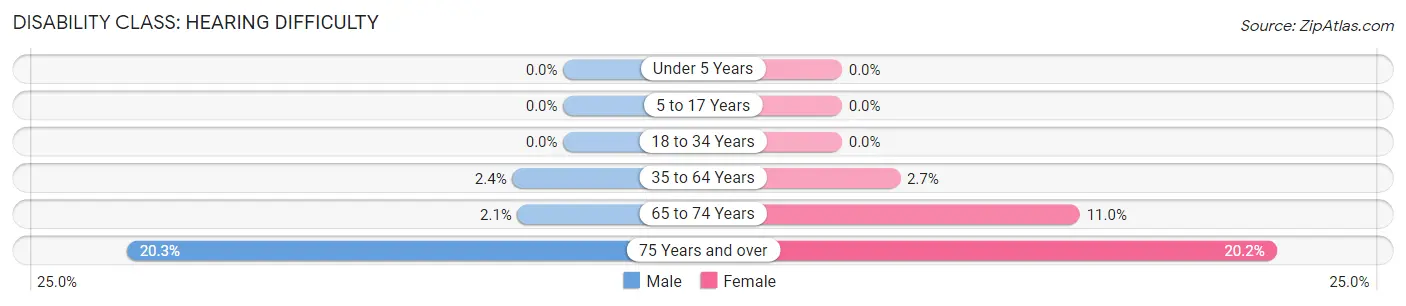
| Age Bracket | Male | Female |
| Under 5 Years | 0 (0.0%) | 0 (0.0%) |
| 5 to 17 Years | 0 (0.0%) | 0 (0.0%) |
| 18 to 34 Years | 0 (0.0%) | 0 (0.0%) |
| 35 to 64 Years | 42 (2.4%) | 52 (2.7%) |
| 65 to 74 Years | 8 (2.1%) | 49 (11.0%) |
| 75 Years and over | 79 (20.3%) | 71 (20.2%) |
Disability Class: Vision Difficulty
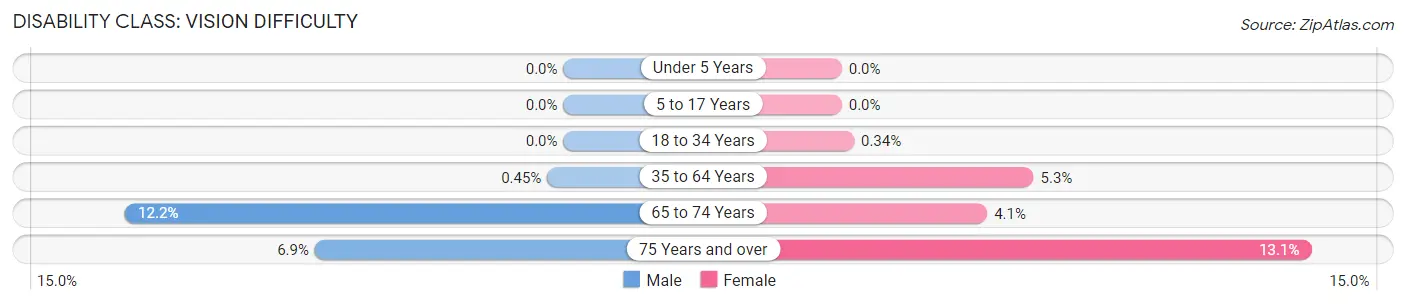
| Age Bracket | Male | Female |
| Under 5 Years | 0 (0.0%) | 0 (0.0%) |
| 5 to 17 Years | 0 (0.0%) | 0 (0.0%) |
| 18 to 34 Years | 0 (0.0%) | 3 (0.3%) |
| 35 to 64 Years | 8 (0.4%) | 103 (5.3%) |
| 65 to 74 Years | 46 (12.2%) | 18 (4.1%) |
| 75 Years and over | 27 (6.9%) | 46 (13.1%) |
Disability Class: Cognitive Difficulty
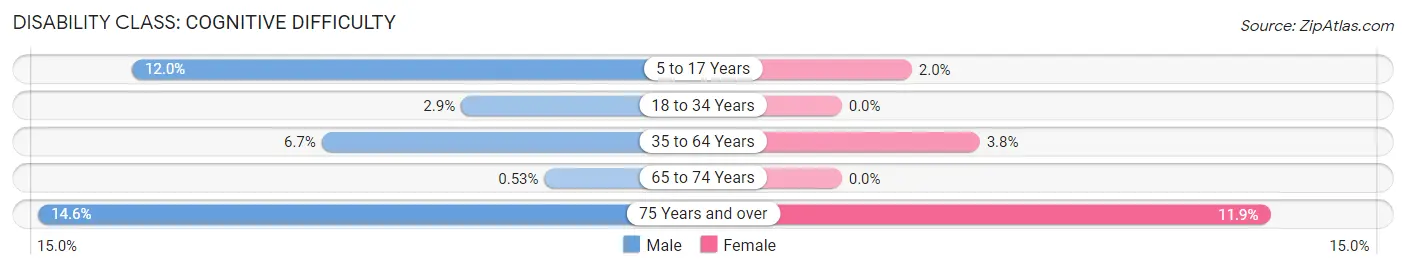
| Age Bracket | Male | Female |
| 5 to 17 Years | 79 (12.0%) | 14 (1.9%) |
| 18 to 34 Years | 36 (2.9%) | 0 (0.0%) |
| 35 to 64 Years | 120 (6.7%) | 74 (3.8%) |
| 65 to 74 Years | 2 (0.5%) | 0 (0.0%) |
| 75 Years and over | 57 (14.6%) | 42 (11.9%) |
Disability Class: Ambulatory Difficulty
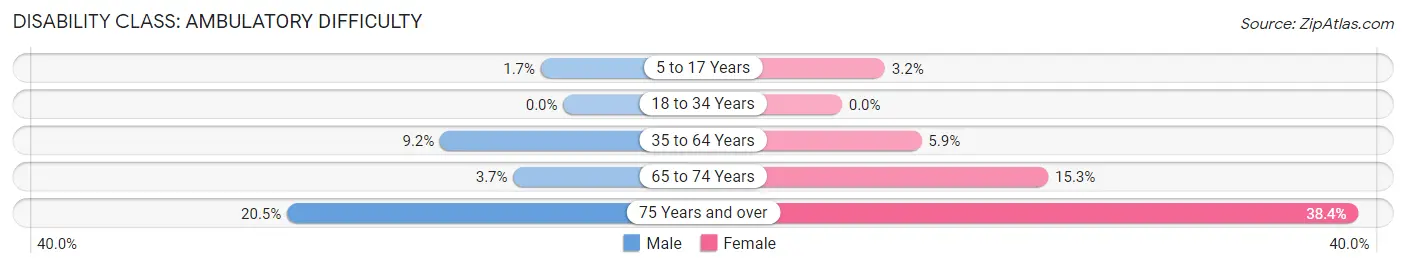
| Age Bracket | Male | Female |
| 5 to 17 Years | 11 (1.7%) | 23 (3.2%) |
| 18 to 34 Years | 0 (0.0%) | 0 (0.0%) |
| 35 to 64 Years | 163 (9.1%) | 114 (5.9%) |
| 65 to 74 Years | 14 (3.7%) | 68 (15.3%) |
| 75 Years and over | 80 (20.5%) | 135 (38.4%) |
Disability Class: Self-Care Difficulty
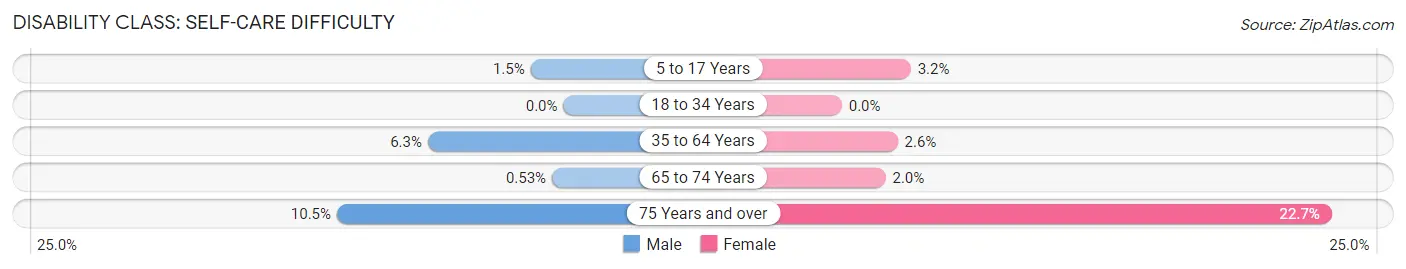
| Age Bracket | Male | Female |
| 5 to 17 Years | 10 (1.5%) | 23 (3.2%) |
| 18 to 34 Years | 0 (0.0%) | 0 (0.0%) |
| 35 to 64 Years | 112 (6.3%) | 50 (2.6%) |
| 65 to 74 Years | 2 (0.5%) | 9 (2.0%) |
| 75 Years and over | 41 (10.5%) | 80 (22.7%) |
Technology Access in Rodeo
Computing Device Access in Rodeo
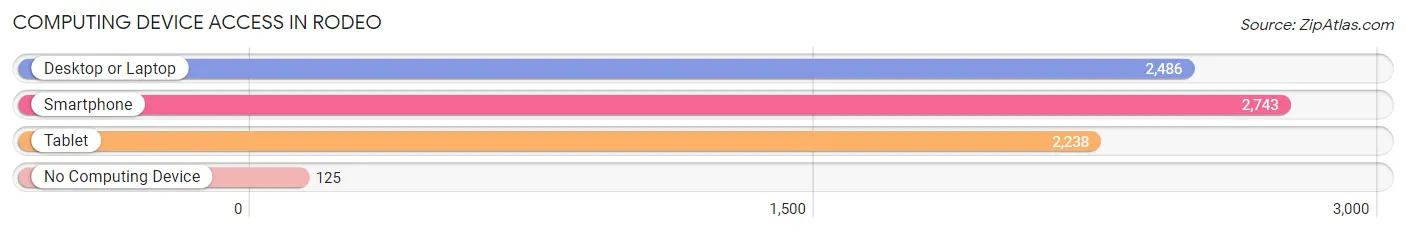
| Device Type | # Households | % Households |
| Desktop or Laptop | 2,486 | 81.3% |
| Smartphone | 2,743 | 89.7% |
| Tablet | 2,238 | 73.2% |
| No Computing Device | 125 | 4.1% |
| Total | 3,058 | 100.0% |
Internet Access in Rodeo
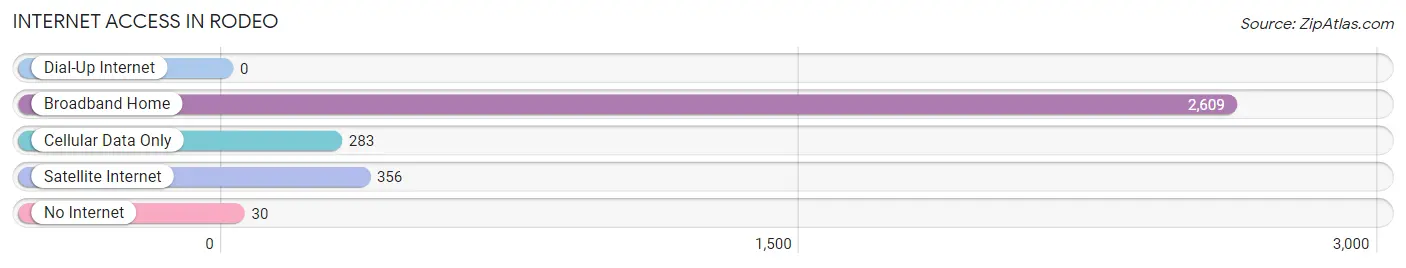
| Internet Type | # Households | % Households |
| Dial-Up Internet | 0 | 0.0% |
| Broadband Home | 2,609 | 85.3% |
| Cellular Data Only | 283 | 9.2% |
| Satellite Internet | 356 | 11.6% |
| No Internet | 30 | 1.0% |
| Total | 3,058 | 100.0% |
Rodeo Summary
Rodeo, California is a small unincorporated community located in Contra Costa County, California. It is situated on the eastern shore of San Pablo Bay, approximately 25 miles northeast of San Francisco. The population of Rodeo was 5,280 as of the 2010 census.
Geography
Rodeo is located at an elevation of 10 feet (3 m) above sea level. It is situated on the eastern shore of San Pablo Bay, approximately 25 miles northeast of San Francisco. The town is bordered by the cities of Hercules and Pinole to the north, Crockett to the east, and Vallejo to the south. The Carquinez Strait lies to the west of Rodeo.
The town is located in the San Francisco Bay Area, and is part of the East Bay region. The climate in Rodeo is mild, with temperatures ranging from the mid-50s to the mid-70s in the summer months.
Economy
Rodeo is home to a variety of businesses, including a number of small retail stores, restaurants, and service providers. The town is also home to a number of industrial and manufacturing businesses, including the Rodeo Refinery, which is owned by Chevron. The refinery is the largest employer in the town, and is responsible for much of the economic activity in the area.
Demographics
As of the 2010 census, the population of Rodeo was 5,280. The racial makeup of the town was 57.2% White, 16.2% African American, 0.7% Native American, 11.2% Asian, 0.3% Pacific Islander, 11.2% from other races, and 3.2% from two or more races. Hispanic or Latino of any race were 24.3% of the population.
The median income for a household in Rodeo was $50,945, and the median income for a family was $60,945. The per capita income for the town was $25,945. About 11.2% of families and 14.2% of the population were below the poverty line, including 18.2% of those under age 18 and 8.2% of those age 65 or over.
Conclusion
Rodeo, California is a small unincorporated community located in Contra Costa County, California. It is situated on the eastern shore of San Pablo Bay, approximately 25 miles northeast of San Francisco. The population of Rodeo was 5,280 as of the 2010 census. The town is home to a variety of businesses, including a number of small retail stores, restaurants, and service providers. The town is also home to a number of industrial and manufacturing businesses, including the Rodeo Refinery, which is owned by Chevron. The racial makeup of the town was 57.2% White, 16.2% African American, 0.7% Native American, 11.2% Asian, 0.3% Pacific Islander, 11.2% from other races, and 3.2% from two or more races. The median income for a household in Rodeo was $50,945, and the median income for a family was $60,945. The per capita income for the town was $25,945. Rodeo is a diverse and vibrant community that offers a variety of economic and recreational opportunities.
Common Questions
What is Per Capita Income in Rodeo?
Per Capita income in Rodeo is $40,299.
What is the Median Family Income in Rodeo?
Median Family Income in Rodeo is $100,769.
What is the Median Household income in Rodeo?
Median Household Income in Rodeo is $91,875.
What is Income or Wage Gap in Rodeo?
Income or Wage Gap in Rodeo is 10.2%.
Women in Rodeo earn 89.8 cents for every dollar earned by a man.
What is Inequality or Gini Index in Rodeo?
Inequality or Gini Index in Rodeo is 0.45.
What is the Total Population of Rodeo?
Total Population of Rodeo is 9,334.
What is the Total Male Population of Rodeo?
Total Male Population of Rodeo is 4,633.
What is the Total Female Population of Rodeo?
Total Female Population of Rodeo is 4,701.
What is the Ratio of Males per 100 Females in Rodeo?
There are 98.55 Males per 100 Females in Rodeo.
What is the Ratio of Females per 100 Males in Rodeo?
There are 101.47 Females per 100 Males in Rodeo.
What is the Median Population Age in Rodeo?
Median Population Age in Rodeo is 39.0 Years.
What is the Average Family Size in Rodeo
Average Family Size in Rodeo is 3.5 People.
What is the Average Household Size in Rodeo
Average Household Size in Rodeo is 3.0 People.
How Large is the Labor Force in Rodeo?
There are 5,017 People in the Labor Forcein in Rodeo.
What is the Percentage of People in the Labor Force in Rodeo?
65.4% of People are in the Labor Force in Rodeo.
What is the Unemployment Rate in Rodeo?
Unemployment Rate in Rodeo is 7.6%.