Robbins, CA Map & Demographics
Robbins Map
Robbins Overview
$29,643
PER CAPITA INCOME
$95,972
AVG FAMILY INCOME
$88,929
AVG HOUSEHOLD INCOME
38.9%
WAGE / INCOME GAP [ % ]
61.1¢/ $1
WAGE / INCOME GAP [ $ ]
0.33
INEQUALITY / GINI INDEX
341
TOTAL POPULATION
154
MALE POPULATION
187
FEMALE POPULATION
82.35
MALES / 100 FEMALES
121.43
FEMALES / 100 MALES
34.7
MEDIAN AGE
3.1
AVG FAMILY SIZE
2.9
AVG HOUSEHOLD SIZE
146
LABOR FORCE [ PEOPLE ]
57.0%
PERCENT IN LABOR FORCE
Robbins Zip Codes
Robbins Area Codes
Income in Robbins
Income Overview in Robbins
Per Capita Income in Robbins is $29,643, while median incomes of families and households are $95,972 and $88,929 respectively.
| Characteristic | Number | Measure |
| Per Capita Income | 341 | $29,643 |
| Median Family Income | 105 | $95,972 |
| Mean Family Income | 105 | $90,830 |
| Median Household Income | 118 | $88,929 |
| Mean Household Income | 118 | $89,258 |
| Income Deficit | 105 | $0 |
| Wage / Income Gap (%) | 341 | 38.86% |
| Wage / Income Gap ($) | 341 | 61.14¢ per $1 |
| Gini / Inequality Index | 341 | 0.33 |
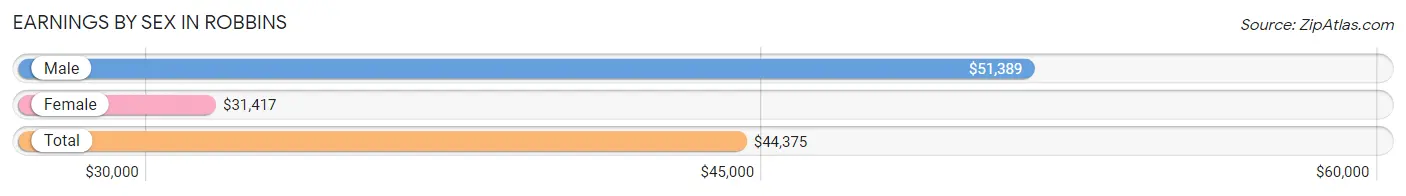
Earnings by Sex in Robbins
Average Earnings in Robbins are $44,375, $51,389 for men and $31,417 for women, a difference of 38.9%.
| Sex | Number | Average Earnings |
| Male | 116 (71.2%) | $51,389 |
| Female | 47 (28.8%) | $31,417 |
| Total | 163 (100.0%) | $44,375 |
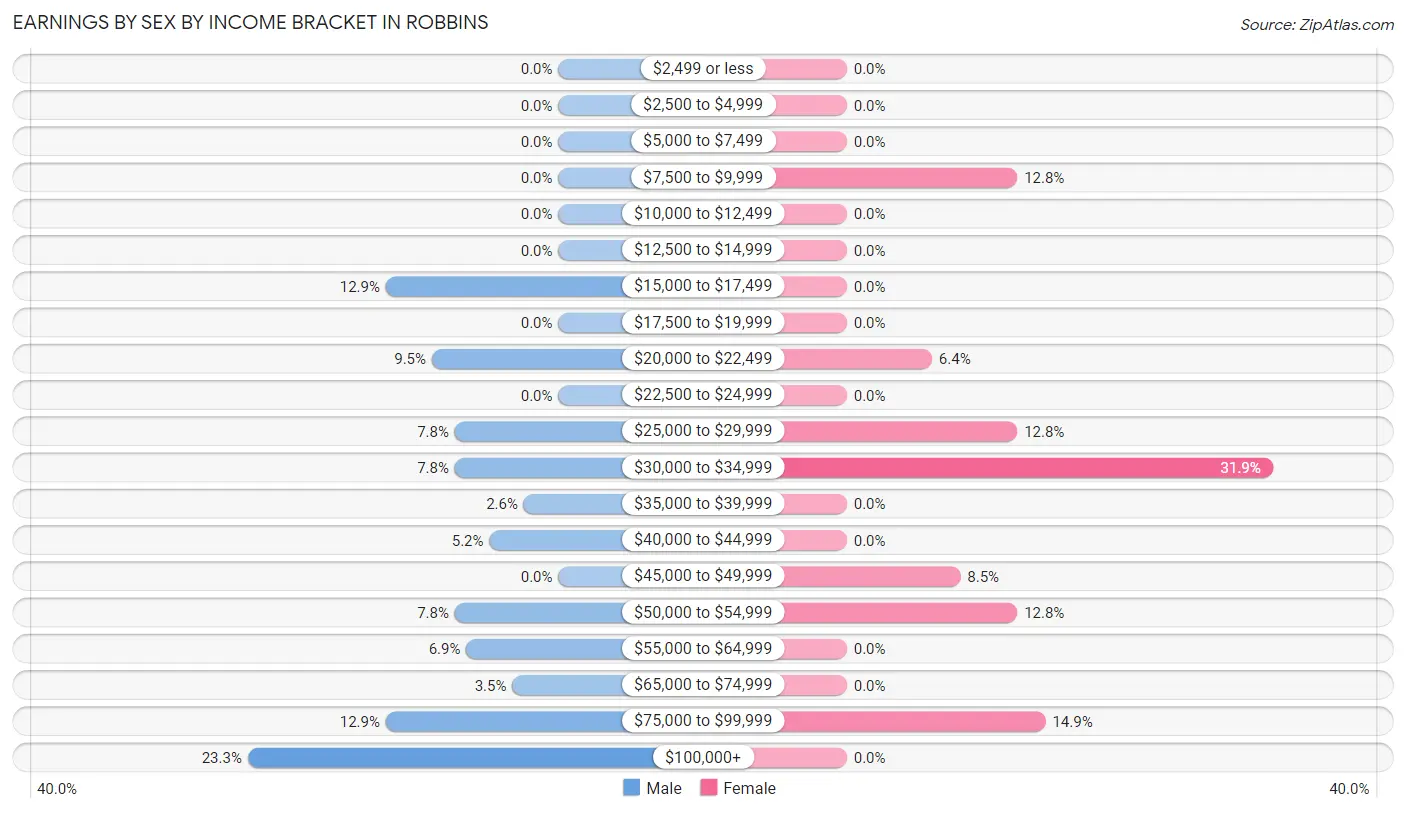
Earnings by Sex by Income Bracket in Robbins
The most common earnings brackets in Robbins are $100,000+ for men (27 | 23.3%) and $30,000 to $34,999 for women (15 | 31.9%).
| Income | Male | Female |
| $2,499 or less | 0 (0.0%) | 0 (0.0%) |
| $2,500 to $4,999 | 0 (0.0%) | 0 (0.0%) |
| $5,000 to $7,499 | 0 (0.0%) | 0 (0.0%) |
| $7,500 to $9,999 | 0 (0.0%) | 6 (12.8%) |
| $10,000 to $12,499 | 0 (0.0%) | 0 (0.0%) |
| $12,500 to $14,999 | 0 (0.0%) | 0 (0.0%) |
| $15,000 to $17,499 | 15 (12.9%) | 0 (0.0%) |
| $17,500 to $19,999 | 0 (0.0%) | 0 (0.0%) |
| $20,000 to $22,499 | 11 (9.5%) | 3 (6.4%) |
| $22,500 to $24,999 | 0 (0.0%) | 0 (0.0%) |
| $25,000 to $29,999 | 9 (7.8%) | 6 (12.8%) |
| $30,000 to $34,999 | 9 (7.8%) | 15 (31.9%) |
| $35,000 to $39,999 | 3 (2.6%) | 0 (0.0%) |
| $40,000 to $44,999 | 6 (5.2%) | 0 (0.0%) |
| $45,000 to $49,999 | 0 (0.0%) | 4 (8.5%) |
| $50,000 to $54,999 | 9 (7.8%) | 6 (12.8%) |
| $55,000 to $64,999 | 8 (6.9%) | 0 (0.0%) |
| $65,000 to $74,999 | 4 (3.5%) | 0 (0.0%) |
| $75,000 to $99,999 | 15 (12.9%) | 7 (14.9%) |
| $100,000+ | 27 (23.3%) | 0 (0.0%) |
| Total | 116 (100.0%) | 47 (100.0%) |
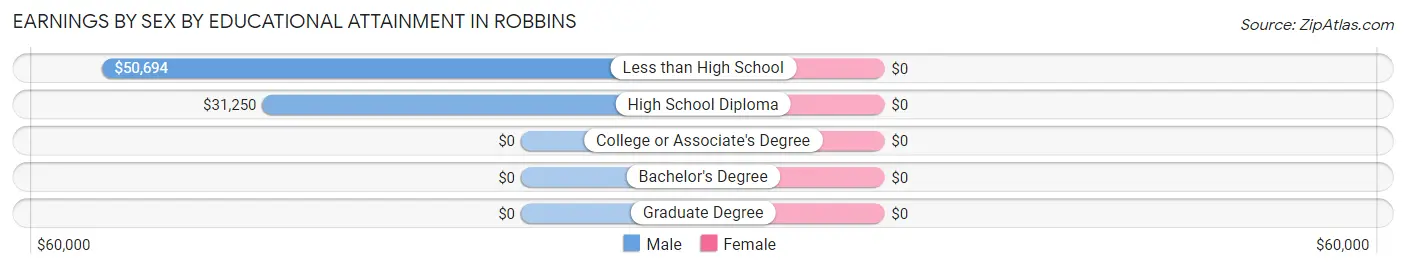
Earnings by Sex by Educational Attainment in Robbins
| Educational Attainment | Male Income | Female Income |
| Less than High School | $50,694 | $0 |
| High School Diploma | $31,250 | $0 |
| College or Associate's Degree | - | - |
| Bachelor's Degree | - | - |
| Graduate Degree | - | - |
| Total | $51,389 | $31,607 |
Family Income in Robbins
Family Income Brackets in Robbins
According to the Robbins family income data, there are 29 families falling into the $100,000 to $149,999 income range, which is the most common income bracket and makes up 27.6% of all families.
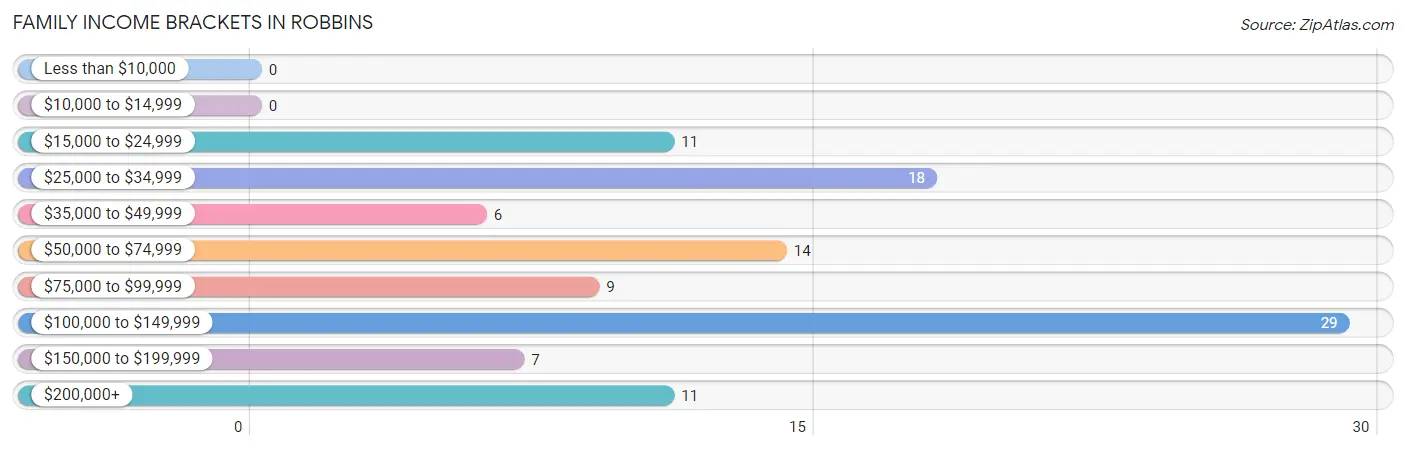
| Income Bracket | # Families | % Families |
| Less than $10,000 | 0 | 0.0% |
| $10,000 to $14,999 | 0 | 0.0% |
| $15,000 to $24,999 | 11 | 10.5% |
| $25,000 to $34,999 | 18 | 17.1% |
| $35,000 to $49,999 | 6 | 5.7% |
| $50,000 to $74,999 | 14 | 13.3% |
| $75,000 to $99,999 | 9 | 8.6% |
| $100,000 to $149,999 | 29 | 27.6% |
| $150,000 to $199,999 | 7 | 6.7% |
| $200,000+ | 11 | 10.5% |
Family Income by Famaliy Size in Robbins
2-person families (41 | 39.1%) account for the highest median family income in Robbins with $129,219 per family, while 2-person families (41 | 39.1%) have the highest median income of $64,610 per family member.
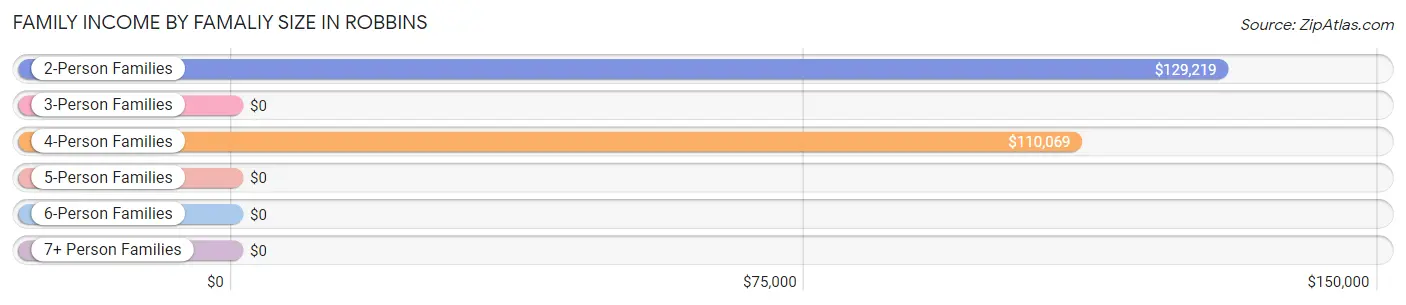
| Income Bracket | # Families | Median Income |
| 2-Person Families | 41 (39.1%) | $129,219 |
| 3-Person Families | 20 (19.1%) | $0 |
| 4-Person Families | 35 (33.3%) | $110,069 |
| 5-Person Families | 0 (0.0%) | $0 |
| 6-Person Families | 9 (8.6%) | $0 |
| 7+ Person Families | 0 (0.0%) | $0 |
| Total | 105 (100.0%) | $95,972 |
Family Income by Number of Earners in Robbins
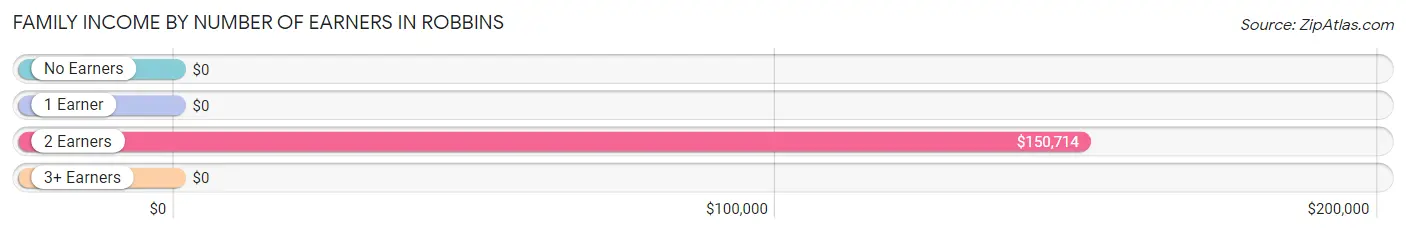
| Number of Earners | # Families | Median Income |
| No Earners | 0 (0.0%) | $0 |
| 1 Earner | 61 (58.1%) | $0 |
| 2 Earners | 32 (30.5%) | $150,714 |
| 3+ Earners | 12 (11.4%) | $0 |
| Total | 105 (100.0%) | $95,972 |
Household Income in Robbins
Household Income Brackets in Robbins
With 29 households falling in the category, the $100,000 to $149,999 income range is the most frequent in Robbins, accounting for 24.6% of all households.
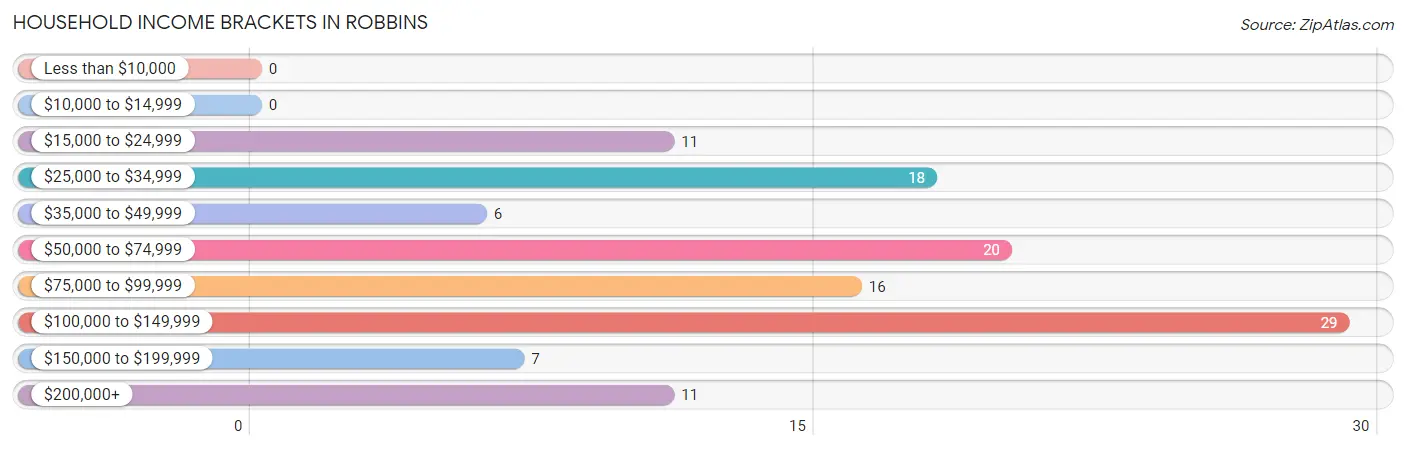
| Income Bracket | # Households | % Households |
| Less than $10,000 | 0 | 0.0% |
| $10,000 to $14,999 | 0 | 0.0% |
| $15,000 to $24,999 | 11 | 9.3% |
| $25,000 to $34,999 | 18 | 15.3% |
| $35,000 to $49,999 | 6 | 5.1% |
| $50,000 to $74,999 | 20 | 16.9% |
| $75,000 to $99,999 | 16 | 13.6% |
| $100,000 to $149,999 | 29 | 24.6% |
| $150,000 to $199,999 | 7 | 5.9% |
| $200,000+ | 11 | 9.3% |
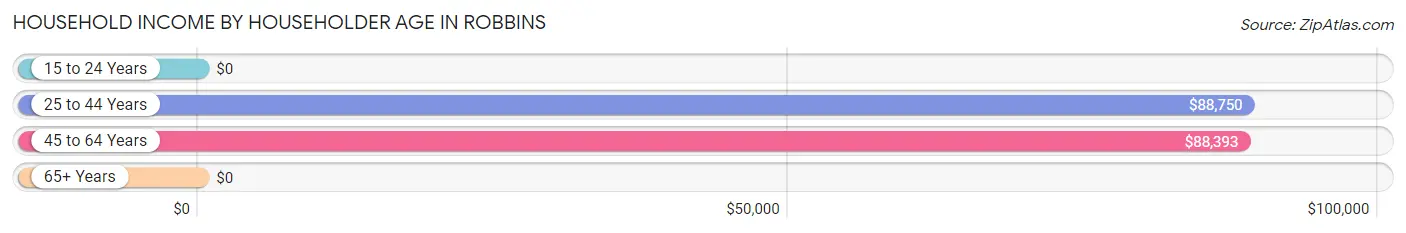
Household Income by Householder Age in Robbins
The median household income in Robbins is $88,929, with the highest median household income of $88,750 found in the 25 to 44 years age bracket for the primary householder. A total of 50 households (42.4%) fall into this category.
| Income Bracket | # Households | Median Income |
| 15 to 24 Years | 0 (0.0%) | $0 |
| 25 to 44 Years | 50 (42.4%) | $88,750 |
| 45 to 64 Years | 65 (55.1%) | $88,393 |
| 65+ Years | 3 (2.5%) | $0 |
| Total | 118 (100.0%) | $88,929 |
Poverty in Robbins
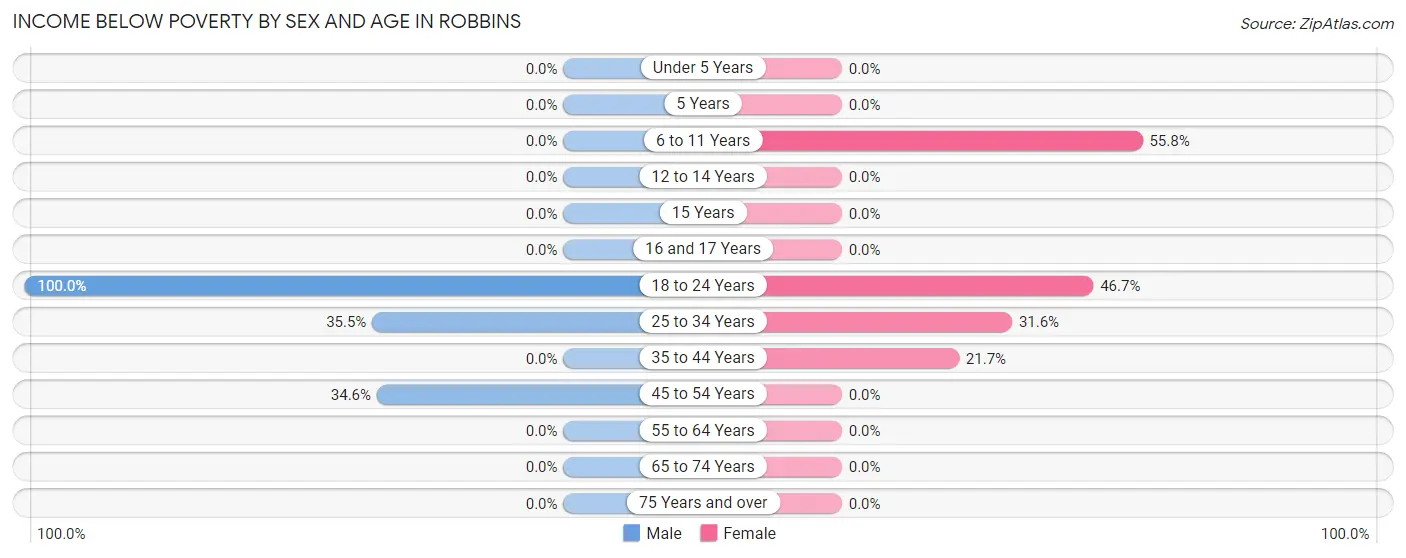
Income Below Poverty by Sex and Age in Robbins
With 18.8% poverty level for males and 25.1% for females among the residents of Robbins, 18 to 24 year old males and 6 to 11 year old females are the most vulnerable to poverty, with 9 males (100.0%) and 24 females (55.8%) in their respective age groups living below the poverty level.
| Age Bracket | Male | Female |
| Under 5 Years | 0 (0.0%) | 0 (0.0%) |
| 5 Years | 0 (0.0%) | 0 (0.0%) |
| 6 to 11 Years | 0 (0.0%) | 24 (55.8%) |
| 12 to 14 Years | 0 (0.0%) | 0 (0.0%) |
| 15 Years | 0 (0.0%) | 0 (0.0%) |
| 16 and 17 Years | 0 (0.0%) | 0 (0.0%) |
| 18 to 24 Years | 9 (100.0%) | 7 (46.7%) |
| 25 to 34 Years | 11 (35.5%) | 6 (31.6%) |
| 35 to 44 Years | 0 (0.0%) | 10 (21.7%) |
| 45 to 54 Years | 9 (34.6%) | 0 (0.0%) |
| 55 to 64 Years | 0 (0.0%) | 0 (0.0%) |
| 65 to 74 Years | 0 (0.0%) | 0 (0.0%) |
| 75 Years and over | 0 (0.0%) | 0 (0.0%) |
| Total | 29 (18.8%) | 47 (25.1%) |
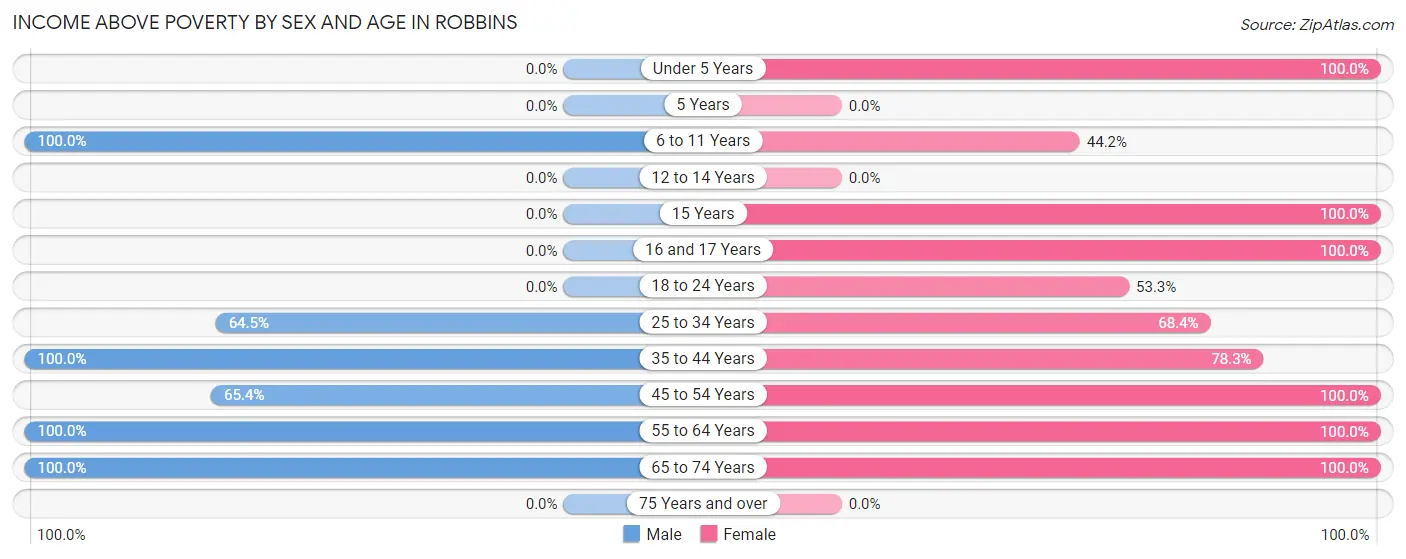
Income Above Poverty by Sex and Age in Robbins
According to the poverty statistics in Robbins, males aged 6 to 11 years and females aged under 5 years are the age groups that are most secure financially, with 100.0% of males and 100.0% of females in these age groups living above the poverty line.
| Age Bracket | Male | Female |
| Under 5 Years | 0 (0.0%) | 10 (100.0%) |
| 5 Years | 0 (0.0%) | 0 (0.0%) |
| 6 to 11 Years | 23 (100.0%) | 19 (44.2%) |
| 12 to 14 Years | 0 (0.0%) | 0 (0.0%) |
| 15 Years | 0 (0.0%) | 9 (100.0%) |
| 16 and 17 Years | 0 (0.0%) | 19 (100.0%) |
| 18 to 24 Years | 0 (0.0%) | 8 (53.3%) |
| 25 to 34 Years | 20 (64.5%) | 13 (68.4%) |
| 35 to 44 Years | 24 (100.0%) | 36 (78.3%) |
| 45 to 54 Years | 17 (65.4%) | 11 (100.0%) |
| 55 to 64 Years | 35 (100.0%) | 6 (100.0%) |
| 65 to 74 Years | 6 (100.0%) | 9 (100.0%) |
| 75 Years and over | 0 (0.0%) | 0 (0.0%) |
| Total | 125 (81.2%) | 140 (74.9%) |
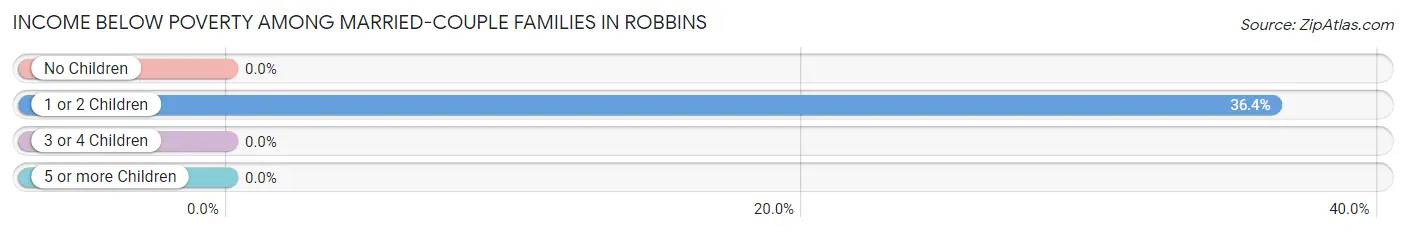
Income Below Poverty Among Married-Couple Families in Robbins
The poverty statistics for married-couple families in Robbins show that 22.7% or 20 of the total 88 families live below the poverty line. Families with 1 or 2 children have the highest poverty rate of 36.4%, comprising of 20 families. On the other hand, families with no children have the lowest poverty rate of 0.0%, which includes 0 families.
| Children | Above Poverty | Below Poverty |
| No Children | 33 (100.0%) | 0 (0.0%) |
| 1 or 2 Children | 35 (63.6%) | 20 (36.4%) |
| 3 or 4 Children | 0 (0.0%) | 0 (0.0%) |
| 5 or more Children | 0 (0.0%) | 0 (0.0%) |
| Total | 68 (77.3%) | 20 (22.7%) |
Income Below Poverty Among Single-Parent Households in Robbins
| Children | Single Father | Single Mother |
| No Children | 0 (0.0%) | 0 (0.0%) |
| 1 or 2 Children | 0 (0.0%) | 0 (0.0%) |
| 3 or 4 Children | 0 (0.0%) | 0 (0.0%) |
| 5 or more Children | 0 (0.0%) | 0 (0.0%) |
| Total | 0 (0.0%) | 0 (0.0%) |
Income Below Poverty Among Married-Couple vs Single-Parent Households in Robbins
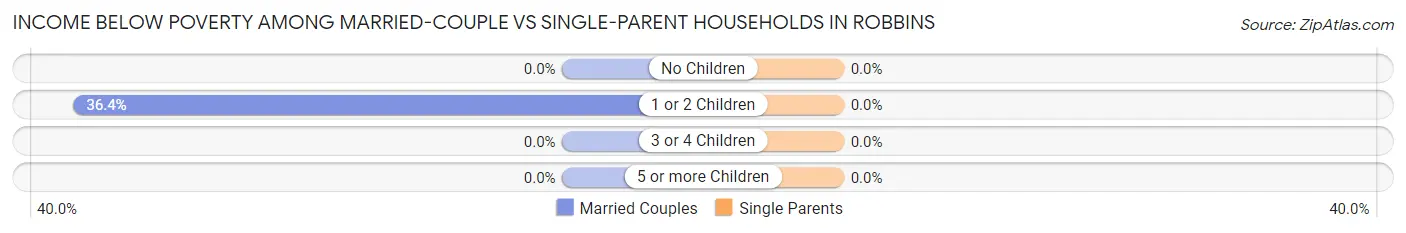
| Children | Married-Couple Families | Single-Parent Households |
| No Children | 0 (0.0%) | 0 (0.0%) |
| 1 or 2 Children | 20 (36.4%) | 0 (0.0%) |
| 3 or 4 Children | 0 (0.0%) | 0 (0.0%) |
| 5 or more Children | 0 (0.0%) | 0 (0.0%) |
| Total | 20 (22.7%) | 0 (0.0%) |
Race in Robbins
The most populous races in Robbins are White / Caucasian (316 | 92.7%), Hispanic or Latino (220 | 64.5%), and Some other Race (15 | 4.4%).
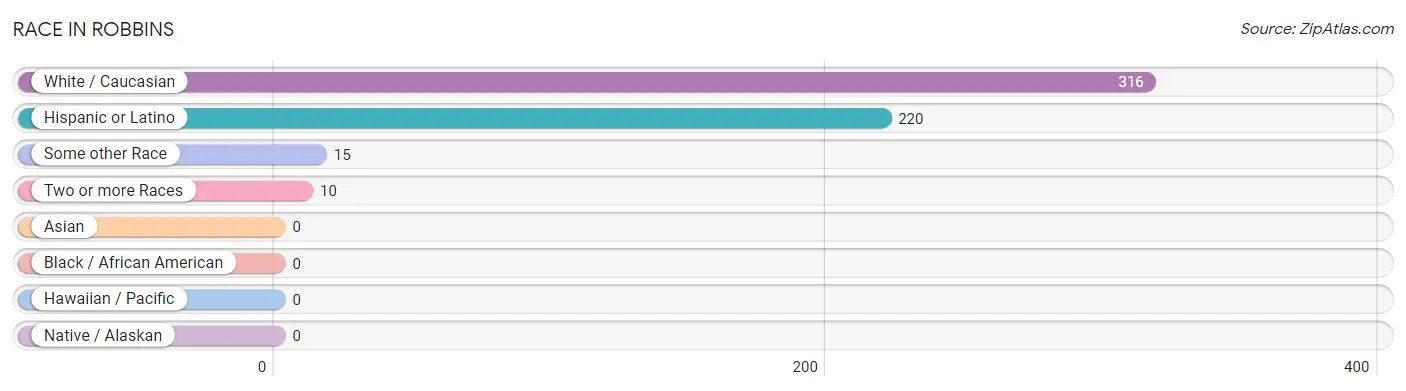
| Race | # Population | % Population |
| Asian | 0 | 0.0% |
| Black / African American | 0 | 0.0% |
| Hawaiian / Pacific | 0 | 0.0% |
| Hispanic or Latino | 220 | 64.5% |
| Native / Alaskan | 0 | 0.0% |
| White / Caucasian | 316 | 92.7% |
| Two or more Races | 10 | 2.9% |
| Some other Race | 15 | 4.4% |
| Total | 341 | 100.0% |
Ancestry in Robbins
The most populous ancestries reported in Robbins are Mexican (209 | 61.3%), Irish (89 | 26.1%), English (76 | 22.3%), German (27 | 7.9%), and American (11 | 3.2%), together accounting for 120.8% of all Robbins residents.
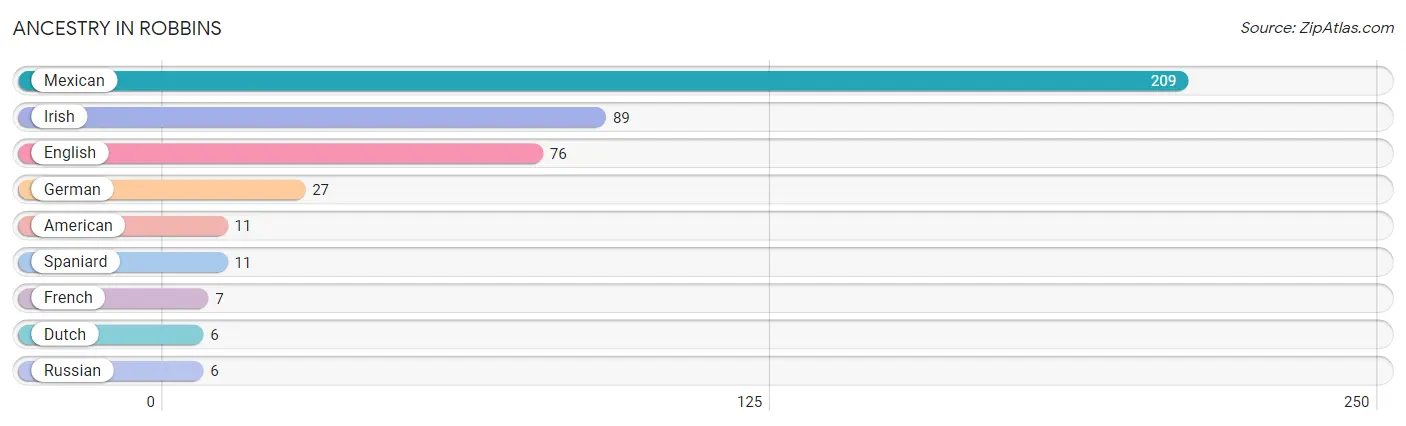
| Ancestry | # Population | % Population |
| American | 11 | 3.2% |
| Dutch | 6 | 1.8% |
| English | 76 | 22.3% |
| French | 7 | 2.1% |
| German | 27 | 7.9% |
| Irish | 89 | 26.1% |
| Mexican | 209 | 61.3% |
| Russian | 6 | 1.8% |
| Spaniard | 11 | 3.2% | View All 9 Rows |
Immigrants in Robbins
The most numerous immigrant groups reported in Robbins came from Central America (132 | 38.7%), Latin America (132 | 38.7%), Mexico (132 | 38.7%), Eastern Europe (6 | 1.8%), and Europe (6 | 1.8%), together accounting for 119.7% of all Robbins residents.
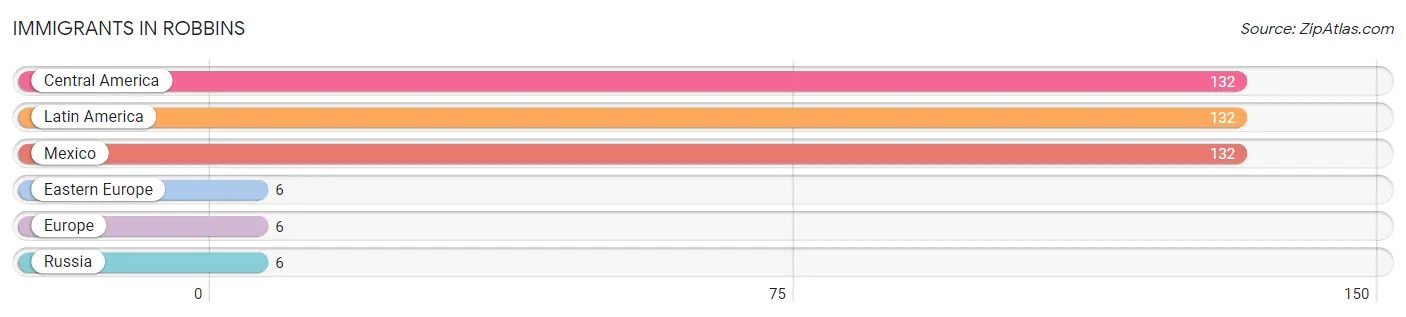
| Immigration Origin | # Population | % Population |
| Central America | 132 | 38.7% |
| Eastern Europe | 6 | 1.8% |
| Europe | 6 | 1.8% |
| Latin America | 132 | 38.7% |
| Mexico | 132 | 38.7% |
| Russia | 6 | 1.8% | View All 6 Rows |
Sex and Age in Robbins
Sex and Age in Robbins
The most populous age groups in Robbins are 50 to 54 Years (26 | 16.9%) for men and 15 to 19 Years (28 | 15.0%) for women.
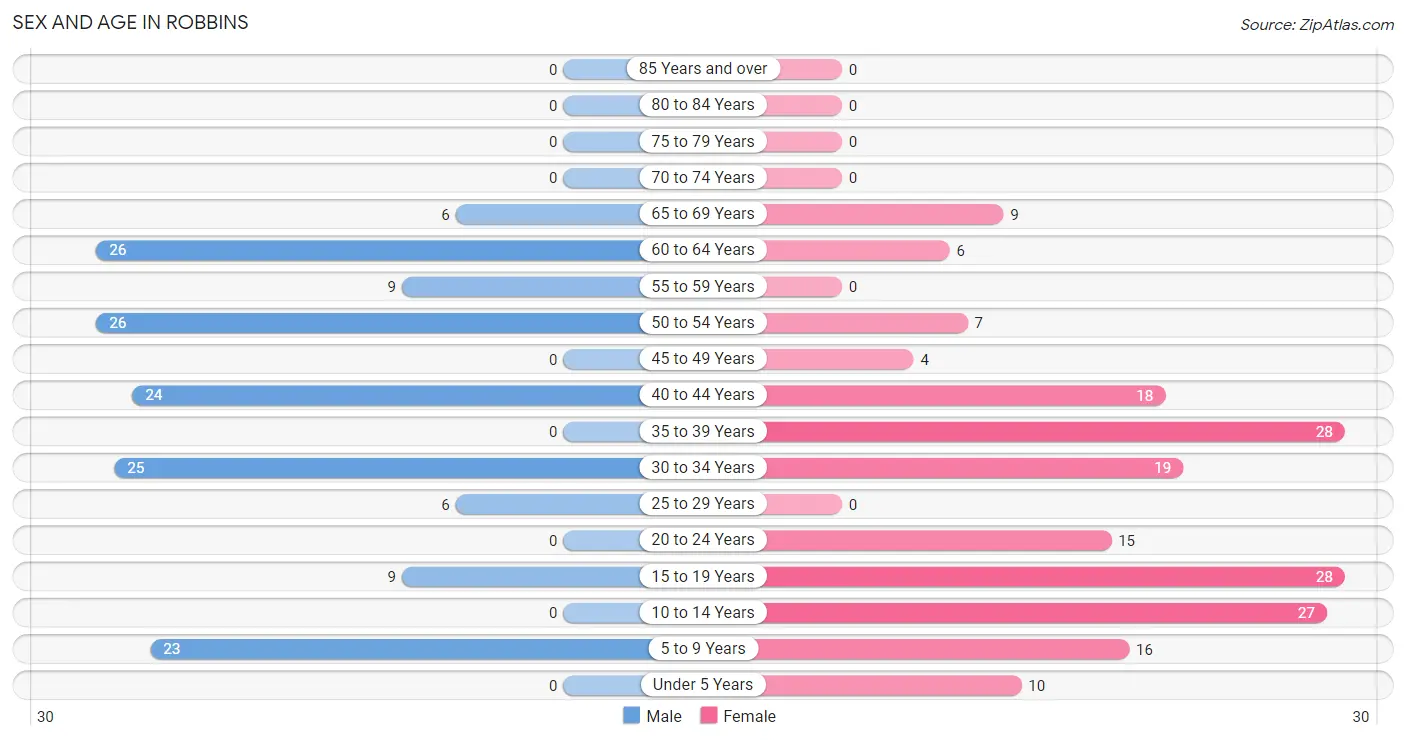
| Age Bracket | Male | Female |
| Under 5 Years | 0 (0.0%) | 10 (5.3%) |
| 5 to 9 Years | 23 (14.9%) | 16 (8.6%) |
| 10 to 14 Years | 0 (0.0%) | 27 (14.4%) |
| 15 to 19 Years | 9 (5.8%) | 28 (15.0%) |
| 20 to 24 Years | 0 (0.0%) | 15 (8.0%) |
| 25 to 29 Years | 6 (3.9%) | 0 (0.0%) |
| 30 to 34 Years | 25 (16.2%) | 19 (10.2%) |
| 35 to 39 Years | 0 (0.0%) | 28 (15.0%) |
| 40 to 44 Years | 24 (15.6%) | 18 (9.6%) |
| 45 to 49 Years | 0 (0.0%) | 4 (2.1%) |
| 50 to 54 Years | 26 (16.9%) | 7 (3.7%) |
| 55 to 59 Years | 9 (5.8%) | 0 (0.0%) |
| 60 to 64 Years | 26 (16.9%) | 6 (3.2%) |
| 65 to 69 Years | 6 (3.9%) | 9 (4.8%) |
| 70 to 74 Years | 0 (0.0%) | 0 (0.0%) |
| 75 to 79 Years | 0 (0.0%) | 0 (0.0%) |
| 80 to 84 Years | 0 (0.0%) | 0 (0.0%) |
| 85 Years and over | 0 (0.0%) | 0 (0.0%) |
| Total | 154 (100.0%) | 187 (100.0%) |
Families and Households in Robbins
Median Family Size in Robbins
The median family size in Robbins is 3.12 persons per family, with single female/mother families (9 | 8.6%) accounting for the largest median family size of 3.56 persons per family. On the other hand, single male/father families (8 | 7.6%) represent the smallest median family size with 2.13 persons per family.
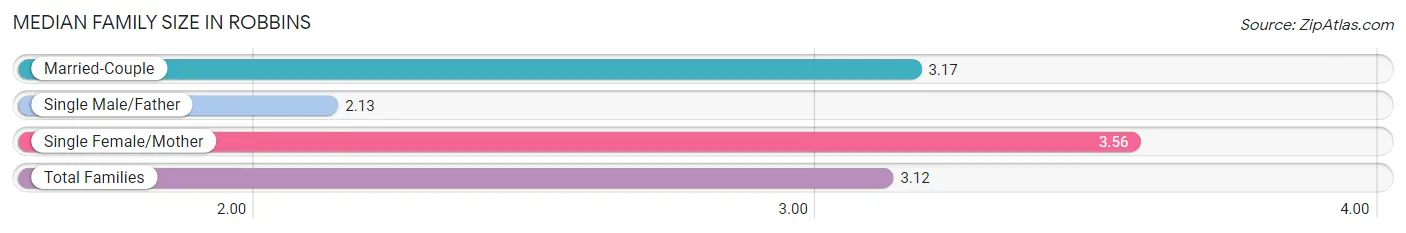
| Family Type | # Families | Family Size |
| Married-Couple | 88 (83.8%) | 3.17 |
| Single Male/Father | 8 (7.6%) | 2.13 |
| Single Female/Mother | 9 (8.6%) | 3.56 |
| Total Families | 105 (100.0%) | 3.12 |
Median Household Size in Robbins
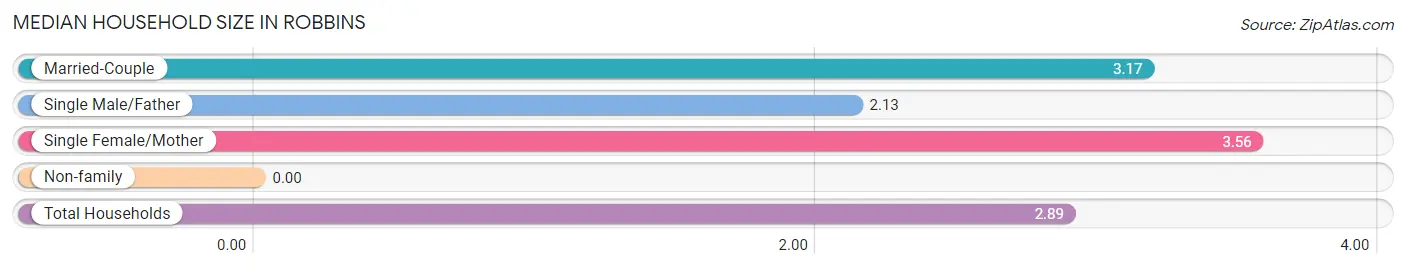
| Household Type | # Households | Household Size |
| Married-Couple | 88 (74.6%) | 3.17 |
| Single Male/Father | 8 (6.8%) | 2.13 |
| Single Female/Mother | 9 (7.6%) | 3.56 |
| Non-family | 13 (11.0%) | - |
| Total Households | 118 (100.0%) | 2.89 |
Household Size by Marriage Status in Robbins
Out of a total of 118 households in Robbins, 105 (89.0%) are family households, while 13 (11.0%) are nonfamily households. The most numerous type of family households are 2-person households, comprising 41, and the most common type of nonfamily households are 1-person households, comprising 13.
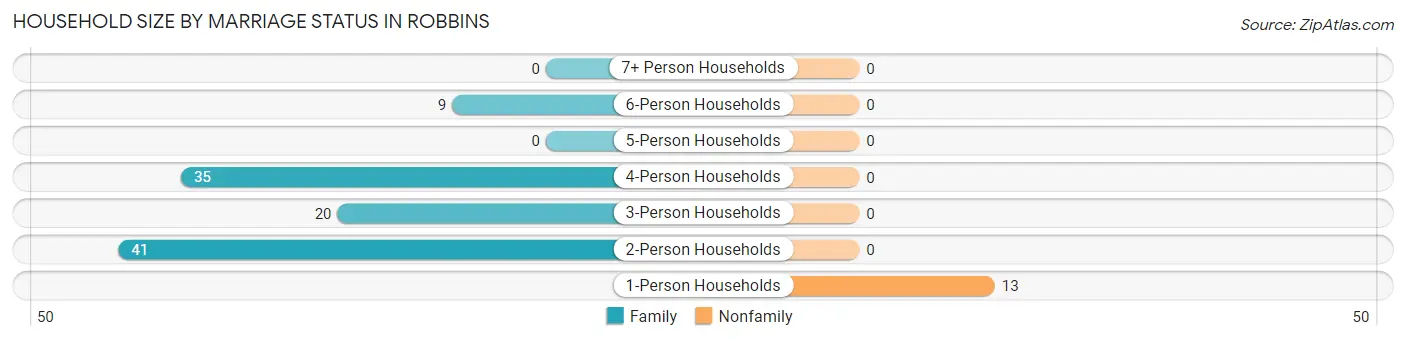
| Household Size | Family Households | Nonfamily Households |
| 1-Person Households | - | 13 (11.0%) |
| 2-Person Households | 41 (34.7%) | 0 (0.0%) |
| 3-Person Households | 20 (17.0%) | 0 (0.0%) |
| 4-Person Households | 35 (29.7%) | 0 (0.0%) |
| 5-Person Households | 0 (0.0%) | 0 (0.0%) |
| 6-Person Households | 9 (7.6%) | 0 (0.0%) |
| 7+ Person Households | 0 (0.0%) | 0 (0.0%) |
| Total | 105 (89.0%) | 13 (11.0%) |
Female Fertility in Robbins
Fertility by Age in Robbins
| Age Bracket | Women with Births | Births / 1,000 Women |
| 15 to 19 years | 0 (0.0%) | 0.0 |
| 20 to 34 years | 0 (0.0%) | 0.0 |
| 35 to 50 years | 0 (0.0%) | 0.0 |
| Total | 0 (0.0%) | 0.0 |
Fertility by Age by Marriage Status in Robbins
| Age Bracket | Married | Unmarried |
| 15 to 19 years | 0 (0.0%) | 0 (0.0%) |
| 20 to 34 years | 0 (0.0%) | 0 (0.0%) |
| 35 to 50 years | 0 (0.0%) | 0 (0.0%) |
| Total | 0 (0.0%) | 0 (0.0%) |
Fertility by Education in Robbins
| Educational Attainment | Women with Births | Births / 1,000 Women |
| Less than High School | 0 (0.0%) | 0.0 |
| High School Diploma | 0 (0.0%) | 0.0 |
| College or Associate's Degree | 0 (0.0%) | 0.0 |
| Bachelor's Degree | 0 (0.0%) | 0.0 |
| Graduate Degree | 0 (0.0%) | 0.0 |
| Total | 0 (0.0%) | 0.0 |
Fertility by Education by Marriage Status in Robbins
| Educational Attainment | Married | Unmarried |
| Less than High School | 0 (0.0%) | 0 (0.0%) |
| High School Diploma | 0 (0.0%) | 0 (0.0%) |
| College or Associate's Degree | 0 (0.0%) | 0 (0.0%) |
| Bachelor's Degree | 0 (0.0%) | 0 (0.0%) |
| Graduate Degree | 0 (0.0%) | 0 (0.0%) |
| Total | 0 (0.0%) | 0 (0.0%) |
Employment Characteristics in Robbins
Employment by Class of Employer in Robbins
Among the 132 employed individuals in Robbins, private company employees (85 | 64.4%), local government employees (16 | 12.1%), and self-employed (not incorporated) (15 | 11.4%) make up the most common classes of employment.
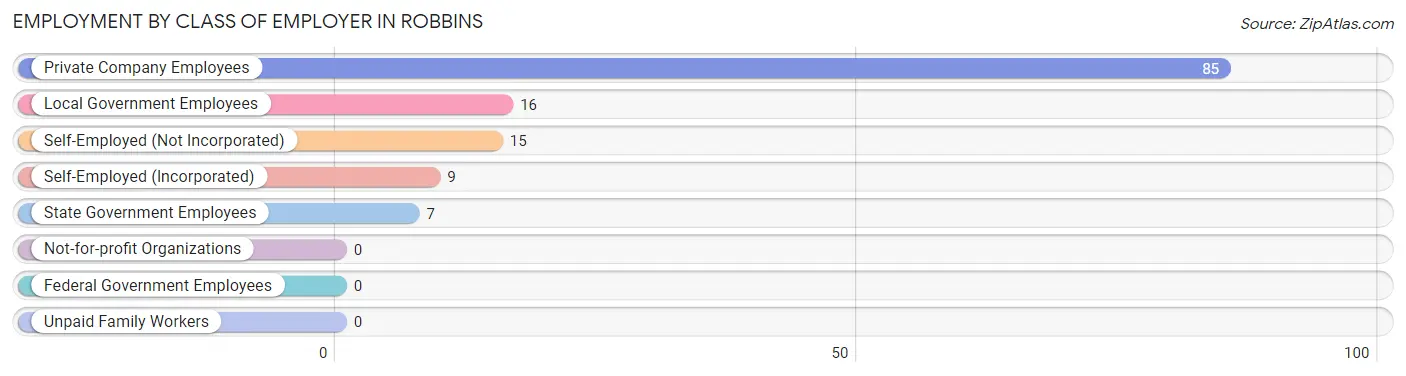
| Employer Class | # Employees | % Employees |
| Private Company Employees | 85 | 64.4% |
| Self-Employed (Incorporated) | 9 | 6.8% |
| Self-Employed (Not Incorporated) | 15 | 11.4% |
| Not-for-profit Organizations | 0 | 0.0% |
| Local Government Employees | 16 | 12.1% |
| State Government Employees | 7 | 5.3% |
| Federal Government Employees | 0 | 0.0% |
| Unpaid Family Workers | 0 | 0.0% |
| Total | 132 | 100.0% |
Employment Status by Age in Robbins
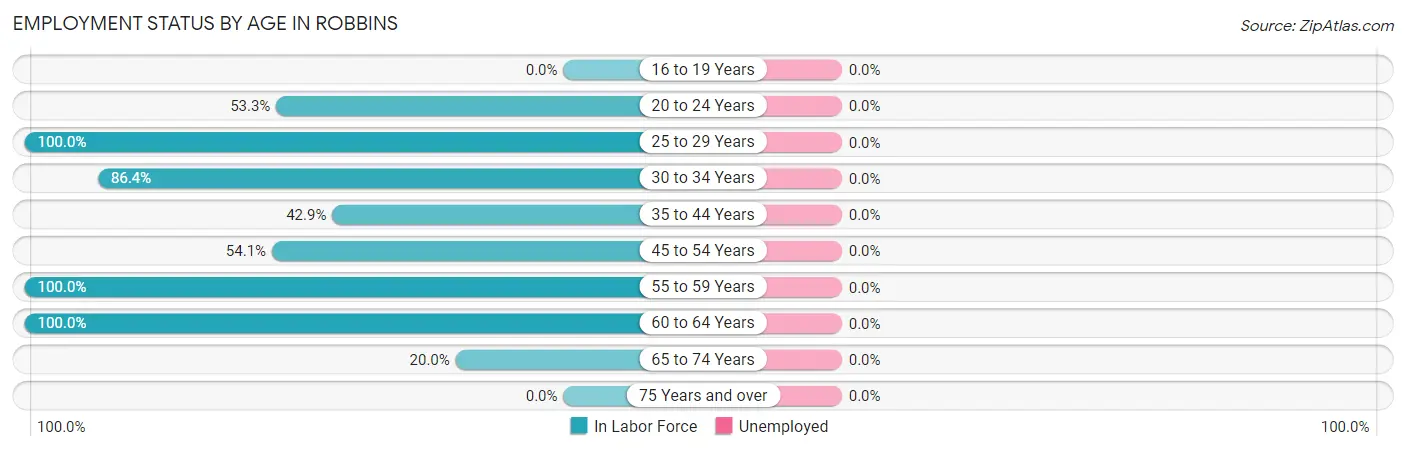
| Age Bracket | In Labor Force | Unemployed |
| 16 to 19 Years | 0 (0.0%) | 0 (0.0%) |
| 20 to 24 Years | 8 (53.3%) | 0 (0.0%) |
| 25 to 29 Years | 6 (100.0%) | 0 (0.0%) |
| 30 to 34 Years | 38 (86.4%) | 0 (0.0%) |
| 35 to 44 Years | 30 (42.9%) | 0 (0.0%) |
| 45 to 54 Years | 20 (54.1%) | 0 (0.0%) |
| 55 to 59 Years | 9 (100.0%) | 0 (0.0%) |
| 60 to 64 Years | 32 (100.0%) | 0 (0.0%) |
| 65 to 74 Years | 3 (20.0%) | 0 (0.0%) |
| 75 Years and over | 0 (0.0%) | 0 (0.0%) |
| Total | 146 (57.0%) | 0 (0.0%) |
Employment Status by Educational Attainment in Robbins
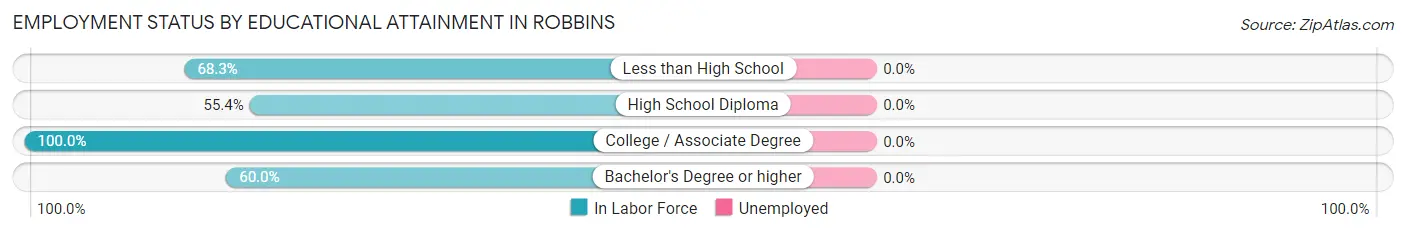
| Educational Attainment | In Labor Force | Unemployed |
| Less than High School | 43 (68.3%) | 0 (0.0%) |
| High School Diploma | 31 (55.4%) | 0 (0.0%) |
| College / Associate Degree | 34 (100.0%) | 0 (0.0%) |
| Bachelor's Degree or higher | 27 (60.0%) | 0 (0.0%) |
| Total | 135 (68.2%) | 0 (0.0%) |
Employment Occupations by Sex in Robbins
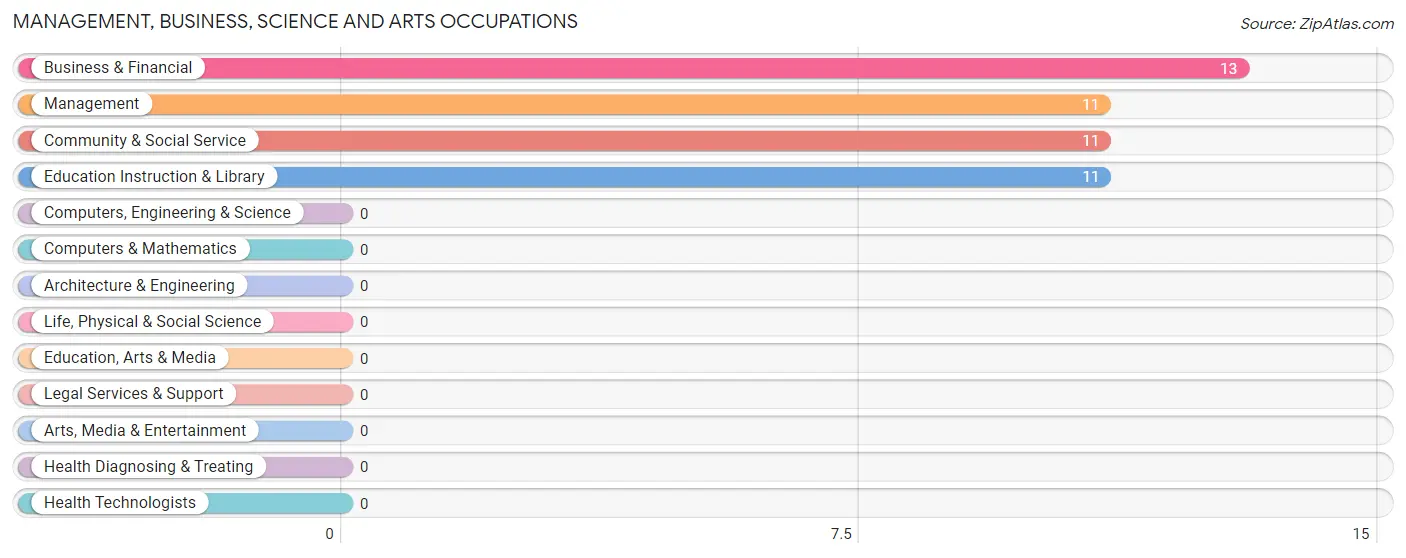
Management, Business, Science and Arts Occupations
The most common Management, Business, Science and Arts occupations in Robbins are Business & Financial (13 | 8.9%), Management (11 | 7.5%), Community & Social Service (11 | 7.5%), and Education Instruction & Library (11 | 7.5%).
Management, Business, Science and Arts Occupations by Sex
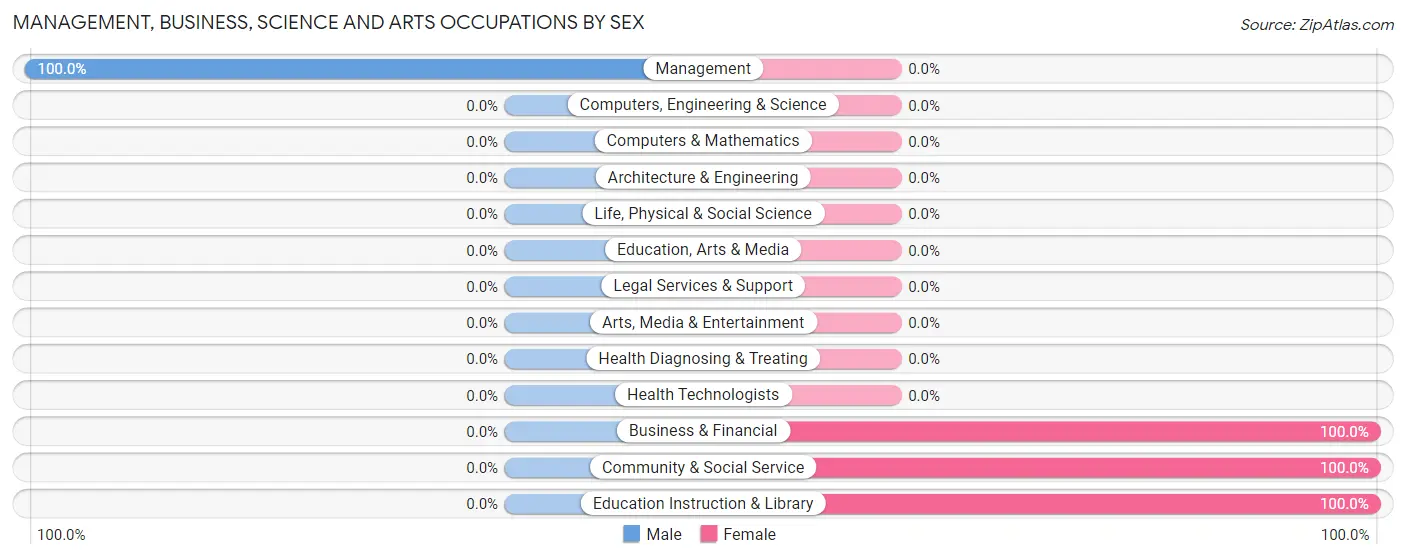
| Occupation | Male | Female |
| Management | 11 (100.0%) | 0 (0.0%) |
| Business & Financial | 0 (0.0%) | 13 (100.0%) |
| Computers, Engineering & Science | 0 (0.0%) | 0 (0.0%) |
| Computers & Mathematics | 0 (0.0%) | 0 (0.0%) |
| Architecture & Engineering | 0 (0.0%) | 0 (0.0%) |
| Life, Physical & Social Science | 0 (0.0%) | 0 (0.0%) |
| Community & Social Service | 0 (0.0%) | 11 (100.0%) |
| Education, Arts & Media | 0 (0.0%) | 0 (0.0%) |
| Legal Services & Support | 0 (0.0%) | 0 (0.0%) |
| Education Instruction & Library | 0 (0.0%) | 11 (100.0%) |
| Arts, Media & Entertainment | 0 (0.0%) | 0 (0.0%) |
| Health Diagnosing & Treating | 0 (0.0%) | 0 (0.0%) |
| Health Technologists | 0 (0.0%) | 0 (0.0%) |
| Total (Category) | 11 (31.4%) | 24 (68.6%) |
| Total (Overall) | 99 (67.8%) | 47 (32.2%) |
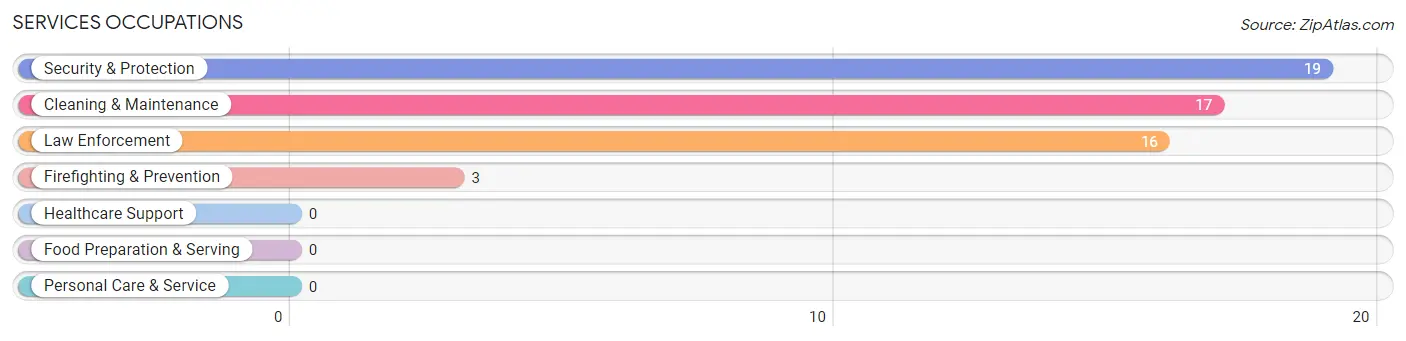
Services Occupations
The most common Services occupations in Robbins are Security & Protection (19 | 13.0%), Cleaning & Maintenance (17 | 11.6%), Law Enforcement (16 | 11.0%), and Firefighting & Prevention (3 | 2.1%).
Services Occupations by Sex
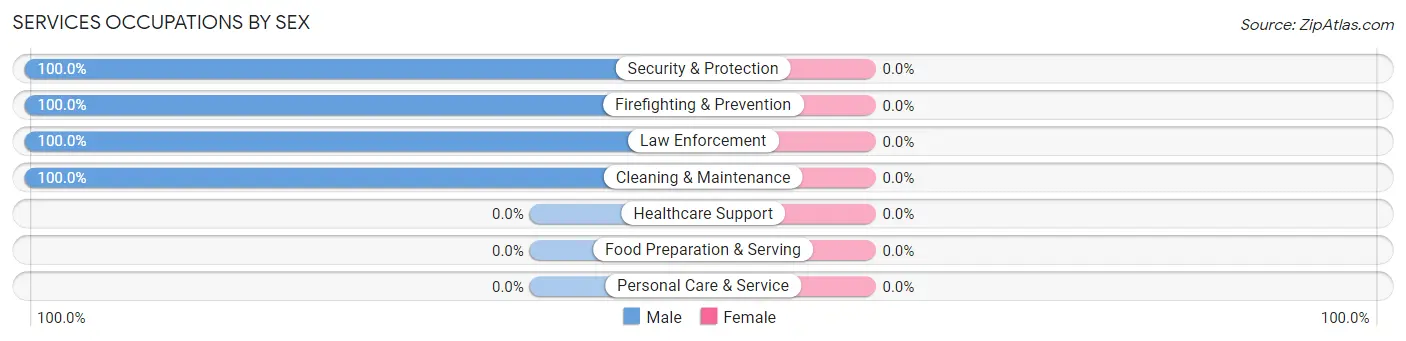
| Occupation | Male | Female |
| Healthcare Support | 0 (0.0%) | 0 (0.0%) |
| Security & Protection | 19 (100.0%) | 0 (0.0%) |
| Firefighting & Prevention | 3 (100.0%) | 0 (0.0%) |
| Law Enforcement | 16 (100.0%) | 0 (0.0%) |
| Food Preparation & Serving | 0 (0.0%) | 0 (0.0%) |
| Cleaning & Maintenance | 17 (100.0%) | 0 (0.0%) |
| Personal Care & Service | 0 (0.0%) | 0 (0.0%) |
| Total (Category) | 36 (100.0%) | 0 (0.0%) |
| Total (Overall) | 99 (67.8%) | 47 (32.2%) |
Sales and Office Occupations
The most common Sales and Office occupations in Robbins are Office & Administration (17 | 11.6%), and Sales & Related (7 | 4.8%).
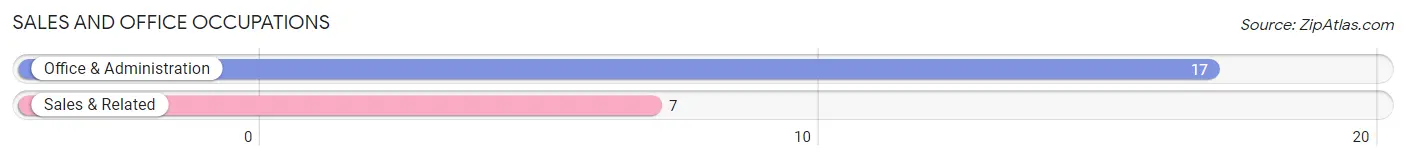
Sales and Office Occupations by Sex
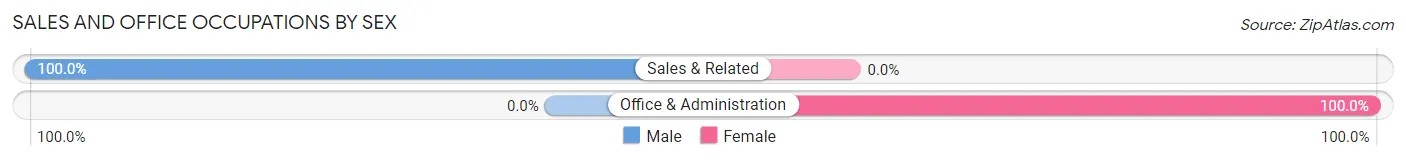
| Occupation | Male | Female |
| Sales & Related | 7 (100.0%) | 0 (0.0%) |
| Office & Administration | 0 (0.0%) | 17 (100.0%) |
| Total (Category) | 7 (29.2%) | 17 (70.8%) |
| Total (Overall) | 99 (67.8%) | 47 (32.2%) |
Natural Resources, Construction and Maintenance Occupations
The most common Natural Resources, Construction and Maintenance occupations in Robbins are Farming, Fishing & Forestry (30 | 20.5%), and Installation, Maintenance & Repair (11 | 7.5%).
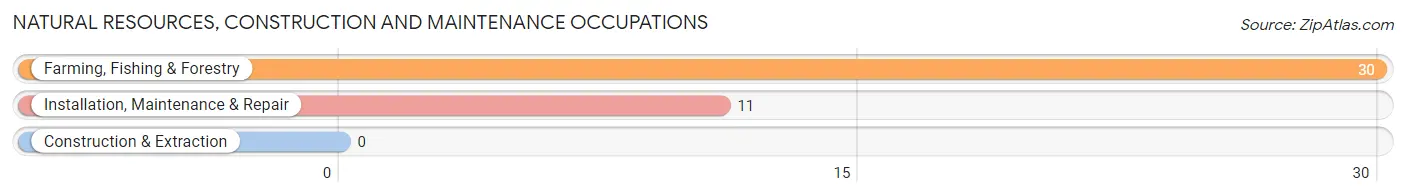
Natural Resources, Construction and Maintenance Occupations by Sex
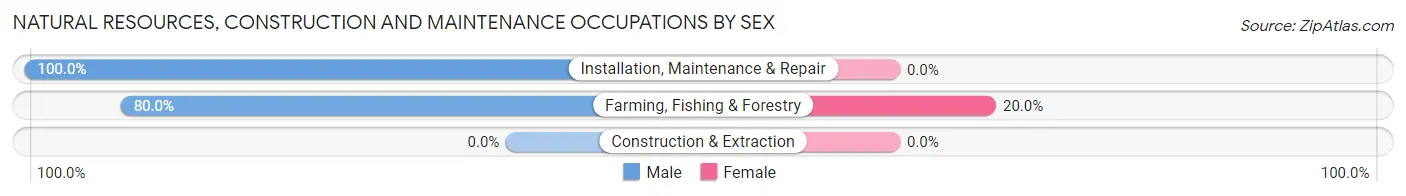
| Occupation | Male | Female |
| Farming, Fishing & Forestry | 24 (80.0%) | 6 (20.0%) |
| Construction & Extraction | 0 (0.0%) | 0 (0.0%) |
| Installation, Maintenance & Repair | 11 (100.0%) | 0 (0.0%) |
| Total (Category) | 35 (85.4%) | 6 (14.6%) |
| Total (Overall) | 99 (67.8%) | 47 (32.2%) |
Production, Transportation and Moving Occupations
The most common Production, Transportation and Moving occupations in Robbins are Transportation (6 | 4.1%), and Production (4 | 2.7%).
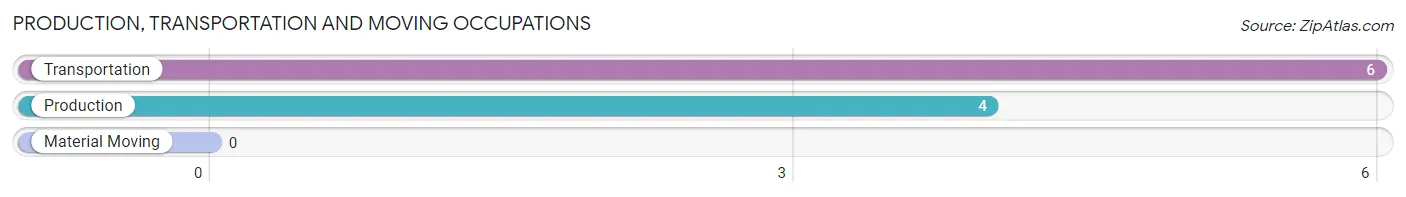
Production, Transportation and Moving Occupations by Sex
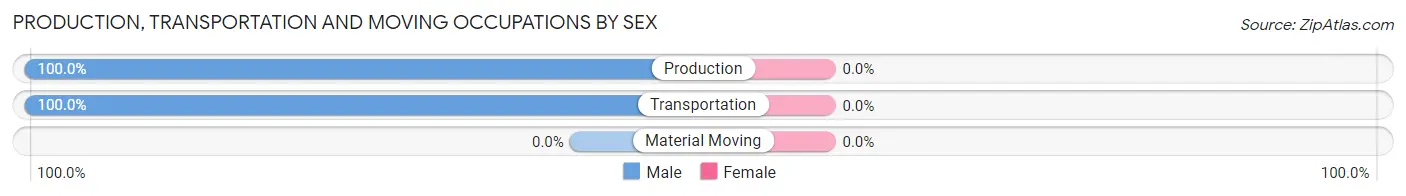
| Occupation | Male | Female |
| Production | 4 (100.0%) | 0 (0.0%) |
| Transportation | 6 (100.0%) | 0 (0.0%) |
| Material Moving | 0 (0.0%) | 0 (0.0%) |
| Total (Category) | 10 (100.0%) | 0 (0.0%) |
| Total (Overall) | 99 (67.8%) | 47 (32.2%) |
Employment Industries by Sex in Robbins
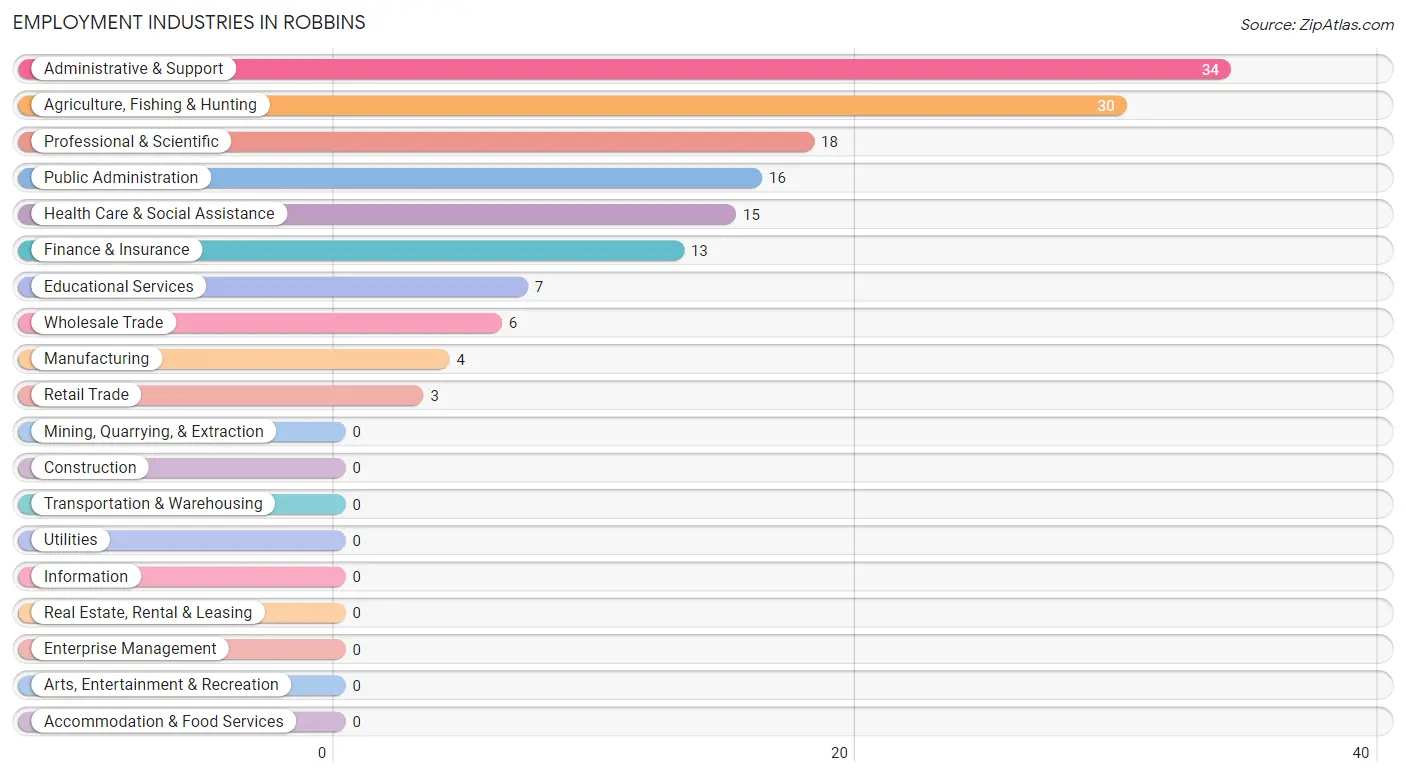
Employment Industries in Robbins
The major employment industries in Robbins include Administrative & Support (34 | 23.3%), Agriculture, Fishing & Hunting (30 | 20.5%), Professional & Scientific (18 | 12.3%), Public Administration (16 | 11.0%), and Health Care & Social Assistance (15 | 10.3%).
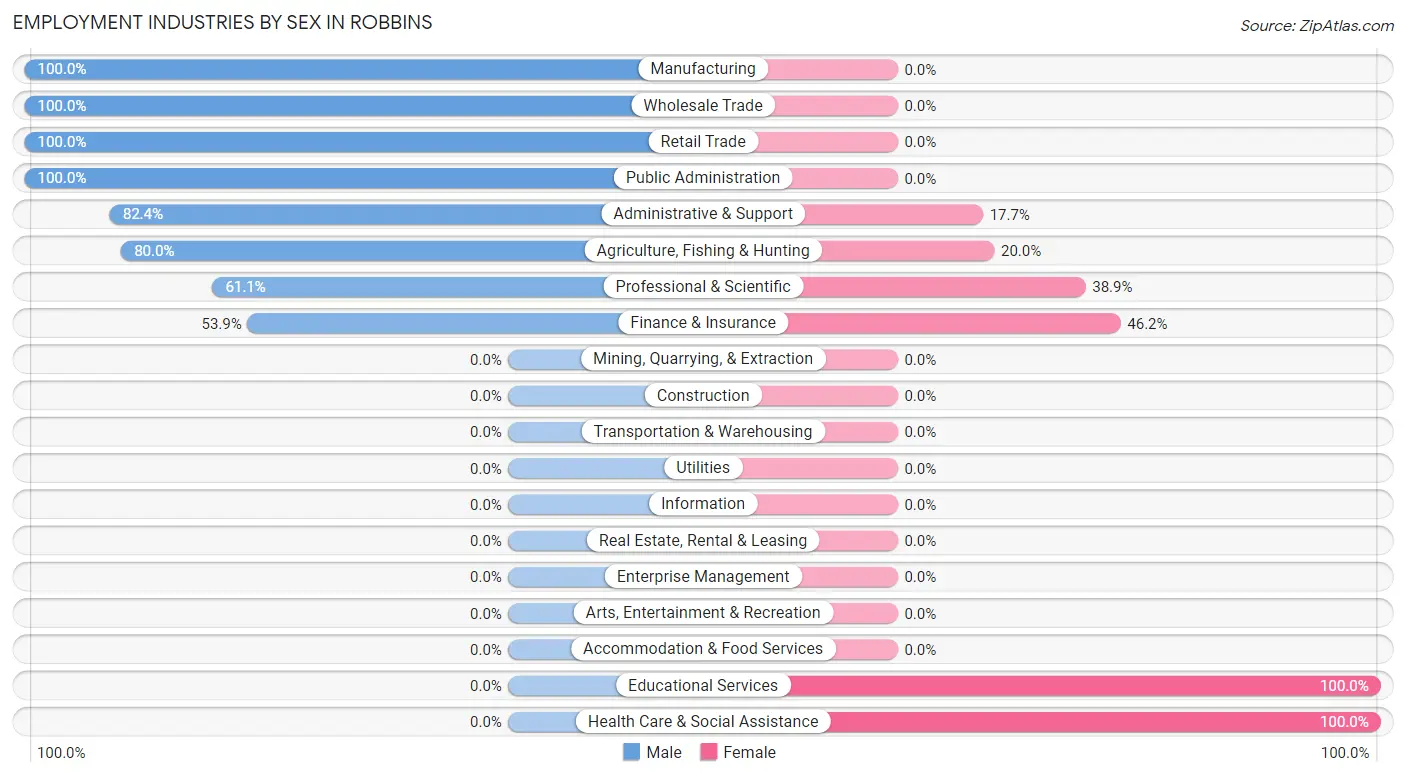
Employment Industries by Sex in Robbins
The Robbins industries that see more men than women are Manufacturing (100.0%), Wholesale Trade (100.0%), and Retail Trade (100.0%), whereas the industries that tend to have a higher number of women are Educational Services (100.0%), Health Care & Social Assistance (100.0%), and Finance & Insurance (46.2%).
| Industry | Male | Female |
| Agriculture, Fishing & Hunting | 24 (80.0%) | 6 (20.0%) |
| Mining, Quarrying, & Extraction | 0 (0.0%) | 0 (0.0%) |
| Construction | 0 (0.0%) | 0 (0.0%) |
| Manufacturing | 4 (100.0%) | 0 (0.0%) |
| Wholesale Trade | 6 (100.0%) | 0 (0.0%) |
| Retail Trade | 3 (100.0%) | 0 (0.0%) |
| Transportation & Warehousing | 0 (0.0%) | 0 (0.0%) |
| Utilities | 0 (0.0%) | 0 (0.0%) |
| Information | 0 (0.0%) | 0 (0.0%) |
| Finance & Insurance | 7 (53.8%) | 6 (46.2%) |
| Real Estate, Rental & Leasing | 0 (0.0%) | 0 (0.0%) |
| Professional & Scientific | 11 (61.1%) | 7 (38.9%) |
| Enterprise Management | 0 (0.0%) | 0 (0.0%) |
| Administrative & Support | 28 (82.4%) | 6 (17.6%) |
| Educational Services | 0 (0.0%) | 7 (100.0%) |
| Health Care & Social Assistance | 0 (0.0%) | 15 (100.0%) |
| Arts, Entertainment & Recreation | 0 (0.0%) | 0 (0.0%) |
| Accommodation & Food Services | 0 (0.0%) | 0 (0.0%) |
| Public Administration | 16 (100.0%) | 0 (0.0%) |
| Total | 99 (67.8%) | 47 (32.2%) |
Education in Robbins
School Enrollment in Robbins
The most common levels of schooling among the 125 students in Robbins are elementary school (58 | 46.4%), high school (37 | 29.6%), and college / undergraduate (22 | 17.6%).
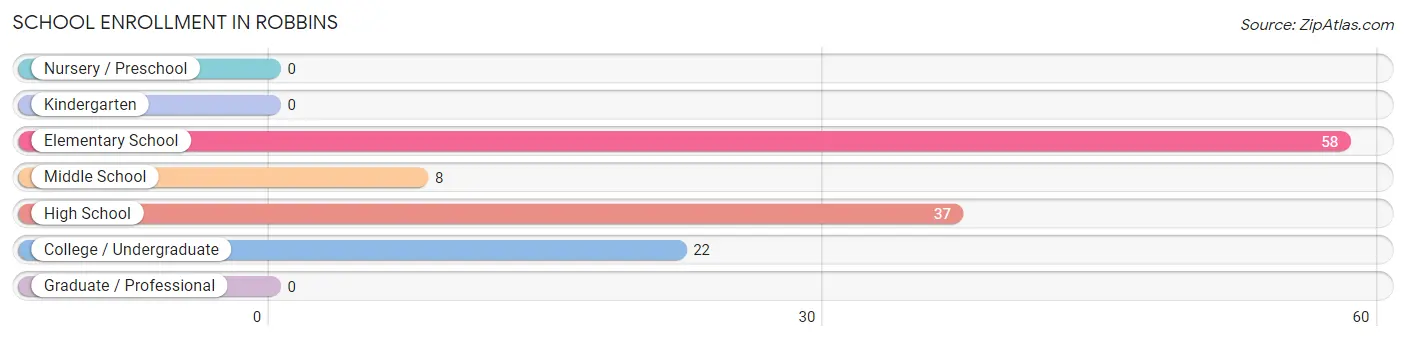
| School Level | # Students | % Students |
| Nursery / Preschool | 0 | 0.0% |
| Kindergarten | 0 | 0.0% |
| Elementary School | 58 | 46.4% |
| Middle School | 8 | 6.4% |
| High School | 37 | 29.6% |
| College / Undergraduate | 22 | 17.6% |
| Graduate / Professional | 0 | 0.0% |
| Total | 125 | 100.0% |
School Enrollment by Age by Funding Source in Robbins
Out of a total of 125 students who are enrolled in schools in Robbins, 42 (33.6%) attend a private institution, while the remaining 83 (66.4%) are enrolled in public schools. The age group of 10 to 14 year olds has the highest likelihood of being enrolled in private schools, with 19 (70.4% in the age bracket) enrolled. Conversely, the age group of 15 to 17 year olds has the lowest likelihood of being enrolled in a private school, with 28 (100.0% in the age bracket) attending a public institution.
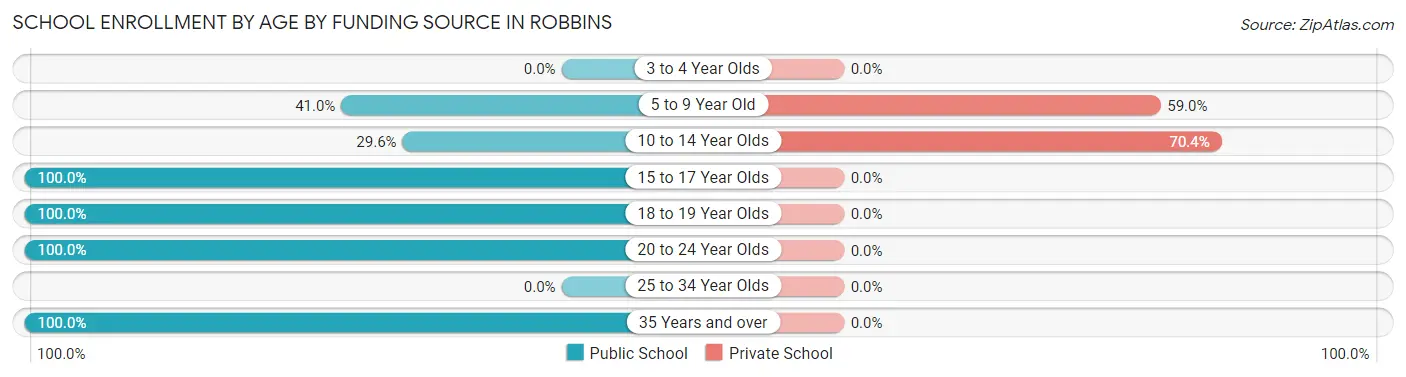
| Age Bracket | Public School | Private School |
| 3 to 4 Year Olds | 0 (0.0%) | 0 (0.0%) |
| 5 to 9 Year Old | 16 (41.0%) | 23 (59.0%) |
| 10 to 14 Year Olds | 8 (29.6%) | 19 (70.4%) |
| 15 to 17 Year Olds | 28 (100.0%) | 0 (0.0%) |
| 18 to 19 Year Olds | 9 (100.0%) | 0 (0.0%) |
| 20 to 24 Year Olds | 15 (100.0%) | 0 (0.0%) |
| 25 to 34 Year Olds | 0 (0.0%) | 0 (0.0%) |
| 35 Years and over | 7 (100.0%) | 0 (0.0%) |
| Total | 83 (66.4%) | 42 (33.6%) |
Educational Attainment by Field of Study in Robbins
Business (35 | 55.6%), liberal arts & history (18 | 28.6%), and arts & humanities (10 | 15.9%) are the most common fields of study among 63 individuals in Robbins who have obtained a bachelor's degree or higher.
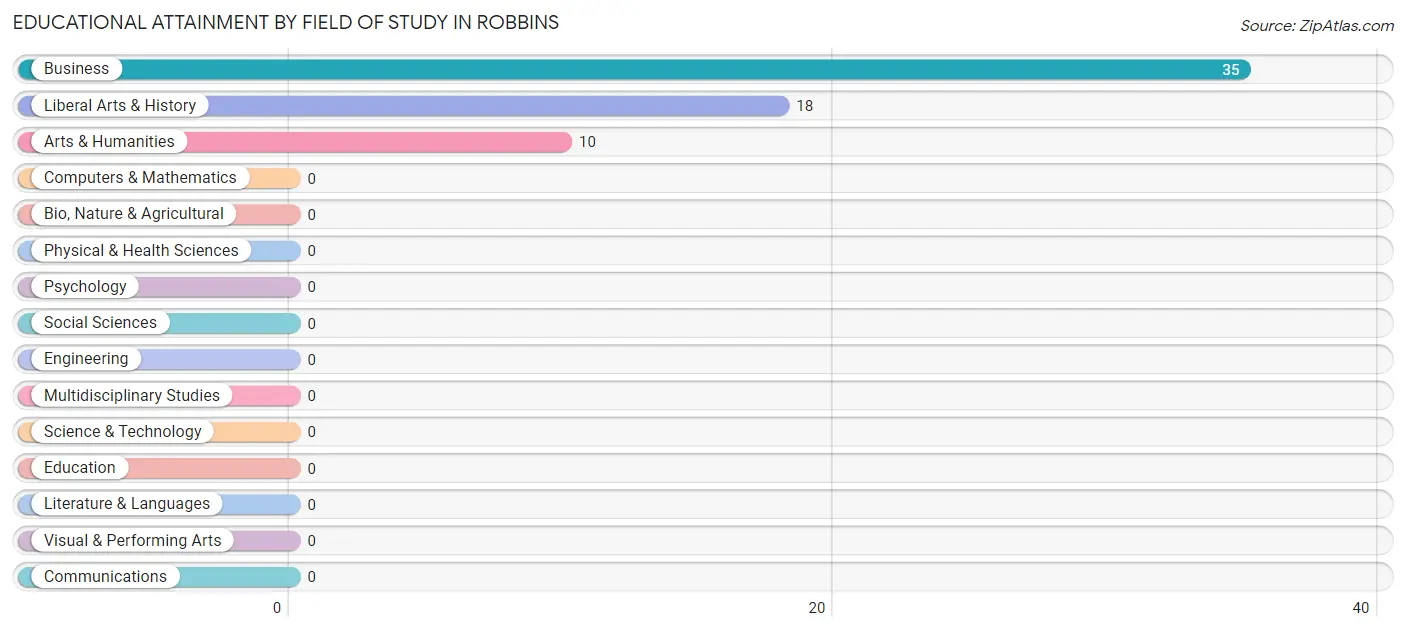
| Field of Study | # Graduates | % Graduates |
| Computers & Mathematics | 0 | 0.0% |
| Bio, Nature & Agricultural | 0 | 0.0% |
| Physical & Health Sciences | 0 | 0.0% |
| Psychology | 0 | 0.0% |
| Social Sciences | 0 | 0.0% |
| Engineering | 0 | 0.0% |
| Multidisciplinary Studies | 0 | 0.0% |
| Science & Technology | 0 | 0.0% |
| Business | 35 | 55.6% |
| Education | 0 | 0.0% |
| Literature & Languages | 0 | 0.0% |
| Liberal Arts & History | 18 | 28.6% |
| Visual & Performing Arts | 0 | 0.0% |
| Communications | 0 | 0.0% |
| Arts & Humanities | 10 | 15.9% |
| Total | 63 | 100.0% |
Transportation & Commute in Robbins
Vehicle Availability by Sex in Robbins
The most prevalent vehicle ownership categories in Robbins are males with 2 vehicles (68, accounting for 73.1%) and females with 2 vehicles (19, making up 174.4%).
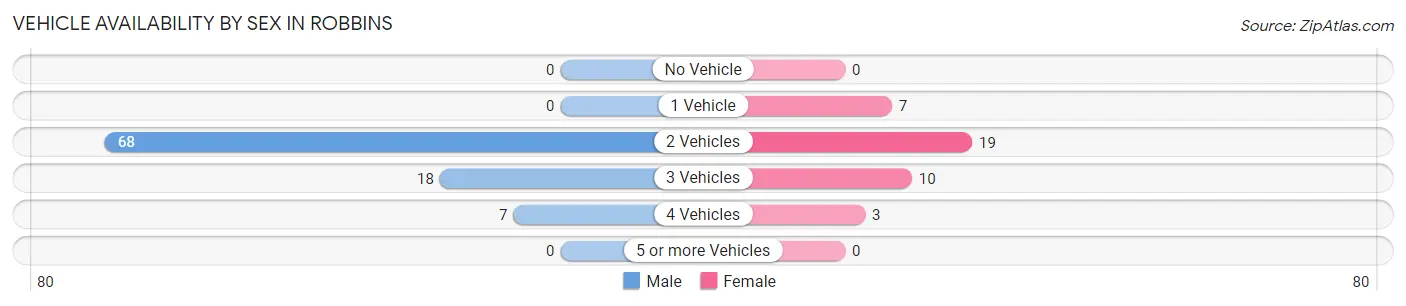
| Vehicles Available | Male | Female |
| No Vehicle | 0 (0.0%) | 0 (0.0%) |
| 1 Vehicle | 0 (0.0%) | 7 (17.9%) |
| 2 Vehicles | 68 (73.1%) | 19 (48.7%) |
| 3 Vehicles | 18 (19.4%) | 10 (25.6%) |
| 4 Vehicles | 7 (7.5%) | 3 (7.7%) |
| 5 or more Vehicles | 0 (0.0%) | 0 (0.0%) |
| Total | 93 (100.0%) | 39 (100.0%) |
Commute Time in Robbins
The most frequently occuring commute durations in Robbins are 30 to 34 minutes (20 commuters, 18.3%), 40 to 44 minutes (18 commuters, 16.5%), and 45 to 59 minutes (16 commuters, 14.7%).
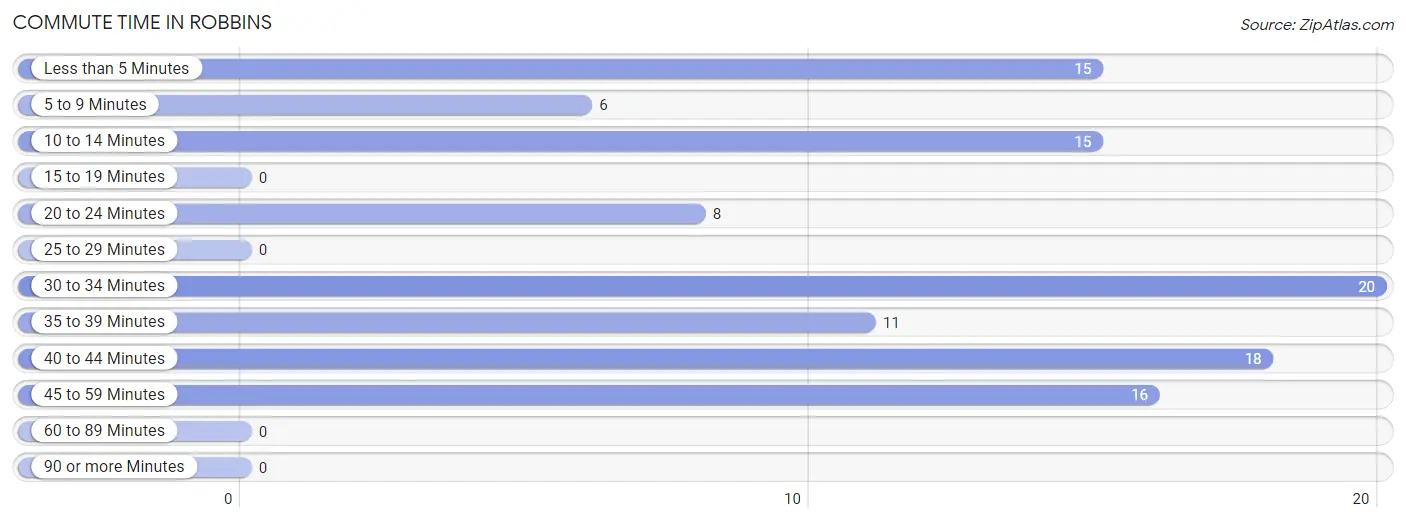
| Commute Time | # Commuters | % Commuters |
| Less than 5 Minutes | 15 | 13.8% |
| 5 to 9 Minutes | 6 | 5.5% |
| 10 to 14 Minutes | 15 | 13.8% |
| 15 to 19 Minutes | 0 | 0.0% |
| 20 to 24 Minutes | 8 | 7.3% |
| 25 to 29 Minutes | 0 | 0.0% |
| 30 to 34 Minutes | 20 | 18.3% |
| 35 to 39 Minutes | 11 | 10.1% |
| 40 to 44 Minutes | 18 | 16.5% |
| 45 to 59 Minutes | 16 | 14.7% |
| 60 to 89 Minutes | 0 | 0.0% |
| 90 or more Minutes | 0 | 0.0% |
Commute Time by Sex in Robbins
The most common commute times in Robbins are 45 to 59 minutes (16 commuters, 20.8%) for males and 30 to 34 minutes (13 commuters, 40.6%) for females.
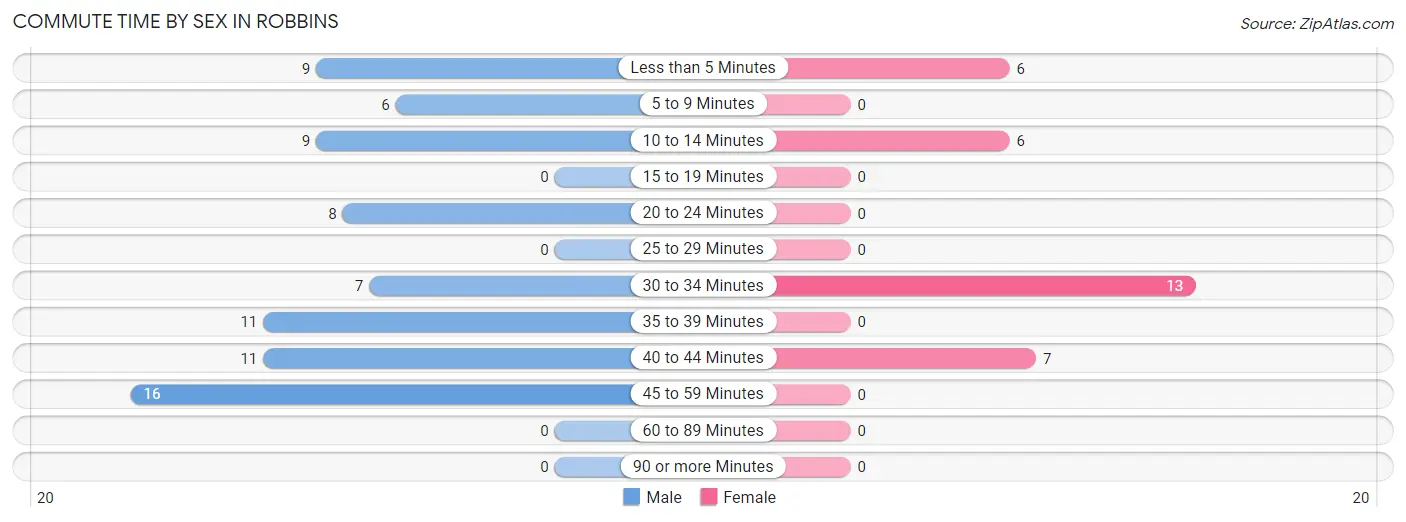
| Commute Time | Male | Female |
| Less than 5 Minutes | 9 (11.7%) | 6 (18.8%) |
| 5 to 9 Minutes | 6 (7.8%) | 0 (0.0%) |
| 10 to 14 Minutes | 9 (11.7%) | 6 (18.8%) |
| 15 to 19 Minutes | 0 (0.0%) | 0 (0.0%) |
| 20 to 24 Minutes | 8 (10.4%) | 0 (0.0%) |
| 25 to 29 Minutes | 0 (0.0%) | 0 (0.0%) |
| 30 to 34 Minutes | 7 (9.1%) | 13 (40.6%) |
| 35 to 39 Minutes | 11 (14.3%) | 0 (0.0%) |
| 40 to 44 Minutes | 11 (14.3%) | 7 (21.9%) |
| 45 to 59 Minutes | 16 (20.8%) | 0 (0.0%) |
| 60 to 89 Minutes | 0 (0.0%) | 0 (0.0%) |
| 90 or more Minutes | 0 (0.0%) | 0 (0.0%) |
Time of Departure to Work by Sex in Robbins
The most frequent times of departure to work in Robbins are 6:00 AM to 6:29 AM (30, 39.0%) for males and 5:00 AM to 5:29 AM (9, 28.1%) for females.
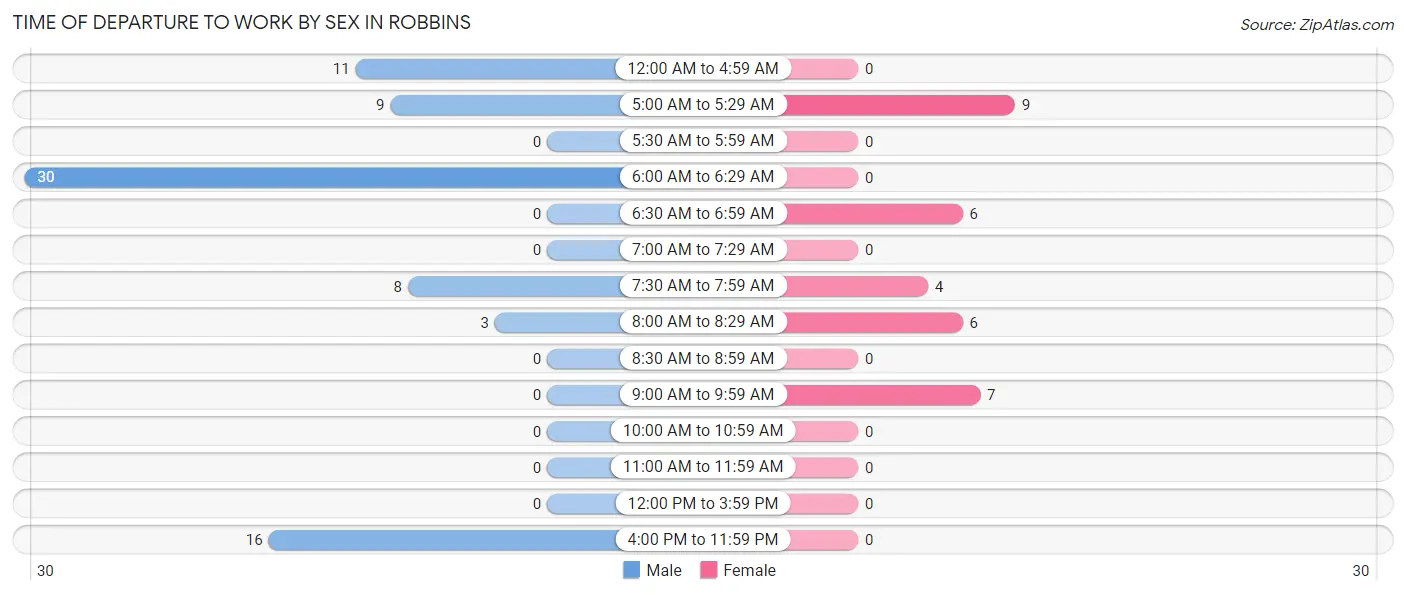
| Time of Departure | Male | Female |
| 12:00 AM to 4:59 AM | 11 (14.3%) | 0 (0.0%) |
| 5:00 AM to 5:29 AM | 9 (11.7%) | 9 (28.1%) |
| 5:30 AM to 5:59 AM | 0 (0.0%) | 0 (0.0%) |
| 6:00 AM to 6:29 AM | 30 (39.0%) | 0 (0.0%) |
| 6:30 AM to 6:59 AM | 0 (0.0%) | 6 (18.8%) |
| 7:00 AM to 7:29 AM | 0 (0.0%) | 0 (0.0%) |
| 7:30 AM to 7:59 AM | 8 (10.4%) | 4 (12.5%) |
| 8:00 AM to 8:29 AM | 3 (3.9%) | 6 (18.8%) |
| 8:30 AM to 8:59 AM | 0 (0.0%) | 0 (0.0%) |
| 9:00 AM to 9:59 AM | 0 (0.0%) | 7 (21.9%) |
| 10:00 AM to 10:59 AM | 0 (0.0%) | 0 (0.0%) |
| 11:00 AM to 11:59 AM | 0 (0.0%) | 0 (0.0%) |
| 12:00 PM to 3:59 PM | 0 (0.0%) | 0 (0.0%) |
| 4:00 PM to 11:59 PM | 16 (20.8%) | 0 (0.0%) |
| Total | 77 (100.0%) | 32 (100.0%) |
Housing Occupancy in Robbins
Occupancy by Ownership in Robbins
Of the total 118 dwellings in Robbins, owner-occupied units account for 63 (53.4%), while renter-occupied units make up 55 (46.6%).
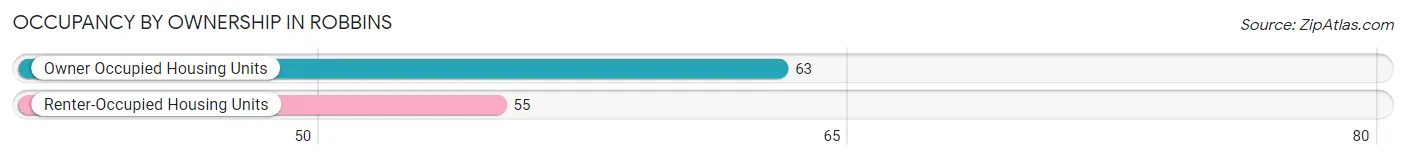
| Occupancy | # Housing Units | % Housing Units |
| Owner Occupied Housing Units | 63 | 53.4% |
| Renter-Occupied Housing Units | 55 | 46.6% |
| Total Occupied Housing Units | 118 | 100.0% |
Occupancy by Household Size in Robbins
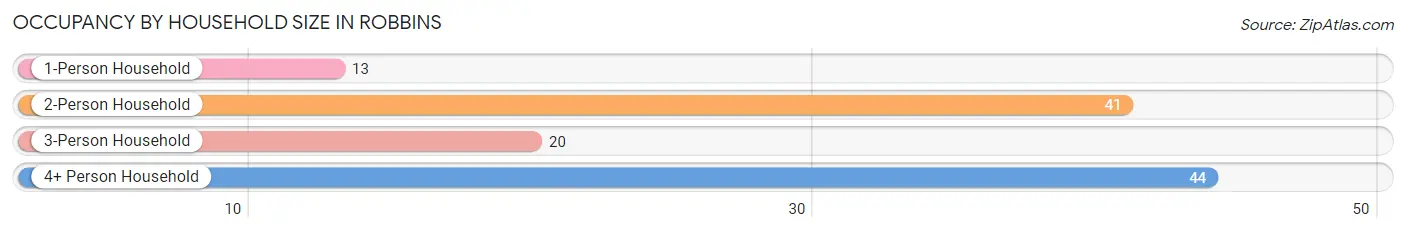
| Household Size | # Housing Units | % Housing Units |
| 1-Person Household | 13 | 11.0% |
| 2-Person Household | 41 | 34.7% |
| 3-Person Household | 20 | 17.0% |
| 4+ Person Household | 44 | 37.3% |
| Total Housing Units | 118 | 100.0% |
Occupancy by Ownership by Household Size in Robbins
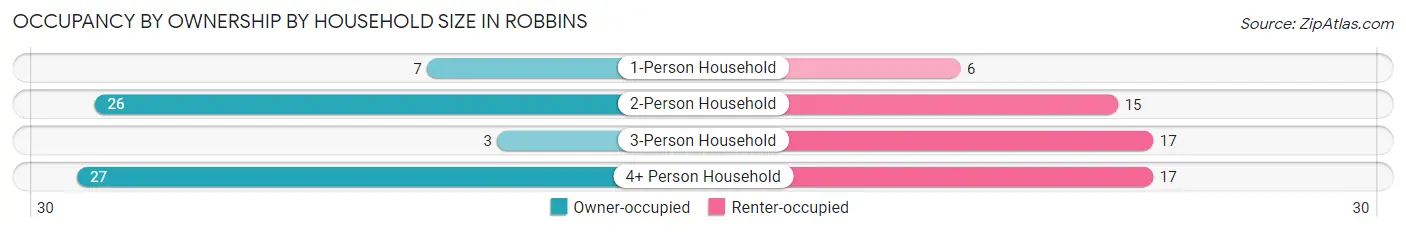
| Household Size | Owner-occupied | Renter-occupied |
| 1-Person Household | 7 (53.8%) | 6 (46.2%) |
| 2-Person Household | 26 (63.4%) | 15 (36.6%) |
| 3-Person Household | 3 (15.0%) | 17 (85.0%) |
| 4+ Person Household | 27 (61.4%) | 17 (38.6%) |
| Total Housing Units | 63 (53.4%) | 55 (46.6%) |
Occupancy by Educational Attainment in Robbins
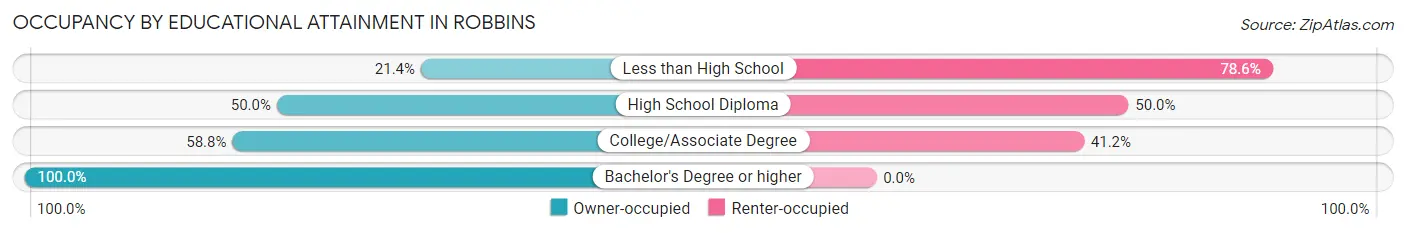
| Household Size | Owner-occupied | Renter-occupied |
| Less than High School | 9 (21.4%) | 33 (78.6%) |
| High School Diploma | 15 (50.0%) | 15 (50.0%) |
| College/Associate Degree | 10 (58.8%) | 7 (41.2%) |
| Bachelor's Degree or higher | 29 (100.0%) | 0 (0.0%) |
Occupancy by Age of Householder in Robbins
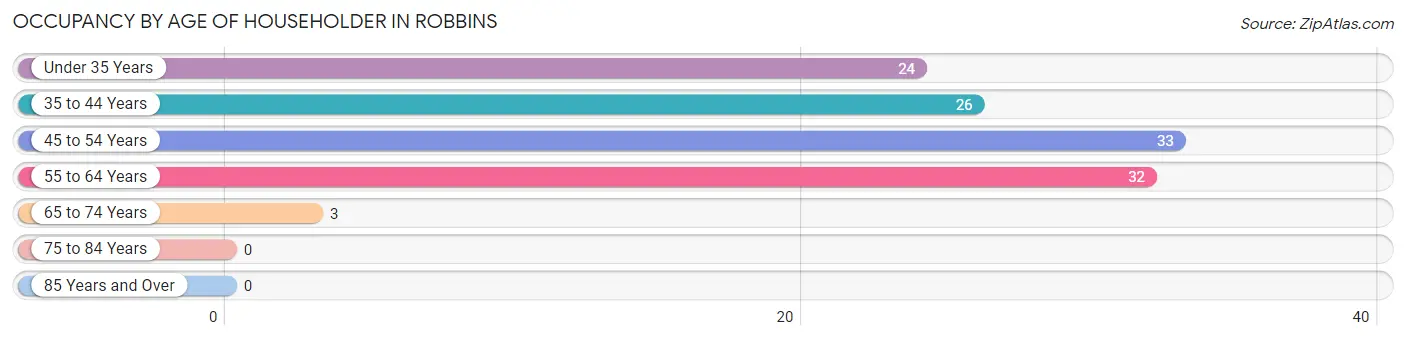
| Age Bracket | # Households | % Households |
| Under 35 Years | 24 | 20.3% |
| 35 to 44 Years | 26 | 22.0% |
| 45 to 54 Years | 33 | 28.0% |
| 55 to 64 Years | 32 | 27.1% |
| 65 to 74 Years | 3 | 2.5% |
| 75 to 84 Years | 0 | 0.0% |
| 85 Years and Over | 0 | 0.0% |
| Total | 118 | 100.0% |
Housing Finances in Robbins
Median Income by Occupancy in Robbins
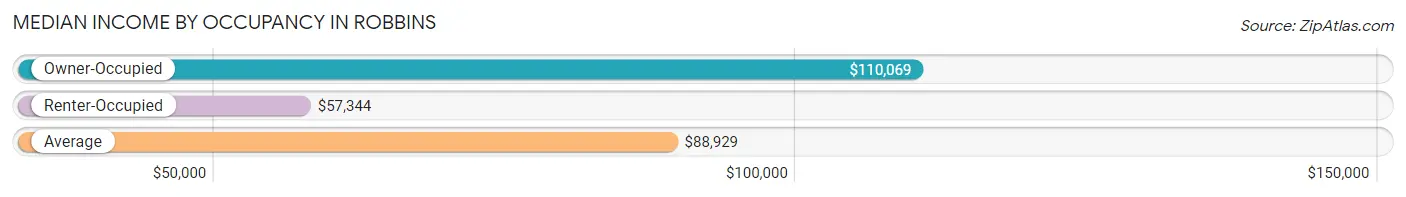
| Occupancy Type | # Households | Median Income |
| Owner-Occupied | 63 (53.4%) | $110,069 |
| Renter-Occupied | 55 (46.6%) | $57,344 |
| Average | 118 (100.0%) | $88,929 |
Occupancy by Householder Income Bracket in Robbins
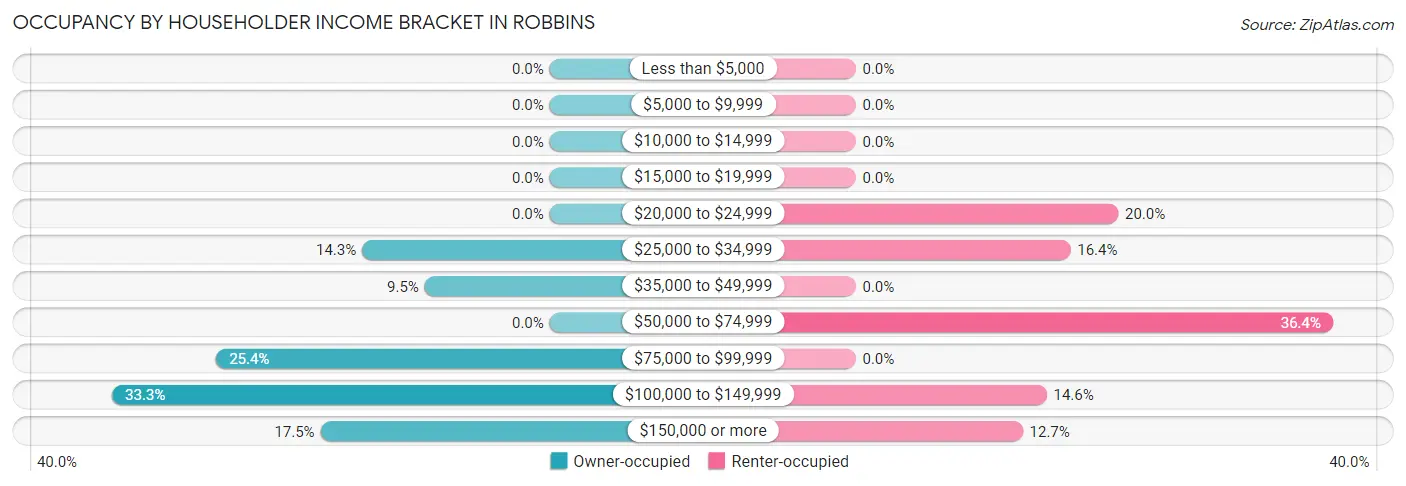
| Income Bracket | Owner-occupied | Renter-occupied |
| Less than $5,000 | 0 (0.0%) | 0 (0.0%) |
| $5,000 to $9,999 | 0 (0.0%) | 0 (0.0%) |
| $10,000 to $14,999 | 0 (0.0%) | 0 (0.0%) |
| $15,000 to $19,999 | 0 (0.0%) | 0 (0.0%) |
| $20,000 to $24,999 | 0 (0.0%) | 11 (20.0%) |
| $25,000 to $34,999 | 9 (14.3%) | 9 (16.4%) |
| $35,000 to $49,999 | 6 (9.5%) | 0 (0.0%) |
| $50,000 to $74,999 | 0 (0.0%) | 20 (36.4%) |
| $75,000 to $99,999 | 16 (25.4%) | 0 (0.0%) |
| $100,000 to $149,999 | 21 (33.3%) | 8 (14.5%) |
| $150,000 or more | 11 (17.5%) | 7 (12.7%) |
| Total | 63 (100.0%) | 55 (100.0%) |
Monthly Housing Cost Tiers in Robbins
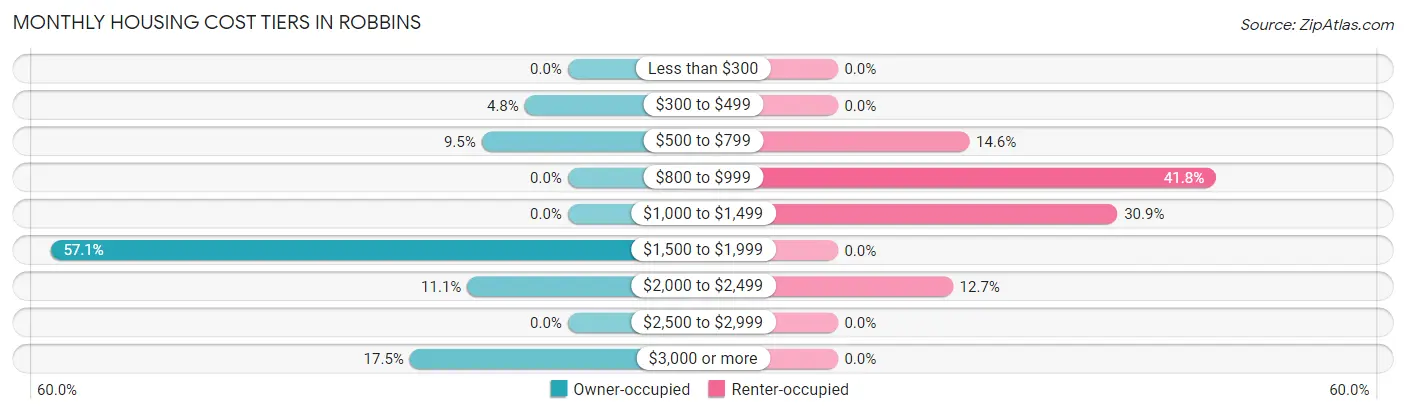
| Monthly Cost | Owner-occupied | Renter-occupied |
| Less than $300 | 0 (0.0%) | 0 (0.0%) |
| $300 to $499 | 3 (4.8%) | 0 (0.0%) |
| $500 to $799 | 6 (9.5%) | 8 (14.5%) |
| $800 to $999 | 0 (0.0%) | 23 (41.8%) |
| $1,000 to $1,499 | 0 (0.0%) | 17 (30.9%) |
| $1,500 to $1,999 | 36 (57.1%) | 0 (0.0%) |
| $2,000 to $2,499 | 7 (11.1%) | 7 (12.7%) |
| $2,500 to $2,999 | 0 (0.0%) | 0 (0.0%) |
| $3,000 or more | 11 (17.5%) | 0 (0.0%) |
| Total | 63 (100.0%) | 55 (100.0%) |
Physical Housing Characteristics in Robbins
Housing Structures in Robbins
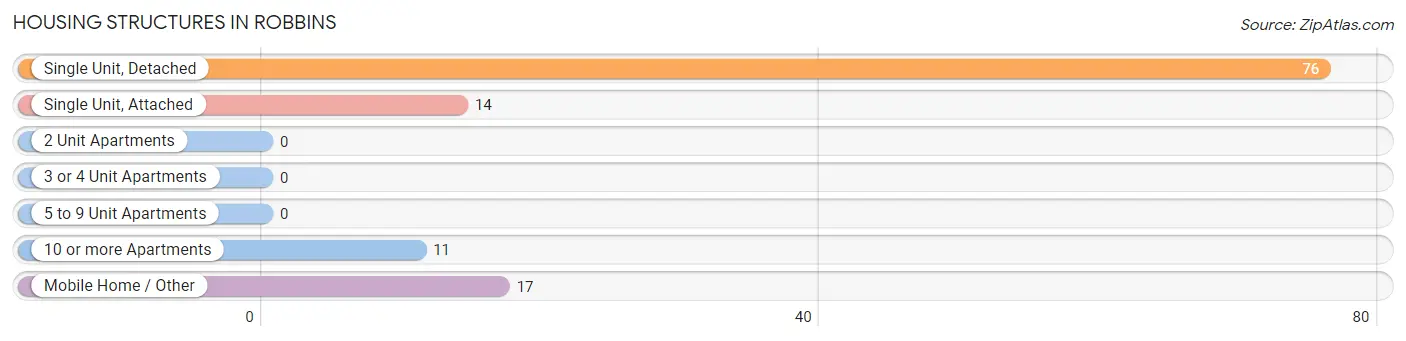
| Structure Type | # Housing Units | % Housing Units |
| Single Unit, Detached | 76 | 64.4% |
| Single Unit, Attached | 14 | 11.9% |
| 2 Unit Apartments | 0 | 0.0% |
| 3 or 4 Unit Apartments | 0 | 0.0% |
| 5 to 9 Unit Apartments | 0 | 0.0% |
| 10 or more Apartments | 11 | 9.3% |
| Mobile Home / Other | 17 | 14.4% |
| Total | 118 | 100.0% |
Housing Structures by Occupancy in Robbins
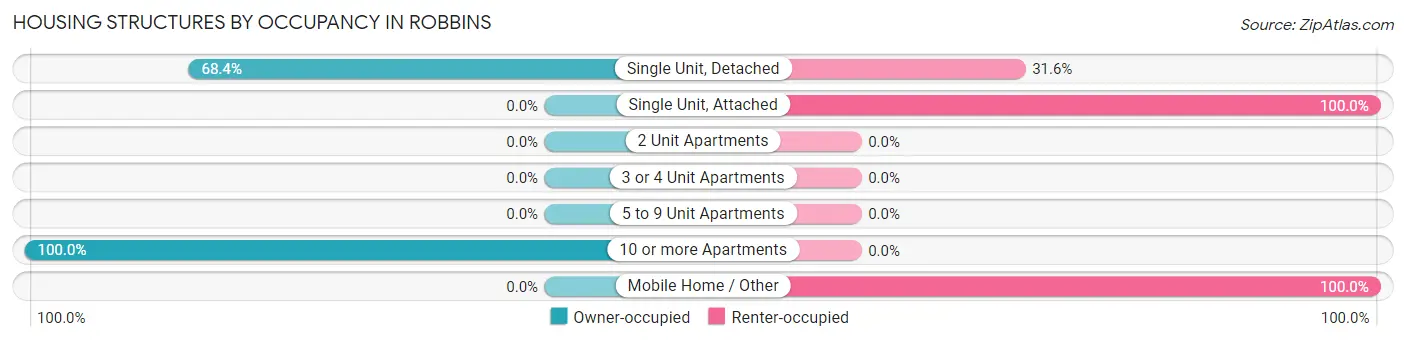
| Structure Type | Owner-occupied | Renter-occupied |
| Single Unit, Detached | 52 (68.4%) | 24 (31.6%) |
| Single Unit, Attached | 0 (0.0%) | 14 (100.0%) |
| 2 Unit Apartments | 0 (0.0%) | 0 (0.0%) |
| 3 or 4 Unit Apartments | 0 (0.0%) | 0 (0.0%) |
| 5 to 9 Unit Apartments | 0 (0.0%) | 0 (0.0%) |
| 10 or more Apartments | 11 (100.0%) | 0 (0.0%) |
| Mobile Home / Other | 0 (0.0%) | 17 (100.0%) |
| Total | 63 (53.4%) | 55 (46.6%) |
Housing Structures by Number of Rooms in Robbins
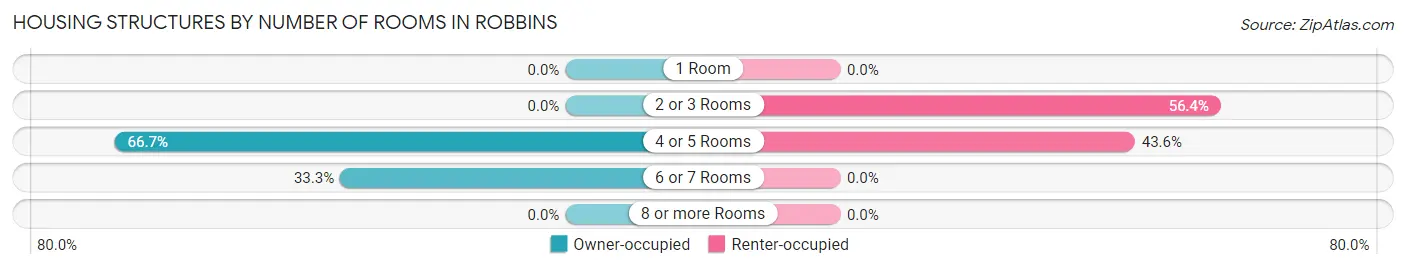
| Number of Rooms | Owner-occupied | Renter-occupied |
| 1 Room | 0 (0.0%) | 0 (0.0%) |
| 2 or 3 Rooms | 0 (0.0%) | 31 (56.4%) |
| 4 or 5 Rooms | 42 (66.7%) | 24 (43.6%) |
| 6 or 7 Rooms | 21 (33.3%) | 0 (0.0%) |
| 8 or more Rooms | 0 (0.0%) | 0 (0.0%) |
| Total | 63 (100.0%) | 55 (100.0%) |
Housing Structure by Heating Type in Robbins
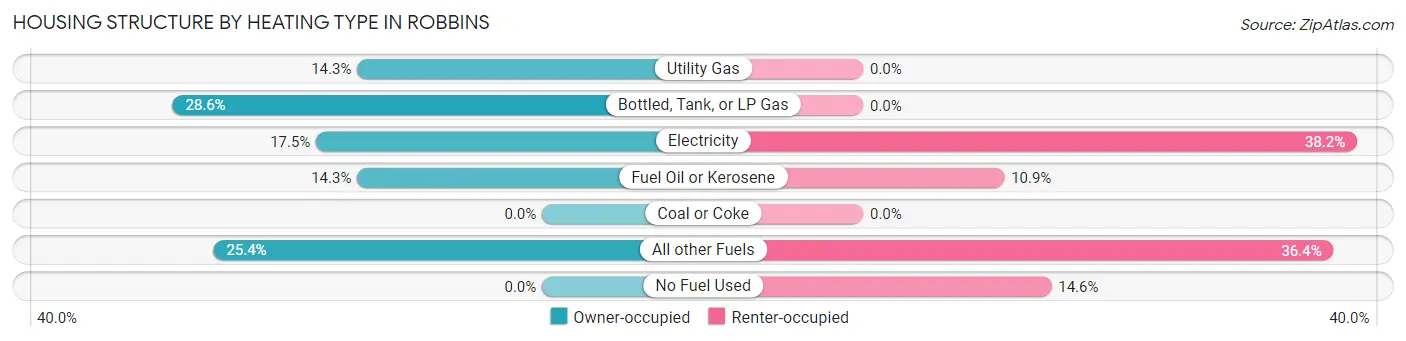
| Heating Type | Owner-occupied | Renter-occupied |
| Utility Gas | 9 (14.3%) | 0 (0.0%) |
| Bottled, Tank, or LP Gas | 18 (28.6%) | 0 (0.0%) |
| Electricity | 11 (17.5%) | 21 (38.2%) |
| Fuel Oil or Kerosene | 9 (14.3%) | 6 (10.9%) |
| Coal or Coke | 0 (0.0%) | 0 (0.0%) |
| All other Fuels | 16 (25.4%) | 20 (36.4%) |
| No Fuel Used | 0 (0.0%) | 8 (14.5%) |
| Total | 63 (100.0%) | 55 (100.0%) |
Household Vehicle Usage in Robbins
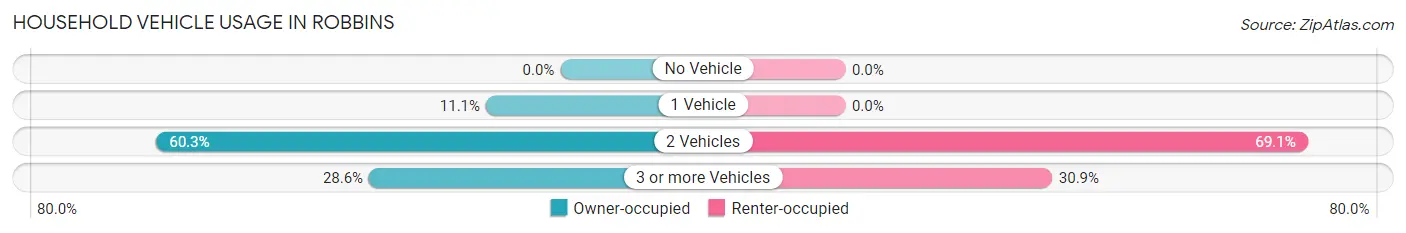
| Vehicles per Household | Owner-occupied | Renter-occupied |
| No Vehicle | 0 (0.0%) | 0 (0.0%) |
| 1 Vehicle | 7 (11.1%) | 0 (0.0%) |
| 2 Vehicles | 38 (60.3%) | 38 (69.1%) |
| 3 or more Vehicles | 18 (28.6%) | 17 (30.9%) |
| Total | 63 (100.0%) | 55 (100.0%) |
Real Estate & Mortgages in Robbins
Real Estate and Mortgage Overview in Robbins
| Characteristic | Without Mortgage | With Mortgage |
| Housing Units | 6 | 57 |
| Median Property Value | - | - |
| Median Household Income | - | - |
| Monthly Housing Costs | - | - |
| Real Estate Taxes | - | - |
Property Value by Mortgage Status in Robbins
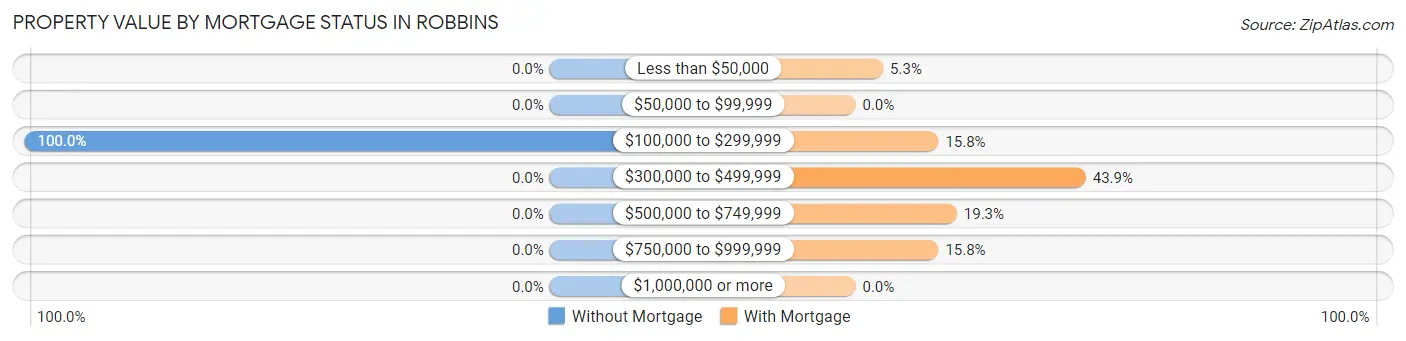
| Property Value | Without Mortgage | With Mortgage |
| Less than $50,000 | 0 (0.0%) | 3 (5.3%) |
| $50,000 to $99,999 | 0 (0.0%) | 0 (0.0%) |
| $100,000 to $299,999 | 6 (100.0%) | 9 (15.8%) |
| $300,000 to $499,999 | 0 (0.0%) | 25 (43.9%) |
| $500,000 to $749,999 | 0 (0.0%) | 11 (19.3%) |
| $750,000 to $999,999 | 0 (0.0%) | 9 (15.8%) |
| $1,000,000 or more | 0 (0.0%) | 0 (0.0%) |
| Total | 6 (100.0%) | 57 (100.0%) |
Household Income by Mortgage Status in Robbins
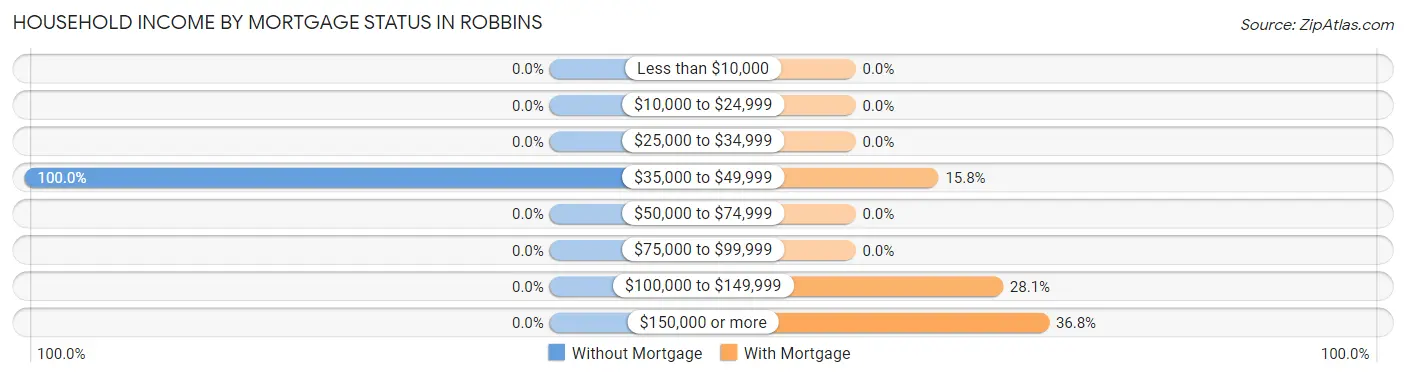
| Household Income | Without Mortgage | With Mortgage |
| Less than $10,000 | 0 (0.0%) | 0 (0.0%) |
| $10,000 to $24,999 | 0 (0.0%) | 0 (0.0%) |
| $25,000 to $34,999 | 0 (0.0%) | 0 (0.0%) |
| $35,000 to $49,999 | 6 (100.0%) | 9 (15.8%) |
| $50,000 to $74,999 | 0 (0.0%) | 0 (0.0%) |
| $75,000 to $99,999 | 0 (0.0%) | 0 (0.0%) |
| $100,000 to $149,999 | 0 (0.0%) | 16 (28.1%) |
| $150,000 or more | 0 (0.0%) | 21 (36.8%) |
| Total | 6 (100.0%) | 57 (100.0%) |
Property Value to Household Income Ratio in Robbins
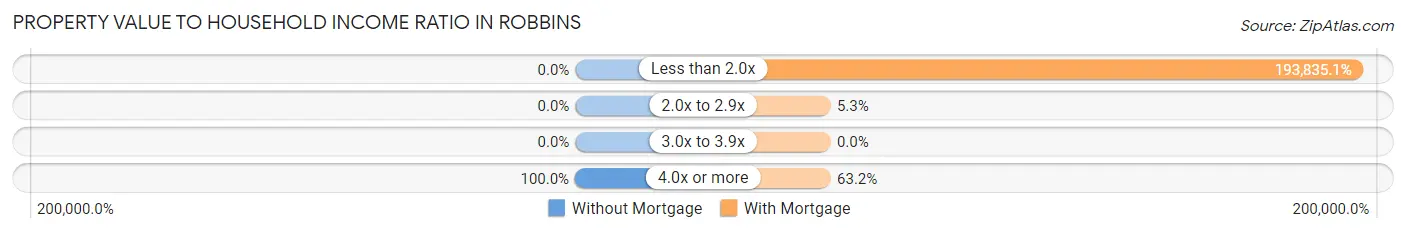
| Value-to-Income Ratio | Without Mortgage | With Mortgage |
| Less than 2.0x | 0 (0.0%) | 110,486 (193,835.1%) |
| 2.0x to 2.9x | 0 (0.0%) | 3 (5.3%) |
| 3.0x to 3.9x | 0 (0.0%) | 0 (0.0%) |
| 4.0x or more | 6 (100.0%) | 36 (63.2%) |
| Total | 6 (100.0%) | 57 (100.0%) |
Real Estate Taxes by Mortgage Status in Robbins
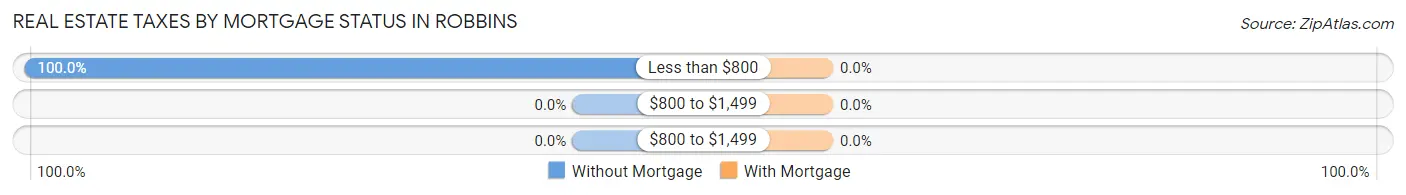
| Property Taxes | Without Mortgage | With Mortgage |
| Less than $800 | 6 (100.0%) | 0 (0.0%) |
| $800 to $1,499 | 0 (0.0%) | 0 (0.0%) |
| $800 to $1,499 | 0 (0.0%) | 0 (0.0%) |
| Total | 6 (100.0%) | 57 (100.0%) |
Health & Disability in Robbins
Health Insurance Coverage by Age in Robbins
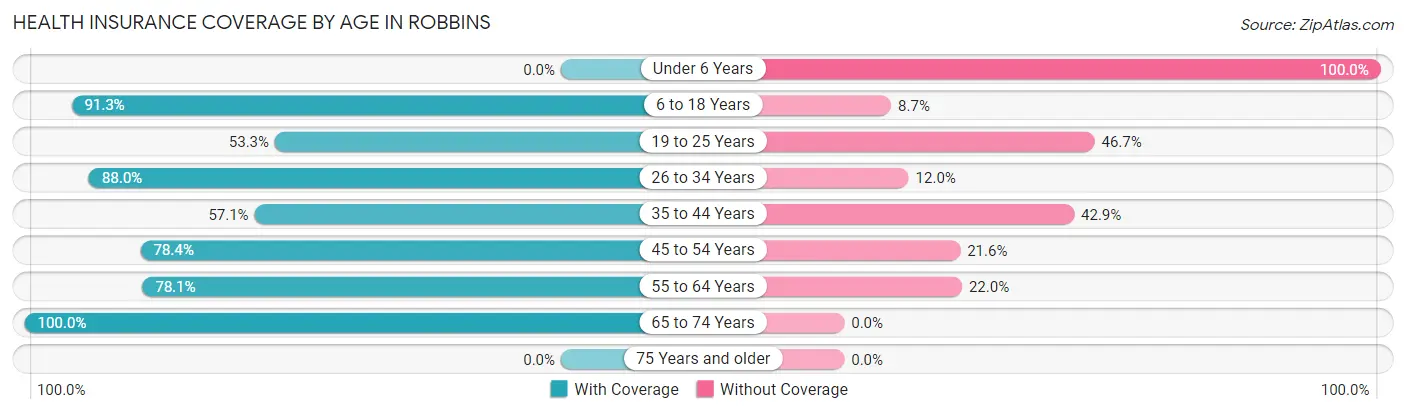
| Age Bracket | With Coverage | Without Coverage |
| Under 6 Years | 0 (0.0%) | 10 (100.0%) |
| 6 to 18 Years | 94 (91.3%) | 9 (8.7%) |
| 19 to 25 Years | 8 (53.3%) | 7 (46.7%) |
| 26 to 34 Years | 44 (88.0%) | 6 (12.0%) |
| 35 to 44 Years | 40 (57.1%) | 30 (42.9%) |
| 45 to 54 Years | 29 (78.4%) | 8 (21.6%) |
| 55 to 64 Years | 32 (78.0%) | 9 (22.0%) |
| 65 to 74 Years | 15 (100.0%) | 0 (0.0%) |
| 75 Years and older | 0 (0.0%) | 0 (0.0%) |
| Total | 262 (76.8%) | 79 (23.2%) |
Health Insurance Coverage by Citizenship Status in Robbins
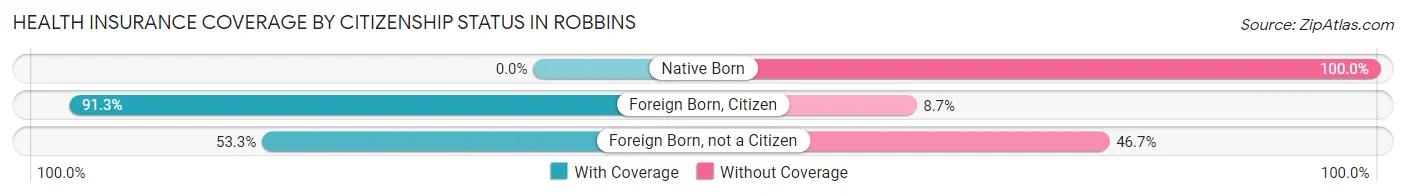
| Citizenship Status | With Coverage | Without Coverage |
| Native Born | 0 (0.0%) | 10 (100.0%) |
| Foreign Born, Citizen | 94 (91.3%) | 9 (8.7%) |
| Foreign Born, not a Citizen | 8 (53.3%) | 7 (46.7%) |
Health Insurance Coverage by Household Income in Robbins
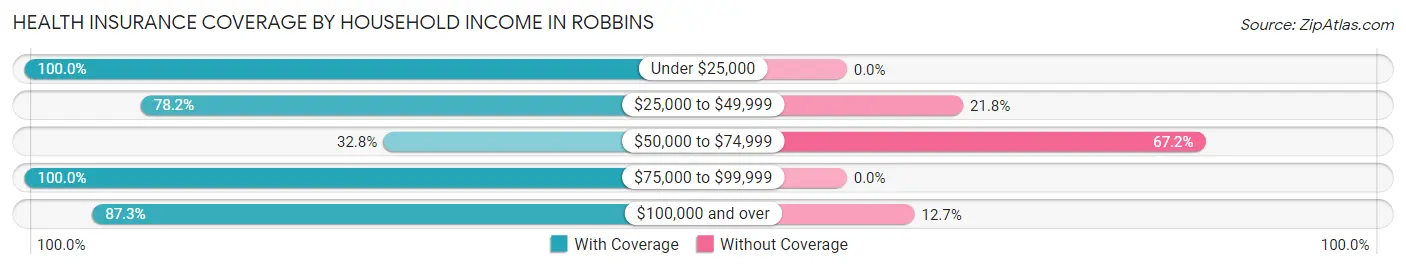
| Household Income | With Coverage | Without Coverage |
| Under $25,000 | 25 (100.0%) | 0 (0.0%) |
| $25,000 to $49,999 | 61 (78.2%) | 17 (21.8%) |
| $50,000 to $74,999 | 22 (32.8%) | 45 (67.2%) |
| $75,000 to $99,999 | 37 (100.0%) | 0 (0.0%) |
| $100,000 and over | 117 (87.3%) | 17 (12.7%) |
Public vs Private Health Insurance Coverage by Age in Robbins
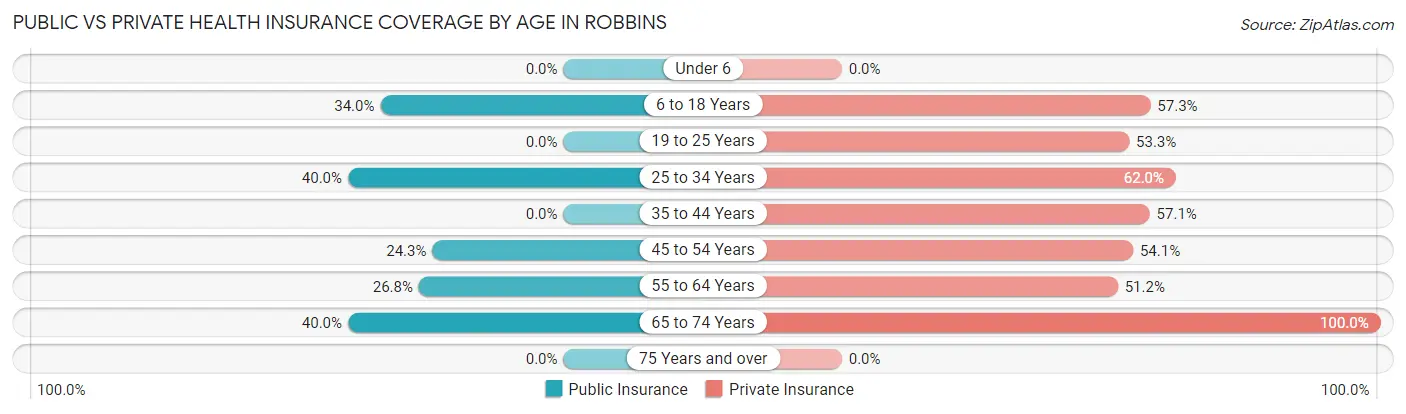
| Age Bracket | Public Insurance | Private Insurance |
| Under 6 | 0 (0.0%) | 0 (0.0%) |
| 6 to 18 Years | 35 (34.0%) | 59 (57.3%) |
| 19 to 25 Years | 0 (0.0%) | 8 (53.3%) |
| 25 to 34 Years | 20 (40.0%) | 31 (62.0%) |
| 35 to 44 Years | 0 (0.0%) | 40 (57.1%) |
| 45 to 54 Years | 9 (24.3%) | 20 (54.0%) |
| 55 to 64 Years | 11 (26.8%) | 21 (51.2%) |
| 65 to 74 Years | 6 (40.0%) | 15 (100.0%) |
| 75 Years and over | 0 (0.0%) | 0 (0.0%) |
| Total | 81 (23.7%) | 194 (56.9%) |
Disability Status by Sex by Age in Robbins
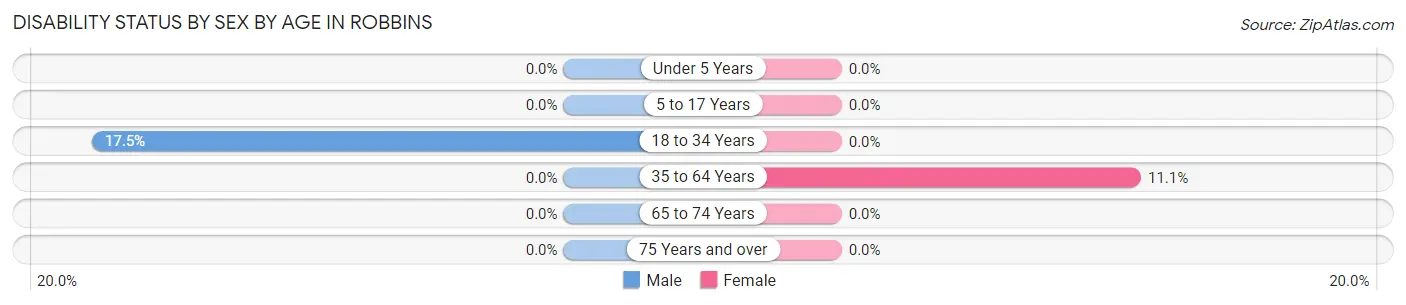
| Age Bracket | Male | Female |
| Under 5 Years | 0 (0.0%) | 0 (0.0%) |
| 5 to 17 Years | 0 (0.0%) | 0 (0.0%) |
| 18 to 34 Years | 7 (17.5%) | 0 (0.0%) |
| 35 to 64 Years | 0 (0.0%) | 7 (11.1%) |
| 65 to 74 Years | 0 (0.0%) | 0 (0.0%) |
| 75 Years and over | 0 (0.0%) | 0 (0.0%) |
Disability Class by Sex by Age in Robbins
Disability Class: Hearing Difficulty
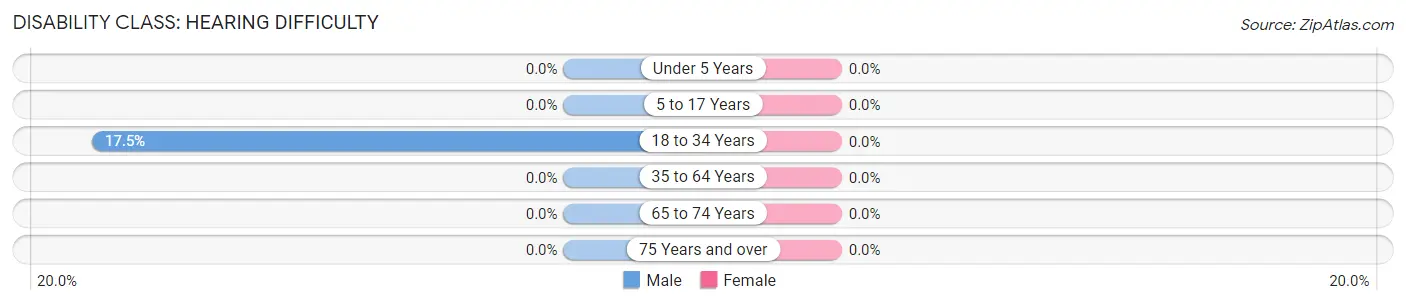
| Age Bracket | Male | Female |
| Under 5 Years | 0 (0.0%) | 0 (0.0%) |
| 5 to 17 Years | 0 (0.0%) | 0 (0.0%) |
| 18 to 34 Years | 7 (17.5%) | 0 (0.0%) |
| 35 to 64 Years | 0 (0.0%) | 0 (0.0%) |
| 65 to 74 Years | 0 (0.0%) | 0 (0.0%) |
| 75 Years and over | 0 (0.0%) | 0 (0.0%) |
Disability Class: Vision Difficulty
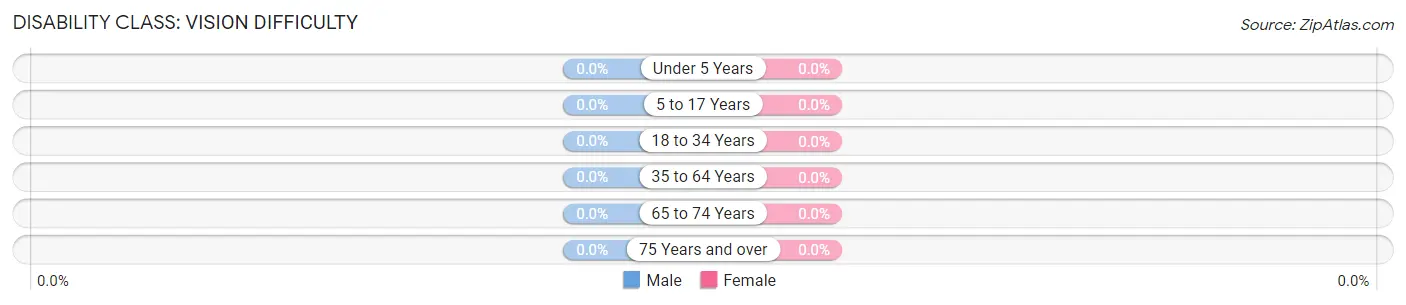
| Age Bracket | Male | Female |
| Under 5 Years | 0 (0.0%) | 0 (0.0%) |
| 5 to 17 Years | 0 (0.0%) | 0 (0.0%) |
| 18 to 34 Years | 0 (0.0%) | 0 (0.0%) |
| 35 to 64 Years | 0 (0.0%) | 0 (0.0%) |
| 65 to 74 Years | 0 (0.0%) | 0 (0.0%) |
| 75 Years and over | 0 (0.0%) | 0 (0.0%) |
Disability Class: Cognitive Difficulty

| Age Bracket | Male | Female |
| 5 to 17 Years | 0 (0.0%) | 0 (0.0%) |
| 18 to 34 Years | 0 (0.0%) | 0 (0.0%) |
| 35 to 64 Years | 0 (0.0%) | 0 (0.0%) |
| 65 to 74 Years | 0 (0.0%) | 0 (0.0%) |
| 75 Years and over | 0 (0.0%) | 0 (0.0%) |
Disability Class: Ambulatory Difficulty
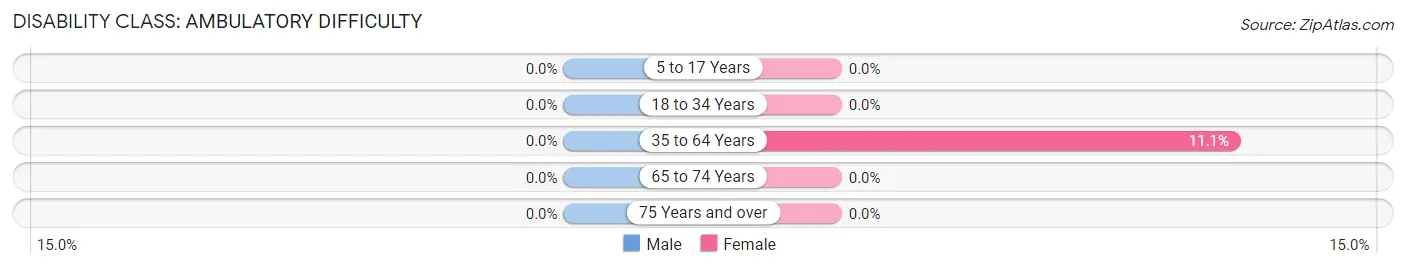
| Age Bracket | Male | Female |
| 5 to 17 Years | 0 (0.0%) | 0 (0.0%) |
| 18 to 34 Years | 0 (0.0%) | 0 (0.0%) |
| 35 to 64 Years | 0 (0.0%) | 7 (11.1%) |
| 65 to 74 Years | 0 (0.0%) | 0 (0.0%) |
| 75 Years and over | 0 (0.0%) | 0 (0.0%) |
Disability Class: Self-Care Difficulty
| Age Bracket | Male | Female |
| 5 to 17 Years | 0 (0.0%) | 0 (0.0%) |
| 18 to 34 Years | 0 (0.0%) | 0 (0.0%) |
| 35 to 64 Years | 0 (0.0%) | 0 (0.0%) |
| 65 to 74 Years | 0 (0.0%) | 0 (0.0%) |
| 75 Years and over | 0 (0.0%) | 0 (0.0%) |
Technology Access in Robbins
Computing Device Access in Robbins
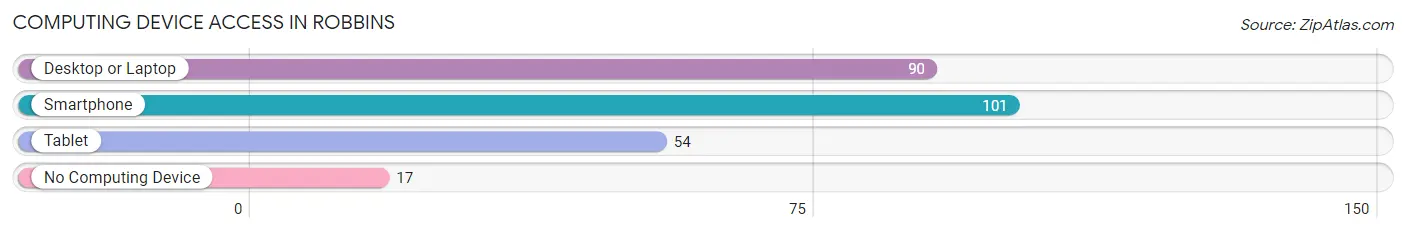
| Device Type | # Households | % Households |
| Desktop or Laptop | 90 | 76.3% |
| Smartphone | 101 | 85.6% |
| Tablet | 54 | 45.8% |
| No Computing Device | 17 | 14.4% |
| Total | 118 | 100.0% |
Internet Access in Robbins
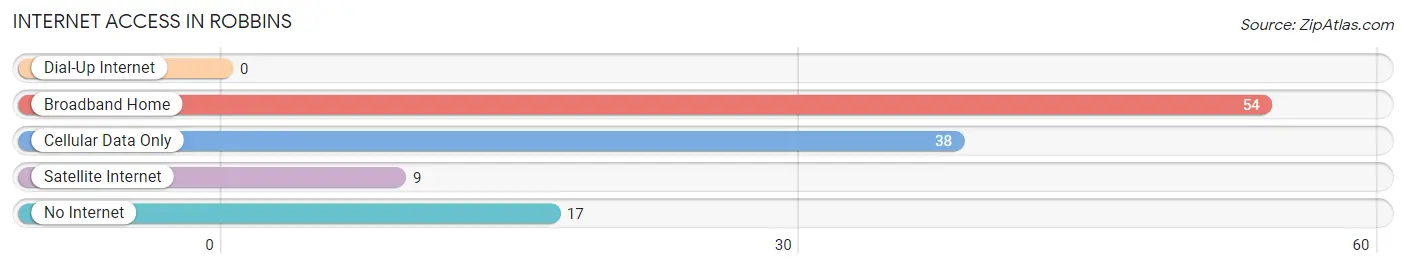
| Internet Type | # Households | % Households |
| Dial-Up Internet | 0 | 0.0% |
| Broadband Home | 54 | 45.8% |
| Cellular Data Only | 38 | 32.2% |
| Satellite Internet | 9 | 7.6% |
| No Internet | 17 | 14.4% |
| Total | 118 | 100.0% |
Robbins Summary
Robbins is a small unincorporated community located in Contra Costa County, California. It is situated in the San Francisco Bay Area, approximately 25 miles east of San Francisco. The population of Robbins was estimated to be 1,845 in 2019.
History
Robbins was founded in 1883 by William and Mary Robbins, who purchased the land from the Mexican government. The town was originally named Robbinsville, but the name was changed to Robbins in 1887. The town was initially a farming community, but it soon became a popular destination for tourists and vacationers.
In the early 1900s, the town was home to a number of businesses, including a hotel, a general store, a blacksmith shop, and a post office. The town also had a school, which was built in 1910.
Geography
Robbins is located in the San Francisco Bay Area, approximately 25 miles east of San Francisco. The town is situated in the Diablo Range, which is part of the California Coast Ranges. The town is surrounded by rolling hills and is located near the San Joaquin River.
The climate in Robbins is mild and temperate, with warm summers and cool winters. The average annual temperature is around 60 degrees Fahrenheit. The average annual precipitation is around 20 inches.
Economy
Robbins is a small, rural community with a limited economy. The town is home to a few small businesses, including a gas station, a grocery store, and a few restaurants. The town also has a few small manufacturing businesses.
The town is also home to a number of farms, which produce a variety of crops, including grapes, olives, and walnuts. The town is also home to a number of wineries, which produce a variety of wines.
Demographics
Robbins is a small, rural community with a population of 1,845 in 2019. The town is predominantly white, with a small Hispanic population. The median household income in Robbins is $63,000, and the median home value is $541,000.
The town is home to a number of churches, including the First Baptist Church of Robbins, the Church of Jesus Christ of Latter-day Saints, and the Robbins United Methodist Church. The town also has a number of parks, including the Robbins Community Park and the Robbins Nature Preserve.
Conclusion
Robbins is a small, rural community located in Contra Costa County, California. The town was founded in 1883 and has a population of 1,845 in 2019. The town is predominantly white, with a small Hispanic population. The town is home to a few small businesses, a number of farms, and a few wineries. The town is also home to a number of churches and parks.
Common Questions
What is Per Capita Income in Robbins?
Per Capita income in Robbins is $29,643.
What is the Median Family Income in Robbins?
Median Family Income in Robbins is $95,972.
What is the Median Household income in Robbins?
Median Household Income in Robbins is $88,929.
What is Income or Wage Gap in Robbins?
Income or Wage Gap in Robbins is 38.9%.
Women in Robbins earn 61.1 cents for every dollar earned by a man.
What is Inequality or Gini Index in Robbins?
Inequality or Gini Index in Robbins is 0.33.
What is the Total Population of Robbins?
Total Population of Robbins is 341.
What is the Total Male Population of Robbins?
Total Male Population of Robbins is 154.
What is the Total Female Population of Robbins?
Total Female Population of Robbins is 187.
What is the Ratio of Males per 100 Females in Robbins?
There are 82.35 Males per 100 Females in Robbins.
What is the Ratio of Females per 100 Males in Robbins?
There are 121.43 Females per 100 Males in Robbins.
What is the Median Population Age in Robbins?
Median Population Age in Robbins is 34.7 Years.
What is the Average Family Size in Robbins
Average Family Size in Robbins is 3.1 People.
What is the Average Household Size in Robbins
Average Household Size in Robbins is 2.9 People.
How Large is the Labor Force in Robbins?
There are 146 People in the Labor Forcein in Robbins.
What is the Percentage of People in the Labor Force in Robbins?
57.0% of People are in the Labor Force in Robbins.