Riverbank, CA Map & Demographics
Riverbank Map
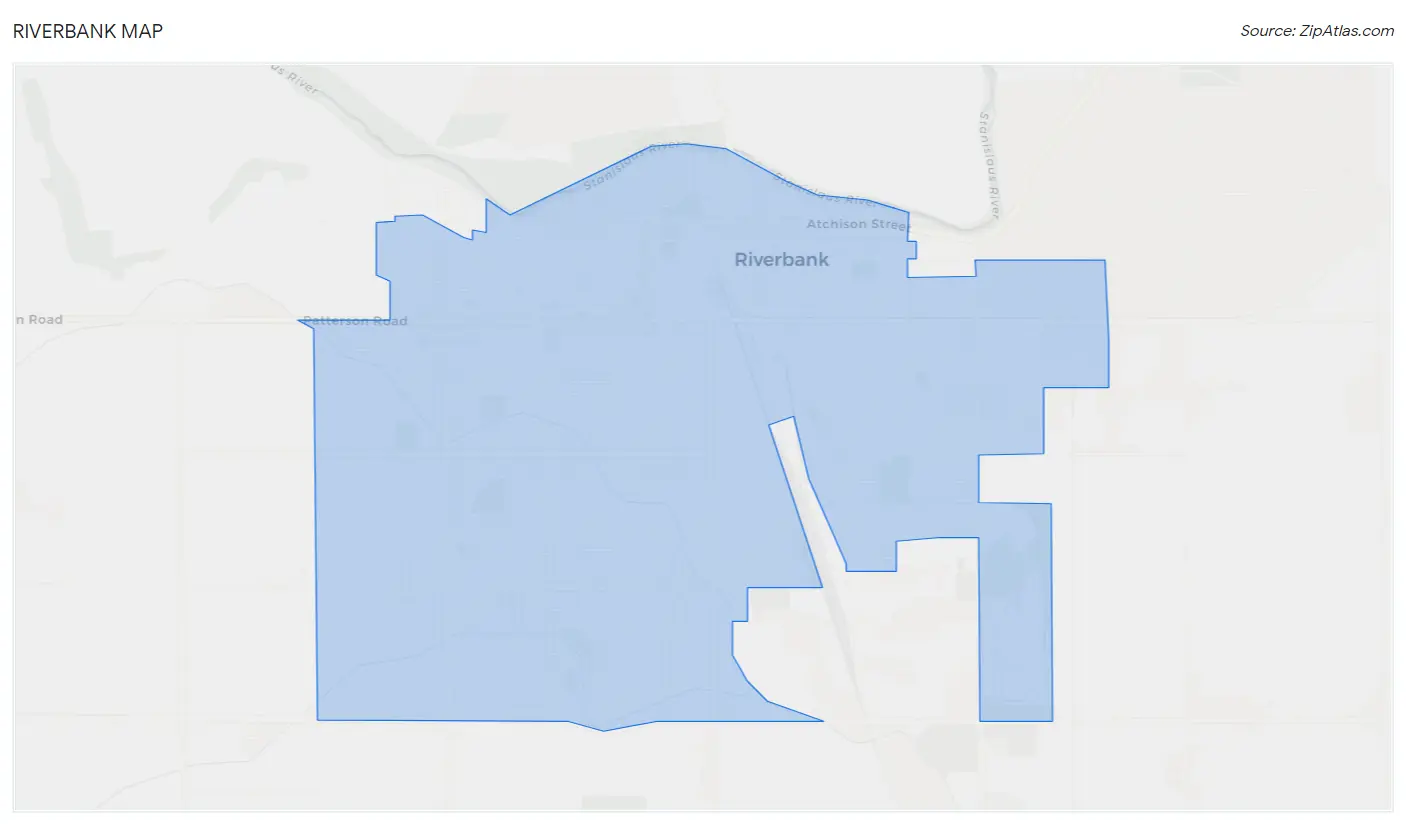
Riverbank Overview
$33,398
PER CAPITA INCOME
$101,199
AVG FAMILY INCOME
$89,504
AVG HOUSEHOLD INCOME
31.3%
WAGE / INCOME GAP [ % ]
68.7¢/ $1
WAGE / INCOME GAP [ $ ]
$11,462
FAMILY INCOME DEFICIT
0.42
INEQUALITY / GINI INDEX
24,803
TOTAL POPULATION
12,185
MALE POPULATION
12,618
FEMALE POPULATION
96.57
MALES / 100 FEMALES
103.55
FEMALES / 100 MALES
33.6
MEDIAN AGE
3.8
AVG FAMILY SIZE
3.4
AVG HOUSEHOLD SIZE
11,319
LABOR FORCE [ PEOPLE ]
62.9%
PERCENT IN LABOR FORCE
5.9%
UNEMPLOYMENT RATE
Riverbank Zip Codes
Riverbank Area Codes
Income in Riverbank
Income Overview in Riverbank
Per Capita Income in Riverbank is $33,398, while median incomes of families and households are $101,199 and $89,504 respectively.
| Characteristic | Number | Measure |
| Per Capita Income | 24,803 | $33,398 |
| Median Family Income | 5,775 | $101,199 |
| Mean Family Income | 5,775 | $120,309 |
| Median Household Income | 7,314 | $89,504 |
| Mean Household Income | 7,314 | $109,682 |
| Income Deficit | 5,775 | $11,462 |
| Wage / Income Gap (%) | 24,803 | 31.29% |
| Wage / Income Gap ($) | 24,803 | 68.71¢ per $1 |
| Gini / Inequality Index | 24,803 | 0.42 |
Earnings by Sex in Riverbank
Average Earnings in Riverbank are $45,580, $54,898 for men and $37,722 for women, a difference of 31.3%.
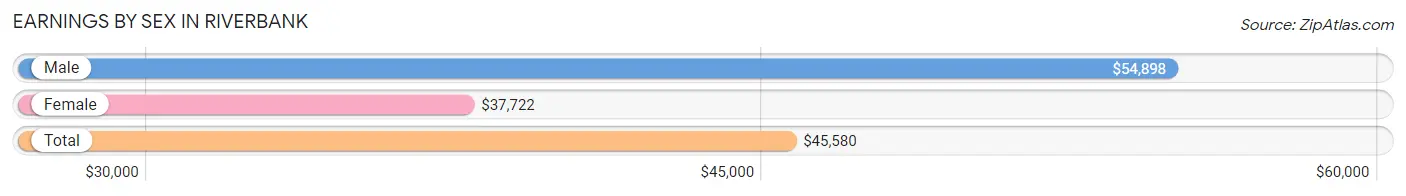
| Sex | Number | Average Earnings |
| Male | 6,361 (56.6%) | $54,898 |
| Female | 4,888 (43.4%) | $37,722 |
| Total | 11,249 (100.0%) | $45,580 |
Earnings by Sex by Income Bracket in Riverbank
The most common earnings brackets in Riverbank are $100,000+ for men (1,328 | 20.9%) and $75,000 to $99,999 for women (518 | 10.6%).
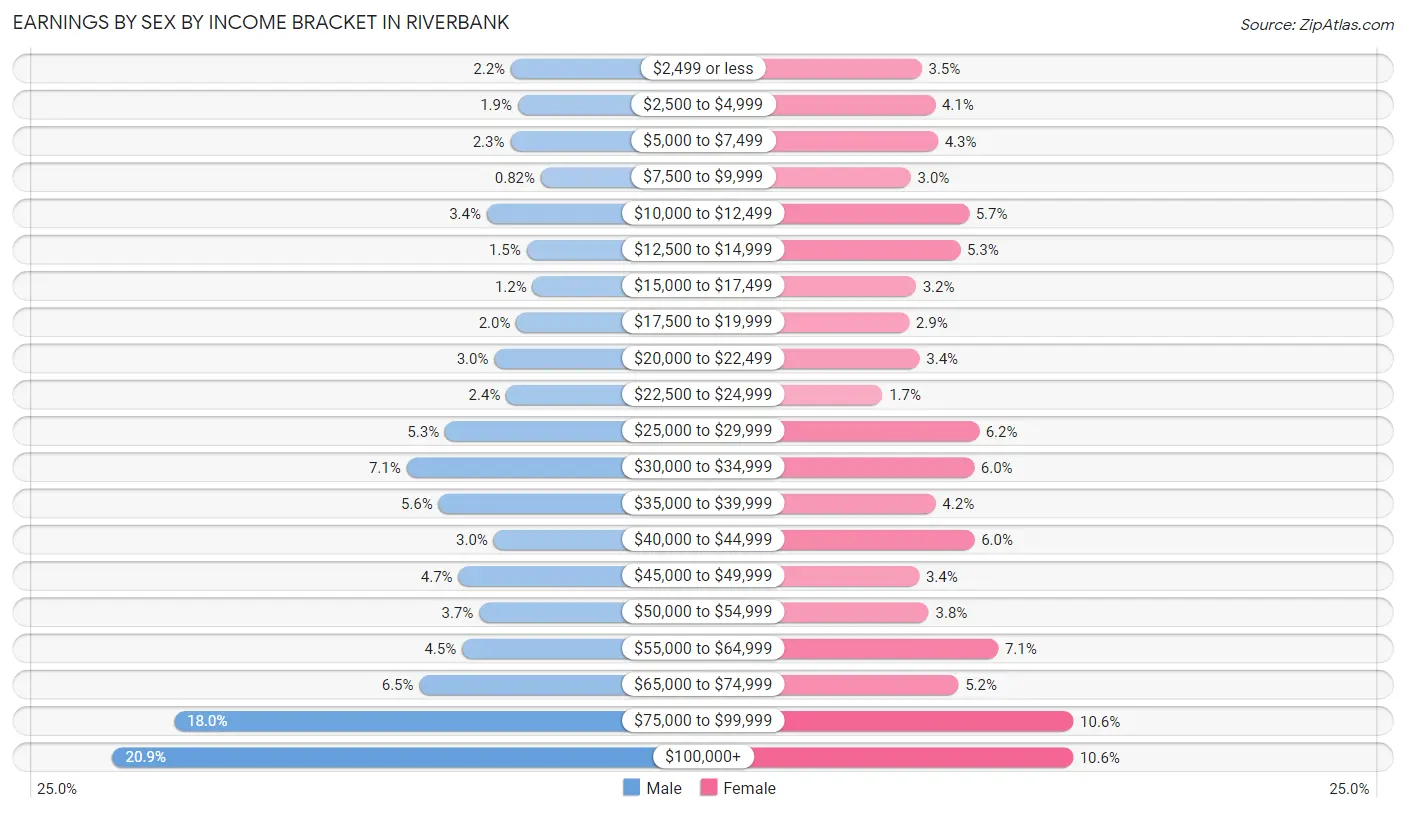
| Income | Male | Female |
| $2,499 or less | 141 (2.2%) | 171 (3.5%) |
| $2,500 to $4,999 | 121 (1.9%) | 202 (4.1%) |
| $5,000 to $7,499 | 143 (2.2%) | 208 (4.3%) |
| $7,500 to $9,999 | 52 (0.8%) | 146 (3.0%) |
| $10,000 to $12,499 | 213 (3.4%) | 279 (5.7%) |
| $12,500 to $14,999 | 95 (1.5%) | 259 (5.3%) |
| $15,000 to $17,499 | 77 (1.2%) | 158 (3.2%) |
| $17,500 to $19,999 | 125 (2.0%) | 142 (2.9%) |
| $20,000 to $22,499 | 191 (3.0%) | 166 (3.4%) |
| $22,500 to $24,999 | 155 (2.4%) | 81 (1.7%) |
| $25,000 to $29,999 | 338 (5.3%) | 302 (6.2%) |
| $30,000 to $34,999 | 452 (7.1%) | 291 (5.9%) |
| $35,000 to $39,999 | 357 (5.6%) | 203 (4.2%) |
| $40,000 to $44,999 | 193 (3.0%) | 292 (6.0%) |
| $45,000 to $49,999 | 298 (4.7%) | 165 (3.4%) |
| $50,000 to $54,999 | 236 (3.7%) | 187 (3.8%) |
| $55,000 to $64,999 | 287 (4.5%) | 346 (7.1%) |
| $65,000 to $74,999 | 414 (6.5%) | 255 (5.2%) |
| $75,000 to $99,999 | 1,145 (18.0%) | 518 (10.6%) |
| $100,000+ | 1,328 (20.9%) | 517 (10.6%) |
| Total | 6,361 (100.0%) | 4,888 (100.0%) |
Earnings by Sex by Educational Attainment in Riverbank
Average earnings in Riverbank are $68,248 for men and $43,205 for women, a difference of 36.7%. Men with an educational attainment of graduate degree enjoy the highest average annual earnings of $138,056, while those with less than high school education earn the least with $34,226. Women with an educational attainment of graduate degree earn the most with the average annual earnings of $94,063, while those with less than high school education have the smallest earnings of $21,115.
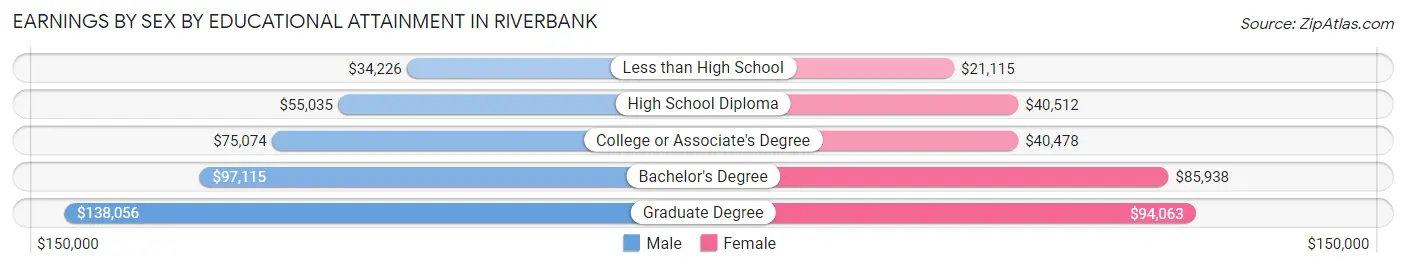
| Educational Attainment | Male Income | Female Income |
| Less than High School | $34,226 | $21,115 |
| High School Diploma | $55,035 | $40,512 |
| College or Associate's Degree | $75,074 | $40,478 |
| Bachelor's Degree | $97,115 | $85,938 |
| Graduate Degree | $138,056 | $94,063 |
| Total | $68,248 | $43,205 |
Family Income in Riverbank
Family Income Brackets in Riverbank
According to the Riverbank family income data, there are 1,276 families falling into the $100,000 to $149,999 income range, which is the most common income bracket and makes up 22.1% of all families. Conversely, the $10,000 to $14,999 income bracket is the least frequent group with only 69 families (1.2%) belonging to this category.
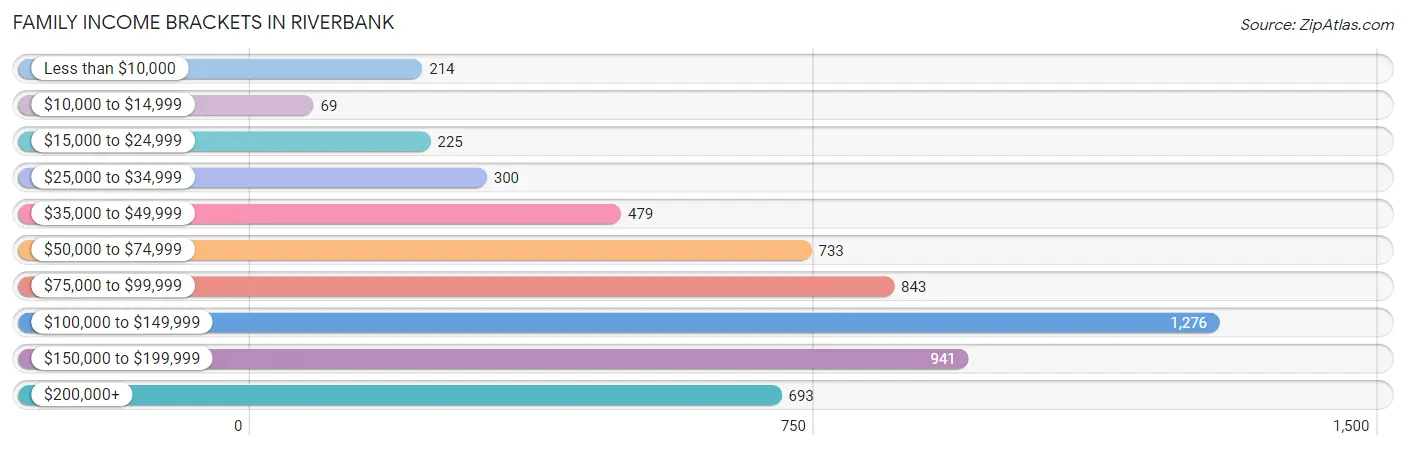
| Income Bracket | # Families | % Families |
| Less than $10,000 | 214 | 3.7% |
| $10,000 to $14,999 | 69 | 1.2% |
| $15,000 to $24,999 | 225 | 3.9% |
| $25,000 to $34,999 | 300 | 5.2% |
| $35,000 to $49,999 | 479 | 8.3% |
| $50,000 to $74,999 | 733 | 12.7% |
| $75,000 to $99,999 | 843 | 14.6% |
| $100,000 to $149,999 | 1,276 | 22.1% |
| $150,000 to $199,999 | 941 | 16.3% |
| $200,000+ | 693 | 12.0% |
Family Income by Famaliy Size in Riverbank
6-person families (409 | 7.1%) account for the highest median family income in Riverbank with $145,262 per family, while 2-person families (1,463 | 25.3%) have the highest median income of $39,797 per family member.
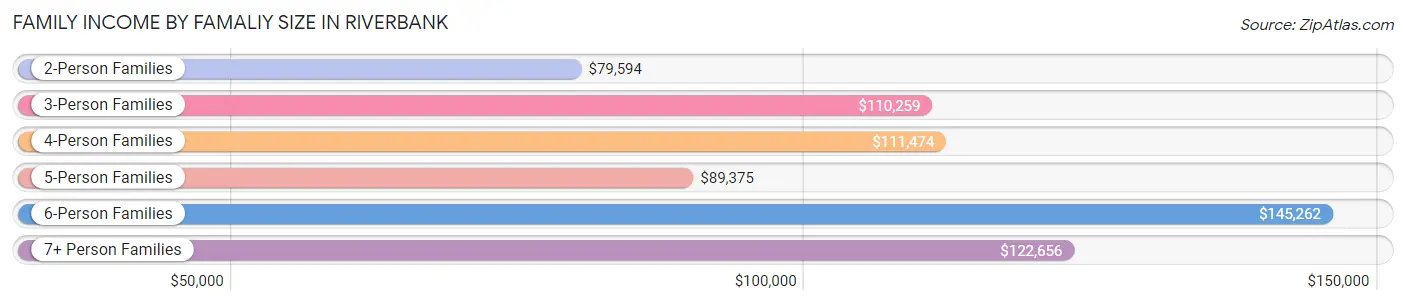
| Income Bracket | # Families | Median Income |
| 2-Person Families | 1,463 (25.3%) | $79,594 |
| 3-Person Families | 1,650 (28.6%) | $110,259 |
| 4-Person Families | 1,289 (22.3%) | $111,474 |
| 5-Person Families | 745 (12.9%) | $89,375 |
| 6-Person Families | 409 (7.1%) | $145,262 |
| 7+ Person Families | 219 (3.8%) | $122,656 |
| Total | 5,775 (100.0%) | $101,199 |
Family Income by Number of Earners in Riverbank
The median family income in Riverbank is $101,199, with families comprising 3+ earners (853) having the highest median family income of $146,469, while families with no earners (572) have the lowest median family income of $25,000, accounting for 14.8% and 9.9% of families, respectively.
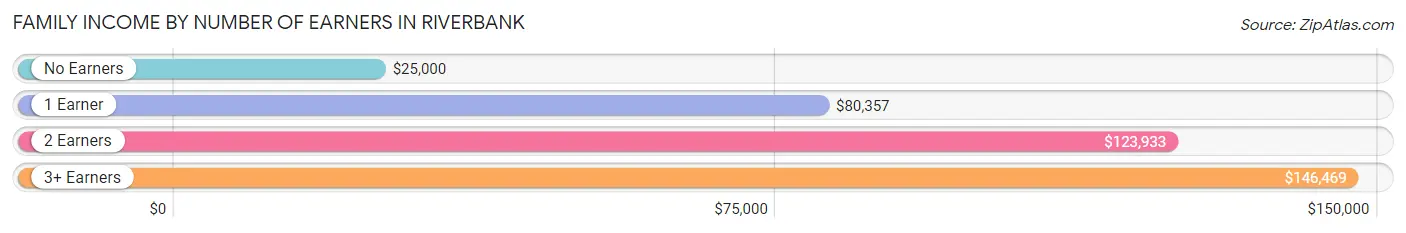
| Number of Earners | # Families | Median Income |
| No Earners | 572 (9.9%) | $25,000 |
| 1 Earner | 2,110 (36.5%) | $80,357 |
| 2 Earners | 2,240 (38.8%) | $123,933 |
| 3+ Earners | 853 (14.8%) | $146,469 |
| Total | 5,775 (100.0%) | $101,199 |
Household Income in Riverbank
Household Income Brackets in Riverbank
With 1,477 households falling in the category, the $100,000 to $149,999 income range is the most frequent in Riverbank, accounting for 20.2% of all households. In contrast, only 124 households (1.7%) fall into the $10,000 to $14,999 income bracket, making it the least populous group.
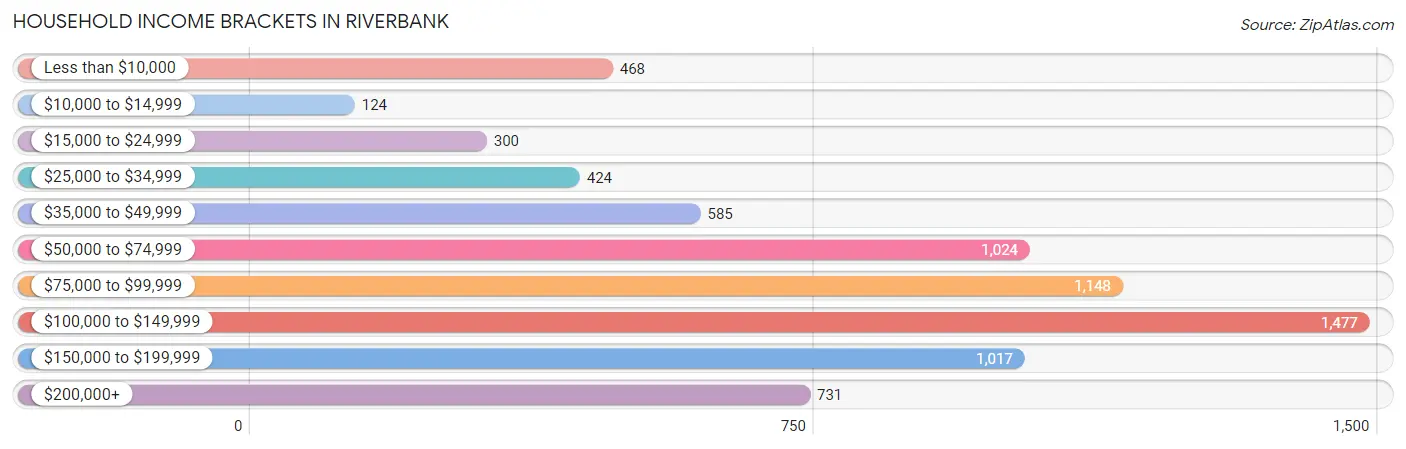
| Income Bracket | # Households | % Households |
| Less than $10,000 | 468 | 6.4% |
| $10,000 to $14,999 | 124 | 1.7% |
| $15,000 to $24,999 | 300 | 4.1% |
| $25,000 to $34,999 | 424 | 5.8% |
| $35,000 to $49,999 | 585 | 8.0% |
| $50,000 to $74,999 | 1,024 | 14.0% |
| $75,000 to $99,999 | 1,148 | 15.7% |
| $100,000 to $149,999 | 1,477 | 20.2% |
| $150,000 to $199,999 | 1,017 | 13.9% |
| $200,000+ | 731 | 10.0% |
Household Income by Householder Age in Riverbank
The median household income in Riverbank is $89,504, with the highest median household income of $104,200 found in the 45 to 64 years age bracket for the primary householder. A total of 2,780 households (38.0%) fall into this category. Meanwhile, the 65+ years age bracket for the primary householder has the lowest median household income of $58,757, with 1,500 households (20.5%) in this group.
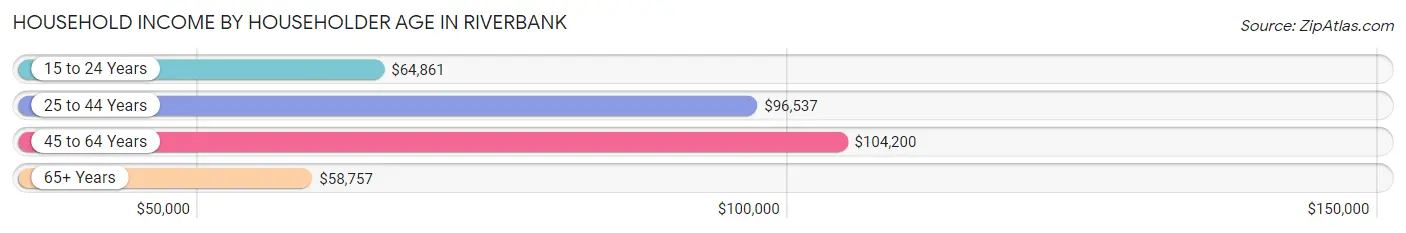
| Income Bracket | # Households | Median Income |
| 15 to 24 Years | 111 (1.5%) | $64,861 |
| 25 to 44 Years | 2,923 (40.0%) | $96,537 |
| 45 to 64 Years | 2,780 (38.0%) | $104,200 |
| 65+ Years | 1,500 (20.5%) | $58,757 |
| Total | 7,314 (100.0%) | $89,504 |
Poverty in Riverbank
Income Below Poverty by Sex and Age in Riverbank
With 12.5% poverty level for males and 14.1% for females among the residents of Riverbank, 6 to 11 year old males and 15 year old females are the most vulnerable to poverty, with 358 males (30.6%) and 52 females (27.7%) in their respective age groups living below the poverty level.
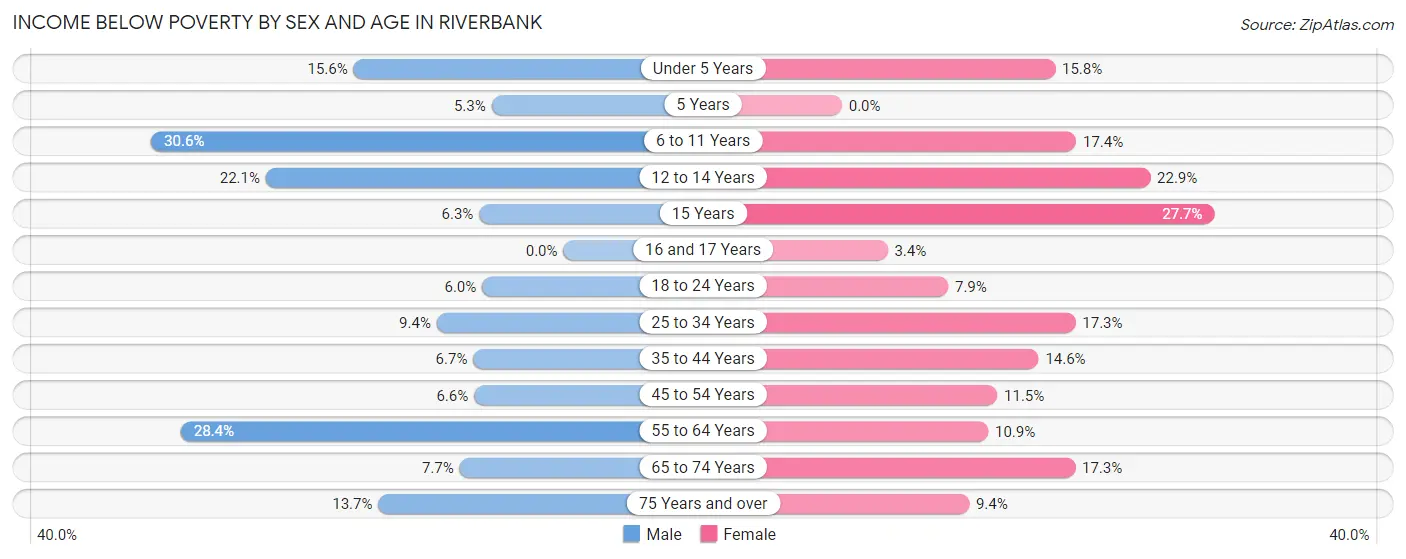
| Age Bracket | Male | Female |
| Under 5 Years | 163 (15.6%) | 142 (15.8%) |
| 5 Years | 13 (5.3%) | 0 (0.0%) |
| 6 to 11 Years | 358 (30.6%) | 164 (17.4%) |
| 12 to 14 Years | 150 (22.1%) | 247 (22.9%) |
| 15 Years | 26 (6.2%) | 52 (27.7%) |
| 16 and 17 Years | 0 (0.0%) | 13 (3.4%) |
| 18 to 24 Years | 62 (6.0%) | 103 (7.9%) |
| 25 to 34 Years | 150 (9.4%) | 275 (17.3%) |
| 35 to 44 Years | 121 (6.7%) | 241 (14.6%) |
| 45 to 54 Years | 126 (6.6%) | 181 (11.5%) |
| 55 to 64 Years | 236 (28.4%) | 143 (10.9%) |
| 65 to 74 Years | 57 (7.7%) | 133 (17.3%) |
| 75 Years and over | 58 (13.7%) | 69 (9.4%) |
| Total | 1,520 (12.5%) | 1,763 (14.1%) |
Income Above Poverty by Sex and Age in Riverbank
According to the poverty statistics in Riverbank, males aged 16 and 17 years and females aged 5 years are the age groups that are most secure financially, with 100.0% of males and 100.0% of females in these age groups living above the poverty line.
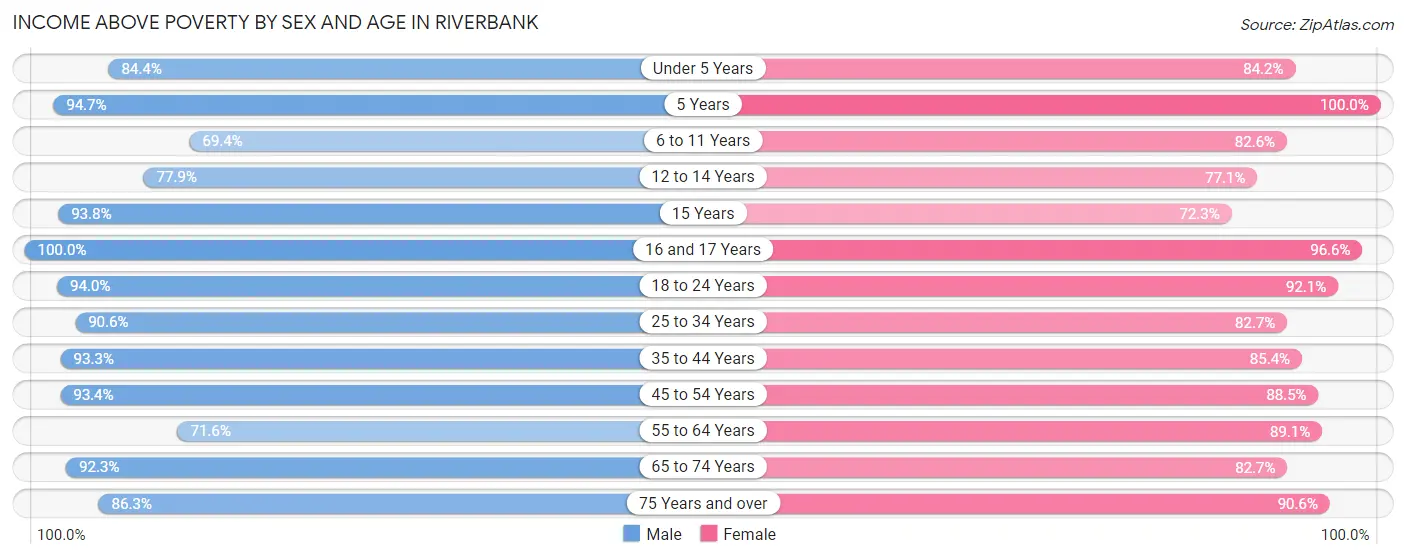
| Age Bracket | Male | Female |
| Under 5 Years | 883 (84.4%) | 755 (84.2%) |
| 5 Years | 231 (94.7%) | 104 (100.0%) |
| 6 to 11 Years | 812 (69.4%) | 779 (82.6%) |
| 12 to 14 Years | 529 (77.9%) | 832 (77.1%) |
| 15 Years | 390 (93.8%) | 136 (72.3%) |
| 16 and 17 Years | 272 (100.0%) | 371 (96.6%) |
| 18 to 24 Years | 966 (94.0%) | 1,203 (92.1%) |
| 25 to 34 Years | 1,445 (90.6%) | 1,311 (82.7%) |
| 35 to 44 Years | 1,689 (93.3%) | 1,410 (85.4%) |
| 45 to 54 Years | 1,775 (93.4%) | 1,389 (88.5%) |
| 55 to 64 Years | 595 (71.6%) | 1,174 (89.1%) |
| 65 to 74 Years | 682 (92.3%) | 635 (82.7%) |
| 75 Years and over | 364 (86.3%) | 662 (90.6%) |
| Total | 10,633 (87.5%) | 10,761 (85.9%) |
Income Below Poverty Among Married-Couple Families in Riverbank
The poverty statistics for married-couple families in Riverbank show that 4.3% or 187 of the total 4,397 families live below the poverty line. Families with 5 or more children have the highest poverty rate of 15.3%, comprising of 13 families. On the other hand, families with 1 or 2 children have the lowest poverty rate of 3.1%, which includes 60 families.
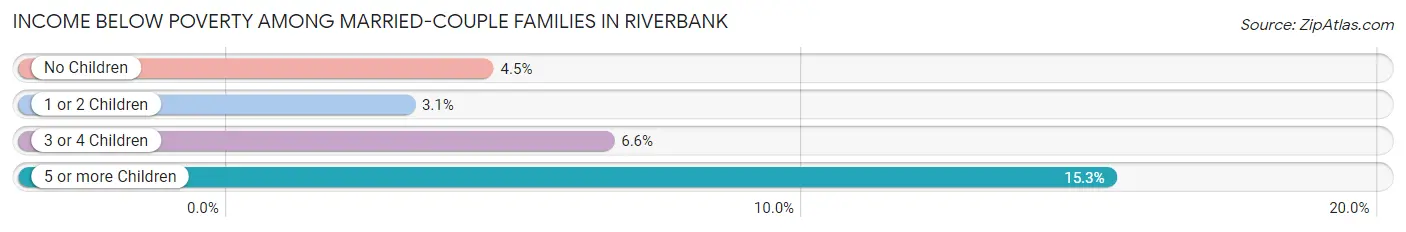
| Children | Above Poverty | Below Poverty |
| No Children | 1,866 (95.6%) | 87 (4.4%) |
| 1 or 2 Children | 1,887 (96.9%) | 60 (3.1%) |
| 3 or 4 Children | 385 (93.4%) | 27 (6.6%) |
| 5 or more Children | 72 (84.7%) | 13 (15.3%) |
| Total | 4,210 (95.8%) | 187 (4.3%) |
Income Below Poverty Among Single-Parent Households in Riverbank
According to the poverty data in Riverbank, 12.6% or 57 single-father households and 39.6% or 367 single-mother households are living below the poverty line. Among single-father households, those with 3 or 4 children have the highest poverty rate, with 33 households (60.0%) experiencing poverty. Likewise, among single-mother households, those with 5 or more children have the highest poverty rate, with 10 households (100.0%) falling below the poverty line.
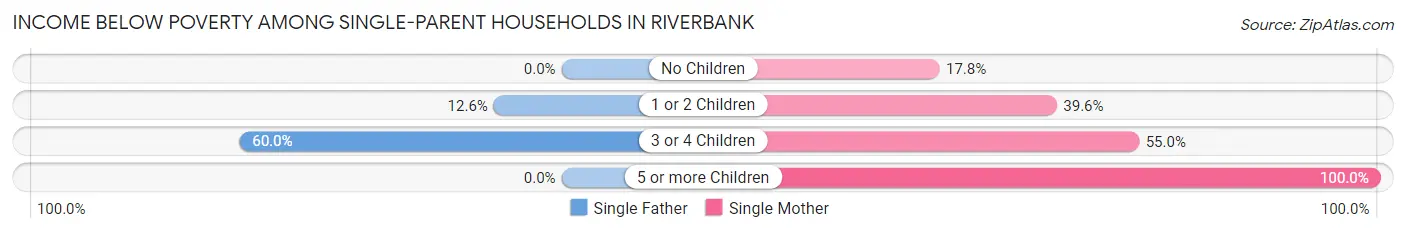
| Children | Single Father | Single Mother |
| No Children | 0 (0.0%) | 35 (17.8%) |
| 1 or 2 Children | 24 (12.6%) | 189 (39.6%) |
| 3 or 4 Children | 33 (60.0%) | 133 (55.0%) |
| 5 or more Children | 0 (0.0%) | 10 (100.0%) |
| Total | 57 (12.6%) | 367 (39.6%) |
Income Below Poverty Among Married-Couple vs Single-Parent Households in Riverbank
The poverty data for Riverbank shows that 187 of the married-couple family households (4.3%) and 424 of the single-parent households (30.8%) are living below the poverty level. Within the married-couple family households, those with 5 or more children have the highest poverty rate, with 13 households (15.3%) falling below the poverty line. Among the single-parent households, those with 5 or more children have the highest poverty rate, with 10 household (100.0%) living below poverty.
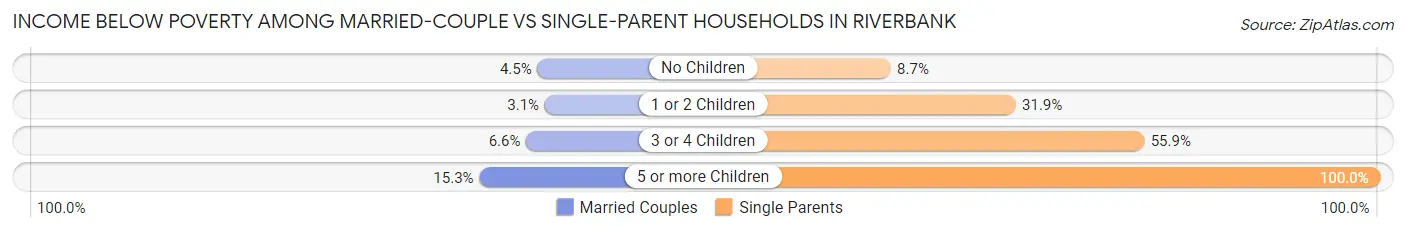
| Children | Married-Couple Families | Single-Parent Households |
| No Children | 87 (4.4%) | 35 (8.7%) |
| 1 or 2 Children | 60 (3.1%) | 213 (31.9%) |
| 3 or 4 Children | 27 (6.6%) | 166 (55.9%) |
| 5 or more Children | 13 (15.3%) | 10 (100.0%) |
| Total | 187 (4.3%) | 424 (30.8%) |
Race in Riverbank
The most populous races in Riverbank are Hispanic or Latino (13,777 | 55.5%), White / Caucasian (13,385 | 54.0%), and Two or more Races (5,658 | 22.8%).
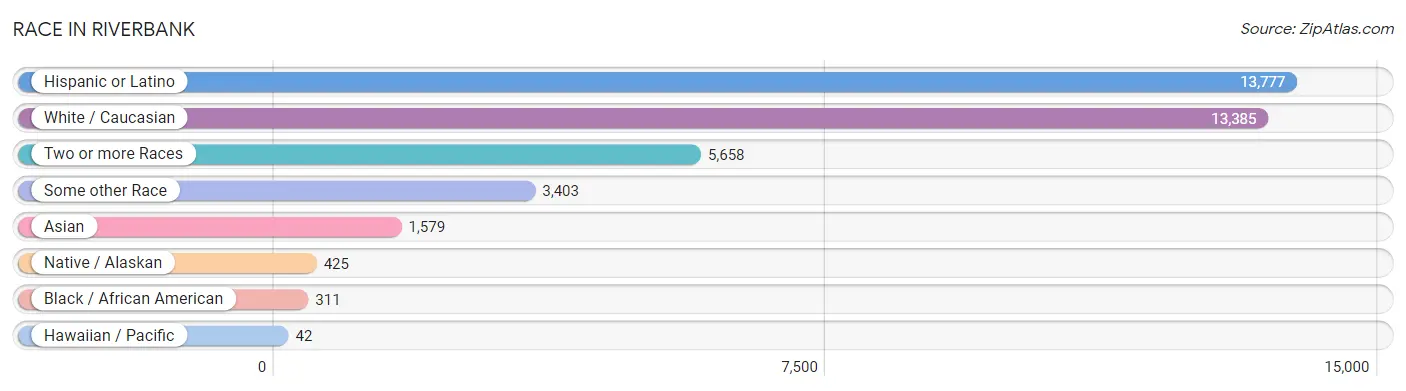
| Race | # Population | % Population |
| Asian | 1,579 | 6.4% |
| Black / African American | 311 | 1.3% |
| Hawaiian / Pacific | 42 | 0.2% |
| Hispanic or Latino | 13,777 | 55.5% |
| Native / Alaskan | 425 | 1.7% |
| White / Caucasian | 13,385 | 54.0% |
| Two or more Races | 5,658 | 22.8% |
| Some other Race | 3,403 | 13.7% |
| Total | 24,803 | 100.0% |
Ancestry in Riverbank
The most populous ancestries reported in Riverbank are Mexican (12,836 | 51.7%), German (1,645 | 6.6%), American (1,621 | 6.5%), English (1,107 | 4.5%), and Irish (847 | 3.4%), together accounting for 72.8% of all Riverbank residents.
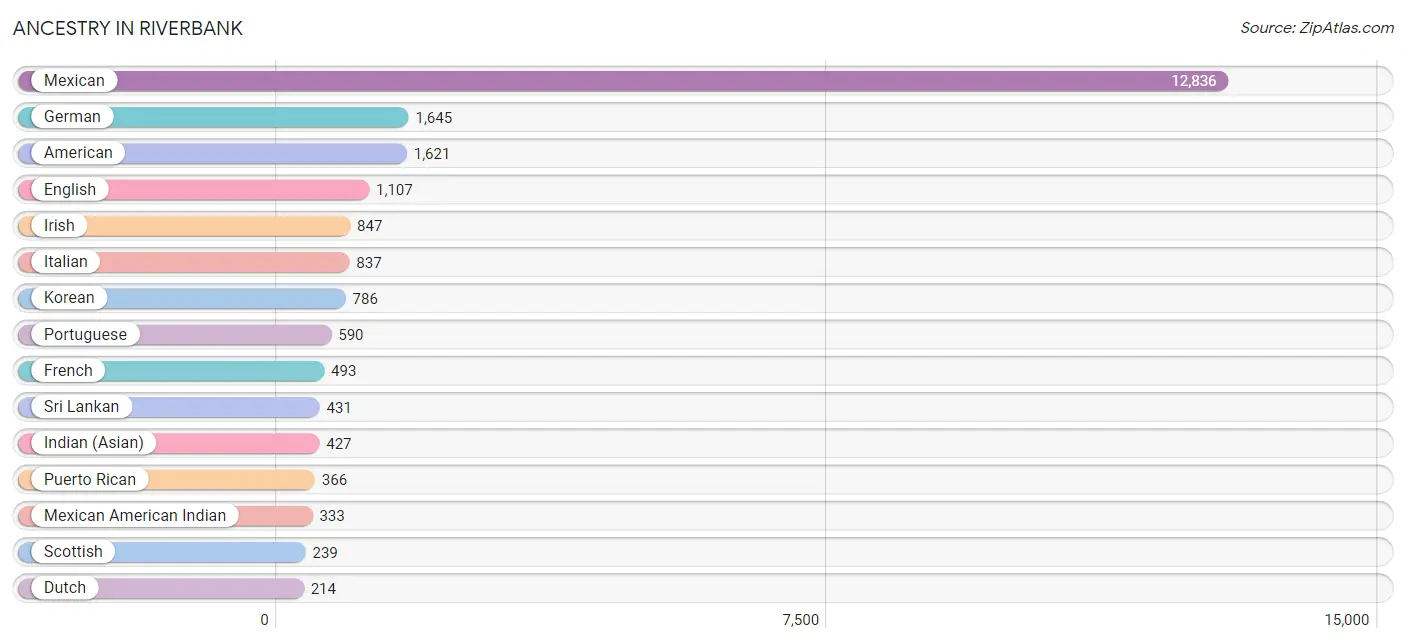
| Ancestry | # Population | % Population |
| African | 2 | 0.0% |
| American | 1,621 | 6.5% |
| Apache | 23 | 0.1% |
| Arab | 126 | 0.5% |
| Armenian | 14 | 0.1% |
| Assyrian / Chaldean / Syriac | 4 | 0.0% |
| Austrian | 22 | 0.1% |
| Belizean | 18 | 0.1% |
| Bhutanese | 25 | 0.1% |
| Brazilian | 10 | 0.0% |
| British | 30 | 0.1% |
| Burmese | 49 | 0.2% |
| Canadian | 16 | 0.1% |
| Celtic | 9 | 0.0% |
| Central American | 178 | 0.7% |
| Central American Indian | 87 | 0.4% |
| Cherokee | 31 | 0.1% |
| Chippewa | 37 | 0.2% |
| Creek | 8 | 0.0% |
| Cuban | 70 | 0.3% |
| Danish | 104 | 0.4% |
| Dutch | 214 | 0.9% |
| Eastern European | 10 | 0.0% |
| English | 1,107 | 4.5% |
| European | 189 | 0.8% |
| French | 493 | 2.0% |
| French Canadian | 8 | 0.0% |
| German | 1,645 | 6.6% |
| Greek | 49 | 0.2% |
| Guamanian / Chamorro | 4 | 0.0% |
| Guatemalan | 15 | 0.1% |
| Honduran | 34 | 0.1% |
| Hungarian | 34 | 0.1% |
| Icelander | 43 | 0.2% |
| Indian (Asian) | 427 | 1.7% |
| Indonesian | 51 | 0.2% |
| Iranian | 93 | 0.4% |
| Irish | 847 | 3.4% |
| Iroquois | 10 | 0.0% |
| Italian | 837 | 3.4% |
| Jamaican | 20 | 0.1% |
| Japanese | 27 | 0.1% |
| Korean | 786 | 3.2% |
| Lebanese | 10 | 0.0% |
| Mexican | 12,836 | 51.7% |
| Mexican American Indian | 333 | 1.3% |
| Native Hawaiian | 90 | 0.4% |
| Nicaraguan | 19 | 0.1% |
| Northern European | 91 | 0.4% |
| Norwegian | 125 | 0.5% |
| Palestinian | 16 | 0.1% |
| Peruvian | 107 | 0.4% |
| Polish | 50 | 0.2% |
| Portuguese | 590 | 2.4% |
| Puerto Rican | 366 | 1.5% |
| Russian | 29 | 0.1% |
| Salvadoran | 110 | 0.4% |
| Samoan | 38 | 0.2% |
| Scandinavian | 6 | 0.0% |
| Scotch-Irish | 73 | 0.3% |
| Scottish | 239 | 1.0% |
| Seminole | 106 | 0.4% |
| Serbian | 1 | 0.0% |
| Slavic | 63 | 0.3% |
| South American | 107 | 0.4% |
| Spaniard | 53 | 0.2% |
| Spanish | 61 | 0.3% |
| Sri Lankan | 431 | 1.7% |
| Subsaharan African | 2 | 0.0% |
| Swedish | 159 | 0.6% |
| Swiss | 44 | 0.2% |
| Thai | 190 | 0.8% |
| Tohono O'Odham | 41 | 0.2% |
| Ukrainian | 41 | 0.2% |
| Welsh | 70 | 0.3% |
| Yugoslavian | 49 | 0.2% | View All 76 Rows |
Immigrants in Riverbank
The most numerous immigrant groups reported in Riverbank came from Latin America (4,148 | 16.7%), Central America (4,094 | 16.5%), Mexico (4,007 | 16.2%), Asia (1,147 | 4.6%), and South Eastern Asia (575 | 2.3%), together accounting for 56.3% of all Riverbank residents.
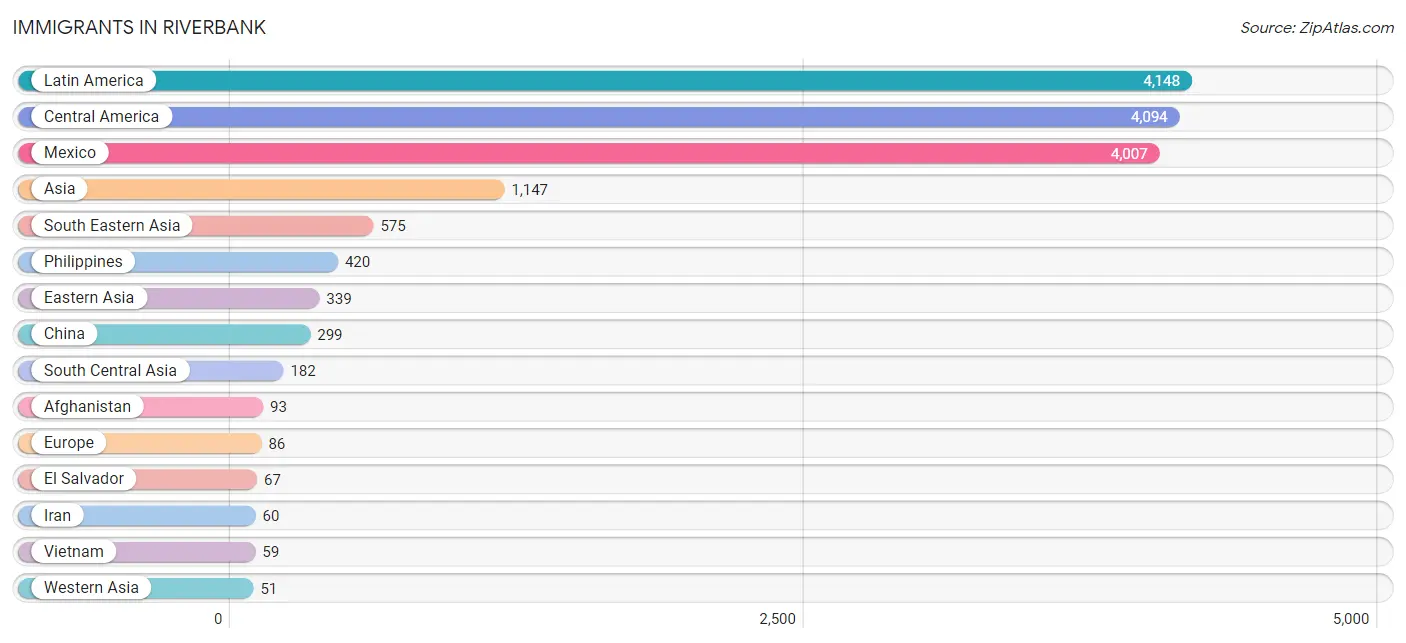
| Immigration Origin | # Population | % Population |
| Afghanistan | 93 | 0.4% |
| Africa | 27 | 0.1% |
| Asia | 1,147 | 4.6% |
| Australia | 21 | 0.1% |
| Azores | 26 | 0.1% |
| Brazil | 10 | 0.0% |
| Cambodia | 33 | 0.1% |
| Canada | 3 | 0.0% |
| Caribbean | 18 | 0.1% |
| Central America | 4,094 | 16.5% |
| China | 299 | 1.2% |
| Cuba | 18 | 0.1% |
| Eastern Asia | 339 | 1.4% |
| El Salvador | 67 | 0.3% |
| England | 3 | 0.0% |
| Europe | 86 | 0.4% |
| Germany | 24 | 0.1% |
| Greece | 2 | 0.0% |
| Guatemala | 10 | 0.0% |
| Honduras | 10 | 0.0% |
| Hong Kong | 31 | 0.1% |
| India | 29 | 0.1% |
| Iran | 60 | 0.2% |
| Iraq | 35 | 0.1% |
| Israel | 10 | 0.0% |
| Korea | 40 | 0.2% |
| Latin America | 4,148 | 16.7% |
| Mexico | 4,007 | 16.2% |
| Northern Europe | 17 | 0.1% |
| Oceania | 21 | 0.1% |
| Peru | 26 | 0.1% |
| Philippines | 420 | 1.7% |
| Portugal | 35 | 0.1% |
| South Africa | 27 | 0.1% |
| South America | 36 | 0.2% |
| South Central Asia | 182 | 0.7% |
| South Eastern Asia | 575 | 2.3% |
| Southern Europe | 45 | 0.2% |
| Spain | 8 | 0.0% |
| Thailand | 25 | 0.1% |
| Vietnam | 59 | 0.2% |
| Western Asia | 51 | 0.2% |
| Western Europe | 24 | 0.1% |
| Yemen | 6 | 0.0% | View All 44 Rows |
Sex and Age in Riverbank
Sex and Age in Riverbank
The most populous age groups in Riverbank are 45 to 49 Years (1,186 | 9.7%) for men and 10 to 14 Years (1,464 | 11.6%) for women.
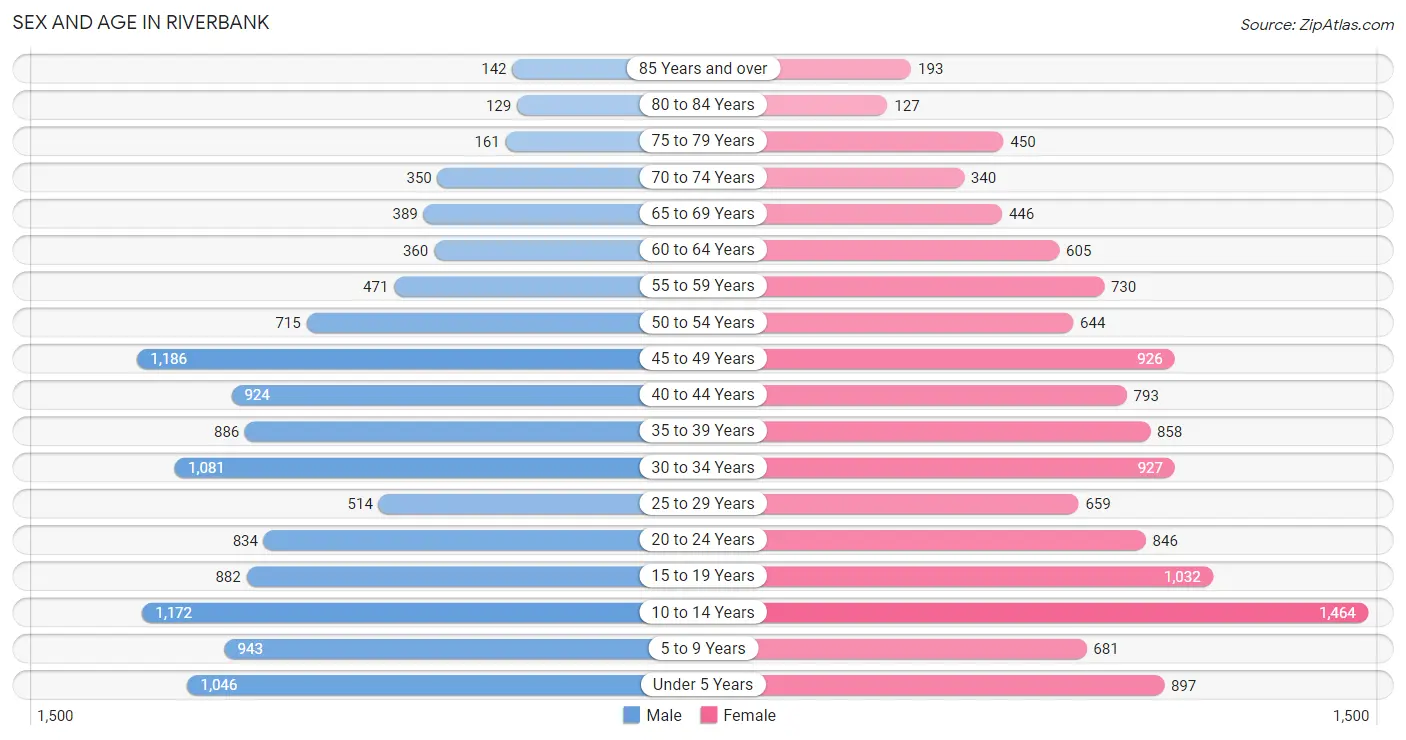
| Age Bracket | Male | Female |
| Under 5 Years | 1,046 (8.6%) | 897 (7.1%) |
| 5 to 9 Years | 943 (7.7%) | 681 (5.4%) |
| 10 to 14 Years | 1,172 (9.6%) | 1,464 (11.6%) |
| 15 to 19 Years | 882 (7.2%) | 1,032 (8.2%) |
| 20 to 24 Years | 834 (6.8%) | 846 (6.7%) |
| 25 to 29 Years | 514 (4.2%) | 659 (5.2%) |
| 30 to 34 Years | 1,081 (8.9%) | 927 (7.3%) |
| 35 to 39 Years | 886 (7.3%) | 858 (6.8%) |
| 40 to 44 Years | 924 (7.6%) | 793 (6.3%) |
| 45 to 49 Years | 1,186 (9.7%) | 926 (7.3%) |
| 50 to 54 Years | 715 (5.9%) | 644 (5.1%) |
| 55 to 59 Years | 471 (3.9%) | 730 (5.8%) |
| 60 to 64 Years | 360 (2.9%) | 605 (4.8%) |
| 65 to 69 Years | 389 (3.2%) | 446 (3.5%) |
| 70 to 74 Years | 350 (2.9%) | 340 (2.7%) |
| 75 to 79 Years | 161 (1.3%) | 450 (3.6%) |
| 80 to 84 Years | 129 (1.1%) | 127 (1.0%) |
| 85 Years and over | 142 (1.2%) | 193 (1.5%) |
| Total | 12,185 (100.0%) | 12,618 (100.0%) |
Families and Households in Riverbank
Median Family Size in Riverbank
The median family size in Riverbank is 3.81 persons per family, with married-couple families (4,397 | 76.1%) accounting for the largest median family size of 3.9 persons per family. On the other hand, single male/father families (452 | 7.8%) represent the smallest median family size with 2.83 persons per family.
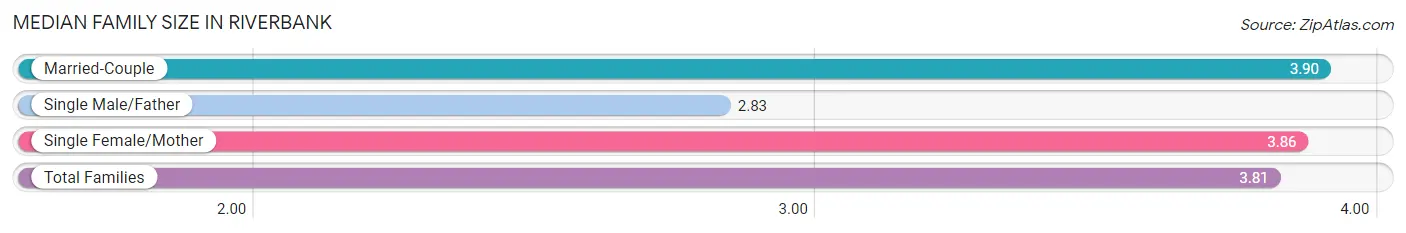
| Family Type | # Families | Family Size |
| Married-Couple | 4,397 (76.1%) | 3.90 |
| Single Male/Father | 452 (7.8%) | 2.83 |
| Single Female/Mother | 926 (16.0%) | 3.86 |
| Total Families | 5,775 (100.0%) | 3.81 |
Median Household Size in Riverbank
The median household size in Riverbank is 3.35 persons per household, with single female/mother households (926 | 12.7%) accounting for the largest median household size of 4.26 persons per household. non-family households (1,539 | 21.0%) represent the smallest median household size with 1.21 persons per household.
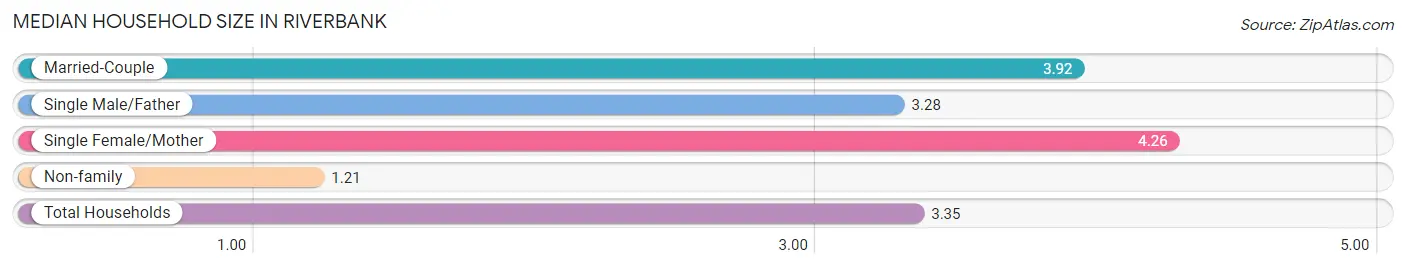
| Household Type | # Households | Household Size |
| Married-Couple | 4,397 (60.1%) | 3.92 |
| Single Male/Father | 452 (6.2%) | 3.28 |
| Single Female/Mother | 926 (12.7%) | 4.26 |
| Non-family | 1,539 (21.0%) | 1.21 |
| Total Households | 7,314 (100.0%) | 3.35 |
Household Size by Marriage Status in Riverbank
Out of a total of 7,314 households in Riverbank, 5,775 (79.0%) are family households, while 1,539 (21.0%) are nonfamily households. The most numerous type of family households are 3-person households, comprising 1,575, and the most common type of nonfamily households are 1-person households, comprising 1,267.
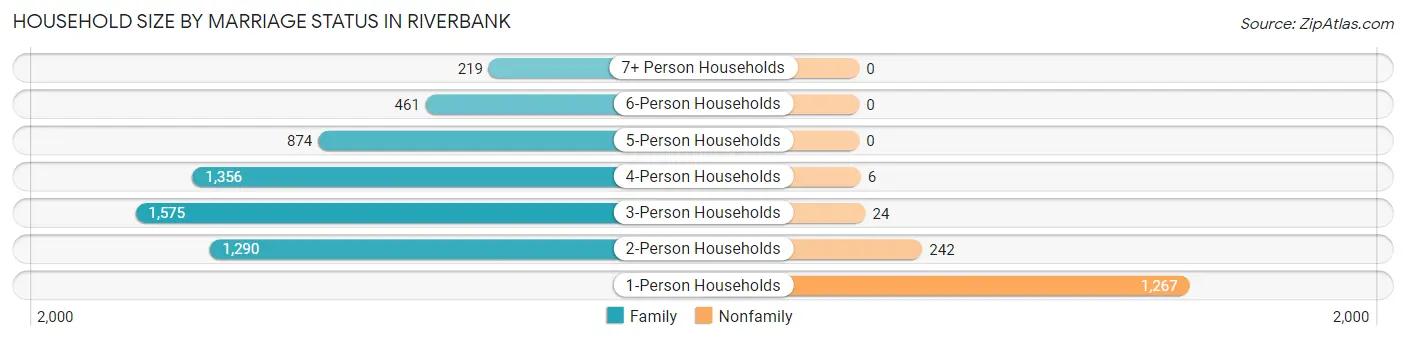
| Household Size | Family Households | Nonfamily Households |
| 1-Person Households | - | 1,267 (17.3%) |
| 2-Person Households | 1,290 (17.6%) | 242 (3.3%) |
| 3-Person Households | 1,575 (21.5%) | 24 (0.3%) |
| 4-Person Households | 1,356 (18.5%) | 6 (0.1%) |
| 5-Person Households | 874 (11.9%) | 0 (0.0%) |
| 6-Person Households | 461 (6.3%) | 0 (0.0%) |
| 7+ Person Households | 219 (3.0%) | 0 (0.0%) |
| Total | 5,775 (79.0%) | 1,539 (21.0%) |
Female Fertility in Riverbank
Fertility by Age in Riverbank
Average fertility rate in Riverbank is 66.0 births per 1,000 women. Women in the age bracket of 20 to 34 years have the highest fertility rate with 146.0 births per 1,000 women. Women in the age bracket of 20 to 34 years acount for 87.4% of all women with births.
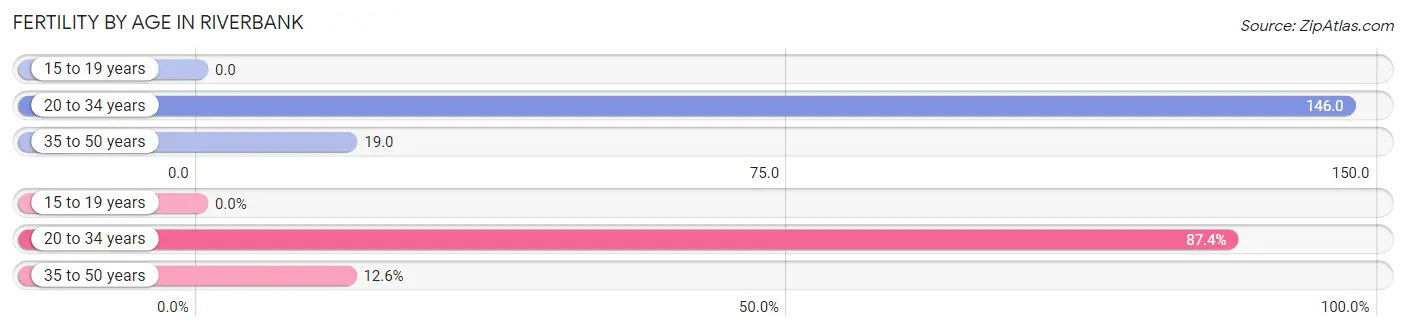
| Age Bracket | Women with Births | Births / 1,000 Women |
| 15 to 19 years | 0 (0.0%) | 0.0 |
| 20 to 34 years | 354 (87.4%) | 146.0 |
| 35 to 50 years | 51 (12.6%) | 19.0 |
| Total | 405 (100.0%) | 66.0 |
Fertility by Age by Marriage Status in Riverbank
57.8% of women with births (405) in Riverbank are married. The highest percentage of unmarried women with births falls into 20 to 34 years age bracket with 44.9% of them unmarried at the time of birth, while the lowest percentage of unmarried women with births belong to 35 to 50 years age bracket with 23.5% of them unmarried.
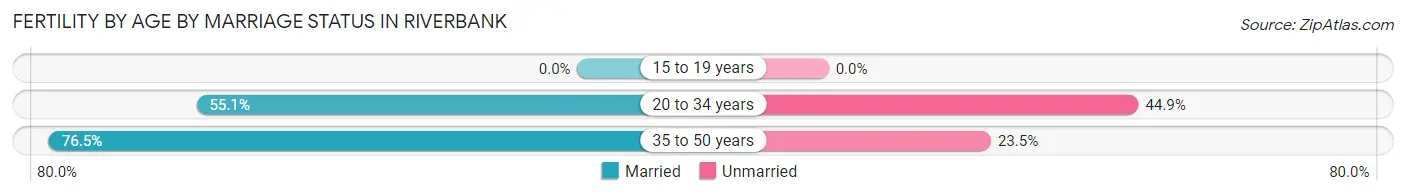
| Age Bracket | Married | Unmarried |
| 15 to 19 years | 0 (0.0%) | 0 (0.0%) |
| 20 to 34 years | 195 (55.1%) | 159 (44.9%) |
| 35 to 50 years | 39 (76.5%) | 12 (23.5%) |
| Total | 234 (57.8%) | 171 (42.2%) |
Fertility by Education in Riverbank
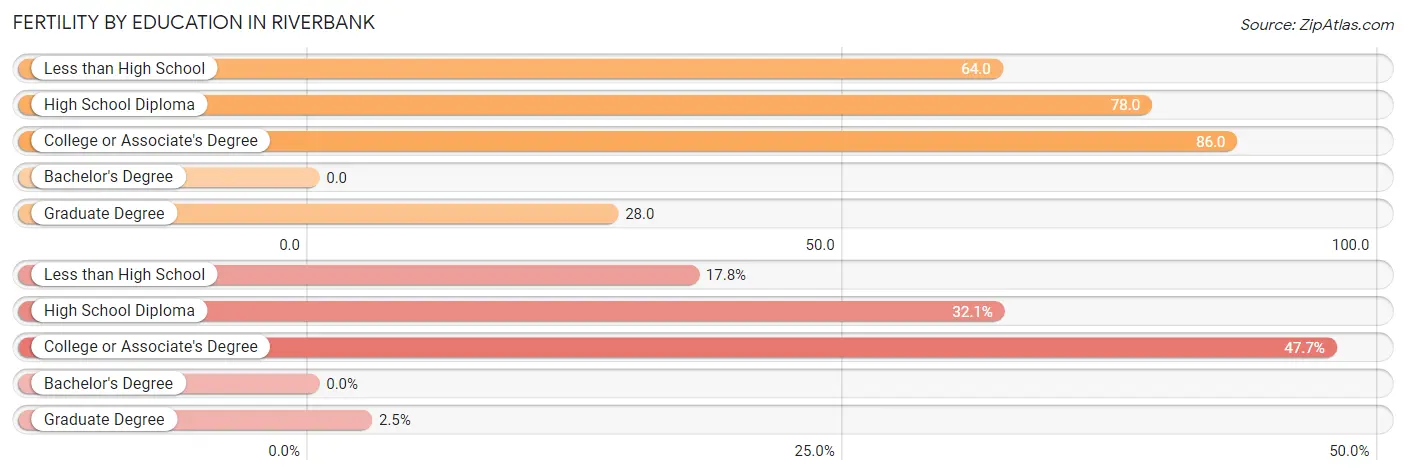
| Educational Attainment | Women with Births | Births / 1,000 Women |
| Less than High School | 72 (17.8%) | 64.0 |
| High School Diploma | 130 (32.1%) | 78.0 |
| College or Associate's Degree | 193 (47.6%) | 86.0 |
| Bachelor's Degree | 0 (0.0%) | 0.0 |
| Graduate Degree | 10 (2.5%) | 28.0 |
| Total | 405 (100.0%) | 66.0 |
Fertility by Education by Marriage Status in Riverbank
42.2% of women with births in Riverbank are unmarried. Women with the educational attainment of less than high school are most likely to be married with 100.0% of them married at childbirth, while women with the educational attainment of high school diploma are least likely to be married with 70.8% of them unmarried at childbirth.
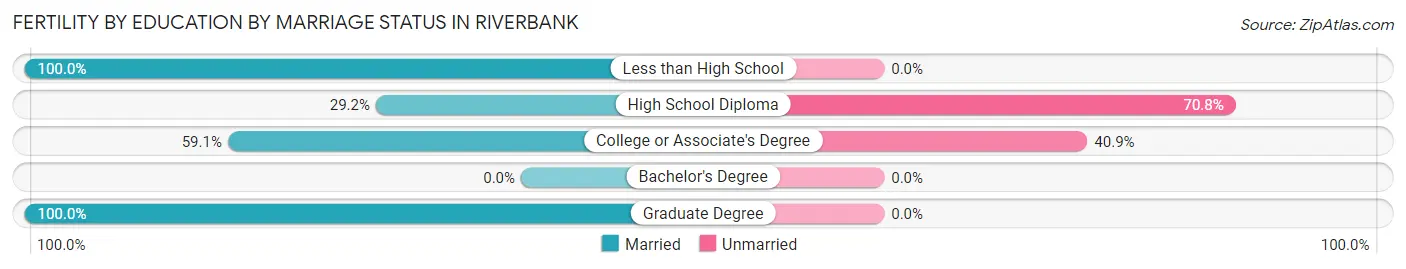
| Educational Attainment | Married | Unmarried |
| Less than High School | 72 (100.0%) | 0 (0.0%) |
| High School Diploma | 38 (29.2%) | 92 (70.8%) |
| College or Associate's Degree | 114 (59.1%) | 79 (40.9%) |
| Bachelor's Degree | 0 (0.0%) | 0 (0.0%) |
| Graduate Degree | 10 (100.0%) | 0 (0.0%) |
| Total | 234 (57.8%) | 171 (42.2%) |
Employment Characteristics in Riverbank
Employment by Class of Employer in Riverbank
Among the 10,442 employed individuals in Riverbank, private company employees (6,975 | 66.8%), local government employees (1,464 | 14.0%), and not-for-profit organizations (629 | 6.0%) make up the most common classes of employment.
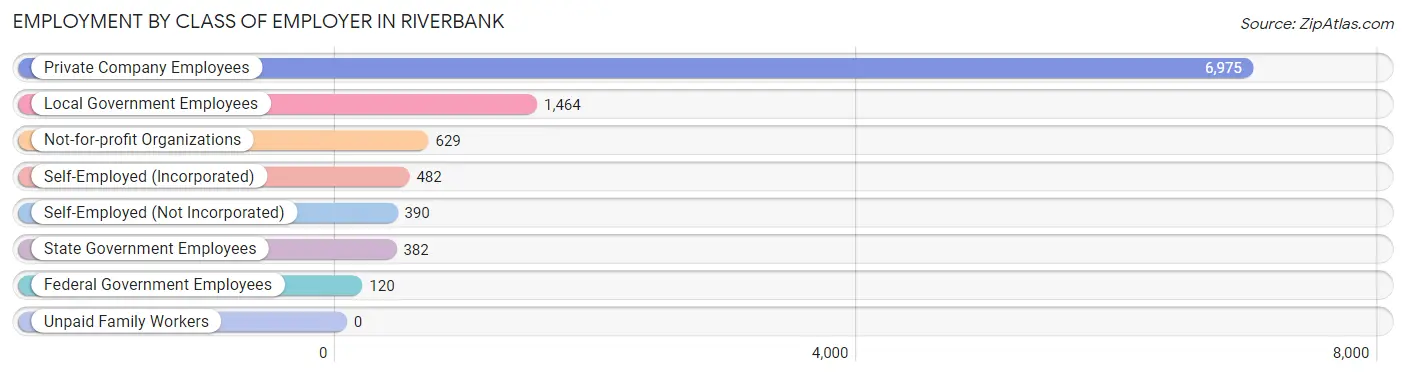
| Employer Class | # Employees | % Employees |
| Private Company Employees | 6,975 | 66.8% |
| Self-Employed (Incorporated) | 482 | 4.6% |
| Self-Employed (Not Incorporated) | 390 | 3.7% |
| Not-for-profit Organizations | 629 | 6.0% |
| Local Government Employees | 1,464 | 14.0% |
| State Government Employees | 382 | 3.7% |
| Federal Government Employees | 120 | 1.1% |
| Unpaid Family Workers | 0 | 0.0% |
| Total | 10,442 | 100.0% |
Employment Status by Age in Riverbank
According to the labor force statistics for Riverbank, out of the total population over 16 years of age (17,996), 62.9% or 11,319 individuals are in the labor force, with 5.9% or 668 of them unemployed. The age group with the highest labor force participation rate is 45 to 54 years, with 83.7% or 2,905 individuals in the labor force. Within the labor force, the 20 to 24 years age range has the highest percentage of unemployed individuals, with 12.1% or 141 of them being unemployed.
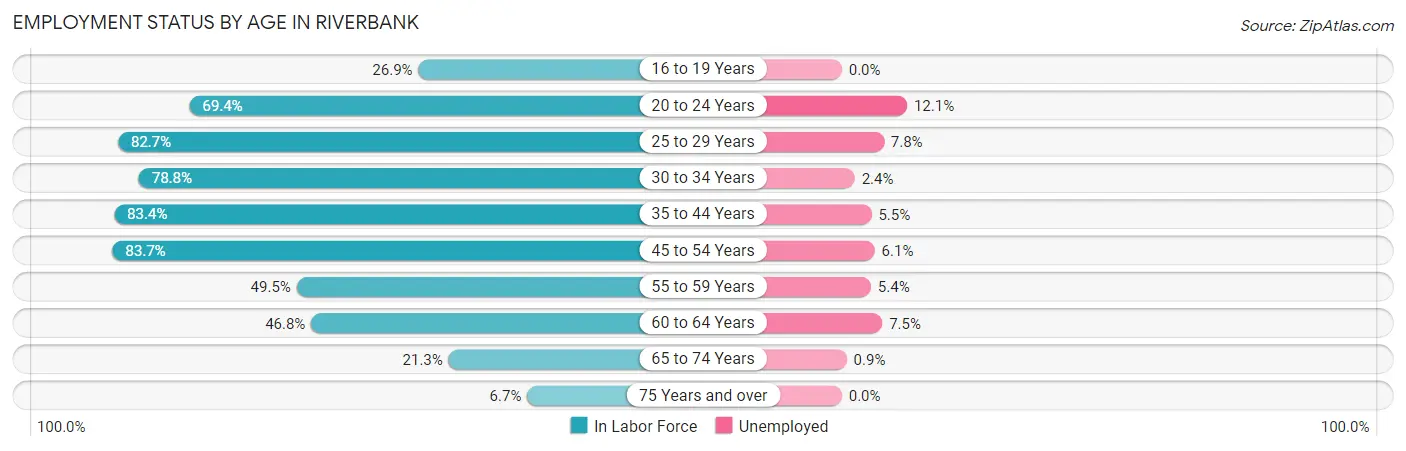
| Age Bracket | In Labor Force | Unemployed |
| 16 to 19 Years | 352 (26.9%) | 0 (0.0%) |
| 20 to 24 Years | 1,166 (69.4%) | 141 (12.1%) |
| 25 to 29 Years | 970 (82.7%) | 76 (7.8%) |
| 30 to 34 Years | 1,582 (78.8%) | 38 (2.4%) |
| 35 to 44 Years | 2,886 (83.4%) | 159 (5.5%) |
| 45 to 54 Years | 2,905 (83.7%) | 177 (6.1%) |
| 55 to 59 Years | 594 (49.5%) | 32 (5.4%) |
| 60 to 64 Years | 452 (46.8%) | 34 (7.5%) |
| 65 to 74 Years | 325 (21.3%) | 3 (0.9%) |
| 75 Years and over | 81 (6.7%) | 0 (0.0%) |
| Total | 11,319 (62.9%) | 668 (5.9%) |
Employment Status by Educational Attainment in Riverbank
According to labor force statistics for Riverbank, 76.5% of individuals (9,393) out of the total population between 25 and 64 years of age (12,279) are in the labor force, with 5.5% or 517 of them being unemployed. The group with the highest labor force participation rate are those with the educational attainment of bachelor's degree or higher, with 87.3% or 2,123 individuals in the labor force. Within the labor force, individuals with less than high school education have the highest percentage of unemployment, with 9.3% or 128 of them being unemployed.
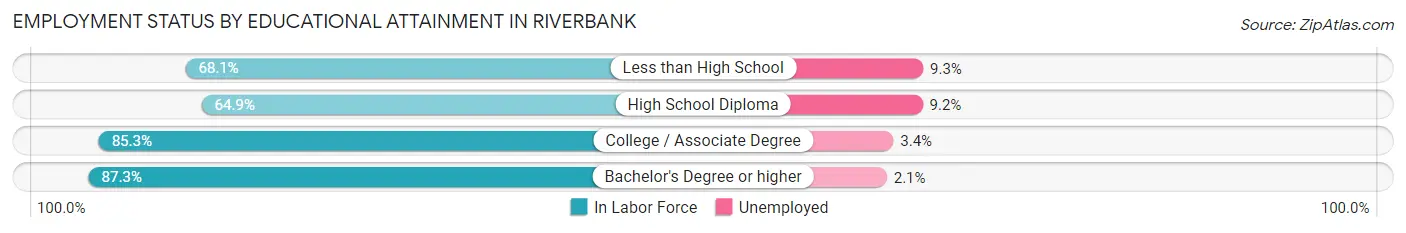
| Educational Attainment | In Labor Force | Unemployed |
| Less than High School | 1,380 (68.1%) | 189 (9.3%) |
| High School Diploma | 2,490 (64.9%) | 353 (9.2%) |
| College / Associate Degree | 3,398 (85.3%) | 135 (3.4%) |
| Bachelor's Degree or higher | 2,123 (87.3%) | 51 (2.1%) |
| Total | 9,393 (76.5%) | 675 (5.5%) |
Employment Occupations by Sex in Riverbank
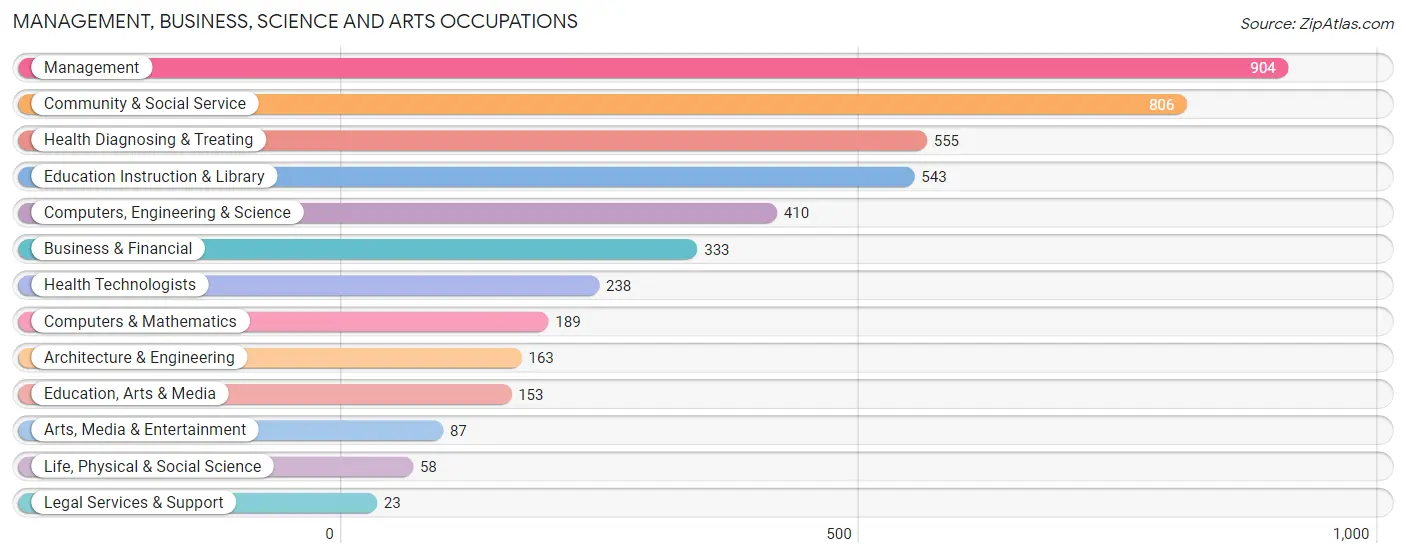
Management, Business, Science and Arts Occupations
The most common Management, Business, Science and Arts occupations in Riverbank are Management (904 | 8.6%), Community & Social Service (806 | 7.6%), Health Diagnosing & Treating (555 | 5.2%), Education Instruction & Library (543 | 5.1%), and Computers, Engineering & Science (410 | 3.9%).
Management, Business, Science and Arts Occupations by Sex
Within the Management, Business, Science and Arts occupations in Riverbank, the most male-oriented occupations are Architecture & Engineering (97.6%), Arts, Media & Entertainment (81.6%), and Computers, Engineering & Science (62.0%), while the most female-oriented occupations are Legal Services & Support (100.0%), Education Instruction & Library (75.5%), and Life, Physical & Social Science (74.1%).
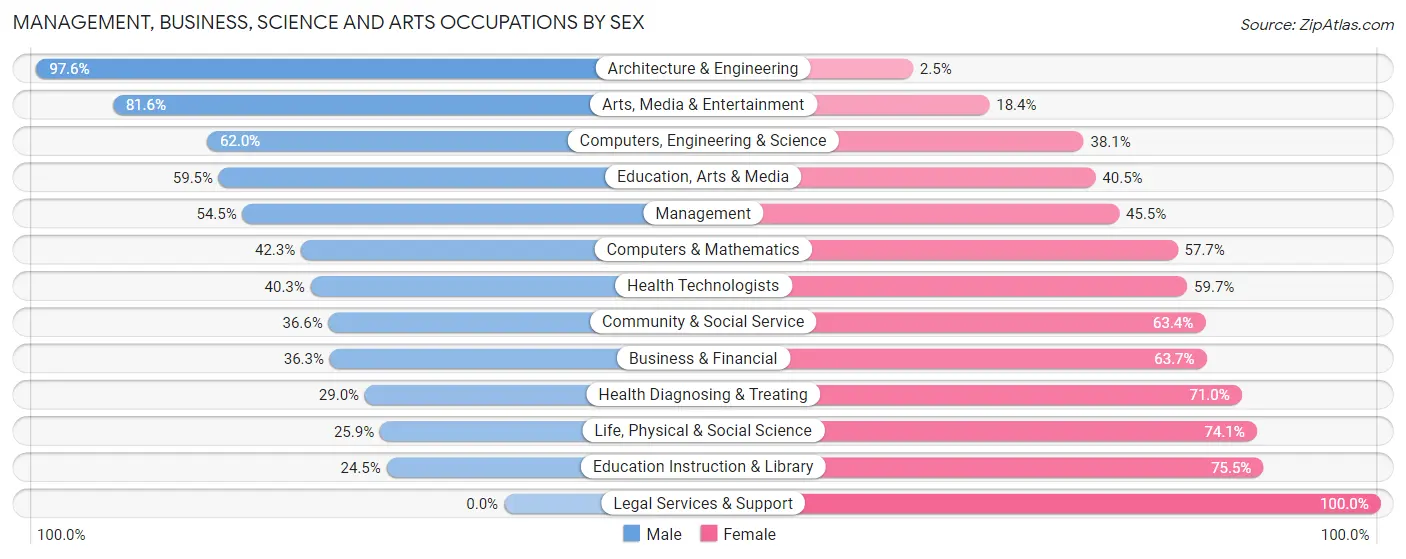
| Occupation | Male | Female |
| Management | 493 (54.5%) | 411 (45.5%) |
| Business & Financial | 121 (36.3%) | 212 (63.7%) |
| Computers, Engineering & Science | 254 (62.0%) | 156 (38.1%) |
| Computers & Mathematics | 80 (42.3%) | 109 (57.7%) |
| Architecture & Engineering | 159 (97.6%) | 4 (2.5%) |
| Life, Physical & Social Science | 15 (25.9%) | 43 (74.1%) |
| Community & Social Service | 295 (36.6%) | 511 (63.4%) |
| Education, Arts & Media | 91 (59.5%) | 62 (40.5%) |
| Legal Services & Support | 0 (0.0%) | 23 (100.0%) |
| Education Instruction & Library | 133 (24.5%) | 410 (75.5%) |
| Arts, Media & Entertainment | 71 (81.6%) | 16 (18.4%) |
| Health Diagnosing & Treating | 161 (29.0%) | 394 (71.0%) |
| Health Technologists | 96 (40.3%) | 142 (59.7%) |
| Total (Category) | 1,324 (44.0%) | 1,684 (56.0%) |
| Total (Overall) | 6,064 (57.3%) | 4,512 (42.7%) |
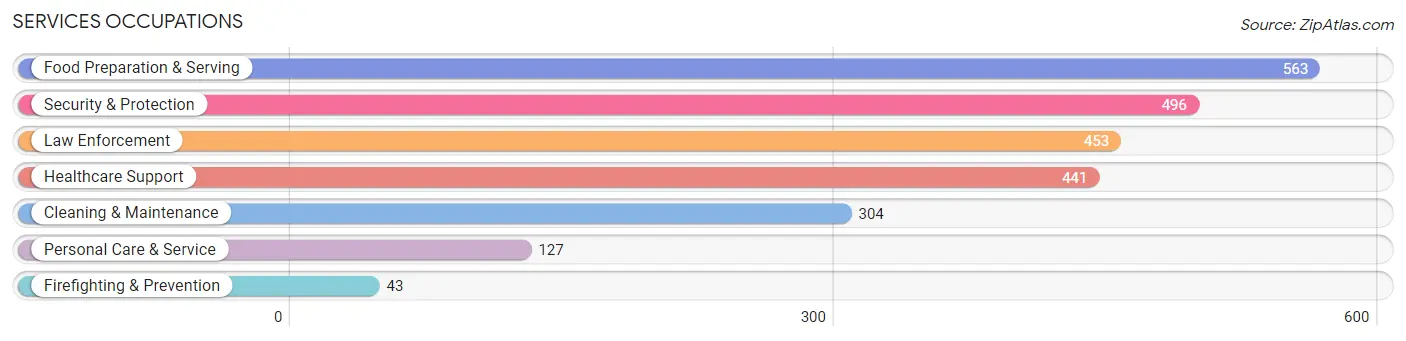
Services Occupations
The most common Services occupations in Riverbank are Food Preparation & Serving (563 | 5.3%), Security & Protection (496 | 4.7%), Law Enforcement (453 | 4.3%), Healthcare Support (441 | 4.2%), and Cleaning & Maintenance (304 | 2.9%).
Services Occupations by Sex
Within the Services occupations in Riverbank, the most male-oriented occupations are Law Enforcement (100.0%), Security & Protection (98.4%), and Firefighting & Prevention (81.4%), while the most female-oriented occupations are Healthcare Support (98.4%), Personal Care & Service (87.4%), and Food Preparation & Serving (54.2%).
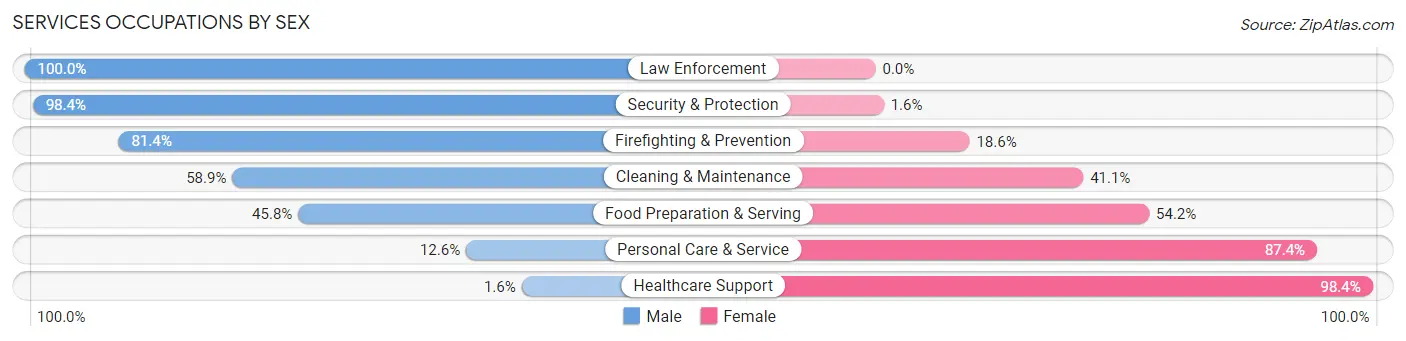
| Occupation | Male | Female |
| Healthcare Support | 7 (1.6%) | 434 (98.4%) |
| Security & Protection | 488 (98.4%) | 8 (1.6%) |
| Firefighting & Prevention | 35 (81.4%) | 8 (18.6%) |
| Law Enforcement | 453 (100.0%) | 0 (0.0%) |
| Food Preparation & Serving | 258 (45.8%) | 305 (54.2%) |
| Cleaning & Maintenance | 179 (58.9%) | 125 (41.1%) |
| Personal Care & Service | 16 (12.6%) | 111 (87.4%) |
| Total (Category) | 948 (49.1%) | 983 (50.9%) |
| Total (Overall) | 6,064 (57.3%) | 4,512 (42.7%) |
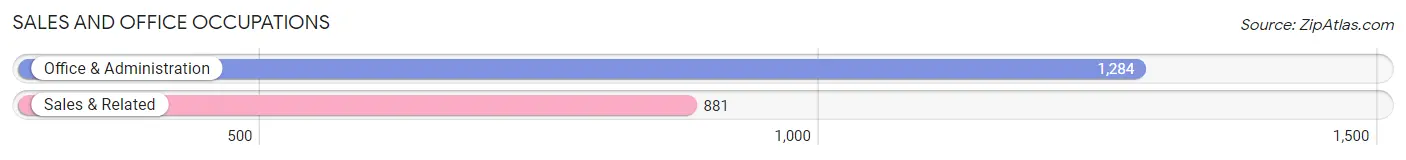
Sales and Office Occupations
The most common Sales and Office occupations in Riverbank are Office & Administration (1,284 | 12.1%), and Sales & Related (881 | 8.3%).
Sales and Office Occupations by Sex
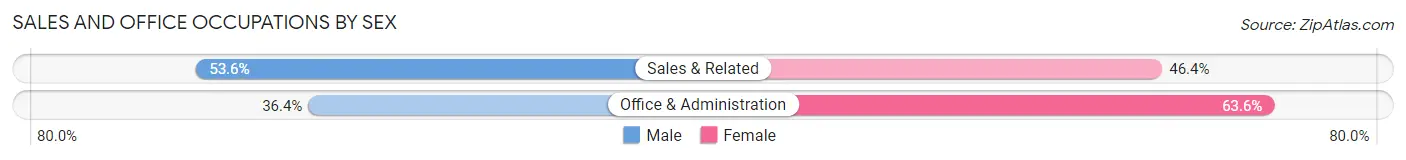
| Occupation | Male | Female |
| Sales & Related | 472 (53.6%) | 409 (46.4%) |
| Office & Administration | 467 (36.4%) | 817 (63.6%) |
| Total (Category) | 939 (43.4%) | 1,226 (56.6%) |
| Total (Overall) | 6,064 (57.3%) | 4,512 (42.7%) |
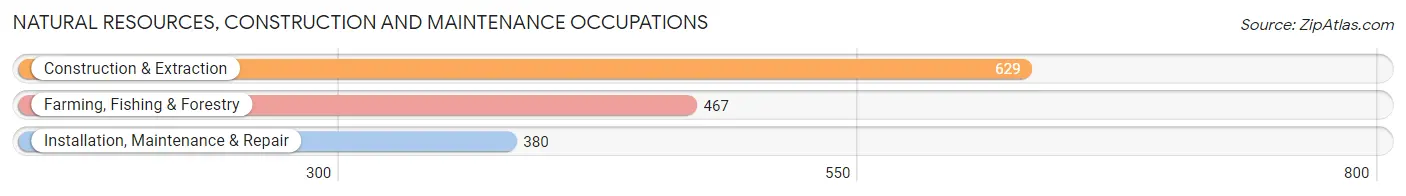
Natural Resources, Construction and Maintenance Occupations
The most common Natural Resources, Construction and Maintenance occupations in Riverbank are Construction & Extraction (629 | 5.9%), Farming, Fishing & Forestry (467 | 4.4%), and Installation, Maintenance & Repair (380 | 3.6%).
Natural Resources, Construction and Maintenance Occupations by Sex
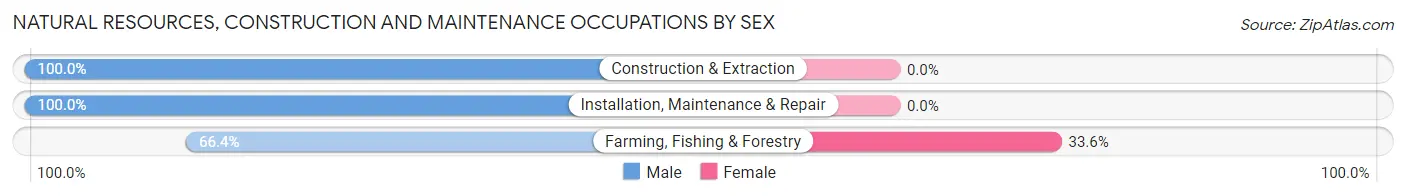
| Occupation | Male | Female |
| Farming, Fishing & Forestry | 310 (66.4%) | 157 (33.6%) |
| Construction & Extraction | 629 (100.0%) | 0 (0.0%) |
| Installation, Maintenance & Repair | 380 (100.0%) | 0 (0.0%) |
| Total (Category) | 1,319 (89.4%) | 157 (10.6%) |
| Total (Overall) | 6,064 (57.3%) | 4,512 (42.7%) |
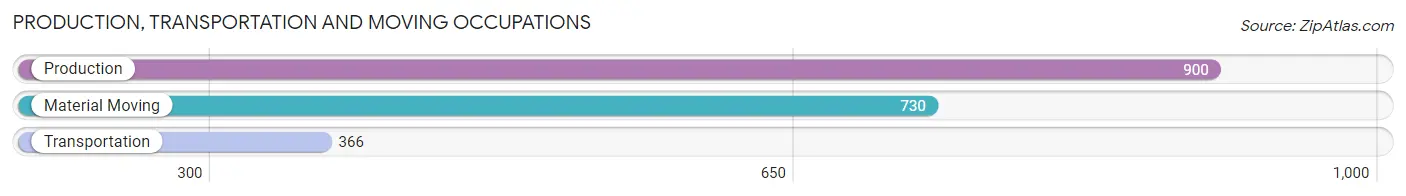
Production, Transportation and Moving Occupations
The most common Production, Transportation and Moving occupations in Riverbank are Production (900 | 8.5%), Material Moving (730 | 6.9%), and Transportation (366 | 3.5%).
Production, Transportation and Moving Occupations by Sex
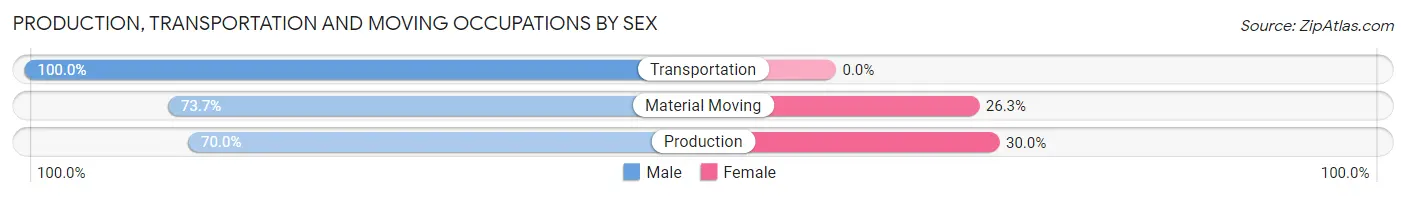
| Occupation | Male | Female |
| Production | 630 (70.0%) | 270 (30.0%) |
| Transportation | 366 (100.0%) | 0 (0.0%) |
| Material Moving | 538 (73.7%) | 192 (26.3%) |
| Total (Category) | 1,534 (76.8%) | 462 (23.2%) |
| Total (Overall) | 6,064 (57.3%) | 4,512 (42.7%) |
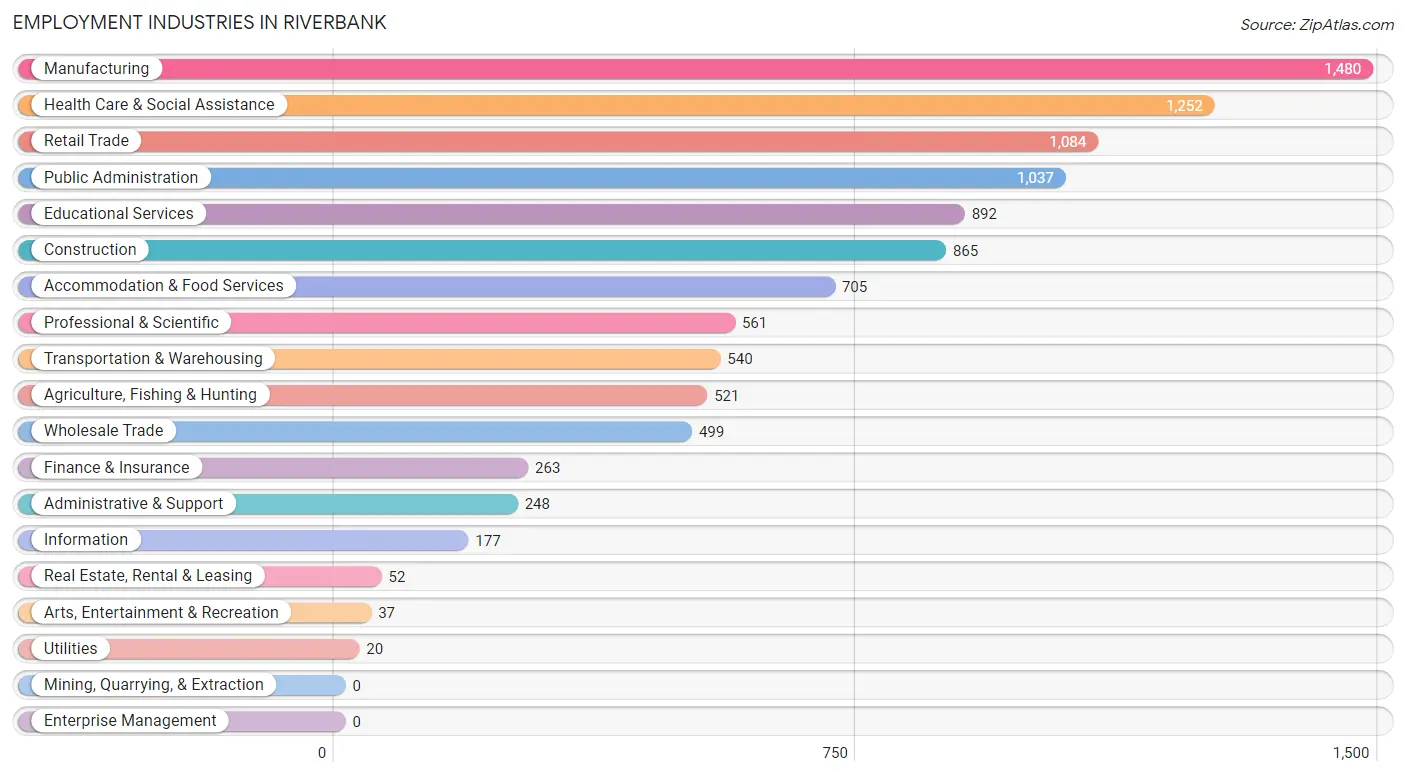
Employment Industries by Sex in Riverbank
Employment Industries in Riverbank
The major employment industries in Riverbank include Manufacturing (1,480 | 14.0%), Health Care & Social Assistance (1,252 | 11.8%), Retail Trade (1,084 | 10.2%), Public Administration (1,037 | 9.8%), and Educational Services (892 | 8.4%).
Employment Industries by Sex in Riverbank
The Riverbank industries that see more men than women are Utilities (100.0%), Transportation & Warehousing (92.2%), and Construction (92.0%), whereas the industries that tend to have a higher number of women are Real Estate, Rental & Leasing (82.7%), Health Care & Social Assistance (82.0%), and Educational Services (76.5%).
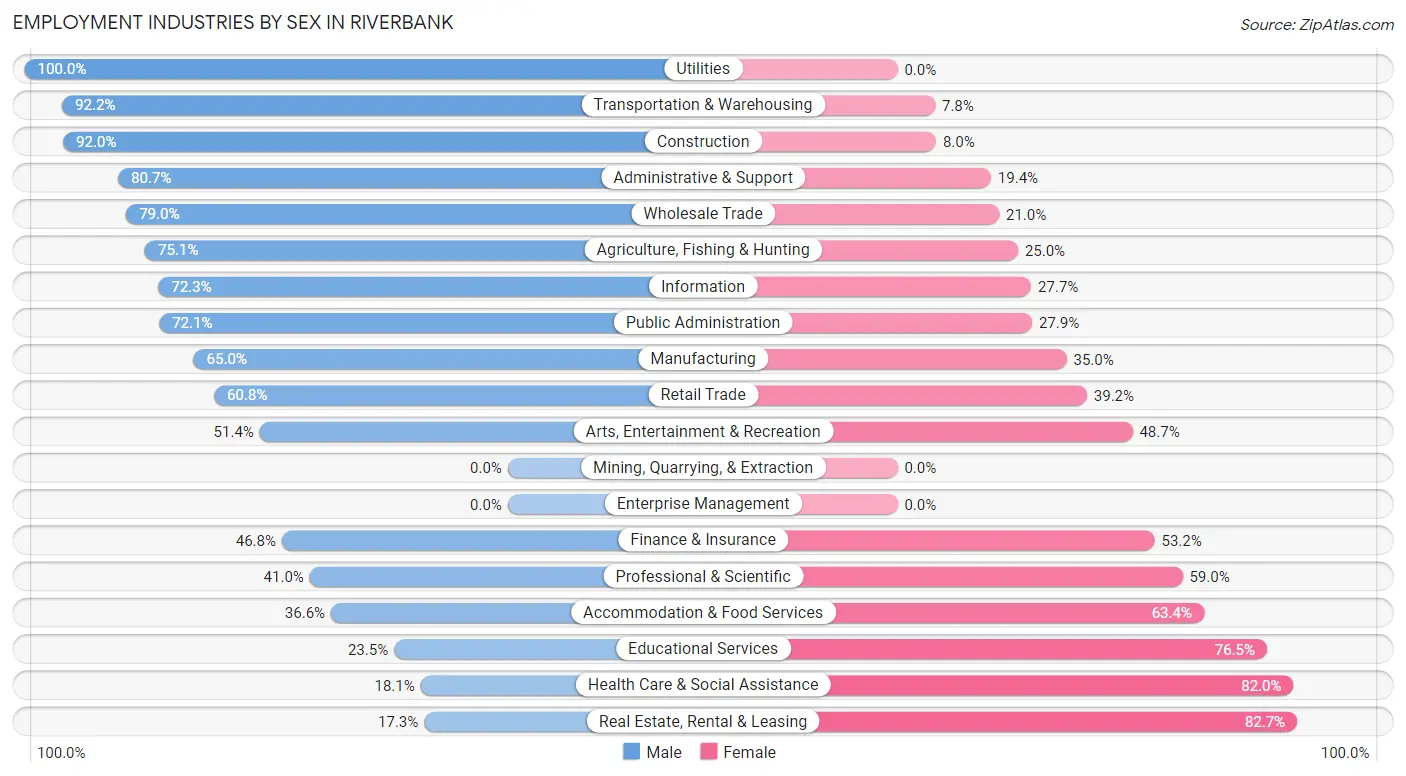
| Industry | Male | Female |
| Agriculture, Fishing & Hunting | 391 (75.0%) | 130 (24.9%) |
| Mining, Quarrying, & Extraction | 0 (0.0%) | 0 (0.0%) |
| Construction | 796 (92.0%) | 69 (8.0%) |
| Manufacturing | 962 (65.0%) | 518 (35.0%) |
| Wholesale Trade | 394 (79.0%) | 105 (21.0%) |
| Retail Trade | 659 (60.8%) | 425 (39.2%) |
| Transportation & Warehousing | 498 (92.2%) | 42 (7.8%) |
| Utilities | 20 (100.0%) | 0 (0.0%) |
| Information | 128 (72.3%) | 49 (27.7%) |
| Finance & Insurance | 123 (46.8%) | 140 (53.2%) |
| Real Estate, Rental & Leasing | 9 (17.3%) | 43 (82.7%) |
| Professional & Scientific | 230 (41.0%) | 331 (59.0%) |
| Enterprise Management | 0 (0.0%) | 0 (0.0%) |
| Administrative & Support | 200 (80.6%) | 48 (19.4%) |
| Educational Services | 210 (23.5%) | 682 (76.5%) |
| Health Care & Social Assistance | 226 (18.0%) | 1,026 (82.0%) |
| Arts, Entertainment & Recreation | 19 (51.3%) | 18 (48.6%) |
| Accommodation & Food Services | 258 (36.6%) | 447 (63.4%) |
| Public Administration | 748 (72.1%) | 289 (27.9%) |
| Total | 6,064 (57.3%) | 4,512 (42.7%) |
Education in Riverbank
School Enrollment in Riverbank
The most common levels of schooling among the 7,261 students in Riverbank are middle school (2,178 | 30.0%), high school (1,788 | 24.6%), and college / undergraduate (1,391 | 19.2%).
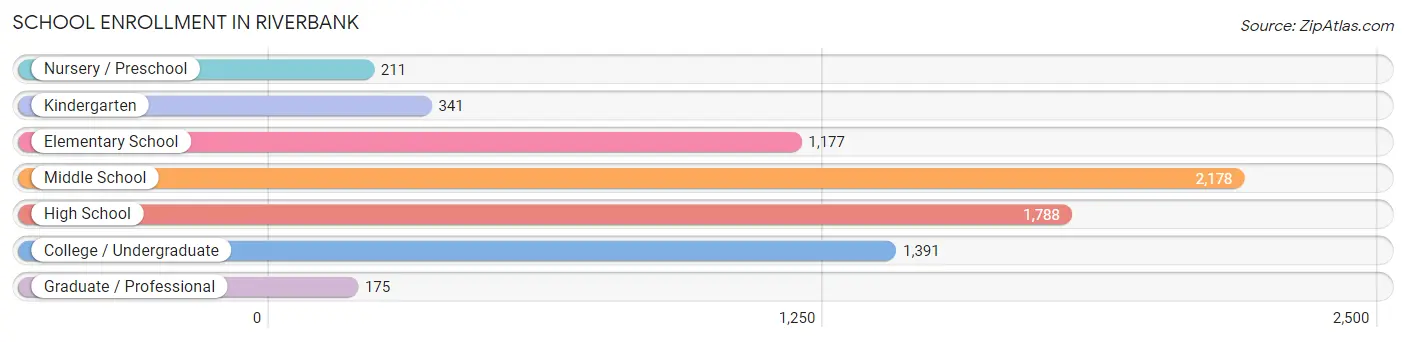
| School Level | # Students | % Students |
| Nursery / Preschool | 211 | 2.9% |
| Kindergarten | 341 | 4.7% |
| Elementary School | 1,177 | 16.2% |
| Middle School | 2,178 | 30.0% |
| High School | 1,788 | 24.6% |
| College / Undergraduate | 1,391 | 19.2% |
| Graduate / Professional | 175 | 2.4% |
| Total | 7,261 | 100.0% |
School Enrollment by Age by Funding Source in Riverbank
Out of a total of 7,261 students who are enrolled in schools in Riverbank, 552 (7.6%) attend a private institution, while the remaining 6,709 (92.4%) are enrolled in public schools. The age group of 25 to 34 year olds has the highest likelihood of being enrolled in private schools, with 57 (18.3% in the age bracket) enrolled. Conversely, the age group of 15 to 17 year olds has the lowest likelihood of being enrolled in a private school, with 1,212 (96.8% in the age bracket) attending a public institution.
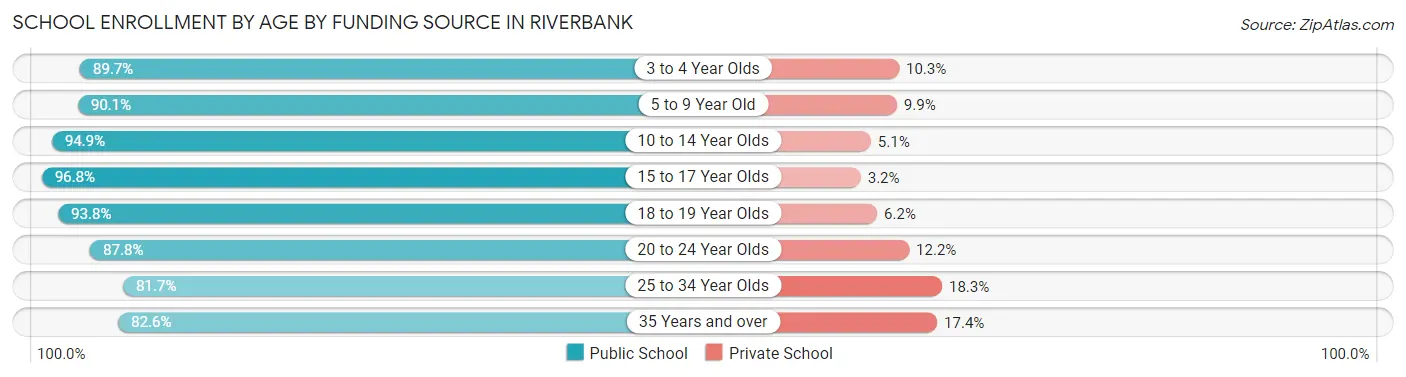
| Age Bracket | Public School | Private School |
| 3 to 4 Year Olds | 174 (89.7%) | 20 (10.3%) |
| 5 to 9 Year Old | 1,326 (90.1%) | 146 (9.9%) |
| 10 to 14 Year Olds | 2,492 (94.9%) | 133 (5.1%) |
| 15 to 17 Year Olds | 1,212 (96.8%) | 40 (3.2%) |
| 18 to 19 Year Olds | 451 (93.8%) | 30 (6.2%) |
| 20 to 24 Year Olds | 576 (87.8%) | 80 (12.2%) |
| 25 to 34 Year Olds | 254 (81.7%) | 57 (18.3%) |
| 35 Years and over | 223 (82.6%) | 47 (17.4%) |
| Total | 6,709 (92.4%) | 552 (7.6%) |
Educational Attainment by Field of Study in Riverbank
Arts & humanities (485 | 16.7%), business (332 | 11.5%), education (331 | 11.4%), liberal arts & history (266 | 9.2%), and social sciences (227 | 7.8%) are the most common fields of study among 2,898 individuals in Riverbank who have obtained a bachelor's degree or higher.
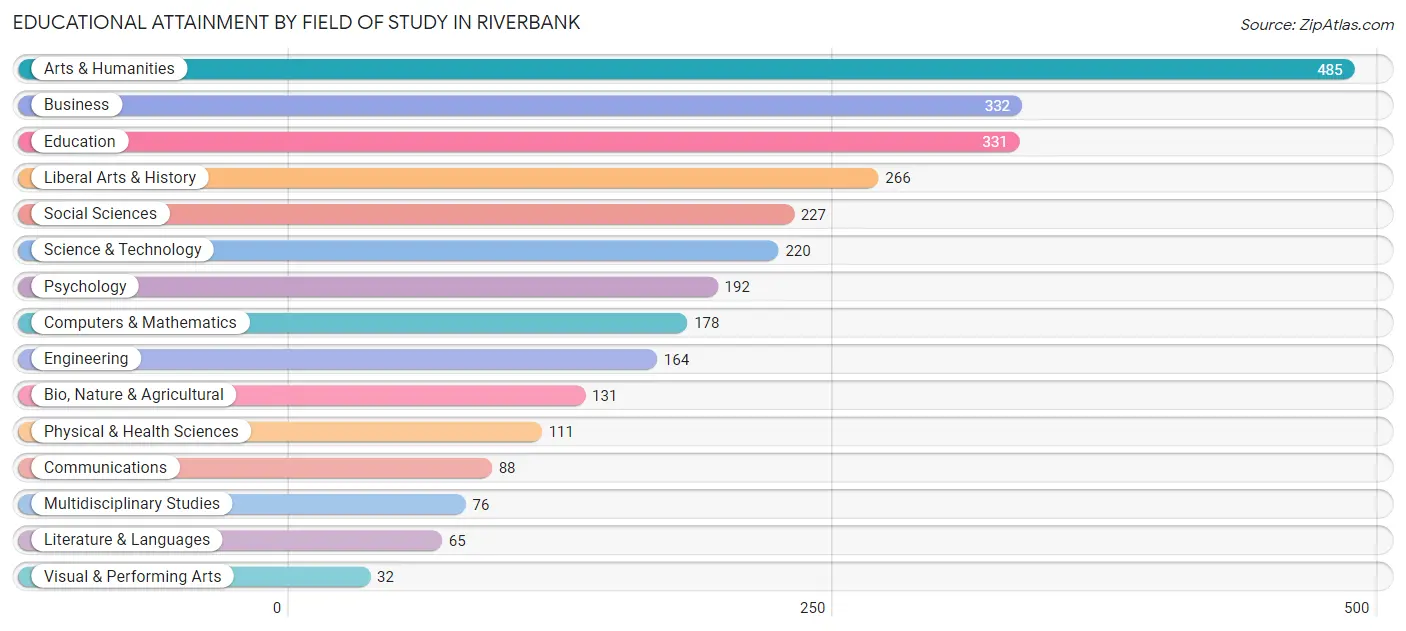
| Field of Study | # Graduates | % Graduates |
| Computers & Mathematics | 178 | 6.1% |
| Bio, Nature & Agricultural | 131 | 4.5% |
| Physical & Health Sciences | 111 | 3.8% |
| Psychology | 192 | 6.6% |
| Social Sciences | 227 | 7.8% |
| Engineering | 164 | 5.7% |
| Multidisciplinary Studies | 76 | 2.6% |
| Science & Technology | 220 | 7.6% |
| Business | 332 | 11.5% |
| Education | 331 | 11.4% |
| Literature & Languages | 65 | 2.2% |
| Liberal Arts & History | 266 | 9.2% |
| Visual & Performing Arts | 32 | 1.1% |
| Communications | 88 | 3.0% |
| Arts & Humanities | 485 | 16.7% |
| Total | 2,898 | 100.0% |
Transportation & Commute in Riverbank
Vehicle Availability by Sex in Riverbank
The most prevalent vehicle ownership categories in Riverbank are males with 2 vehicles (2,307, accounting for 38.4%) and females with 2 vehicles (1,738, making up 52.1%).
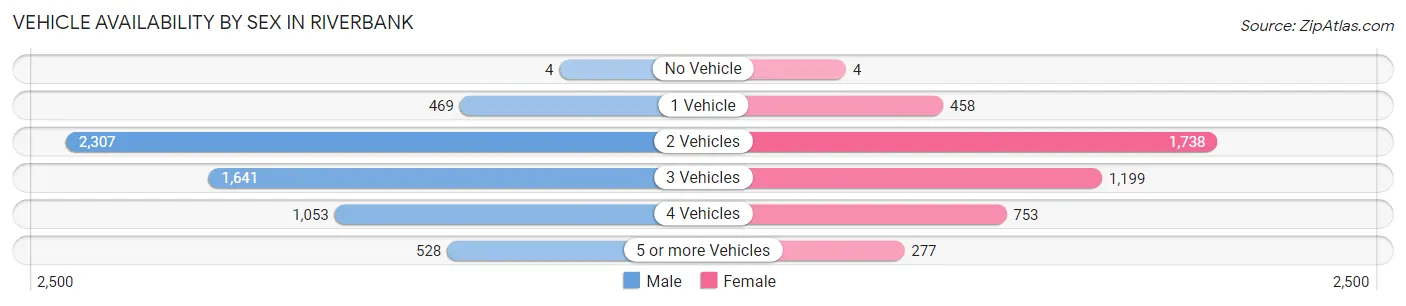
| Vehicles Available | Male | Female |
| No Vehicle | 4 (0.1%) | 4 (0.1%) |
| 1 Vehicle | 469 (7.8%) | 458 (10.3%) |
| 2 Vehicles | 2,307 (38.4%) | 1,738 (39.2%) |
| 3 Vehicles | 1,641 (27.3%) | 1,199 (27.1%) |
| 4 Vehicles | 1,053 (17.5%) | 753 (17.0%) |
| 5 or more Vehicles | 528 (8.8%) | 277 (6.2%) |
| Total | 6,002 (100.0%) | 4,429 (100.0%) |
Commute Time in Riverbank
The most frequently occuring commute durations in Riverbank are 15 to 19 minutes (1,893 commuters, 19.3%), 30 to 34 minutes (1,640 commuters, 16.7%), and 20 to 24 minutes (1,556 commuters, 15.9%).
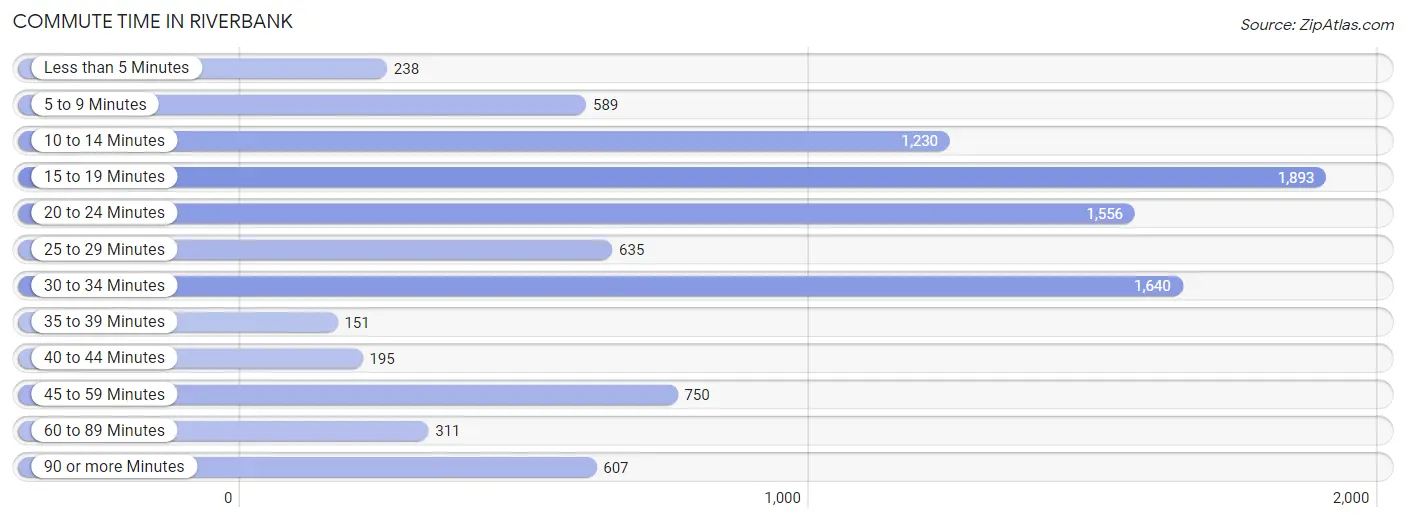
| Commute Time | # Commuters | % Commuters |
| Less than 5 Minutes | 238 | 2.4% |
| 5 to 9 Minutes | 589 | 6.0% |
| 10 to 14 Minutes | 1,230 | 12.6% |
| 15 to 19 Minutes | 1,893 | 19.3% |
| 20 to 24 Minutes | 1,556 | 15.9% |
| 25 to 29 Minutes | 635 | 6.5% |
| 30 to 34 Minutes | 1,640 | 16.7% |
| 35 to 39 Minutes | 151 | 1.5% |
| 40 to 44 Minutes | 195 | 2.0% |
| 45 to 59 Minutes | 750 | 7.7% |
| 60 to 89 Minutes | 311 | 3.2% |
| 90 or more Minutes | 607 | 6.2% |
Commute Time by Sex in Riverbank
The most common commute times in Riverbank are 30 to 34 minutes (1,120 commuters, 19.5%) for males and 15 to 19 minutes (871 commuters, 21.5%) for females.
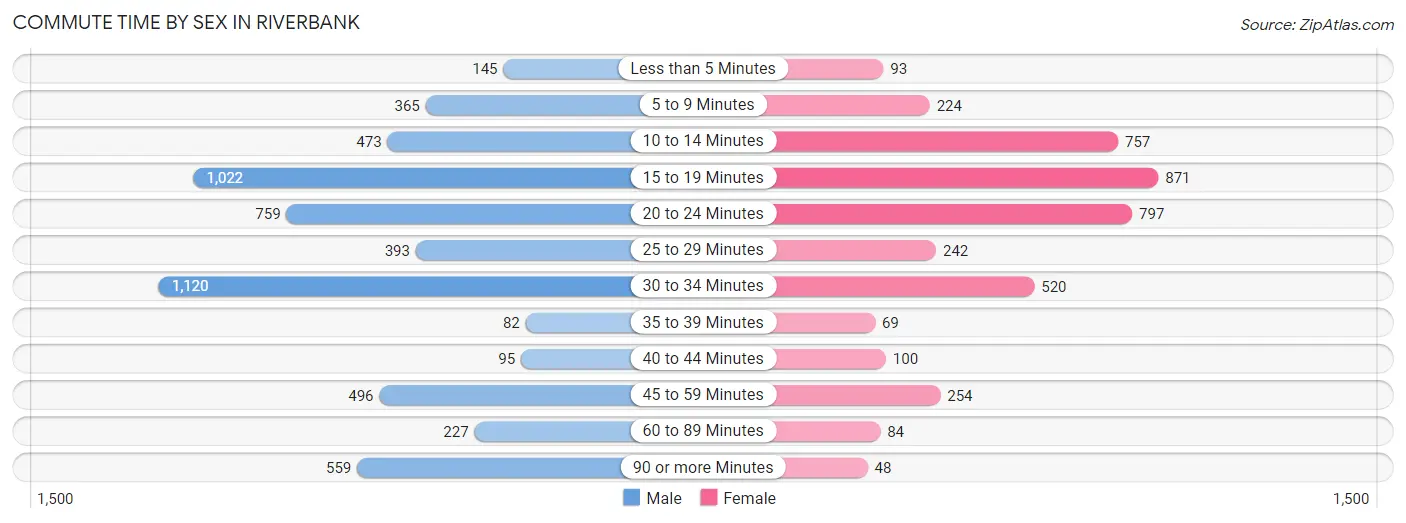
| Commute Time | Male | Female |
| Less than 5 Minutes | 145 (2.5%) | 93 (2.3%) |
| 5 to 9 Minutes | 365 (6.4%) | 224 (5.5%) |
| 10 to 14 Minutes | 473 (8.3%) | 757 (18.6%) |
| 15 to 19 Minutes | 1,022 (17.8%) | 871 (21.5%) |
| 20 to 24 Minutes | 759 (13.2%) | 797 (19.6%) |
| 25 to 29 Minutes | 393 (6.9%) | 242 (6.0%) |
| 30 to 34 Minutes | 1,120 (19.5%) | 520 (12.8%) |
| 35 to 39 Minutes | 82 (1.4%) | 69 (1.7%) |
| 40 to 44 Minutes | 95 (1.7%) | 100 (2.5%) |
| 45 to 59 Minutes | 496 (8.6%) | 254 (6.3%) |
| 60 to 89 Minutes | 227 (4.0%) | 84 (2.1%) |
| 90 or more Minutes | 559 (9.8%) | 48 (1.2%) |
Time of Departure to Work by Sex in Riverbank
The most frequent times of departure to work in Riverbank are 12:00 AM to 4:59 AM (795, 13.9%) for males and 7:00 AM to 7:29 AM (867, 21.4%) for females.
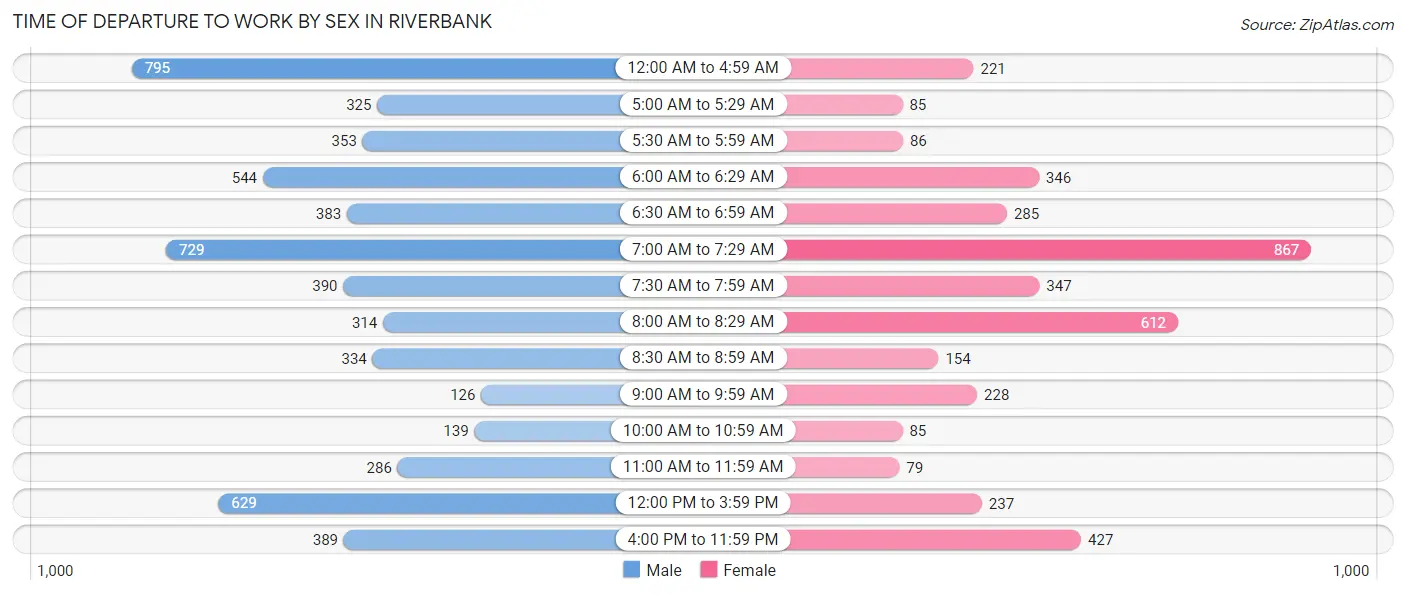
| Time of Departure | Male | Female |
| 12:00 AM to 4:59 AM | 795 (13.9%) | 221 (5.4%) |
| 5:00 AM to 5:29 AM | 325 (5.7%) | 85 (2.1%) |
| 5:30 AM to 5:59 AM | 353 (6.1%) | 86 (2.1%) |
| 6:00 AM to 6:29 AM | 544 (9.5%) | 346 (8.5%) |
| 6:30 AM to 6:59 AM | 383 (6.7%) | 285 (7.0%) |
| 7:00 AM to 7:29 AM | 729 (12.7%) | 867 (21.4%) |
| 7:30 AM to 7:59 AM | 390 (6.8%) | 347 (8.6%) |
| 8:00 AM to 8:29 AM | 314 (5.5%) | 612 (15.1%) |
| 8:30 AM to 8:59 AM | 334 (5.8%) | 154 (3.8%) |
| 9:00 AM to 9:59 AM | 126 (2.2%) | 228 (5.6%) |
| 10:00 AM to 10:59 AM | 139 (2.4%) | 85 (2.1%) |
| 11:00 AM to 11:59 AM | 286 (5.0%) | 79 (1.9%) |
| 12:00 PM to 3:59 PM | 629 (11.0%) | 237 (5.8%) |
| 4:00 PM to 11:59 PM | 389 (6.8%) | 427 (10.5%) |
| Total | 5,736 (100.0%) | 4,059 (100.0%) |
Housing Occupancy in Riverbank
Occupancy by Ownership in Riverbank
Of the total 7,314 dwellings in Riverbank, owner-occupied units account for 5,072 (69.4%), while renter-occupied units make up 2,242 (30.6%).
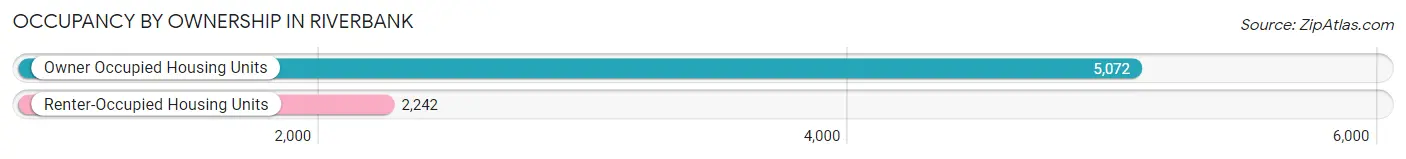
| Occupancy | # Housing Units | % Housing Units |
| Owner Occupied Housing Units | 5,072 | 69.4% |
| Renter-Occupied Housing Units | 2,242 | 30.6% |
| Total Occupied Housing Units | 7,314 | 100.0% |
Occupancy by Household Size in Riverbank
| Household Size | # Housing Units | % Housing Units |
| 1-Person Household | 1,267 | 17.3% |
| 2-Person Household | 1,532 | 20.9% |
| 3-Person Household | 1,599 | 21.9% |
| 4+ Person Household | 2,916 | 39.9% |
| Total Housing Units | 7,314 | 100.0% |
Occupancy by Ownership by Household Size in Riverbank
| Household Size | Owner-occupied | Renter-occupied |
| 1-Person Household | 782 (61.7%) | 485 (38.3%) |
| 2-Person Household | 1,215 (79.3%) | 317 (20.7%) |
| 3-Person Household | 938 (58.7%) | 661 (41.3%) |
| 4+ Person Household | 2,137 (73.3%) | 779 (26.7%) |
| Total Housing Units | 5,072 (69.4%) | 2,242 (30.6%) |
Occupancy by Educational Attainment in Riverbank
| Household Size | Owner-occupied | Renter-occupied |
| Less than High School | 511 (51.1%) | 488 (48.8%) |
| High School Diploma | 1,448 (64.2%) | 807 (35.8%) |
| College/Associate Degree | 2,070 (74.7%) | 700 (25.3%) |
| Bachelor's Degree or higher | 1,043 (80.8%) | 247 (19.2%) |
Occupancy by Age of Householder in Riverbank
| Age Bracket | # Households | % Households |
| Under 35 Years | 1,250 | 17.1% |
| 35 to 44 Years | 1,784 | 24.4% |
| 45 to 54 Years | 1,678 | 22.9% |
| 55 to 64 Years | 1,102 | 15.1% |
| 65 to 74 Years | 831 | 11.4% |
| 75 to 84 Years | 508 | 7.0% |
| 85 Years and Over | 161 | 2.2% |
| Total | 7,314 | 100.0% |
Housing Finances in Riverbank
Median Income by Occupancy in Riverbank
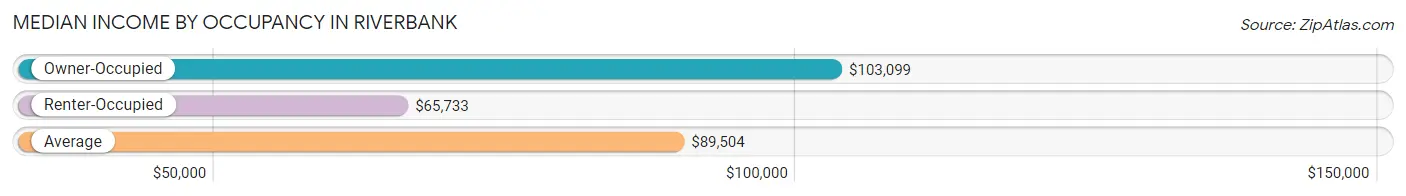
| Occupancy Type | # Households | Median Income |
| Owner-Occupied | 5,072 (69.4%) | $103,099 |
| Renter-Occupied | 2,242 (30.6%) | $65,733 |
| Average | 7,314 (100.0%) | $89,504 |
Occupancy by Householder Income Bracket in Riverbank
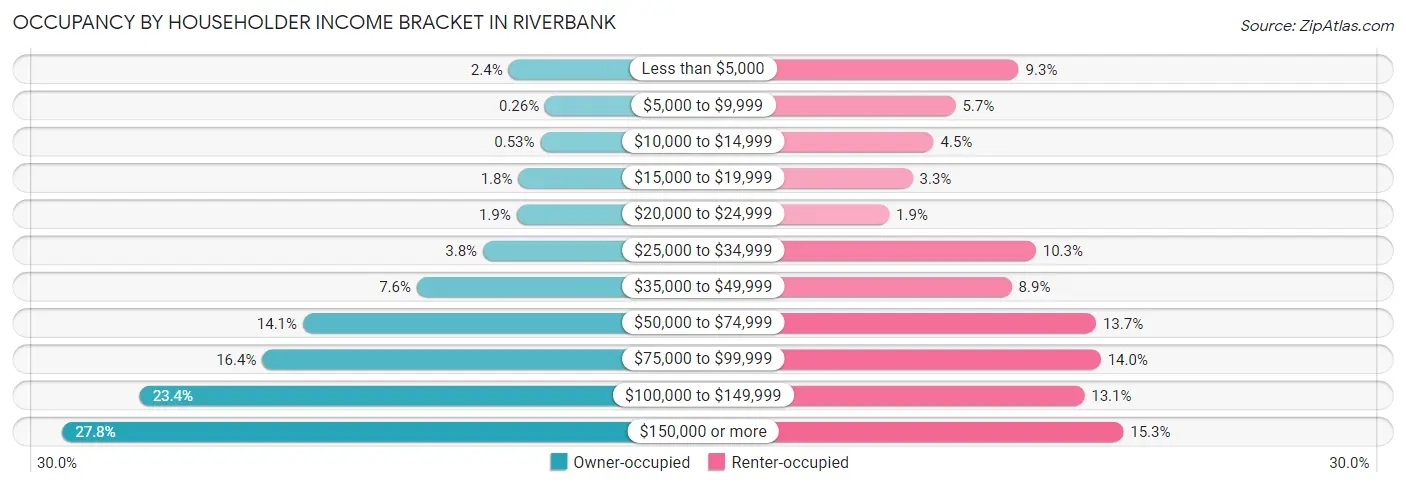
| Income Bracket | Owner-occupied | Renter-occupied |
| Less than $5,000 | 119 (2.4%) | 209 (9.3%) |
| $5,000 to $9,999 | 13 (0.3%) | 128 (5.7%) |
| $10,000 to $14,999 | 27 (0.5%) | 100 (4.5%) |
| $15,000 to $19,999 | 91 (1.8%) | 73 (3.3%) |
| $20,000 to $24,999 | 96 (1.9%) | 43 (1.9%) |
| $25,000 to $34,999 | 193 (3.8%) | 231 (10.3%) |
| $35,000 to $49,999 | 385 (7.6%) | 200 (8.9%) |
| $50,000 to $74,999 | 715 (14.1%) | 308 (13.7%) |
| $75,000 to $99,999 | 833 (16.4%) | 314 (14.0%) |
| $100,000 to $149,999 | 1,188 (23.4%) | 293 (13.1%) |
| $150,000 or more | 1,412 (27.8%) | 343 (15.3%) |
| Total | 5,072 (100.0%) | 2,242 (100.0%) |
Monthly Housing Cost Tiers in Riverbank
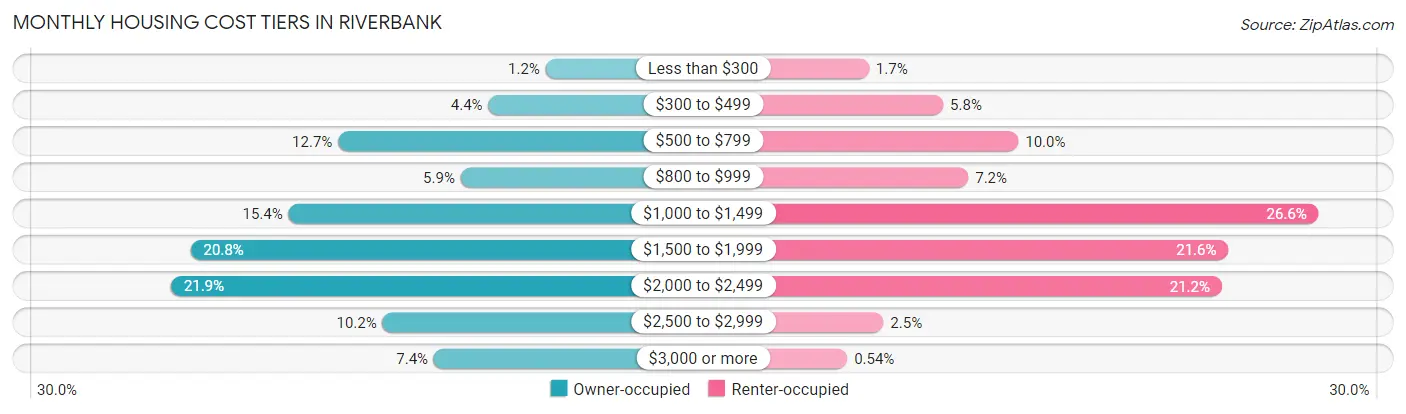
| Monthly Cost | Owner-occupied | Renter-occupied |
| Less than $300 | 62 (1.2%) | 39 (1.7%) |
| $300 to $499 | 222 (4.4%) | 131 (5.8%) |
| $500 to $799 | 643 (12.7%) | 224 (10.0%) |
| $800 to $999 | 300 (5.9%) | 162 (7.2%) |
| $1,000 to $1,499 | 782 (15.4%) | 596 (26.6%) |
| $1,500 to $1,999 | 1,057 (20.8%) | 484 (21.6%) |
| $2,000 to $2,499 | 1,112 (21.9%) | 476 (21.2%) |
| $2,500 to $2,999 | 519 (10.2%) | 57 (2.5%) |
| $3,000 or more | 375 (7.4%) | 12 (0.5%) |
| Total | 5,072 (100.0%) | 2,242 (100.0%) |
Physical Housing Characteristics in Riverbank
Housing Structures in Riverbank
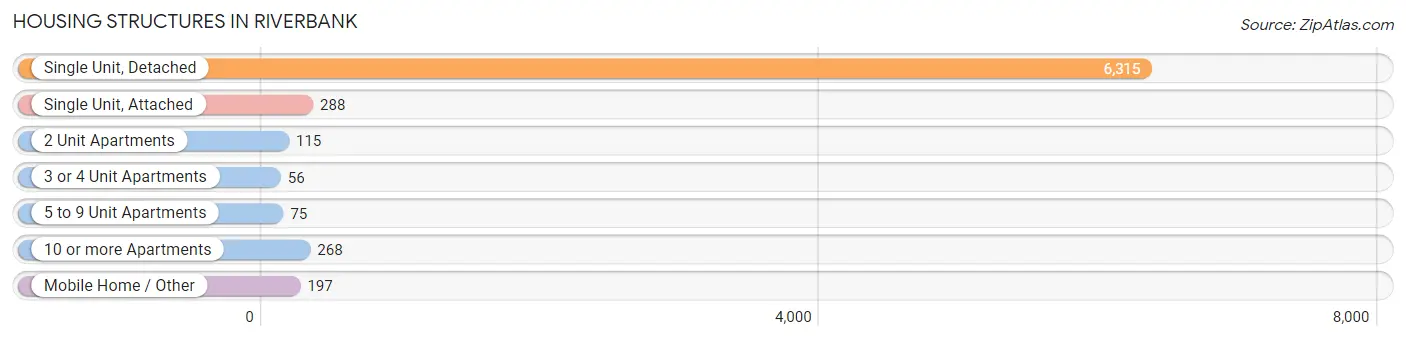
| Structure Type | # Housing Units | % Housing Units |
| Single Unit, Detached | 6,315 | 86.3% |
| Single Unit, Attached | 288 | 3.9% |
| 2 Unit Apartments | 115 | 1.6% |
| 3 or 4 Unit Apartments | 56 | 0.8% |
| 5 to 9 Unit Apartments | 75 | 1.0% |
| 10 or more Apartments | 268 | 3.7% |
| Mobile Home / Other | 197 | 2.7% |
| Total | 7,314 | 100.0% |
Housing Structures by Occupancy in Riverbank
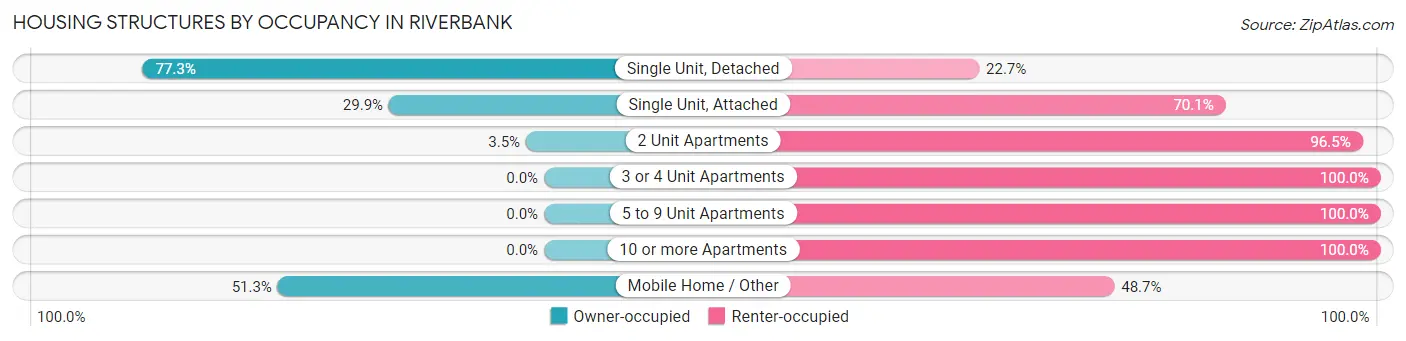
| Structure Type | Owner-occupied | Renter-occupied |
| Single Unit, Detached | 4,881 (77.3%) | 1,434 (22.7%) |
| Single Unit, Attached | 86 (29.9%) | 202 (70.1%) |
| 2 Unit Apartments | 4 (3.5%) | 111 (96.5%) |
| 3 or 4 Unit Apartments | 0 (0.0%) | 56 (100.0%) |
| 5 to 9 Unit Apartments | 0 (0.0%) | 75 (100.0%) |
| 10 or more Apartments | 0 (0.0%) | 268 (100.0%) |
| Mobile Home / Other | 101 (51.3%) | 96 (48.7%) |
| Total | 5,072 (69.4%) | 2,242 (30.6%) |
Housing Structures by Number of Rooms in Riverbank
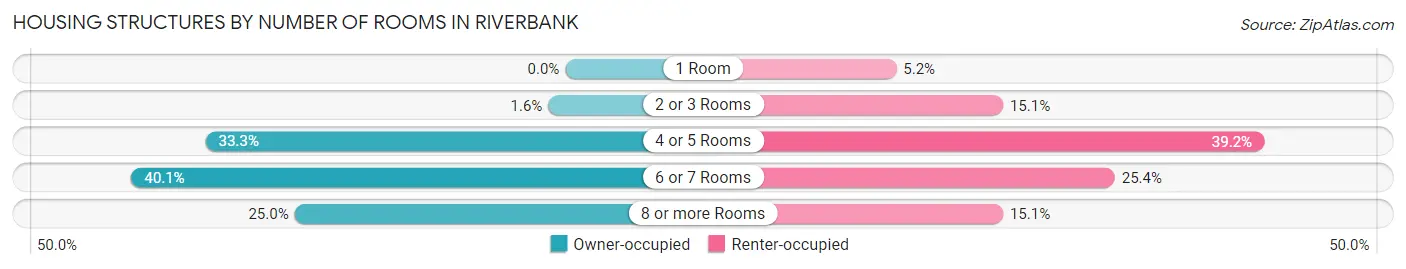
| Number of Rooms | Owner-occupied | Renter-occupied |
| 1 Room | 0 (0.0%) | 117 (5.2%) |
| 2 or 3 Rooms | 80 (1.6%) | 338 (15.1%) |
| 4 or 5 Rooms | 1,687 (33.3%) | 879 (39.2%) |
| 6 or 7 Rooms | 2,035 (40.1%) | 570 (25.4%) |
| 8 or more Rooms | 1,270 (25.0%) | 338 (15.1%) |
| Total | 5,072 (100.0%) | 2,242 (100.0%) |
Housing Structure by Heating Type in Riverbank
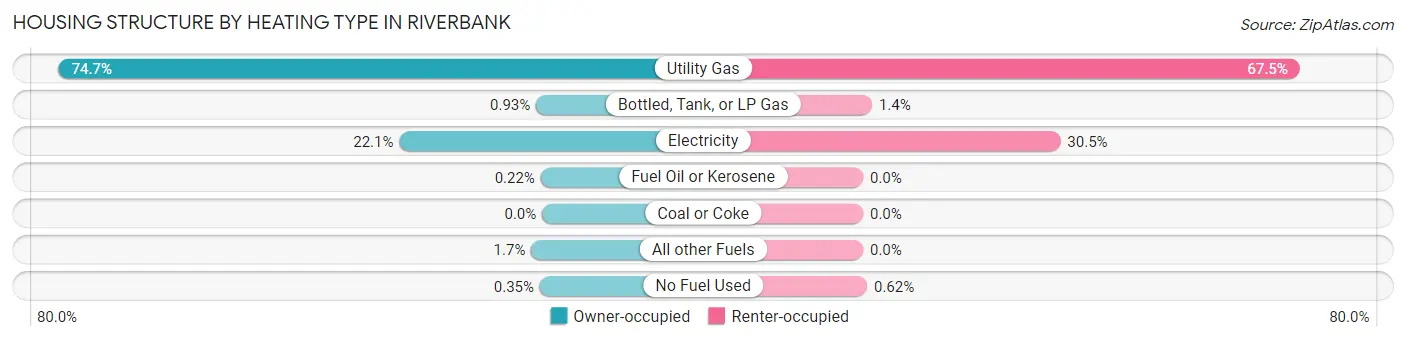
| Heating Type | Owner-occupied | Renter-occupied |
| Utility Gas | 3,791 (74.7%) | 1,513 (67.5%) |
| Bottled, Tank, or LP Gas | 47 (0.9%) | 31 (1.4%) |
| Electricity | 1,120 (22.1%) | 684 (30.5%) |
| Fuel Oil or Kerosene | 11 (0.2%) | 0 (0.0%) |
| Coal or Coke | 0 (0.0%) | 0 (0.0%) |
| All other Fuels | 85 (1.7%) | 0 (0.0%) |
| No Fuel Used | 18 (0.4%) | 14 (0.6%) |
| Total | 5,072 (100.0%) | 2,242 (100.0%) |
Household Vehicle Usage in Riverbank
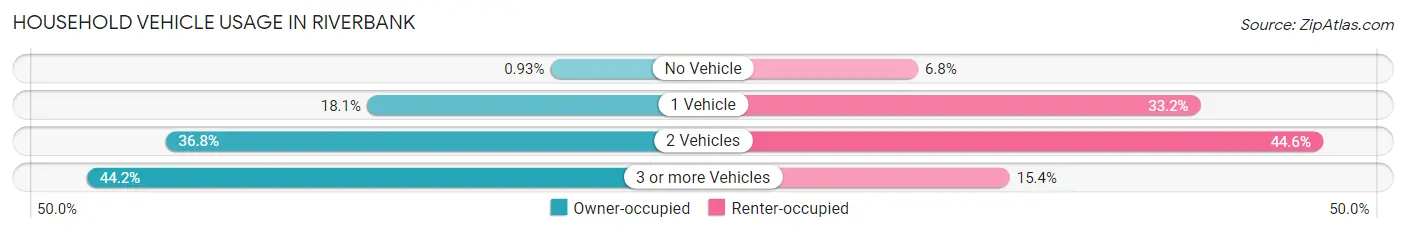
| Vehicles per Household | Owner-occupied | Renter-occupied |
| No Vehicle | 47 (0.9%) | 153 (6.8%) |
| 1 Vehicle | 916 (18.1%) | 744 (33.2%) |
| 2 Vehicles | 1,868 (36.8%) | 1,000 (44.6%) |
| 3 or more Vehicles | 2,241 (44.2%) | 345 (15.4%) |
| Total | 5,072 (100.0%) | 2,242 (100.0%) |
Real Estate & Mortgages in Riverbank
Real Estate and Mortgage Overview in Riverbank
| Characteristic | Without Mortgage | With Mortgage |
| Housing Units | 1,312 | 3,760 |
| Median Property Value | $388,600 | $419,300 |
| Median Household Income | $59,931 | $1,099 |
| Monthly Housing Costs | $670 | $367 |
| Real Estate Taxes | $3,404 | $158 |
Property Value by Mortgage Status in Riverbank
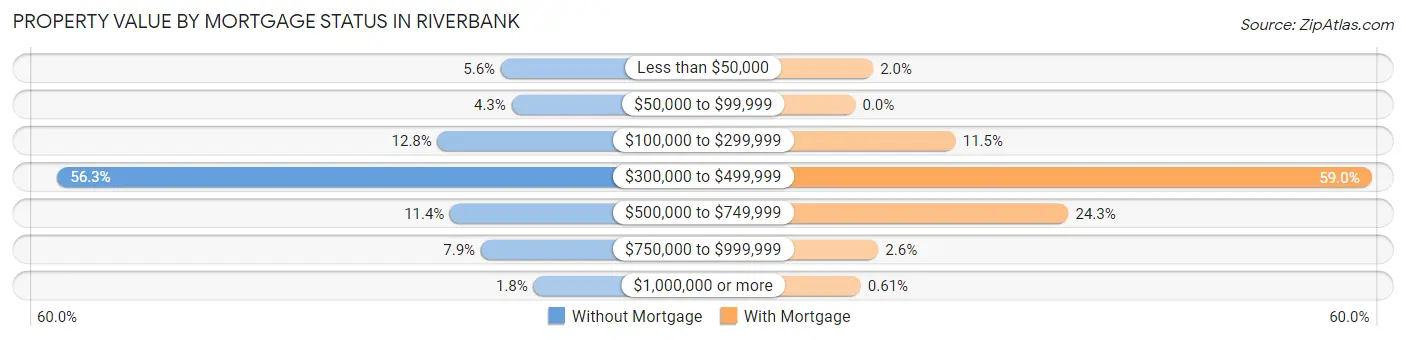
| Property Value | Without Mortgage | With Mortgage |
| Less than $50,000 | 73 (5.6%) | 76 (2.0%) |
| $50,000 to $99,999 | 57 (4.3%) | 0 (0.0%) |
| $100,000 to $299,999 | 168 (12.8%) | 431 (11.5%) |
| $300,000 to $499,999 | 738 (56.2%) | 2,217 (59.0%) |
| $500,000 to $749,999 | 149 (11.4%) | 915 (24.3%) |
| $750,000 to $999,999 | 103 (7.9%) | 98 (2.6%) |
| $1,000,000 or more | 24 (1.8%) | 23 (0.6%) |
| Total | 1,312 (100.0%) | 3,760 (100.0%) |
Household Income by Mortgage Status in Riverbank
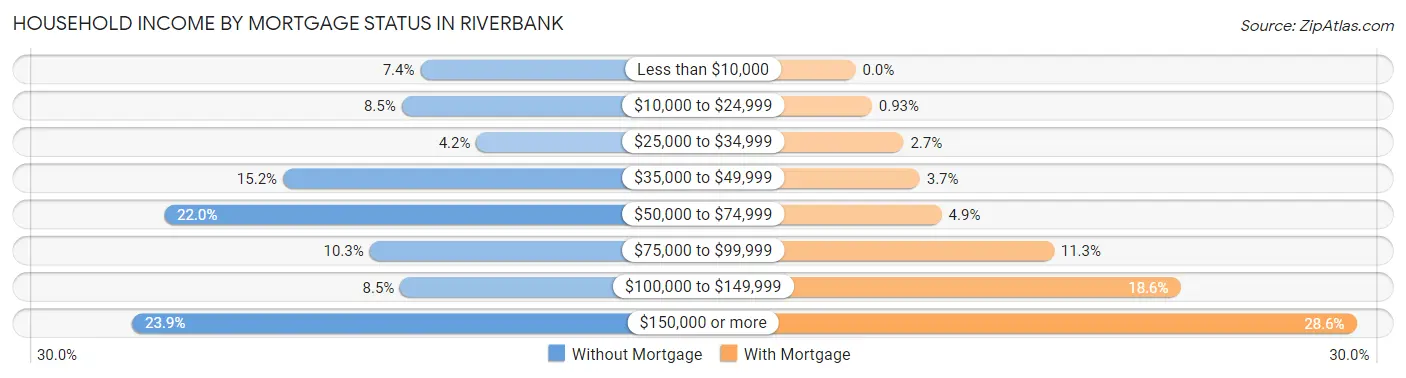
| Household Income | Without Mortgage | With Mortgage |
| Less than $10,000 | 97 (7.4%) | 0 (0.0%) |
| $10,000 to $24,999 | 111 (8.5%) | 35 (0.9%) |
| $25,000 to $34,999 | 55 (4.2%) | 103 (2.7%) |
| $35,000 to $49,999 | 200 (15.2%) | 138 (3.7%) |
| $50,000 to $74,999 | 289 (22.0%) | 185 (4.9%) |
| $75,000 to $99,999 | 135 (10.3%) | 426 (11.3%) |
| $100,000 to $149,999 | 112 (8.5%) | 698 (18.6%) |
| $150,000 or more | 313 (23.9%) | 1,076 (28.6%) |
| Total | 1,312 (100.0%) | 3,760 (100.0%) |
Property Value to Household Income Ratio in Riverbank
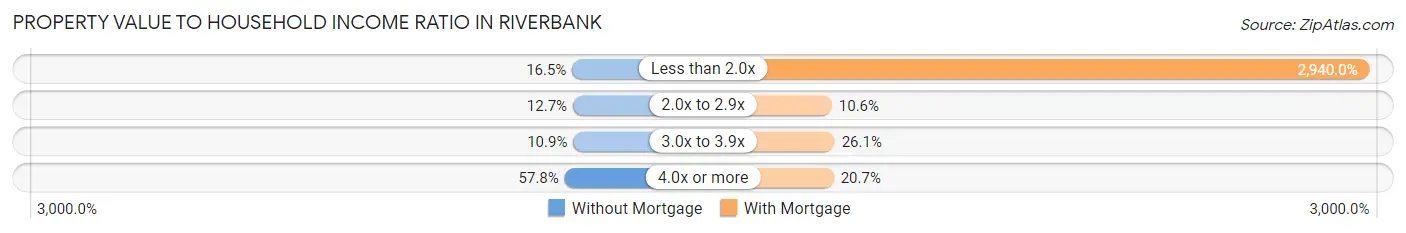
| Value-to-Income Ratio | Without Mortgage | With Mortgage |
| Less than 2.0x | 216 (16.5%) | 110,542 (2,939.9%) |
| 2.0x to 2.9x | 166 (12.7%) | 399 (10.6%) |
| 3.0x to 3.9x | 143 (10.9%) | 981 (26.1%) |
| 4.0x or more | 758 (57.8%) | 778 (20.7%) |
| Total | 1,312 (100.0%) | 3,760 (100.0%) |
Real Estate Taxes by Mortgage Status in Riverbank
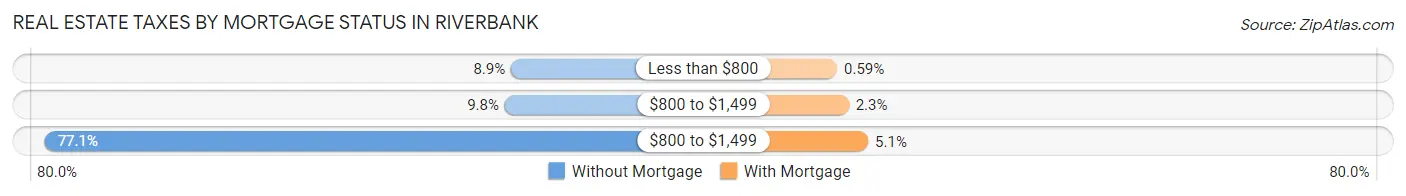
| Property Taxes | Without Mortgage | With Mortgage |
| Less than $800 | 117 (8.9%) | 22 (0.6%) |
| $800 to $1,499 | 129 (9.8%) | 86 (2.3%) |
| $800 to $1,499 | 1,011 (77.1%) | 193 (5.1%) |
| Total | 1,312 (100.0%) | 3,760 (100.0%) |
Health & Disability in Riverbank
Health Insurance Coverage by Age in Riverbank
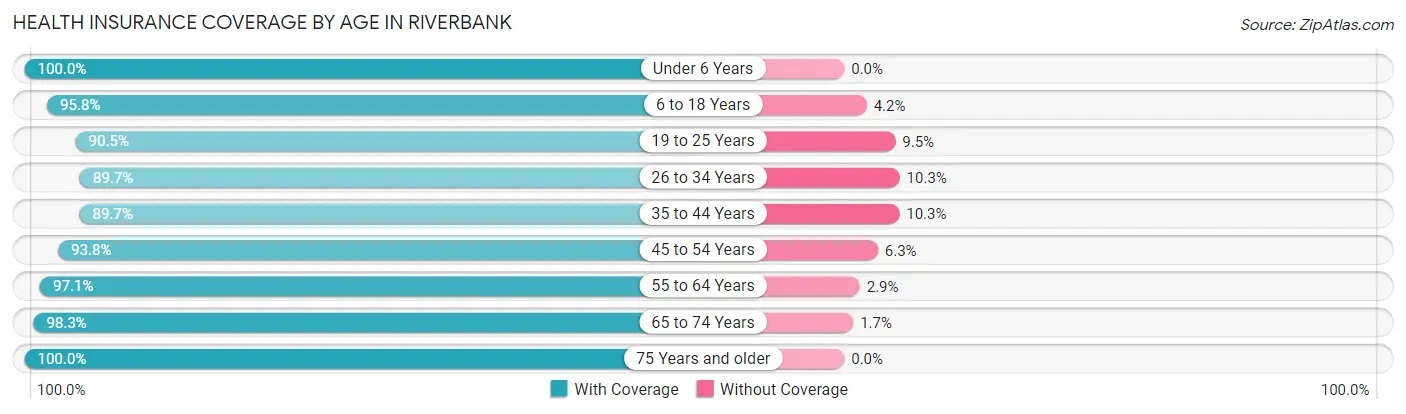
| Age Bracket | With Coverage | Without Coverage |
| Under 6 Years | 2,291 (100.0%) | 0 (0.0%) |
| 6 to 18 Years | 5,321 (95.8%) | 232 (4.2%) |
| 19 to 25 Years | 1,949 (90.5%) | 205 (9.5%) |
| 26 to 34 Years | 2,599 (89.7%) | 299 (10.3%) |
| 35 to 44 Years | 3,106 (89.7%) | 355 (10.3%) |
| 45 to 54 Years | 3,254 (93.8%) | 217 (6.2%) |
| 55 to 64 Years | 2,086 (97.1%) | 62 (2.9%) |
| 65 to 74 Years | 1,482 (98.3%) | 25 (1.7%) |
| 75 Years and older | 1,153 (100.0%) | 0 (0.0%) |
| Total | 23,241 (94.3%) | 1,395 (5.7%) |
Health Insurance Coverage by Citizenship Status in Riverbank
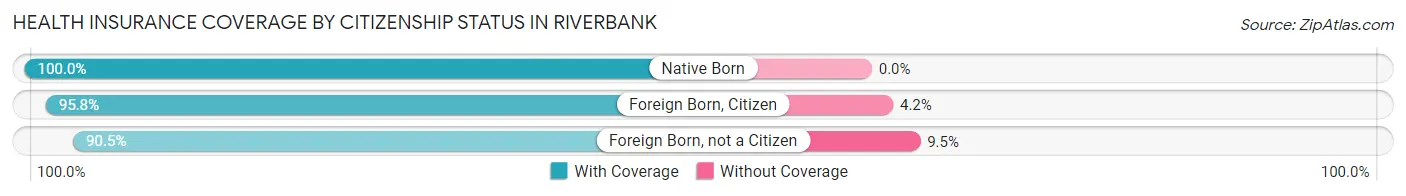
| Citizenship Status | With Coverage | Without Coverage |
| Native Born | 2,291 (100.0%) | 0 (0.0%) |
| Foreign Born, Citizen | 5,321 (95.8%) | 232 (4.2%) |
| Foreign Born, not a Citizen | 1,949 (90.5%) | 205 (9.5%) |
Health Insurance Coverage by Household Income in Riverbank
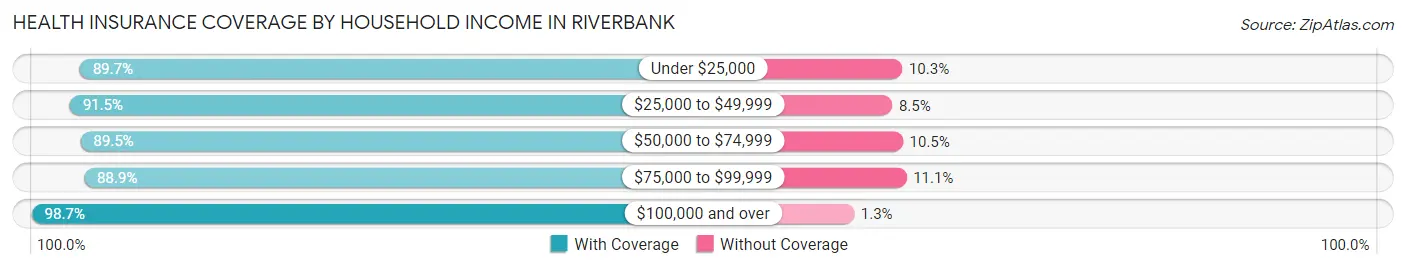
| Household Income | With Coverage | Without Coverage |
| Under $25,000 | 1,483 (89.7%) | 171 (10.3%) |
| $25,000 to $49,999 | 2,834 (91.5%) | 262 (8.5%) |
| $50,000 to $74,999 | 3,228 (89.5%) | 377 (10.5%) |
| $75,000 to $99,999 | 3,281 (88.9%) | 411 (11.1%) |
| $100,000 and over | 12,241 (98.7%) | 164 (1.3%) |
Public vs Private Health Insurance Coverage by Age in Riverbank
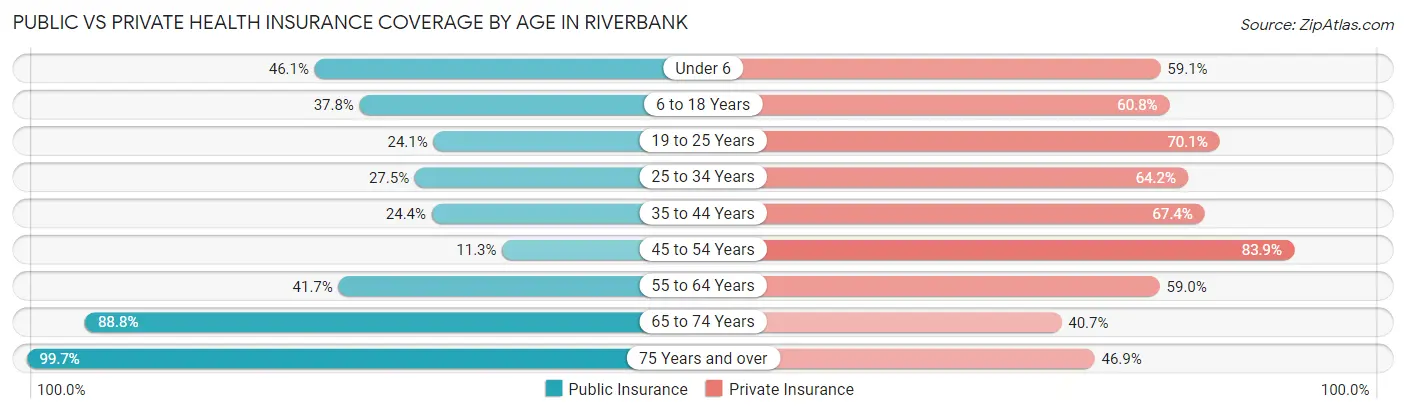
| Age Bracket | Public Insurance | Private Insurance |
| Under 6 | 1,057 (46.1%) | 1,355 (59.1%) |
| 6 to 18 Years | 2,099 (37.8%) | 3,376 (60.8%) |
| 19 to 25 Years | 519 (24.1%) | 1,510 (70.1%) |
| 25 to 34 Years | 798 (27.5%) | 1,861 (64.2%) |
| 35 to 44 Years | 845 (24.4%) | 2,331 (67.3%) |
| 45 to 54 Years | 393 (11.3%) | 2,912 (83.9%) |
| 55 to 64 Years | 896 (41.7%) | 1,267 (59.0%) |
| 65 to 74 Years | 1,338 (88.8%) | 614 (40.7%) |
| 75 Years and over | 1,149 (99.7%) | 541 (46.9%) |
| Total | 9,094 (36.9%) | 15,767 (64.0%) |
Disability Status by Sex by Age in Riverbank
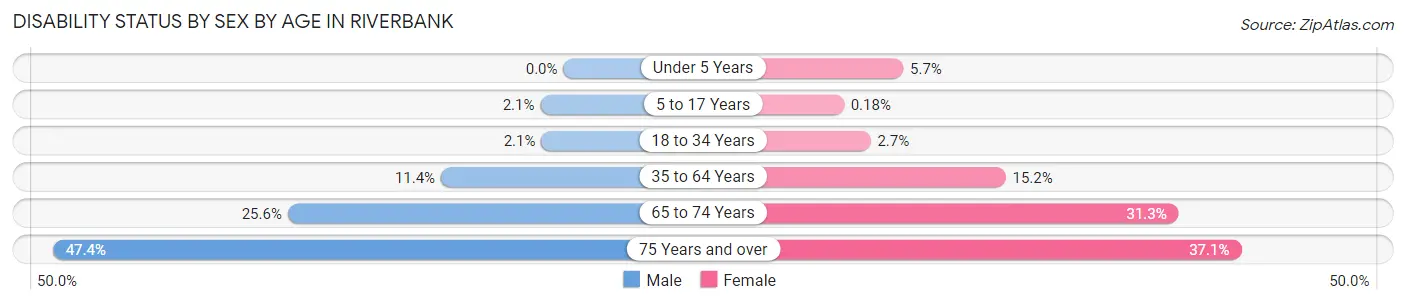
| Age Bracket | Male | Female |
| Under 5 Years | 0 (0.0%) | 51 (5.7%) |
| 5 to 17 Years | 60 (2.1%) | 5 (0.2%) |
| 18 to 34 Years | 52 (2.1%) | 77 (2.7%) |
| 35 to 64 Years | 516 (11.4%) | 690 (15.2%) |
| 65 to 74 Years | 189 (25.6%) | 240 (31.2%) |
| 75 Years and over | 200 (47.4%) | 271 (37.1%) |
Disability Class by Sex by Age in Riverbank
Disability Class: Hearing Difficulty
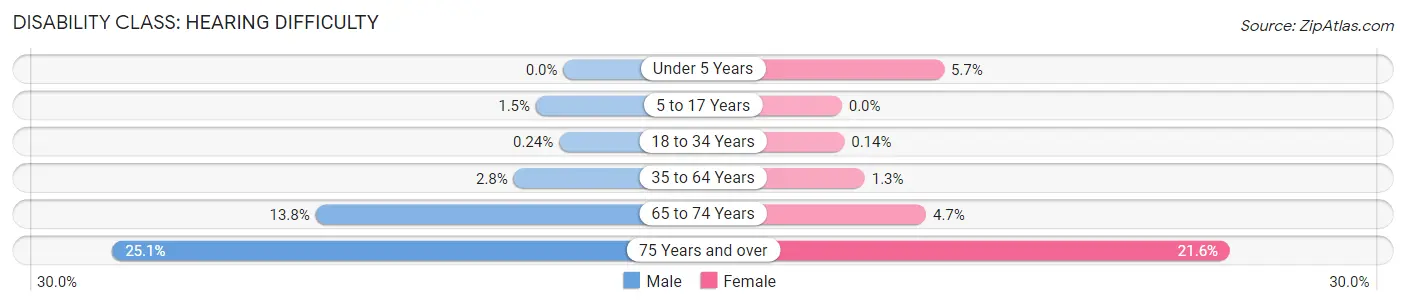
| Age Bracket | Male | Female |
| Under 5 Years | 0 (0.0%) | 51 (5.7%) |
| 5 to 17 Years | 43 (1.5%) | 0 (0.0%) |
| 18 to 34 Years | 6 (0.2%) | 4 (0.1%) |
| 35 to 64 Years | 126 (2.8%) | 58 (1.3%) |
| 65 to 74 Years | 102 (13.8%) | 36 (4.7%) |
| 75 Years and over | 106 (25.1%) | 158 (21.6%) |
Disability Class: Vision Difficulty
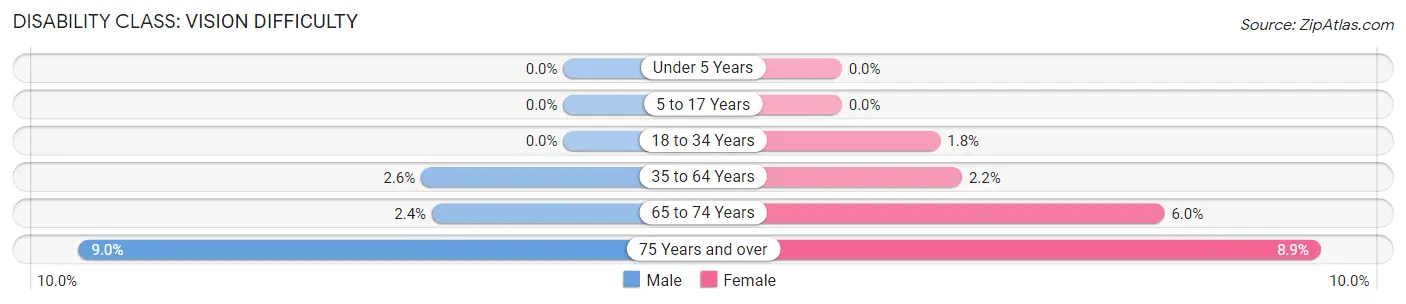
| Age Bracket | Male | Female |
| Under 5 Years | 0 (0.0%) | 0 (0.0%) |
| 5 to 17 Years | 0 (0.0%) | 0 (0.0%) |
| 18 to 34 Years | 0 (0.0%) | 53 (1.8%) |
| 35 to 64 Years | 120 (2.6%) | 101 (2.2%) |
| 65 to 74 Years | 18 (2.4%) | 46 (6.0%) |
| 75 Years and over | 38 (9.0%) | 65 (8.9%) |
Disability Class: Cognitive Difficulty
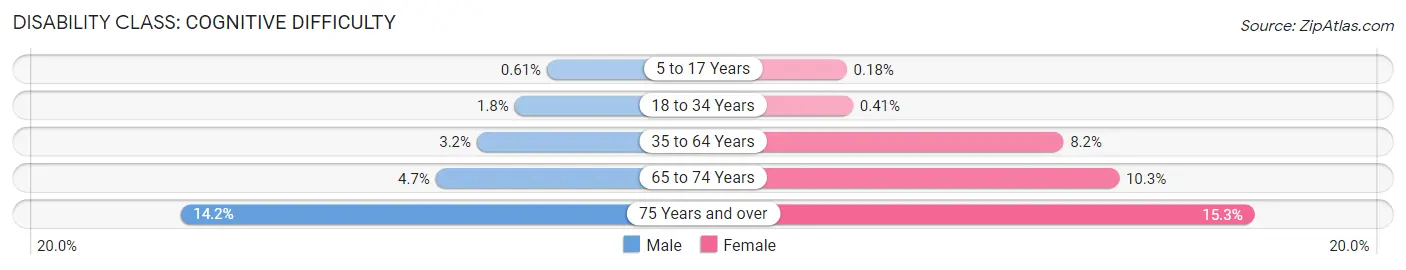
| Age Bracket | Male | Female |
| 5 to 17 Years | 17 (0.6%) | 5 (0.2%) |
| 18 to 34 Years | 46 (1.8%) | 12 (0.4%) |
| 35 to 64 Years | 146 (3.2%) | 373 (8.2%) |
| 65 to 74 Years | 35 (4.7%) | 79 (10.3%) |
| 75 Years and over | 60 (14.2%) | 112 (15.3%) |
Disability Class: Ambulatory Difficulty
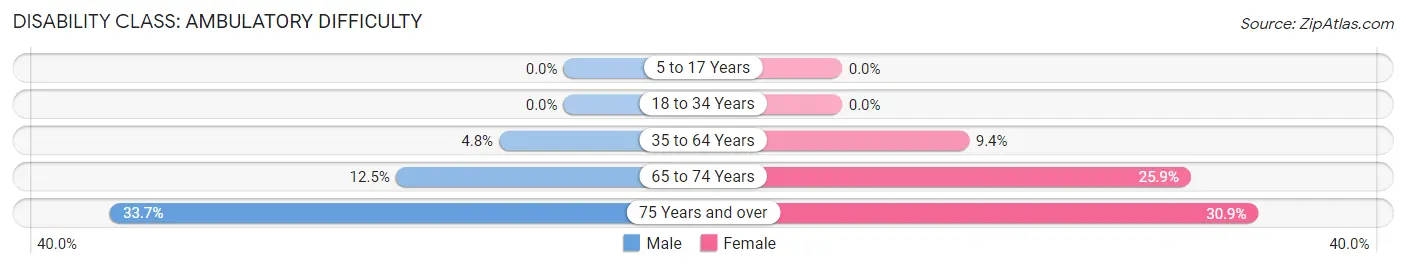
| Age Bracket | Male | Female |
| 5 to 17 Years | 0 (0.0%) | 0 (0.0%) |
| 18 to 34 Years | 0 (0.0%) | 0 (0.0%) |
| 35 to 64 Years | 217 (4.8%) | 428 (9.4%) |
| 65 to 74 Years | 92 (12.4%) | 199 (25.9%) |
| 75 Years and over | 142 (33.7%) | 226 (30.9%) |
Disability Class: Self-Care Difficulty
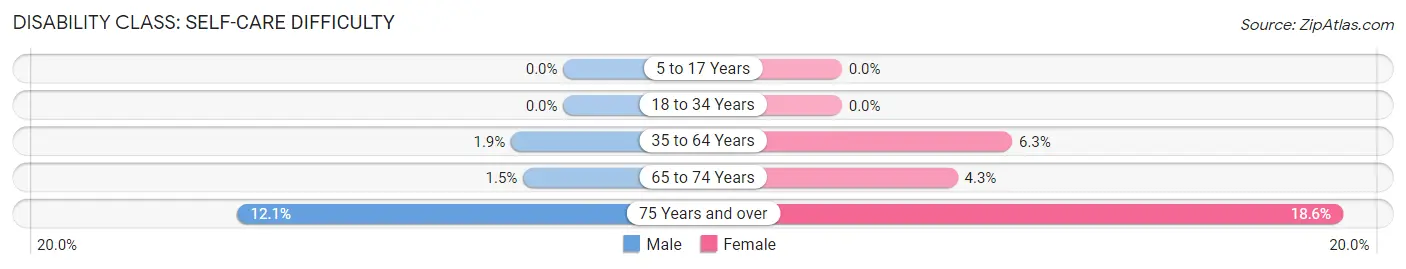
| Age Bracket | Male | Female |
| 5 to 17 Years | 0 (0.0%) | 0 (0.0%) |
| 18 to 34 Years | 0 (0.0%) | 0 (0.0%) |
| 35 to 64 Years | 88 (1.9%) | 287 (6.3%) |
| 65 to 74 Years | 11 (1.5%) | 33 (4.3%) |
| 75 Years and over | 51 (12.1%) | 136 (18.6%) |
Technology Access in Riverbank
Computing Device Access in Riverbank
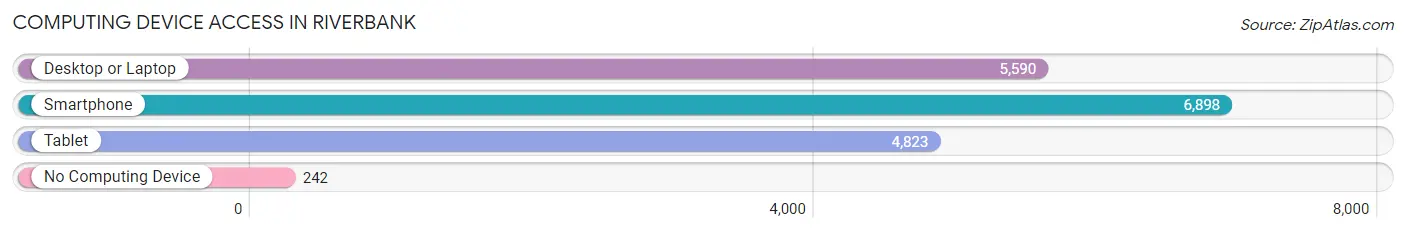
| Device Type | # Households | % Households |
| Desktop or Laptop | 5,590 | 76.4% |
| Smartphone | 6,898 | 94.3% |
| Tablet | 4,823 | 65.9% |
| No Computing Device | 242 | 3.3% |
| Total | 7,314 | 100.0% |
Internet Access in Riverbank
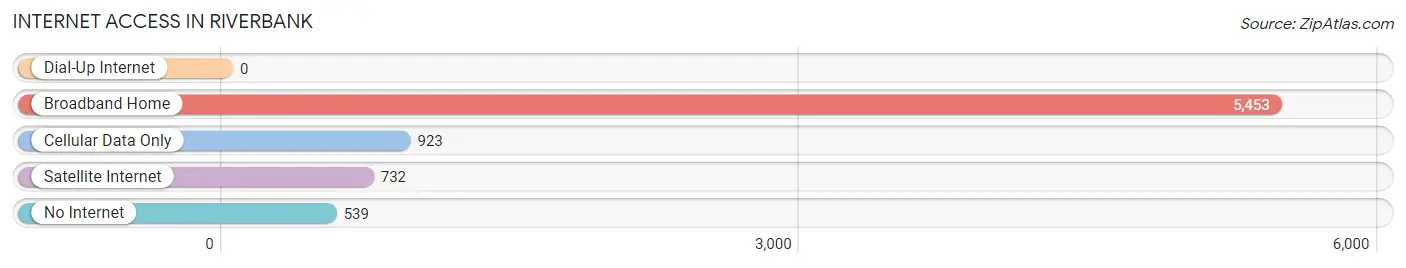
| Internet Type | # Households | % Households |
| Dial-Up Internet | 0 | 0.0% |
| Broadband Home | 5,453 | 74.6% |
| Cellular Data Only | 923 | 12.6% |
| Satellite Internet | 732 | 10.0% |
| No Internet | 539 | 7.4% |
| Total | 7,314 | 100.0% |
Riverbank Summary
Riverbank is a city located in Stanislaus County, California, United States. The population was 22,678 at the 2010 census, up from 15,826 at the 2000 census. Riverbank is located in the Central Valley of California, near Modesto, the county seat.
History
The area that is now Riverbank was originally inhabited by the Yokut Indians. The first European settlers arrived in the area in the mid-1800s, and the town was officially founded in 1868. The town was originally called “Rio de los Santos”, which translates to “River of the Saints”. The name was changed to Riverbank in 1891.
The town was a major agricultural center in the early 1900s, with many of the local farmers growing grapes, peaches, and other fruits. The town was also home to a large cannery, which processed the fruits grown in the area.
In the 1950s, Riverbank began to experience a population boom, as many people moved to the area from the San Francisco Bay Area. This growth continued into the 1960s and 1970s, and the population of Riverbank has continued to grow ever since.
Geography
Riverbank is located in the Central Valley of California, about 10 miles south of Modesto. The city is situated on the banks of the Stanislaus River, which runs through the city. The city is surrounded by rolling hills and farmland.
The climate in Riverbank is mild and temperate, with hot summers and cool winters. The average high temperature in the summer is around 90 degrees Fahrenheit, and the average low temperature in the winter is around 40 degrees Fahrenheit.
Economy
Riverbank’s economy is largely based on agriculture. The city is home to many farms and orchards, which produce a variety of fruits and vegetables. The city is also home to several wineries, which produce a variety of wines.
In addition to agriculture, Riverbank is home to several manufacturing and industrial businesses. The city is home to a large food processing plant, as well as several other manufacturing and industrial businesses.
Demographics
As of the 2010 census, the population of Riverbank was 22,678. The racial makeup of the city was 68.3% White, 1.3% African American, 0.7% Native American, 1.2% Asian, 0.2% Pacific Islander, 25.2% from other races, and 3.3% from two or more races. Hispanic or Latino of any race were 44.2% of the population.
The median household income in Riverbank was $50,945, and the median family income was $56,945. The per capita income in Riverbank was $20,945. About 16.2% of the population was below the poverty line.
Conclusion
Riverbank is a city located in Stanislaus County, California, United States. The city has a long history, dating back to the mid-1800s, and has experienced a population boom in recent decades. The city’s economy is largely based on agriculture, with many farms and orchards in the area. The population of Riverbank was 22,678 at the 2010 census, and the median household income was $50,945.
Common Questions
What is Per Capita Income in Riverbank?
Per Capita income in Riverbank is $33,398.
What is the Median Family Income in Riverbank?
Median Family Income in Riverbank is $101,199.
What is the Median Household income in Riverbank?
Median Household Income in Riverbank is $89,504.
What is Income or Wage Gap in Riverbank?
Income or Wage Gap in Riverbank is 31.3%.
Women in Riverbank earn 68.7 cents for every dollar earned by a man.
What is Family Income Deficit in Riverbank?
Family Income Deficit in Riverbank is $11,462.
Families that are below poverty line in Riverbank earn $11,462 less on average than the poverty threshold level.
What is Inequality or Gini Index in Riverbank?
Inequality or Gini Index in Riverbank is 0.42.
What is the Total Population of Riverbank?
Total Population of Riverbank is 24,803.
What is the Total Male Population of Riverbank?
Total Male Population of Riverbank is 12,185.
What is the Total Female Population of Riverbank?
Total Female Population of Riverbank is 12,618.
What is the Ratio of Males per 100 Females in Riverbank?
There are 96.57 Males per 100 Females in Riverbank.
What is the Ratio of Females per 100 Males in Riverbank?
There are 103.55 Females per 100 Males in Riverbank.
What is the Median Population Age in Riverbank?
Median Population Age in Riverbank is 33.6 Years.
What is the Average Family Size in Riverbank
Average Family Size in Riverbank is 3.8 People.
What is the Average Household Size in Riverbank
Average Household Size in Riverbank is 3.4 People.
How Large is the Labor Force in Riverbank?
There are 11,319 People in the Labor Forcein in Riverbank.
What is the Percentage of People in the Labor Force in Riverbank?
62.9% of People are in the Labor Force in Riverbank.
What is the Unemployment Rate in Riverbank?
Unemployment Rate in Riverbank is 5.9%.