Raisin City, CA Map & Demographics
Raisin City Map
Raisin City Overview
$21,320
PER CAPITA INCOME
$56,250
AVG FAMILY INCOME
$54,583
AVG HOUSEHOLD INCOME
0.25
INEQUALITY / GINI INDEX
267
TOTAL POPULATION
146
MALE POPULATION
121
FEMALE POPULATION
120.66
MALES / 100 FEMALES
82.88
FEMALES / 100 MALES
38.5
MEDIAN AGE
4.0
AVG FAMILY SIZE
3.1
AVG HOUSEHOLD SIZE
133
LABOR FORCE [ PEOPLE ]
59.9%
PERCENT IN LABOR FORCE
33.1%
UNEMPLOYMENT RATE
Raisin City Zip Codes
Raisin City Area Codes
Income in Raisin City
Income Overview in Raisin City
Per Capita Income in Raisin City is $21,320, while median incomes of families and households are $56,250 and $54,583 respectively.
| Characteristic | Number | Measure |
| Per Capita Income | 267 | $21,320 |
| Median Family Income | 56 | $56,250 |
| Mean Family Income | 56 | $70,320 |
| Median Household Income | 85 | $54,583 |
| Mean Household Income | 85 | $63,349 |
| Income Deficit | 56 | $0 |
| Wage / Income Gap (%) | 267 | 0.00% |
| Wage / Income Gap ($) | 267 | 100.00¢ per $1 |
| Gini / Inequality Index | 267 | 0.25 |
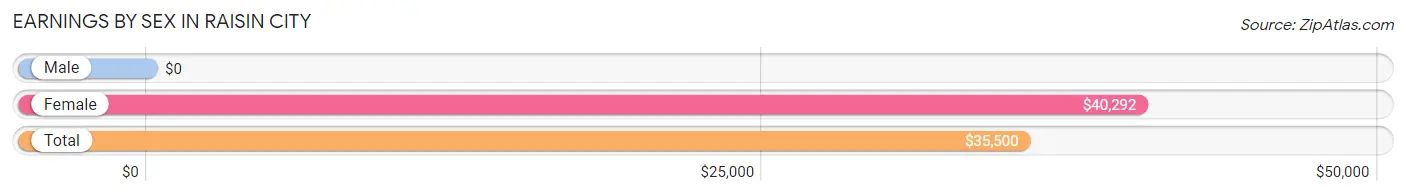
Earnings by Sex in Raisin City
| Sex | Number | Average Earnings |
| Male | 81 (60.5%) | $0 |
| Female | 53 (39.6%) | $40,292 |
| Total | 134 (100.0%) | $35,500 |
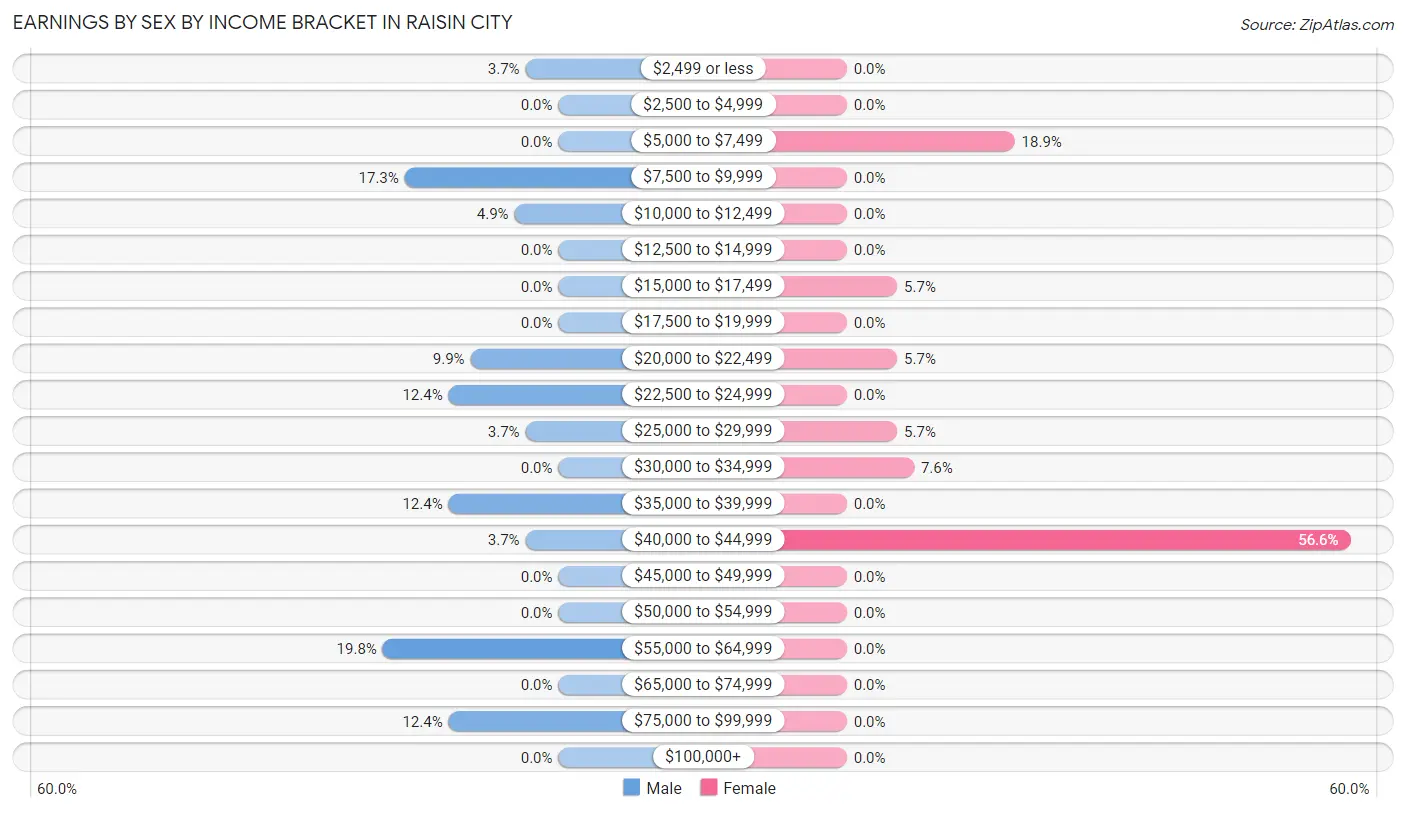
Earnings by Sex by Income Bracket in Raisin City
The most common earnings brackets in Raisin City are $55,000 to $64,999 for men (16 | 19.8%) and $40,000 to $44,999 for women (30 | 56.6%).
| Income | Male | Female |
| $2,499 or less | 3 (3.7%) | 0 (0.0%) |
| $2,500 to $4,999 | 0 (0.0%) | 0 (0.0%) |
| $5,000 to $7,499 | 0 (0.0%) | 10 (18.9%) |
| $7,500 to $9,999 | 14 (17.3%) | 0 (0.0%) |
| $10,000 to $12,499 | 4 (4.9%) | 0 (0.0%) |
| $12,500 to $14,999 | 0 (0.0%) | 0 (0.0%) |
| $15,000 to $17,499 | 0 (0.0%) | 3 (5.7%) |
| $17,500 to $19,999 | 0 (0.0%) | 0 (0.0%) |
| $20,000 to $22,499 | 8 (9.9%) | 3 (5.7%) |
| $22,500 to $24,999 | 10 (12.3%) | 0 (0.0%) |
| $25,000 to $29,999 | 3 (3.7%) | 3 (5.7%) |
| $30,000 to $34,999 | 0 (0.0%) | 4 (7.5%) |
| $35,000 to $39,999 | 10 (12.3%) | 0 (0.0%) |
| $40,000 to $44,999 | 3 (3.7%) | 30 (56.6%) |
| $45,000 to $49,999 | 0 (0.0%) | 0 (0.0%) |
| $50,000 to $54,999 | 0 (0.0%) | 0 (0.0%) |
| $55,000 to $64,999 | 16 (19.8%) | 0 (0.0%) |
| $65,000 to $74,999 | 0 (0.0%) | 0 (0.0%) |
| $75,000 to $99,999 | 10 (12.3%) | 0 (0.0%) |
| $100,000+ | 0 (0.0%) | 0 (0.0%) |
| Total | 81 (100.0%) | 53 (100.0%) |
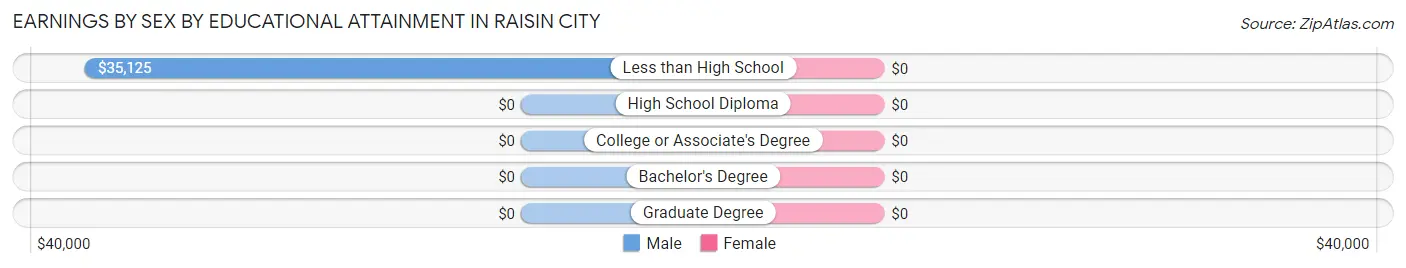
Earnings by Sex by Educational Attainment in Raisin City
| Educational Attainment | Male Income | Female Income |
| Less than High School | $35,125 | $0 |
| High School Diploma | - | - |
| College or Associate's Degree | - | - |
| Bachelor's Degree | - | - |
| Graduate Degree | - | - |
| Total | - | - |
Family Income in Raisin City
Family Income Brackets in Raisin City
According to the Raisin City family income data, there are 24 families falling into the $50,000 to $74,999 income range, which is the most common income bracket and makes up 42.9% of all families.
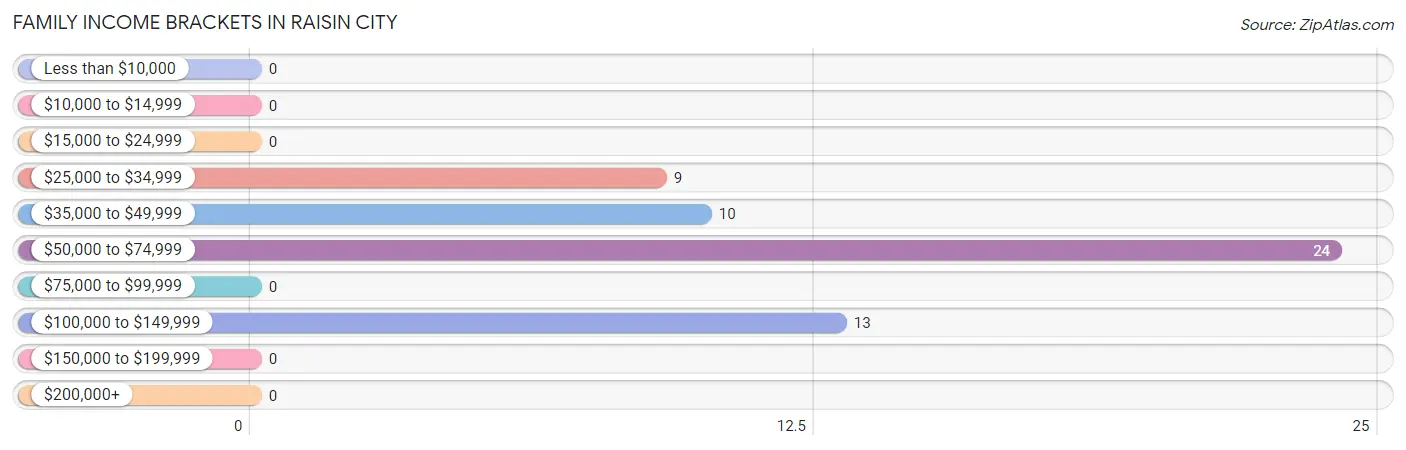
| Income Bracket | # Families | % Families |
| Less than $10,000 | 0 | 0.0% |
| $10,000 to $14,999 | 0 | 0.0% |
| $15,000 to $24,999 | 0 | 0.0% |
| $25,000 to $34,999 | 9 | 16.1% |
| $35,000 to $49,999 | 10 | 17.9% |
| $50,000 to $74,999 | 24 | 42.9% |
| $75,000 to $99,999 | 0 | 0.0% |
| $100,000 to $149,999 | 13 | 23.2% |
| $150,000 to $199,999 | 0 | 0.0% |
| $200,000+ | 0 | 0.0% |
Family Income by Famaliy Size in Raisin City
4-person families (24 | 42.9%) account for the highest median family income in Raisin City with $51,250 per family, while 4-person families (24 | 42.9%) have the highest median income of $12,812 per family member.
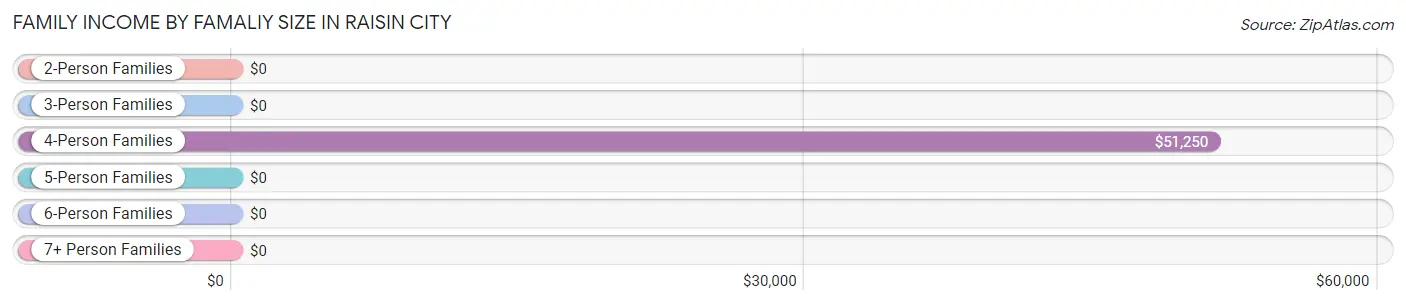
| Income Bracket | # Families | Median Income |
| 2-Person Families | 6 (10.7%) | $0 |
| 3-Person Families | 18 (32.1%) | $0 |
| 4-Person Families | 24 (42.9%) | $51,250 |
| 5-Person Families | 3 (5.4%) | $0 |
| 6-Person Families | 2 (3.6%) | $0 |
| 7+ Person Families | 3 (5.4%) | $0 |
| Total | 56 (100.0%) | $56,250 |
Family Income by Number of Earners in Raisin City
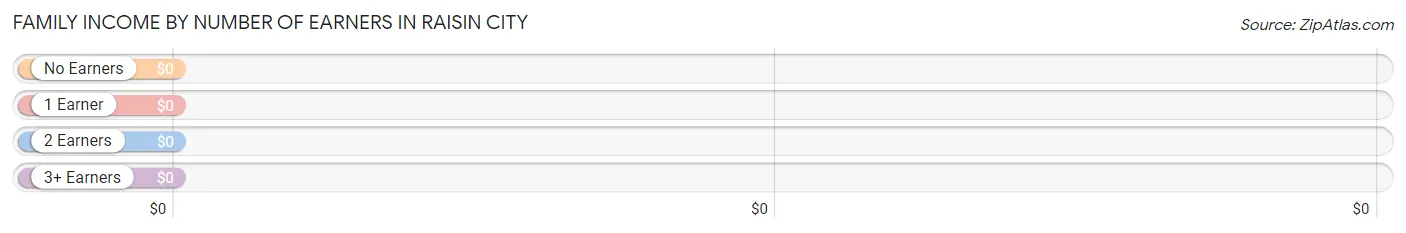
| Number of Earners | # Families | Median Income |
| No Earners | 6 (10.7%) | $0 |
| 1 Earner | 6 (10.7%) | $0 |
| 2 Earners | 34 (60.7%) | $0 |
| 3+ Earners | 10 (17.9%) | $0 |
| Total | 56 (100.0%) | $56,250 |
Household Income in Raisin City
Household Income Brackets in Raisin City
With 36 households falling in the category, the $50,000 to $74,999 income range is the most frequent in Raisin City, accounting for 42.3% of all households.
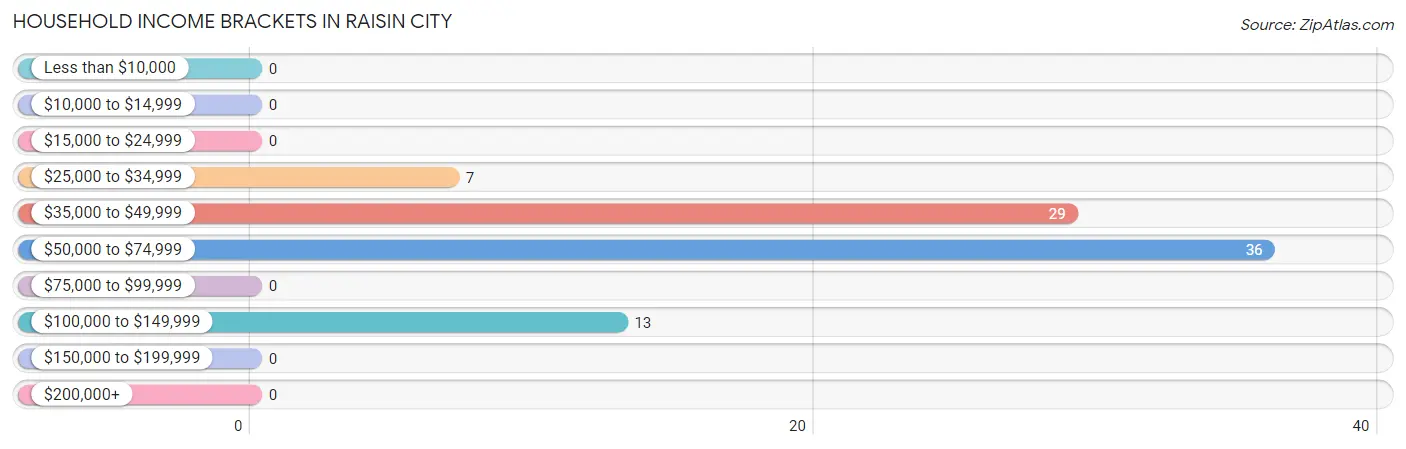
| Income Bracket | # Households | % Households |
| Less than $10,000 | 0 | 0.0% |
| $10,000 to $14,999 | 0 | 0.0% |
| $15,000 to $24,999 | 0 | 0.0% |
| $25,000 to $34,999 | 7 | 8.2% |
| $35,000 to $49,999 | 29 | 34.1% |
| $50,000 to $74,999 | 36 | 42.4% |
| $75,000 to $99,999 | 0 | 0.0% |
| $100,000 to $149,999 | 13 | 15.3% |
| $150,000 to $199,999 | 0 | 0.0% |
| $200,000+ | 0 | 0.0% |
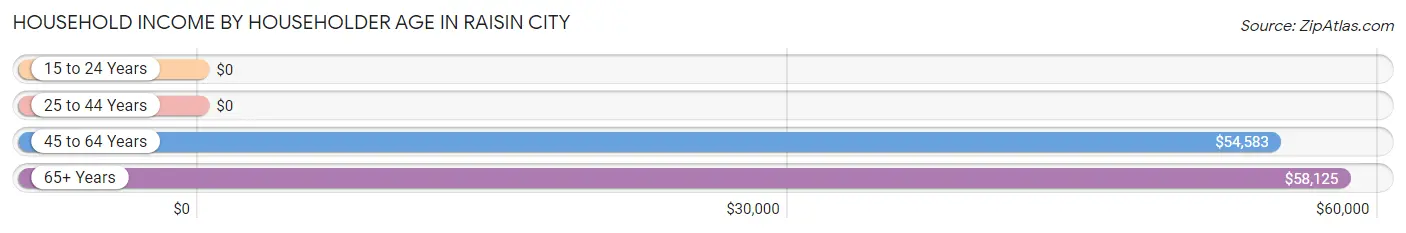
Household Income by Householder Age in Raisin City
The median household income in Raisin City is $54,583, with the highest median household income of $58,125 found in the 65+ years age bracket for the primary householder. A total of 27 households (31.8%) fall into this category.
| Income Bracket | # Households | Median Income |
| 15 to 24 Years | 0 (0.0%) | $0 |
| 25 to 44 Years | 33 (38.8%) | $0 |
| 45 to 64 Years | 25 (29.4%) | $54,583 |
| 65+ Years | 27 (31.8%) | $58,125 |
| Total | 85 (100.0%) | $54,583 |
Poverty in Raisin City
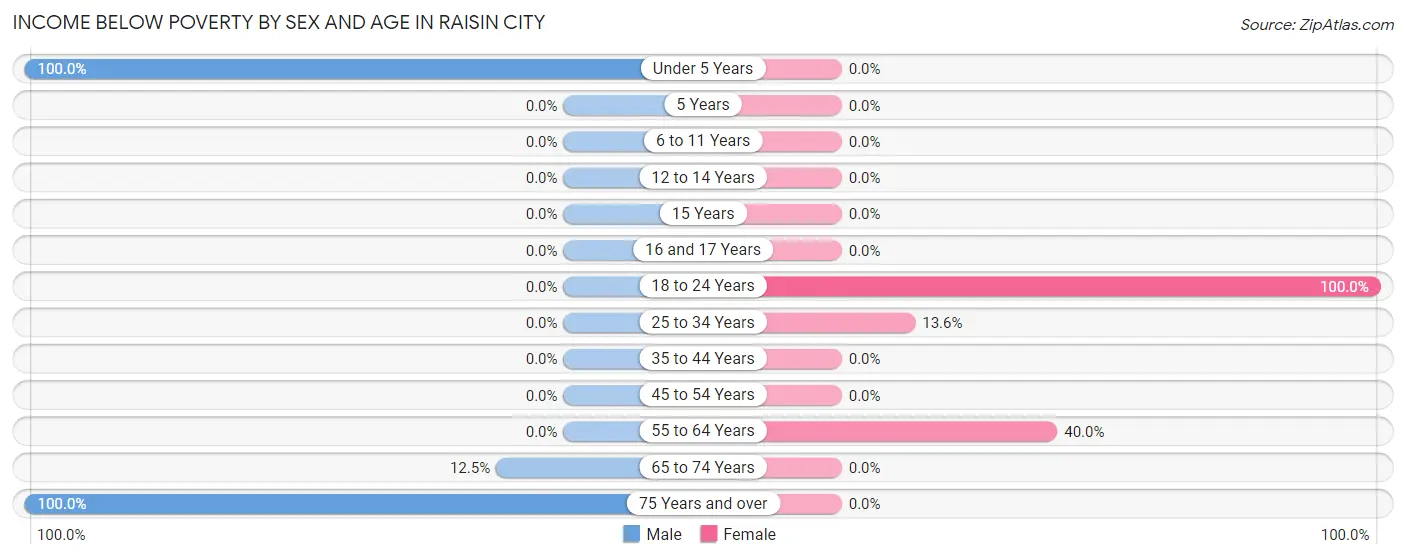
Income Below Poverty by Sex and Age in Raisin City
With 7.5% poverty level for males and 11.6% for females among the residents of Raisin City, under 5 year old males and 18 to 24 year old females are the most vulnerable to poverty, with 5 males (100.0%) and 9 females (100.0%) in their respective age groups living below the poverty level.
| Age Bracket | Male | Female |
| Under 5 Years | 5 (100.0%) | 0 (0.0%) |
| 5 Years | 0 (0.0%) | 0 (0.0%) |
| 6 to 11 Years | 0 (0.0%) | 0 (0.0%) |
| 12 to 14 Years | 0 (0.0%) | 0 (0.0%) |
| 15 Years | 0 (0.0%) | 0 (0.0%) |
| 16 and 17 Years | 0 (0.0%) | 0 (0.0%) |
| 18 to 24 Years | 0 (0.0%) | 9 (100.0%) |
| 25 to 34 Years | 0 (0.0%) | 3 (13.6%) |
| 35 to 44 Years | 0 (0.0%) | 0 (0.0%) |
| 45 to 54 Years | 0 (0.0%) | 0 (0.0%) |
| 55 to 64 Years | 0 (0.0%) | 2 (40.0%) |
| 65 to 74 Years | 3 (12.5%) | 0 (0.0%) |
| 75 Years and over | 3 (100.0%) | 0 (0.0%) |
| Total | 11 (7.5%) | 14 (11.6%) |
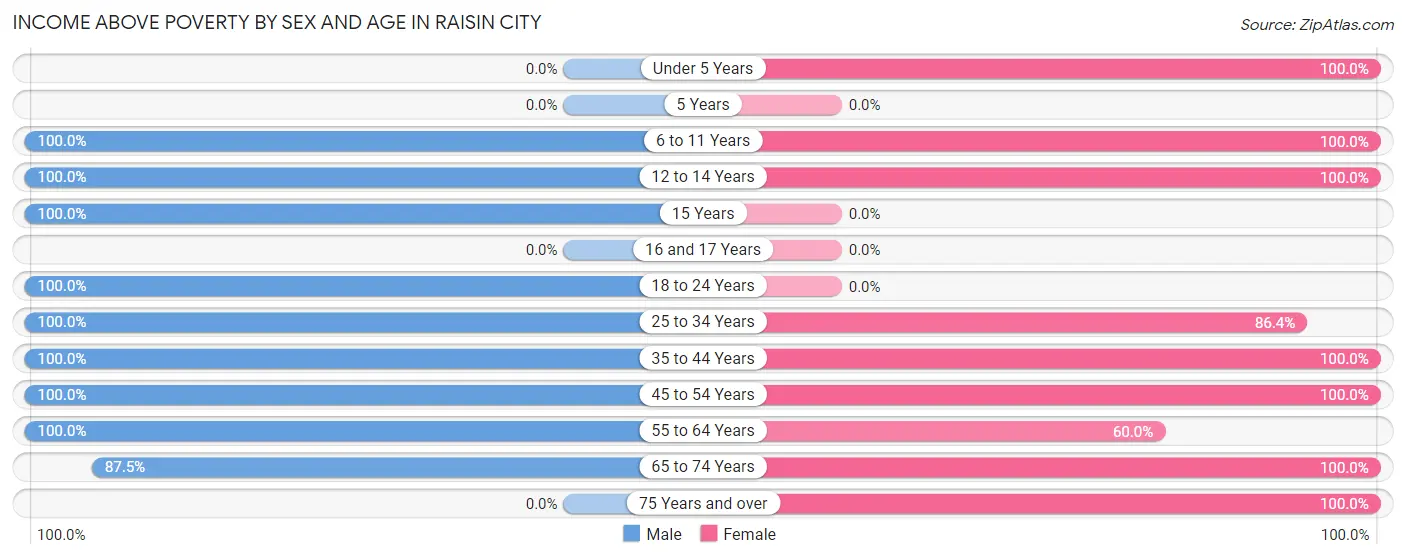
Income Above Poverty by Sex and Age in Raisin City
According to the poverty statistics in Raisin City, males aged 6 to 11 years and females aged under 5 years are the age groups that are most secure financially, with 100.0% of males and 100.0% of females in these age groups living above the poverty line.
| Age Bracket | Male | Female |
| Under 5 Years | 0 (0.0%) | 14 (100.0%) |
| 5 Years | 0 (0.0%) | 0 (0.0%) |
| 6 to 11 Years | 3 (100.0%) | 7 (100.0%) |
| 12 to 14 Years | 7 (100.0%) | 6 (100.0%) |
| 15 Years | 3 (100.0%) | 0 (0.0%) |
| 16 and 17 Years | 0 (0.0%) | 0 (0.0%) |
| 18 to 24 Years | 22 (100.0%) | 0 (0.0%) |
| 25 to 34 Years | 17 (100.0%) | 19 (86.4%) |
| 35 to 44 Years | 27 (100.0%) | 19 (100.0%) |
| 45 to 54 Years | 25 (100.0%) | 23 (100.0%) |
| 55 to 64 Years | 10 (100.0%) | 3 (60.0%) |
| 65 to 74 Years | 21 (87.5%) | 6 (100.0%) |
| 75 Years and over | 0 (0.0%) | 10 (100.0%) |
| Total | 135 (92.5%) | 107 (88.4%) |
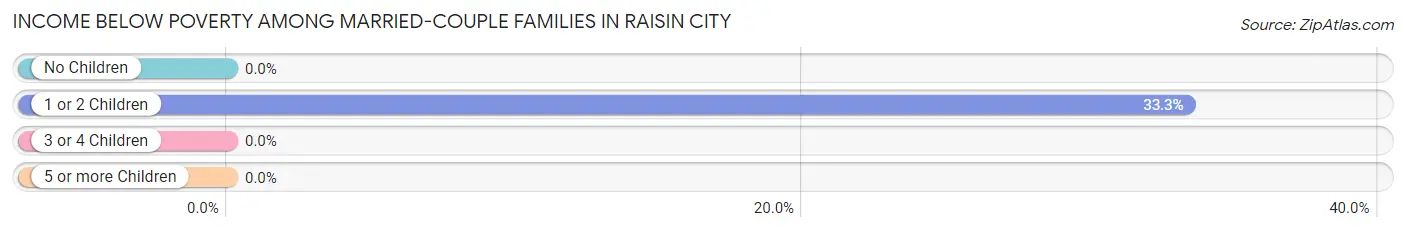
Income Below Poverty Among Married-Couple Families in Raisin City
The poverty statistics for married-couple families in Raisin City show that 5.6% or 2 of the total 36 families live below the poverty line. Families with 1 or 2 children have the highest poverty rate of 33.3%, comprising of 2 families. On the other hand, families with no children have the lowest poverty rate of 0.0%, which includes 0 families.
| Children | Above Poverty | Below Poverty |
| No Children | 27 (100.0%) | 0 (0.0%) |
| 1 or 2 Children | 4 (66.7%) | 2 (33.3%) |
| 3 or 4 Children | 0 (0.0%) | 0 (0.0%) |
| 5 or more Children | 3 (100.0%) | 0 (0.0%) |
| Total | 34 (94.4%) | 2 (5.6%) |
Income Below Poverty Among Single-Parent Households in Raisin City
| Children | Single Father | Single Mother |
| No Children | 0 (0.0%) | 0 (0.0%) |
| 1 or 2 Children | 0 (0.0%) | 0 (0.0%) |
| 3 or 4 Children | 0 (0.0%) | 0 (0.0%) |
| 5 or more Children | 0 (0.0%) | 0 (0.0%) |
| Total | 0 (0.0%) | 0 (0.0%) |
Income Below Poverty Among Married-Couple vs Single-Parent Households in Raisin City
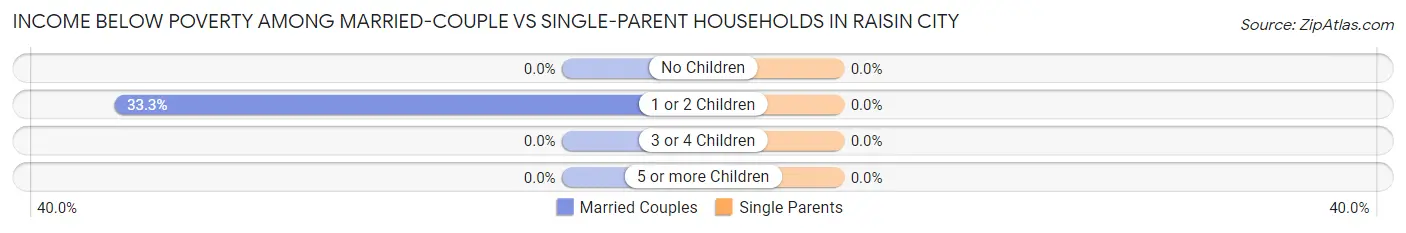
| Children | Married-Couple Families | Single-Parent Households |
| No Children | 0 (0.0%) | 0 (0.0%) |
| 1 or 2 Children | 2 (33.3%) | 0 (0.0%) |
| 3 or 4 Children | 0 (0.0%) | 0 (0.0%) |
| 5 or more Children | 0 (0.0%) | 0 (0.0%) |
| Total | 2 (5.6%) | 0 (0.0%) |
Race in Raisin City
The most populous races in Raisin City are Hispanic or Latino (253 | 94.8%), White / Caucasian (157 | 58.8%), and Some other Race (102 | 38.2%).
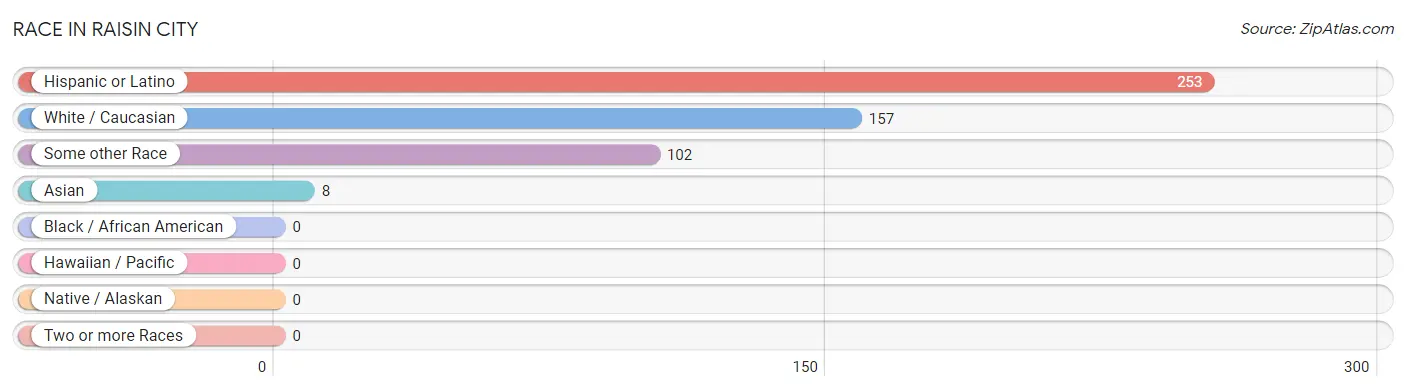
| Race | # Population | % Population |
| Asian | 8 | 3.0% |
| Black / African American | 0 | 0.0% |
| Hawaiian / Pacific | 0 | 0.0% |
| Hispanic or Latino | 253 | 94.8% |
| Native / Alaskan | 0 | 0.0% |
| White / Caucasian | 157 | 58.8% |
| Two or more Races | 0 | 0.0% |
| Some other Race | 102 | 38.2% |
| Total | 267 | 100.0% |
Ancestry in Raisin City
The most populous ancestries reported in Raisin City are Mexican (253 | 94.8%), Thai (8 | 3.0%), and Italian (7 | 2.6%), together accounting for 100.4% of all Raisin City residents.
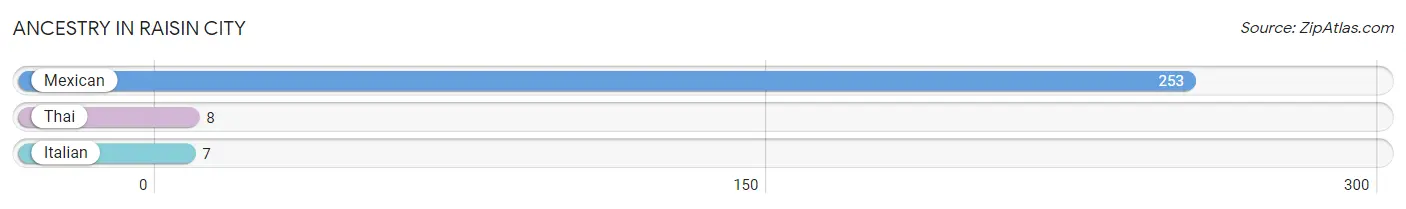
| Ancestry | # Population | % Population |
| Italian | 7 | 2.6% |
| Mexican | 253 | 94.8% |
| Thai | 8 | 3.0% | View All 3 Rows |
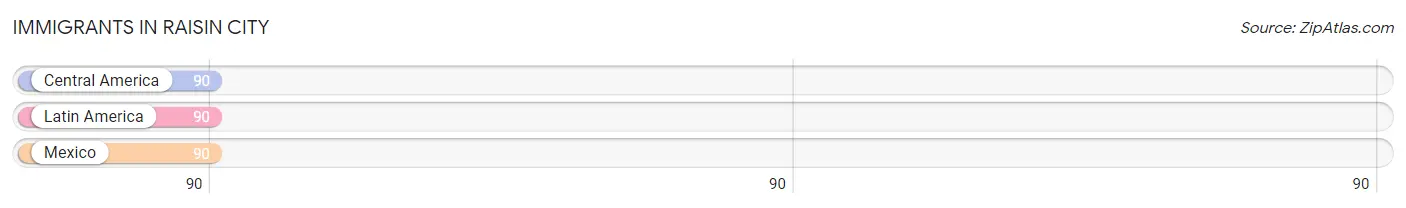
Immigrants in Raisin City
The most numerous immigrant groups reported in Raisin City came from Central America (90 | 33.7%), Latin America (90 | 33.7%), and Mexico (90 | 33.7%), together accounting for 101.1% of all Raisin City residents.
| Immigration Origin | # Population | % Population |
| Central America | 90 | 33.7% |
| Latin America | 90 | 33.7% |
| Mexico | 90 | 33.7% | View All 3 Rows |
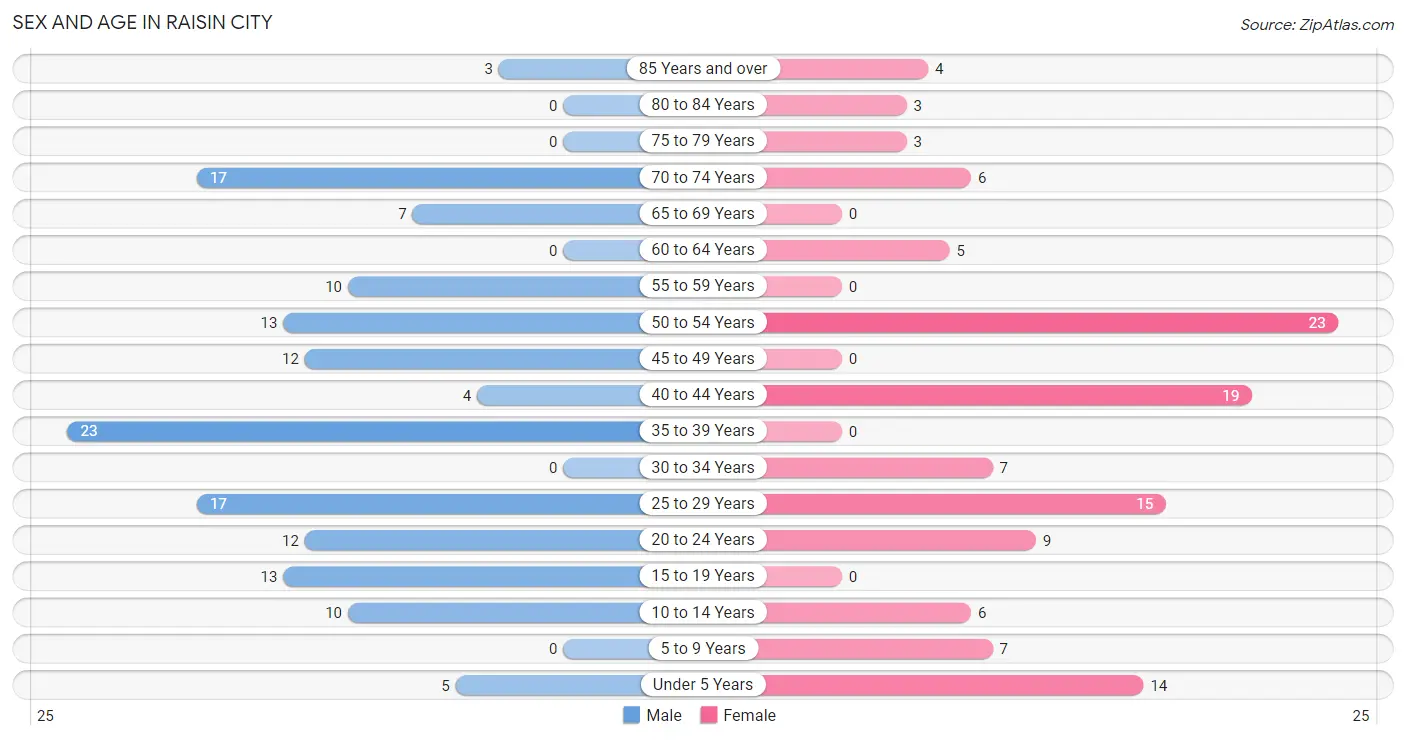
Sex and Age in Raisin City
Sex and Age in Raisin City
The most populous age groups in Raisin City are 35 to 39 Years (23 | 15.8%) for men and 50 to 54 Years (23 | 19.0%) for women.
| Age Bracket | Male | Female |
| Under 5 Years | 5 (3.4%) | 14 (11.6%) |
| 5 to 9 Years | 0 (0.0%) | 7 (5.8%) |
| 10 to 14 Years | 10 (6.9%) | 6 (5.0%) |
| 15 to 19 Years | 13 (8.9%) | 0 (0.0%) |
| 20 to 24 Years | 12 (8.2%) | 9 (7.4%) |
| 25 to 29 Years | 17 (11.6%) | 15 (12.4%) |
| 30 to 34 Years | 0 (0.0%) | 7 (5.8%) |
| 35 to 39 Years | 23 (15.8%) | 0 (0.0%) |
| 40 to 44 Years | 4 (2.7%) | 19 (15.7%) |
| 45 to 49 Years | 12 (8.2%) | 0 (0.0%) |
| 50 to 54 Years | 13 (8.9%) | 23 (19.0%) |
| 55 to 59 Years | 10 (6.9%) | 0 (0.0%) |
| 60 to 64 Years | 0 (0.0%) | 5 (4.1%) |
| 65 to 69 Years | 7 (4.8%) | 0 (0.0%) |
| 70 to 74 Years | 17 (11.6%) | 6 (5.0%) |
| 75 to 79 Years | 0 (0.0%) | 3 (2.5%) |
| 80 to 84 Years | 0 (0.0%) | 3 (2.5%) |
| 85 Years and over | 3 (2.1%) | 4 (3.3%) |
| Total | 146 (100.0%) | 121 (100.0%) |
Families and Households in Raisin City
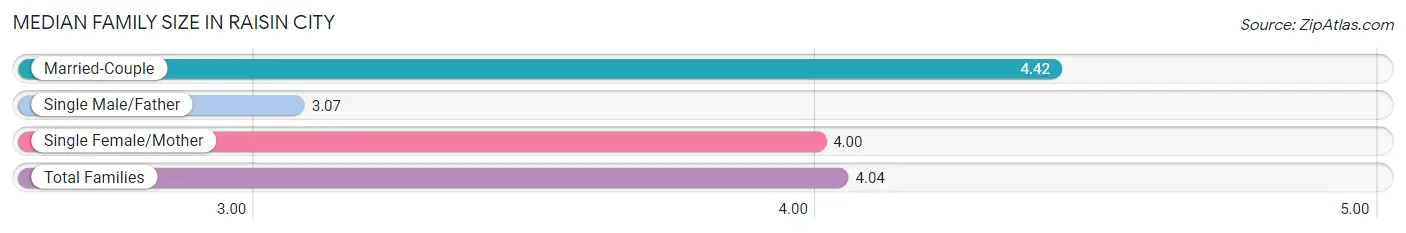
Median Family Size in Raisin City
The median family size in Raisin City is 4.04 persons per family, with married-couple families (36 | 64.3%) accounting for the largest median family size of 4.42 persons per family. On the other hand, single male/father families (14 | 25.0%) represent the smallest median family size with 3.07 persons per family.
| Family Type | # Families | Family Size |
| Married-Couple | 36 (64.3%) | 4.42 |
| Single Male/Father | 14 (25.0%) | 3.07 |
| Single Female/Mother | 6 (10.7%) | 4.00 |
| Total Families | 56 (100.0%) | 4.04 |
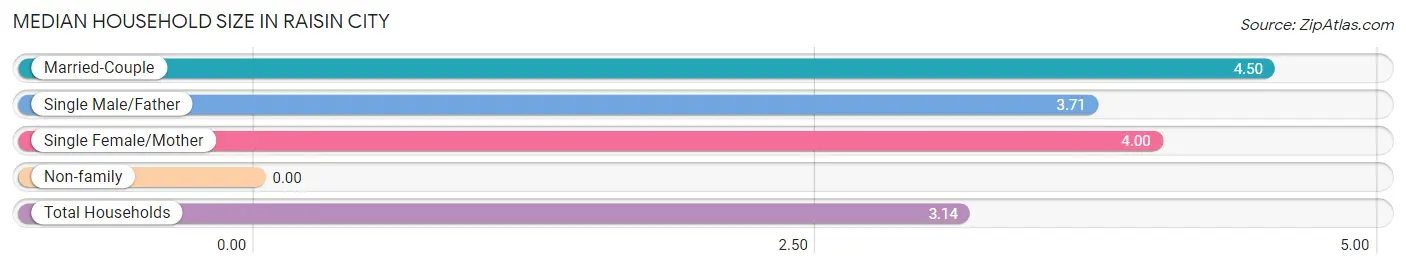
Median Household Size in Raisin City
| Household Type | # Households | Household Size |
| Married-Couple | 36 (42.3%) | 4.50 |
| Single Male/Father | 14 (16.5%) | 3.71 |
| Single Female/Mother | 6 (7.1%) | 4.00 |
| Non-family | 29 (34.1%) | - |
| Total Households | 85 (100.0%) | 3.14 |
Household Size by Marriage Status in Raisin City
Out of a total of 85 households in Raisin City, 56 (65.9%) are family households, while 29 (34.1%) are nonfamily households. The most numerous type of family households are 4-person households, comprising 34, and the most common type of nonfamily households are 1-person households, comprising 29.
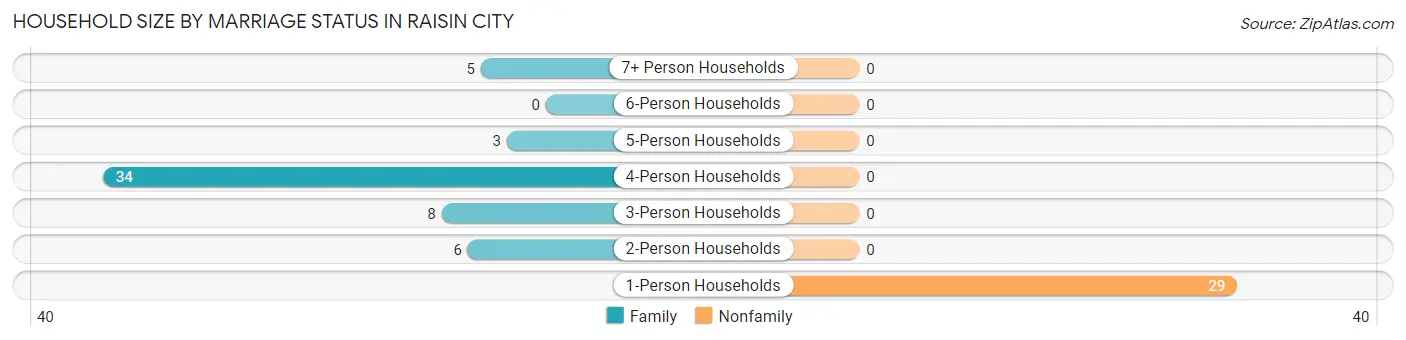
| Household Size | Family Households | Nonfamily Households |
| 1-Person Households | - | 29 (34.1%) |
| 2-Person Households | 6 (7.1%) | 0 (0.0%) |
| 3-Person Households | 8 (9.4%) | 0 (0.0%) |
| 4-Person Households | 34 (40.0%) | 0 (0.0%) |
| 5-Person Households | 3 (3.5%) | 0 (0.0%) |
| 6-Person Households | 0 (0.0%) | 0 (0.0%) |
| 7+ Person Households | 5 (5.9%) | 0 (0.0%) |
| Total | 56 (65.9%) | 29 (34.1%) |
Female Fertility in Raisin City
Fertility by Age in Raisin City
Average fertility rate in Raisin City is 57.0 births per 1,000 women. Women in the age bracket of 20 to 34 years have the highest fertility rate with 97.0 births per 1,000 women. Women in the age bracket of 20 to 34 years acount for 100.0% of all women with births.
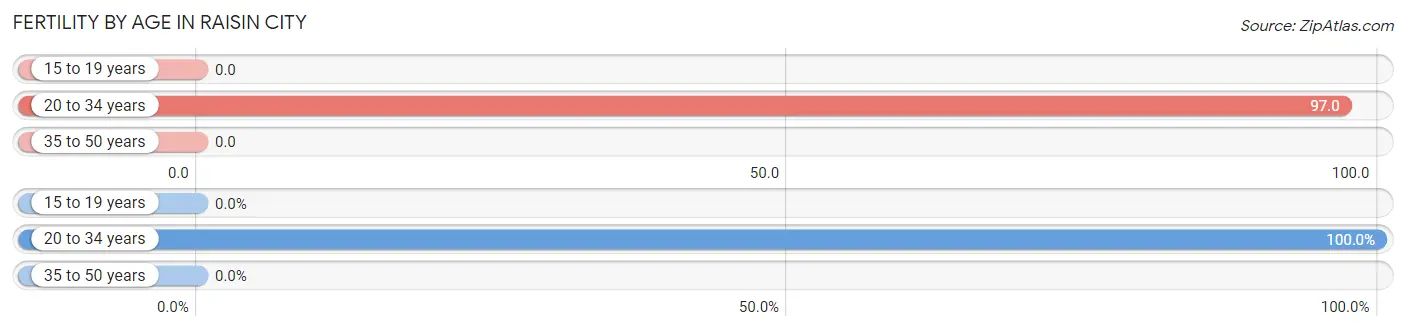
| Age Bracket | Women with Births | Births / 1,000 Women |
| 15 to 19 years | 0 (0.0%) | 0.0 |
| 20 to 34 years | 3 (100.0%) | 97.0 |
| 35 to 50 years | 0 (0.0%) | 0.0 |
| Total | 3 (100.0%) | 57.0 |
Fertility by Age by Marriage Status in Raisin City
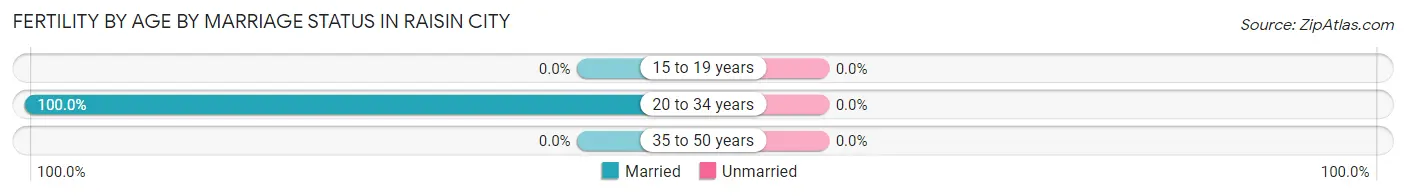
| Age Bracket | Married | Unmarried |
| 15 to 19 years | 0 (0.0%) | 0 (0.0%) |
| 20 to 34 years | 3 (100.0%) | 0 (0.0%) |
| 35 to 50 years | 0 (0.0%) | 0 (0.0%) |
| Total | 3 (100.0%) | 0 (0.0%) |
Fertility by Education in Raisin City
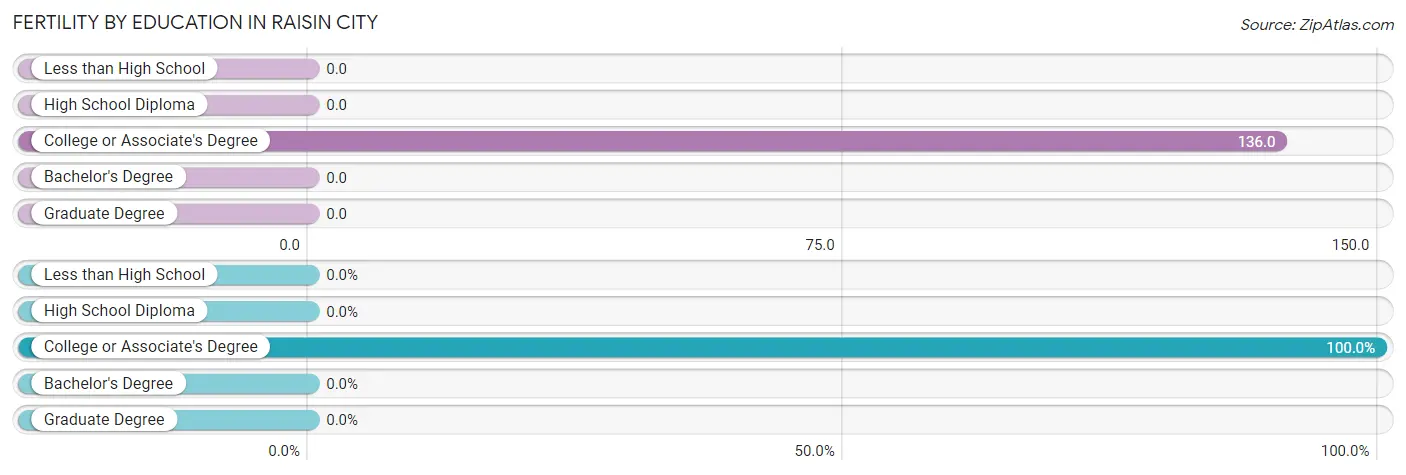
| Educational Attainment | Women with Births | Births / 1,000 Women |
| Less than High School | 0 (0.0%) | 0.0 |
| High School Diploma | 0 (0.0%) | 0.0 |
| College or Associate's Degree | 3 (100.0%) | 136.0 |
| Bachelor's Degree | 0 (0.0%) | 0.0 |
| Graduate Degree | 0 (0.0%) | 0.0 |
| Total | 3 (100.0%) | 57.0 |
Fertility by Education by Marriage Status in Raisin City
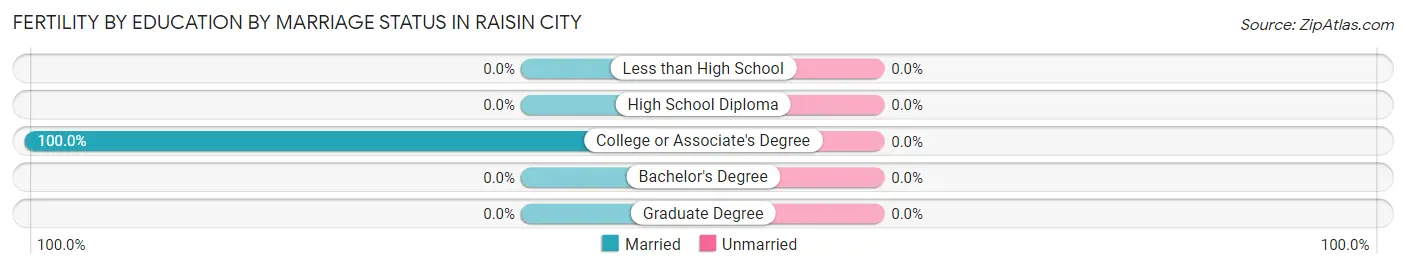
| Educational Attainment | Married | Unmarried |
| Less than High School | 0 (0.0%) | 0 (0.0%) |
| High School Diploma | 0 (0.0%) | 0 (0.0%) |
| College or Associate's Degree | 3 (100.0%) | 0 (0.0%) |
| Bachelor's Degree | 0 (0.0%) | 0 (0.0%) |
| Graduate Degree | 0 (0.0%) | 0 (0.0%) |
| Total | 3 (100.0%) | 0 (0.0%) |
Employment Characteristics in Raisin City
Employment by Class of Employer in Raisin City
Among the 89 employed individuals in Raisin City, private company employees (60 | 67.4%), local government employees (14 | 15.7%), and self-employed (not incorporated) (7 | 7.9%) make up the most common classes of employment.
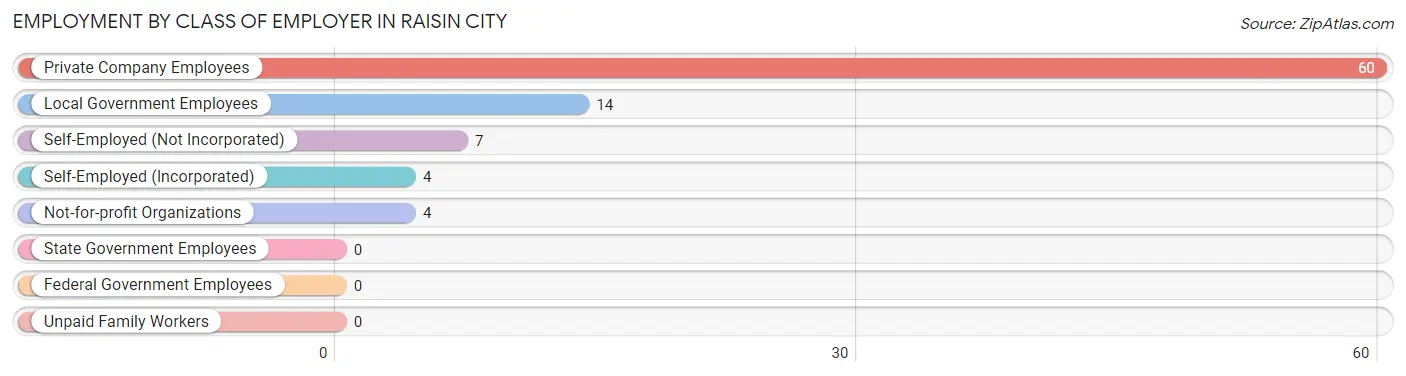
| Employer Class | # Employees | % Employees |
| Private Company Employees | 60 | 67.4% |
| Self-Employed (Incorporated) | 4 | 4.5% |
| Self-Employed (Not Incorporated) | 7 | 7.9% |
| Not-for-profit Organizations | 4 | 4.5% |
| Local Government Employees | 14 | 15.7% |
| State Government Employees | 0 | 0.0% |
| Federal Government Employees | 0 | 0.0% |
| Unpaid Family Workers | 0 | 0.0% |
| Total | 89 | 100.0% |
Employment Status by Age in Raisin City
According to the labor force statistics for Raisin City, out of the total population over 16 years of age (222), 59.9% or 133 individuals are in the labor force, with 33.1% or 44 of them unemployed. The age group with the highest labor force participation rate is 30 to 34 years, with 100.0% or 7 individuals in the labor force. Within the labor force, the 60 to 64 years age range has the highest percentage of unemployed individuals, with 100.0% or 3 of them being unemployed.
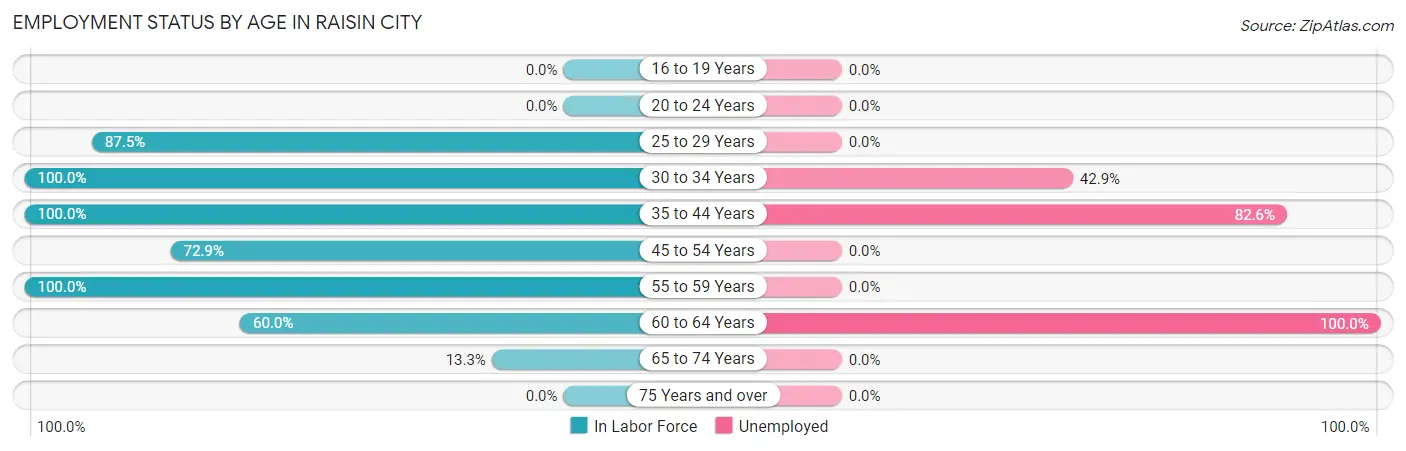
| Age Bracket | In Labor Force | Unemployed |
| 16 to 19 Years | 0 (0.0%) | 0 (0.0%) |
| 20 to 24 Years | 0 (0.0%) | 0 (0.0%) |
| 25 to 29 Years | 28 (87.5%) | 0 (0.0%) |
| 30 to 34 Years | 7 (100.0%) | 3 (42.9%) |
| 35 to 44 Years | 46 (100.0%) | 38 (82.6%) |
| 45 to 54 Years | 35 (72.9%) | 0 (0.0%) |
| 55 to 59 Years | 10 (100.0%) | 0 (0.0%) |
| 60 to 64 Years | 3 (60.0%) | 3 (100.0%) |
| 65 to 74 Years | 4 (13.3%) | 0 (0.0%) |
| 75 Years and over | 0 (0.0%) | 0 (0.0%) |
| Total | 133 (59.9%) | 44 (33.1%) |
Employment Status by Educational Attainment in Raisin City
According to labor force statistics for Raisin City, 87.2% of individuals (129) out of the total population between 25 and 64 years of age (148) are in the labor force, with 34.1% or 44 of them being unemployed. The group with the highest labor force participation rate are those with the educational attainment of college / associate degree, with 100.0% or 35 individuals in the labor force. Within the labor force, individuals with high school diploma education have the highest percentage of unemployment, with 70.4% or 19 of them being unemployed.
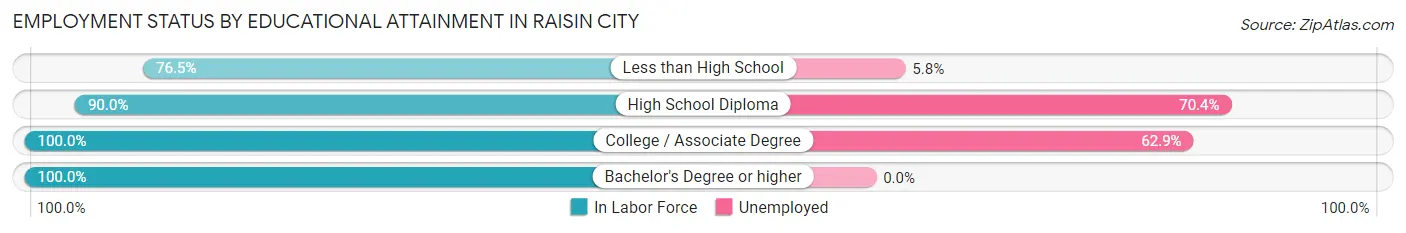
| Educational Attainment | In Labor Force | Unemployed |
| Less than High School | 52 (76.5%) | 4 (5.8%) |
| High School Diploma | 27 (90.0%) | 21 (70.4%) |
| College / Associate Degree | 35 (100.0%) | 22 (62.9%) |
| Bachelor's Degree or higher | 15 (100.0%) | 0 (0.0%) |
| Total | 129 (87.2%) | 50 (34.1%) |
Employment Occupations by Sex in Raisin City
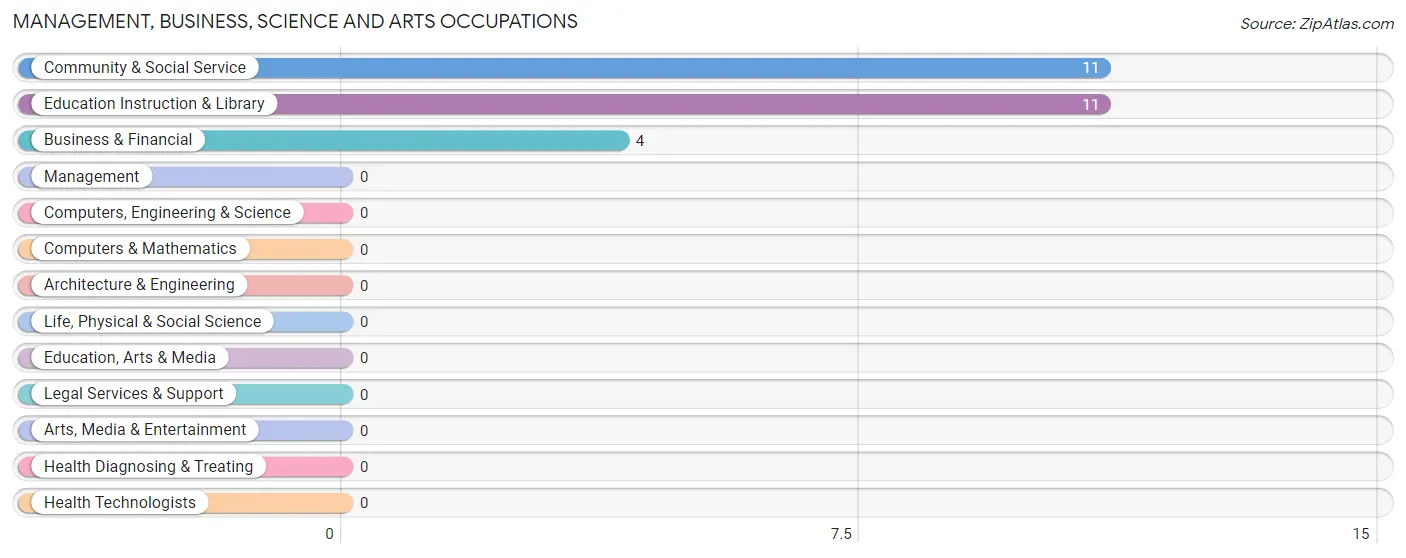
Management, Business, Science and Arts Occupations
The most common Management, Business, Science and Arts occupations in Raisin City are Community & Social Service (11 | 12.4%), Education Instruction & Library (11 | 12.4%), and Business & Financial (4 | 4.5%).
Management, Business, Science and Arts Occupations by Sex
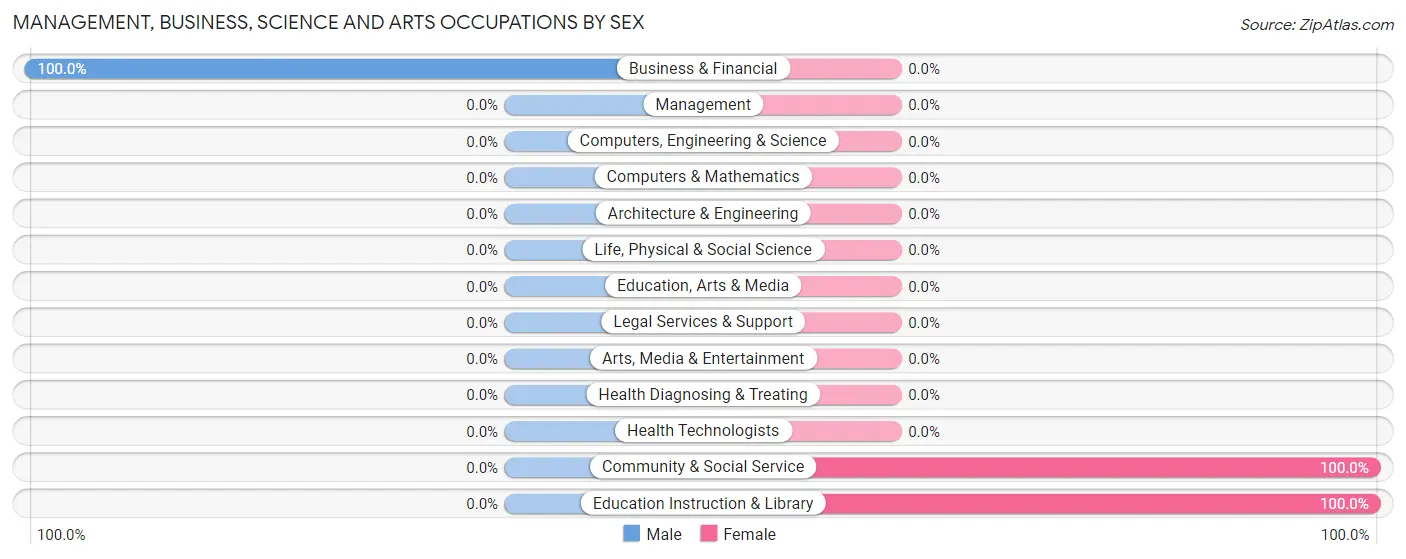
| Occupation | Male | Female |
| Management | 0 (0.0%) | 0 (0.0%) |
| Business & Financial | 4 (100.0%) | 0 (0.0%) |
| Computers, Engineering & Science | 0 (0.0%) | 0 (0.0%) |
| Computers & Mathematics | 0 (0.0%) | 0 (0.0%) |
| Architecture & Engineering | 0 (0.0%) | 0 (0.0%) |
| Life, Physical & Social Science | 0 (0.0%) | 0 (0.0%) |
| Community & Social Service | 0 (0.0%) | 11 (100.0%) |
| Education, Arts & Media | 0 (0.0%) | 0 (0.0%) |
| Legal Services & Support | 0 (0.0%) | 0 (0.0%) |
| Education Instruction & Library | 0 (0.0%) | 11 (100.0%) |
| Arts, Media & Entertainment | 0 (0.0%) | 0 (0.0%) |
| Health Diagnosing & Treating | 0 (0.0%) | 0 (0.0%) |
| Health Technologists | 0 (0.0%) | 0 (0.0%) |
| Total (Category) | 4 (26.7%) | 11 (73.3%) |
| Total (Overall) | 61 (68.5%) | 28 (31.5%) |
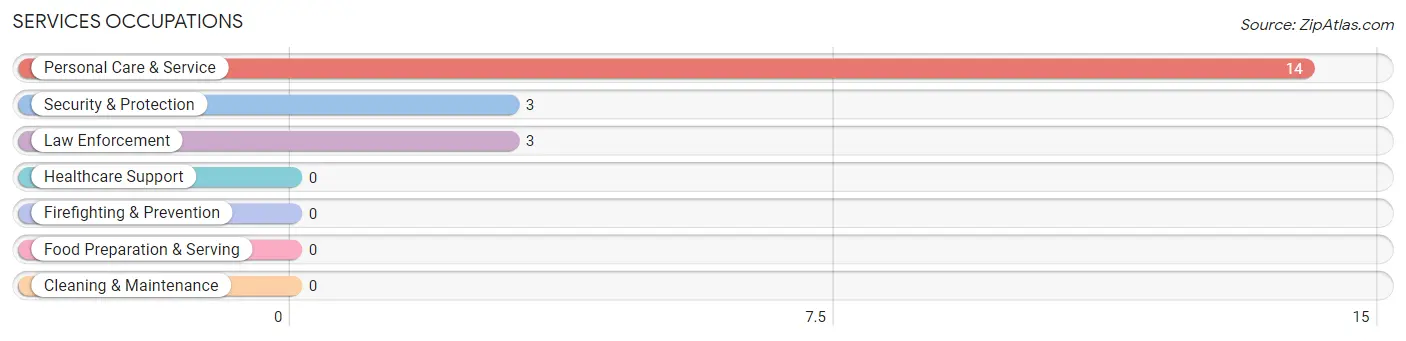
Services Occupations
The most common Services occupations in Raisin City are Personal Care & Service (14 | 15.7%), Security & Protection (3 | 3.4%), and Law Enforcement (3 | 3.4%).
Services Occupations by Sex
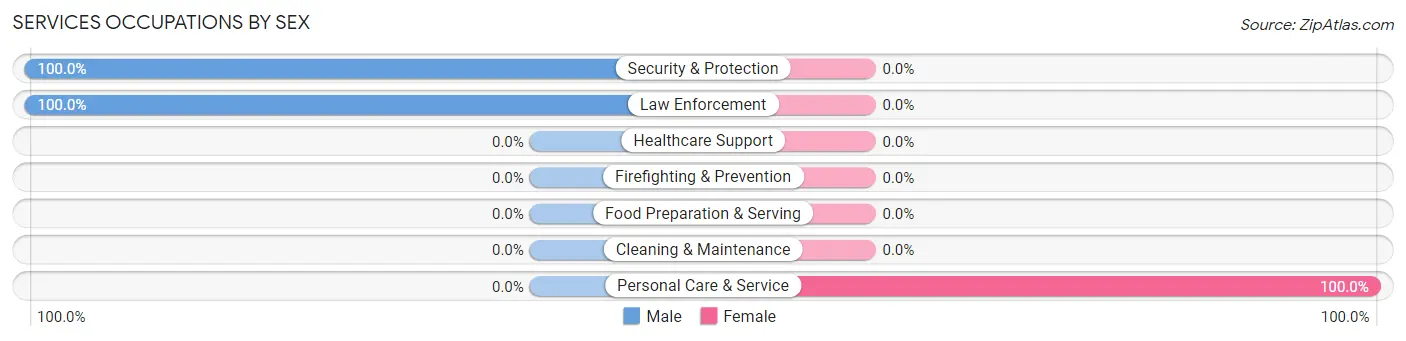
| Occupation | Male | Female |
| Healthcare Support | 0 (0.0%) | 0 (0.0%) |
| Security & Protection | 3 (100.0%) | 0 (0.0%) |
| Firefighting & Prevention | 0 (0.0%) | 0 (0.0%) |
| Law Enforcement | 3 (100.0%) | 0 (0.0%) |
| Food Preparation & Serving | 0 (0.0%) | 0 (0.0%) |
| Cleaning & Maintenance | 0 (0.0%) | 0 (0.0%) |
| Personal Care & Service | 0 (0.0%) | 14 (100.0%) |
| Total (Category) | 3 (17.6%) | 14 (82.4%) |
| Total (Overall) | 61 (68.5%) | 28 (31.5%) |
Sales and Office Occupations
The most common Sales and Office occupations in Raisin City are Sales & Related (13 | 14.6%), and Office & Administration (4 | 4.5%).
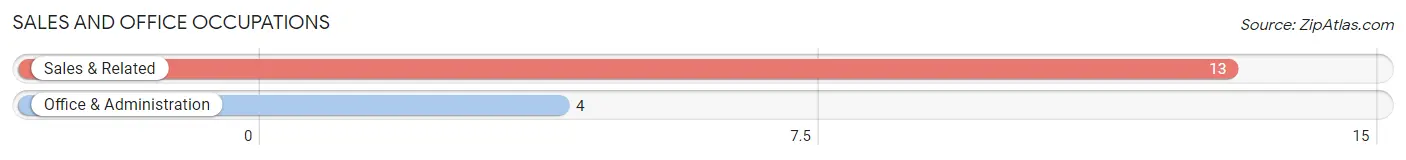
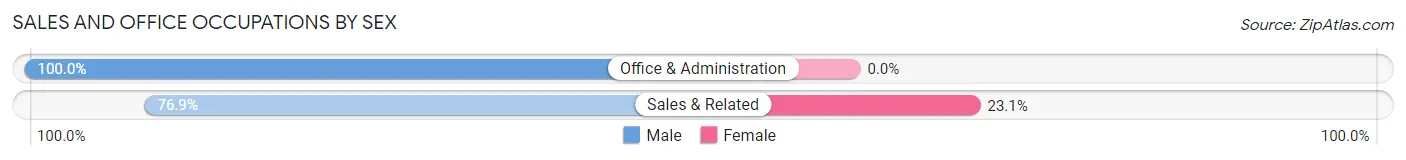
Sales and Office Occupations by Sex
| Occupation | Male | Female |
| Sales & Related | 10 (76.9%) | 3 (23.1%) |
| Office & Administration | 4 (100.0%) | 0 (0.0%) |
| Total (Category) | 14 (82.4%) | 3 (17.6%) |
| Total (Overall) | 61 (68.5%) | 28 (31.5%) |
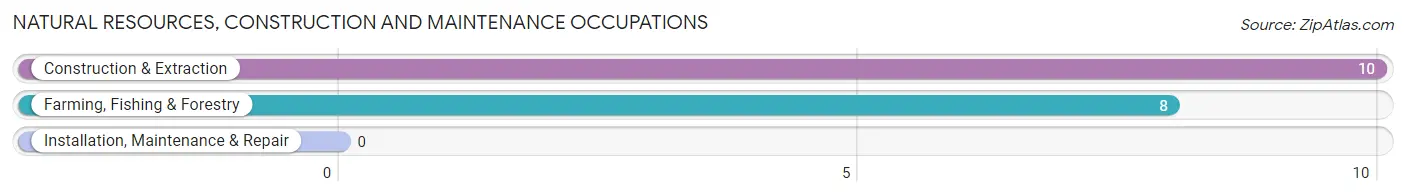
Natural Resources, Construction and Maintenance Occupations
The most common Natural Resources, Construction and Maintenance occupations in Raisin City are Construction & Extraction (10 | 11.2%), and Farming, Fishing & Forestry (8 | 9.0%).
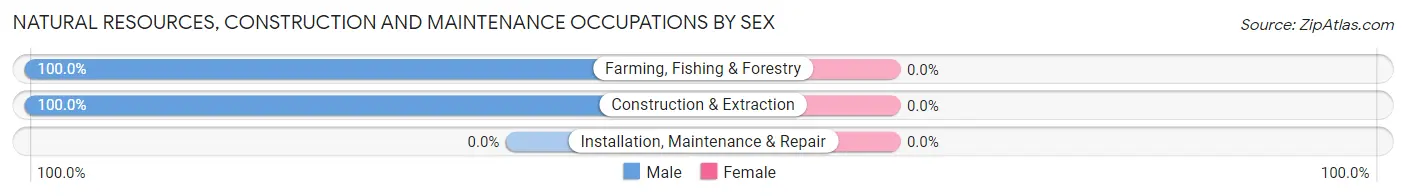
Natural Resources, Construction and Maintenance Occupations by Sex
| Occupation | Male | Female |
| Farming, Fishing & Forestry | 8 (100.0%) | 0 (0.0%) |
| Construction & Extraction | 10 (100.0%) | 0 (0.0%) |
| Installation, Maintenance & Repair | 0 (0.0%) | 0 (0.0%) |
| Total (Category) | 18 (100.0%) | 0 (0.0%) |
| Total (Overall) | 61 (68.5%) | 28 (31.5%) |
Production, Transportation and Moving Occupations
The most common Production, Transportation and Moving occupations in Raisin City are , and Material Moving (22 | 24.7%).
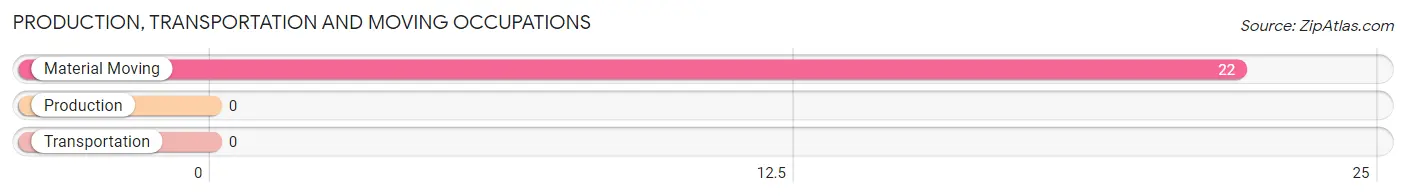
Production, Transportation and Moving Occupations by Sex
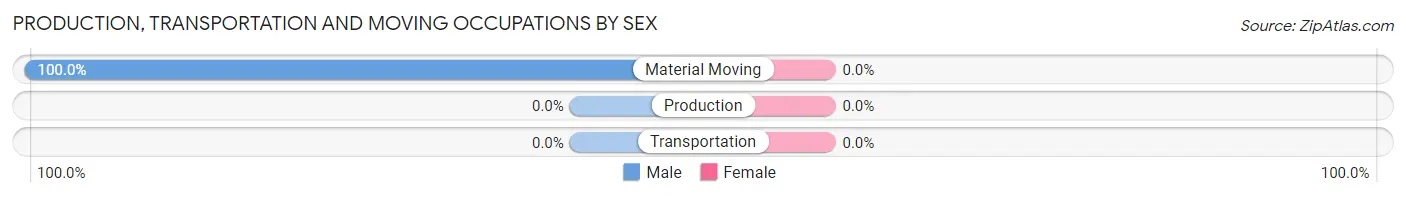
| Occupation | Male | Female |
| Production | 0 (0.0%) | 0 (0.0%) |
| Transportation | 0 (0.0%) | 0 (0.0%) |
| Material Moving | 22 (100.0%) | 0 (0.0%) |
| Total (Category) | 22 (100.0%) | 0 (0.0%) |
| Total (Overall) | 61 (68.5%) | 28 (31.5%) |
Employment Industries by Sex in Raisin City
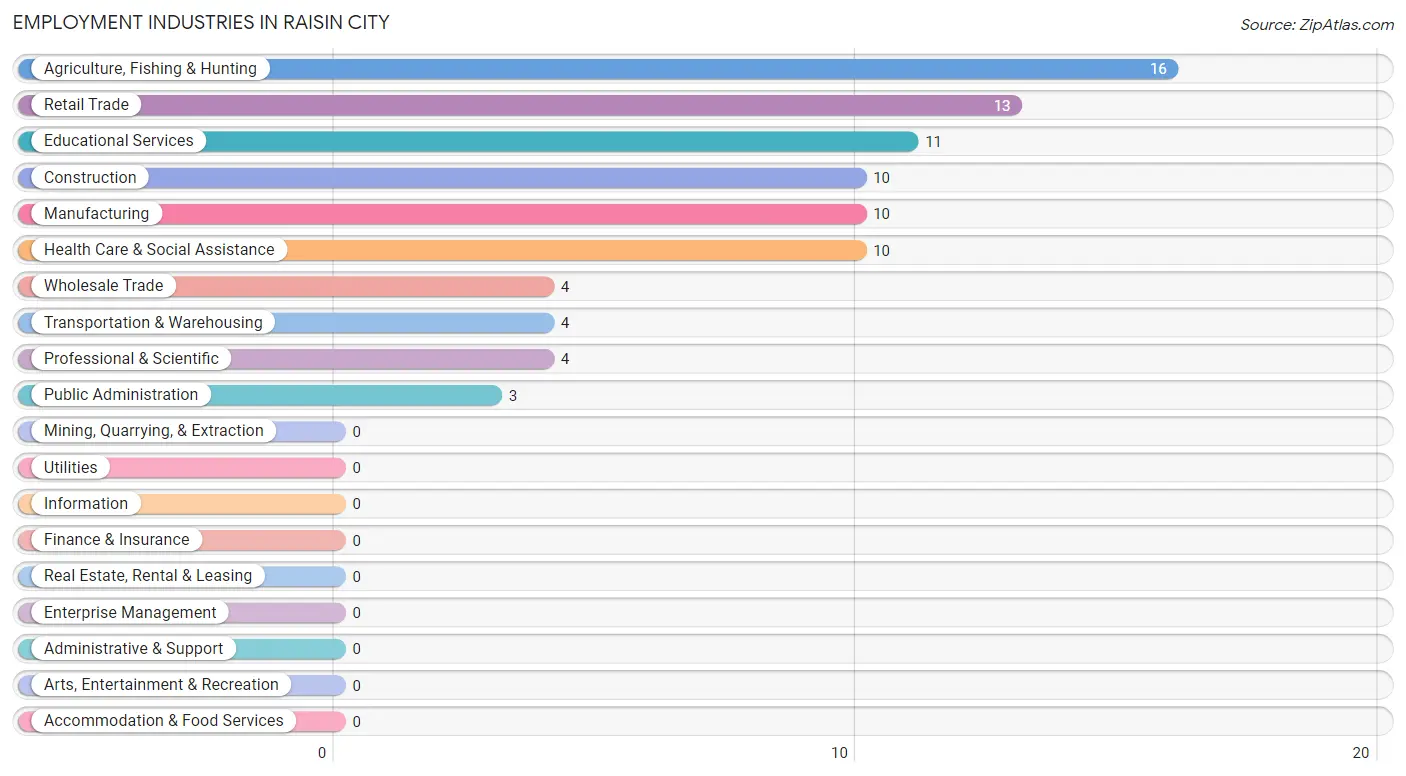
Employment Industries in Raisin City
The major employment industries in Raisin City include Agriculture, Fishing & Hunting (16 | 18.0%), Retail Trade (13 | 14.6%), Educational Services (11 | 12.4%), Construction (10 | 11.2%), and Manufacturing (10 | 11.2%).
Employment Industries by Sex in Raisin City
The Raisin City industries that see more men than women are Agriculture, Fishing & Hunting (100.0%), Construction (100.0%), and Manufacturing (100.0%), whereas the industries that tend to have a higher number of women are Educational Services (100.0%), Health Care & Social Assistance (100.0%), and Retail Trade (23.1%).
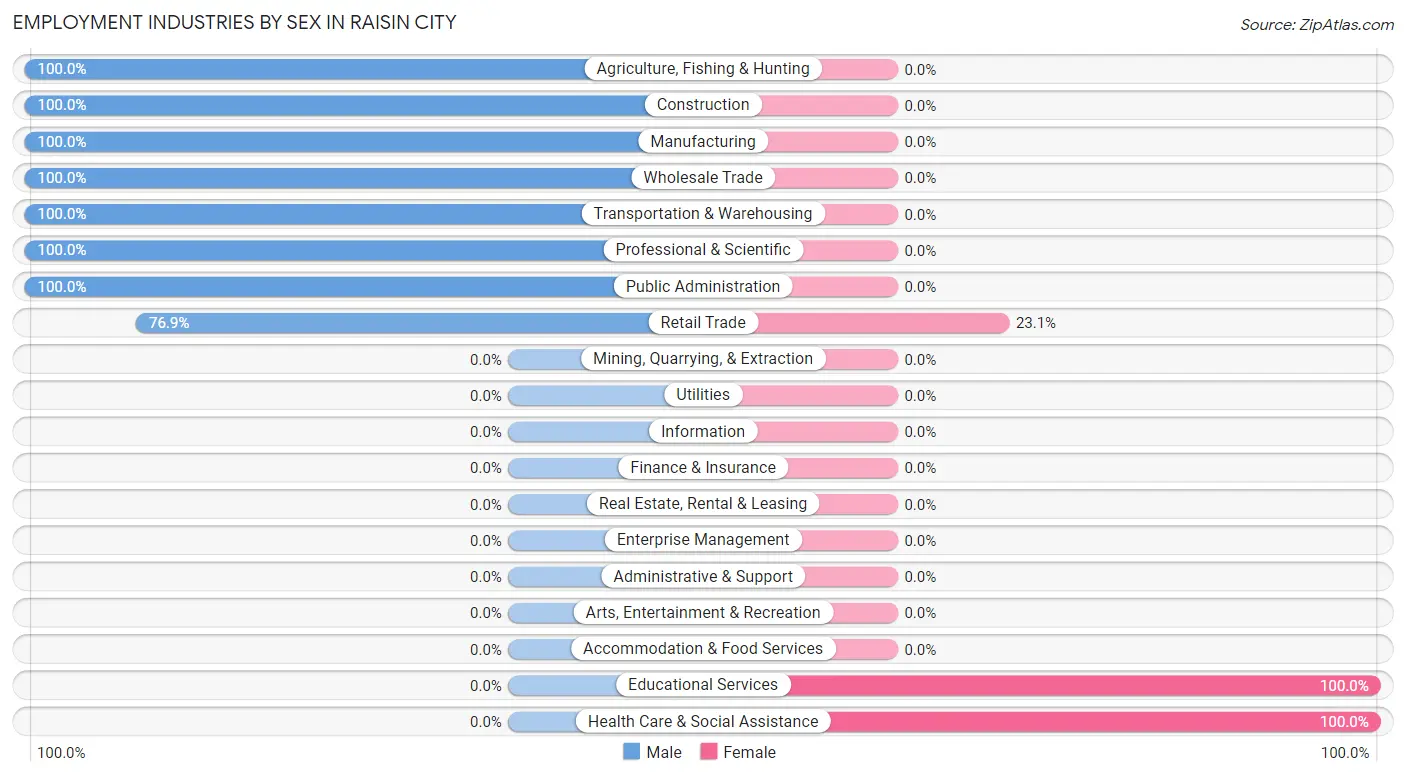
| Industry | Male | Female |
| Agriculture, Fishing & Hunting | 16 (100.0%) | 0 (0.0%) |
| Mining, Quarrying, & Extraction | 0 (0.0%) | 0 (0.0%) |
| Construction | 10 (100.0%) | 0 (0.0%) |
| Manufacturing | 10 (100.0%) | 0 (0.0%) |
| Wholesale Trade | 4 (100.0%) | 0 (0.0%) |
| Retail Trade | 10 (76.9%) | 3 (23.1%) |
| Transportation & Warehousing | 4 (100.0%) | 0 (0.0%) |
| Utilities | 0 (0.0%) | 0 (0.0%) |
| Information | 0 (0.0%) | 0 (0.0%) |
| Finance & Insurance | 0 (0.0%) | 0 (0.0%) |
| Real Estate, Rental & Leasing | 0 (0.0%) | 0 (0.0%) |
| Professional & Scientific | 4 (100.0%) | 0 (0.0%) |
| Enterprise Management | 0 (0.0%) | 0 (0.0%) |
| Administrative & Support | 0 (0.0%) | 0 (0.0%) |
| Educational Services | 0 (0.0%) | 11 (100.0%) |
| Health Care & Social Assistance | 0 (0.0%) | 10 (100.0%) |
| Arts, Entertainment & Recreation | 0 (0.0%) | 0 (0.0%) |
| Accommodation & Food Services | 0 (0.0%) | 0 (0.0%) |
| Public Administration | 3 (100.0%) | 0 (0.0%) |
| Total | 61 (68.5%) | 28 (31.5%) |
Education in Raisin City
School Enrollment in Raisin City
The most common levels of schooling among the 44 students in Raisin City are middle school (13 | 29.5%), college / undergraduate (12 | 27.3%), and elementary school (7 | 15.9%).
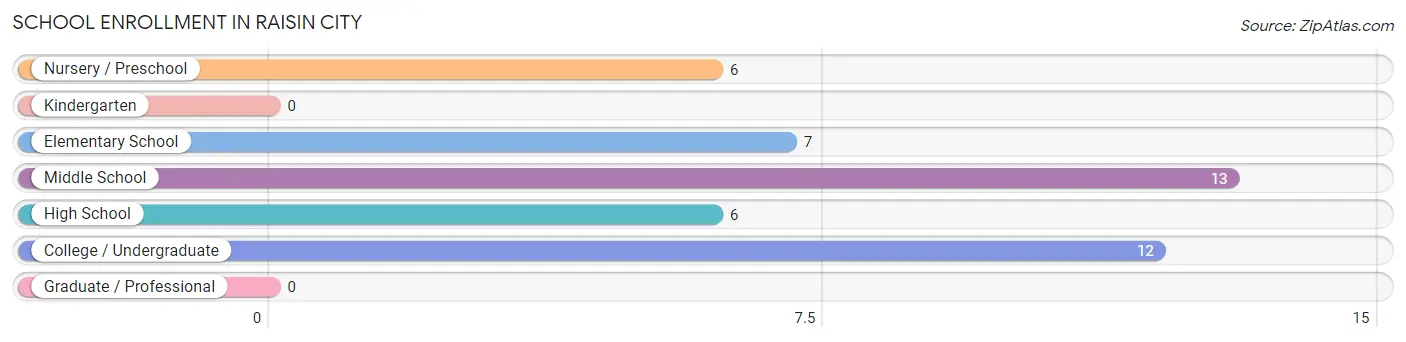
| School Level | # Students | % Students |
| Nursery / Preschool | 6 | 13.6% |
| Kindergarten | 0 | 0.0% |
| Elementary School | 7 | 15.9% |
| Middle School | 13 | 29.5% |
| High School | 6 | 13.6% |
| College / Undergraduate | 12 | 27.3% |
| Graduate / Professional | 0 | 0.0% |
| Total | 44 | 100.0% |
School Enrollment by Age by Funding Source in Raisin City
Out of a total of 44 students who are enrolled in schools in Raisin City, 4 (9.1%) attend a private institution, while the remaining 40 (90.9%) are enrolled in public schools. The age group of 10 to 14 year olds has the highest likelihood of being enrolled in private schools, with 4 (25.0% in the age bracket) enrolled. Conversely, the age group of 3 to 4 year olds has the lowest likelihood of being enrolled in a private school, with 6 (100.0% in the age bracket) attending a public institution.
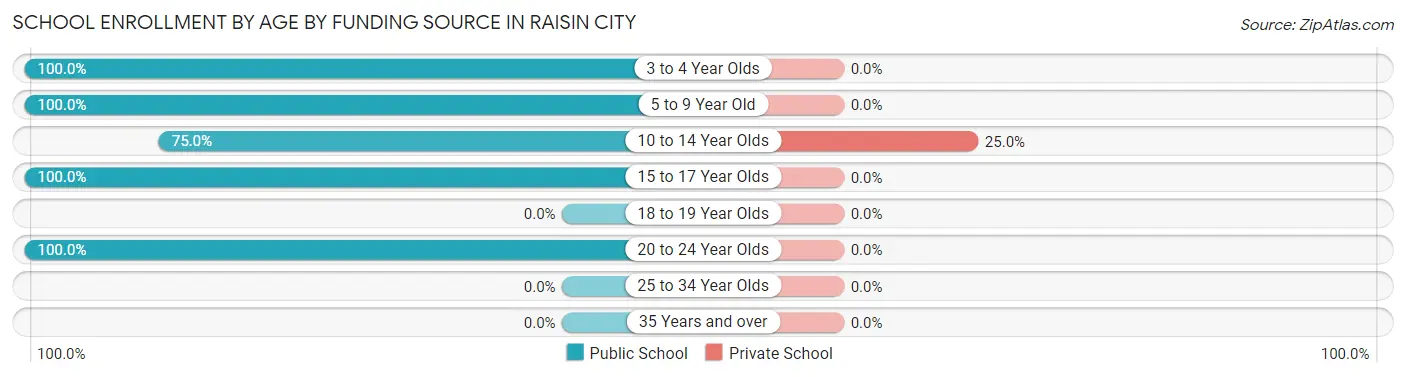
| Age Bracket | Public School | Private School |
| 3 to 4 Year Olds | 6 (100.0%) | 0 (0.0%) |
| 5 to 9 Year Old | 7 (100.0%) | 0 (0.0%) |
| 10 to 14 Year Olds | 12 (75.0%) | 4 (25.0%) |
| 15 to 17 Year Olds | 3 (100.0%) | 0 (0.0%) |
| 18 to 19 Year Olds | 0 (0.0%) | 0 (0.0%) |
| 20 to 24 Year Olds | 12 (100.0%) | 0 (0.0%) |
| 25 to 34 Year Olds | 0 (0.0%) | 0 (0.0%) |
| 35 Years and over | 0 (0.0%) | 0 (0.0%) |
| Total | 40 (90.9%) | 4 (9.1%) |
Educational Attainment by Field of Study in Raisin City
Education (11 | 73.3%), and communications (4 | 26.7%) are the most common fields of study among 15 individuals in Raisin City who have obtained a bachelor's degree or higher.
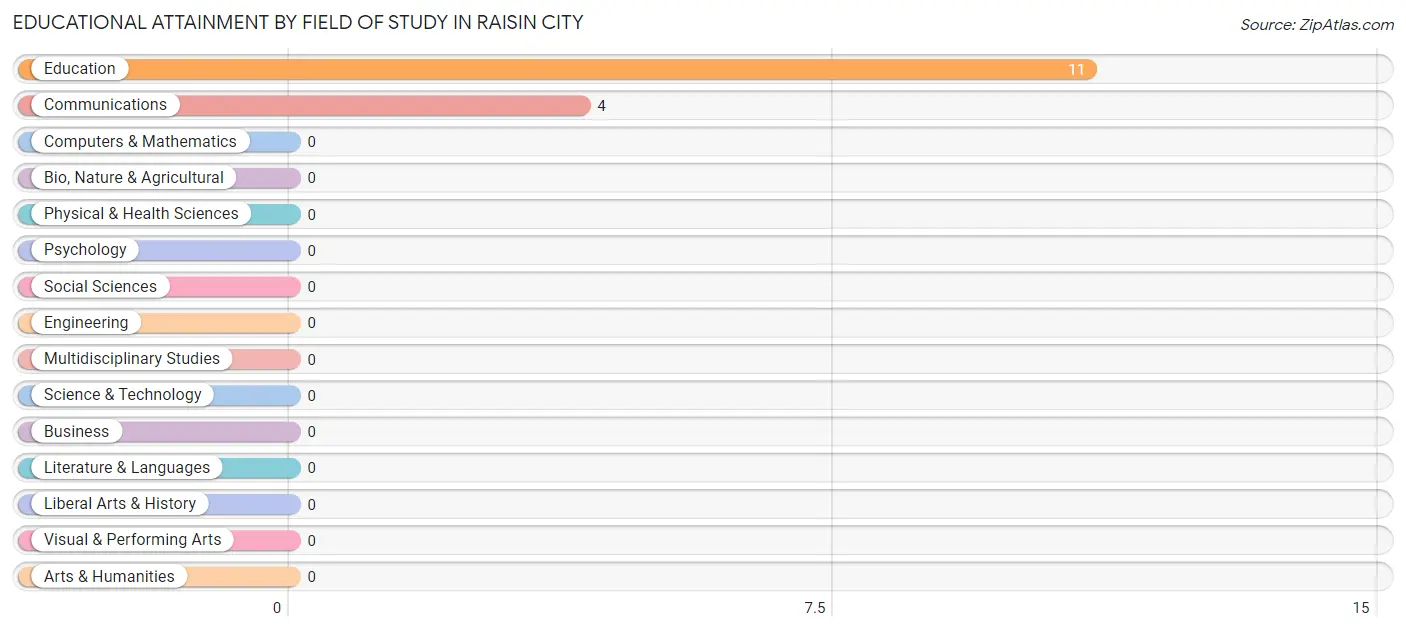
| Field of Study | # Graduates | % Graduates |
| Computers & Mathematics | 0 | 0.0% |
| Bio, Nature & Agricultural | 0 | 0.0% |
| Physical & Health Sciences | 0 | 0.0% |
| Psychology | 0 | 0.0% |
| Social Sciences | 0 | 0.0% |
| Engineering | 0 | 0.0% |
| Multidisciplinary Studies | 0 | 0.0% |
| Science & Technology | 0 | 0.0% |
| Business | 0 | 0.0% |
| Education | 11 | 73.3% |
| Literature & Languages | 0 | 0.0% |
| Liberal Arts & History | 0 | 0.0% |
| Visual & Performing Arts | 0 | 0.0% |
| Communications | 4 | 26.7% |
| Arts & Humanities | 0 | 0.0% |
| Total | 15 | 100.0% |
Transportation & Commute in Raisin City
Vehicle Availability by Sex in Raisin City
The most prevalent vehicle ownership categories in Raisin City are males with 2 vehicles (22, accounting for 36.1%) and females with 2 vehicles (3, making up 78.6%).
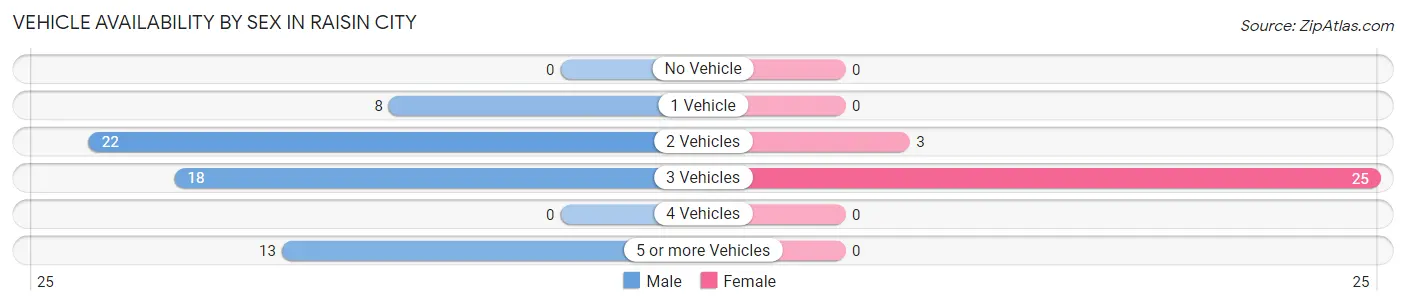
| Vehicles Available | Male | Female |
| No Vehicle | 0 (0.0%) | 0 (0.0%) |
| 1 Vehicle | 8 (13.1%) | 0 (0.0%) |
| 2 Vehicles | 22 (36.1%) | 3 (10.7%) |
| 3 Vehicles | 18 (29.5%) | 25 (89.3%) |
| 4 Vehicles | 0 (0.0%) | 0 (0.0%) |
| 5 or more Vehicles | 13 (21.3%) | 0 (0.0%) |
| Total | 61 (100.0%) | 28 (100.0%) |
Commute Time in Raisin City
The most frequently occuring commute durations in Raisin City are 30 to 34 minutes (27 commuters, 30.3%), 15 to 19 minutes (18 commuters, 20.2%), and 20 to 24 minutes (13 commuters, 14.6%).
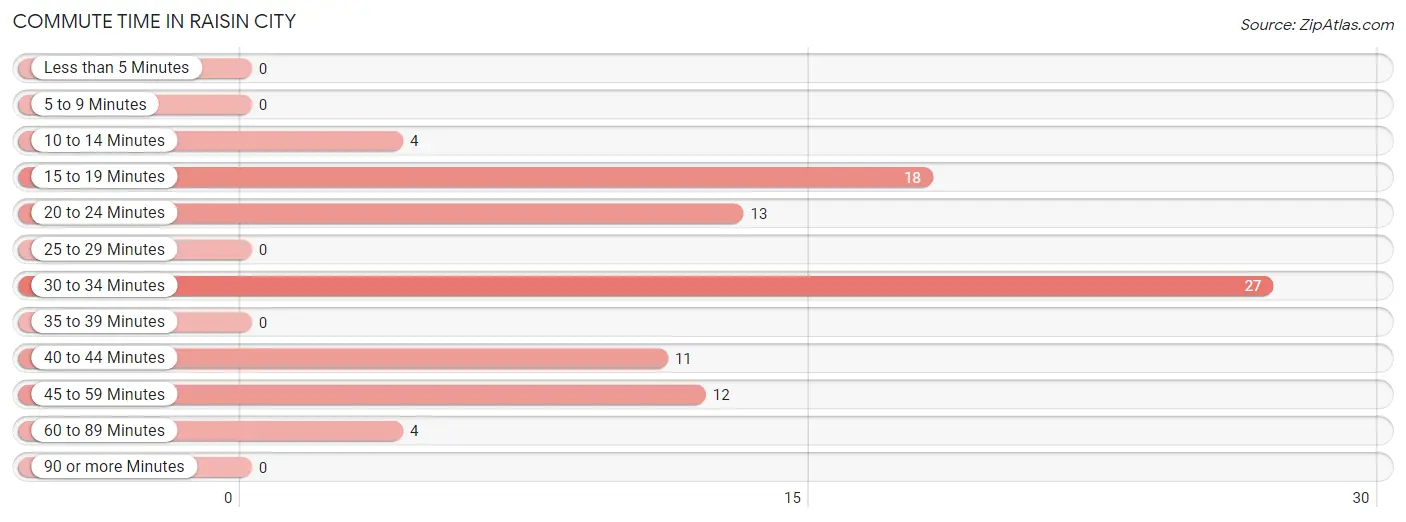
| Commute Time | # Commuters | % Commuters |
| Less than 5 Minutes | 0 | 0.0% |
| 5 to 9 Minutes | 0 | 0.0% |
| 10 to 14 Minutes | 4 | 4.5% |
| 15 to 19 Minutes | 18 | 20.2% |
| 20 to 24 Minutes | 13 | 14.6% |
| 25 to 29 Minutes | 0 | 0.0% |
| 30 to 34 Minutes | 27 | 30.3% |
| 35 to 39 Minutes | 0 | 0.0% |
| 40 to 44 Minutes | 11 | 12.4% |
| 45 to 59 Minutes | 12 | 13.5% |
| 60 to 89 Minutes | 4 | 4.5% |
| 90 or more Minutes | 0 | 0.0% |
Commute Time by Sex in Raisin City
The most common commute times in Raisin City are 15 to 19 minutes (18 commuters, 29.5%) for males and 30 to 34 minutes (14 commuters, 50.0%) for females.
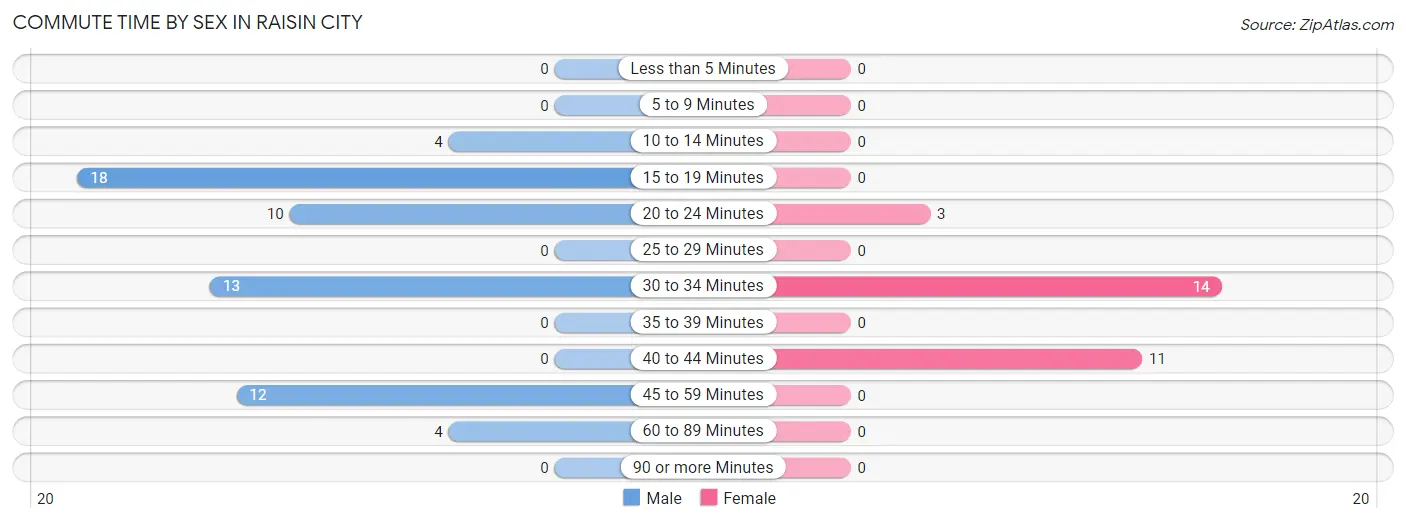
| Commute Time | Male | Female |
| Less than 5 Minutes | 0 (0.0%) | 0 (0.0%) |
| 5 to 9 Minutes | 0 (0.0%) | 0 (0.0%) |
| 10 to 14 Minutes | 4 (6.6%) | 0 (0.0%) |
| 15 to 19 Minutes | 18 (29.5%) | 0 (0.0%) |
| 20 to 24 Minutes | 10 (16.4%) | 3 (10.7%) |
| 25 to 29 Minutes | 0 (0.0%) | 0 (0.0%) |
| 30 to 34 Minutes | 13 (21.3%) | 14 (50.0%) |
| 35 to 39 Minutes | 0 (0.0%) | 0 (0.0%) |
| 40 to 44 Minutes | 0 (0.0%) | 11 (39.3%) |
| 45 to 59 Minutes | 12 (19.7%) | 0 (0.0%) |
| 60 to 89 Minutes | 4 (6.6%) | 0 (0.0%) |
| 90 or more Minutes | 0 (0.0%) | 0 (0.0%) |
Time of Departure to Work by Sex in Raisin City
The most frequent times of departure to work in Raisin City are 5:00 AM to 5:29 AM (27, 44.3%) for males and 8:30 AM to 8:59 AM (15, 53.6%) for females.
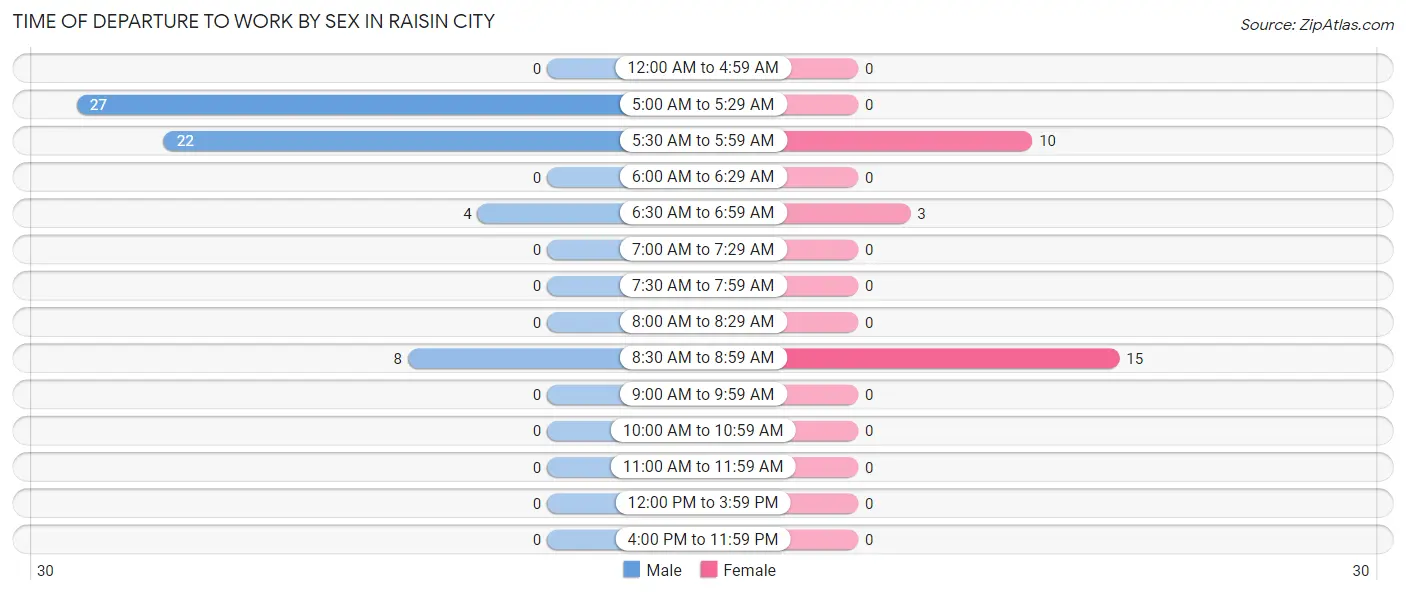
| Time of Departure | Male | Female |
| 12:00 AM to 4:59 AM | 0 (0.0%) | 0 (0.0%) |
| 5:00 AM to 5:29 AM | 27 (44.3%) | 0 (0.0%) |
| 5:30 AM to 5:59 AM | 22 (36.1%) | 10 (35.7%) |
| 6:00 AM to 6:29 AM | 0 (0.0%) | 0 (0.0%) |
| 6:30 AM to 6:59 AM | 4 (6.6%) | 3 (10.7%) |
| 7:00 AM to 7:29 AM | 0 (0.0%) | 0 (0.0%) |
| 7:30 AM to 7:59 AM | 0 (0.0%) | 0 (0.0%) |
| 8:00 AM to 8:29 AM | 0 (0.0%) | 0 (0.0%) |
| 8:30 AM to 8:59 AM | 8 (13.1%) | 15 (53.6%) |
| 9:00 AM to 9:59 AM | 0 (0.0%) | 0 (0.0%) |
| 10:00 AM to 10:59 AM | 0 (0.0%) | 0 (0.0%) |
| 11:00 AM to 11:59 AM | 0 (0.0%) | 0 (0.0%) |
| 12:00 PM to 3:59 PM | 0 (0.0%) | 0 (0.0%) |
| 4:00 PM to 11:59 PM | 0 (0.0%) | 0 (0.0%) |
| Total | 61 (100.0%) | 28 (100.0%) |
Housing Occupancy in Raisin City
Occupancy by Ownership in Raisin City
Of the total 85 dwellings in Raisin City, owner-occupied units account for 62 (72.9%), while renter-occupied units make up 23 (27.1%).
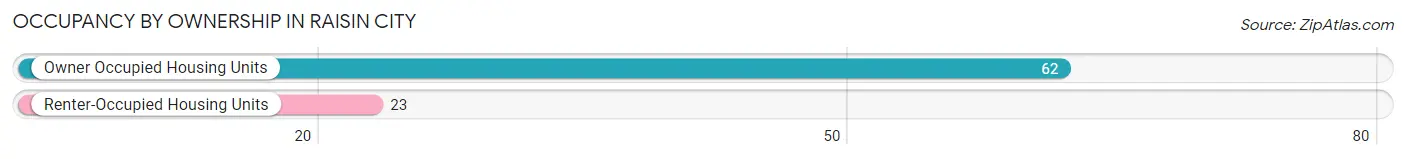
| Occupancy | # Housing Units | % Housing Units |
| Owner Occupied Housing Units | 62 | 72.9% |
| Renter-Occupied Housing Units | 23 | 27.1% |
| Total Occupied Housing Units | 85 | 100.0% |
Occupancy by Household Size in Raisin City
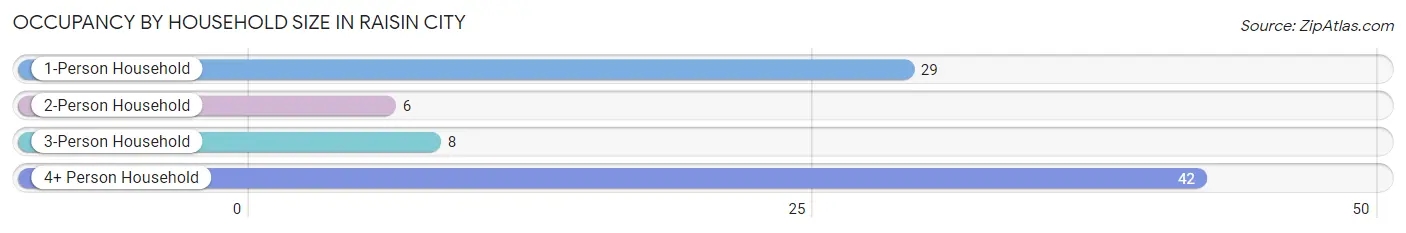
| Household Size | # Housing Units | % Housing Units |
| 1-Person Household | 29 | 34.1% |
| 2-Person Household | 6 | 7.1% |
| 3-Person Household | 8 | 9.4% |
| 4+ Person Household | 42 | 49.4% |
| Total Housing Units | 85 | 100.0% |
Occupancy by Ownership by Household Size in Raisin City
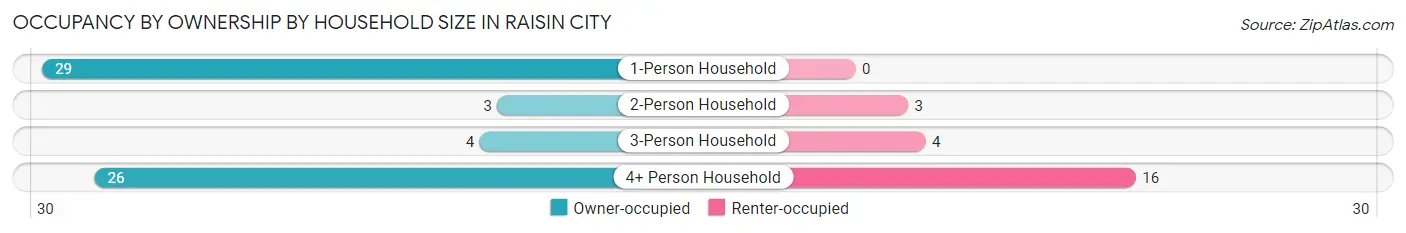
| Household Size | Owner-occupied | Renter-occupied |
| 1-Person Household | 29 (100.0%) | 0 (0.0%) |
| 2-Person Household | 3 (50.0%) | 3 (50.0%) |
| 3-Person Household | 4 (50.0%) | 4 (50.0%) |
| 4+ Person Household | 26 (61.9%) | 16 (38.1%) |
| Total Housing Units | 62 (72.9%) | 23 (27.1%) |
Occupancy by Educational Attainment in Raisin City
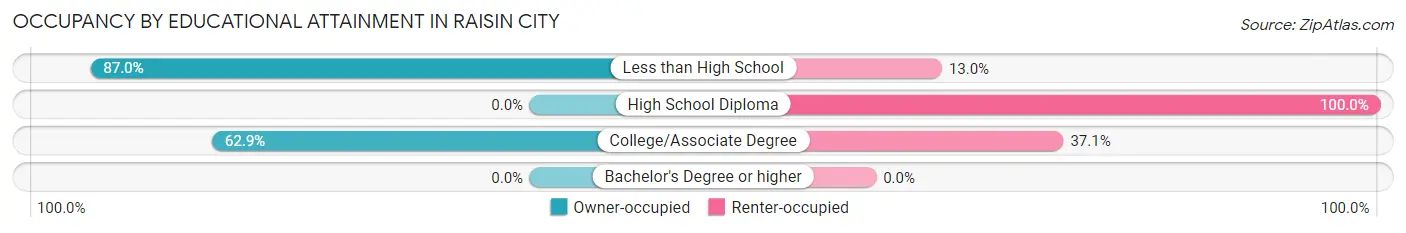
| Household Size | Owner-occupied | Renter-occupied |
| Less than High School | 40 (87.0%) | 6 (13.0%) |
| High School Diploma | 0 (0.0%) | 4 (100.0%) |
| College/Associate Degree | 22 (62.9%) | 13 (37.1%) |
| Bachelor's Degree or higher | 0 (0.0%) | 0 (0.0%) |
Occupancy by Age of Householder in Raisin City
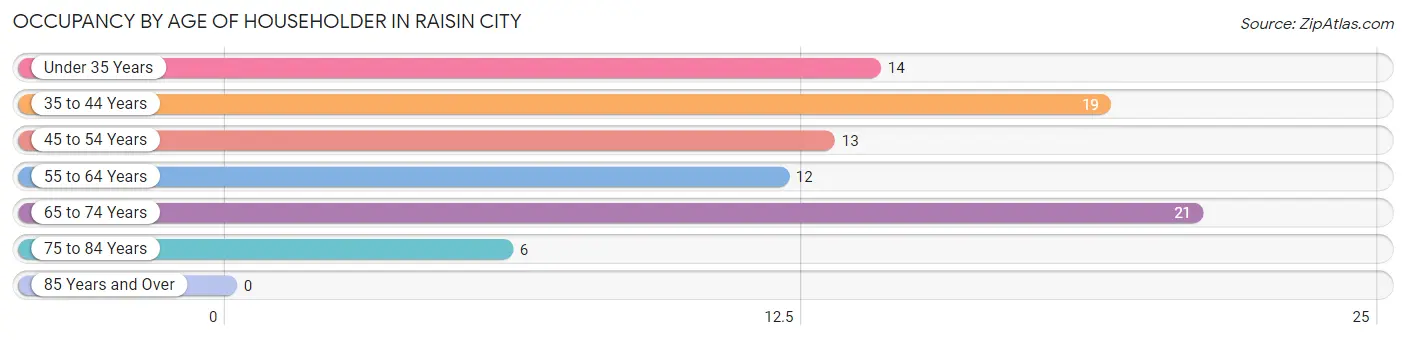
| Age Bracket | # Households | % Households |
| Under 35 Years | 14 | 16.5% |
| 35 to 44 Years | 19 | 22.4% |
| 45 to 54 Years | 13 | 15.3% |
| 55 to 64 Years | 12 | 14.1% |
| 65 to 74 Years | 21 | 24.7% |
| 75 to 84 Years | 6 | 7.1% |
| 85 Years and Over | 0 | 0.0% |
| Total | 85 | 100.0% |
Housing Finances in Raisin City
Median Income by Occupancy in Raisin City
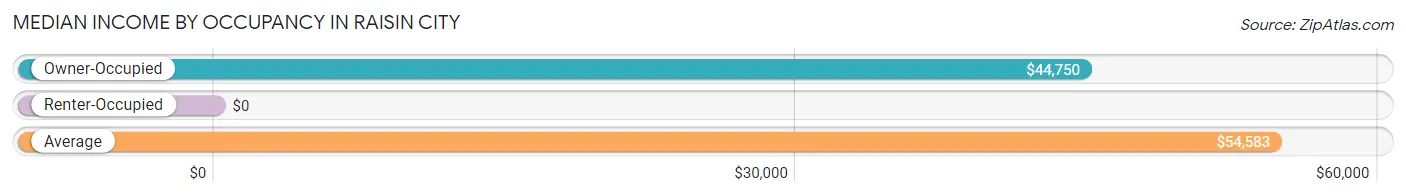
| Occupancy Type | # Households | Median Income |
| Owner-Occupied | 62 (72.9%) | $44,750 |
| Renter-Occupied | 23 (27.1%) | $0 |
| Average | 85 (100.0%) | $54,583 |
Occupancy by Householder Income Bracket in Raisin City
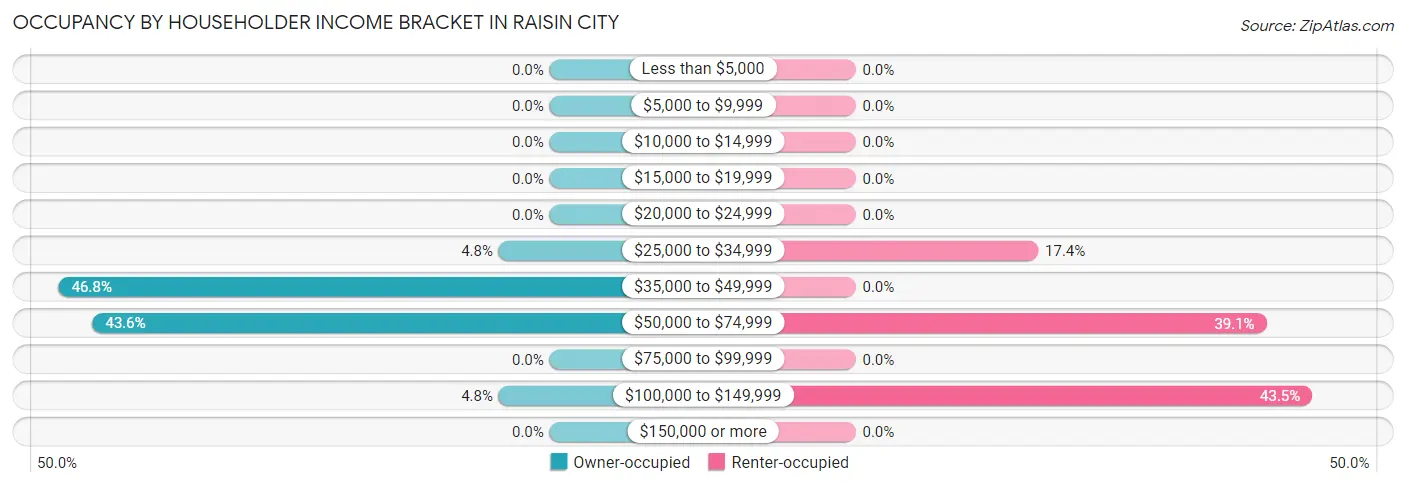
| Income Bracket | Owner-occupied | Renter-occupied |
| Less than $5,000 | 0 (0.0%) | 0 (0.0%) |
| $5,000 to $9,999 | 0 (0.0%) | 0 (0.0%) |
| $10,000 to $14,999 | 0 (0.0%) | 0 (0.0%) |
| $15,000 to $19,999 | 0 (0.0%) | 0 (0.0%) |
| $20,000 to $24,999 | 0 (0.0%) | 0 (0.0%) |
| $25,000 to $34,999 | 3 (4.8%) | 4 (17.4%) |
| $35,000 to $49,999 | 29 (46.8%) | 0 (0.0%) |
| $50,000 to $74,999 | 27 (43.5%) | 9 (39.1%) |
| $75,000 to $99,999 | 0 (0.0%) | 0 (0.0%) |
| $100,000 to $149,999 | 3 (4.8%) | 10 (43.5%) |
| $150,000 or more | 0 (0.0%) | 0 (0.0%) |
| Total | 62 (100.0%) | 23 (100.0%) |
Monthly Housing Cost Tiers in Raisin City
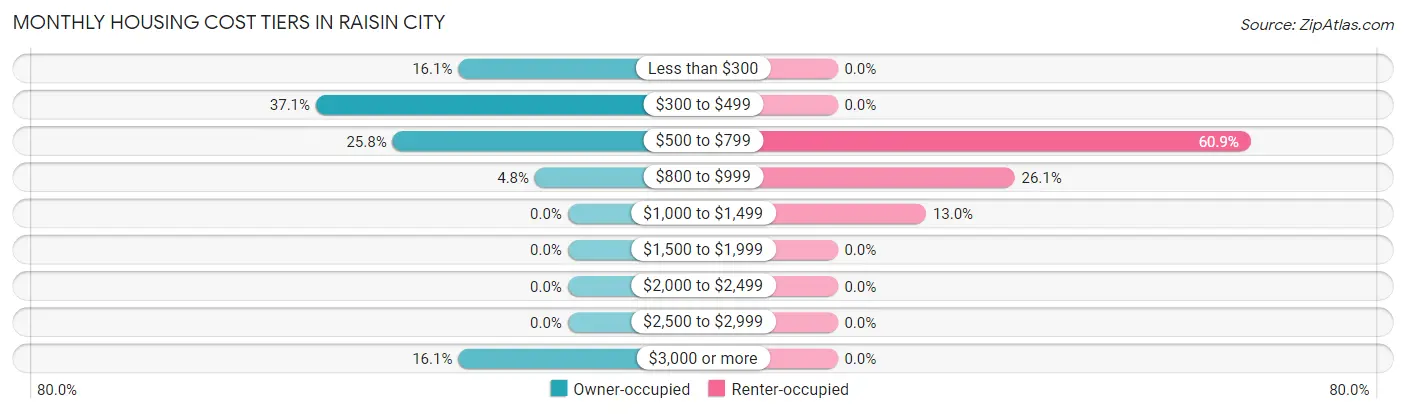
| Monthly Cost | Owner-occupied | Renter-occupied |
| Less than $300 | 10 (16.1%) | 0 (0.0%) |
| $300 to $499 | 23 (37.1%) | 0 (0.0%) |
| $500 to $799 | 16 (25.8%) | 14 (60.9%) |
| $800 to $999 | 3 (4.8%) | 6 (26.1%) |
| $1,000 to $1,499 | 0 (0.0%) | 3 (13.0%) |
| $1,500 to $1,999 | 0 (0.0%) | 0 (0.0%) |
| $2,000 to $2,499 | 0 (0.0%) | 0 (0.0%) |
| $2,500 to $2,999 | 0 (0.0%) | 0 (0.0%) |
| $3,000 or more | 10 (16.1%) | 0 (0.0%) |
| Total | 62 (100.0%) | 23 (100.0%) |
Physical Housing Characteristics in Raisin City
Housing Structures in Raisin City
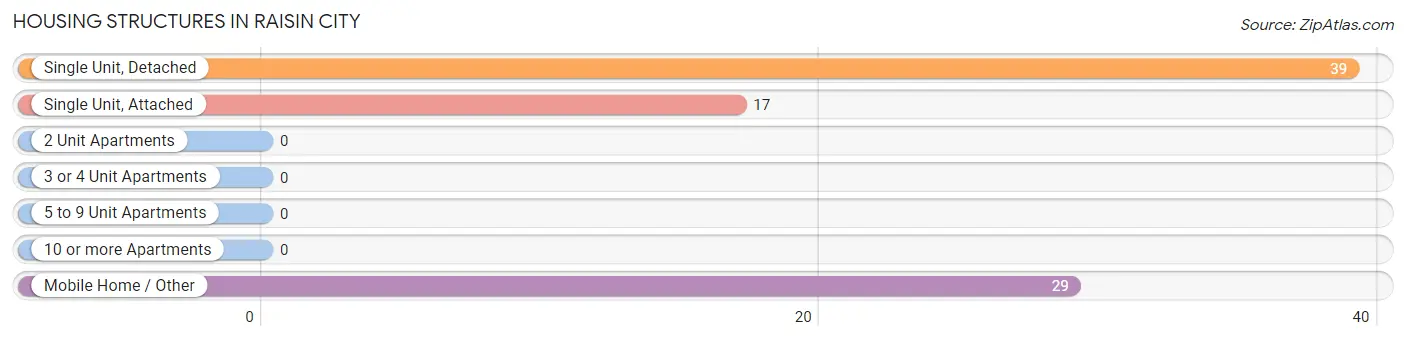
| Structure Type | # Housing Units | % Housing Units |
| Single Unit, Detached | 39 | 45.9% |
| Single Unit, Attached | 17 | 20.0% |
| 2 Unit Apartments | 0 | 0.0% |
| 3 or 4 Unit Apartments | 0 | 0.0% |
| 5 to 9 Unit Apartments | 0 | 0.0% |
| 10 or more Apartments | 0 | 0.0% |
| Mobile Home / Other | 29 | 34.1% |
| Total | 85 | 100.0% |
Housing Structures by Occupancy in Raisin City
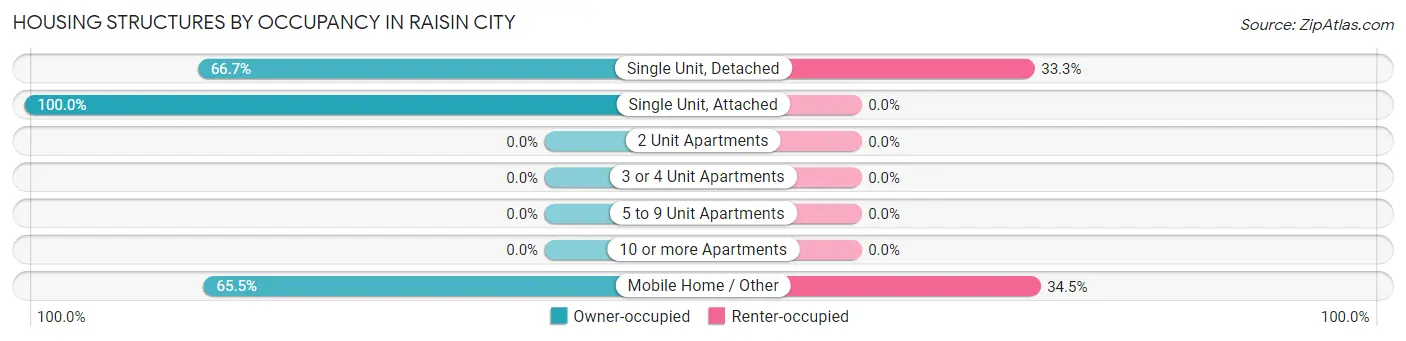
| Structure Type | Owner-occupied | Renter-occupied |
| Single Unit, Detached | 26 (66.7%) | 13 (33.3%) |
| Single Unit, Attached | 17 (100.0%) | 0 (0.0%) |
| 2 Unit Apartments | 0 (0.0%) | 0 (0.0%) |
| 3 or 4 Unit Apartments | 0 (0.0%) | 0 (0.0%) |
| 5 to 9 Unit Apartments | 0 (0.0%) | 0 (0.0%) |
| 10 or more Apartments | 0 (0.0%) | 0 (0.0%) |
| Mobile Home / Other | 19 (65.5%) | 10 (34.5%) |
| Total | 62 (72.9%) | 23 (27.1%) |
Housing Structures by Number of Rooms in Raisin City
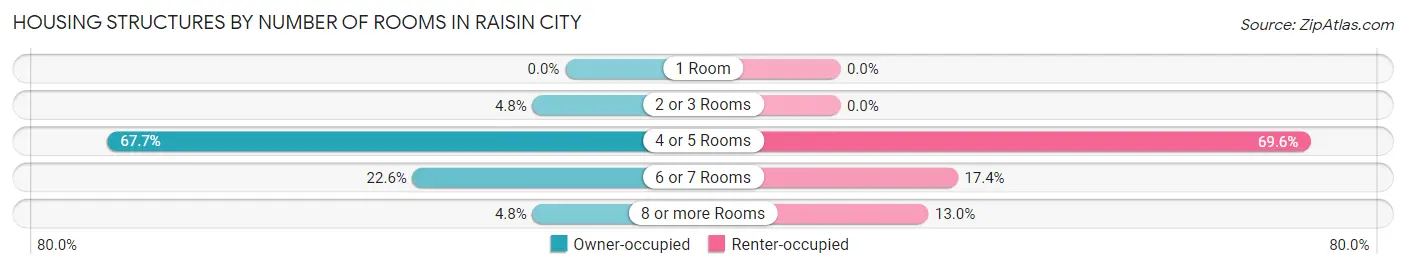
| Number of Rooms | Owner-occupied | Renter-occupied |
| 1 Room | 0 (0.0%) | 0 (0.0%) |
| 2 or 3 Rooms | 3 (4.8%) | 0 (0.0%) |
| 4 or 5 Rooms | 42 (67.7%) | 16 (69.6%) |
| 6 or 7 Rooms | 14 (22.6%) | 4 (17.4%) |
| 8 or more Rooms | 3 (4.8%) | 3 (13.0%) |
| Total | 62 (100.0%) | 23 (100.0%) |
Housing Structure by Heating Type in Raisin City
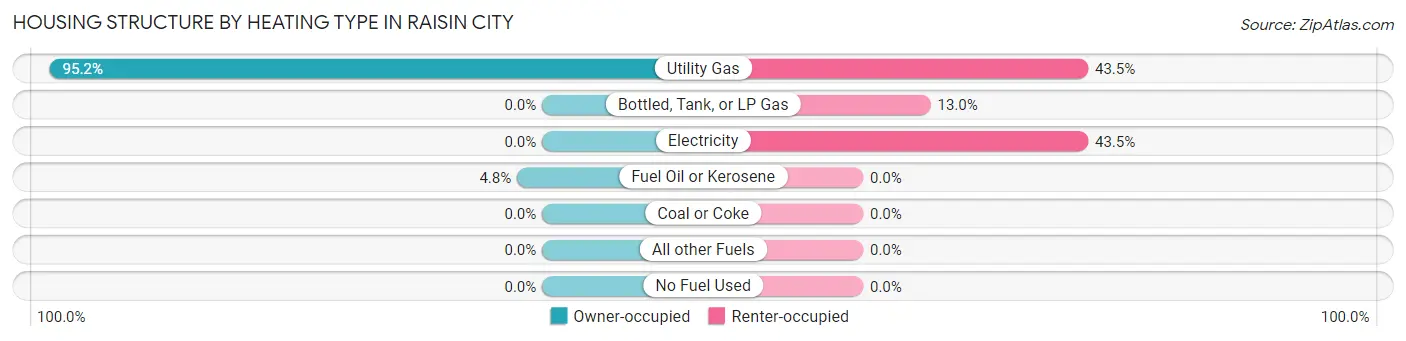
| Heating Type | Owner-occupied | Renter-occupied |
| Utility Gas | 59 (95.2%) | 10 (43.5%) |
| Bottled, Tank, or LP Gas | 0 (0.0%) | 3 (13.0%) |
| Electricity | 0 (0.0%) | 10 (43.5%) |
| Fuel Oil or Kerosene | 3 (4.8%) | 0 (0.0%) |
| Coal or Coke | 0 (0.0%) | 0 (0.0%) |
| All other Fuels | 0 (0.0%) | 0 (0.0%) |
| No Fuel Used | 0 (0.0%) | 0 (0.0%) |
| Total | 62 (100.0%) | 23 (100.0%) |
Household Vehicle Usage in Raisin City
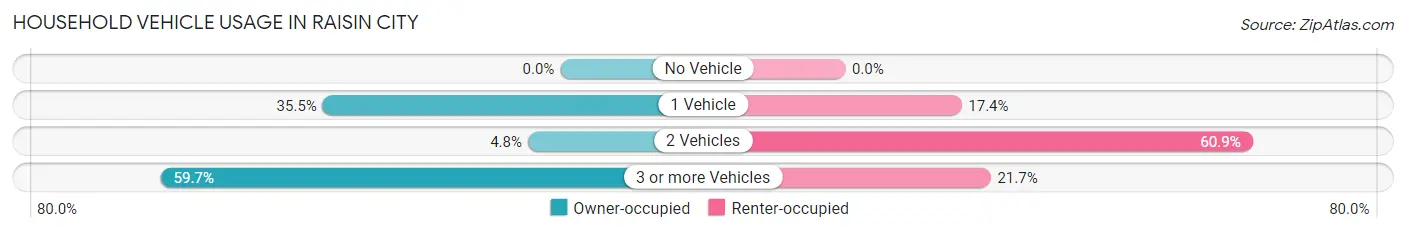
| Vehicles per Household | Owner-occupied | Renter-occupied |
| No Vehicle | 0 (0.0%) | 0 (0.0%) |
| 1 Vehicle | 22 (35.5%) | 4 (17.4%) |
| 2 Vehicles | 3 (4.8%) | 14 (60.9%) |
| 3 or more Vehicles | 37 (59.7%) | 5 (21.7%) |
| Total | 62 (100.0%) | 23 (100.0%) |
Real Estate & Mortgages in Raisin City
Real Estate and Mortgage Overview in Raisin City
| Characteristic | Without Mortgage | With Mortgage |
| Housing Units | 52 | 10 |
| Median Property Value | - | - |
| Median Household Income | $43,500 | $0 |
| Monthly Housing Costs | $385 | $10 |
| Real Estate Taxes | $1,096 | $0 |
Property Value by Mortgage Status in Raisin City
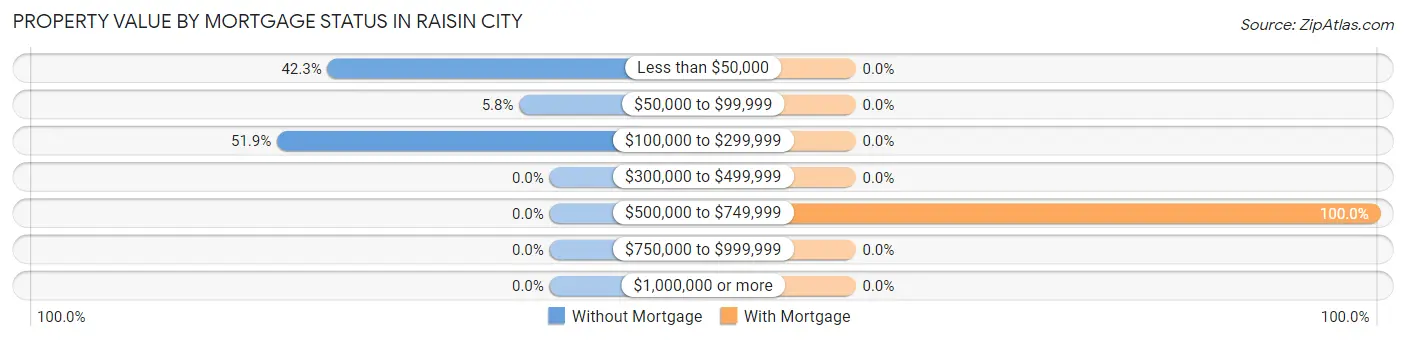
| Property Value | Without Mortgage | With Mortgage |
| Less than $50,000 | 22 (42.3%) | 0 (0.0%) |
| $50,000 to $99,999 | 3 (5.8%) | 0 (0.0%) |
| $100,000 to $299,999 | 27 (51.9%) | 0 (0.0%) |
| $300,000 to $499,999 | 0 (0.0%) | 0 (0.0%) |
| $500,000 to $749,999 | 0 (0.0%) | 10 (100.0%) |
| $750,000 to $999,999 | 0 (0.0%) | 0 (0.0%) |
| $1,000,000 or more | 0 (0.0%) | 0 (0.0%) |
| Total | 52 (100.0%) | 10 (100.0%) |
Household Income by Mortgage Status in Raisin City
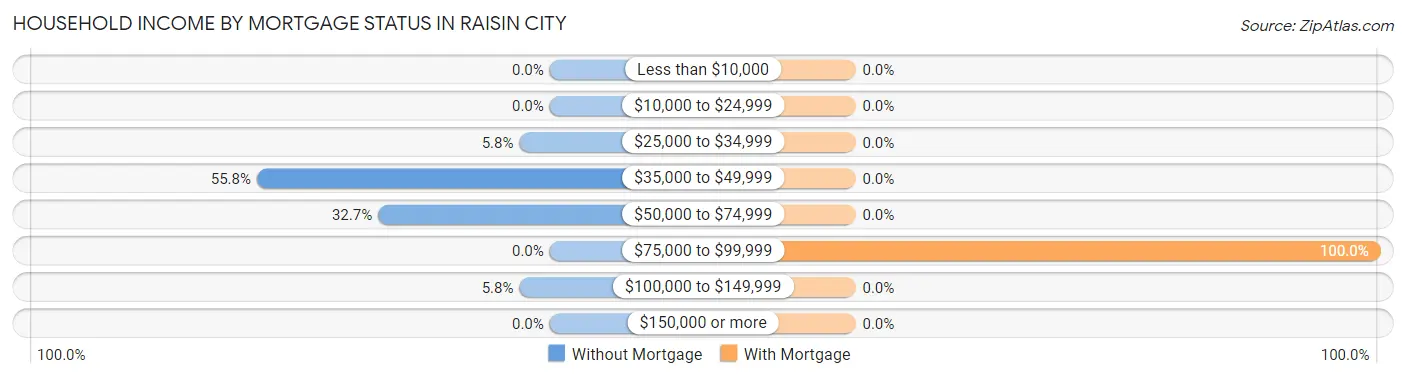
| Household Income | Without Mortgage | With Mortgage |
| Less than $10,000 | 0 (0.0%) | 0 (0.0%) |
| $10,000 to $24,999 | 0 (0.0%) | 0 (0.0%) |
| $25,000 to $34,999 | 3 (5.8%) | 0 (0.0%) |
| $35,000 to $49,999 | 29 (55.8%) | 0 (0.0%) |
| $50,000 to $74,999 | 17 (32.7%) | 0 (0.0%) |
| $75,000 to $99,999 | 0 (0.0%) | 10 (100.0%) |
| $100,000 to $149,999 | 3 (5.8%) | 0 (0.0%) |
| $150,000 or more | 0 (0.0%) | 0 (0.0%) |
| Total | 52 (100.0%) | 10 (100.0%) |
Property Value to Household Income Ratio in Raisin City
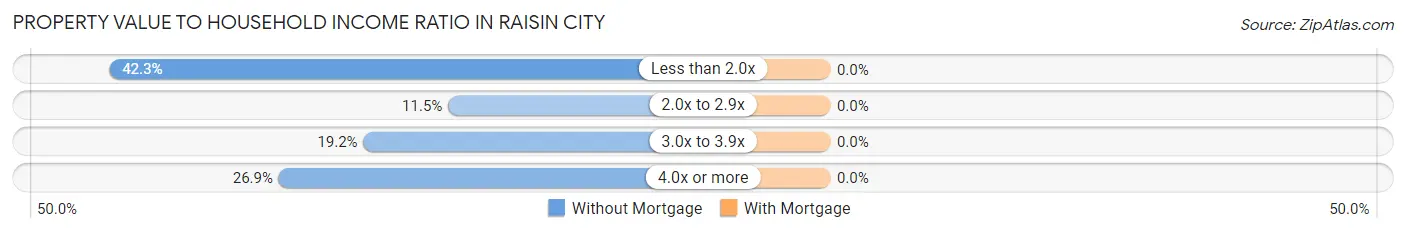
| Value-to-Income Ratio | Without Mortgage | With Mortgage |
| Less than 2.0x | 22 (42.3%) | 0 (0.0%) |
| 2.0x to 2.9x | 6 (11.5%) | 0 (0.0%) |
| 3.0x to 3.9x | 10 (19.2%) | 0 (0.0%) |
| 4.0x or more | 14 (26.9%) | 0 (0.0%) |
| Total | 52 (100.0%) | 10 (100.0%) |
Real Estate Taxes by Mortgage Status in Raisin City
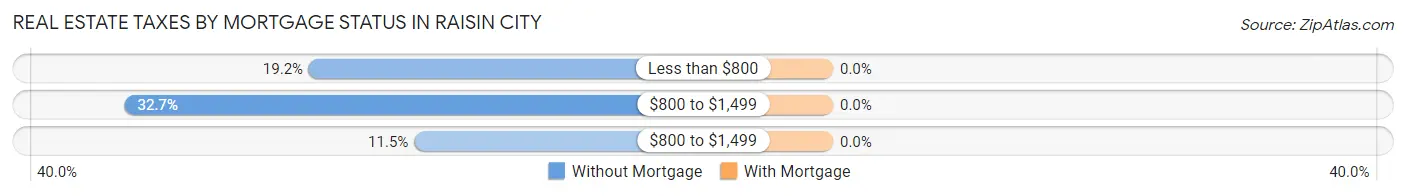
| Property Taxes | Without Mortgage | With Mortgage |
| Less than $800 | 10 (19.2%) | 0 (0.0%) |
| $800 to $1,499 | 17 (32.7%) | 0 (0.0%) |
| $800 to $1,499 | 6 (11.5%) | 0 (0.0%) |
| Total | 52 (100.0%) | 10 (100.0%) |
Health & Disability in Raisin City
Health Insurance Coverage by Age in Raisin City
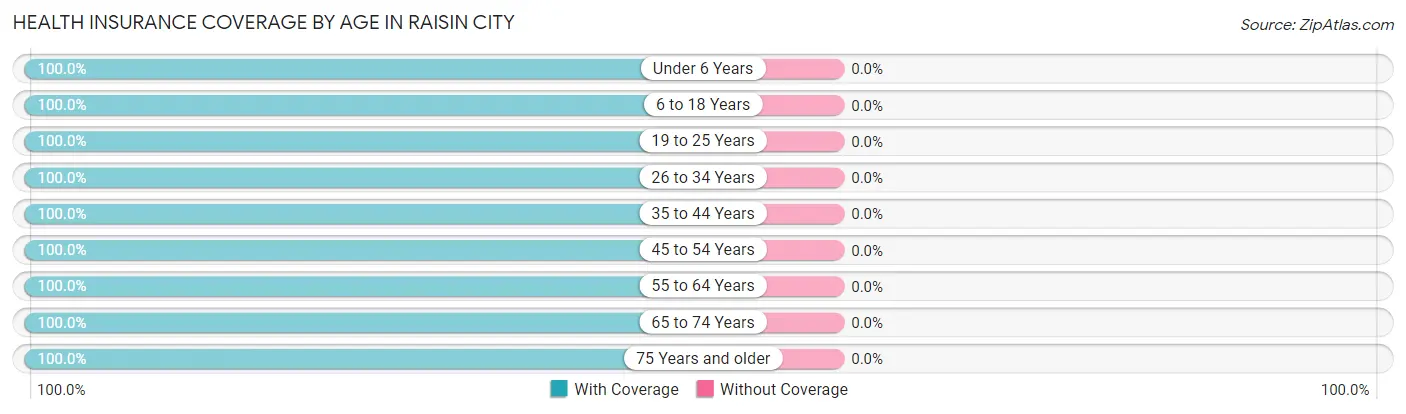
| Age Bracket | With Coverage | Without Coverage |
| Under 6 Years | 19 (100.0%) | 0 (0.0%) |
| 6 to 18 Years | 36 (100.0%) | 0 (0.0%) |
| 19 to 25 Years | 32 (100.0%) | 0 (0.0%) |
| 26 to 34 Years | 28 (100.0%) | 0 (0.0%) |
| 35 to 44 Years | 46 (100.0%) | 0 (0.0%) |
| 45 to 54 Years | 48 (100.0%) | 0 (0.0%) |
| 55 to 64 Years | 15 (100.0%) | 0 (0.0%) |
| 65 to 74 Years | 30 (100.0%) | 0 (0.0%) |
| 75 Years and older | 13 (100.0%) | 0 (0.0%) |
| Total | 267 (100.0%) | 0 (0.0%) |
Health Insurance Coverage by Citizenship Status in Raisin City
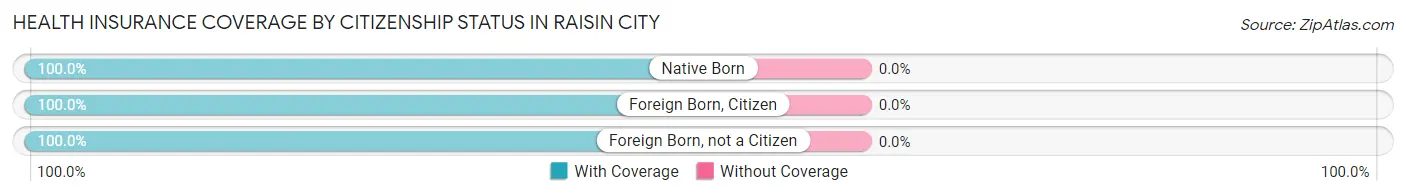
| Citizenship Status | With Coverage | Without Coverage |
| Native Born | 19 (100.0%) | 0 (0.0%) |
| Foreign Born, Citizen | 36 (100.0%) | 0 (0.0%) |
| Foreign Born, not a Citizen | 32 (100.0%) | 0 (0.0%) |
Health Insurance Coverage by Household Income in Raisin City
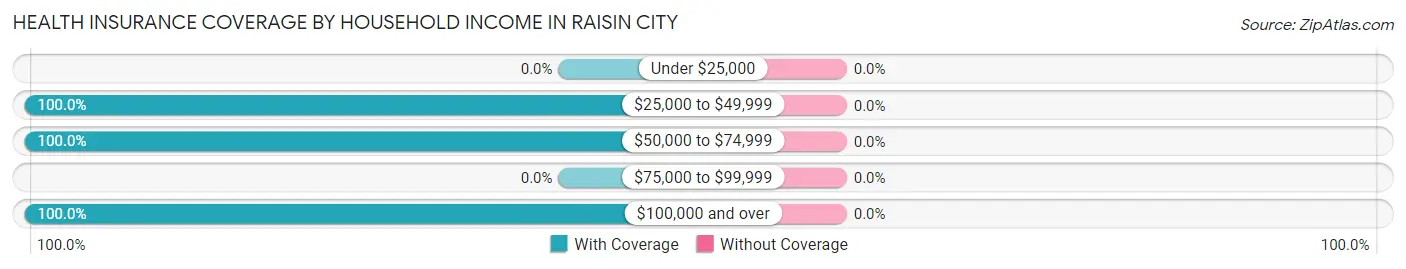
| Household Income | With Coverage | Without Coverage |
| Under $25,000 | 0 (0.0%) | 0 (0.0%) |
| $25,000 to $49,999 | 83 (100.0%) | 0 (0.0%) |
| $50,000 to $74,999 | 126 (100.0%) | 0 (0.0%) |
| $75,000 to $99,999 | 0 (0.0%) | 0 (0.0%) |
| $100,000 and over | 58 (100.0%) | 0 (0.0%) |
Public vs Private Health Insurance Coverage by Age in Raisin City
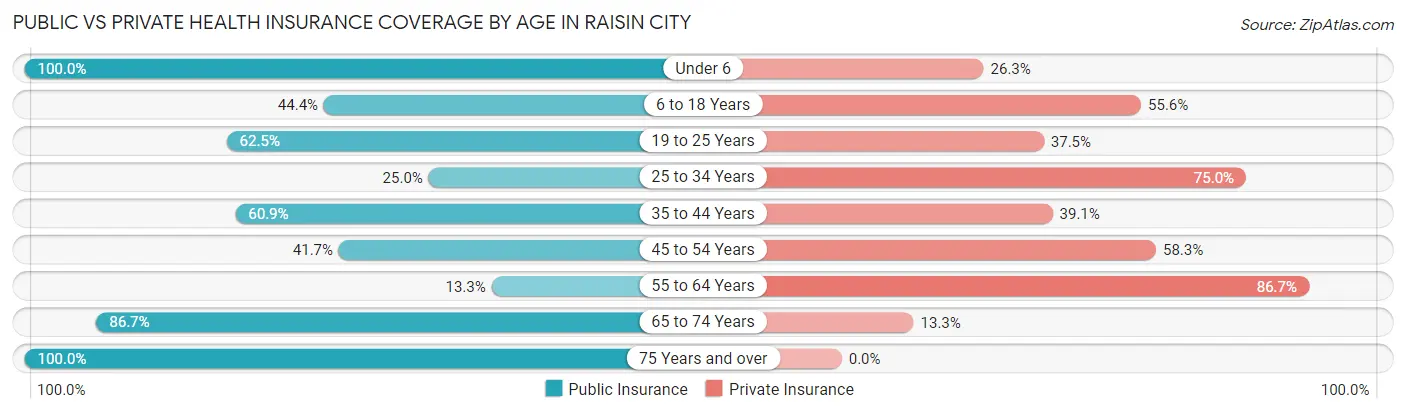
| Age Bracket | Public Insurance | Private Insurance |
| Under 6 | 19 (100.0%) | 5 (26.3%) |
| 6 to 18 Years | 16 (44.4%) | 20 (55.6%) |
| 19 to 25 Years | 20 (62.5%) | 12 (37.5%) |
| 25 to 34 Years | 7 (25.0%) | 21 (75.0%) |
| 35 to 44 Years | 28 (60.9%) | 18 (39.1%) |
| 45 to 54 Years | 20 (41.7%) | 28 (58.3%) |
| 55 to 64 Years | 2 (13.3%) | 13 (86.7%) |
| 65 to 74 Years | 26 (86.7%) | 4 (13.3%) |
| 75 Years and over | 13 (100.0%) | 0 (0.0%) |
| Total | 151 (56.6%) | 121 (45.3%) |
Disability Status by Sex by Age in Raisin City
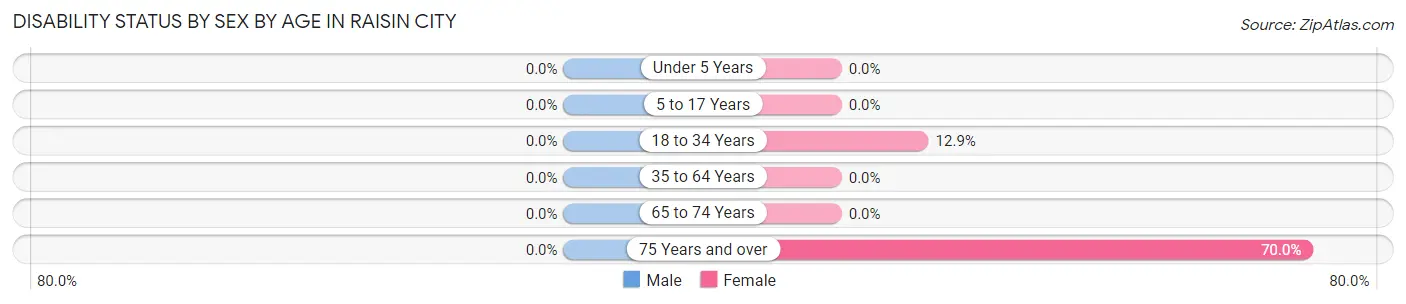
| Age Bracket | Male | Female |
| Under 5 Years | 0 (0.0%) | 0 (0.0%) |
| 5 to 17 Years | 0 (0.0%) | 0 (0.0%) |
| 18 to 34 Years | 0 (0.0%) | 4 (12.9%) |
| 35 to 64 Years | 0 (0.0%) | 0 (0.0%) |
| 65 to 74 Years | 0 (0.0%) | 0 (0.0%) |
| 75 Years and over | 0 (0.0%) | 7 (70.0%) |
Disability Class by Sex by Age in Raisin City
Disability Class: Hearing Difficulty
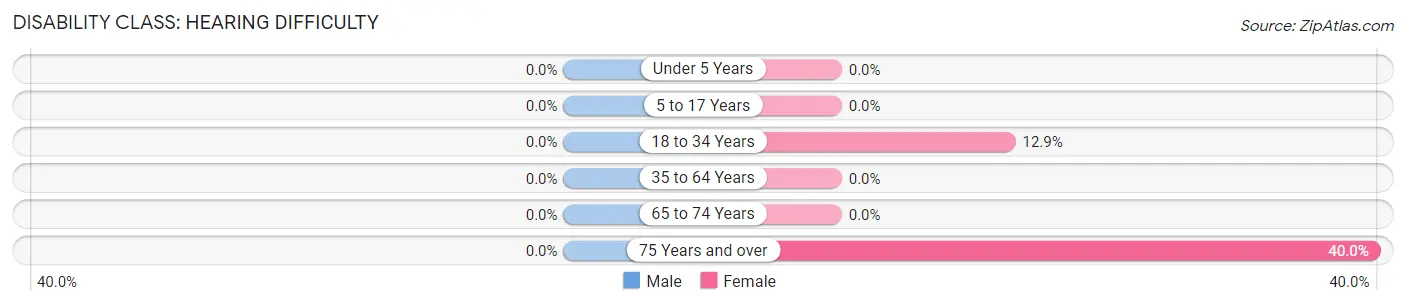
| Age Bracket | Male | Female |
| Under 5 Years | 0 (0.0%) | 0 (0.0%) |
| 5 to 17 Years | 0 (0.0%) | 0 (0.0%) |
| 18 to 34 Years | 0 (0.0%) | 4 (12.9%) |
| 35 to 64 Years | 0 (0.0%) | 0 (0.0%) |
| 65 to 74 Years | 0 (0.0%) | 0 (0.0%) |
| 75 Years and over | 0 (0.0%) | 4 (40.0%) |
Disability Class: Vision Difficulty
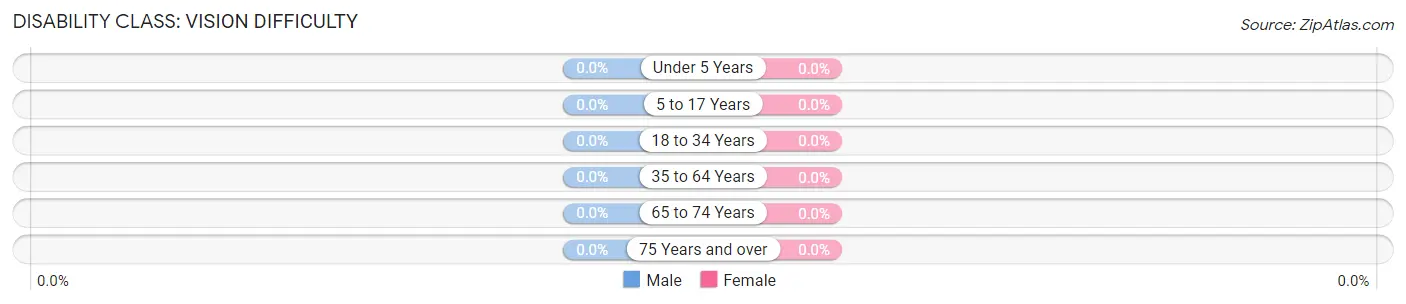
| Age Bracket | Male | Female |
| Under 5 Years | 0 (0.0%) | 0 (0.0%) |
| 5 to 17 Years | 0 (0.0%) | 0 (0.0%) |
| 18 to 34 Years | 0 (0.0%) | 0 (0.0%) |
| 35 to 64 Years | 0 (0.0%) | 0 (0.0%) |
| 65 to 74 Years | 0 (0.0%) | 0 (0.0%) |
| 75 Years and over | 0 (0.0%) | 0 (0.0%) |
Disability Class: Cognitive Difficulty
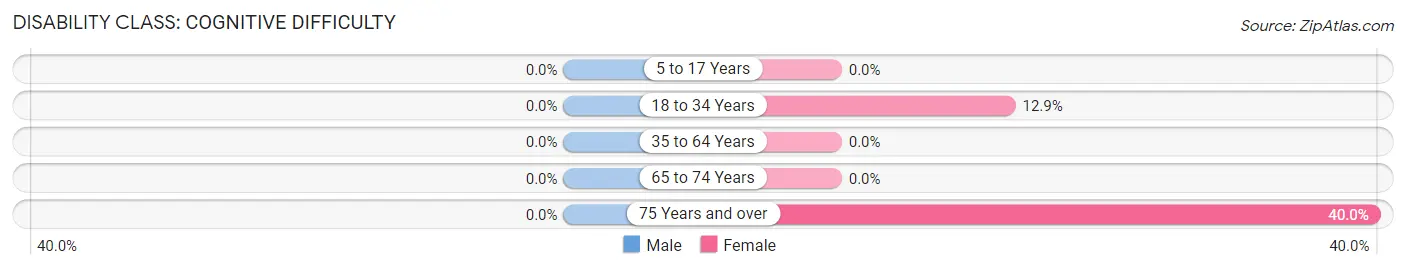
| Age Bracket | Male | Female |
| 5 to 17 Years | 0 (0.0%) | 0 (0.0%) |
| 18 to 34 Years | 0 (0.0%) | 4 (12.9%) |
| 35 to 64 Years | 0 (0.0%) | 0 (0.0%) |
| 65 to 74 Years | 0 (0.0%) | 0 (0.0%) |
| 75 Years and over | 0 (0.0%) | 4 (40.0%) |
Disability Class: Ambulatory Difficulty
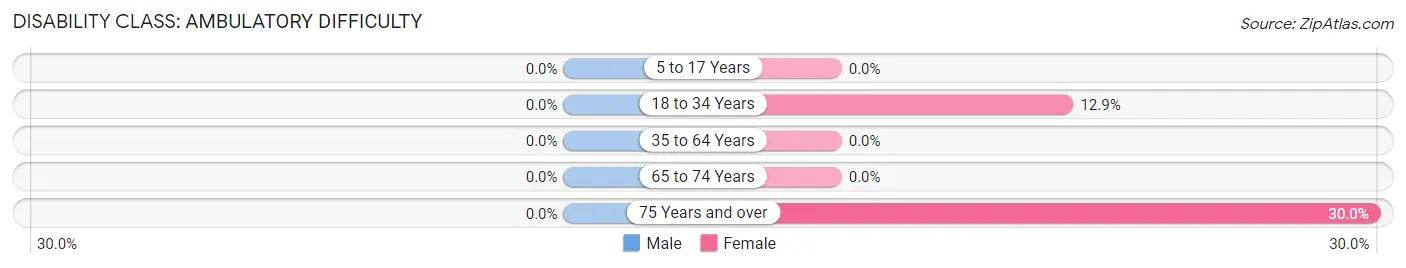
| Age Bracket | Male | Female |
| 5 to 17 Years | 0 (0.0%) | 0 (0.0%) |
| 18 to 34 Years | 0 (0.0%) | 4 (12.9%) |
| 35 to 64 Years | 0 (0.0%) | 0 (0.0%) |
| 65 to 74 Years | 0 (0.0%) | 0 (0.0%) |
| 75 Years and over | 0 (0.0%) | 3 (30.0%) |
Disability Class: Self-Care Difficulty
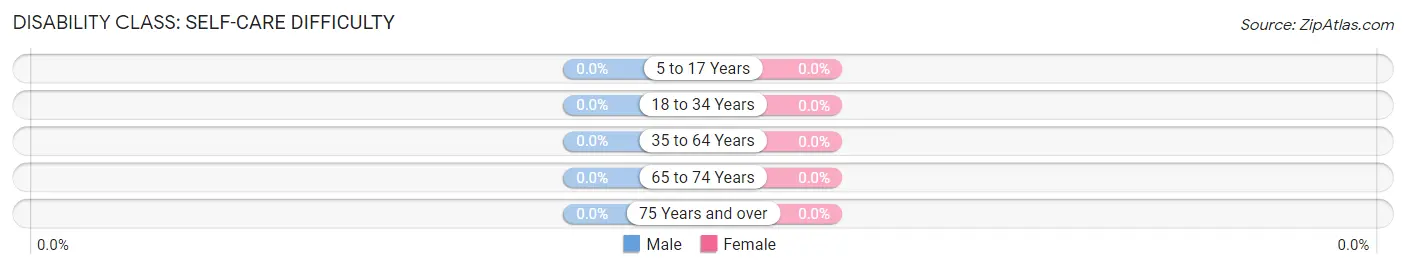
| Age Bracket | Male | Female |
| 5 to 17 Years | 0 (0.0%) | 0 (0.0%) |
| 18 to 34 Years | 0 (0.0%) | 0 (0.0%) |
| 35 to 64 Years | 0 (0.0%) | 0 (0.0%) |
| 65 to 74 Years | 0 (0.0%) | 0 (0.0%) |
| 75 Years and over | 0 (0.0%) | 0 (0.0%) |
Technology Access in Raisin City
Computing Device Access in Raisin City
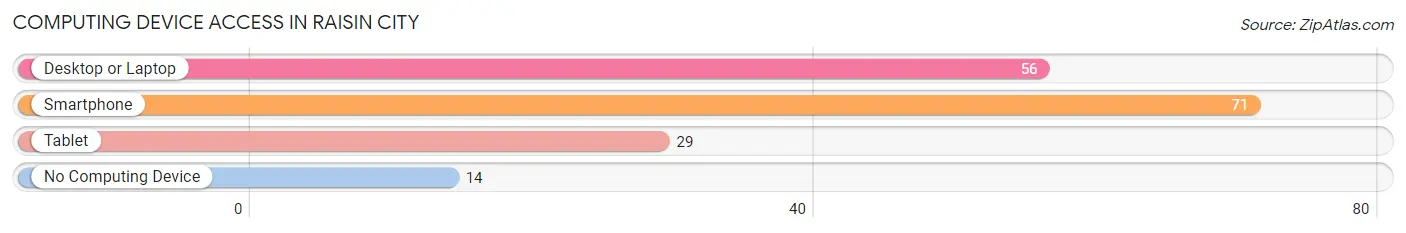
| Device Type | # Households | % Households |
| Desktop or Laptop | 56 | 65.9% |
| Smartphone | 71 | 83.5% |
| Tablet | 29 | 34.1% |
| No Computing Device | 14 | 16.5% |
| Total | 85 | 100.0% |
Internet Access in Raisin City
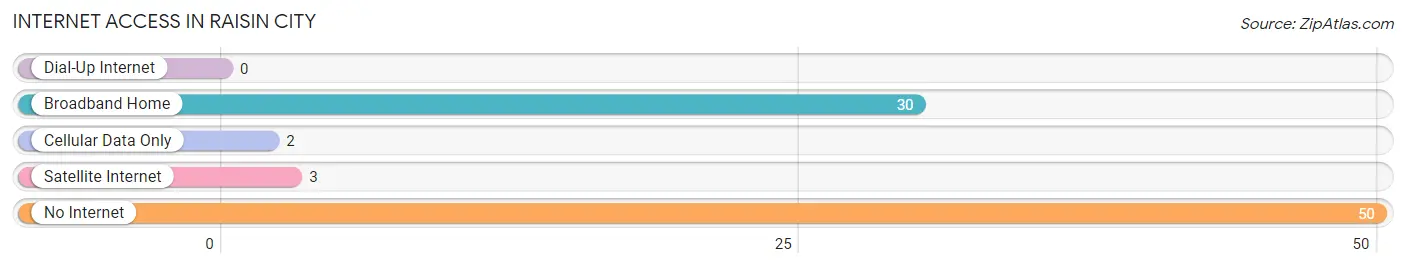
| Internet Type | # Households | % Households |
| Dial-Up Internet | 0 | 0.0% |
| Broadband Home | 30 | 35.3% |
| Cellular Data Only | 2 | 2.4% |
| Satellite Internet | 3 | 3.5% |
| No Internet | 50 | 58.8% |
| Total | 85 | 100.0% |
Raisin City Summary
Raisin City is a small unincorporated community located in Fresno County, California. It is situated in the San Joaquin Valley, approximately 10 miles east of Fresno. The population of Raisin City was 1,845 at the 2010 census.
History
Raisin City was founded in 1891 by the California Raisin Company, which was established to grow and process raisins. The company was owned by the brothers, John and Charles Miller, who had previously been involved in the raisin industry in Fresno. The company was successful and the town grew rapidly, becoming the largest raisin-producing center in the world.
In the early 1900s, the town was home to a large number of Japanese immigrants who worked in the raisin fields. The town was also home to a large number of Mexican immigrants who worked in the fields and in the raisin processing plants.
In the 1920s, the town was the site of a major labor dispute between the California Raisin Company and the United Farm Workers. The dispute resulted in a strike that lasted for several months and resulted in the company agreeing to better wages and working conditions for its workers.
Geography
Raisin City is located in the San Joaquin Valley, approximately 10 miles east of Fresno. The town is situated on the banks of the Kings River, which flows through the area. The town is surrounded by agricultural land, primarily used for growing grapes, raisins, and other crops.
The climate in Raisin City is hot and dry in the summer, with temperatures reaching up to 100 degrees Fahrenheit. In the winter, temperatures can drop to freezing.
Economy
Raisin City’s economy is primarily based on agriculture. The town is home to several raisin processing plants, as well as a number of vineyards and wineries. The town is also home to a number of small businesses, including restaurants, grocery stores, and other retail establishments.
Demographics
As of the 2010 census, the population of Raisin City was 1,845. The racial makeup of the town was 57.3% White, 0.7% African American, 0.7% Native American, 0.3% Asian, 0.1% Pacific Islander, 37.2% from other races, and 4.0% from two or more races. Hispanic or Latino of any race were 64.2% of the population.
The median household income in Raisin City was $30,938, and the median family income was $35,938. The per capita income for the town was $13,938. About 24.2% of families and 28.2% of the population were below the poverty line, including 37.2% of those under age 18 and 11.2% of those age 65 or over.
Common Questions
What is Per Capita Income in Raisin City?
Per Capita income in Raisin City is $21,320.
What is the Median Family Income in Raisin City?
Median Family Income in Raisin City is $56,250.
What is the Median Household income in Raisin City?
Median Household Income in Raisin City is $54,583.
What is Inequality or Gini Index in Raisin City?
Inequality or Gini Index in Raisin City is 0.25.
What is the Total Population of Raisin City?
Total Population of Raisin City is 267.
What is the Total Male Population of Raisin City?
Total Male Population of Raisin City is 146.
What is the Total Female Population of Raisin City?
Total Female Population of Raisin City is 121.
What is the Ratio of Males per 100 Females in Raisin City?
There are 120.66 Males per 100 Females in Raisin City.
What is the Ratio of Females per 100 Males in Raisin City?
There are 82.88 Females per 100 Males in Raisin City.
What is the Median Population Age in Raisin City?
Median Population Age in Raisin City is 38.5 Years.
What is the Average Family Size in Raisin City
Average Family Size in Raisin City is 4.0 People.
What is the Average Household Size in Raisin City
Average Household Size in Raisin City is 3.1 People.
How Large is the Labor Force in Raisin City?
There are 133 People in the Labor Forcein in Raisin City.
What is the Percentage of People in the Labor Force in Raisin City?
59.9% of People are in the Labor Force in Raisin City.
What is the Unemployment Rate in Raisin City?
Unemployment Rate in Raisin City is 33.1%.