Quincy, CA Map & Demographics
Quincy Map
Quincy Overview
$47,767
PER CAPITA INCOME
$97,750
AVG FAMILY INCOME
$75,469
AVG HOUSEHOLD INCOME
13.3%
WAGE / INCOME GAP [ % ]
86.7¢/ $1
WAGE / INCOME GAP [ $ ]
0.42
INEQUALITY / GINI INDEX
1,368
TOTAL POPULATION
720
MALE POPULATION
648
FEMALE POPULATION
111.11
MALES / 100 FEMALES
90.00
FEMALES / 100 MALES
57.1
MEDIAN AGE
2.6
AVG FAMILY SIZE
2.0
AVG HOUSEHOLD SIZE
724
LABOR FORCE [ PEOPLE ]
54.4%
PERCENT IN LABOR FORCE
11.9%
UNEMPLOYMENT RATE
Quincy Zip Codes
Quincy Area Codes
Income in Quincy
Income Overview in Quincy
Per Capita Income in Quincy is $47,767, while median incomes of families and households are $97,750 and $75,469 respectively.
| Characteristic | Number | Measure |
| Per Capita Income | 1,368 | $47,767 |
| Median Family Income | 318 | $97,750 |
| Mean Family Income | 318 | $113,897 |
| Median Household Income | 648 | $75,469 |
| Mean Household Income | 648 | $92,732 |
| Income Deficit | 318 | $0 |
| Wage / Income Gap (%) | 1,368 | 13.32% |
| Wage / Income Gap ($) | 1,368 | 86.68¢ per $1 |
| Gini / Inequality Index | 1,368 | 0.42 |
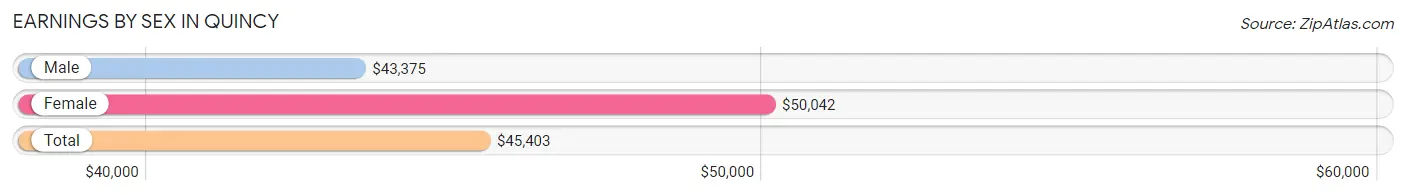
Earnings by Sex in Quincy
Average Earnings in Quincy are $45,403, $43,375 for men and $50,042 for women, a difference of 13.3%.
| Sex | Number | Average Earnings |
| Male | 361 (49.3%) | $43,375 |
| Female | 371 (50.7%) | $50,042 |
| Total | 732 (100.0%) | $45,403 |
Earnings by Sex by Income Bracket in Quincy
The most common earnings brackets in Quincy are $55,000 to $64,999 for men (79 | 21.9%) and $50,000 to $54,999 for women (90 | 24.3%).
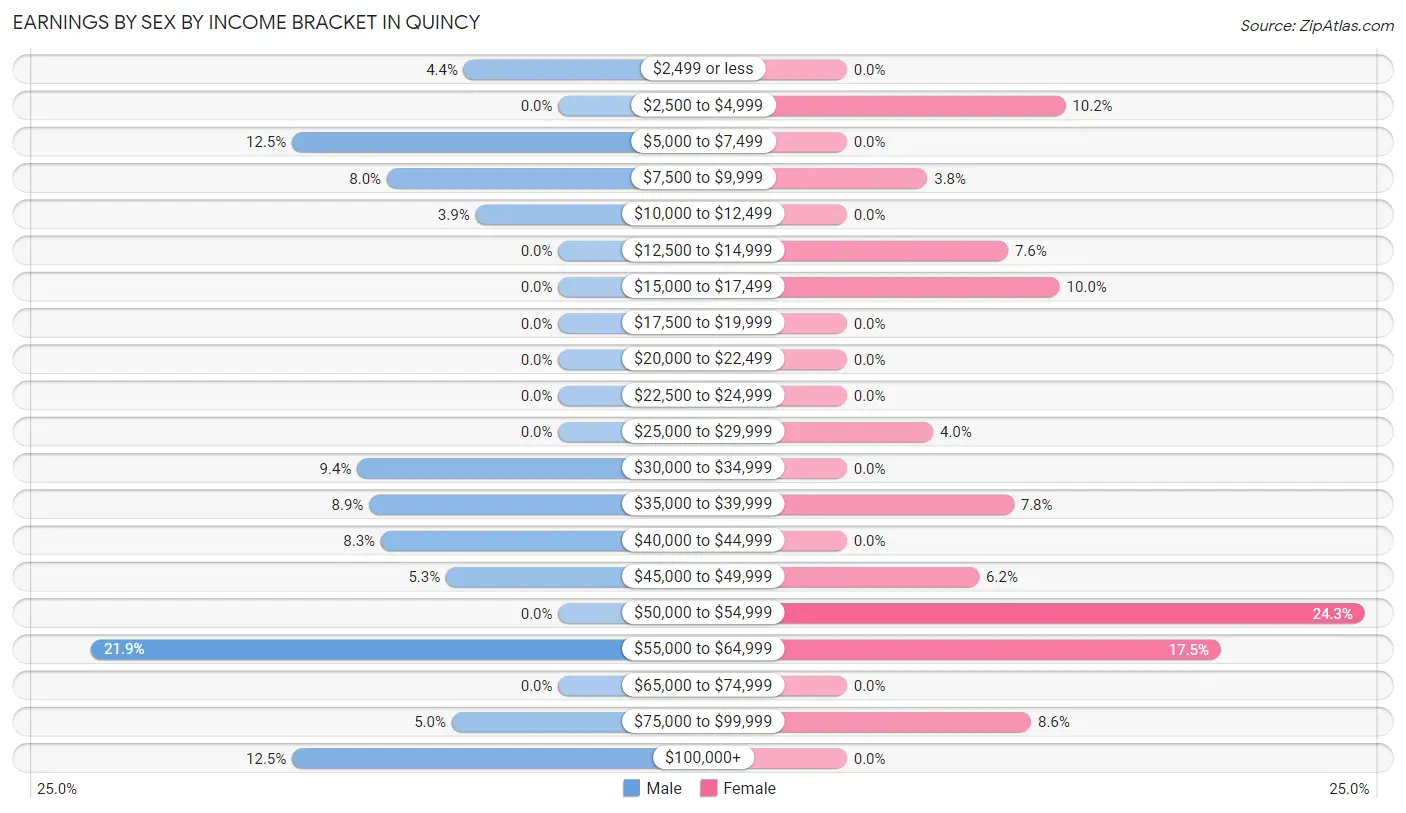
| Income | Male | Female |
| $2,499 or less | 16 (4.4%) | 0 (0.0%) |
| $2,500 to $4,999 | 0 (0.0%) | 38 (10.2%) |
| $5,000 to $7,499 | 45 (12.5%) | 0 (0.0%) |
| $7,500 to $9,999 | 29 (8.0%) | 14 (3.8%) |
| $10,000 to $12,499 | 14 (3.9%) | 0 (0.0%) |
| $12,500 to $14,999 | 0 (0.0%) | 28 (7.5%) |
| $15,000 to $17,499 | 0 (0.0%) | 37 (10.0%) |
| $17,500 to $19,999 | 0 (0.0%) | 0 (0.0%) |
| $20,000 to $22,499 | 0 (0.0%) | 0 (0.0%) |
| $22,500 to $24,999 | 0 (0.0%) | 0 (0.0%) |
| $25,000 to $29,999 | 0 (0.0%) | 15 (4.0%) |
| $30,000 to $34,999 | 34 (9.4%) | 0 (0.0%) |
| $35,000 to $39,999 | 32 (8.9%) | 29 (7.8%) |
| $40,000 to $44,999 | 30 (8.3%) | 0 (0.0%) |
| $45,000 to $49,999 | 19 (5.3%) | 23 (6.2%) |
| $50,000 to $54,999 | 0 (0.0%) | 90 (24.3%) |
| $55,000 to $64,999 | 79 (21.9%) | 65 (17.5%) |
| $65,000 to $74,999 | 0 (0.0%) | 0 (0.0%) |
| $75,000 to $99,999 | 18 (5.0%) | 32 (8.6%) |
| $100,000+ | 45 (12.5%) | 0 (0.0%) |
| Total | 361 (100.0%) | 371 (100.0%) |
Earnings by Sex by Educational Attainment in Quincy
Average earnings in Quincy are $43,375 for men and $50,431 for women, a difference of 14.0%. Men with an educational attainment of college or associate's degree enjoy the highest average annual earnings of $57,596, while those with bachelor's degree education earn the least with $37,813. Women with an educational attainment of high school diploma earn the most with the average annual earnings of $60,673, while those with college or associate's degree education have the smallest earnings of $35,733.
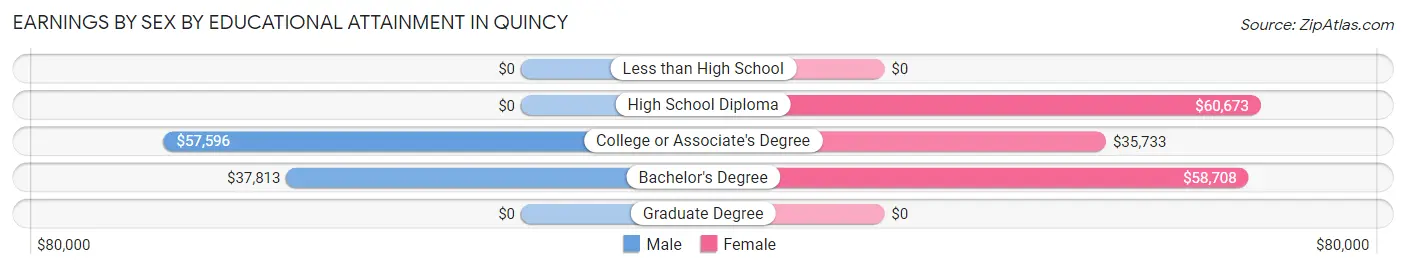
| Educational Attainment | Male Income | Female Income |
| Less than High School | - | - |
| High School Diploma | - | - |
| College or Associate's Degree | $57,596 | $35,733 |
| Bachelor's Degree | $37,813 | $58,708 |
| Graduate Degree | - | - |
| Total | $43,375 | $50,431 |
Family Income in Quincy
Family Income Brackets in Quincy
According to the Quincy family income data, there are 89 families falling into the $100,000 to $149,999 income range, which is the most common income bracket and makes up 28.0% of all families.
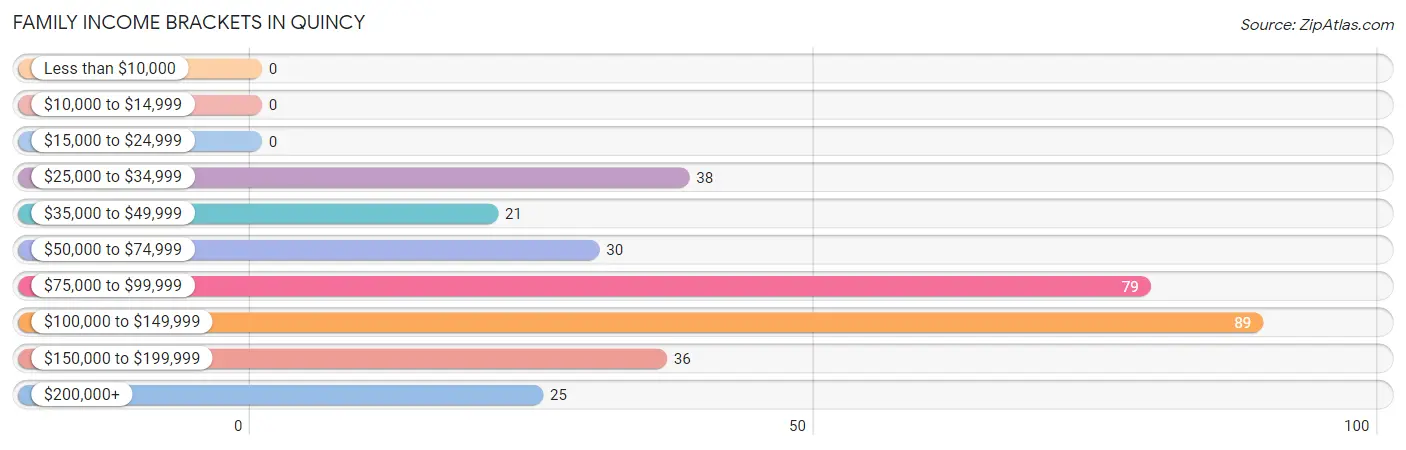
| Income Bracket | # Families | % Families |
| Less than $10,000 | 0 | 0.0% |
| $10,000 to $14,999 | 0 | 0.0% |
| $15,000 to $24,999 | 0 | 0.0% |
| $25,000 to $34,999 | 38 | 11.9% |
| $35,000 to $49,999 | 21 | 6.6% |
| $50,000 to $74,999 | 30 | 9.4% |
| $75,000 to $99,999 | 79 | 24.8% |
| $100,000 to $149,999 | 89 | 28.0% |
| $150,000 to $199,999 | 36 | 11.3% |
| $200,000+ | 25 | 7.9% |
Family Income by Famaliy Size in Quincy
3-person families (72 | 22.6%) account for the highest median family income in Quincy with $137,568 per family, while 2-person families (239 | 75.2%) have the highest median income of $49,188 per family member.
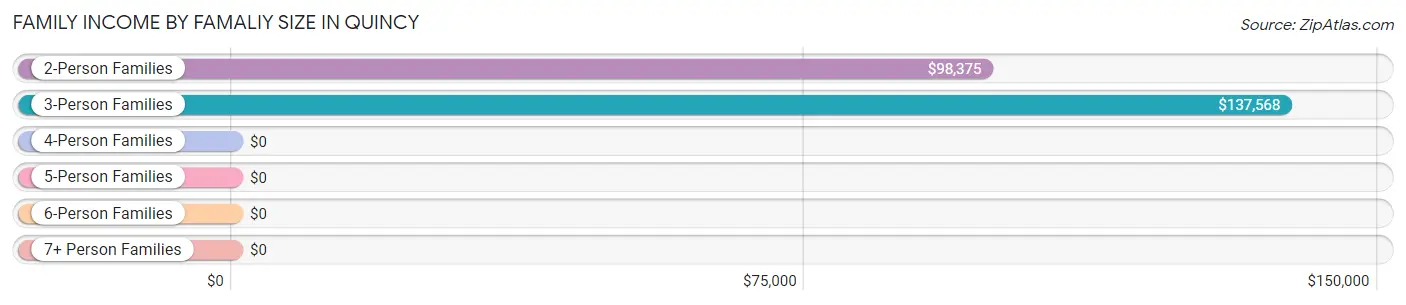
| Income Bracket | # Families | Median Income |
| 2-Person Families | 239 (75.2%) | $98,375 |
| 3-Person Families | 72 (22.6%) | $137,568 |
| 4-Person Families | 7 (2.2%) | $0 |
| 5-Person Families | 0 (0.0%) | $0 |
| 6-Person Families | 0 (0.0%) | $0 |
| 7+ Person Families | 0 (0.0%) | $0 |
| Total | 318 (100.0%) | $97,750 |
Family Income by Number of Earners in Quincy
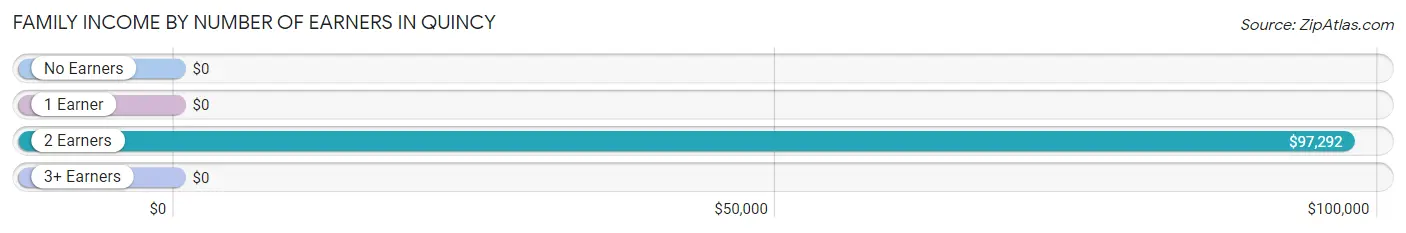
| Number of Earners | # Families | Median Income |
| No Earners | 61 (19.2%) | $0 |
| 1 Earner | 141 (44.3%) | $0 |
| 2 Earners | 109 (34.3%) | $97,292 |
| 3+ Earners | 7 (2.2%) | $0 |
| Total | 318 (100.0%) | $97,750 |
Household Income in Quincy
Household Income Brackets in Quincy
With 127 households falling in the category, the $75,000 to $99,999 income range is the most frequent in Quincy, accounting for 19.6% of all households. In contrast, only 5 households (0.8%) fall into the $10,000 to $14,999 income bracket, making it the least populous group.
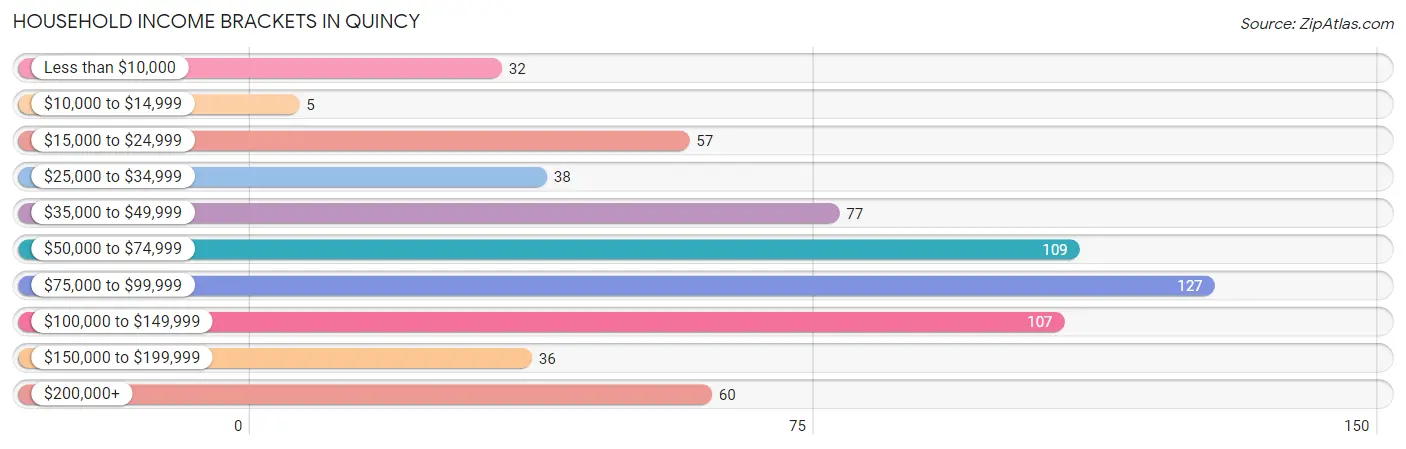
| Income Bracket | # Households | % Households |
| Less than $10,000 | 32 | 4.9% |
| $10,000 to $14,999 | 5 | 0.8% |
| $15,000 to $24,999 | 57 | 8.8% |
| $25,000 to $34,999 | 38 | 5.9% |
| $35,000 to $49,999 | 77 | 11.9% |
| $50,000 to $74,999 | 109 | 16.8% |
| $75,000 to $99,999 | 127 | 19.6% |
| $100,000 to $149,999 | 107 | 16.5% |
| $150,000 to $199,999 | 36 | 5.6% |
| $200,000+ | 60 | 9.3% |
Household Income by Householder Age in Quincy
The median household income in Quincy is $75,469, with the highest median household income of $83,516 found in the 45 to 64 years age bracket for the primary householder. A total of 276 households (42.6%) fall into this category. Meanwhile, the 15 to 24 years age bracket for the primary householder has the lowest median household income of $0, with 32 households (4.9%) in this group.
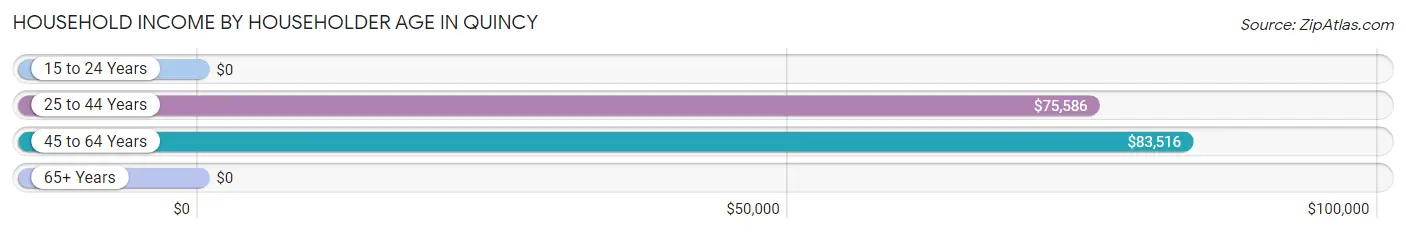
| Income Bracket | # Households | Median Income |
| 15 to 24 Years | 32 (4.9%) | $0 |
| 25 to 44 Years | 127 (19.6%) | $75,586 |
| 45 to 64 Years | 276 (42.6%) | $83,516 |
| 65+ Years | 213 (32.9%) | $0 |
| Total | 648 (100.0%) | $75,469 |
Poverty in Quincy
Income Below Poverty by Sex and Age in Quincy
With 15.7% poverty level for males and 6.4% for females among the residents of Quincy, 18 to 24 year old males and 18 to 24 year old females are the most vulnerable to poverty, with 32 males (100.0%) and 34 females (100.0%) in their respective age groups living below the poverty level.
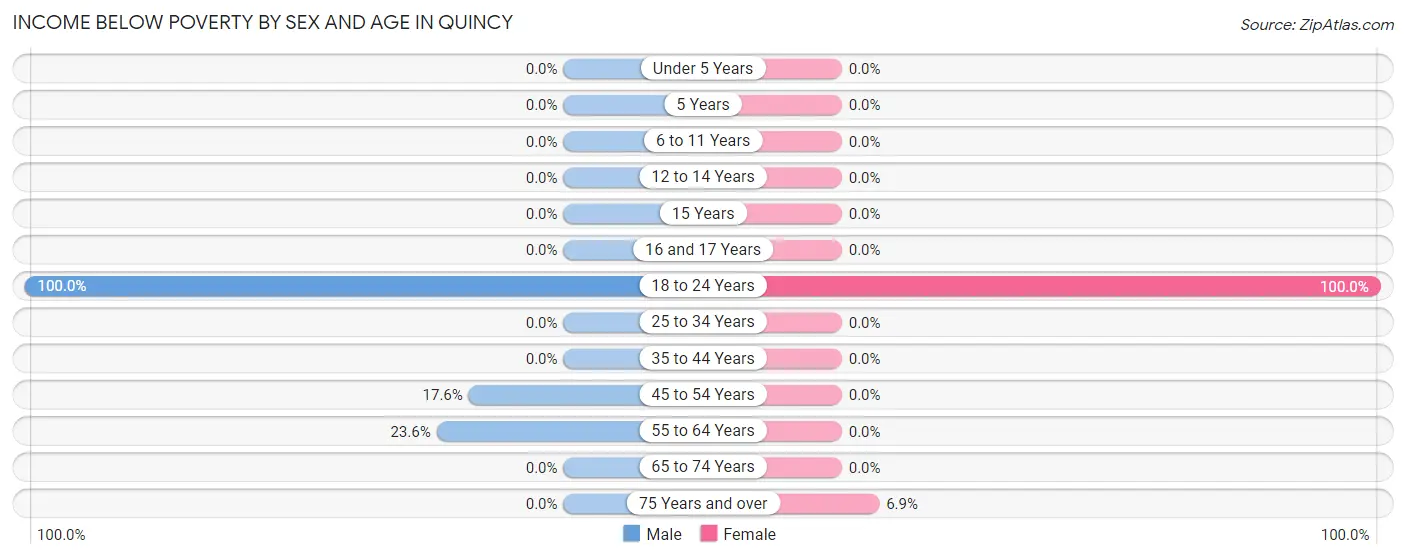
| Age Bracket | Male | Female |
| Under 5 Years | 0 (0.0%) | 0 (0.0%) |
| 5 Years | 0 (0.0%) | 0 (0.0%) |
| 6 to 11 Years | 0 (0.0%) | 0 (0.0%) |
| 12 to 14 Years | 0 (0.0%) | 0 (0.0%) |
| 15 Years | 0 (0.0%) | 0 (0.0%) |
| 16 and 17 Years | 0 (0.0%) | 0 (0.0%) |
| 18 to 24 Years | 32 (100.0%) | 34 (100.0%) |
| 25 to 34 Years | 0 (0.0%) | 0 (0.0%) |
| 35 to 44 Years | 0 (0.0%) | 0 (0.0%) |
| 45 to 54 Years | 16 (17.6%) | 0 (0.0%) |
| 55 to 64 Years | 61 (23.5%) | 0 (0.0%) |
| 65 to 74 Years | 0 (0.0%) | 0 (0.0%) |
| 75 Years and over | 0 (0.0%) | 5 (6.9%) |
| Total | 109 (15.7%) | 39 (6.4%) |
Income Above Poverty by Sex and Age in Quincy
According to the poverty statistics in Quincy, males aged 25 to 34 years and females aged under 5 years are the age groups that are most secure financially, with 100.0% of males and 100.0% of females in these age groups living above the poverty line.
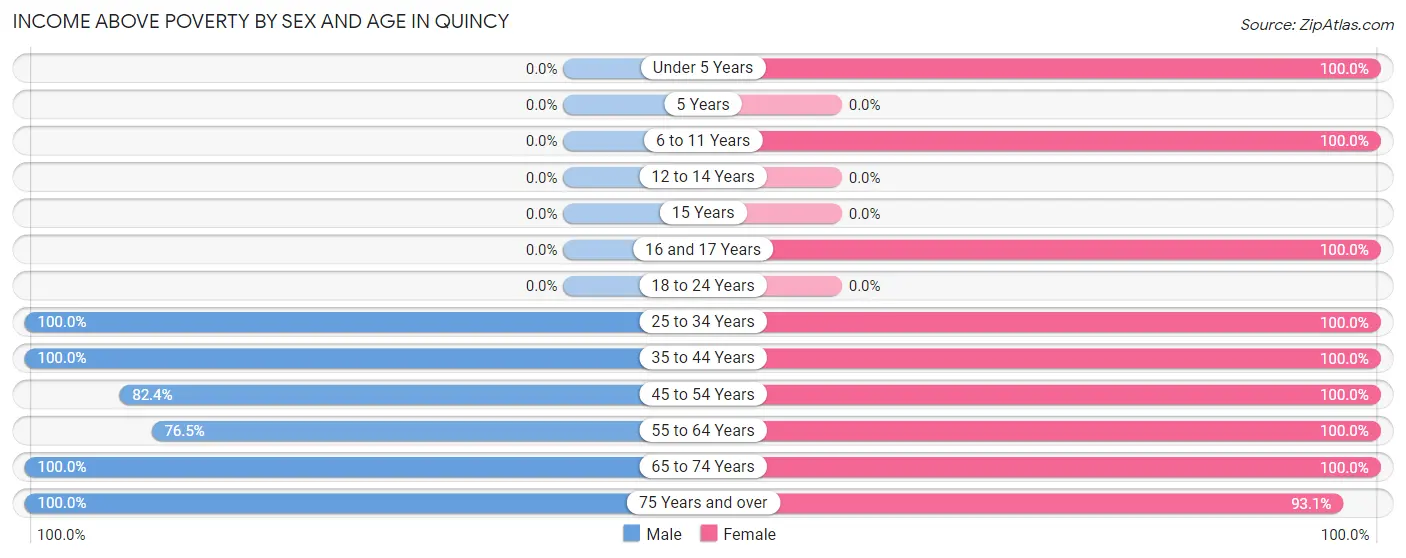
| Age Bracket | Male | Female |
| Under 5 Years | 0 (0.0%) | 16 (100.0%) |
| 5 Years | 0 (0.0%) | 0 (0.0%) |
| 6 to 11 Years | 0 (0.0%) | 22 (100.0%) |
| 12 to 14 Years | 0 (0.0%) | 0 (0.0%) |
| 15 Years | 0 (0.0%) | 0 (0.0%) |
| 16 and 17 Years | 0 (0.0%) | 28 (100.0%) |
| 18 to 24 Years | 0 (0.0%) | 0 (0.0%) |
| 25 to 34 Years | 34 (100.0%) | 93 (100.0%) |
| 35 to 44 Years | 68 (100.0%) | 52 (100.0%) |
| 45 to 54 Years | 75 (82.4%) | 57 (100.0%) |
| 55 to 64 Years | 198 (76.4%) | 135 (100.0%) |
| 65 to 74 Years | 140 (100.0%) | 105 (100.0%) |
| 75 Years and over | 70 (100.0%) | 67 (93.1%) |
| Total | 585 (84.3%) | 575 (93.6%) |
Income Below Poverty Among Married-Couple Families in Quincy
| Children | Above Poverty | Below Poverty |
| No Children | 239 (100.0%) | 0 (0.0%) |
| 1 or 2 Children | 37 (100.0%) | 0 (0.0%) |
| 3 or 4 Children | 0 (0.0%) | 0 (0.0%) |
| 5 or more Children | 0 (0.0%) | 0 (0.0%) |
| Total | 276 (100.0%) | 0 (0.0%) |
Income Below Poverty Among Single-Parent Households in Quincy
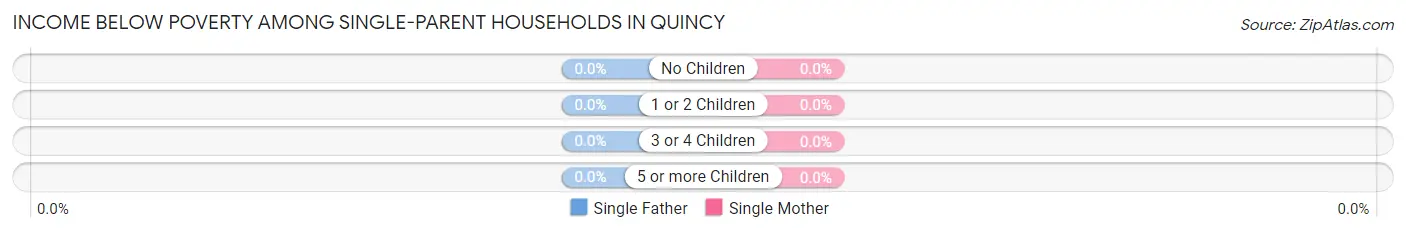
| Children | Single Father | Single Mother |
| No Children | 0 (0.0%) | 0 (0.0%) |
| 1 or 2 Children | 0 (0.0%) | 0 (0.0%) |
| 3 or 4 Children | 0 (0.0%) | 0 (0.0%) |
| 5 or more Children | 0 (0.0%) | 0 (0.0%) |
| Total | 0 (0.0%) | 0 (0.0%) |
Income Below Poverty Among Married-Couple vs Single-Parent Households in Quincy
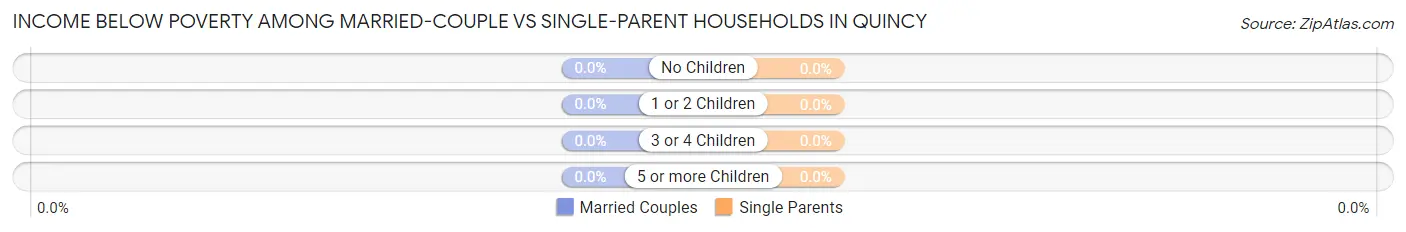
| Children | Married-Couple Families | Single-Parent Households |
| No Children | 0 (0.0%) | 0 (0.0%) |
| 1 or 2 Children | 0 (0.0%) | 0 (0.0%) |
| 3 or 4 Children | 0 (0.0%) | 0 (0.0%) |
| 5 or more Children | 0 (0.0%) | 0 (0.0%) |
| Total | 0 (0.0%) | 0 (0.0%) |
Race in Quincy
The most populous races in Quincy are White / Caucasian (1,031 | 75.4%), Hispanic or Latino (220 | 16.1%), and Black / African American (150 | 11.0%).
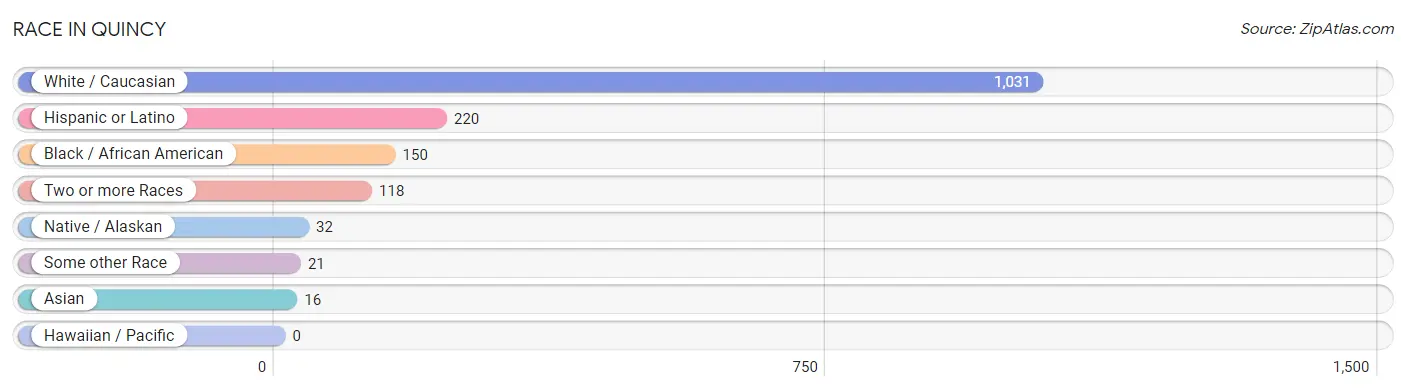
| Race | # Population | % Population |
| Asian | 16 | 1.2% |
| Black / African American | 150 | 11.0% |
| Hawaiian / Pacific | 0 | 0.0% |
| Hispanic or Latino | 220 | 16.1% |
| Native / Alaskan | 32 | 2.3% |
| White / Caucasian | 1,031 | 75.4% |
| Two or more Races | 118 | 8.6% |
| Some other Race | 21 | 1.5% |
| Total | 1,368 | 100.0% |
Ancestry in Quincy
The most populous ancestries reported in Quincy are German (191 | 14.0%), English (161 | 11.8%), Welsh (65 | 4.8%), Polish (60 | 4.4%), and Irish (57 | 4.2%), together accounting for 39.0% of all Quincy residents.
| Ancestry | # Population | % Population |
| African | 2 | 0.2% |
| American | 10 | 0.7% |
| Arab | 1 | 0.1% |
| Central American | 26 | 1.9% |
| Czech | 15 | 1.1% |
| Czechoslovakian | 13 | 0.9% |
| Dutch | 22 | 1.6% |
| English | 161 | 11.8% |
| European | 52 | 3.8% |
| French | 11 | 0.8% |
| German | 191 | 14.0% |
| Irish | 57 | 4.2% |
| Italian | 31 | 2.3% |
| Jordanian | 1 | 0.1% |
| Korean | 16 | 1.2% |
| Mexican | 36 | 2.6% |
| Norwegian | 34 | 2.5% |
| Polish | 60 | 4.4% |
| Portuguese | 46 | 3.4% |
| Potawatomi | 32 | 2.3% |
| Puerto Rican | 1 | 0.1% |
| Russian | 11 | 0.8% |
| Salvadoran | 26 | 1.9% |
| Scandinavian | 39 | 2.9% |
| Scotch-Irish | 16 | 1.2% |
| Scottish | 16 | 1.2% |
| Spaniard | 56 | 4.1% |
| Spanish | 15 | 1.1% |
| Subsaharan African | 2 | 0.2% |
| Swedish | 14 | 1.0% |
| Welsh | 65 | 4.8% | View All 31 Rows |
Immigrants in Quincy
The most numerous immigrant groups reported in Quincy came from Asia (33 | 2.4%), China (32 | 2.3%), Eastern Asia (32 | 2.3%), Taiwan (32 | 2.3%), and Oceania (14 | 1.0%), together accounting for 10.5% of all Quincy residents.
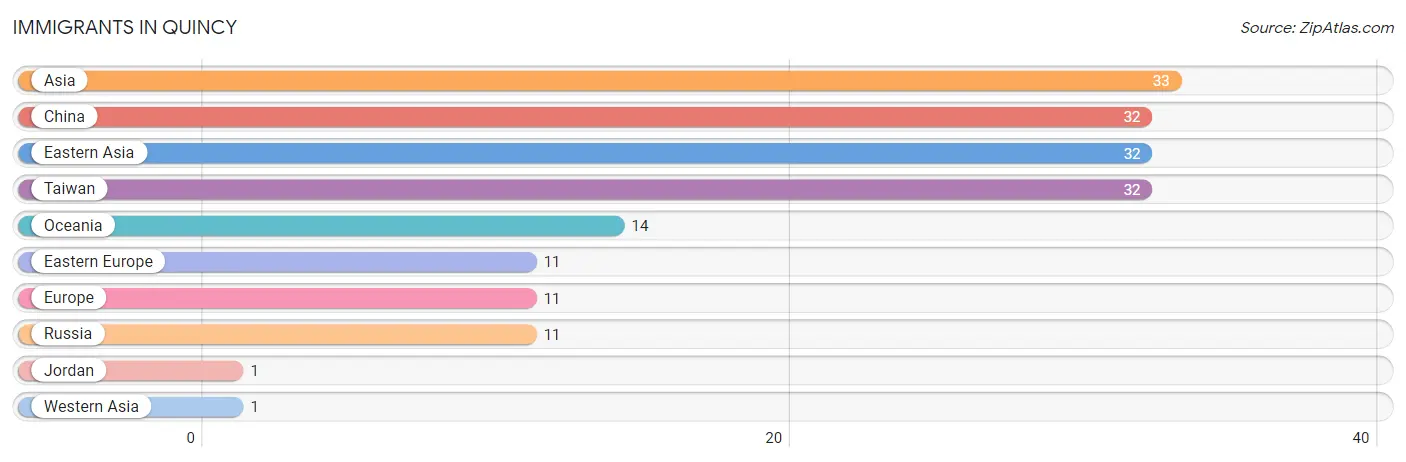
| Immigration Origin | # Population | % Population |
| Asia | 33 | 2.4% |
| China | 32 | 2.3% |
| Eastern Asia | 32 | 2.3% |
| Eastern Europe | 11 | 0.8% |
| Europe | 11 | 0.8% |
| Jordan | 1 | 0.1% |
| Oceania | 14 | 1.0% |
| Russia | 11 | 0.8% |
| Taiwan | 32 | 2.3% |
| Western Asia | 1 | 0.1% | View All 10 Rows |
Sex and Age in Quincy
Sex and Age in Quincy
The most populous age groups in Quincy are 55 to 59 Years (179 | 24.9%) for men and 70 to 74 Years (102 | 15.7%) for women.
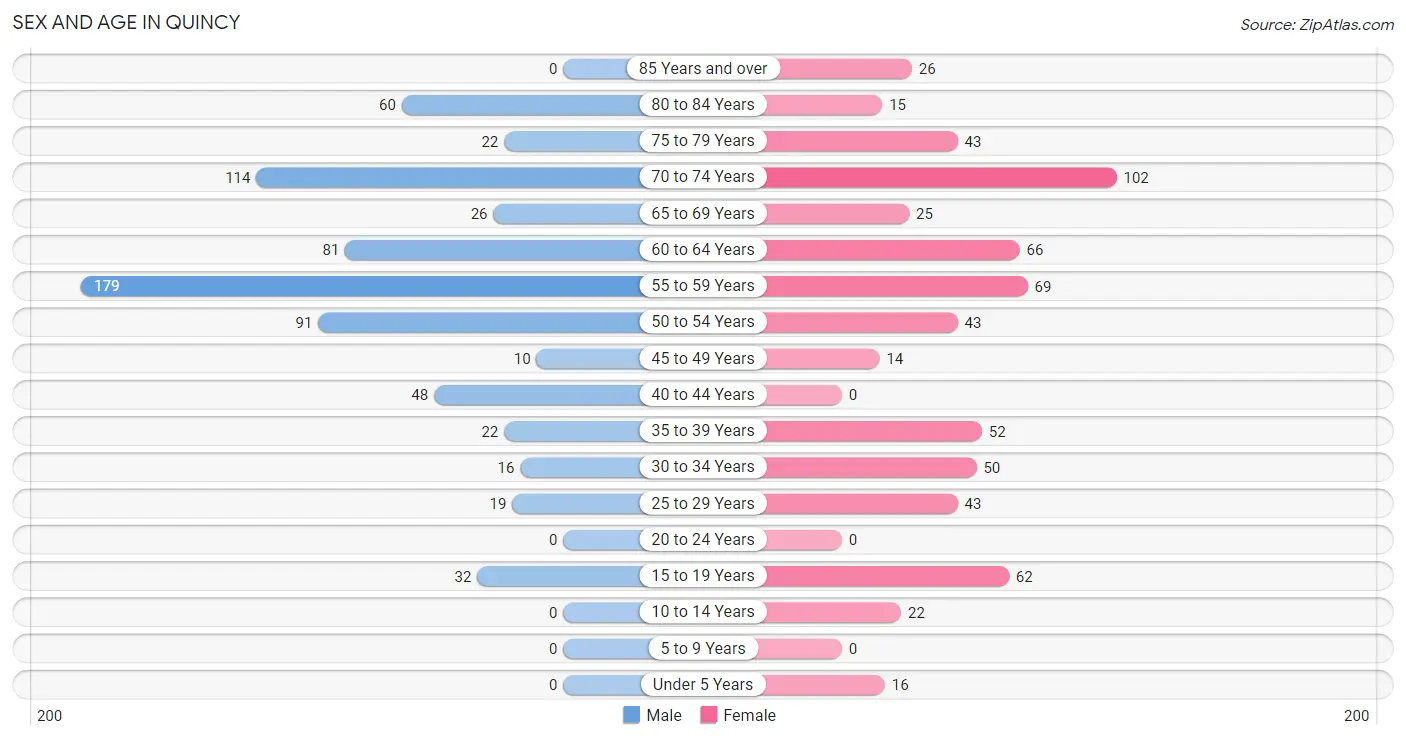
| Age Bracket | Male | Female |
| Under 5 Years | 0 (0.0%) | 16 (2.5%) |
| 5 to 9 Years | 0 (0.0%) | 0 (0.0%) |
| 10 to 14 Years | 0 (0.0%) | 22 (3.4%) |
| 15 to 19 Years | 32 (4.4%) | 62 (9.6%) |
| 20 to 24 Years | 0 (0.0%) | 0 (0.0%) |
| 25 to 29 Years | 19 (2.6%) | 43 (6.6%) |
| 30 to 34 Years | 16 (2.2%) | 50 (7.7%) |
| 35 to 39 Years | 22 (3.1%) | 52 (8.0%) |
| 40 to 44 Years | 48 (6.7%) | 0 (0.0%) |
| 45 to 49 Years | 10 (1.4%) | 14 (2.2%) |
| 50 to 54 Years | 91 (12.6%) | 43 (6.6%) |
| 55 to 59 Years | 179 (24.9%) | 69 (10.6%) |
| 60 to 64 Years | 81 (11.3%) | 66 (10.2%) |
| 65 to 69 Years | 26 (3.6%) | 25 (3.9%) |
| 70 to 74 Years | 114 (15.8%) | 102 (15.7%) |
| 75 to 79 Years | 22 (3.1%) | 43 (6.6%) |
| 80 to 84 Years | 60 (8.3%) | 15 (2.3%) |
| 85 Years and over | 0 (0.0%) | 26 (4.0%) |
| Total | 720 (100.0%) | 648 (100.0%) |
Families and Households in Quincy
Median Family Size in Quincy
The median family size in Quincy is 2.57 persons per family, with single male/father families (25 | 7.9%) accounting for the largest median family size of 5.72 persons per family. On the other hand, married-couple families (276 | 86.8%) represent the smallest median family size with 2.21 persons per family.
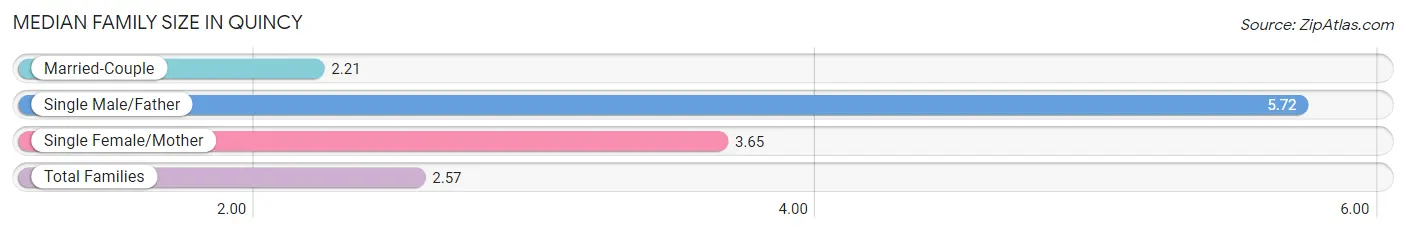
| Family Type | # Families | Family Size |
| Married-Couple | 276 (86.8%) | 2.21 |
| Single Male/Father | 25 (7.9%) | 5.72 |
| Single Female/Mother | 17 (5.3%) | 3.65 |
| Total Families | 318 (100.0%) | 2.57 |
Median Household Size in Quincy
The median household size in Quincy is 1.98 persons per household, with single male/father households (25 | 3.9%) accounting for the largest median household size of 5.72 persons per household. non-family households (330 | 50.9%) represent the smallest median household size with 1.36 persons per household.
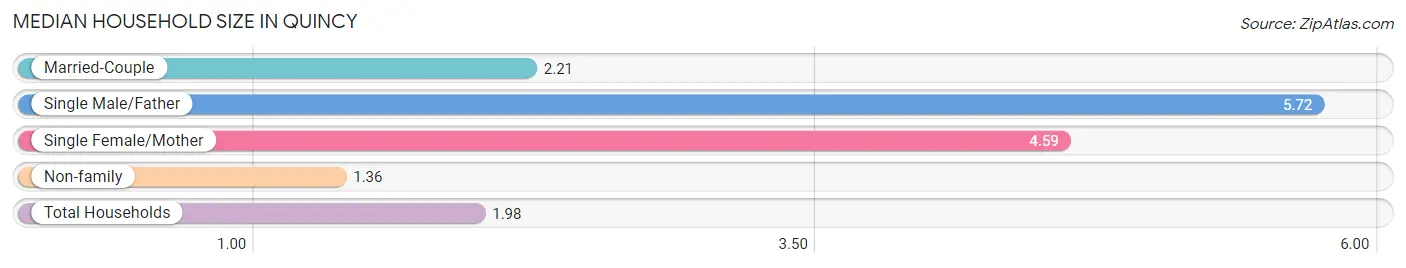
| Household Type | # Households | Household Size |
| Married-Couple | 276 (42.6%) | 2.21 |
| Single Male/Father | 25 (3.9%) | 5.72 |
| Single Female/Mother | 17 (2.6%) | 4.59 |
| Non-family | 330 (50.9%) | 1.36 |
| Total Households | 648 (100.0%) | 1.98 |
Household Size by Marriage Status in Quincy
Out of a total of 648 households in Quincy, 318 (49.1%) are family households, while 330 (50.9%) are nonfamily households. The most numerous type of family households are 2-person households, comprising 239, and the most common type of nonfamily households are 1-person households, comprising 253.
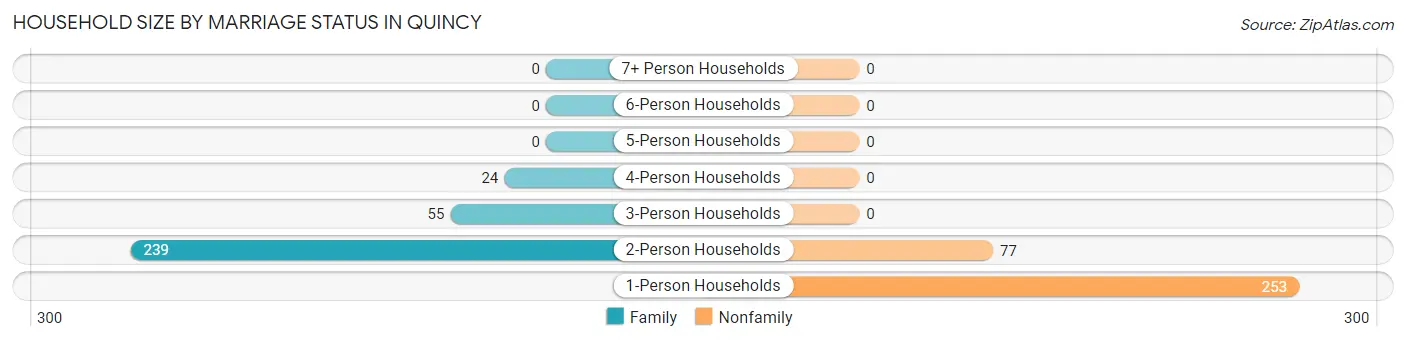
| Household Size | Family Households | Nonfamily Households |
| 1-Person Households | - | 253 (39.0%) |
| 2-Person Households | 239 (36.9%) | 77 (11.9%) |
| 3-Person Households | 55 (8.5%) | 0 (0.0%) |
| 4-Person Households | 24 (3.7%) | 0 (0.0%) |
| 5-Person Households | 0 (0.0%) | 0 (0.0%) |
| 6-Person Households | 0 (0.0%) | 0 (0.0%) |
| 7+ Person Households | 0 (0.0%) | 0 (0.0%) |
| Total | 318 (49.1%) | 330 (50.9%) |
Female Fertility in Quincy
Fertility by Age in Quincy
| Age Bracket | Women with Births | Births / 1,000 Women |
| 15 to 19 years | 0 (0.0%) | 0.0 |
| 20 to 34 years | 0 (0.0%) | 0.0 |
| 35 to 50 years | 0 (0.0%) | 0.0 |
| Total | 0 (0.0%) | 0.0 |
Fertility by Age by Marriage Status in Quincy
| Age Bracket | Married | Unmarried |
| 15 to 19 years | 0 (0.0%) | 0 (0.0%) |
| 20 to 34 years | 0 (0.0%) | 0 (0.0%) |
| 35 to 50 years | 0 (0.0%) | 0 (0.0%) |
| Total | 0 (0.0%) | 0 (0.0%) |
Fertility by Education in Quincy
| Educational Attainment | Women with Births | Births / 1,000 Women |
| Less than High School | 0 (0.0%) | 0.0 |
| High School Diploma | 0 (0.0%) | 0.0 |
| College or Associate's Degree | 0 (0.0%) | 0.0 |
| Bachelor's Degree | 0 (0.0%) | 0.0 |
| Graduate Degree | 0 (0.0%) | 0.0 |
| Total | 0 (0.0%) | 0.0 |
Fertility by Education by Marriage Status in Quincy
| Educational Attainment | Married | Unmarried |
| Less than High School | 0 (0.0%) | 0 (0.0%) |
| High School Diploma | 0 (0.0%) | 0 (0.0%) |
| College or Associate's Degree | 0 (0.0%) | 0 (0.0%) |
| Bachelor's Degree | 0 (0.0%) | 0 (0.0%) |
| Graduate Degree | 0 (0.0%) | 0 (0.0%) |
| Total | 0 (0.0%) | 0 (0.0%) |
Employment Characteristics in Quincy
Employment by Class of Employer in Quincy
Among the 586 employed individuals in Quincy, private company employees (218 | 37.2%), not-for-profit organizations (120 | 20.5%), and self-employed (not incorporated) (113 | 19.3%) make up the most common classes of employment.
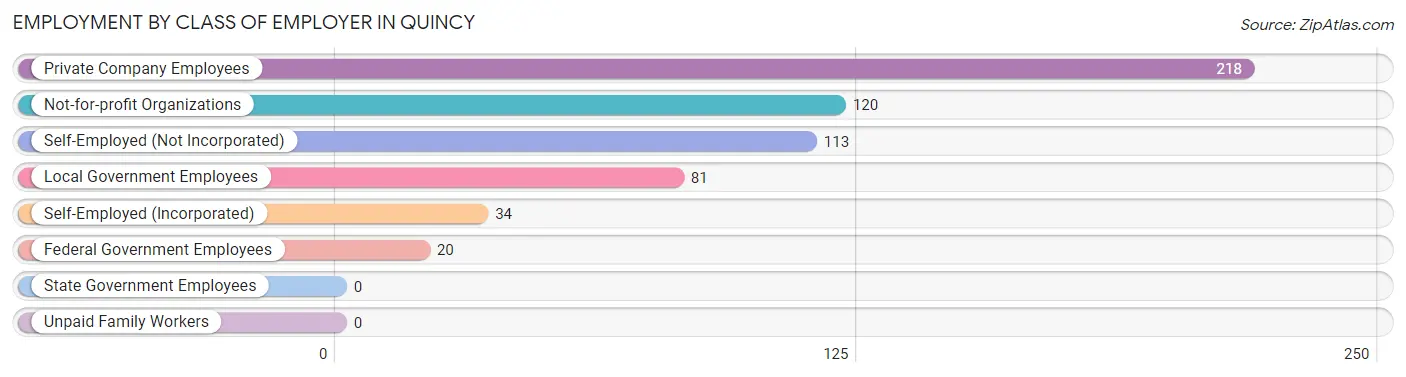
| Employer Class | # Employees | % Employees |
| Private Company Employees | 218 | 37.2% |
| Self-Employed (Incorporated) | 34 | 5.8% |
| Self-Employed (Not Incorporated) | 113 | 19.3% |
| Not-for-profit Organizations | 120 | 20.5% |
| Local Government Employees | 81 | 13.8% |
| State Government Employees | 0 | 0.0% |
| Federal Government Employees | 20 | 3.4% |
| Unpaid Family Workers | 0 | 0.0% |
| Total | 586 | 100.0% |
Employment Status by Age in Quincy
According to the labor force statistics for Quincy, out of the total population over 16 years of age (1,330), 54.4% or 724 individuals are in the labor force, with 11.9% or 86 of them unemployed. The age group with the highest labor force participation rate is 30 to 34 years, with 100.0% or 66 individuals in the labor force. Within the labor force, the 45 to 54 years age range has the highest percentage of unemployed individuals, with 44.1% or 45 of them being unemployed.
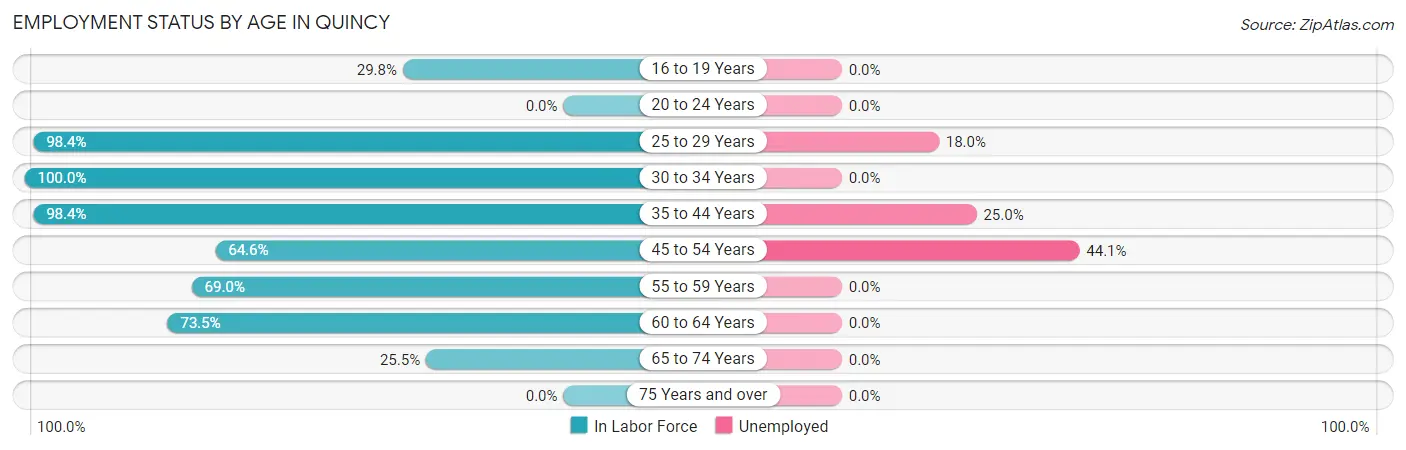
| Age Bracket | In Labor Force | Unemployed |
| 16 to 19 Years | 28 (29.8%) | 0 (0.0%) |
| 20 to 24 Years | 0 (0.0%) | 0 (0.0%) |
| 25 to 29 Years | 61 (98.4%) | 11 (18.0%) |
| 30 to 34 Years | 66 (100.0%) | 0 (0.0%) |
| 35 to 44 Years | 120 (98.4%) | 30 (25.0%) |
| 45 to 54 Years | 102 (64.6%) | 45 (44.1%) |
| 55 to 59 Years | 171 (69.0%) | 0 (0.0%) |
| 60 to 64 Years | 108 (73.5%) | 0 (0.0%) |
| 65 to 74 Years | 68 (25.5%) | 0 (0.0%) |
| 75 Years and over | 0 (0.0%) | 0 (0.0%) |
| Total | 724 (54.4%) | 86 (11.9%) |
Employment Status by Educational Attainment in Quincy
According to labor force statistics for Quincy, 78.2% of individuals (628) out of the total population between 25 and 64 years of age (803) are in the labor force, with 13.7% or 86 of them being unemployed. The group with the highest labor force participation rate are those with the educational attainment of high school diploma, with 90.6% or 212 individuals in the labor force. Within the labor force, individuals with high school diploma education have the highest percentage of unemployment, with 35.4% or 75 of them being unemployed.
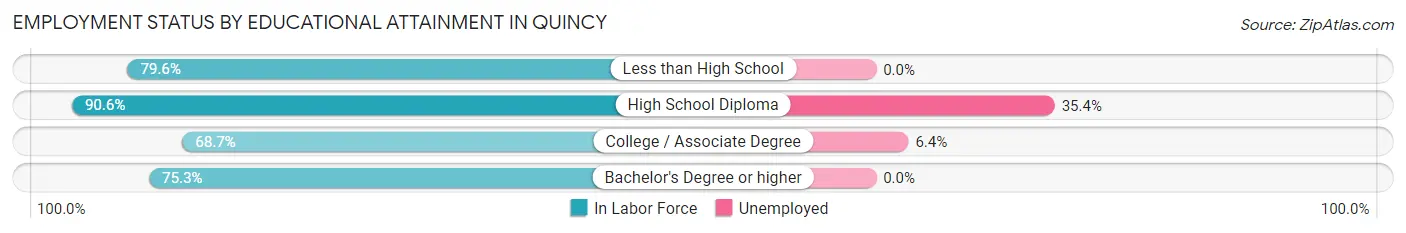
| Educational Attainment | In Labor Force | Unemployed |
| Less than High School | 78 (79.6%) | 0 (0.0%) |
| High School Diploma | 212 (90.6%) | 83 (35.4%) |
| College / Associate Degree | 173 (68.7%) | 16 (6.4%) |
| Bachelor's Degree or higher | 165 (75.3%) | 0 (0.0%) |
| Total | 628 (78.2%) | 110 (13.7%) |
Employment Occupations by Sex in Quincy
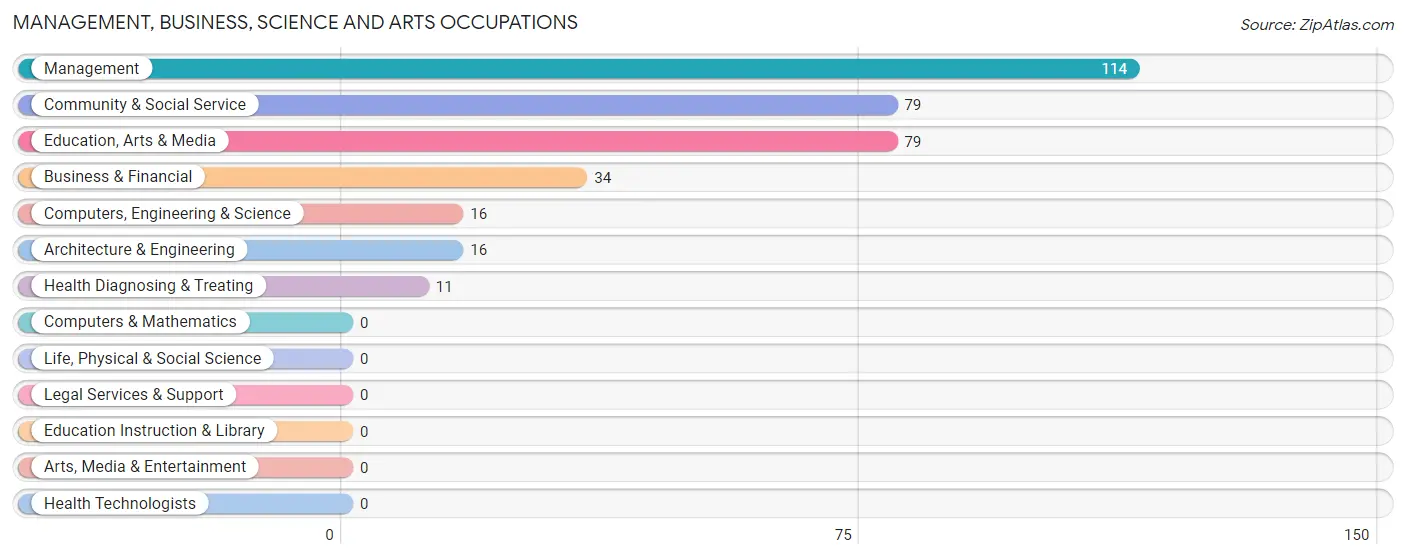
Management, Business, Science and Arts Occupations
The most common Management, Business, Science and Arts occupations in Quincy are Management (114 | 17.9%), Community & Social Service (79 | 12.4%), Education, Arts & Media (79 | 12.4%), Business & Financial (34 | 5.3%), and Computers, Engineering & Science (16 | 2.5%).
Management, Business, Science and Arts Occupations by Sex
Within the Management, Business, Science and Arts occupations in Quincy, the most male-oriented occupations are Computers, Engineering & Science (100.0%), Architecture & Engineering (100.0%), and Management (82.5%), while the most female-oriented occupations are Community & Social Service (100.0%), Education, Arts & Media (100.0%), and Health Diagnosing & Treating (100.0%).
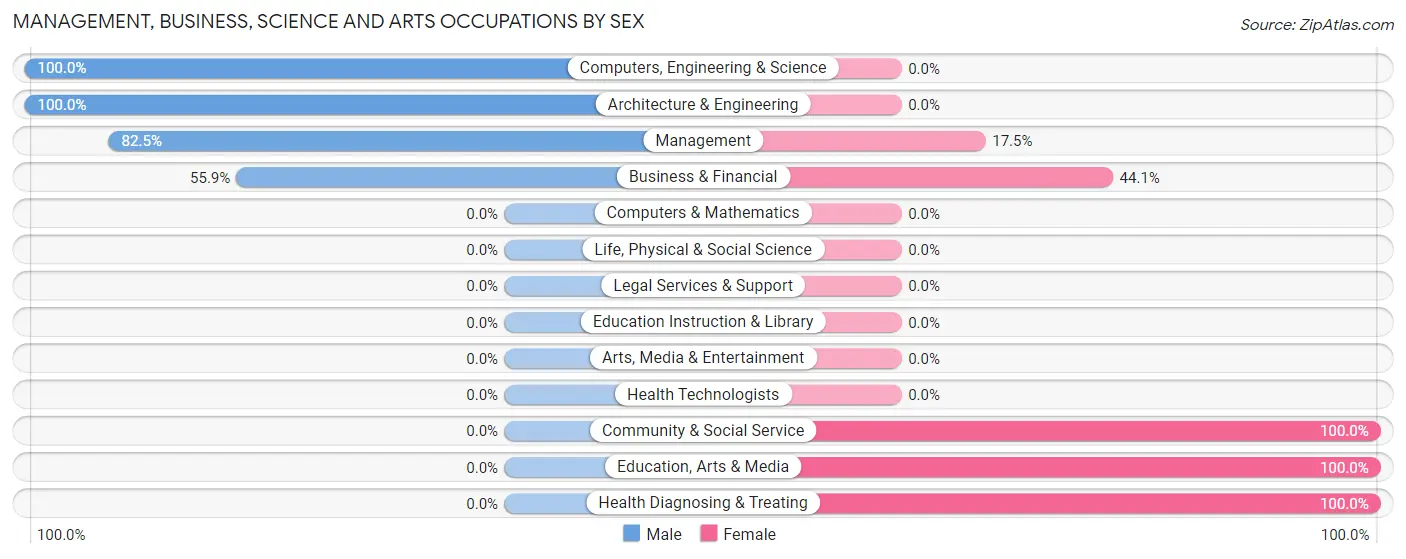
| Occupation | Male | Female |
| Management | 94 (82.5%) | 20 (17.5%) |
| Business & Financial | 19 (55.9%) | 15 (44.1%) |
| Computers, Engineering & Science | 16 (100.0%) | 0 (0.0%) |
| Computers & Mathematics | 0 (0.0%) | 0 (0.0%) |
| Architecture & Engineering | 16 (100.0%) | 0 (0.0%) |
| Life, Physical & Social Science | 0 (0.0%) | 0 (0.0%) |
| Community & Social Service | 0 (0.0%) | 79 (100.0%) |
| Education, Arts & Media | 0 (0.0%) | 79 (100.0%) |
| Legal Services & Support | 0 (0.0%) | 0 (0.0%) |
| Education Instruction & Library | 0 (0.0%) | 0 (0.0%) |
| Arts, Media & Entertainment | 0 (0.0%) | 0 (0.0%) |
| Health Diagnosing & Treating | 0 (0.0%) | 11 (100.0%) |
| Health Technologists | 0 (0.0%) | 0 (0.0%) |
| Total (Category) | 129 (50.8%) | 125 (49.2%) |
| Total (Overall) | 267 (41.8%) | 371 (58.2%) |
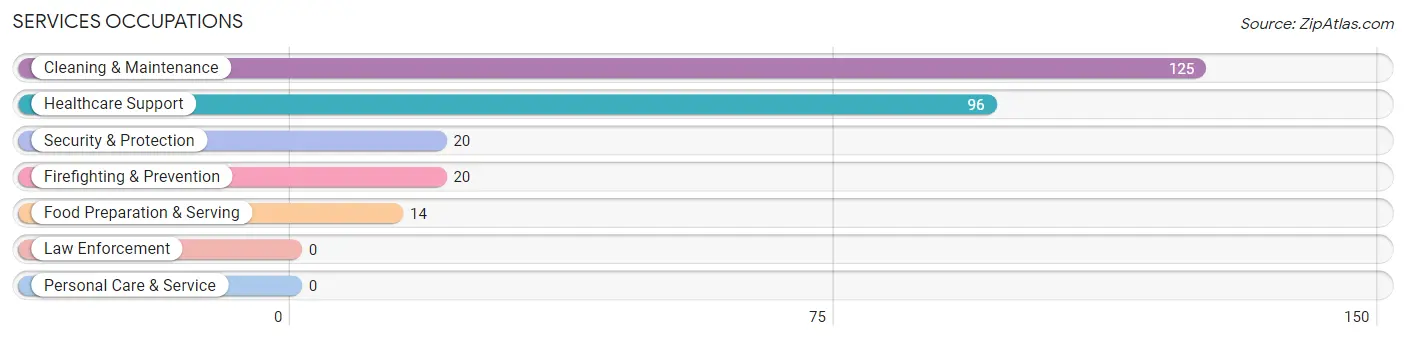
Services Occupations
The most common Services occupations in Quincy are Cleaning & Maintenance (125 | 19.6%), Healthcare Support (96 | 15.0%), Security & Protection (20 | 3.1%), Firefighting & Prevention (20 | 3.1%), and Food Preparation & Serving (14 | 2.2%).
Services Occupations by Sex
Within the Services occupations in Quincy, the most male-oriented occupations are Security & Protection (100.0%), Firefighting & Prevention (100.0%), and Cleaning & Maintenance (36.0%), while the most female-oriented occupations are Healthcare Support (100.0%), Food Preparation & Serving (100.0%), and Cleaning & Maintenance (64.0%).
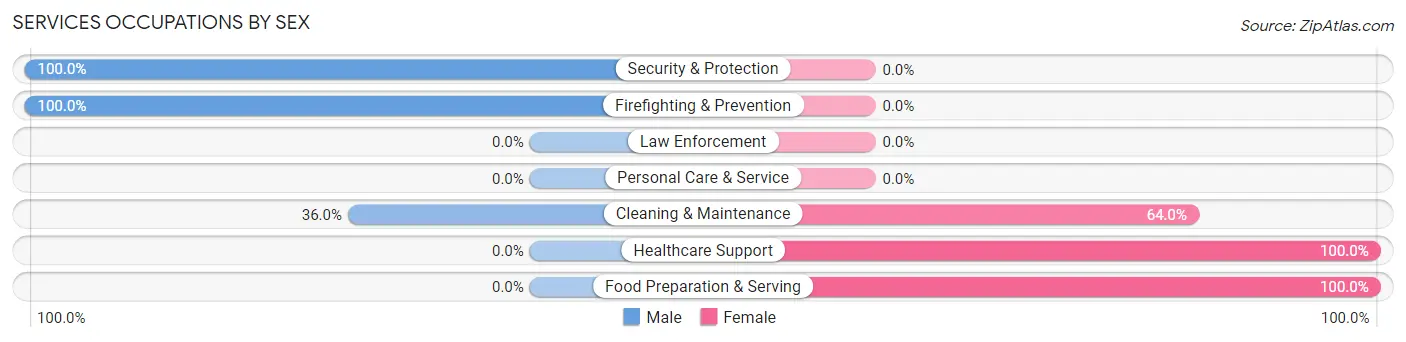
| Occupation | Male | Female |
| Healthcare Support | 0 (0.0%) | 96 (100.0%) |
| Security & Protection | 20 (100.0%) | 0 (0.0%) |
| Firefighting & Prevention | 20 (100.0%) | 0 (0.0%) |
| Law Enforcement | 0 (0.0%) | 0 (0.0%) |
| Food Preparation & Serving | 0 (0.0%) | 14 (100.0%) |
| Cleaning & Maintenance | 45 (36.0%) | 80 (64.0%) |
| Personal Care & Service | 0 (0.0%) | 0 (0.0%) |
| Total (Category) | 65 (25.5%) | 190 (74.5%) |
| Total (Overall) | 267 (41.8%) | 371 (58.2%) |
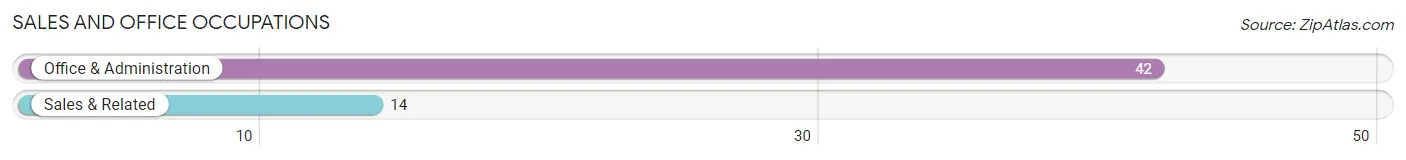
Sales and Office Occupations
The most common Sales and Office occupations in Quincy are Office & Administration (42 | 6.6%), and Sales & Related (14 | 2.2%).
Sales and Office Occupations by Sex
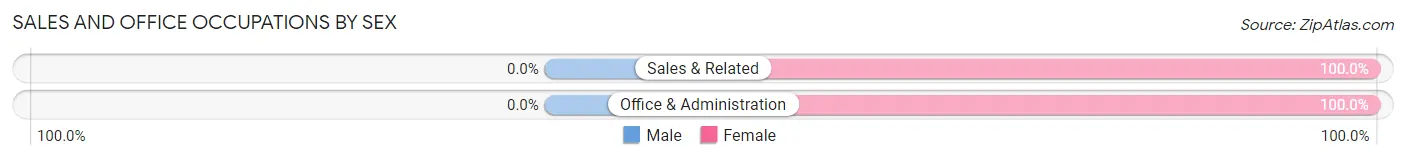
| Occupation | Male | Female |
| Sales & Related | 0 (0.0%) | 14 (100.0%) |
| Office & Administration | 0 (0.0%) | 42 (100.0%) |
| Total (Category) | 0 (0.0%) | 56 (100.0%) |
| Total (Overall) | 267 (41.8%) | 371 (58.2%) |
Natural Resources, Construction and Maintenance Occupations
Natural Resources, Construction and Maintenance Occupations by Sex
| Occupation | Male | Female |
| Farming, Fishing & Forestry | 0 (0.0%) | 0 (0.0%) |
| Construction & Extraction | 0 (0.0%) | 0 (0.0%) |
| Installation, Maintenance & Repair | 0 (0.0%) | 0 (0.0%) |
| Total (Category) | 0 (0.0%) | 0 (0.0%) |
| Total (Overall) | 267 (41.8%) | 371 (58.2%) |
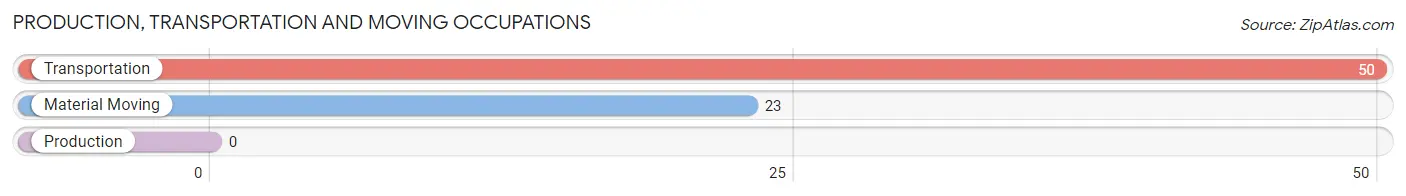
Production, Transportation and Moving Occupations
The most common Production, Transportation and Moving occupations in Quincy are Transportation (50 | 7.8%), and Material Moving (23 | 3.6%).
Production, Transportation and Moving Occupations by Sex
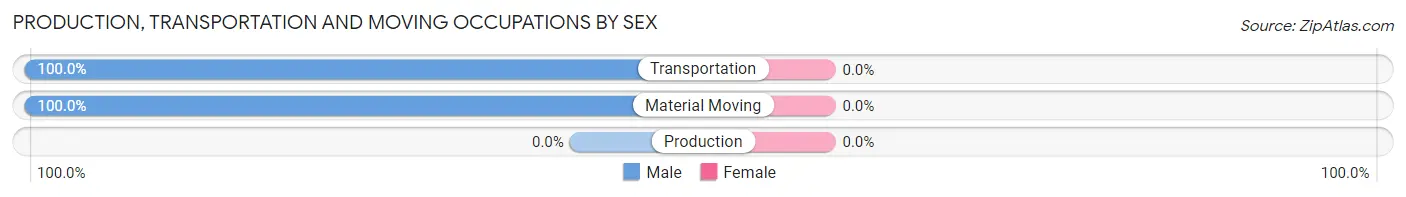
| Occupation | Male | Female |
| Production | 0 (0.0%) | 0 (0.0%) |
| Transportation | 50 (100.0%) | 0 (0.0%) |
| Material Moving | 23 (100.0%) | 0 (0.0%) |
| Total (Category) | 73 (100.0%) | 0 (0.0%) |
| Total (Overall) | 267 (41.8%) | 371 (58.2%) |
Employment Industries by Sex in Quincy
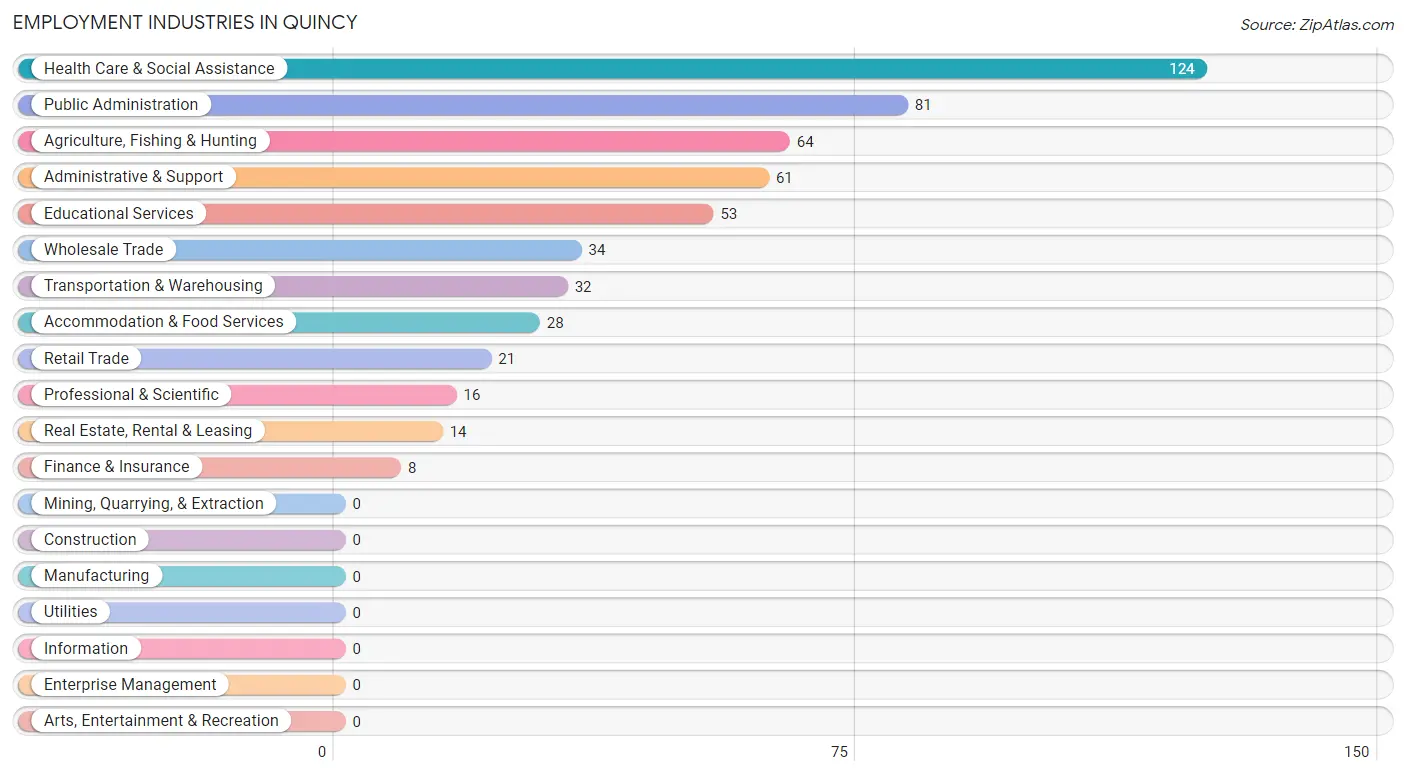
Employment Industries in Quincy
The major employment industries in Quincy include Health Care & Social Assistance (124 | 19.4%), Public Administration (81 | 12.7%), Agriculture, Fishing & Hunting (64 | 10.0%), Administrative & Support (61 | 9.6%), and Educational Services (53 | 8.3%).
Employment Industries by Sex in Quincy
The Quincy industries that see more men than women are Agriculture, Fishing & Hunting (100.0%), Transportation & Warehousing (100.0%), and Professional & Scientific (100.0%), whereas the industries that tend to have a higher number of women are Finance & Insurance (100.0%), Real Estate, Rental & Leasing (100.0%), and Health Care & Social Assistance (100.0%).
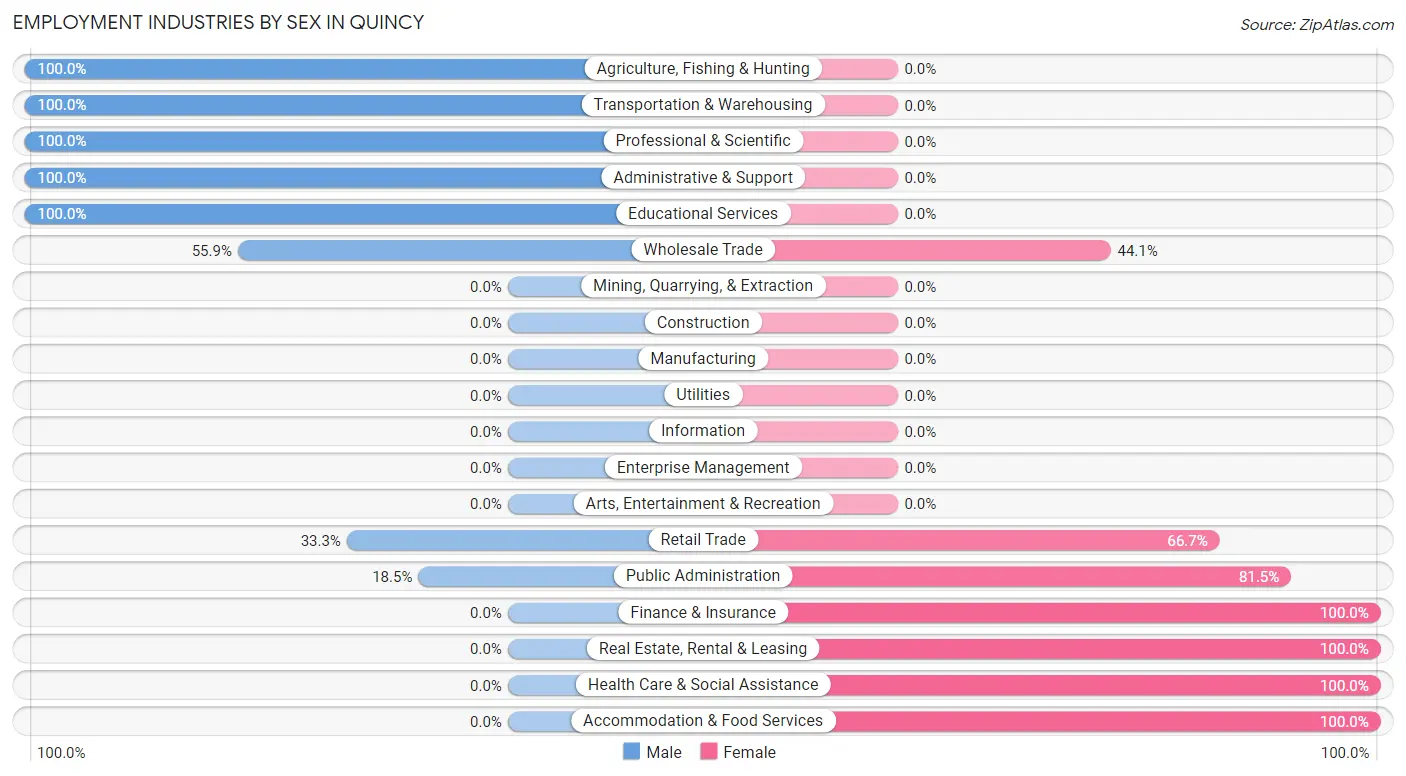
| Industry | Male | Female |
| Agriculture, Fishing & Hunting | 64 (100.0%) | 0 (0.0%) |
| Mining, Quarrying, & Extraction | 0 (0.0%) | 0 (0.0%) |
| Construction | 0 (0.0%) | 0 (0.0%) |
| Manufacturing | 0 (0.0%) | 0 (0.0%) |
| Wholesale Trade | 19 (55.9%) | 15 (44.1%) |
| Retail Trade | 7 (33.3%) | 14 (66.7%) |
| Transportation & Warehousing | 32 (100.0%) | 0 (0.0%) |
| Utilities | 0 (0.0%) | 0 (0.0%) |
| Information | 0 (0.0%) | 0 (0.0%) |
| Finance & Insurance | 0 (0.0%) | 8 (100.0%) |
| Real Estate, Rental & Leasing | 0 (0.0%) | 14 (100.0%) |
| Professional & Scientific | 16 (100.0%) | 0 (0.0%) |
| Enterprise Management | 0 (0.0%) | 0 (0.0%) |
| Administrative & Support | 61 (100.0%) | 0 (0.0%) |
| Educational Services | 53 (100.0%) | 0 (0.0%) |
| Health Care & Social Assistance | 0 (0.0%) | 124 (100.0%) |
| Arts, Entertainment & Recreation | 0 (0.0%) | 0 (0.0%) |
| Accommodation & Food Services | 0 (0.0%) | 28 (100.0%) |
| Public Administration | 15 (18.5%) | 66 (81.5%) |
| Total | 267 (41.8%) | 371 (58.2%) |
Education in Quincy
School Enrollment in Quincy
The most common levels of schooling among the 132 students in Quincy are college / undergraduate (66 | 50.0%), high school (28 | 21.2%), and middle school (22 | 16.7%).
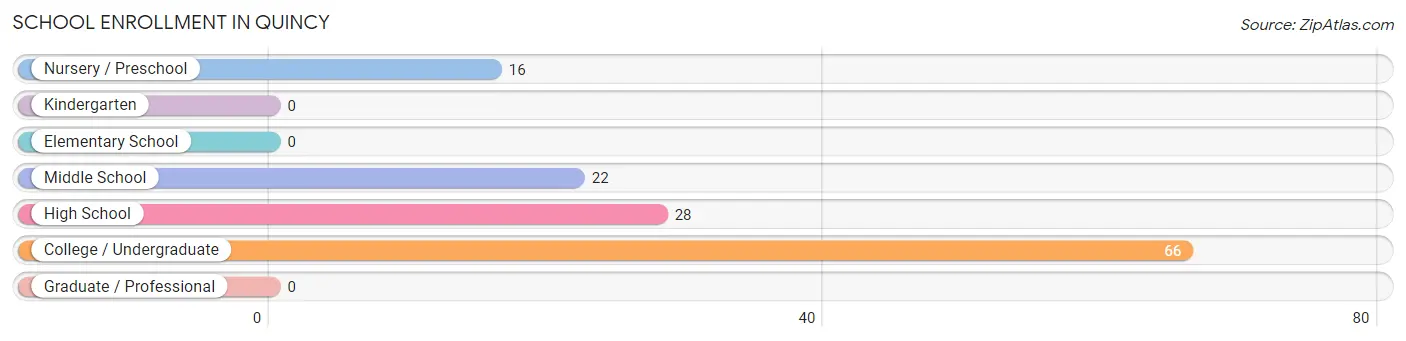
| School Level | # Students | % Students |
| Nursery / Preschool | 16 | 12.1% |
| Kindergarten | 0 | 0.0% |
| Elementary School | 0 | 0.0% |
| Middle School | 22 | 16.7% |
| High School | 28 | 21.2% |
| College / Undergraduate | 66 | 50.0% |
| Graduate / Professional | 0 | 0.0% |
| Total | 132 | 100.0% |
School Enrollment by Age by Funding Source in Quincy
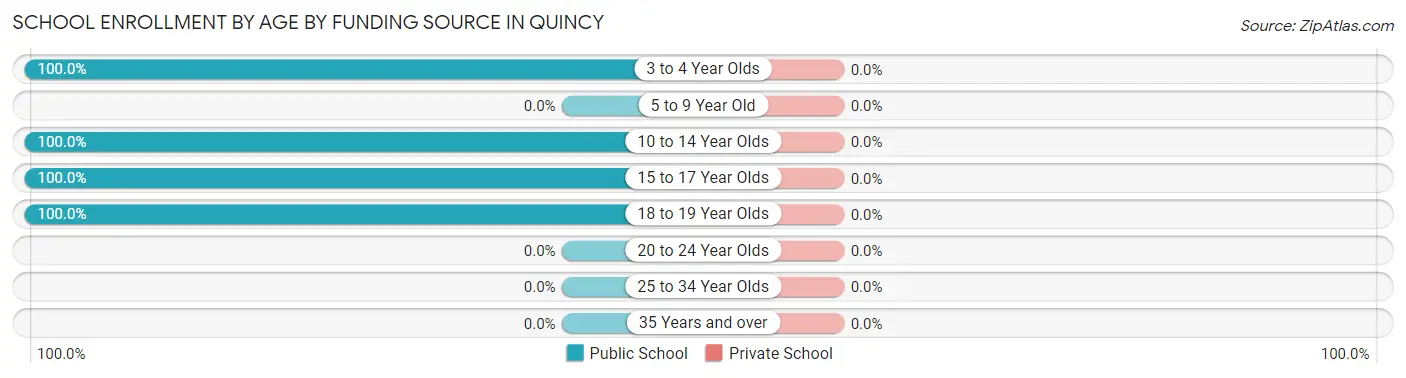
| Age Bracket | Public School | Private School |
| 3 to 4 Year Olds | 16 (100.0%) | 0 (0.0%) |
| 5 to 9 Year Old | 0 (0.0%) | 0 (0.0%) |
| 10 to 14 Year Olds | 22 (100.0%) | 0 (0.0%) |
| 15 to 17 Year Olds | 28 (100.0%) | 0 (0.0%) |
| 18 to 19 Year Olds | 66 (100.0%) | 0 (0.0%) |
| 20 to 24 Year Olds | 0 (0.0%) | 0 (0.0%) |
| 25 to 34 Year Olds | 0 (0.0%) | 0 (0.0%) |
| 35 Years and over | 0 (0.0%) | 0 (0.0%) |
| Total | 132 (100.0%) | 0 (0.0%) |
Educational Attainment by Field of Study in Quincy
Engineering (102 | 26.8%), psychology (84 | 22.1%), social sciences (42 | 11.1%), business (39 | 10.3%), and liberal arts & history (37 | 9.7%) are the most common fields of study among 380 individuals in Quincy who have obtained a bachelor's degree or higher.
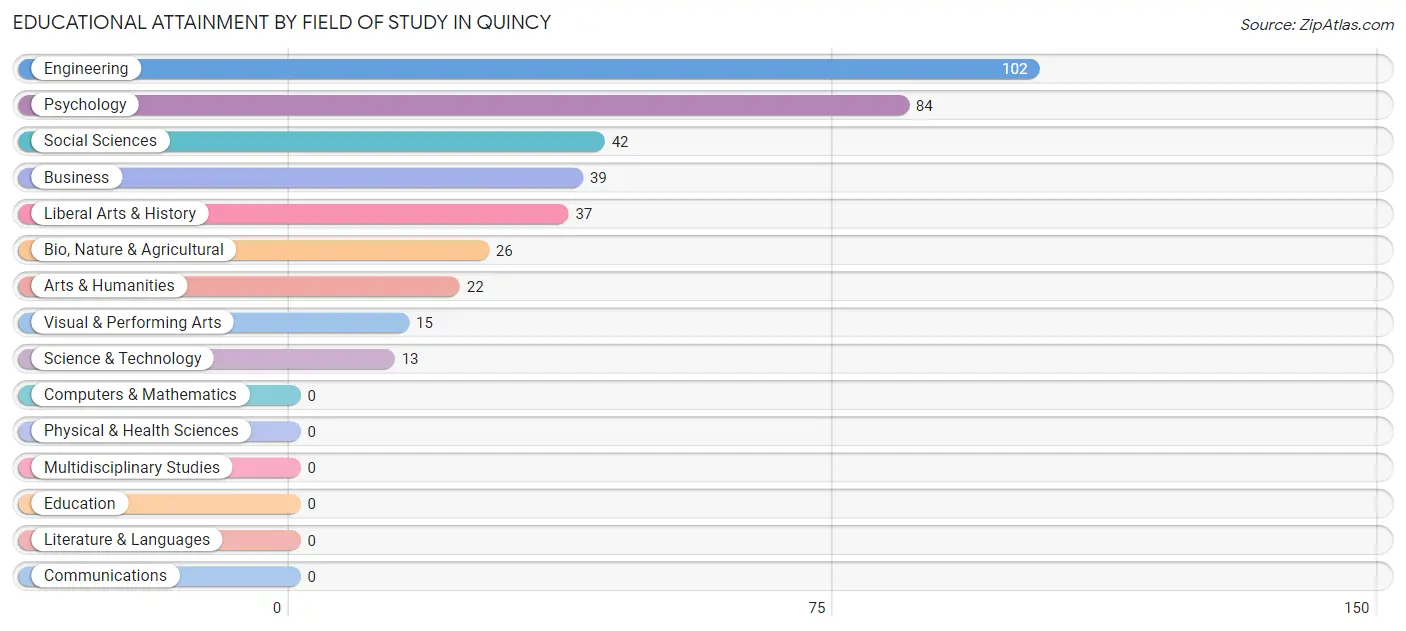
| Field of Study | # Graduates | % Graduates |
| Computers & Mathematics | 0 | 0.0% |
| Bio, Nature & Agricultural | 26 | 6.8% |
| Physical & Health Sciences | 0 | 0.0% |
| Psychology | 84 | 22.1% |
| Social Sciences | 42 | 11.1% |
| Engineering | 102 | 26.8% |
| Multidisciplinary Studies | 0 | 0.0% |
| Science & Technology | 13 | 3.4% |
| Business | 39 | 10.3% |
| Education | 0 | 0.0% |
| Literature & Languages | 0 | 0.0% |
| Liberal Arts & History | 37 | 9.7% |
| Visual & Performing Arts | 15 | 4.0% |
| Communications | 0 | 0.0% |
| Arts & Humanities | 22 | 5.8% |
| Total | 380 | 100.0% |
Transportation & Commute in Quincy
Vehicle Availability by Sex in Quincy
The most prevalent vehicle ownership categories in Quincy are males with 4 vehicles (95, accounting for 35.6%) and females with 4 vehicles (28, making up 32.4%).
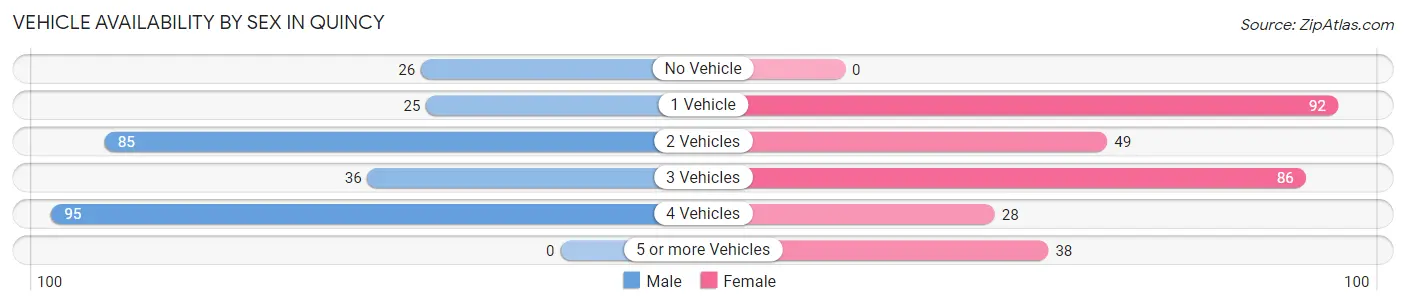
| Vehicles Available | Male | Female |
| No Vehicle | 26 (9.7%) | 0 (0.0%) |
| 1 Vehicle | 25 (9.4%) | 92 (31.4%) |
| 2 Vehicles | 85 (31.8%) | 49 (16.7%) |
| 3 Vehicles | 36 (13.5%) | 86 (29.3%) |
| 4 Vehicles | 95 (35.6%) | 28 (9.6%) |
| 5 or more Vehicles | 0 (0.0%) | 38 (13.0%) |
| Total | 267 (100.0%) | 293 (100.0%) |
Commute Time in Quincy
The most frequently occuring commute durations in Quincy are 5 to 9 minutes (107 commuters, 19.9%), 10 to 14 minutes (93 commuters, 17.2%), and 45 to 59 minutes (91 commuters, 16.9%).
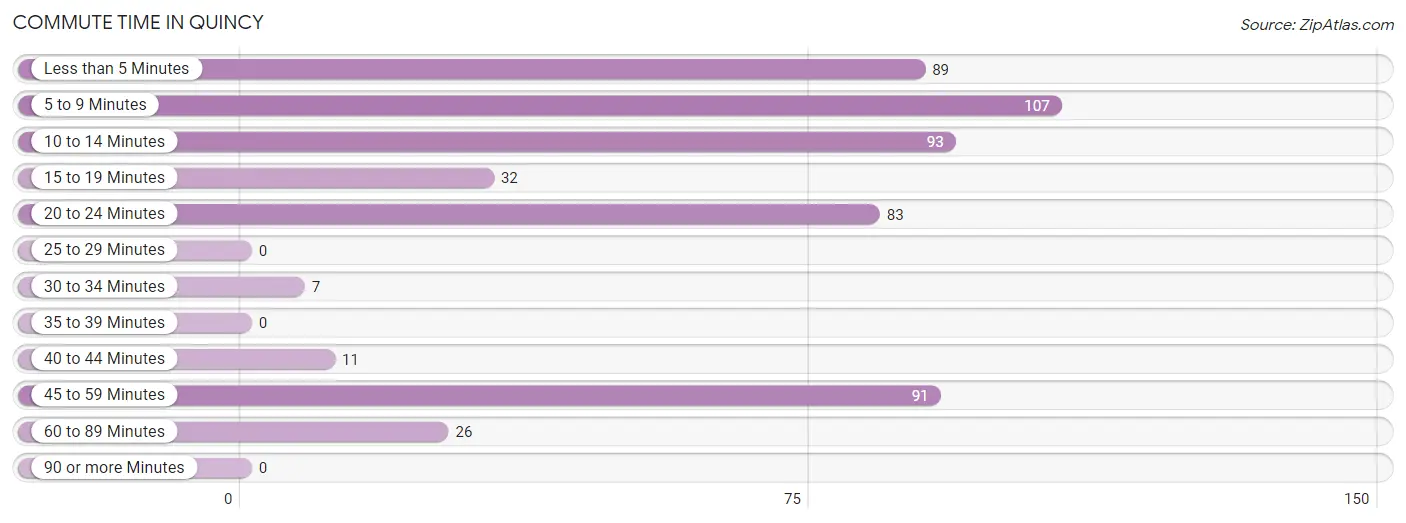
| Commute Time | # Commuters | % Commuters |
| Less than 5 Minutes | 89 | 16.5% |
| 5 to 9 Minutes | 107 | 19.9% |
| 10 to 14 Minutes | 93 | 17.2% |
| 15 to 19 Minutes | 32 | 5.9% |
| 20 to 24 Minutes | 83 | 15.4% |
| 25 to 29 Minutes | 0 | 0.0% |
| 30 to 34 Minutes | 7 | 1.3% |
| 35 to 39 Minutes | 0 | 0.0% |
| 40 to 44 Minutes | 11 | 2.0% |
| 45 to 59 Minutes | 91 | 16.9% |
| 60 to 89 Minutes | 26 | 4.8% |
| 90 or more Minutes | 0 | 0.0% |
Commute Time by Sex in Quincy
The most common commute times in Quincy are less than 5 minutes (76 commuters, 30.3%) for males and 20 to 24 minutes (83 commuters, 28.8%) for females.
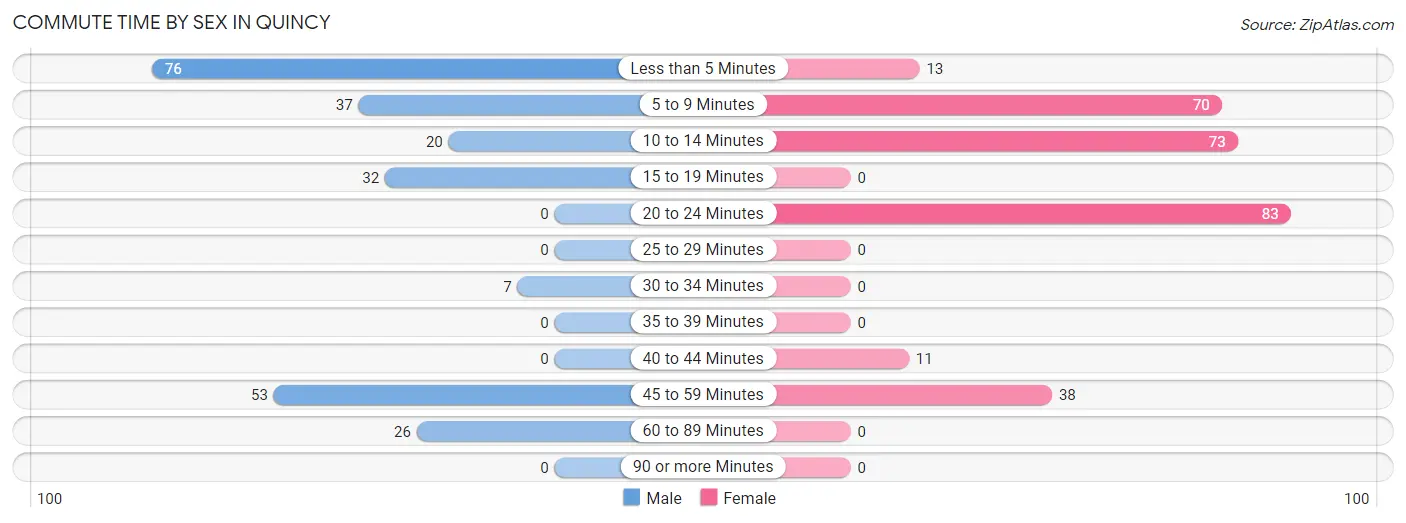
| Commute Time | Male | Female |
| Less than 5 Minutes | 76 (30.3%) | 13 (4.5%) |
| 5 to 9 Minutes | 37 (14.7%) | 70 (24.3%) |
| 10 to 14 Minutes | 20 (8.0%) | 73 (25.4%) |
| 15 to 19 Minutes | 32 (12.8%) | 0 (0.0%) |
| 20 to 24 Minutes | 0 (0.0%) | 83 (28.8%) |
| 25 to 29 Minutes | 0 (0.0%) | 0 (0.0%) |
| 30 to 34 Minutes | 7 (2.8%) | 0 (0.0%) |
| 35 to 39 Minutes | 0 (0.0%) | 0 (0.0%) |
| 40 to 44 Minutes | 0 (0.0%) | 11 (3.8%) |
| 45 to 59 Minutes | 53 (21.1%) | 38 (13.2%) |
| 60 to 89 Minutes | 26 (10.4%) | 0 (0.0%) |
| 90 or more Minutes | 0 (0.0%) | 0 (0.0%) |
Time of Departure to Work by Sex in Quincy
The most frequent times of departure to work in Quincy are 7:00 AM to 7:29 AM (65, 25.9%) for males and 6:30 AM to 6:59 AM (112, 38.9%) for females.
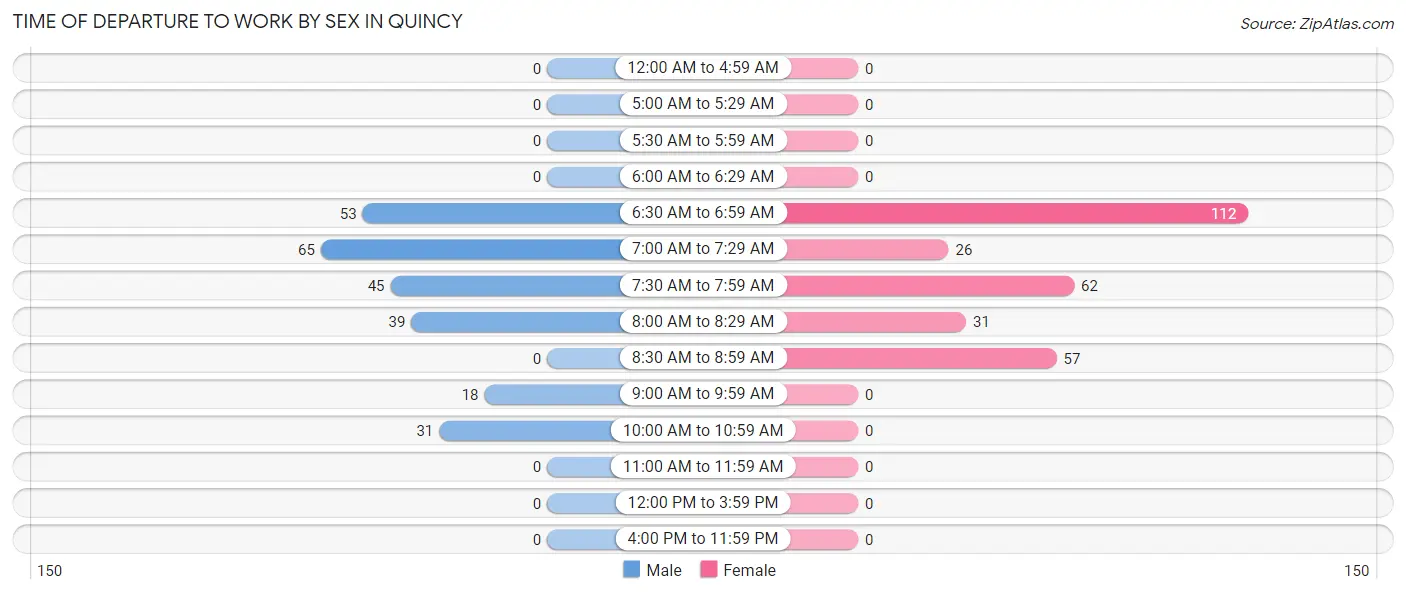
| Time of Departure | Male | Female |
| 12:00 AM to 4:59 AM | 0 (0.0%) | 0 (0.0%) |
| 5:00 AM to 5:29 AM | 0 (0.0%) | 0 (0.0%) |
| 5:30 AM to 5:59 AM | 0 (0.0%) | 0 (0.0%) |
| 6:00 AM to 6:29 AM | 0 (0.0%) | 0 (0.0%) |
| 6:30 AM to 6:59 AM | 53 (21.1%) | 112 (38.9%) |
| 7:00 AM to 7:29 AM | 65 (25.9%) | 26 (9.0%) |
| 7:30 AM to 7:59 AM | 45 (17.9%) | 62 (21.5%) |
| 8:00 AM to 8:29 AM | 39 (15.5%) | 31 (10.8%) |
| 8:30 AM to 8:59 AM | 0 (0.0%) | 57 (19.8%) |
| 9:00 AM to 9:59 AM | 18 (7.2%) | 0 (0.0%) |
| 10:00 AM to 10:59 AM | 31 (12.3%) | 0 (0.0%) |
| 11:00 AM to 11:59 AM | 0 (0.0%) | 0 (0.0%) |
| 12:00 PM to 3:59 PM | 0 (0.0%) | 0 (0.0%) |
| 4:00 PM to 11:59 PM | 0 (0.0%) | 0 (0.0%) |
| Total | 251 (100.0%) | 288 (100.0%) |
Housing Occupancy in Quincy
Occupancy by Ownership in Quincy
Of the total 648 dwellings in Quincy, owner-occupied units account for 246 (38.0%), while renter-occupied units make up 402 (62.0%).
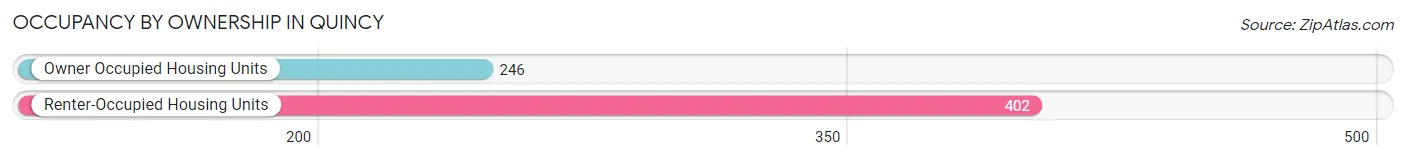
| Occupancy | # Housing Units | % Housing Units |
| Owner Occupied Housing Units | 246 | 38.0% |
| Renter-Occupied Housing Units | 402 | 62.0% |
| Total Occupied Housing Units | 648 | 100.0% |
Occupancy by Household Size in Quincy
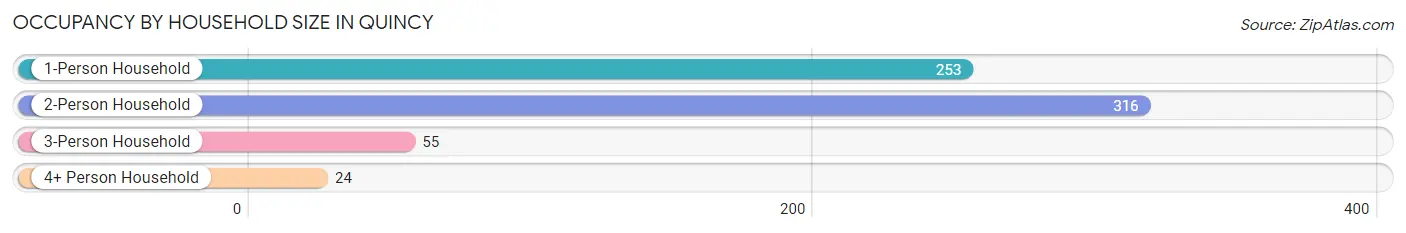
| Household Size | # Housing Units | % Housing Units |
| 1-Person Household | 253 | 39.0% |
| 2-Person Household | 316 | 48.8% |
| 3-Person Household | 55 | 8.5% |
| 4+ Person Household | 24 | 3.7% |
| Total Housing Units | 648 | 100.0% |
Occupancy by Ownership by Household Size in Quincy
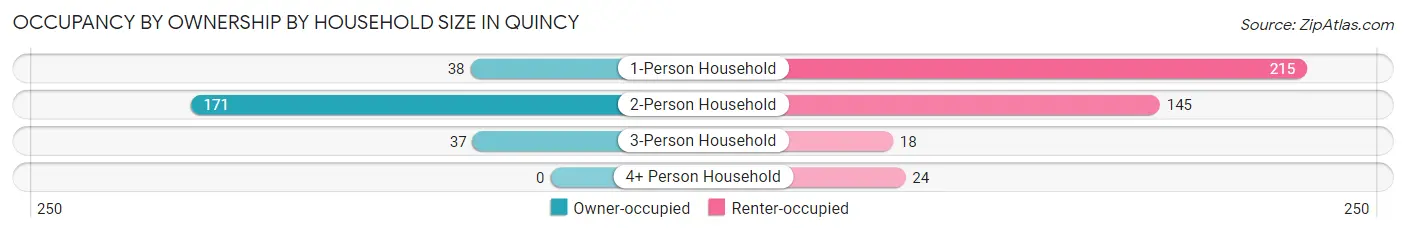
| Household Size | Owner-occupied | Renter-occupied |
| 1-Person Household | 38 (15.0%) | 215 (85.0%) |
| 2-Person Household | 171 (54.1%) | 145 (45.9%) |
| 3-Person Household | 37 (67.3%) | 18 (32.7%) |
| 4+ Person Household | 0 (0.0%) | 24 (100.0%) |
| Total Housing Units | 246 (38.0%) | 402 (62.0%) |
Occupancy by Educational Attainment in Quincy
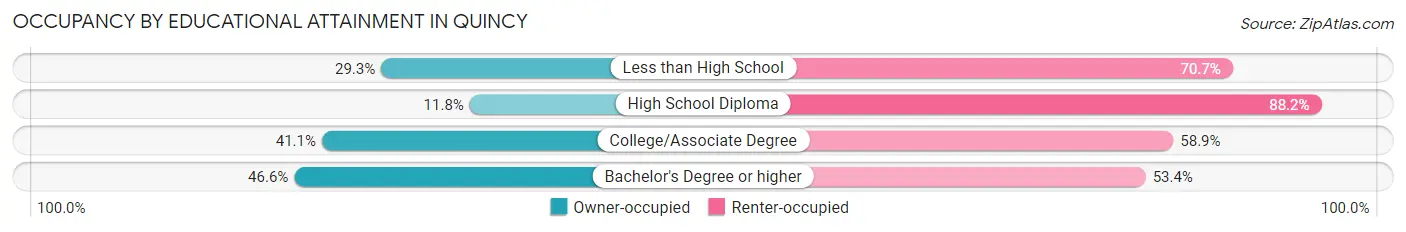
| Household Size | Owner-occupied | Renter-occupied |
| Less than High School | 22 (29.3%) | 53 (70.7%) |
| High School Diploma | 10 (11.8%) | 75 (88.2%) |
| College/Associate Degree | 99 (41.1%) | 142 (58.9%) |
| Bachelor's Degree or higher | 115 (46.6%) | 132 (53.4%) |
Occupancy by Age of Householder in Quincy
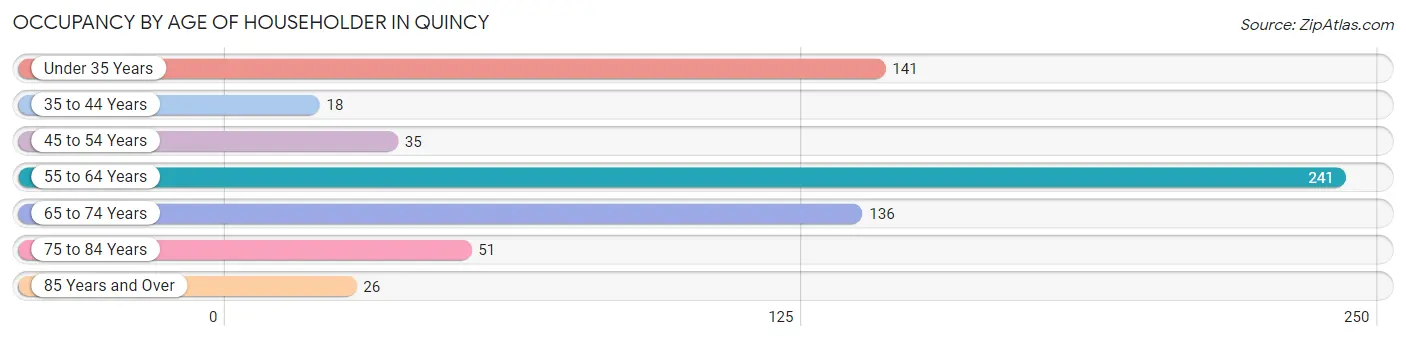
| Age Bracket | # Households | % Households |
| Under 35 Years | 141 | 21.8% |
| 35 to 44 Years | 18 | 2.8% |
| 45 to 54 Years | 35 | 5.4% |
| 55 to 64 Years | 241 | 37.2% |
| 65 to 74 Years | 136 | 21.0% |
| 75 to 84 Years | 51 | 7.9% |
| 85 Years and Over | 26 | 4.0% |
| Total | 648 | 100.0% |
Housing Finances in Quincy
Median Income by Occupancy in Quincy
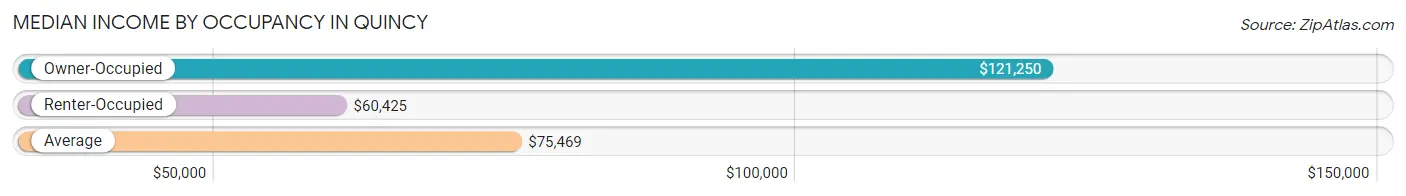
| Occupancy Type | # Households | Median Income |
| Owner-Occupied | 246 (38.0%) | $121,250 |
| Renter-Occupied | 402 (62.0%) | $60,425 |
| Average | 648 (100.0%) | $75,469 |
Occupancy by Householder Income Bracket in Quincy
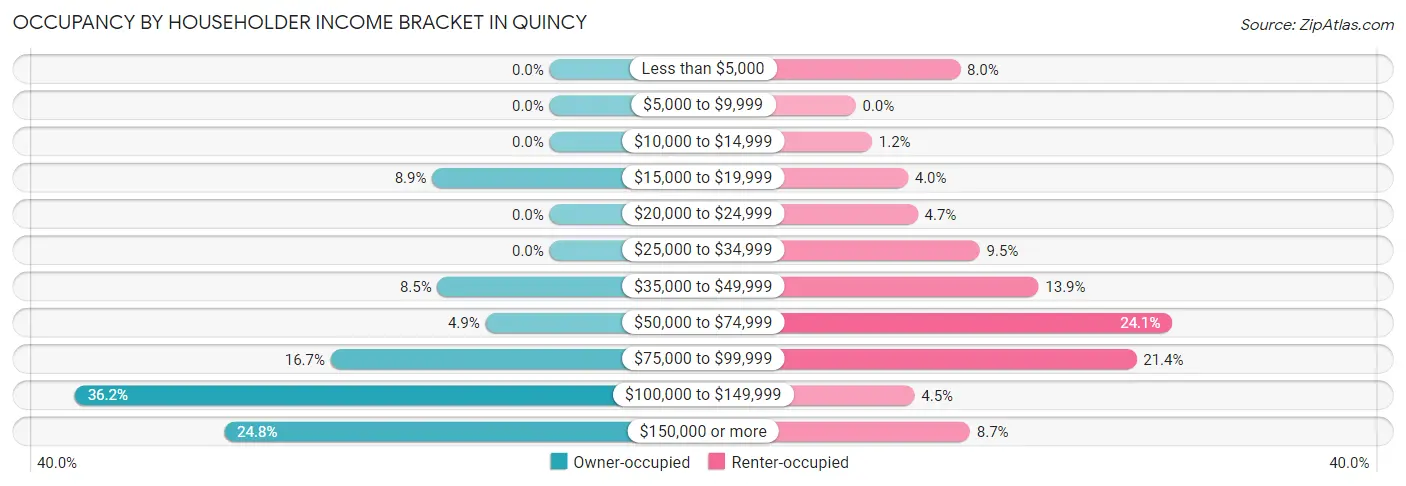
| Income Bracket | Owner-occupied | Renter-occupied |
| Less than $5,000 | 0 (0.0%) | 32 (8.0%) |
| $5,000 to $9,999 | 0 (0.0%) | 0 (0.0%) |
| $10,000 to $14,999 | 0 (0.0%) | 5 (1.2%) |
| $15,000 to $19,999 | 22 (8.9%) | 16 (4.0%) |
| $20,000 to $24,999 | 0 (0.0%) | 19 (4.7%) |
| $25,000 to $34,999 | 0 (0.0%) | 38 (9.5%) |
| $35,000 to $49,999 | 21 (8.5%) | 56 (13.9%) |
| $50,000 to $74,999 | 12 (4.9%) | 97 (24.1%) |
| $75,000 to $99,999 | 41 (16.7%) | 86 (21.4%) |
| $100,000 to $149,999 | 89 (36.2%) | 18 (4.5%) |
| $150,000 or more | 61 (24.8%) | 35 (8.7%) |
| Total | 246 (100.0%) | 402 (100.0%) |
Monthly Housing Cost Tiers in Quincy
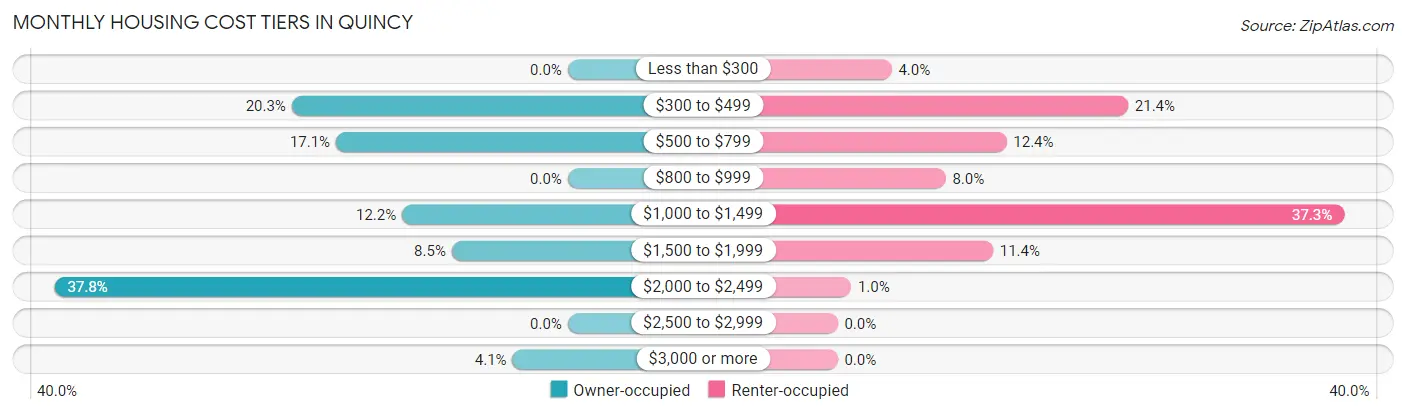
| Monthly Cost | Owner-occupied | Renter-occupied |
| Less than $300 | 0 (0.0%) | 16 (4.0%) |
| $300 to $499 | 50 (20.3%) | 86 (21.4%) |
| $500 to $799 | 42 (17.1%) | 50 (12.4%) |
| $800 to $999 | 0 (0.0%) | 32 (8.0%) |
| $1,000 to $1,499 | 30 (12.2%) | 150 (37.3%) |
| $1,500 to $1,999 | 21 (8.5%) | 46 (11.4%) |
| $2,000 to $2,499 | 93 (37.8%) | 4 (1.0%) |
| $2,500 to $2,999 | 0 (0.0%) | 0 (0.0%) |
| $3,000 or more | 10 (4.1%) | 0 (0.0%) |
| Total | 246 (100.0%) | 402 (100.0%) |
Physical Housing Characteristics in Quincy
Housing Structures in Quincy
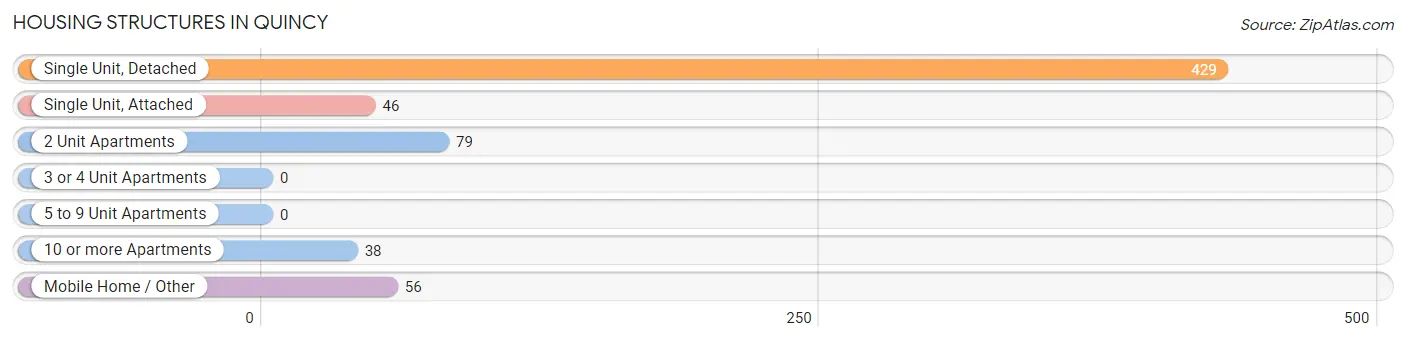
| Structure Type | # Housing Units | % Housing Units |
| Single Unit, Detached | 429 | 66.2% |
| Single Unit, Attached | 46 | 7.1% |
| 2 Unit Apartments | 79 | 12.2% |
| 3 or 4 Unit Apartments | 0 | 0.0% |
| 5 to 9 Unit Apartments | 0 | 0.0% |
| 10 or more Apartments | 38 | 5.9% |
| Mobile Home / Other | 56 | 8.6% |
| Total | 648 | 100.0% |
Housing Structures by Occupancy in Quincy
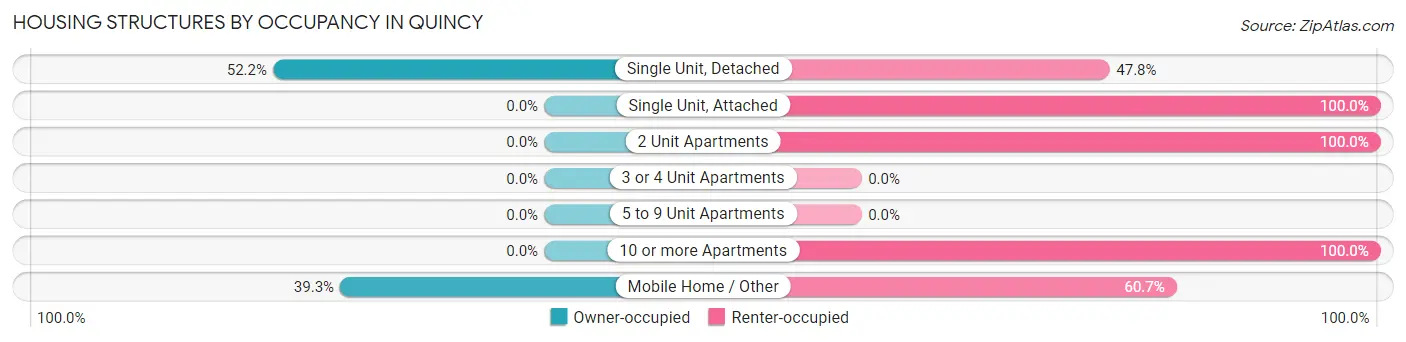
| Structure Type | Owner-occupied | Renter-occupied |
| Single Unit, Detached | 224 (52.2%) | 205 (47.8%) |
| Single Unit, Attached | 0 (0.0%) | 46 (100.0%) |
| 2 Unit Apartments | 0 (0.0%) | 79 (100.0%) |
| 3 or 4 Unit Apartments | 0 (0.0%) | 0 (0.0%) |
| 5 to 9 Unit Apartments | 0 (0.0%) | 0 (0.0%) |
| 10 or more Apartments | 0 (0.0%) | 38 (100.0%) |
| Mobile Home / Other | 22 (39.3%) | 34 (60.7%) |
| Total | 246 (38.0%) | 402 (62.0%) |
Housing Structures by Number of Rooms in Quincy
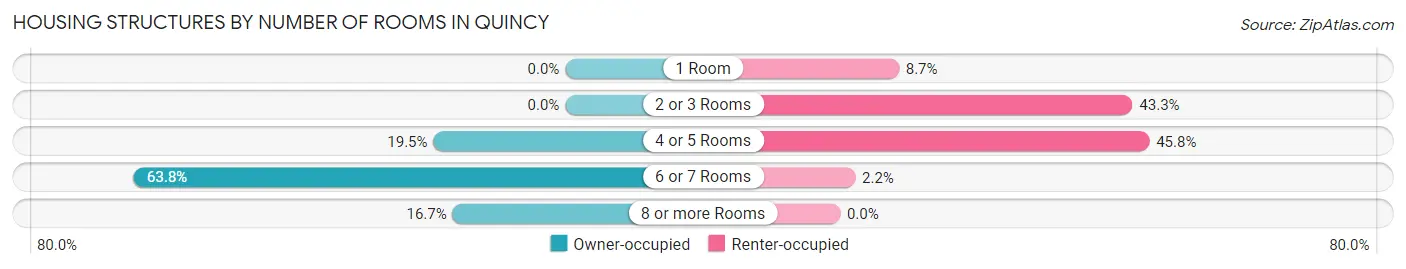
| Number of Rooms | Owner-occupied | Renter-occupied |
| 1 Room | 0 (0.0%) | 35 (8.7%) |
| 2 or 3 Rooms | 0 (0.0%) | 174 (43.3%) |
| 4 or 5 Rooms | 48 (19.5%) | 184 (45.8%) |
| 6 or 7 Rooms | 157 (63.8%) | 9 (2.2%) |
| 8 or more Rooms | 41 (16.7%) | 0 (0.0%) |
| Total | 246 (100.0%) | 402 (100.0%) |
Housing Structure by Heating Type in Quincy
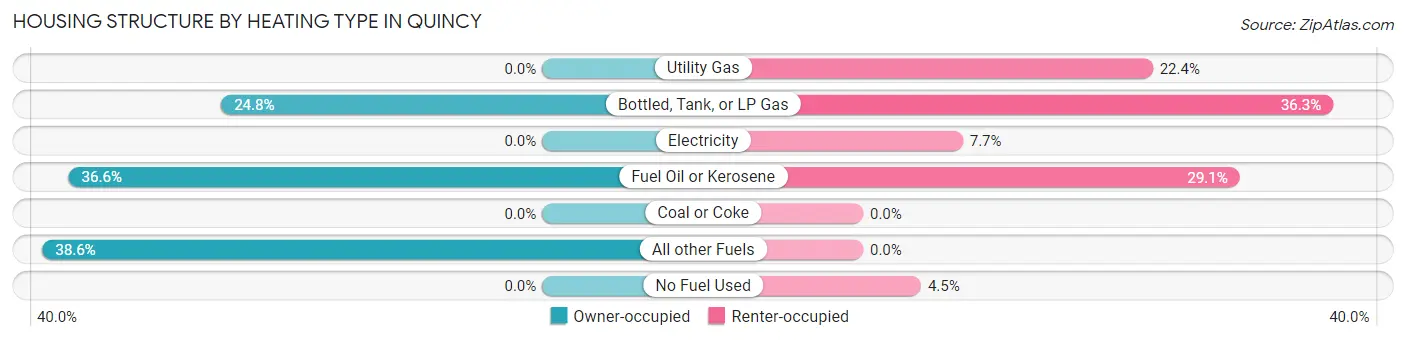
| Heating Type | Owner-occupied | Renter-occupied |
| Utility Gas | 0 (0.0%) | 90 (22.4%) |
| Bottled, Tank, or LP Gas | 61 (24.8%) | 146 (36.3%) |
| Electricity | 0 (0.0%) | 31 (7.7%) |
| Fuel Oil or Kerosene | 90 (36.6%) | 117 (29.1%) |
| Coal or Coke | 0 (0.0%) | 0 (0.0%) |
| All other Fuels | 95 (38.6%) | 0 (0.0%) |
| No Fuel Used | 0 (0.0%) | 18 (4.5%) |
| Total | 246 (100.0%) | 402 (100.0%) |
Household Vehicle Usage in Quincy
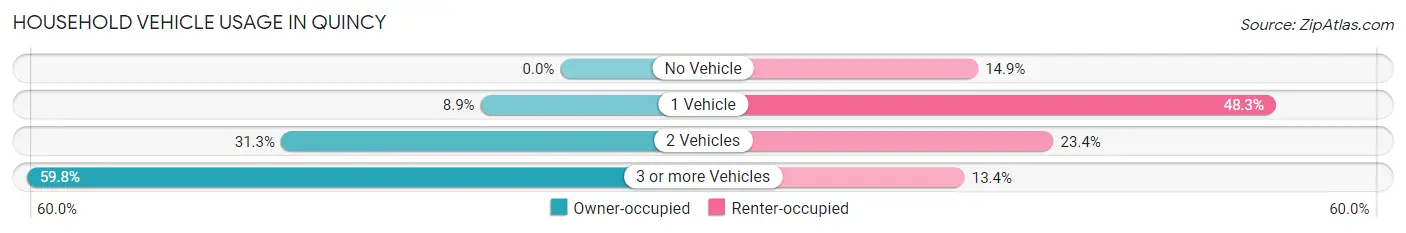
| Vehicles per Household | Owner-occupied | Renter-occupied |
| No Vehicle | 0 (0.0%) | 60 (14.9%) |
| 1 Vehicle | 22 (8.9%) | 194 (48.3%) |
| 2 Vehicles | 77 (31.3%) | 94 (23.4%) |
| 3 or more Vehicles | 147 (59.8%) | 54 (13.4%) |
| Total | 246 (100.0%) | 402 (100.0%) |
Real Estate & Mortgages in Quincy
Real Estate and Mortgage Overview in Quincy
| Characteristic | Without Mortgage | With Mortgage |
| Housing Units | 92 | 154 |
| Median Property Value | $206,500 | $300,000 |
| Median Household Income | $58,125 | $61 |
| Monthly Housing Costs | $486 | $10 |
| Real Estate Taxes | $1,087 | $0 |
Property Value by Mortgage Status in Quincy
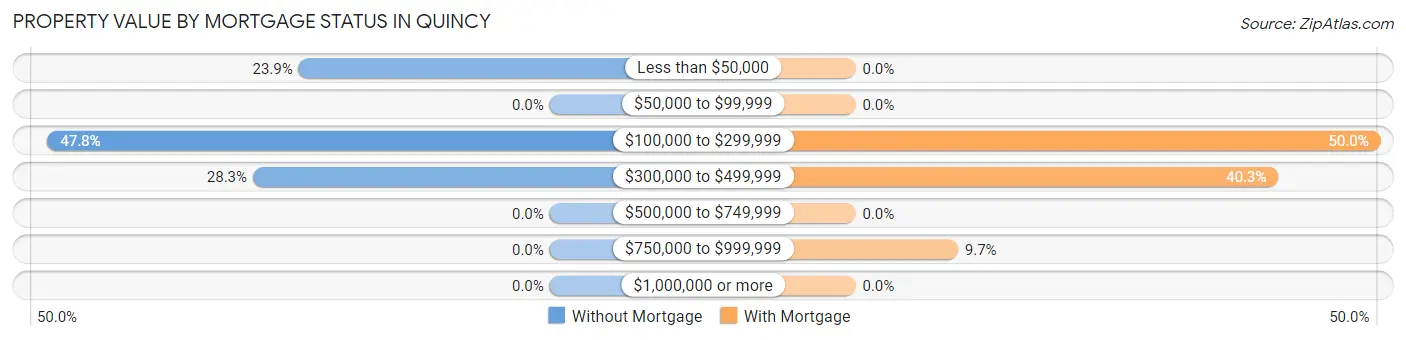
| Property Value | Without Mortgage | With Mortgage |
| Less than $50,000 | 22 (23.9%) | 0 (0.0%) |
| $50,000 to $99,999 | 0 (0.0%) | 0 (0.0%) |
| $100,000 to $299,999 | 44 (47.8%) | 77 (50.0%) |
| $300,000 to $499,999 | 26 (28.3%) | 62 (40.3%) |
| $500,000 to $749,999 | 0 (0.0%) | 0 (0.0%) |
| $750,000 to $999,999 | 0 (0.0%) | 15 (9.7%) |
| $1,000,000 or more | 0 (0.0%) | 0 (0.0%) |
| Total | 92 (100.0%) | 154 (100.0%) |
Household Income by Mortgage Status in Quincy
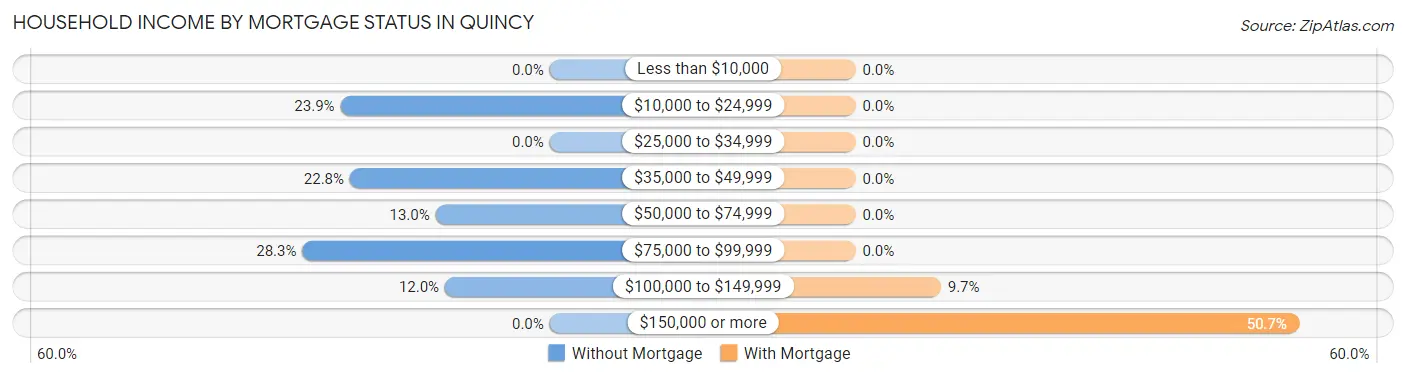
| Household Income | Without Mortgage | With Mortgage |
| Less than $10,000 | 0 (0.0%) | 0 (0.0%) |
| $10,000 to $24,999 | 22 (23.9%) | 0 (0.0%) |
| $25,000 to $34,999 | 0 (0.0%) | 0 (0.0%) |
| $35,000 to $49,999 | 21 (22.8%) | 0 (0.0%) |
| $50,000 to $74,999 | 12 (13.0%) | 0 (0.0%) |
| $75,000 to $99,999 | 26 (28.3%) | 0 (0.0%) |
| $100,000 to $149,999 | 11 (12.0%) | 15 (9.7%) |
| $150,000 or more | 0 (0.0%) | 78 (50.6%) |
| Total | 92 (100.0%) | 154 (100.0%) |
Property Value to Household Income Ratio in Quincy
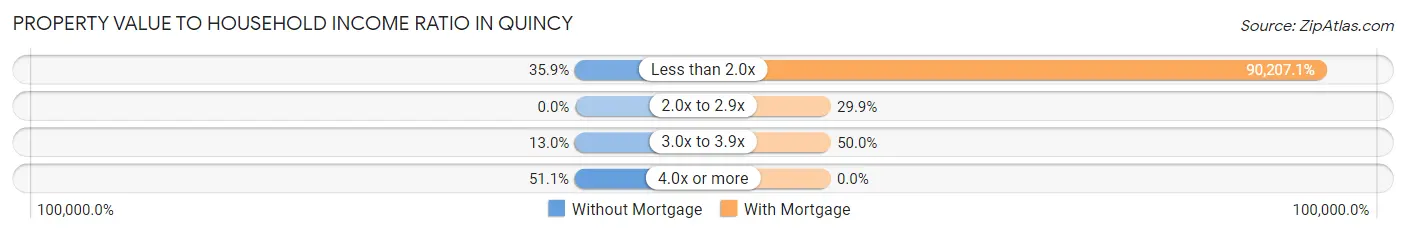
| Value-to-Income Ratio | Without Mortgage | With Mortgage |
| Less than 2.0x | 33 (35.9%) | 138,919 (90,207.1%) |
| 2.0x to 2.9x | 0 (0.0%) | 46 (29.9%) |
| 3.0x to 3.9x | 12 (13.0%) | 77 (50.0%) |
| 4.0x or more | 47 (51.1%) | 0 (0.0%) |
| Total | 92 (100.0%) | 154 (100.0%) |
Real Estate Taxes by Mortgage Status in Quincy
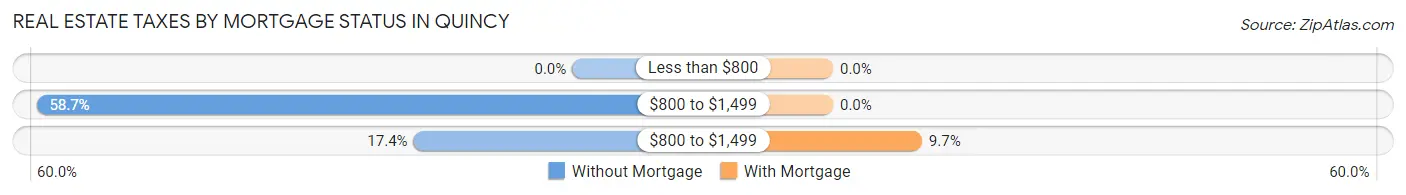
| Property Taxes | Without Mortgage | With Mortgage |
| Less than $800 | 0 (0.0%) | 0 (0.0%) |
| $800 to $1,499 | 54 (58.7%) | 0 (0.0%) |
| $800 to $1,499 | 16 (17.4%) | 15 (9.7%) |
| Total | 92 (100.0%) | 154 (100.0%) |
Health & Disability in Quincy
Health Insurance Coverage by Age in Quincy
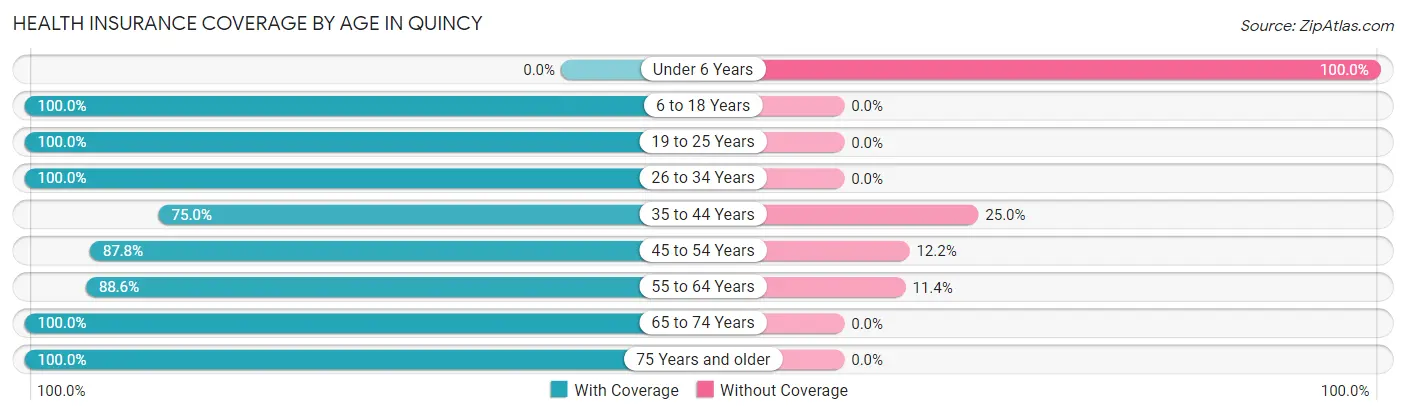
| Age Bracket | With Coverage | Without Coverage |
| Under 6 Years | 0 (0.0%) | 16 (100.0%) |
| 6 to 18 Years | 50 (100.0%) | 0 (0.0%) |
| 19 to 25 Years | 66 (100.0%) | 0 (0.0%) |
| 26 to 34 Years | 127 (100.0%) | 0 (0.0%) |
| 35 to 44 Years | 90 (75.0%) | 30 (25.0%) |
| 45 to 54 Years | 130 (87.8%) | 18 (12.2%) |
| 55 to 64 Years | 349 (88.6%) | 45 (11.4%) |
| 65 to 74 Years | 245 (100.0%) | 0 (0.0%) |
| 75 Years and older | 142 (100.0%) | 0 (0.0%) |
| Total | 1,199 (91.7%) | 109 (8.3%) |
Health Insurance Coverage by Citizenship Status in Quincy
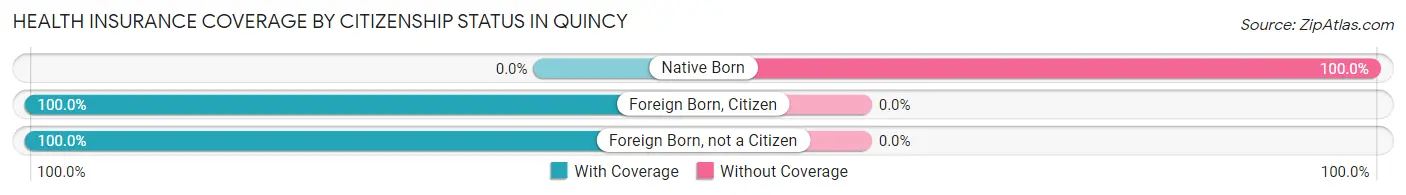
| Citizenship Status | With Coverage | Without Coverage |
| Native Born | 0 (0.0%) | 16 (100.0%) |
| Foreign Born, Citizen | 50 (100.0%) | 0 (0.0%) |
| Foreign Born, not a Citizen | 66 (100.0%) | 0 (0.0%) |
Health Insurance Coverage by Household Income in Quincy
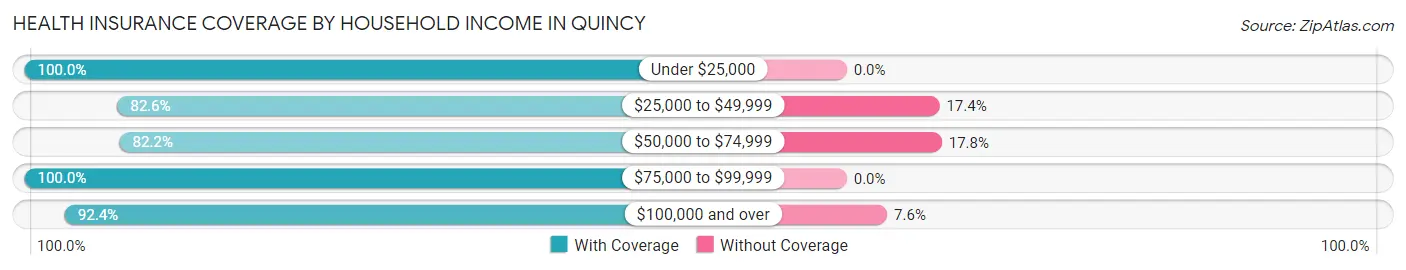
| Household Income | With Coverage | Without Coverage |
| Under $25,000 | 128 (100.0%) | 0 (0.0%) |
| $25,000 to $49,999 | 214 (82.6%) | 45 (17.4%) |
| $50,000 to $74,999 | 157 (82.2%) | 34 (17.8%) |
| $75,000 to $99,999 | 307 (100.0%) | 0 (0.0%) |
| $100,000 and over | 367 (92.4%) | 30 (7.6%) |
Public vs Private Health Insurance Coverage by Age in Quincy
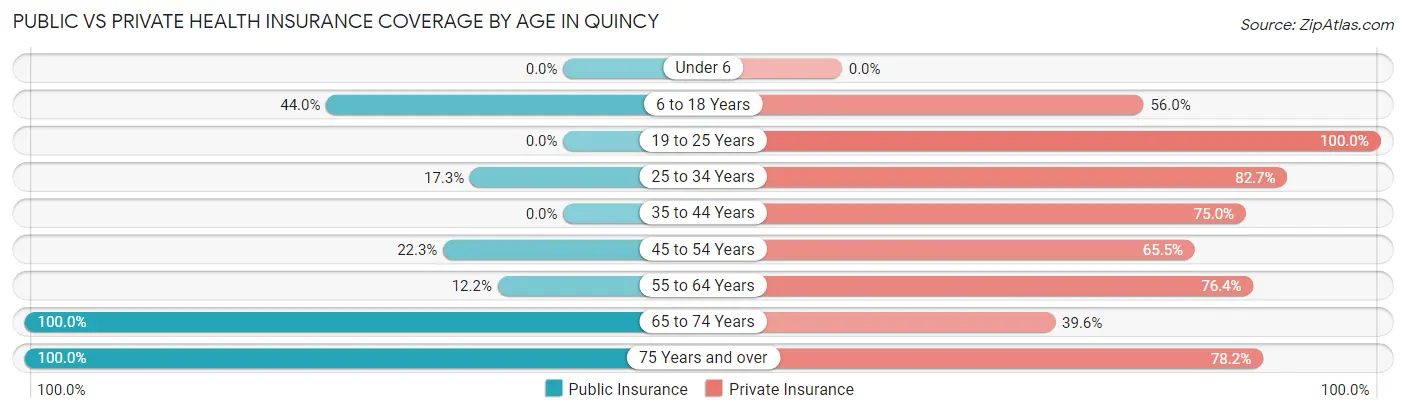
| Age Bracket | Public Insurance | Private Insurance |
| Under 6 | 0 (0.0%) | 0 (0.0%) |
| 6 to 18 Years | 22 (44.0%) | 28 (56.0%) |
| 19 to 25 Years | 0 (0.0%) | 66 (100.0%) |
| 25 to 34 Years | 22 (17.3%) | 105 (82.7%) |
| 35 to 44 Years | 0 (0.0%) | 90 (75.0%) |
| 45 to 54 Years | 33 (22.3%) | 97 (65.5%) |
| 55 to 64 Years | 48 (12.2%) | 301 (76.4%) |
| 65 to 74 Years | 245 (100.0%) | 97 (39.6%) |
| 75 Years and over | 142 (100.0%) | 111 (78.2%) |
| Total | 512 (39.1%) | 895 (68.4%) |
Disability Status by Sex by Age in Quincy
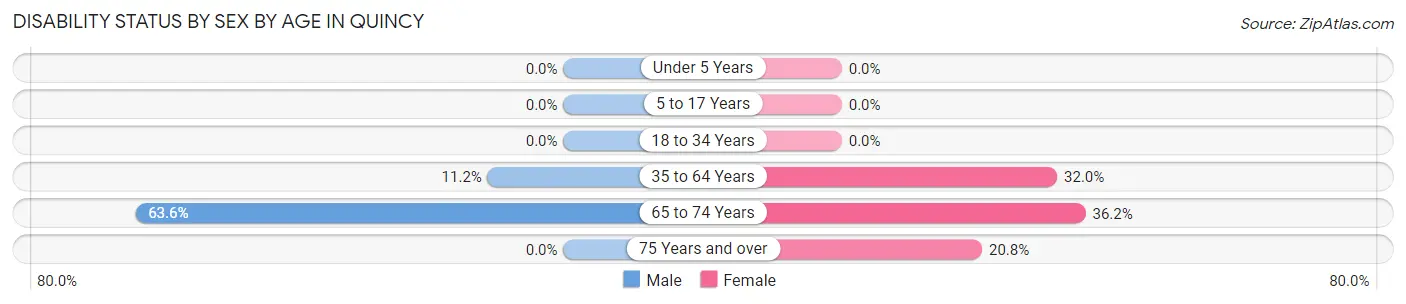
| Age Bracket | Male | Female |
| Under 5 Years | 0 (0.0%) | 0 (0.0%) |
| 5 to 17 Years | 0 (0.0%) | 0 (0.0%) |
| 18 to 34 Years | 0 (0.0%) | 0 (0.0%) |
| 35 to 64 Years | 47 (11.2%) | 78 (32.0%) |
| 65 to 74 Years | 89 (63.6%) | 38 (36.2%) |
| 75 Years and over | 0 (0.0%) | 15 (20.8%) |
Disability Class by Sex by Age in Quincy
Disability Class: Hearing Difficulty
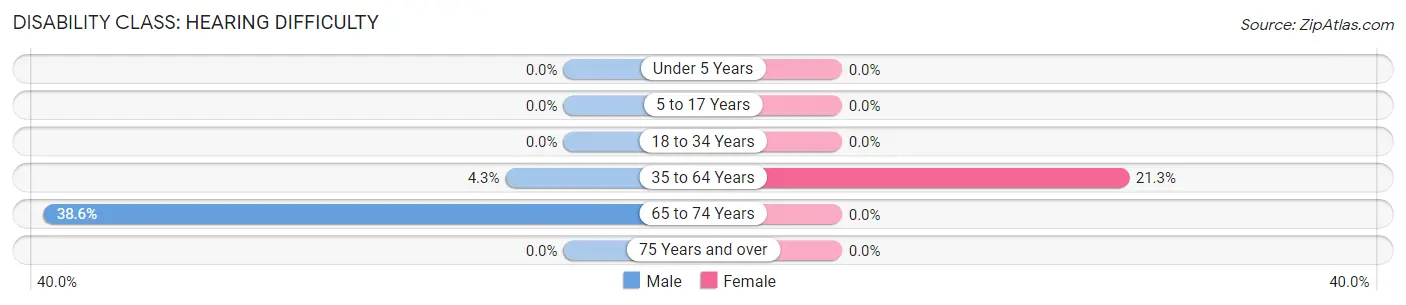
| Age Bracket | Male | Female |
| Under 5 Years | 0 (0.0%) | 0 (0.0%) |
| 5 to 17 Years | 0 (0.0%) | 0 (0.0%) |
| 18 to 34 Years | 0 (0.0%) | 0 (0.0%) |
| 35 to 64 Years | 18 (4.3%) | 52 (21.3%) |
| 65 to 74 Years | 54 (38.6%) | 0 (0.0%) |
| 75 Years and over | 0 (0.0%) | 0 (0.0%) |
Disability Class: Vision Difficulty
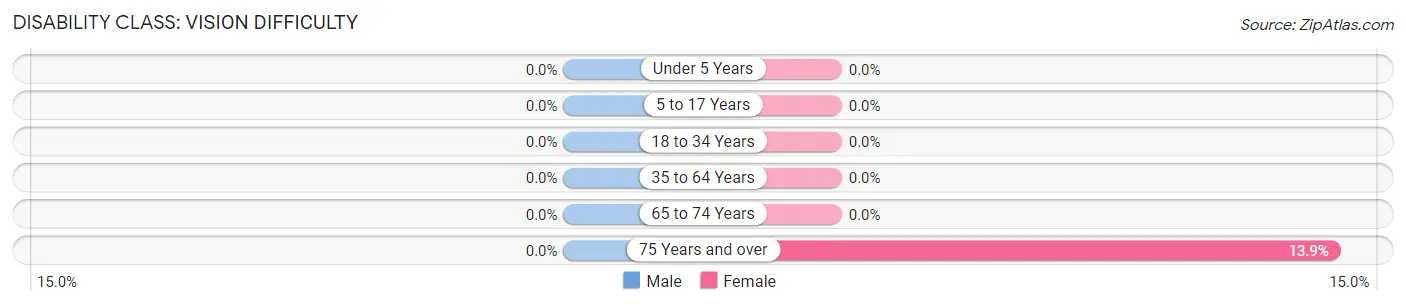
| Age Bracket | Male | Female |
| Under 5 Years | 0 (0.0%) | 0 (0.0%) |
| 5 to 17 Years | 0 (0.0%) | 0 (0.0%) |
| 18 to 34 Years | 0 (0.0%) | 0 (0.0%) |
| 35 to 64 Years | 0 (0.0%) | 0 (0.0%) |
| 65 to 74 Years | 0 (0.0%) | 0 (0.0%) |
| 75 Years and over | 0 (0.0%) | 10 (13.9%) |
Disability Class: Cognitive Difficulty
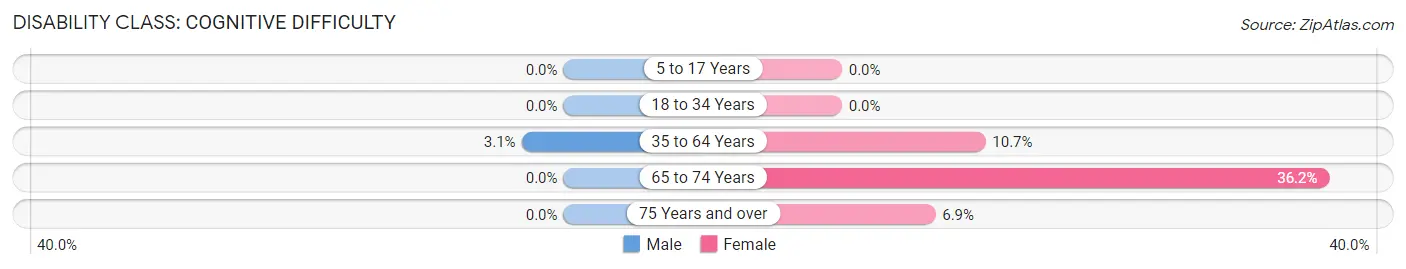
| Age Bracket | Male | Female |
| 5 to 17 Years | 0 (0.0%) | 0 (0.0%) |
| 18 to 34 Years | 0 (0.0%) | 0 (0.0%) |
| 35 to 64 Years | 13 (3.1%) | 26 (10.7%) |
| 65 to 74 Years | 0 (0.0%) | 38 (36.2%) |
| 75 Years and over | 0 (0.0%) | 5 (6.9%) |
Disability Class: Ambulatory Difficulty
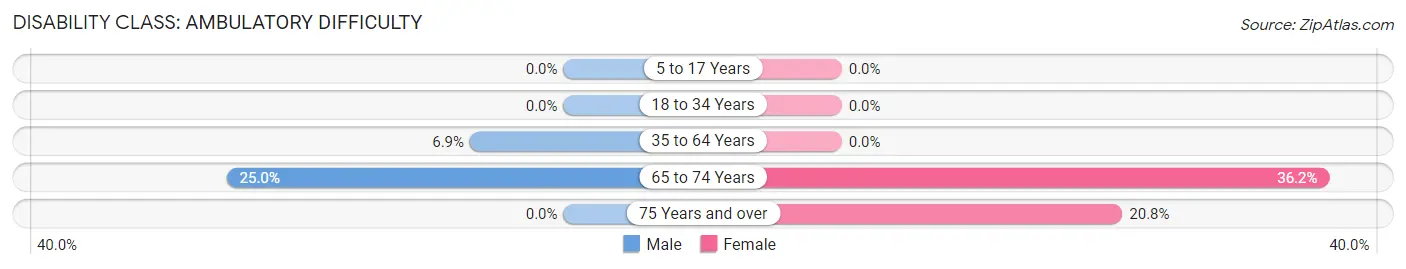
| Age Bracket | Male | Female |
| 5 to 17 Years | 0 (0.0%) | 0 (0.0%) |
| 18 to 34 Years | 0 (0.0%) | 0 (0.0%) |
| 35 to 64 Years | 29 (6.9%) | 0 (0.0%) |
| 65 to 74 Years | 35 (25.0%) | 38 (36.2%) |
| 75 Years and over | 0 (0.0%) | 15 (20.8%) |
Disability Class: Self-Care Difficulty
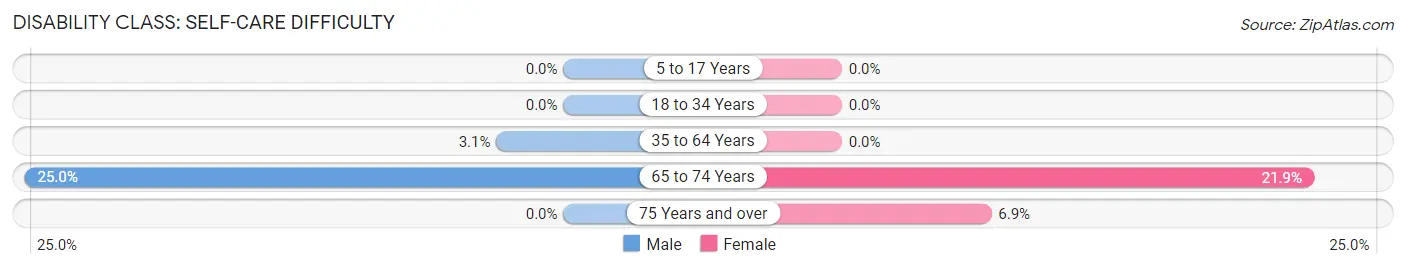
| Age Bracket | Male | Female |
| 5 to 17 Years | 0 (0.0%) | 0 (0.0%) |
| 18 to 34 Years | 0 (0.0%) | 0 (0.0%) |
| 35 to 64 Years | 13 (3.1%) | 0 (0.0%) |
| 65 to 74 Years | 35 (25.0%) | 23 (21.9%) |
| 75 Years and over | 0 (0.0%) | 5 (6.9%) |
Technology Access in Quincy
Computing Device Access in Quincy
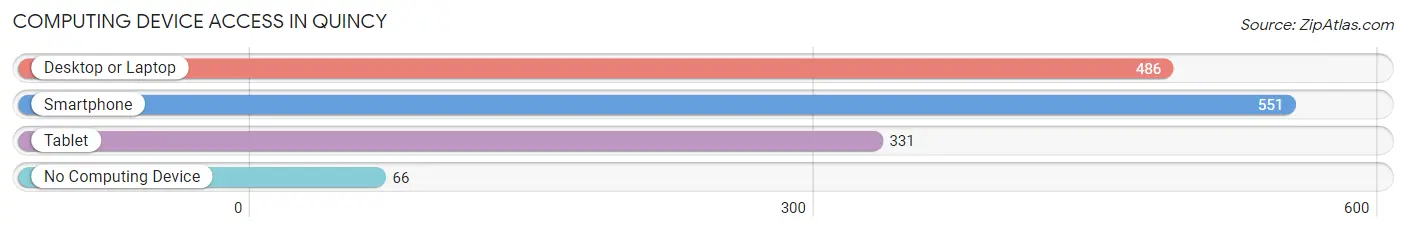
| Device Type | # Households | % Households |
| Desktop or Laptop | 486 | 75.0% |
| Smartphone | 551 | 85.0% |
| Tablet | 331 | 51.1% |
| No Computing Device | 66 | 10.2% |
| Total | 648 | 100.0% |
Internet Access in Quincy
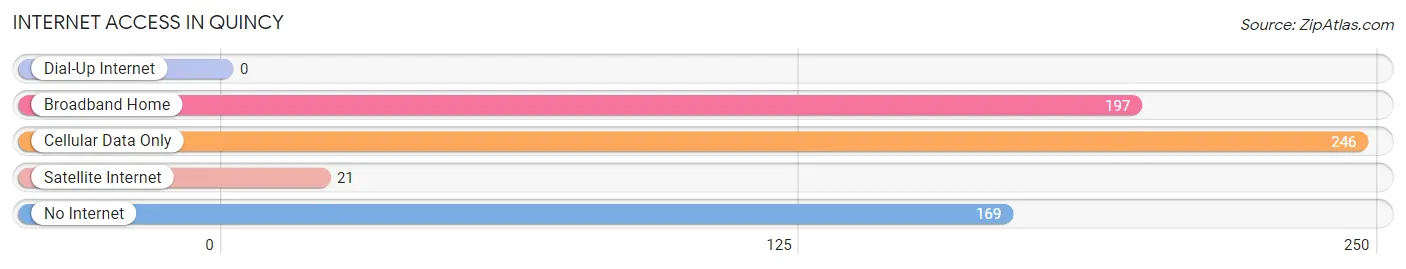
| Internet Type | # Households | % Households |
| Dial-Up Internet | 0 | 0.0% |
| Broadband Home | 197 | 30.4% |
| Cellular Data Only | 246 | 38.0% |
| Satellite Internet | 21 | 3.2% |
| No Internet | 169 | 26.1% |
| Total | 648 | 100.0% |
Quincy Summary
Quincy is a small town located in Plumas County, California, United States. It is situated in the Sierra Nevada mountain range, at an elevation of 4,945 feet (1,506 m). The population was 1,879 at the 2010 census, down from 2,020 at the 2000 census.
History
Quincy was founded in 1855 by settlers from Quincy, Illinois. The town was named after the Illinois city, which was in turn named after John Quincy Adams, the sixth President of the United States. The town was originally a mining camp, and the first quartz mill in Plumas County was built in Quincy in 1856. The town grew rapidly, and by 1860, it had a population of over 1,000.
During the Civil War, Quincy was a major supply center for the Union Army. The town was also the site of a major battle between the Union and Confederate forces in 1862. After the war, the town continued to grow, and by the early 1900s, it had become a major center for logging and lumber production.
Geography
Quincy is located at 39°55′N 120°56′W (39.914, -120.933). According to the United States Census Bureau, the town has a total area of 1.3 square miles (3.4 km2), all of it land.
Economy
Quincy’s economy is largely based on tourism and agriculture. The town is a popular destination for outdoor recreation, such as camping, fishing, and hiking. The town is also home to several wineries and vineyards, as well as a number of small businesses.
Demographics
As of the census of 2000, there were 2,020 people, 845 households, and 517 families residing in the town. The population density was 1,541.2 people per square mile (595.2/km2). There were 945 housing units at an average density of 717.3 per square mile (277.3/km2). The racial makeup of the town was 90.2% White, 0.2% African American, 2.3% Native American, 0.7% Asian, 0.1% Pacific Islander, 3.3% from other races, and 3.2% from two or more races. Hispanic or Latino of any race were 8.2% of the population.
There were 845 households, out of which 28.2% had children under the age of 18 living with them, 46.2% were married couples living together, 10.2% had a female householder with no husband present, and 38.7% were non-families. 32.2% of all households were made up of individuals, and 13.2% had someone living alone who was 65 years of age or older. The average household size was 2.37 and the average family size was 2.99.
In the town, the population was spread out, with 24.7% under the age of 18, 6.2% from 18 to 24, 25.2% from 25 to 44, 26.2% from 45 to 64, and 17.7% who were 65 years of age or older. The median age was 41 years. For every 100 females, there were 97.2 males. For every 100 females age 18 and over, there were 94.2 males.
The median income for a household in the town was $30,938, and the median income for a family was $37,500. Males had a median income of $31,250 versus $21,250 for females. The per capita income for the town was $17,845. About 10.2% of families and 13.2% of the population were below the poverty line, including 17.2% of those under age 18 and 8.2% of those age 65 or over.
Common Questions
What is Per Capita Income in Quincy?
Per Capita income in Quincy is $47,767.
What is the Median Family Income in Quincy?
Median Family Income in Quincy is $97,750.
What is the Median Household income in Quincy?
Median Household Income in Quincy is $75,469.
What is Income or Wage Gap in Quincy?
Income or Wage Gap in Quincy is 13.3%.
Women in Quincy earn 86.7 cents for every dollar earned by a man.
What is Inequality or Gini Index in Quincy?
Inequality or Gini Index in Quincy is 0.42.
What is the Total Population of Quincy?
Total Population of Quincy is 1,368.
What is the Total Male Population of Quincy?
Total Male Population of Quincy is 720.
What is the Total Female Population of Quincy?
Total Female Population of Quincy is 648.
What is the Ratio of Males per 100 Females in Quincy?
There are 111.11 Males per 100 Females in Quincy.
What is the Ratio of Females per 100 Males in Quincy?
There are 90.00 Females per 100 Males in Quincy.
What is the Median Population Age in Quincy?
Median Population Age in Quincy is 57.1 Years.
What is the Average Family Size in Quincy
Average Family Size in Quincy is 2.6 People.
What is the Average Household Size in Quincy
Average Household Size in Quincy is 2.0 People.
How Large is the Labor Force in Quincy?
There are 724 People in the Labor Forcein in Quincy.
What is the Percentage of People in the Labor Force in Quincy?
54.4% of People are in the Labor Force in Quincy.
What is the Unemployment Rate in Quincy?
Unemployment Rate in Quincy is 11.9%.