Poway, CA Map & Demographics
Poway Map
Poway Overview
$58,325
PER CAPITA INCOME
$146,534
AVG FAMILY INCOME
$135,605
AVG HOUSEHOLD INCOME
37.2%
WAGE / INCOME GAP [ % ]
62.8¢/ $1
WAGE / INCOME GAP [ $ ]
$12,356
FAMILY INCOME DEFICIT
0.43
INEQUALITY / GINI INDEX
48,737
TOTAL POPULATION
24,931
MALE POPULATION
23,806
FEMALE POPULATION
104.73
MALES / 100 FEMALES
95.49
FEMALES / 100 MALES
41.7
MEDIAN AGE
3.2
AVG FAMILY SIZE
3.0
AVG HOUSEHOLD SIZE
24,667
LABOR FORCE [ PEOPLE ]
63.3%
PERCENT IN LABOR FORCE
5.9%
UNEMPLOYMENT RATE
Poway Zip Codes
Income in Poway
Income Overview in Poway
Per Capita Income in Poway is $58,325, while median incomes of families and households are $146,534 and $135,605 respectively.
| Characteristic | Number | Measure |
| Per Capita Income | 48,737 | $58,325 |
| Median Family Income | 12,900 | $146,534 |
| Mean Family Income | 12,900 | $180,111 |
| Median Household Income | 16,159 | $135,605 |
| Mean Household Income | 16,159 | $170,679 |
| Income Deficit | 12,900 | $12,356 |
| Wage / Income Gap (%) | 48,737 | 37.22% |
| Wage / Income Gap ($) | 48,737 | 62.78¢ per $1 |
| Gini / Inequality Index | 48,737 | 0.43 |
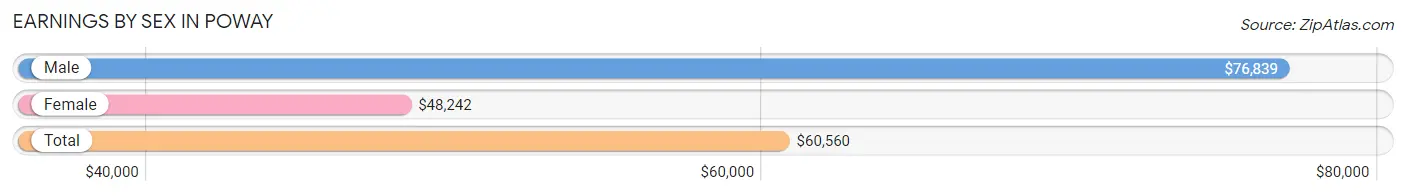
Earnings by Sex in Poway
Average Earnings in Poway are $60,560, $76,839 for men and $48,242 for women, a difference of 37.2%.
| Sex | Number | Average Earnings |
| Male | 14,011 (55.9%) | $76,839 |
| Female | 11,056 (44.1%) | $48,242 |
| Total | 25,067 (100.0%) | $60,560 |
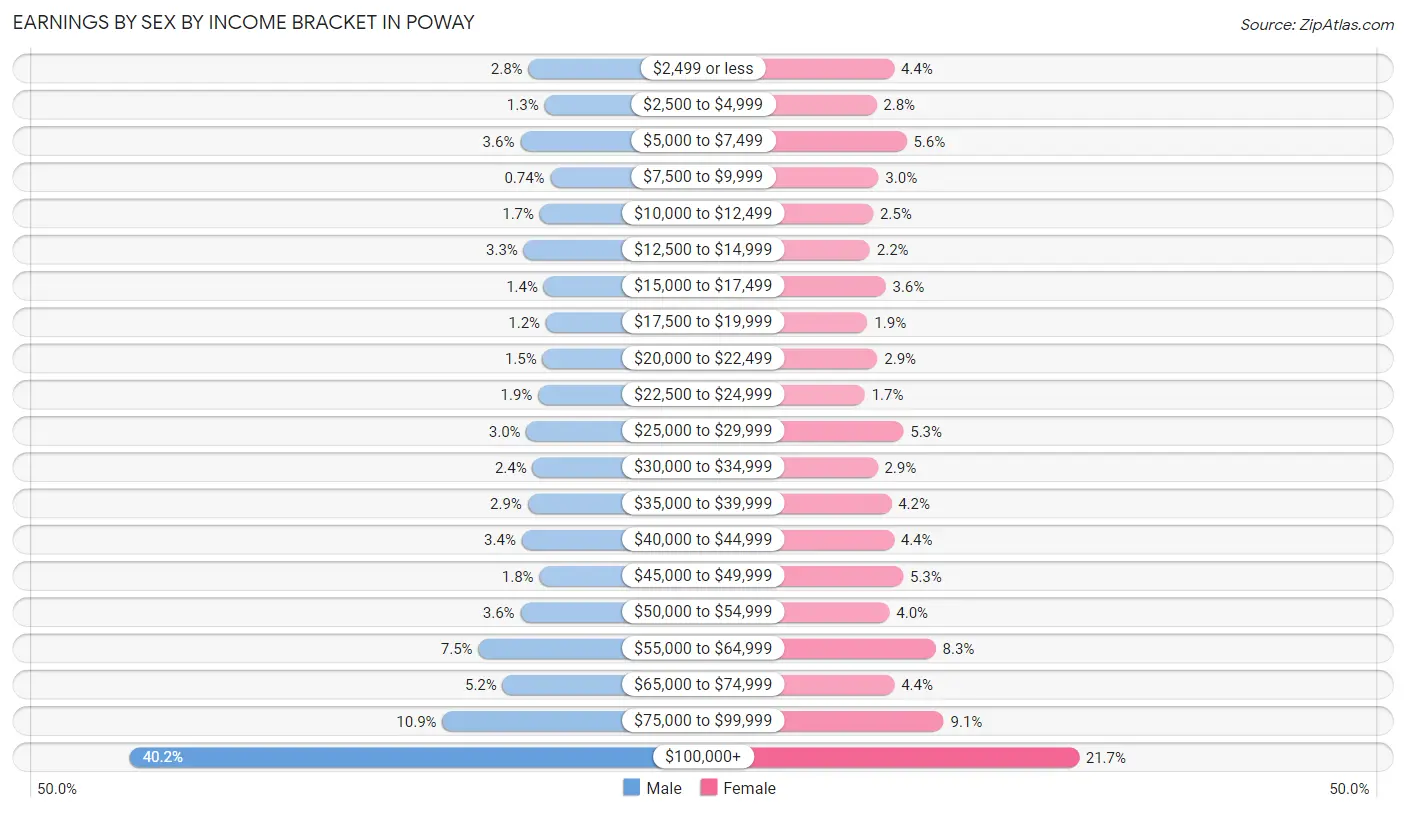
Earnings by Sex by Income Bracket in Poway
The most common earnings brackets in Poway are $100,000+ for men (5,625 | 40.2%) and $100,000+ for women (2,403 | 21.7%).
| Income | Male | Female |
| $2,499 or less | 392 (2.8%) | 489 (4.4%) |
| $2,500 to $4,999 | 182 (1.3%) | 306 (2.8%) |
| $5,000 to $7,499 | 500 (3.6%) | 618 (5.6%) |
| $7,500 to $9,999 | 103 (0.7%) | 327 (3.0%) |
| $10,000 to $12,499 | 242 (1.7%) | 271 (2.5%) |
| $12,500 to $14,999 | 455 (3.3%) | 239 (2.2%) |
| $15,000 to $17,499 | 190 (1.4%) | 401 (3.6%) |
| $17,500 to $19,999 | 162 (1.2%) | 213 (1.9%) |
| $20,000 to $22,499 | 207 (1.5%) | 316 (2.9%) |
| $22,500 to $24,999 | 265 (1.9%) | 186 (1.7%) |
| $25,000 to $29,999 | 419 (3.0%) | 585 (5.3%) |
| $30,000 to $34,999 | 339 (2.4%) | 317 (2.9%) |
| $35,000 to $39,999 | 402 (2.9%) | 460 (4.2%) |
| $40,000 to $44,999 | 481 (3.4%) | 487 (4.4%) |
| $45,000 to $49,999 | 248 (1.8%) | 583 (5.3%) |
| $50,000 to $54,999 | 498 (3.5%) | 441 (4.0%) |
| $55,000 to $64,999 | 1,049 (7.5%) | 920 (8.3%) |
| $65,000 to $74,999 | 731 (5.2%) | 491 (4.4%) |
| $75,000 to $99,999 | 1,521 (10.9%) | 1,003 (9.1%) |
| $100,000+ | 5,625 (40.2%) | 2,403 (21.7%) |
| Total | 14,011 (100.0%) | 11,056 (100.0%) |
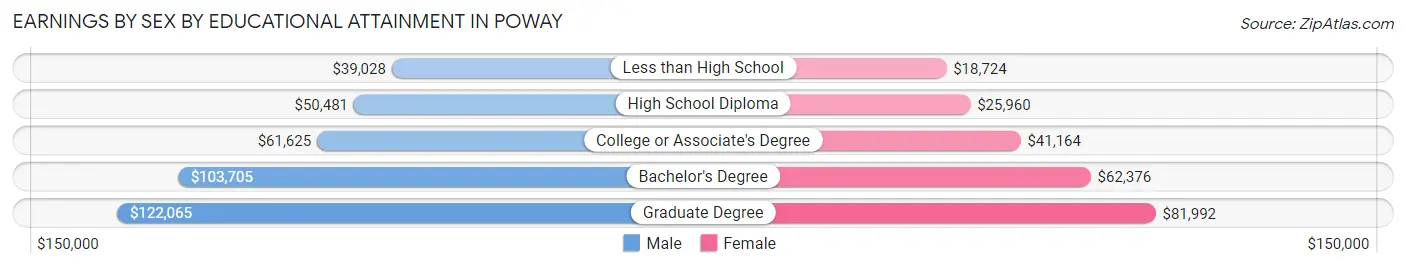
Earnings by Sex by Educational Attainment in Poway
Average earnings in Poway are $85,300 for men and $52,340 for women, a difference of 38.6%. Men with an educational attainment of graduate degree enjoy the highest average annual earnings of $122,065, while those with less than high school education earn the least with $39,028. Women with an educational attainment of graduate degree earn the most with the average annual earnings of $81,992, while those with less than high school education have the smallest earnings of $18,724.
| Educational Attainment | Male Income | Female Income |
| Less than High School | $39,028 | $18,724 |
| High School Diploma | $50,481 | $25,960 |
| College or Associate's Degree | $61,625 | $41,164 |
| Bachelor's Degree | $103,705 | $62,376 |
| Graduate Degree | $122,065 | $81,992 |
| Total | $85,300 | $52,340 |
Family Income in Poway
Family Income Brackets in Poway
According to the Poway family income data, there are 4,167 families falling into the $200,000+ income range, which is the most common income bracket and makes up 32.3% of all families. Conversely, the $10,000 to $14,999 income bracket is the least frequent group with only 77 families (0.6%) belonging to this category.
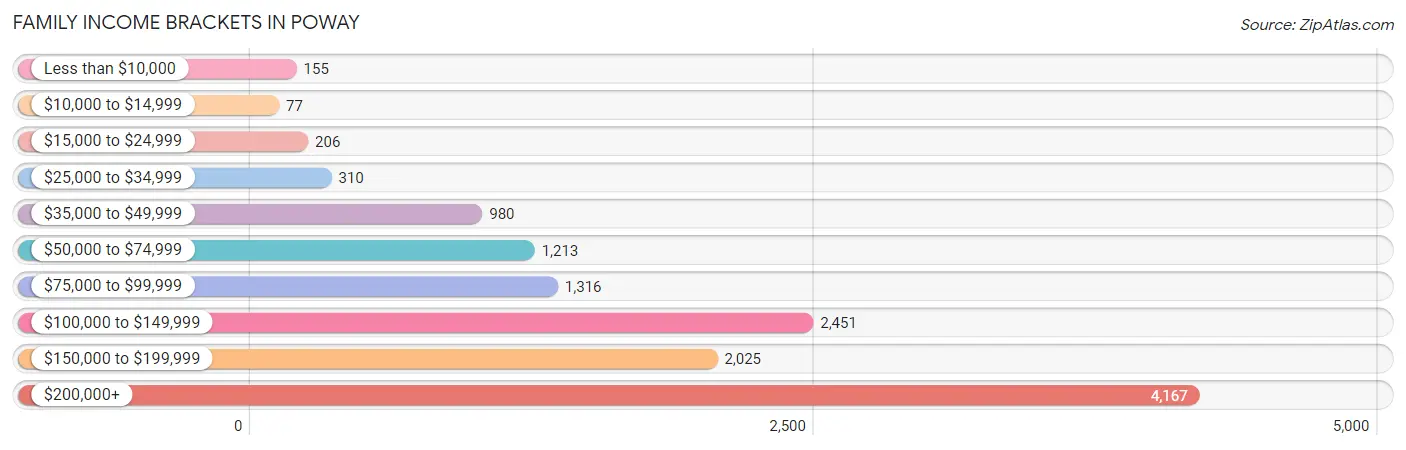
| Income Bracket | # Families | % Families |
| Less than $10,000 | 155 | 1.2% |
| $10,000 to $14,999 | 77 | 0.6% |
| $15,000 to $24,999 | 206 | 1.6% |
| $25,000 to $34,999 | 310 | 2.4% |
| $35,000 to $49,999 | 980 | 7.6% |
| $50,000 to $74,999 | 1,213 | 9.4% |
| $75,000 to $99,999 | 1,316 | 10.2% |
| $100,000 to $149,999 | 2,451 | 19.0% |
| $150,000 to $199,999 | 2,025 | 15.7% |
| $200,000+ | 4,167 | 32.3% |
Family Income by Famaliy Size in Poway
5-person families (1,181 | 9.2%) account for the highest median family income in Poway with $191,691 per family, while 2-person families (5,665 | 43.9%) have the highest median income of $59,291 per family member.
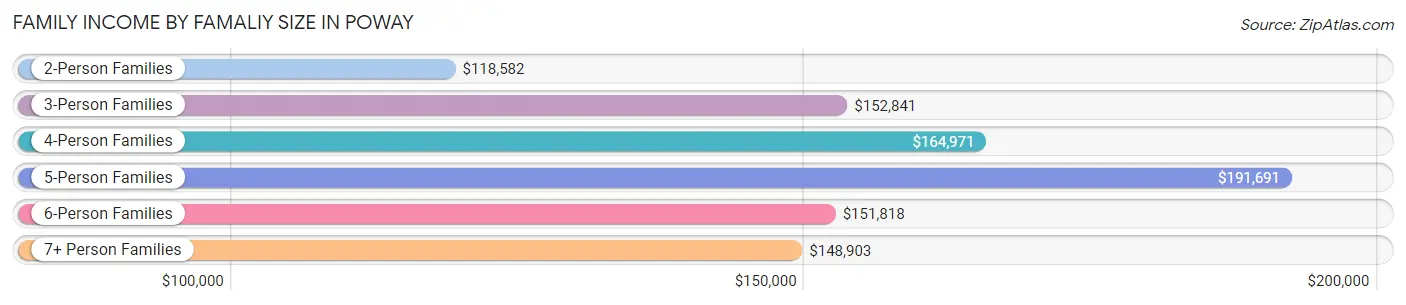
| Income Bracket | # Families | Median Income |
| 2-Person Families | 5,665 (43.9%) | $118,582 |
| 3-Person Families | 2,716 (21.0%) | $152,841 |
| 4-Person Families | 2,849 (22.1%) | $164,971 |
| 5-Person Families | 1,181 (9.2%) | $191,691 |
| 6-Person Families | 248 (1.9%) | $151,818 |
| 7+ Person Families | 241 (1.9%) | $148,903 |
| Total | 12,900 (100.0%) | $146,534 |
Family Income by Number of Earners in Poway
The median family income in Poway is $146,534, with families comprising 3+ earners (1,426) having the highest median family income of $223,547, while families with no earners (1,912) have the lowest median family income of $79,792, accounting for 11.1% and 14.8% of families, respectively.
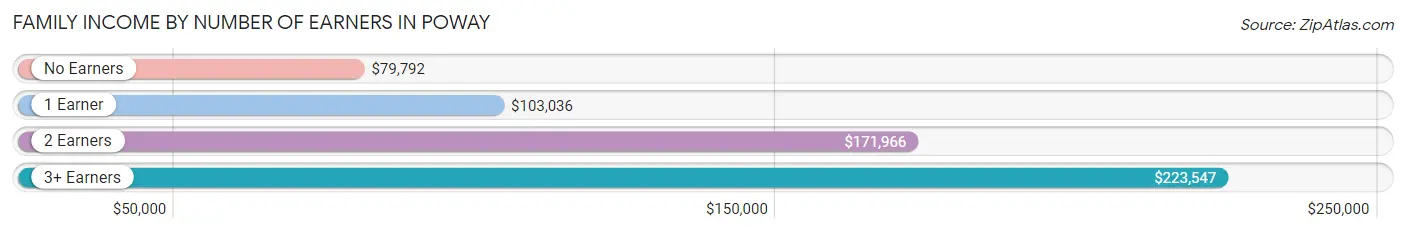
| Number of Earners | # Families | Median Income |
| No Earners | 1,912 (14.8%) | $79,792 |
| 1 Earner | 3,933 (30.5%) | $103,036 |
| 2 Earners | 5,629 (43.6%) | $171,966 |
| 3+ Earners | 1,426 (11.1%) | $223,547 |
| Total | 12,900 (100.0%) | $146,534 |
Household Income in Poway
Household Income Brackets in Poway
With 4,815 households falling in the category, the $200,000+ income range is the most frequent in Poway, accounting for 29.8% of all households. In contrast, only 162 households (1.0%) fall into the $10,000 to $14,999 income bracket, making it the least populous group.
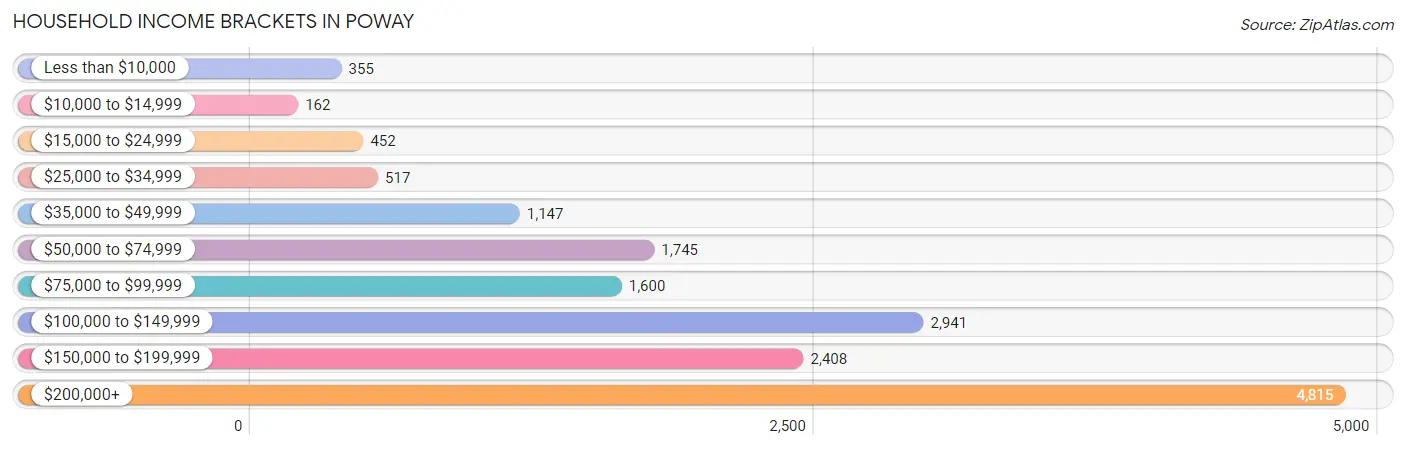
| Income Bracket | # Households | % Households |
| Less than $10,000 | 355 | 2.2% |
| $10,000 to $14,999 | 162 | 1.0% |
| $15,000 to $24,999 | 452 | 2.8% |
| $25,000 to $34,999 | 517 | 3.2% |
| $35,000 to $49,999 | 1,147 | 7.1% |
| $50,000 to $74,999 | 1,745 | 10.8% |
| $75,000 to $99,999 | 1,600 | 9.9% |
| $100,000 to $149,999 | 2,941 | 18.2% |
| $150,000 to $199,999 | 2,408 | 14.9% |
| $200,000+ | 4,815 | 29.8% |
Household Income by Householder Age in Poway
The median household income in Poway is $135,605, with the highest median household income of $156,920 found in the 45 to 64 years age bracket for the primary householder. A total of 6,513 households (40.3%) fall into this category. Meanwhile, the 15 to 24 years age bracket for the primary householder has the lowest median household income of $0, with 89 households (0.5%) in this group.
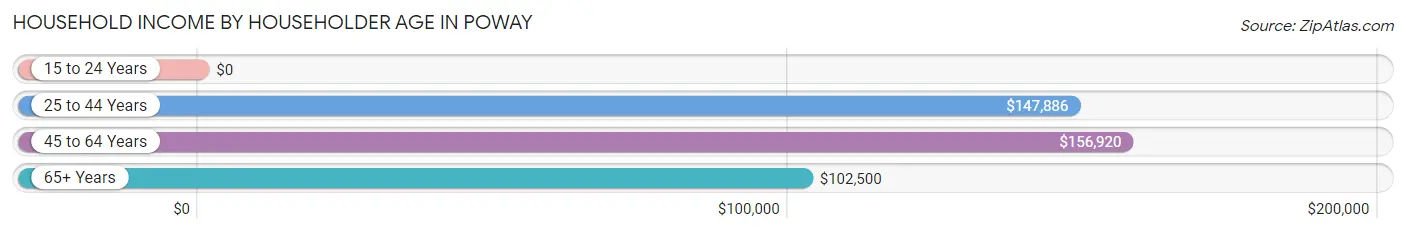
| Income Bracket | # Households | Median Income |
| 15 to 24 Years | 89 (0.5%) | $0 |
| 25 to 44 Years | 4,373 (27.1%) | $147,886 |
| 45 to 64 Years | 6,513 (40.3%) | $156,920 |
| 65+ Years | 5,184 (32.1%) | $102,500 |
| Total | 16,159 (100.0%) | $135,605 |
Poverty in Poway
Income Below Poverty by Sex and Age in Poway
With 4.5% poverty level for males and 7.4% for females among the residents of Poway, 6 to 11 year old males and under 5 year old females are the most vulnerable to poverty, with 204 males (8.8%) and 215 females (17.8%) in their respective age groups living below the poverty level.
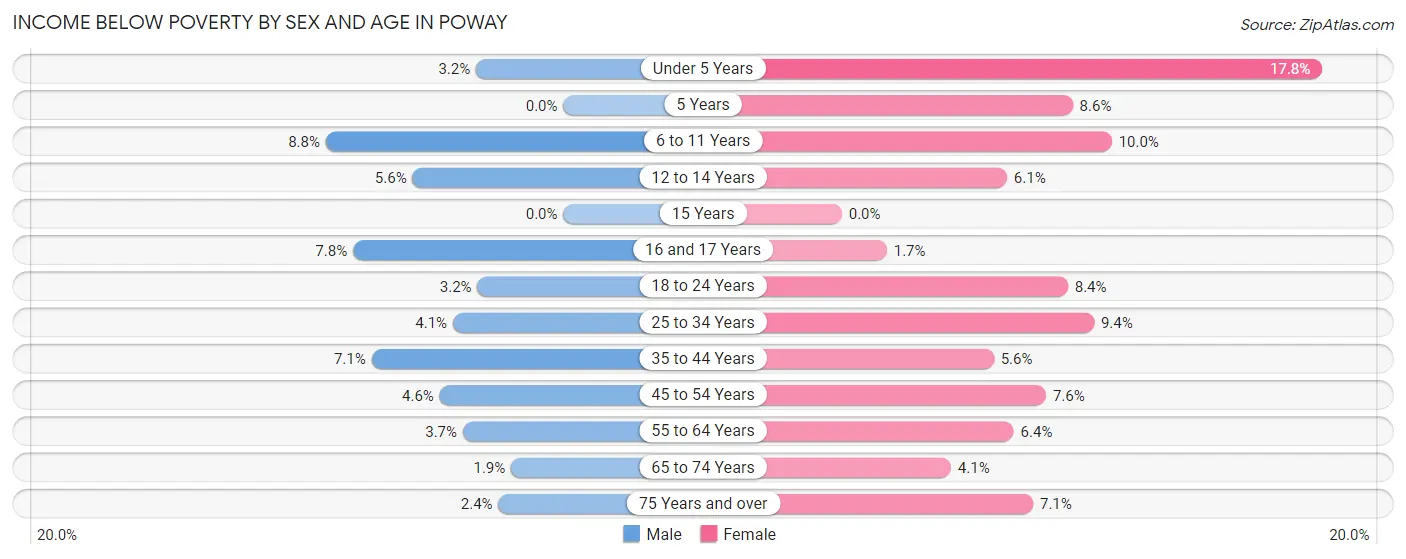
| Age Bracket | Male | Female |
| Under 5 Years | 52 (3.2%) | 215 (17.8%) |
| 5 Years | 0 (0.0%) | 33 (8.6%) |
| 6 to 11 Years | 204 (8.8%) | 171 (10.0%) |
| 12 to 14 Years | 45 (5.6%) | 54 (6.1%) |
| 15 Years | 0 (0.0%) | 0 (0.0%) |
| 16 and 17 Years | 40 (7.8%) | 9 (1.7%) |
| 18 to 24 Years | 64 (3.2%) | 110 (8.4%) |
| 25 to 34 Years | 121 (4.1%) | 269 (9.4%) |
| 35 to 44 Years | 240 (7.1%) | 171 (5.6%) |
| 45 to 54 Years | 136 (4.6%) | 239 (7.6%) |
| 55 to 64 Years | 132 (3.7%) | 205 (6.4%) |
| 65 to 74 Years | 51 (1.9%) | 115 (4.1%) |
| 75 Years and over | 38 (2.4%) | 146 (7.1%) |
| Total | 1,123 (4.5%) | 1,737 (7.4%) |
Income Above Poverty by Sex and Age in Poway
According to the poverty statistics in Poway, males aged 5 years and females aged 15 years are the age groups that are most secure financially, with 100.0% of males and 100.0% of females in these age groups living above the poverty line.
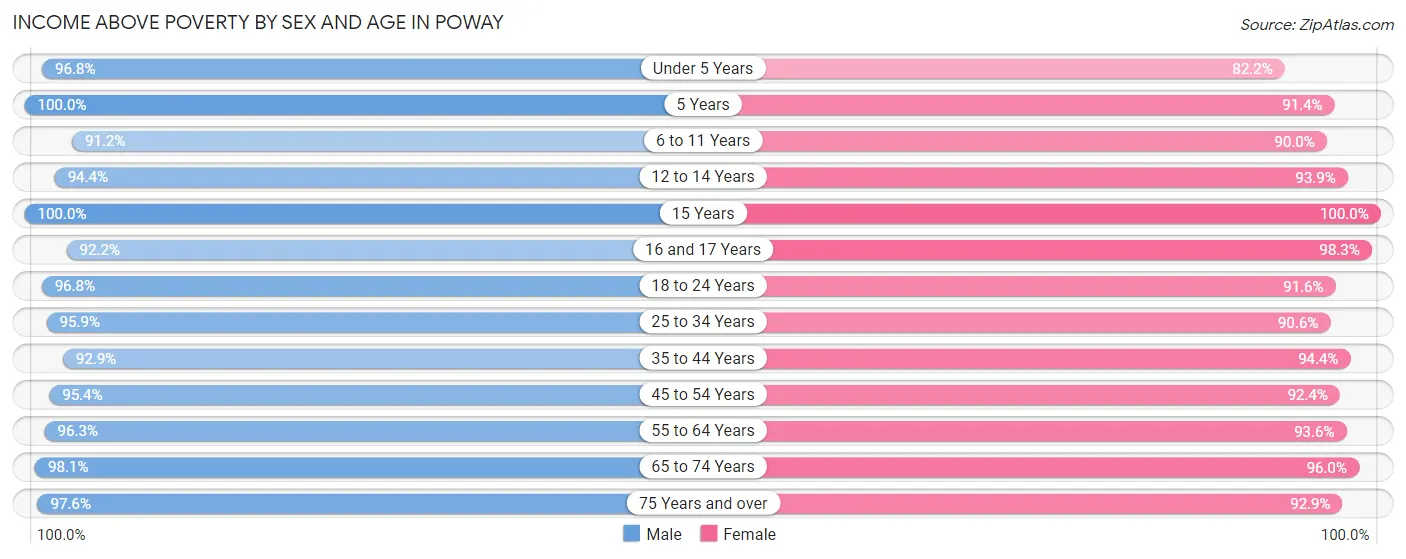
| Age Bracket | Male | Female |
| Under 5 Years | 1,554 (96.8%) | 991 (82.2%) |
| 5 Years | 276 (100.0%) | 352 (91.4%) |
| 6 to 11 Years | 2,109 (91.2%) | 1,536 (90.0%) |
| 12 to 14 Years | 758 (94.4%) | 827 (93.9%) |
| 15 Years | 184 (100.0%) | 316 (100.0%) |
| 16 and 17 Years | 472 (92.2%) | 529 (98.3%) |
| 18 to 24 Years | 1,941 (96.8%) | 1,201 (91.6%) |
| 25 to 34 Years | 2,832 (95.9%) | 2,604 (90.6%) |
| 35 to 44 Years | 3,133 (92.9%) | 2,862 (94.4%) |
| 45 to 54 Years | 2,827 (95.4%) | 2,914 (92.4%) |
| 55 to 64 Years | 3,410 (96.3%) | 3,006 (93.6%) |
| 65 to 74 Years | 2,577 (98.1%) | 2,725 (96.0%) |
| 75 Years and over | 1,541 (97.6%) | 1,910 (92.9%) |
| Total | 23,614 (95.5%) | 21,773 (92.6%) |
Income Below Poverty Among Married-Couple Families in Poway
The poverty statistics for married-couple families in Poway show that 2.0% or 215 of the total 10,517 families live below the poverty line. Families with 3 or 4 children have the highest poverty rate of 9.8%, comprising of 89 families. On the other hand, families with 5 or more children have the lowest poverty rate of 0.0%, which includes 0 families.
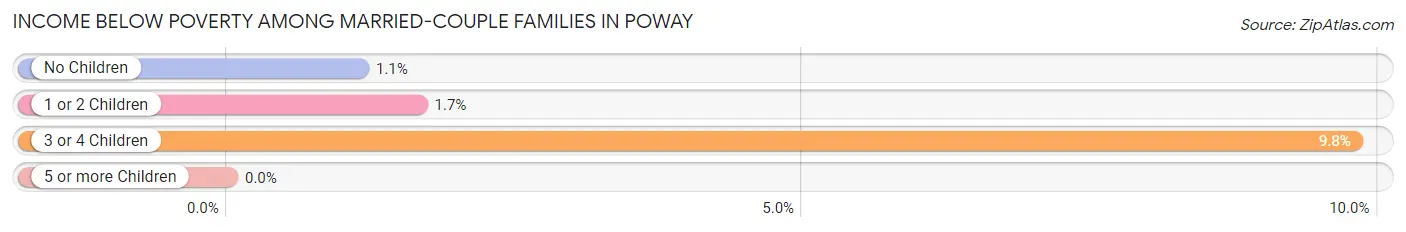
| Children | Above Poverty | Below Poverty |
| No Children | 6,134 (98.9%) | 71 (1.1%) |
| 1 or 2 Children | 3,285 (98.4%) | 55 (1.7%) |
| 3 or 4 Children | 820 (90.2%) | 89 (9.8%) |
| 5 or more Children | 63 (100.0%) | 0 (0.0%) |
| Total | 10,302 (98.0%) | 215 (2.0%) |
Income Below Poverty Among Single-Parent Households in Poway
According to the poverty data in Poway, 9.2% or 84 single-father households and 8.7% or 128 single-mother households are living below the poverty line. Among single-father households, those with 3 or 4 children have the highest poverty rate, with 43 households (71.7%) experiencing poverty. Likewise, among single-mother households, those with 3 or 4 children have the highest poverty rate, with 65 households (46.1%) falling below the poverty line.
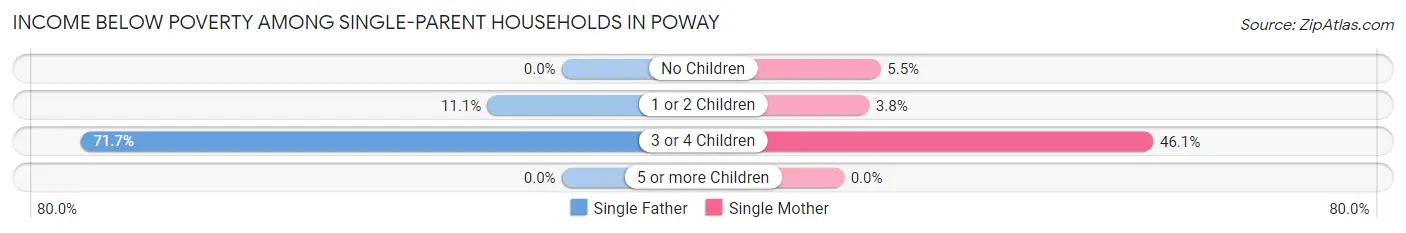
| Children | Single Father | Single Mother |
| No Children | 0 (0.0%) | 41 (5.5%) |
| 1 or 2 Children | 41 (11.1%) | 22 (3.8%) |
| 3 or 4 Children | 43 (71.7%) | 65 (46.1%) |
| 5 or more Children | 0 (0.0%) | 0 (0.0%) |
| Total | 84 (9.2%) | 128 (8.7%) |
Income Below Poverty Among Married-Couple vs Single-Parent Households in Poway
The poverty data for Poway shows that 215 of the married-couple family households (2.0%) and 212 of the single-parent households (8.9%) are living below the poverty level. Within the married-couple family households, those with 3 or 4 children have the highest poverty rate, with 89 households (9.8%) falling below the poverty line. Among the single-parent households, those with 3 or 4 children have the highest poverty rate, with 108 household (53.7%) living below poverty.
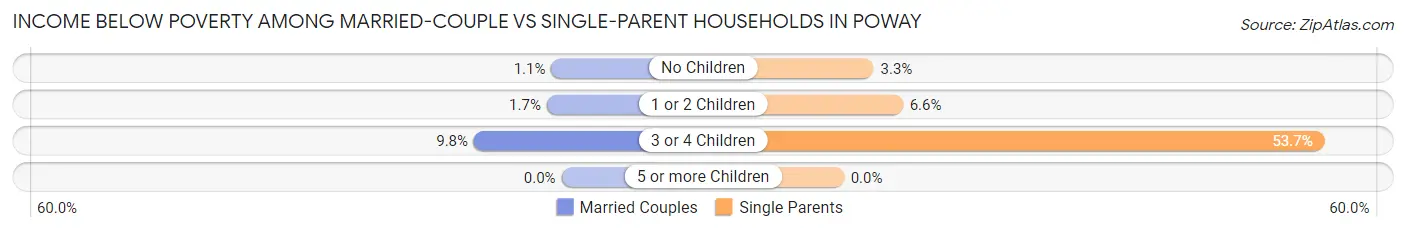
| Children | Married-Couple Families | Single-Parent Households |
| No Children | 71 (1.1%) | 41 (3.3%) |
| 1 or 2 Children | 55 (1.7%) | 63 (6.6%) |
| 3 or 4 Children | 89 (9.8%) | 108 (53.7%) |
| 5 or more Children | 0 (0.0%) | 0 (0.0%) |
| Total | 215 (2.0%) | 212 (8.9%) |
Race in Poway
The most populous races in Poway are White / Caucasian (30,569 | 62.7%), Hispanic or Latino (8,099 | 16.6%), and Asian (6,553 | 13.5%).
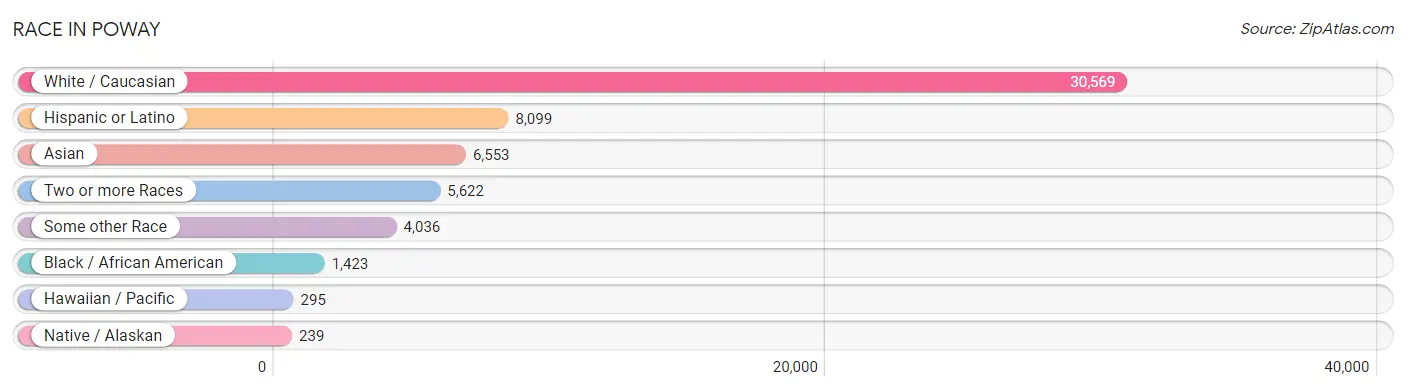
| Race | # Population | % Population |
| Asian | 6,553 | 13.5% |
| Black / African American | 1,423 | 2.9% |
| Hawaiian / Pacific | 295 | 0.6% |
| Hispanic or Latino | 8,099 | 16.6% |
| Native / Alaskan | 239 | 0.5% |
| White / Caucasian | 30,569 | 62.7% |
| Two or more Races | 5,622 | 11.5% |
| Some other Race | 4,036 | 8.3% |
| Total | 48,737 | 100.0% |
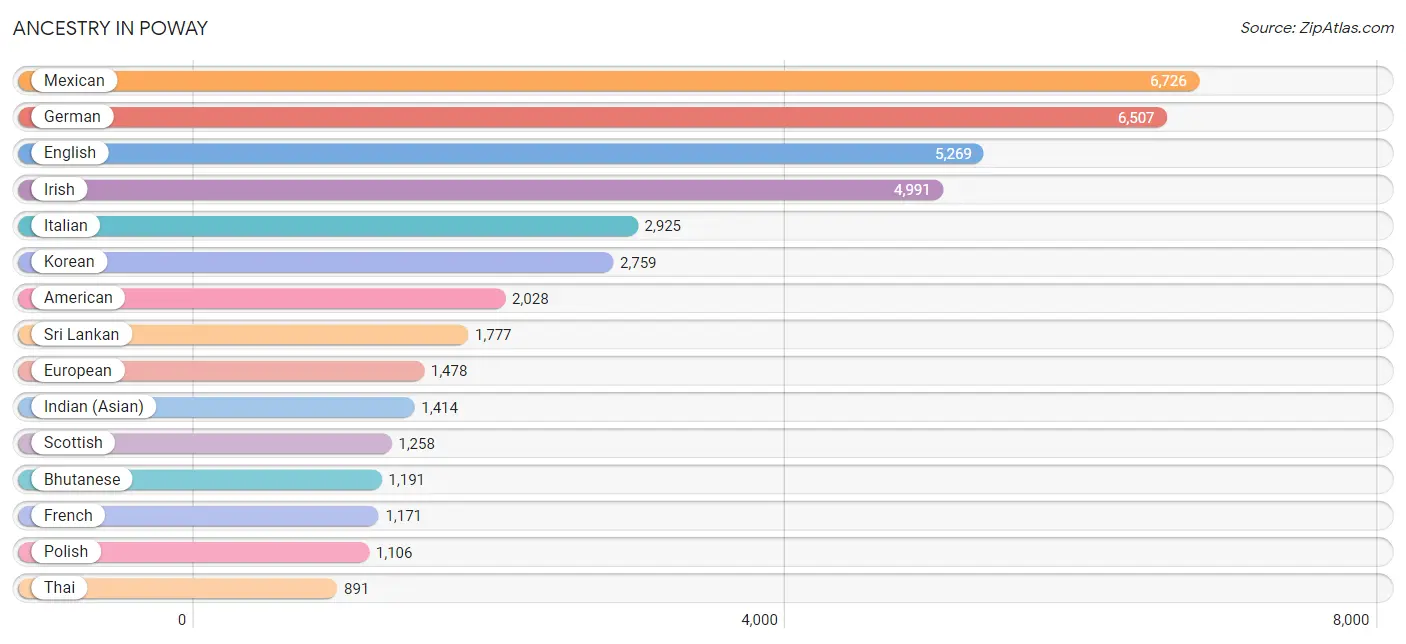
Ancestry in Poway
The most populous ancestries reported in Poway are Mexican (6,726 | 13.8%), German (6,507 | 13.4%), English (5,269 | 10.8%), Irish (4,991 | 10.2%), and Italian (2,925 | 6.0%), together accounting for 54.2% of all Poway residents.
| Ancestry | # Population | % Population |
| Afghan | 25 | 0.1% |
| African | 141 | 0.3% |
| American | 2,028 | 4.2% |
| Apache | 129 | 0.3% |
| Arab | 769 | 1.6% |
| Argentinean | 21 | 0.0% |
| Armenian | 31 | 0.1% |
| Assyrian / Chaldean / Syriac | 113 | 0.2% |
| Australian | 91 | 0.2% |
| Austrian | 103 | 0.2% |
| Basque | 98 | 0.2% |
| Belgian | 11 | 0.0% |
| Bhutanese | 1,191 | 2.4% |
| Blackfeet | 16 | 0.0% |
| Brazilian | 38 | 0.1% |
| British | 474 | 1.0% |
| Bulgarian | 109 | 0.2% |
| Burmese | 624 | 1.3% |
| Cambodian | 11 | 0.0% |
| Canadian | 134 | 0.3% |
| Central American | 232 | 0.5% |
| Central American Indian | 15 | 0.0% |
| Cherokee | 195 | 0.4% |
| Chinese | 61 | 0.1% |
| Choctaw | 24 | 0.1% |
| Colombian | 89 | 0.2% |
| Costa Rican | 21 | 0.0% |
| Croatian | 97 | 0.2% |
| Cuban | 50 | 0.1% |
| Czech | 290 | 0.6% |
| Czechoslovakian | 9 | 0.0% |
| Danish | 142 | 0.3% |
| Dominican | 17 | 0.0% |
| Dutch | 467 | 1.0% |
| Eastern European | 170 | 0.4% |
| Ecuadorian | 33 | 0.1% |
| English | 5,269 | 10.8% |
| Estonian | 12 | 0.0% |
| Ethiopian | 70 | 0.1% |
| European | 1,478 | 3.0% |
| Filipino | 96 | 0.2% |
| Finnish | 128 | 0.3% |
| French | 1,171 | 2.4% |
| French American Indian | 7 | 0.0% |
| French Canadian | 107 | 0.2% |
| German | 6,507 | 13.4% |
| German Russian | 22 | 0.1% |
| Greek | 269 | 0.5% |
| Guamanian / Chamorro | 26 | 0.1% |
| Guatemalan | 158 | 0.3% |
| Haitian | 35 | 0.1% |
| Hungarian | 148 | 0.3% |
| Icelander | 11 | 0.0% |
| Indian (Asian) | 1,414 | 2.9% |
| Iranian | 803 | 1.7% |
| Iraqi | 121 | 0.3% |
| Irish | 4,991 | 10.2% |
| Israeli | 75 | 0.2% |
| Italian | 2,925 | 6.0% |
| Kenyan | 40 | 0.1% |
| Korean | 2,759 | 5.7% |
| Latvian | 12 | 0.0% |
| Lebanese | 350 | 0.7% |
| Lithuanian | 119 | 0.2% |
| Macedonian | 27 | 0.1% |
| Menominee | 9 | 0.0% |
| Mexican | 6,726 | 13.8% |
| Mexican American Indian | 37 | 0.1% |
| Mongolian | 7 | 0.0% |
| Native Hawaiian | 357 | 0.7% |
| Nicaraguan | 18 | 0.0% |
| Nigerian | 25 | 0.1% |
| Northern European | 212 | 0.4% |
| Norwegian | 817 | 1.7% |
| Pakistani | 39 | 0.1% |
| Palestinian | 58 | 0.1% |
| Pennsylvania German | 17 | 0.0% |
| Peruvian | 65 | 0.1% |
| Polish | 1,106 | 2.3% |
| Portuguese | 123 | 0.3% |
| Potawatomi | 20 | 0.0% |
| Puerto Rican | 193 | 0.4% |
| Romanian | 71 | 0.2% |
| Russian | 596 | 1.2% |
| Salvadoran | 35 | 0.1% |
| Samoan | 25 | 0.1% |
| Scandinavian | 313 | 0.6% |
| Scotch-Irish | 406 | 0.8% |
| Scottish | 1,258 | 2.6% |
| Senegalese | 23 | 0.1% |
| Serbian | 23 | 0.1% |
| Slavic | 11 | 0.0% |
| Slovak | 36 | 0.1% |
| South American | 272 | 0.6% |
| South American Indian | 38 | 0.1% |
| Soviet Union | 19 | 0.0% |
| Spaniard | 244 | 0.5% |
| Spanish | 143 | 0.3% |
| Sri Lankan | 1,777 | 3.6% |
| Subsaharan African | 283 | 0.6% |
| Swedish | 714 | 1.5% |
| Swiss | 278 | 0.6% |
| Syrian | 32 | 0.1% |
| Thai | 891 | 1.8% |
| Turkish | 11 | 0.0% |
| Ukrainian | 201 | 0.4% |
| Venezuelan | 34 | 0.1% |
| Welsh | 425 | 0.9% |
| West Indian | 68 | 0.1% |
| Yugoslavian | 28 | 0.1% | View All 110 Rows |
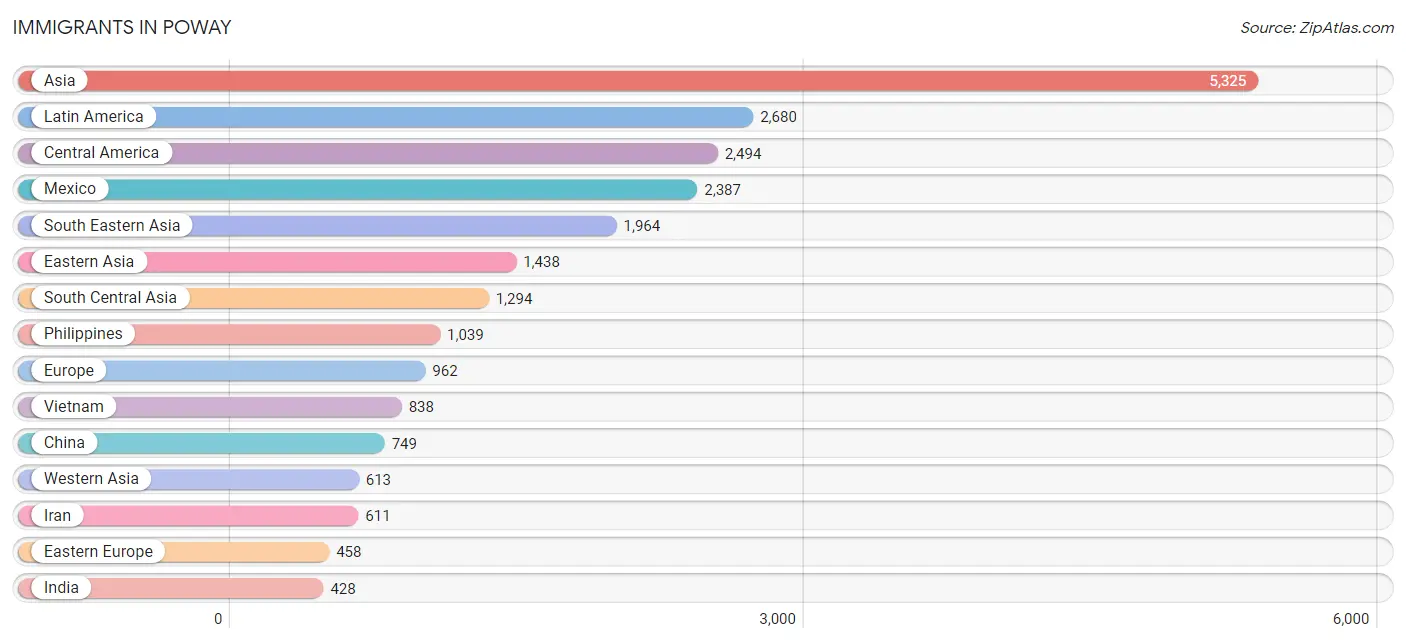
Immigrants in Poway
The most numerous immigrant groups reported in Poway came from Asia (5,325 | 10.9%), Latin America (2,680 | 5.5%), Central America (2,494 | 5.1%), Mexico (2,387 | 4.9%), and South Eastern Asia (1,964 | 4.0%), together accounting for 30.5% of all Poway residents.
| Immigration Origin | # Population | % Population |
| Afghanistan | 25 | 0.1% |
| Africa | 231 | 0.5% |
| Argentina | 15 | 0.0% |
| Armenia | 1 | 0.0% |
| Asia | 5,325 | 10.9% |
| Australia | 128 | 0.3% |
| Brazil | 54 | 0.1% |
| Bulgaria | 5 | 0.0% |
| Canada | 231 | 0.5% |
| Caribbean | 9 | 0.0% |
| Central America | 2,494 | 5.1% |
| Chile | 7 | 0.0% |
| China | 749 | 1.5% |
| Colombia | 29 | 0.1% |
| Costa Rica | 9 | 0.0% |
| Czechoslovakia | 13 | 0.0% |
| Denmark | 8 | 0.0% |
| Eastern Africa | 77 | 0.2% |
| Eastern Asia | 1,438 | 2.9% |
| Eastern Europe | 458 | 0.9% |
| Ecuador | 13 | 0.0% |
| El Salvador | 8 | 0.0% |
| England | 123 | 0.3% |
| Ethiopia | 34 | 0.1% |
| Europe | 962 | 2.0% |
| France | 8 | 0.0% |
| Germany | 120 | 0.3% |
| Greece | 19 | 0.0% |
| Guatemala | 54 | 0.1% |
| Hong Kong | 93 | 0.2% |
| Hungary | 57 | 0.1% |
| India | 428 | 0.9% |
| Indonesia | 48 | 0.1% |
| Iran | 611 | 1.3% |
| Iraq | 189 | 0.4% |
| Israel | 133 | 0.3% |
| Italy | 40 | 0.1% |
| Japan | 362 | 0.7% |
| Kazakhstan | 8 | 0.0% |
| Kenya | 40 | 0.1% |
| Korea | 316 | 0.6% |
| Latin America | 2,680 | 5.5% |
| Latvia | 67 | 0.1% |
| Lebanon | 133 | 0.3% |
| Malaysia | 11 | 0.0% |
| Mexico | 2,387 | 4.9% |
| Middle Africa | 71 | 0.2% |
| Nepal | 8 | 0.0% |
| Netherlands | 15 | 0.0% |
| Nicaragua | 18 | 0.0% |
| Northern Africa | 44 | 0.1% |
| Northern Europe | 267 | 0.5% |
| Oceania | 130 | 0.3% |
| Pakistan | 91 | 0.2% |
| Panama | 18 | 0.0% |
| Peru | 25 | 0.1% |
| Philippines | 1,039 | 2.1% |
| Poland | 20 | 0.0% |
| Portugal | 3 | 0.0% |
| Romania | 54 | 0.1% |
| Russia | 194 | 0.4% |
| Saudi Arabia | 11 | 0.0% |
| Scotland | 50 | 0.1% |
| Serbia | 9 | 0.0% |
| South Africa | 39 | 0.1% |
| South America | 177 | 0.4% |
| South Central Asia | 1,294 | 2.7% |
| South Eastern Asia | 1,964 | 4.0% |
| Southern Europe | 62 | 0.1% |
| Sri Lanka | 123 | 0.3% |
| Sweden | 7 | 0.0% |
| Switzerland | 2 | 0.0% |
| Syria | 146 | 0.3% |
| Taiwan | 74 | 0.2% |
| Thailand | 20 | 0.0% |
| Ukraine | 39 | 0.1% |
| Venezuela | 34 | 0.1% |
| Vietnam | 838 | 1.7% |
| West Indies | 9 | 0.0% |
| Western Asia | 613 | 1.3% |
| Western Europe | 145 | 0.3% | View All 81 Rows |
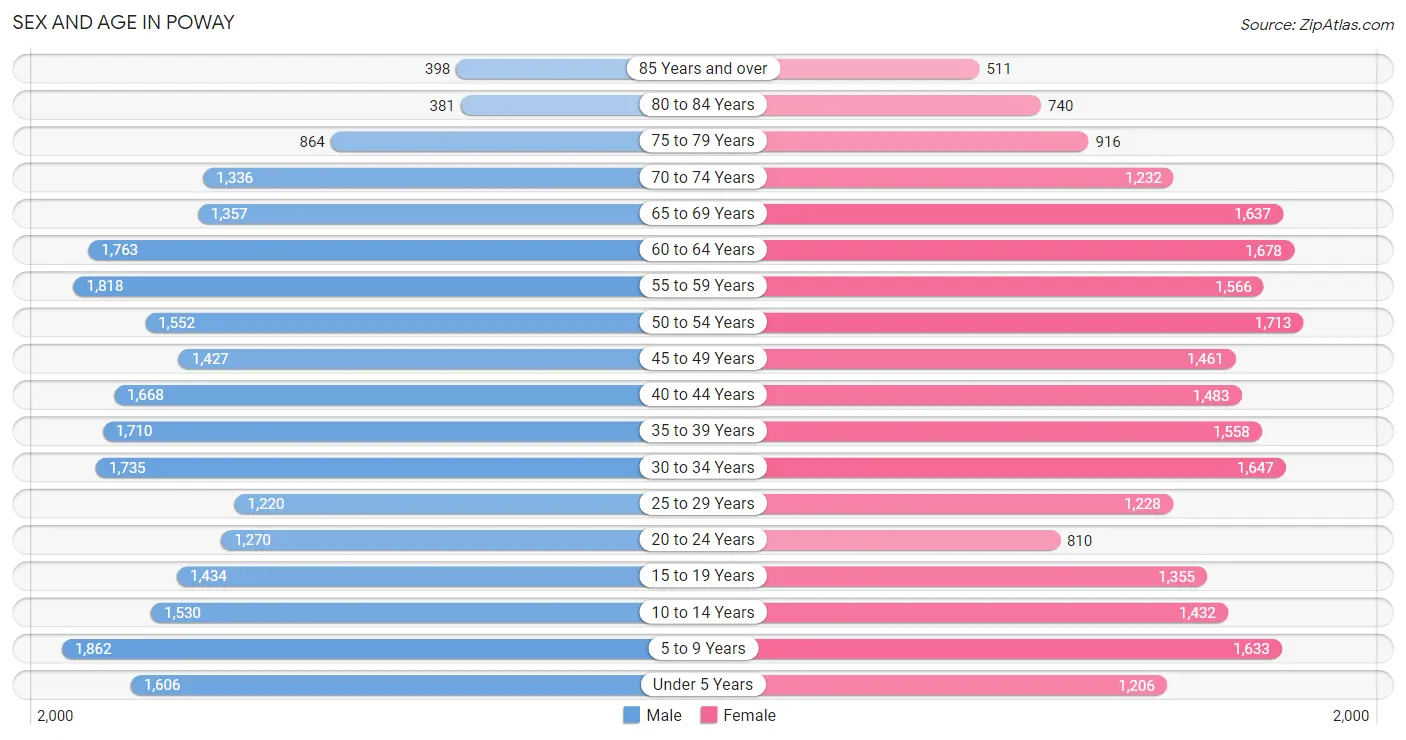
Sex and Age in Poway
Sex and Age in Poway
The most populous age groups in Poway are 5 to 9 Years (1,862 | 7.5%) for men and 50 to 54 Years (1,713 | 7.2%) for women.
| Age Bracket | Male | Female |
| Under 5 Years | 1,606 (6.4%) | 1,206 (5.1%) |
| 5 to 9 Years | 1,862 (7.5%) | 1,633 (6.9%) |
| 10 to 14 Years | 1,530 (6.1%) | 1,432 (6.0%) |
| 15 to 19 Years | 1,434 (5.8%) | 1,355 (5.7%) |
| 20 to 24 Years | 1,270 (5.1%) | 810 (3.4%) |
| 25 to 29 Years | 1,220 (4.9%) | 1,228 (5.2%) |
| 30 to 34 Years | 1,735 (7.0%) | 1,647 (6.9%) |
| 35 to 39 Years | 1,710 (6.9%) | 1,558 (6.5%) |
| 40 to 44 Years | 1,668 (6.7%) | 1,483 (6.2%) |
| 45 to 49 Years | 1,427 (5.7%) | 1,461 (6.1%) |
| 50 to 54 Years | 1,552 (6.2%) | 1,713 (7.2%) |
| 55 to 59 Years | 1,818 (7.3%) | 1,566 (6.6%) |
| 60 to 64 Years | 1,763 (7.1%) | 1,678 (7.0%) |
| 65 to 69 Years | 1,357 (5.4%) | 1,637 (6.9%) |
| 70 to 74 Years | 1,336 (5.4%) | 1,232 (5.2%) |
| 75 to 79 Years | 864 (3.5%) | 916 (3.8%) |
| 80 to 84 Years | 381 (1.5%) | 740 (3.1%) |
| 85 Years and over | 398 (1.6%) | 511 (2.1%) |
| Total | 24,931 (100.0%) | 23,806 (100.0%) |
Families and Households in Poway
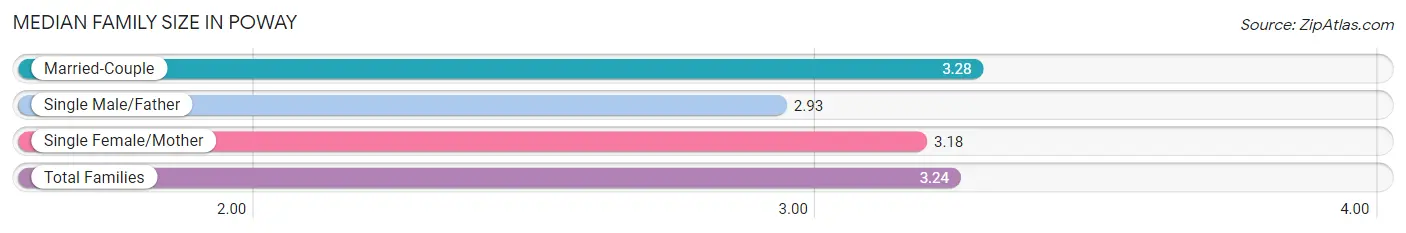
Median Family Size in Poway
The median family size in Poway is 3.24 persons per family, with married-couple families (10,517 | 81.5%) accounting for the largest median family size of 3.28 persons per family. On the other hand, single male/father families (908 | 7.0%) represent the smallest median family size with 2.93 persons per family.
| Family Type | # Families | Family Size |
| Married-Couple | 10,517 (81.5%) | 3.28 |
| Single Male/Father | 908 (7.0%) | 2.93 |
| Single Female/Mother | 1,475 (11.4%) | 3.18 |
| Total Families | 12,900 (100.0%) | 3.24 |
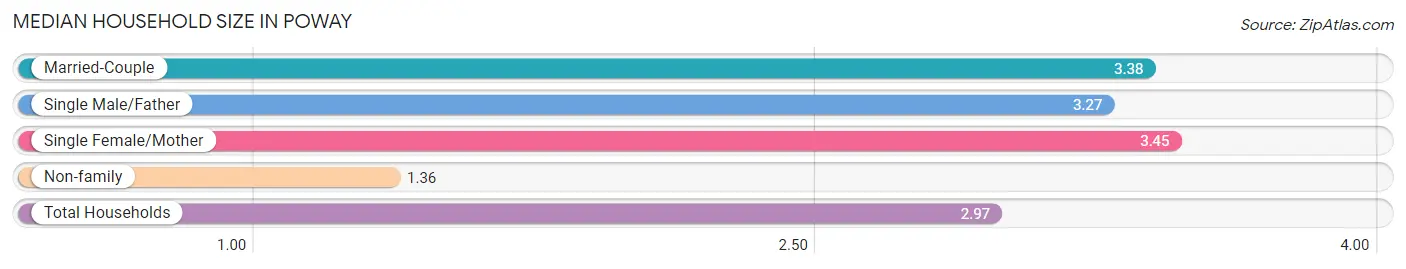
Median Household Size in Poway
The median household size in Poway is 2.97 persons per household, with single female/mother households (1,475 | 9.1%) accounting for the largest median household size of 3.45 persons per household. non-family households (3,259 | 20.2%) represent the smallest median household size with 1.36 persons per household.
| Household Type | # Households | Household Size |
| Married-Couple | 10,517 (65.1%) | 3.38 |
| Single Male/Father | 908 (5.6%) | 3.27 |
| Single Female/Mother | 1,475 (9.1%) | 3.45 |
| Non-family | 3,259 (20.2%) | 1.36 |
| Total Households | 16,159 (100.0%) | 2.97 |
Household Size by Marriage Status in Poway
Out of a total of 16,159 households in Poway, 12,900 (79.8%) are family households, while 3,259 (20.2%) are nonfamily households. The most numerous type of family households are 2-person households, comprising 5,218, and the most common type of nonfamily households are 1-person households, comprising 2,393.
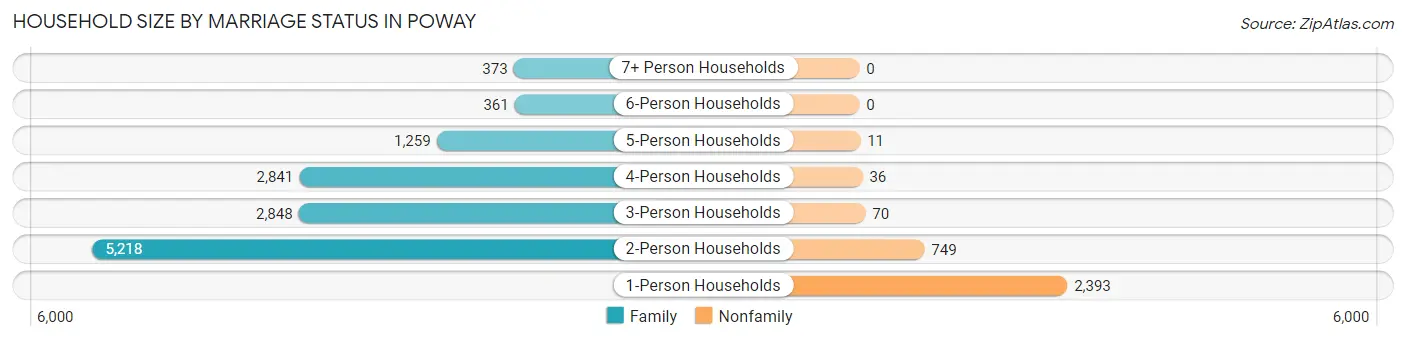
| Household Size | Family Households | Nonfamily Households |
| 1-Person Households | - | 2,393 (14.8%) |
| 2-Person Households | 5,218 (32.3%) | 749 (4.6%) |
| 3-Person Households | 2,848 (17.6%) | 70 (0.4%) |
| 4-Person Households | 2,841 (17.6%) | 36 (0.2%) |
| 5-Person Households | 1,259 (7.8%) | 11 (0.1%) |
| 6-Person Households | 361 (2.2%) | 0 (0.0%) |
| 7+ Person Households | 373 (2.3%) | 0 (0.0%) |
| Total | 12,900 (79.8%) | 3,259 (20.2%) |
Female Fertility in Poway
Fertility by Age in Poway
Average fertility rate in Poway is 65.0 births per 1,000 women. Women in the age bracket of 20 to 34 years have the highest fertility rate with 118.0 births per 1,000 women. Women in the age bracket of 20 to 34 years acount for 67.7% of all women with births.
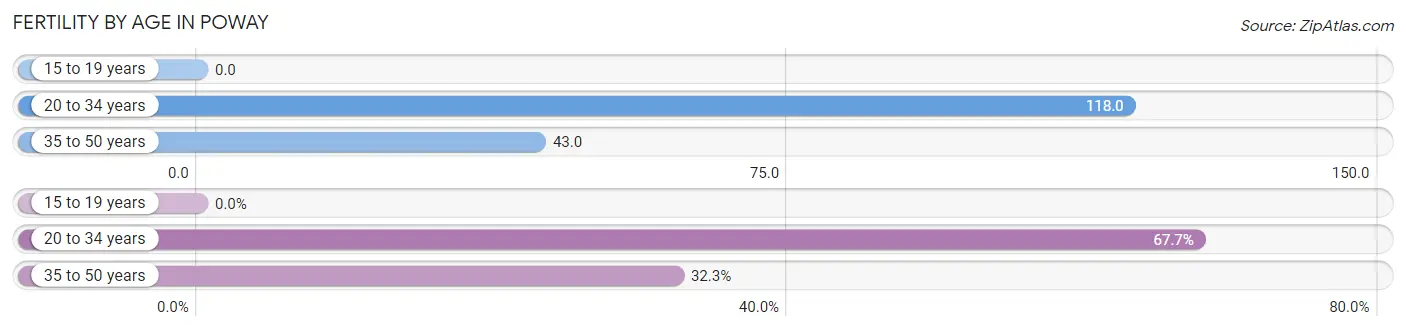
| Age Bracket | Women with Births | Births / 1,000 Women |
| 15 to 19 years | 0 (0.0%) | 0.0 |
| 20 to 34 years | 436 (67.7%) | 118.0 |
| 35 to 50 years | 208 (32.3%) | 43.0 |
| Total | 644 (100.0%) | 65.0 |
Fertility by Age by Marriage Status in Poway
98.3% of women with births (644) in Poway are married. The highest percentage of unmarried women with births falls into 20 to 34 years age bracket with 2.1% of them unmarried at the time of birth, while the lowest percentage of unmarried women with births belong to 35 to 50 years age bracket with 1.0% of them unmarried.
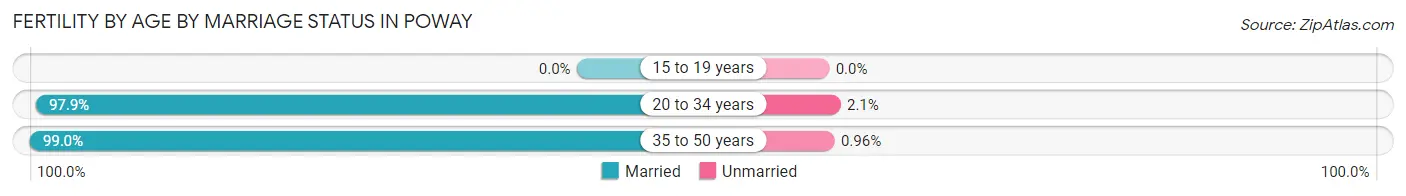
| Age Bracket | Married | Unmarried |
| 15 to 19 years | 0 (0.0%) | 0 (0.0%) |
| 20 to 34 years | 427 (97.9%) | 9 (2.1%) |
| 35 to 50 years | 206 (99.0%) | 2 (1.0%) |
| Total | 633 (98.3%) | 11 (1.7%) |
Fertility by Education in Poway
Average fertility rate in Poway is 65.0 births per 1,000 women. Women with the education attainment of graduate degree have the highest fertility rate of 109.0 births per 1,000 women, while women with the education attainment of high school diploma have the lowest fertility at 30.0 births per 1,000 women. Women with the education attainment of bachelor's degree represent 38.8% of all women with births.
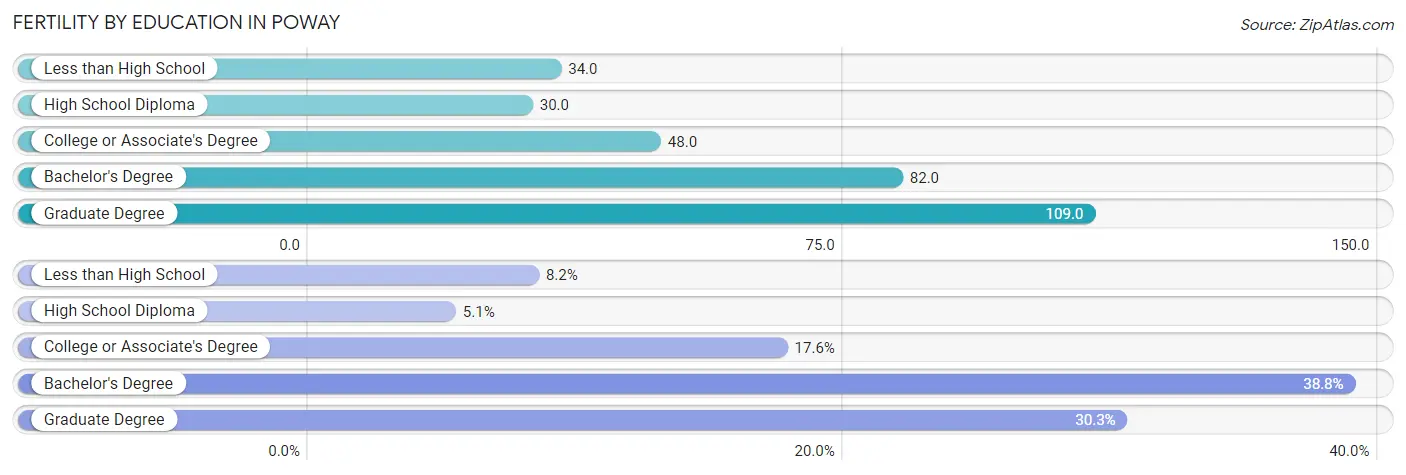
| Educational Attainment | Women with Births | Births / 1,000 Women |
| Less than High School | 53 (8.2%) | 34.0 |
| High School Diploma | 33 (5.1%) | 30.0 |
| College or Associate's Degree | 113 (17.5%) | 48.0 |
| Bachelor's Degree | 250 (38.8%) | 82.0 |
| Graduate Degree | 195 (30.3%) | 109.0 |
| Total | 644 (100.0%) | 65.0 |
Fertility by Education by Marriage Status in Poway
1.7% of women with births in Poway are unmarried. Women with the educational attainment of less than high school are most likely to be married with 100.0% of them married at childbirth, while women with the educational attainment of high school diploma are least likely to be married with 27.3% of them unmarried at childbirth.
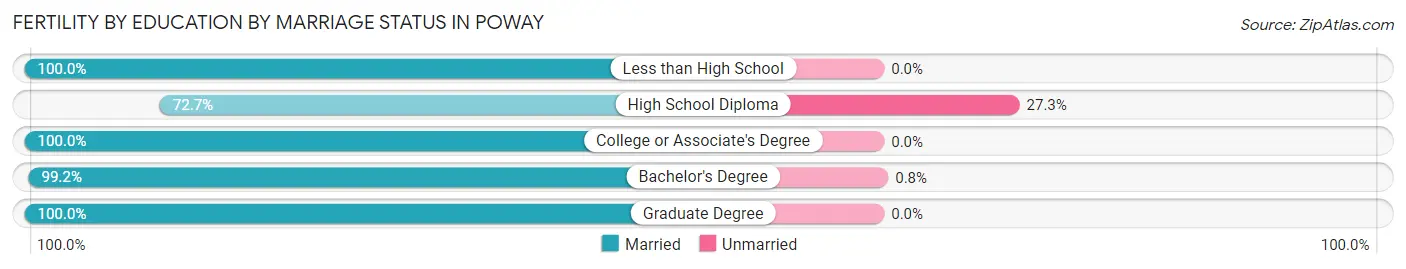
| Educational Attainment | Married | Unmarried |
| Less than High School | 53 (100.0%) | 0 (0.0%) |
| High School Diploma | 24 (72.7%) | 9 (27.3%) |
| College or Associate's Degree | 113 (100.0%) | 0 (0.0%) |
| Bachelor's Degree | 248 (99.2%) | 2 (0.8%) |
| Graduate Degree | 195 (100.0%) | 0 (0.0%) |
| Total | 633 (98.3%) | 11 (1.7%) |
Employment Characteristics in Poway
Employment by Class of Employer in Poway
Among the 22,647 employed individuals in Poway, private company employees (14,315 | 63.2%), local government employees (1,986 | 8.8%), and not-for-profit organizations (1,939 | 8.6%) make up the most common classes of employment.
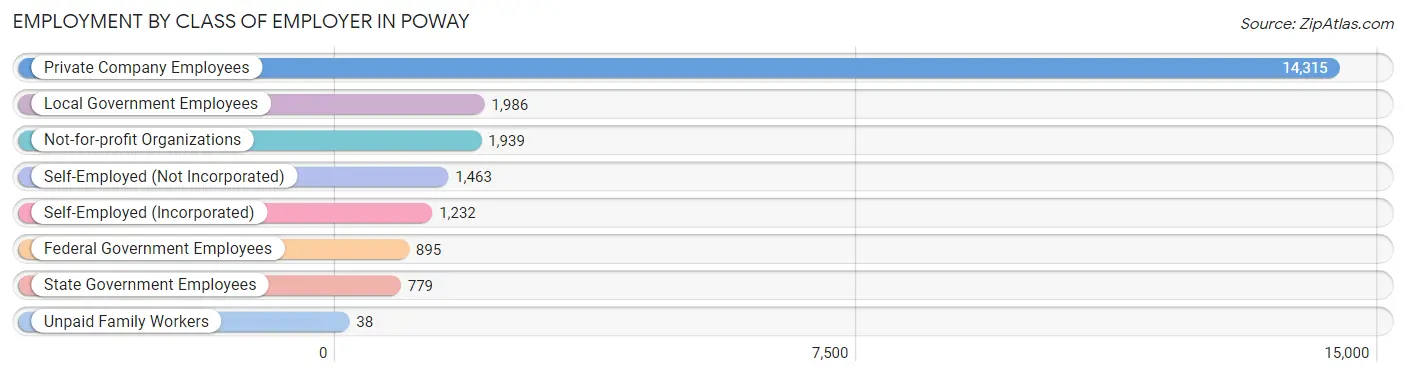
| Employer Class | # Employees | % Employees |
| Private Company Employees | 14,315 | 63.2% |
| Self-Employed (Incorporated) | 1,232 | 5.4% |
| Self-Employed (Not Incorporated) | 1,463 | 6.5% |
| Not-for-profit Organizations | 1,939 | 8.6% |
| Local Government Employees | 1,986 | 8.8% |
| State Government Employees | 779 | 3.4% |
| Federal Government Employees | 895 | 4.0% |
| Unpaid Family Workers | 38 | 0.2% |
| Total | 22,647 | 100.0% |
Employment Status by Age in Poway
According to the labor force statistics for Poway, out of the total population over 16 years of age (38,968), 63.3% or 24,667 individuals are in the labor force, with 5.9% or 1,455 of them unemployed. The age group with the highest labor force participation rate is 25 to 29 years, with 86.0% or 2,105 individuals in the labor force. Within the labor force, the 20 to 24 years age range has the highest percentage of unemployed individuals, with 16.2% or 244 of them being unemployed.
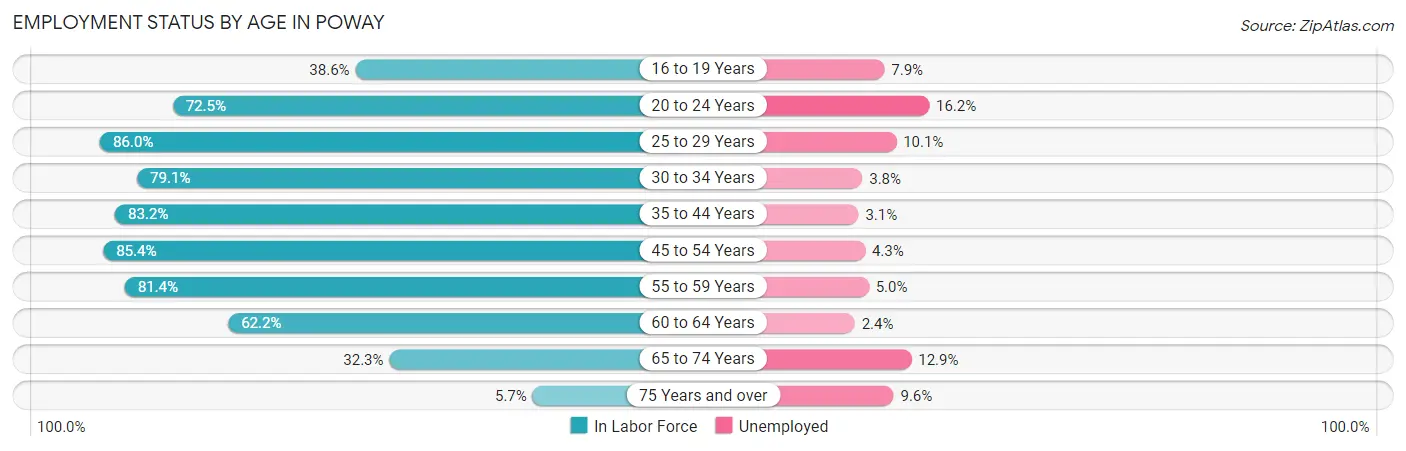
| Age Bracket | In Labor Force | Unemployed |
| 16 to 19 Years | 884 (38.6%) | 70 (7.9%) |
| 20 to 24 Years | 1,508 (72.5%) | 244 (16.2%) |
| 25 to 29 Years | 2,105 (86.0%) | 213 (10.1%) |
| 30 to 34 Years | 2,675 (79.1%) | 102 (3.8%) |
| 35 to 44 Years | 5,341 (83.2%) | 166 (3.1%) |
| 45 to 54 Years | 5,255 (85.4%) | 226 (4.3%) |
| 55 to 59 Years | 2,755 (81.4%) | 138 (5.0%) |
| 60 to 64 Years | 2,140 (62.2%) | 51 (2.4%) |
| 65 to 74 Years | 1,797 (32.3%) | 232 (12.9%) |
| 75 Years and over | 217 (5.7%) | 21 (9.6%) |
| Total | 24,667 (63.3%) | 1,455 (5.9%) |
Employment Status by Educational Attainment in Poway
According to labor force statistics for Poway, 80.3% of individuals (20,257) out of the total population between 25 and 64 years of age (25,227) are in the labor force, with 4.4% or 891 of them being unemployed. The group with the highest labor force participation rate are those with the educational attainment of bachelor's degree or higher, with 85.9% or 12,059 individuals in the labor force. Within the labor force, individuals with college / associate degree education have the highest percentage of unemployment, with 6.1% or 325 of them being unemployed.
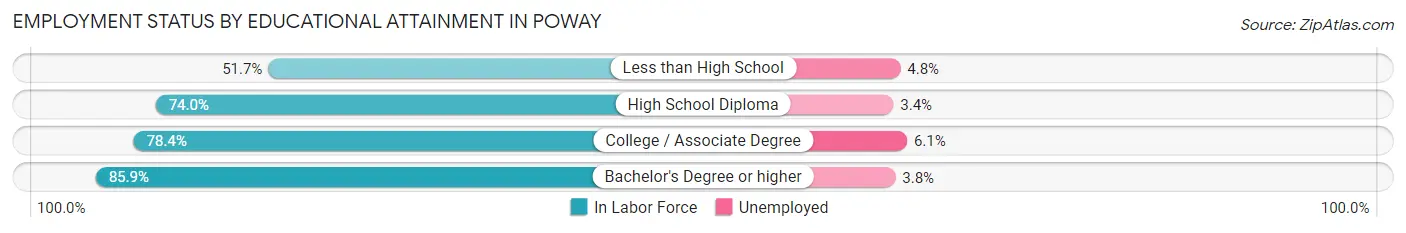
| Educational Attainment | In Labor Force | Unemployed |
| Less than High School | 852 (51.7%) | 79 (4.8%) |
| High School Diploma | 2,036 (74.0%) | 94 (3.4%) |
| College / Associate Degree | 5,323 (78.4%) | 414 (6.1%) |
| Bachelor's Degree or higher | 12,059 (85.9%) | 533 (3.8%) |
| Total | 20,257 (80.3%) | 1,110 (4.4%) |
Employment Occupations by Sex in Poway
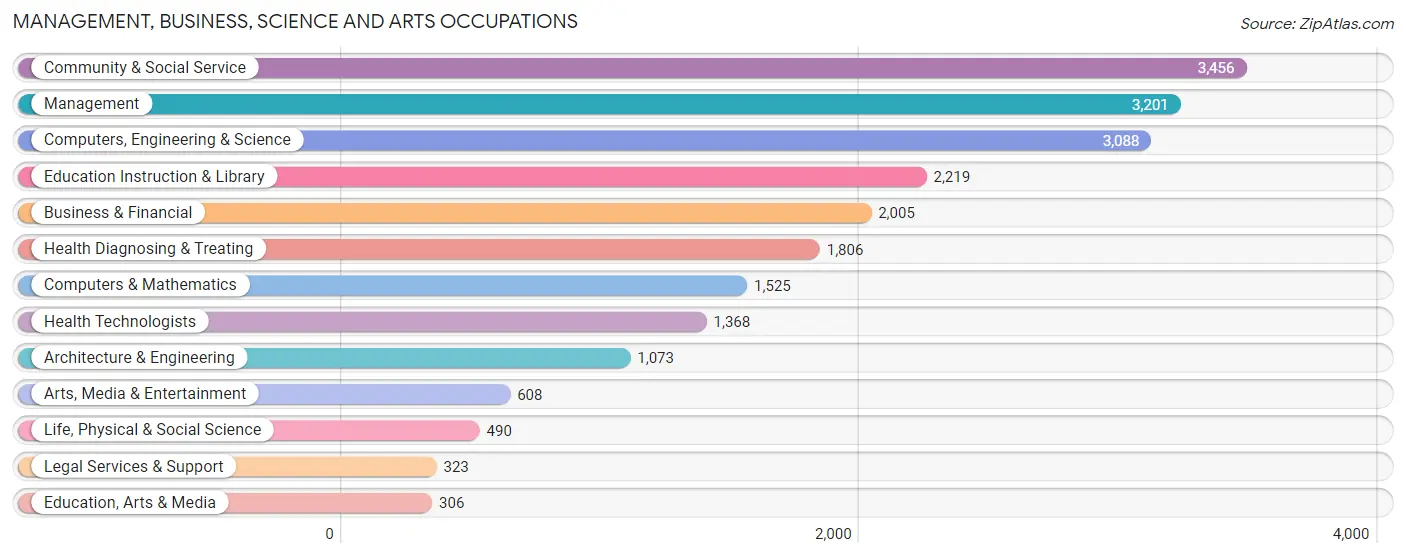
Management, Business, Science and Arts Occupations
The most common Management, Business, Science and Arts occupations in Poway are Community & Social Service (3,456 | 15.0%), Management (3,201 | 13.9%), Computers, Engineering & Science (3,088 | 13.4%), Education Instruction & Library (2,219 | 9.6%), and Business & Financial (2,005 | 8.7%).
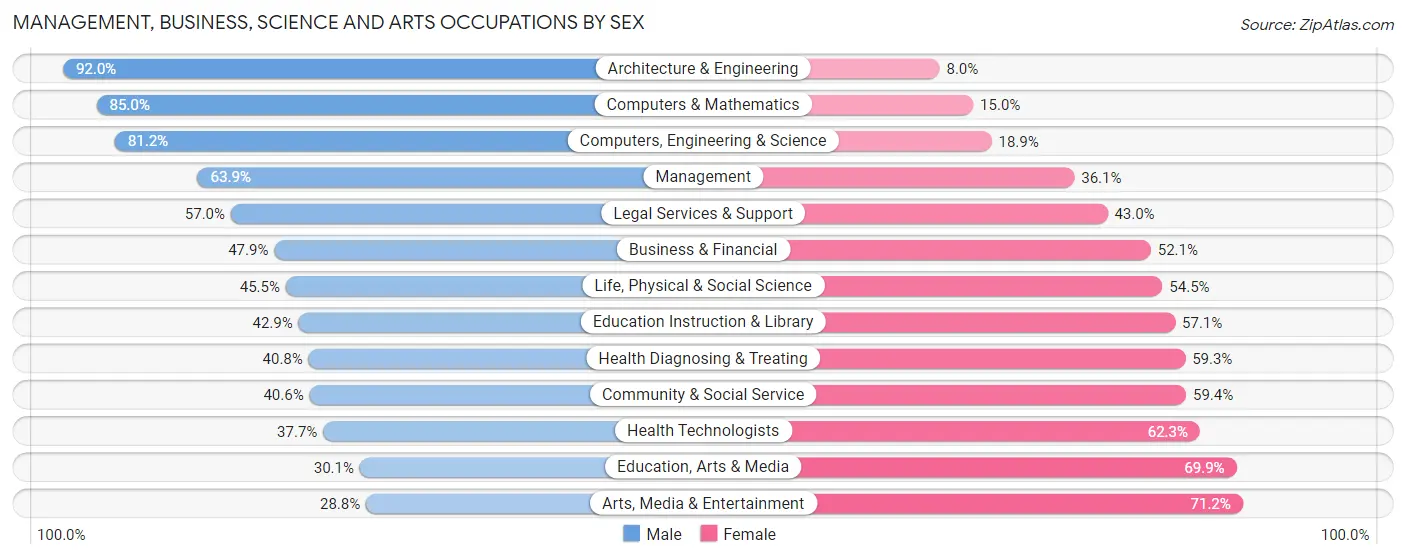
Management, Business, Science and Arts Occupations by Sex
Within the Management, Business, Science and Arts occupations in Poway, the most male-oriented occupations are Architecture & Engineering (92.0%), Computers & Mathematics (85.0%), and Computers, Engineering & Science (81.1%), while the most female-oriented occupations are Arts, Media & Entertainment (71.2%), Education, Arts & Media (69.9%), and Health Technologists (62.3%).
| Occupation | Male | Female |
| Management | 2,045 (63.9%) | 1,156 (36.1%) |
| Business & Financial | 961 (47.9%) | 1,044 (52.1%) |
| Computers, Engineering & Science | 2,506 (81.1%) | 582 (18.9%) |
| Computers & Mathematics | 1,296 (85.0%) | 229 (15.0%) |
| Architecture & Engineering | 987 (92.0%) | 86 (8.0%) |
| Life, Physical & Social Science | 223 (45.5%) | 267 (54.5%) |
| Community & Social Service | 1,402 (40.6%) | 2,054 (59.4%) |
| Education, Arts & Media | 92 (30.1%) | 214 (69.9%) |
| Legal Services & Support | 184 (57.0%) | 139 (43.0%) |
| Education Instruction & Library | 951 (42.9%) | 1,268 (57.1%) |
| Arts, Media & Entertainment | 175 (28.8%) | 433 (71.2%) |
| Health Diagnosing & Treating | 736 (40.7%) | 1,070 (59.3%) |
| Health Technologists | 516 (37.7%) | 852 (62.3%) |
| Total (Category) | 7,650 (56.4%) | 5,906 (43.6%) |
| Total (Overall) | 12,864 (55.9%) | 10,159 (44.1%) |
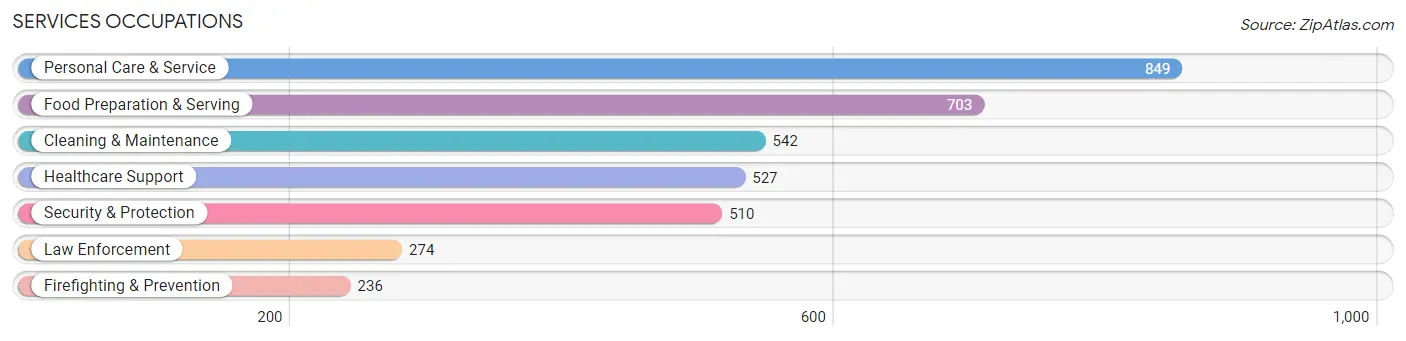
Services Occupations
The most common Services occupations in Poway are Personal Care & Service (849 | 3.7%), Food Preparation & Serving (703 | 3.0%), Cleaning & Maintenance (542 | 2.4%), Healthcare Support (527 | 2.3%), and Security & Protection (510 | 2.2%).
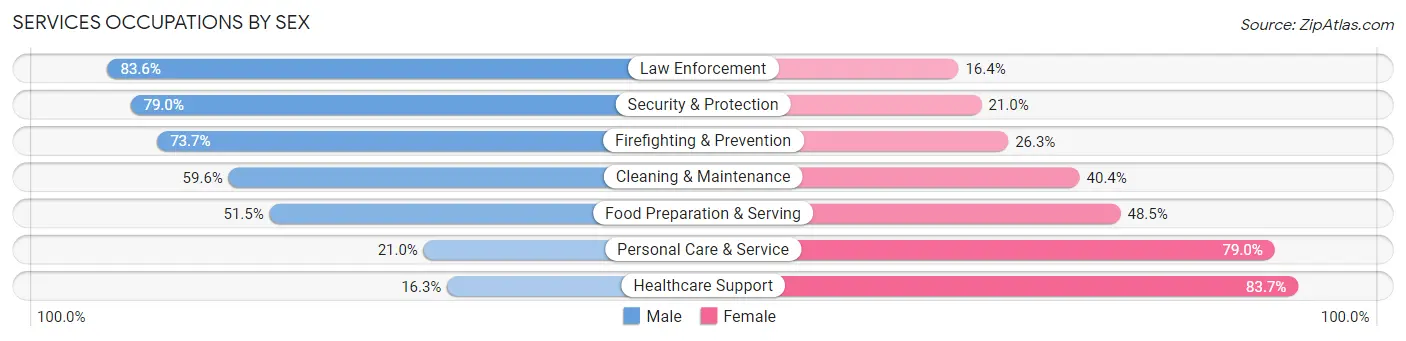
Services Occupations by Sex
Within the Services occupations in Poway, the most male-oriented occupations are Law Enforcement (83.6%), Security & Protection (79.0%), and Firefighting & Prevention (73.7%), while the most female-oriented occupations are Healthcare Support (83.7%), Personal Care & Service (79.0%), and Food Preparation & Serving (48.5%).
| Occupation | Male | Female |
| Healthcare Support | 86 (16.3%) | 441 (83.7%) |
| Security & Protection | 403 (79.0%) | 107 (21.0%) |
| Firefighting & Prevention | 174 (73.7%) | 62 (26.3%) |
| Law Enforcement | 229 (83.6%) | 45 (16.4%) |
| Food Preparation & Serving | 362 (51.5%) | 341 (48.5%) |
| Cleaning & Maintenance | 323 (59.6%) | 219 (40.4%) |
| Personal Care & Service | 178 (21.0%) | 671 (79.0%) |
| Total (Category) | 1,352 (43.2%) | 1,779 (56.8%) |
| Total (Overall) | 12,864 (55.9%) | 10,159 (44.1%) |
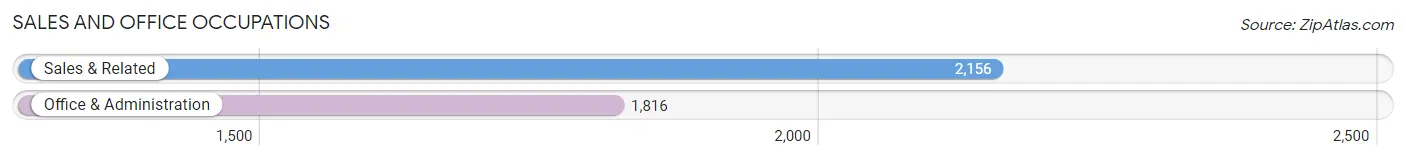
Sales and Office Occupations
The most common Sales and Office occupations in Poway are Sales & Related (2,156 | 9.4%), and Office & Administration (1,816 | 7.9%).
Sales and Office Occupations by Sex
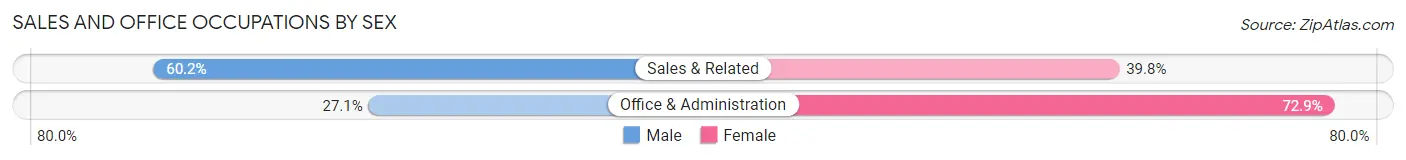
| Occupation | Male | Female |
| Sales & Related | 1,298 (60.2%) | 858 (39.8%) |
| Office & Administration | 492 (27.1%) | 1,324 (72.9%) |
| Total (Category) | 1,790 (45.1%) | 2,182 (54.9%) |
| Total (Overall) | 12,864 (55.9%) | 10,159 (44.1%) |
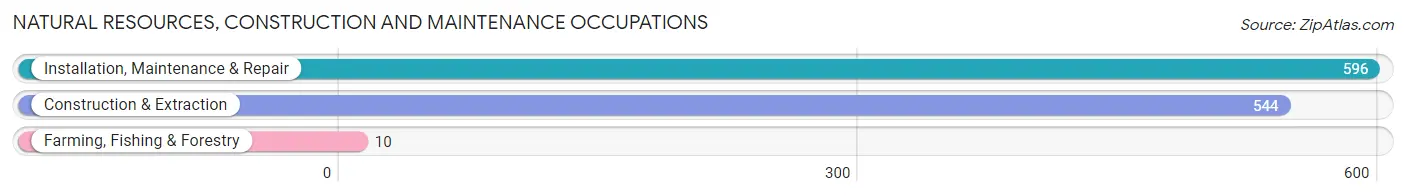
Natural Resources, Construction and Maintenance Occupations
The most common Natural Resources, Construction and Maintenance occupations in Poway are Installation, Maintenance & Repair (596 | 2.6%), Construction & Extraction (544 | 2.4%), and Farming, Fishing & Forestry (10 | 0.0%).
Natural Resources, Construction and Maintenance Occupations by Sex
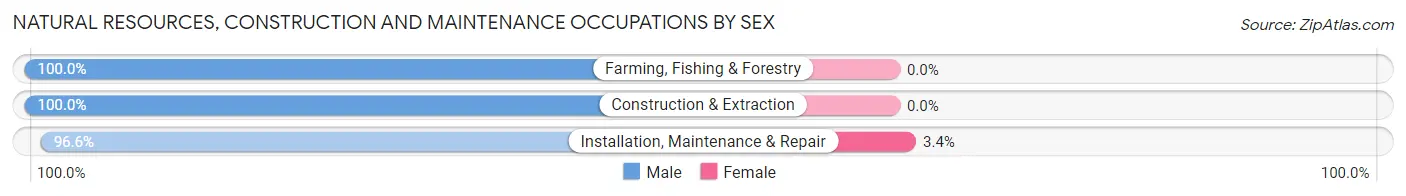
| Occupation | Male | Female |
| Farming, Fishing & Forestry | 10 (100.0%) | 0 (0.0%) |
| Construction & Extraction | 544 (100.0%) | 0 (0.0%) |
| Installation, Maintenance & Repair | 576 (96.6%) | 20 (3.4%) |
| Total (Category) | 1,130 (98.3%) | 20 (1.7%) |
| Total (Overall) | 12,864 (55.9%) | 10,159 (44.1%) |
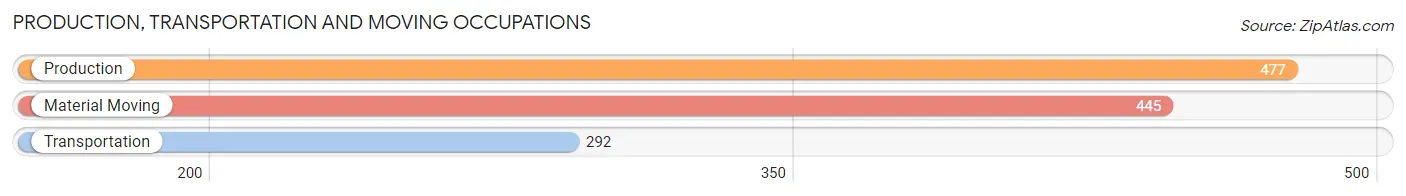
Production, Transportation and Moving Occupations
The most common Production, Transportation and Moving occupations in Poway are Production (477 | 2.1%), Material Moving (445 | 1.9%), and Transportation (292 | 1.3%).
Production, Transportation and Moving Occupations by Sex
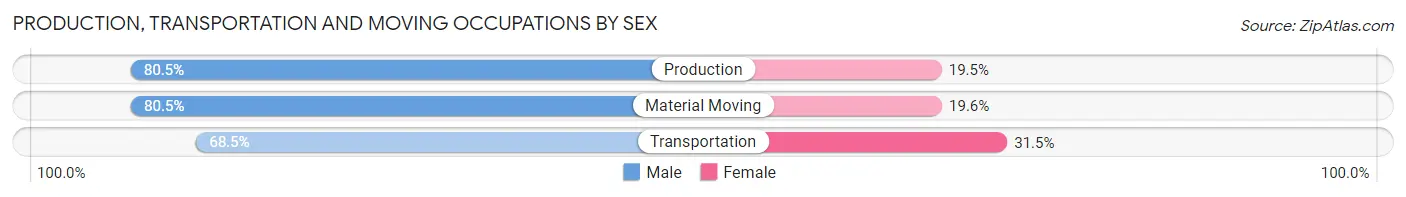
| Occupation | Male | Female |
| Production | 384 (80.5%) | 93 (19.5%) |
| Transportation | 200 (68.5%) | 92 (31.5%) |
| Material Moving | 358 (80.4%) | 87 (19.6%) |
| Total (Category) | 942 (77.6%) | 272 (22.4%) |
| Total (Overall) | 12,864 (55.9%) | 10,159 (44.1%) |
Employment Industries by Sex in Poway
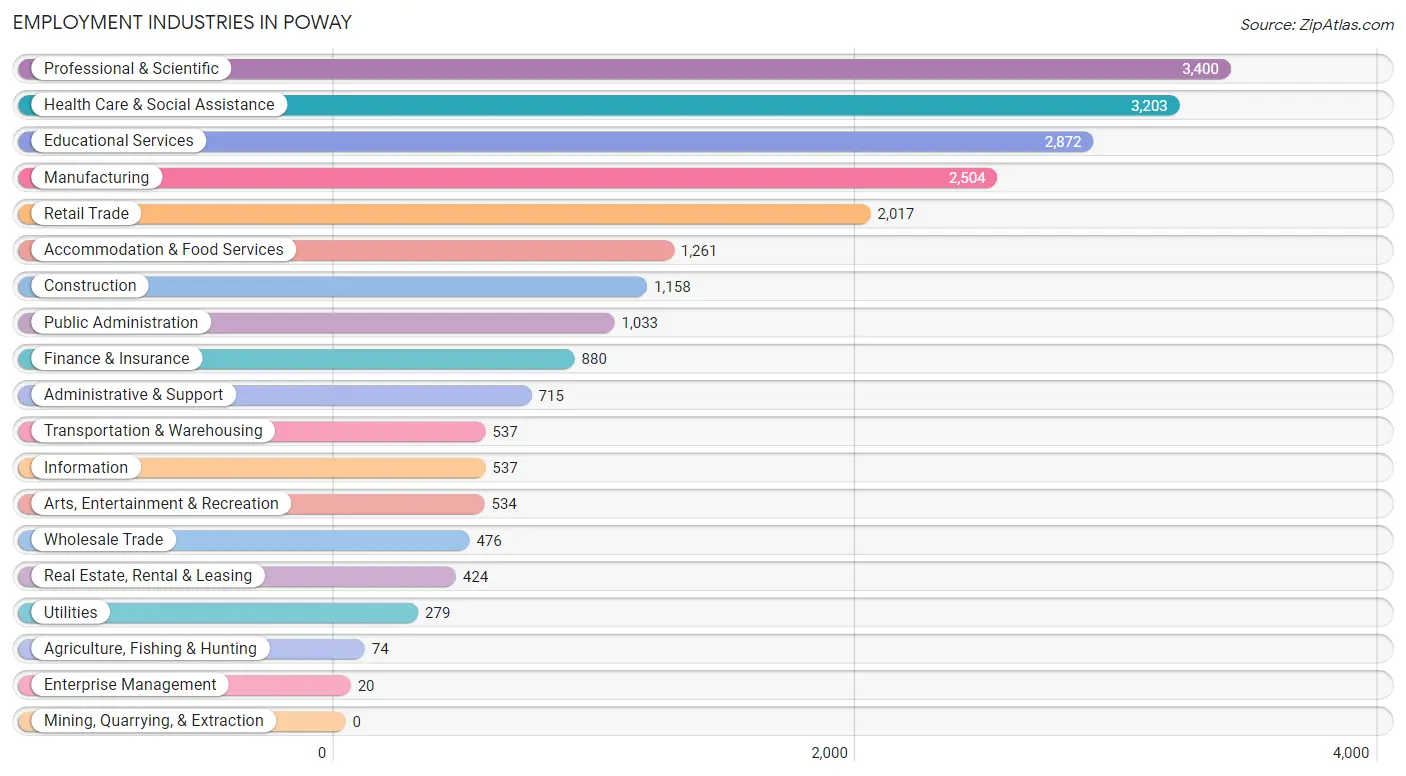
Employment Industries in Poway
The major employment industries in Poway include Professional & Scientific (3,400 | 14.8%), Health Care & Social Assistance (3,203 | 13.9%), Educational Services (2,872 | 12.5%), Manufacturing (2,504 | 10.9%), and Retail Trade (2,017 | 8.8%).
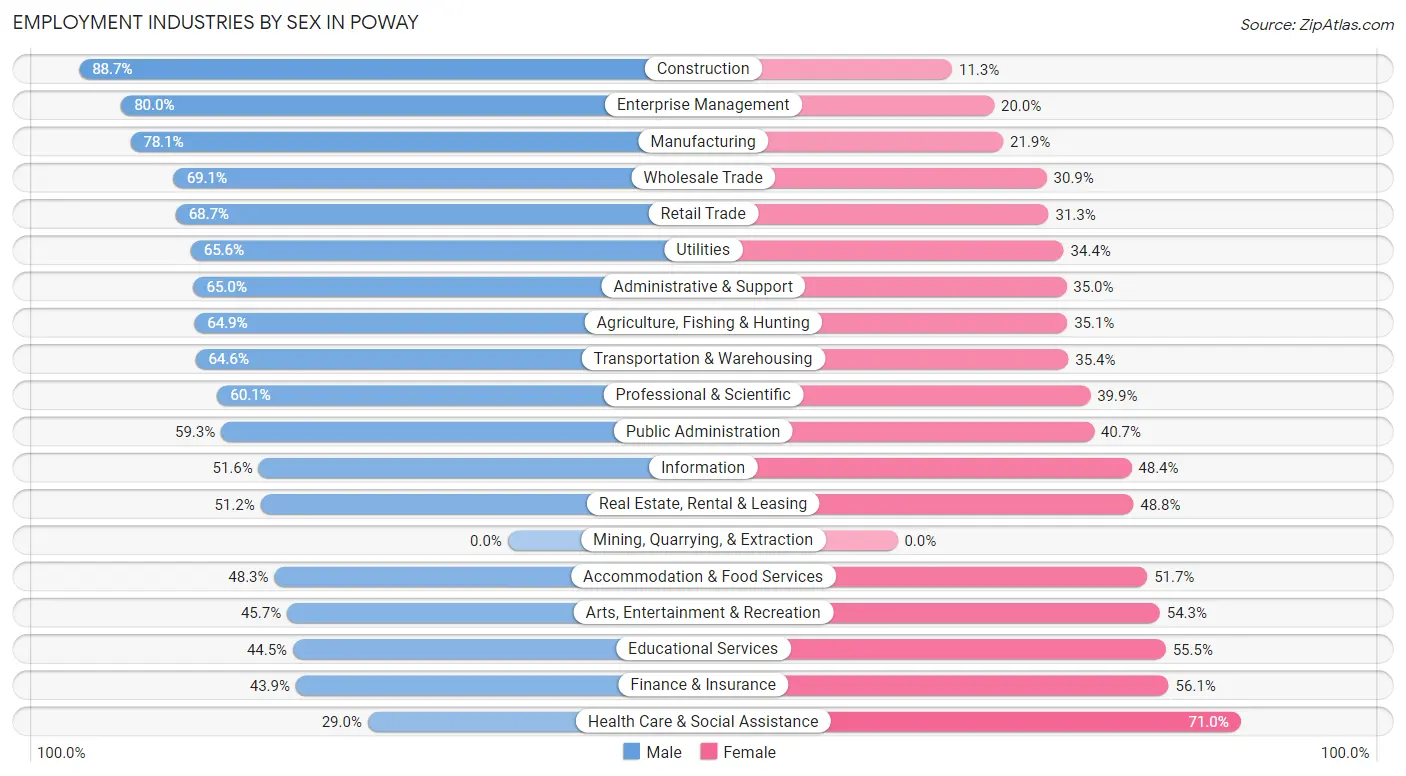
Employment Industries by Sex in Poway
The Poway industries that see more men than women are Construction (88.7%), Enterprise Management (80.0%), and Manufacturing (78.1%), whereas the industries that tend to have a higher number of women are Health Care & Social Assistance (71.0%), Finance & Insurance (56.1%), and Educational Services (55.5%).
| Industry | Male | Female |
| Agriculture, Fishing & Hunting | 48 (64.9%) | 26 (35.1%) |
| Mining, Quarrying, & Extraction | 0 (0.0%) | 0 (0.0%) |
| Construction | 1,027 (88.7%) | 131 (11.3%) |
| Manufacturing | 1,956 (78.1%) | 548 (21.9%) |
| Wholesale Trade | 329 (69.1%) | 147 (30.9%) |
| Retail Trade | 1,386 (68.7%) | 631 (31.3%) |
| Transportation & Warehousing | 347 (64.6%) | 190 (35.4%) |
| Utilities | 183 (65.6%) | 96 (34.4%) |
| Information | 277 (51.6%) | 260 (48.4%) |
| Finance & Insurance | 386 (43.9%) | 494 (56.1%) |
| Real Estate, Rental & Leasing | 217 (51.2%) | 207 (48.8%) |
| Professional & Scientific | 2,043 (60.1%) | 1,357 (39.9%) |
| Enterprise Management | 16 (80.0%) | 4 (20.0%) |
| Administrative & Support | 465 (65.0%) | 250 (35.0%) |
| Educational Services | 1,277 (44.5%) | 1,595 (55.5%) |
| Health Care & Social Assistance | 928 (29.0%) | 2,275 (71.0%) |
| Arts, Entertainment & Recreation | 244 (45.7%) | 290 (54.3%) |
| Accommodation & Food Services | 609 (48.3%) | 652 (51.7%) |
| Public Administration | 613 (59.3%) | 420 (40.7%) |
| Total | 12,864 (55.9%) | 10,159 (44.1%) |
Education in Poway
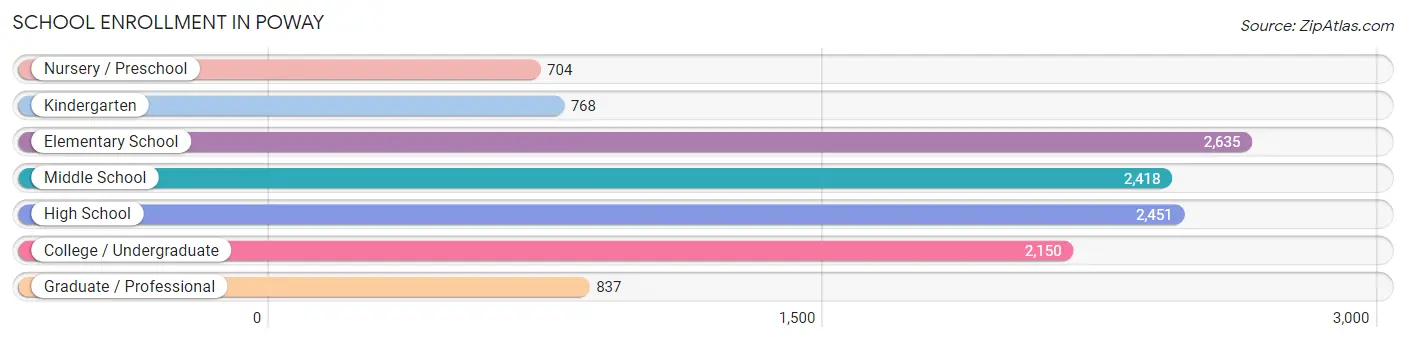
School Enrollment in Poway
The most common levels of schooling among the 11,963 students in Poway are elementary school (2,635 | 22.0%), high school (2,451 | 20.5%), and middle school (2,418 | 20.2%).
| School Level | # Students | % Students |
| Nursery / Preschool | 704 | 5.9% |
| Kindergarten | 768 | 6.4% |
| Elementary School | 2,635 | 22.0% |
| Middle School | 2,418 | 20.2% |
| High School | 2,451 | 20.5% |
| College / Undergraduate | 2,150 | 18.0% |
| Graduate / Professional | 837 | 7.0% |
| Total | 11,963 | 100.0% |
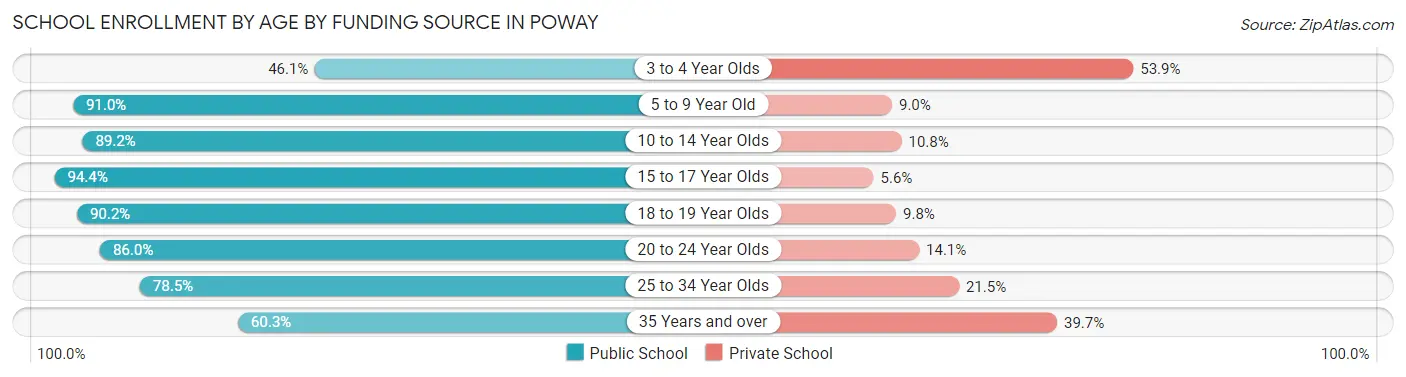
School Enrollment by Age by Funding Source in Poway
Out of a total of 11,963 students who are enrolled in schools in Poway, 1,663 (13.9%) attend a private institution, while the remaining 10,300 (86.1%) are enrolled in public schools. The age group of 3 to 4 year olds has the highest likelihood of being enrolled in private schools, with 260 (53.9% in the age bracket) enrolled. Conversely, the age group of 15 to 17 year olds has the lowest likelihood of being enrolled in a private school, with 1,454 (94.4% in the age bracket) attending a public institution.
| Age Bracket | Public School | Private School |
| 3 to 4 Year Olds | 222 (46.1%) | 260 (53.9%) |
| 5 to 9 Year Old | 3,030 (91.0%) | 300 (9.0%) |
| 10 to 14 Year Olds | 2,633 (89.2%) | 318 (10.8%) |
| 15 to 17 Year Olds | 1,454 (94.4%) | 86 (5.6%) |
| 18 to 19 Year Olds | 999 (90.2%) | 108 (9.8%) |
| 20 to 24 Year Olds | 924 (86.0%) | 151 (14.1%) |
| 25 to 34 Year Olds | 625 (78.5%) | 171 (21.5%) |
| 35 Years and over | 411 (60.3%) | 271 (39.7%) |
| Total | 10,300 (86.1%) | 1,663 (13.9%) |
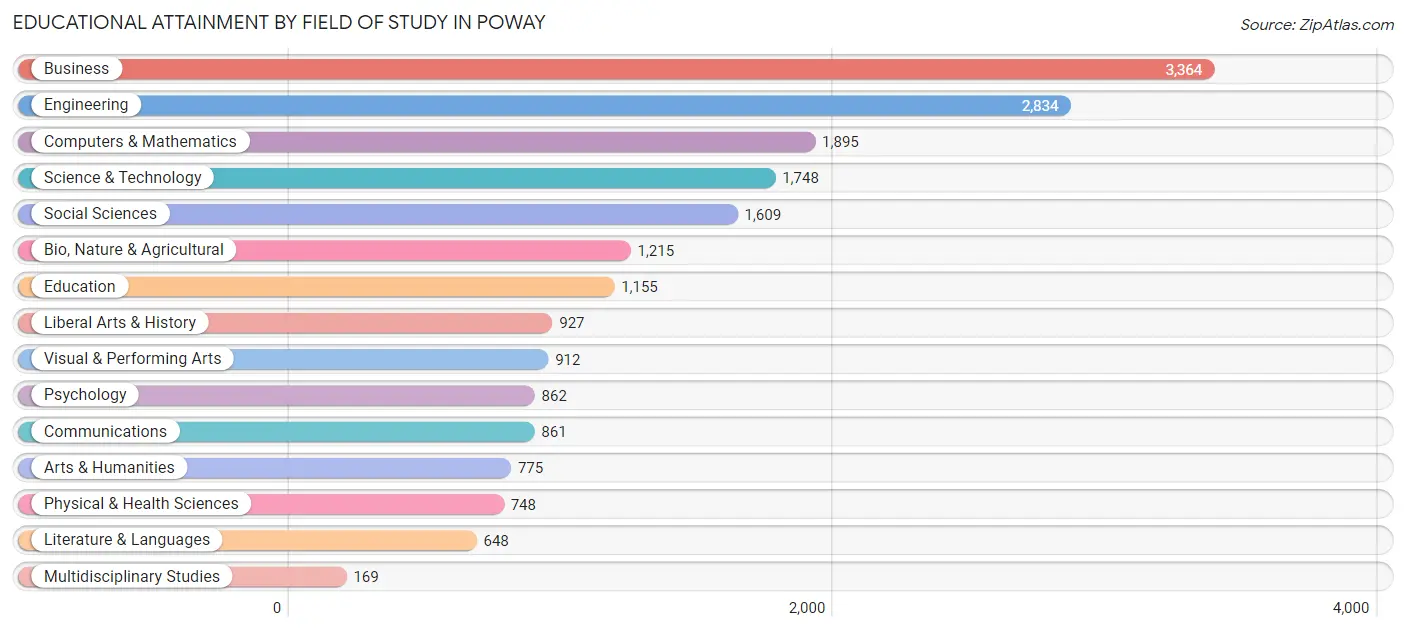
Educational Attainment by Field of Study in Poway
Business (3,364 | 17.1%), engineering (2,834 | 14.4%), computers & mathematics (1,895 | 9.6%), science & technology (1,748 | 8.9%), and social sciences (1,609 | 8.2%) are the most common fields of study among 19,722 individuals in Poway who have obtained a bachelor's degree or higher.
| Field of Study | # Graduates | % Graduates |
| Computers & Mathematics | 1,895 | 9.6% |
| Bio, Nature & Agricultural | 1,215 | 6.2% |
| Physical & Health Sciences | 748 | 3.8% |
| Psychology | 862 | 4.4% |
| Social Sciences | 1,609 | 8.2% |
| Engineering | 2,834 | 14.4% |
| Multidisciplinary Studies | 169 | 0.9% |
| Science & Technology | 1,748 | 8.9% |
| Business | 3,364 | 17.1% |
| Education | 1,155 | 5.9% |
| Literature & Languages | 648 | 3.3% |
| Liberal Arts & History | 927 | 4.7% |
| Visual & Performing Arts | 912 | 4.6% |
| Communications | 861 | 4.4% |
| Arts & Humanities | 775 | 3.9% |
| Total | 19,722 | 100.0% |
Transportation & Commute in Poway
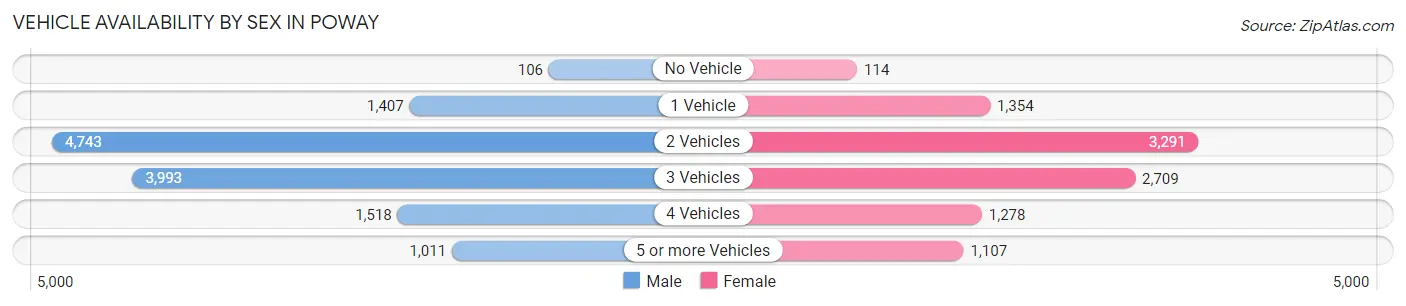
Vehicle Availability by Sex in Poway
The most prevalent vehicle ownership categories in Poway are males with 2 vehicles (4,743, accounting for 37.1%) and females with 2 vehicles (3,291, making up 48.1%).
| Vehicles Available | Male | Female |
| No Vehicle | 106 (0.8%) | 114 (1.2%) |
| 1 Vehicle | 1,407 (11.0%) | 1,354 (13.7%) |
| 2 Vehicles | 4,743 (37.1%) | 3,291 (33.4%) |
| 3 Vehicles | 3,993 (31.2%) | 2,709 (27.5%) |
| 4 Vehicles | 1,518 (11.9%) | 1,278 (13.0%) |
| 5 or more Vehicles | 1,011 (7.9%) | 1,107 (11.2%) |
| Total | 12,778 (100.0%) | 9,853 (100.0%) |
Commute Time in Poway
The most frequently occuring commute durations in Poway are 30 to 34 minutes (3,795 commuters, 20.3%), 15 to 19 minutes (2,610 commuters, 14.0%), and 10 to 14 minutes (2,417 commuters, 13.0%).
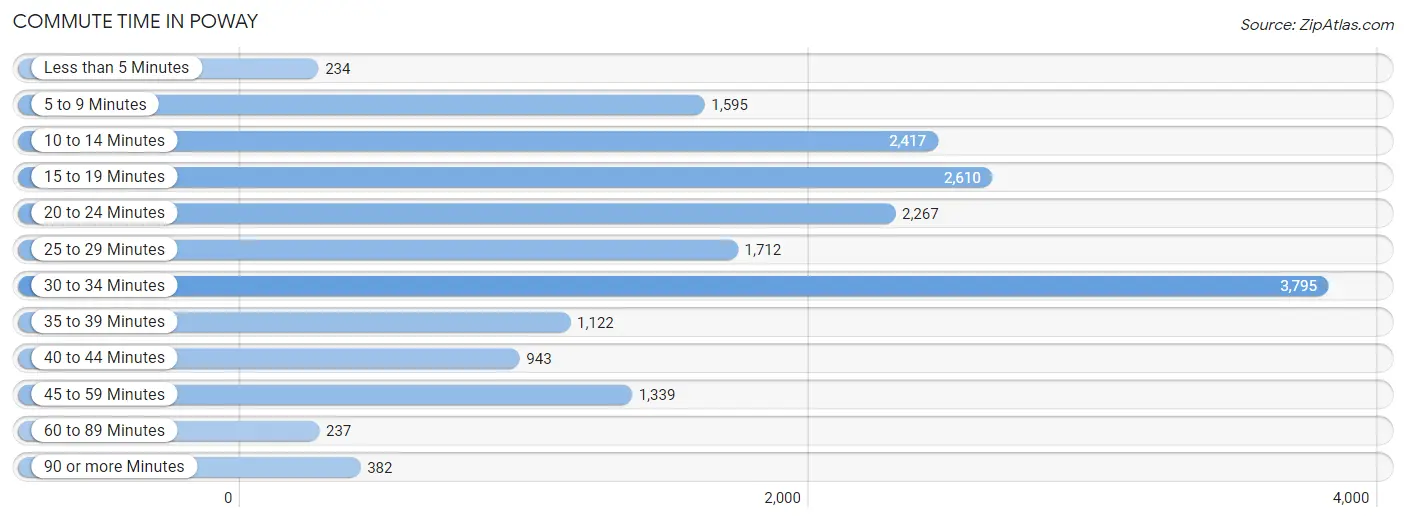
| Commute Time | # Commuters | % Commuters |
| Less than 5 Minutes | 234 | 1.3% |
| 5 to 9 Minutes | 1,595 | 8.6% |
| 10 to 14 Minutes | 2,417 | 13.0% |
| 15 to 19 Minutes | 2,610 | 14.0% |
| 20 to 24 Minutes | 2,267 | 12.1% |
| 25 to 29 Minutes | 1,712 | 9.2% |
| 30 to 34 Minutes | 3,795 | 20.3% |
| 35 to 39 Minutes | 1,122 | 6.0% |
| 40 to 44 Minutes | 943 | 5.1% |
| 45 to 59 Minutes | 1,339 | 7.2% |
| 60 to 89 Minutes | 237 | 1.3% |
| 90 or more Minutes | 382 | 2.1% |
Commute Time by Sex in Poway
The most common commute times in Poway are 30 to 34 minutes (2,209 commuters, 20.7%) for males and 30 to 34 minutes (1,586 commuters, 19.8%) for females.
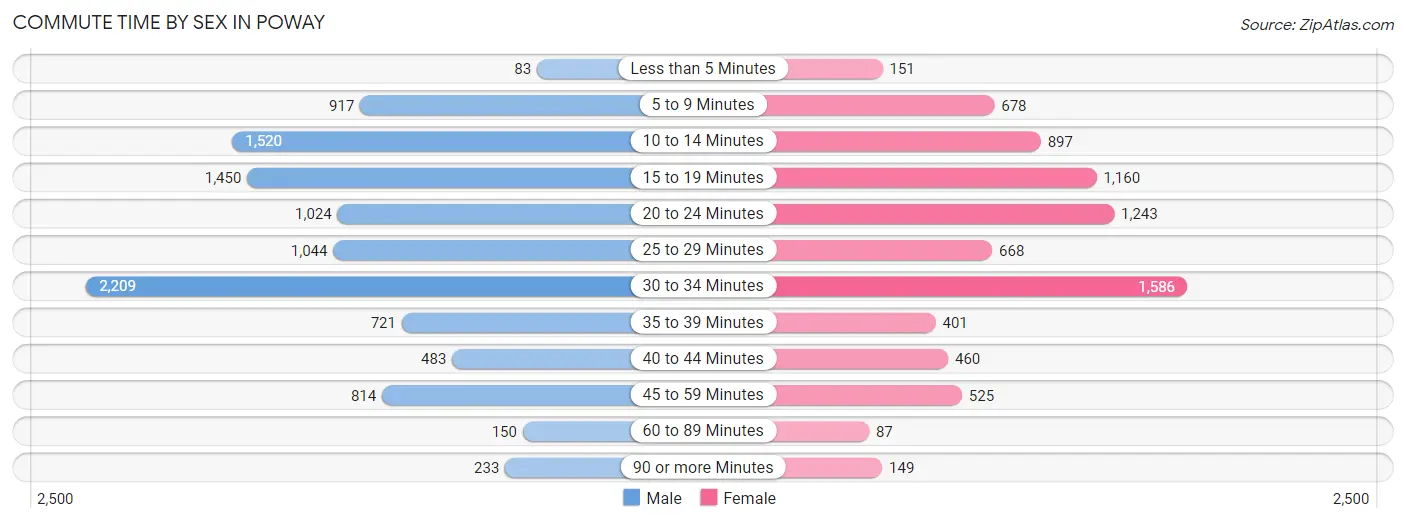
| Commute Time | Male | Female |
| Less than 5 Minutes | 83 (0.8%) | 151 (1.9%) |
| 5 to 9 Minutes | 917 (8.6%) | 678 (8.5%) |
| 10 to 14 Minutes | 1,520 (14.3%) | 897 (11.2%) |
| 15 to 19 Minutes | 1,450 (13.6%) | 1,160 (14.5%) |
| 20 to 24 Minutes | 1,024 (9.6%) | 1,243 (15.5%) |
| 25 to 29 Minutes | 1,044 (9.8%) | 668 (8.3%) |
| 30 to 34 Minutes | 2,209 (20.7%) | 1,586 (19.8%) |
| 35 to 39 Minutes | 721 (6.8%) | 401 (5.0%) |
| 40 to 44 Minutes | 483 (4.5%) | 460 (5.8%) |
| 45 to 59 Minutes | 814 (7.6%) | 525 (6.6%) |
| 60 to 89 Minutes | 150 (1.4%) | 87 (1.1%) |
| 90 or more Minutes | 233 (2.2%) | 149 (1.9%) |
Time of Departure to Work by Sex in Poway
The most frequent times of departure to work in Poway are 7:00 AM to 7:29 AM (1,529, 14.4%) for males and 7:00 AM to 7:29 AM (1,415, 17.7%) for females.
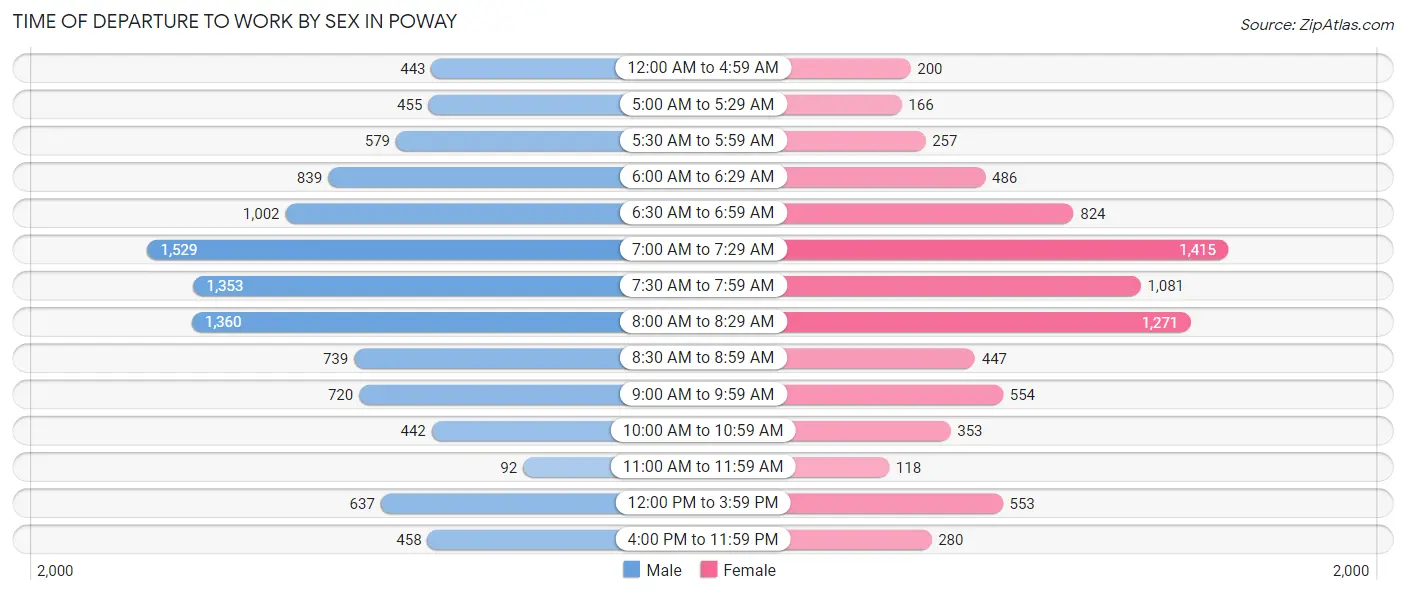
| Time of Departure | Male | Female |
| 12:00 AM to 4:59 AM | 443 (4.2%) | 200 (2.5%) |
| 5:00 AM to 5:29 AM | 455 (4.3%) | 166 (2.1%) |
| 5:30 AM to 5:59 AM | 579 (5.4%) | 257 (3.2%) |
| 6:00 AM to 6:29 AM | 839 (7.9%) | 486 (6.1%) |
| 6:30 AM to 6:59 AM | 1,002 (9.4%) | 824 (10.3%) |
| 7:00 AM to 7:29 AM | 1,529 (14.4%) | 1,415 (17.7%) |
| 7:30 AM to 7:59 AM | 1,353 (12.7%) | 1,081 (13.5%) |
| 8:00 AM to 8:29 AM | 1,360 (12.8%) | 1,271 (15.9%) |
| 8:30 AM to 8:59 AM | 739 (6.9%) | 447 (5.6%) |
| 9:00 AM to 9:59 AM | 720 (6.8%) | 554 (6.9%) |
| 10:00 AM to 10:59 AM | 442 (4.2%) | 353 (4.4%) |
| 11:00 AM to 11:59 AM | 92 (0.9%) | 118 (1.5%) |
| 12:00 PM to 3:59 PM | 637 (6.0%) | 553 (6.9%) |
| 4:00 PM to 11:59 PM | 458 (4.3%) | 280 (3.5%) |
| Total | 10,648 (100.0%) | 8,005 (100.0%) |
Housing Occupancy in Poway
Occupancy by Ownership in Poway
Of the total 16,159 dwellings in Poway, owner-occupied units account for 12,186 (75.4%), while renter-occupied units make up 3,973 (24.6%).
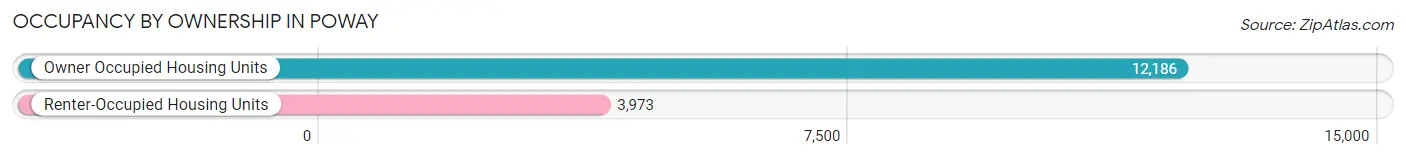
| Occupancy | # Housing Units | % Housing Units |
| Owner Occupied Housing Units | 12,186 | 75.4% |
| Renter-Occupied Housing Units | 3,973 | 24.6% |
| Total Occupied Housing Units | 16,159 | 100.0% |
Occupancy by Household Size in Poway
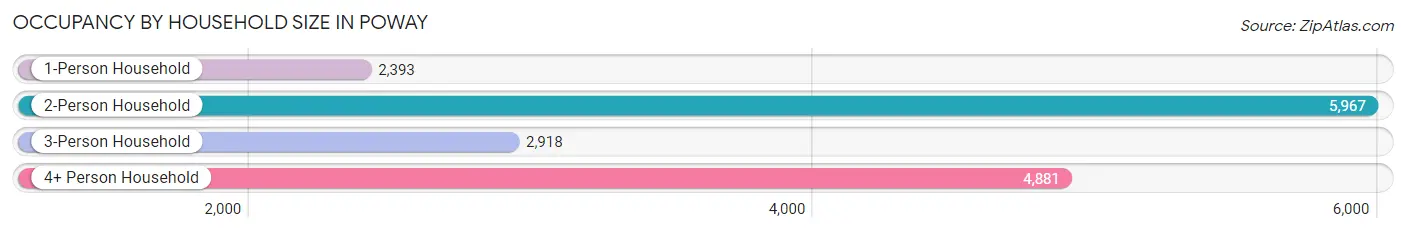
| Household Size | # Housing Units | % Housing Units |
| 1-Person Household | 2,393 | 14.8% |
| 2-Person Household | 5,967 | 36.9% |
| 3-Person Household | 2,918 | 18.1% |
| 4+ Person Household | 4,881 | 30.2% |
| Total Housing Units | 16,159 | 100.0% |
Occupancy by Ownership by Household Size in Poway
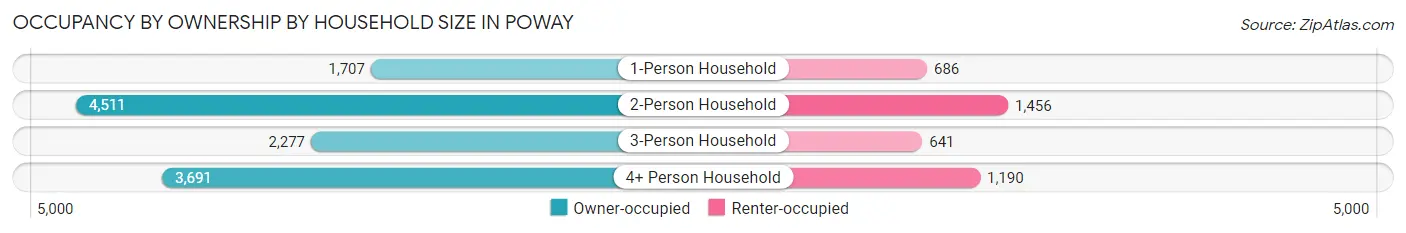
| Household Size | Owner-occupied | Renter-occupied |
| 1-Person Household | 1,707 (71.3%) | 686 (28.7%) |
| 2-Person Household | 4,511 (75.6%) | 1,456 (24.4%) |
| 3-Person Household | 2,277 (78.0%) | 641 (22.0%) |
| 4+ Person Household | 3,691 (75.6%) | 1,190 (24.4%) |
| Total Housing Units | 12,186 (75.4%) | 3,973 (24.6%) |
Occupancy by Educational Attainment in Poway
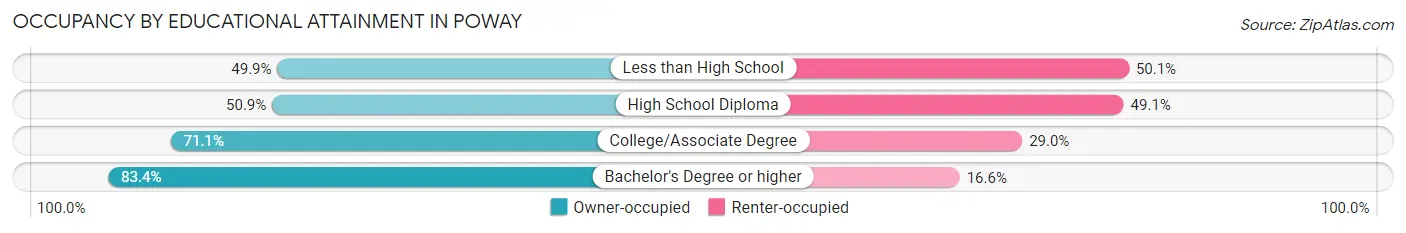
| Household Size | Owner-occupied | Renter-occupied |
| Less than High School | 406 (49.9%) | 408 (50.1%) |
| High School Diploma | 794 (50.9%) | 765 (49.1%) |
| College/Associate Degree | 2,960 (71.1%) | 1,206 (28.9%) |
| Bachelor's Degree or higher | 8,026 (83.4%) | 1,594 (16.6%) |
Occupancy by Age of Householder in Poway
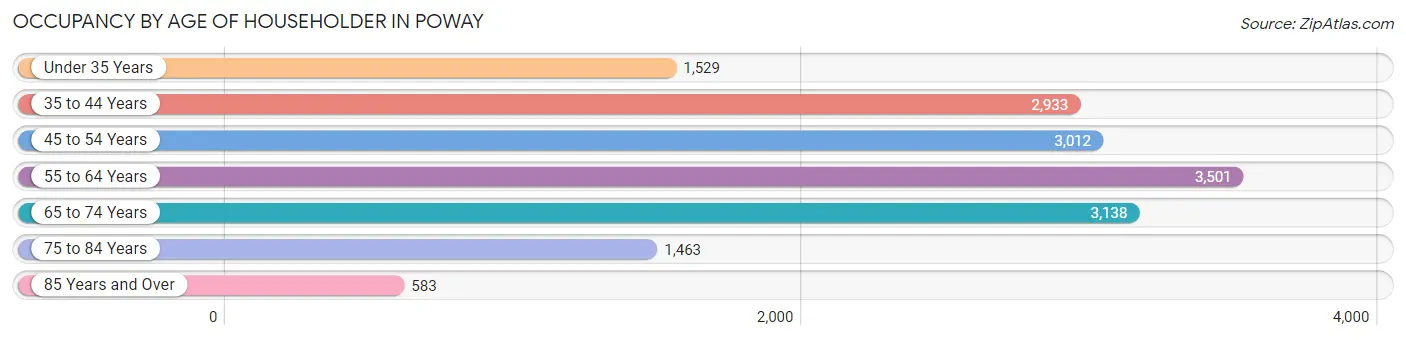
| Age Bracket | # Households | % Households |
| Under 35 Years | 1,529 | 9.5% |
| 35 to 44 Years | 2,933 | 18.1% |
| 45 to 54 Years | 3,012 | 18.6% |
| 55 to 64 Years | 3,501 | 21.7% |
| 65 to 74 Years | 3,138 | 19.4% |
| 75 to 84 Years | 1,463 | 9.0% |
| 85 Years and Over | 583 | 3.6% |
| Total | 16,159 | 100.0% |
Housing Finances in Poway
Median Income by Occupancy in Poway
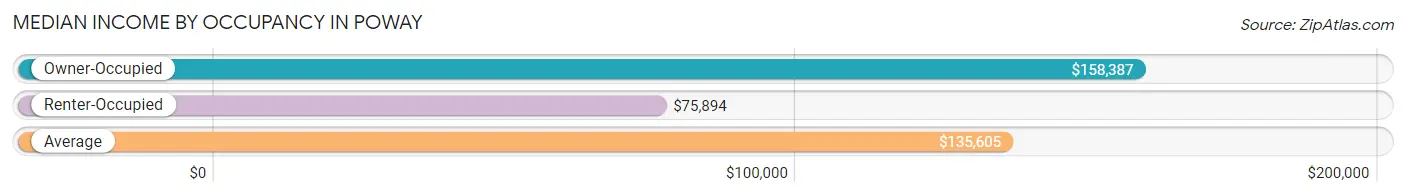
| Occupancy Type | # Households | Median Income |
| Owner-Occupied | 12,186 (75.4%) | $158,387 |
| Renter-Occupied | 3,973 (24.6%) | $75,894 |
| Average | 16,159 (100.0%) | $135,605 |
Occupancy by Householder Income Bracket in Poway
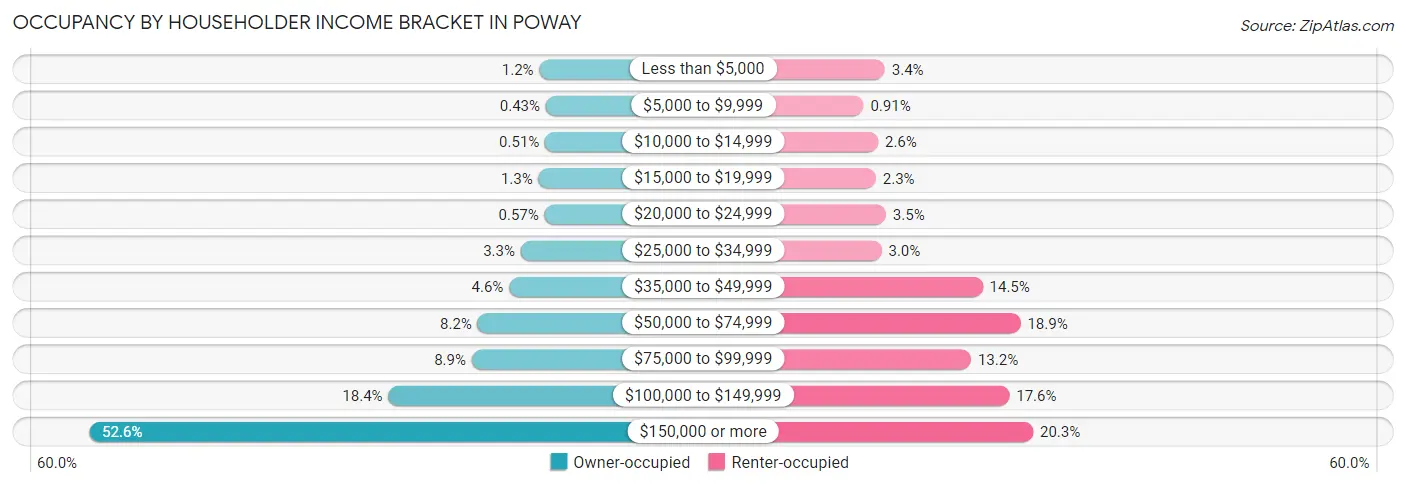
| Income Bracket | Owner-occupied | Renter-occupied |
| Less than $5,000 | 141 (1.2%) | 133 (3.4%) |
| $5,000 to $9,999 | 52 (0.4%) | 36 (0.9%) |
| $10,000 to $14,999 | 62 (0.5%) | 102 (2.6%) |
| $15,000 to $19,999 | 153 (1.3%) | 92 (2.3%) |
| $20,000 to $24,999 | 70 (0.6%) | 138 (3.5%) |
| $25,000 to $34,999 | 401 (3.3%) | 118 (3.0%) |
| $35,000 to $49,999 | 563 (4.6%) | 577 (14.5%) |
| $50,000 to $74,999 | 1,002 (8.2%) | 749 (18.9%) |
| $75,000 to $99,999 | 1,083 (8.9%) | 524 (13.2%) |
| $100,000 to $149,999 | 2,245 (18.4%) | 698 (17.6%) |
| $150,000 or more | 6,414 (52.6%) | 806 (20.3%) |
| Total | 12,186 (100.0%) | 3,973 (100.0%) |
Monthly Housing Cost Tiers in Poway
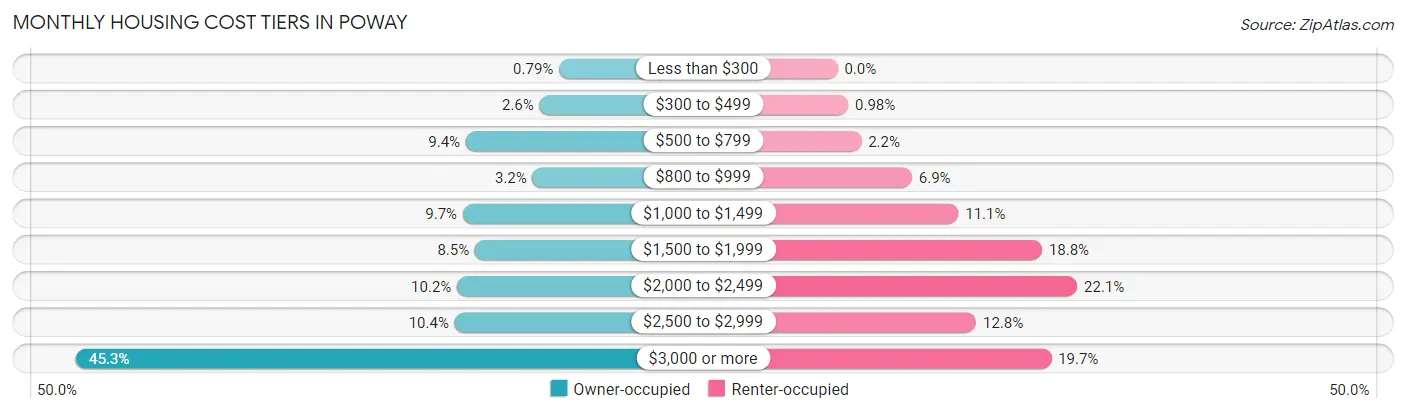
| Monthly Cost | Owner-occupied | Renter-occupied |
| Less than $300 | 96 (0.8%) | 0 (0.0%) |
| $300 to $499 | 316 (2.6%) | 39 (1.0%) |
| $500 to $799 | 1,142 (9.4%) | 87 (2.2%) |
| $800 to $999 | 394 (3.2%) | 272 (6.9%) |
| $1,000 to $1,499 | 1,176 (9.7%) | 442 (11.1%) |
| $1,500 to $1,999 | 1,040 (8.5%) | 748 (18.8%) |
| $2,000 to $2,499 | 1,240 (10.2%) | 877 (22.1%) |
| $2,500 to $2,999 | 1,267 (10.4%) | 507 (12.8%) |
| $3,000 or more | 5,515 (45.3%) | 782 (19.7%) |
| Total | 12,186 (100.0%) | 3,973 (100.0%) |
Physical Housing Characteristics in Poway
Housing Structures in Poway
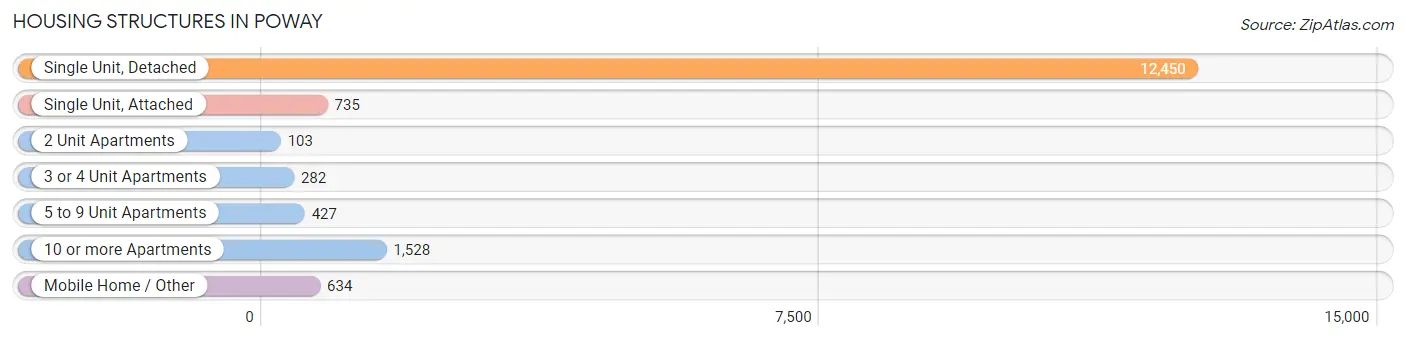
| Structure Type | # Housing Units | % Housing Units |
| Single Unit, Detached | 12,450 | 77.0% |
| Single Unit, Attached | 735 | 4.5% |
| 2 Unit Apartments | 103 | 0.6% |
| 3 or 4 Unit Apartments | 282 | 1.8% |
| 5 to 9 Unit Apartments | 427 | 2.6% |
| 10 or more Apartments | 1,528 | 9.5% |
| Mobile Home / Other | 634 | 3.9% |
| Total | 16,159 | 100.0% |
Housing Structures by Occupancy in Poway
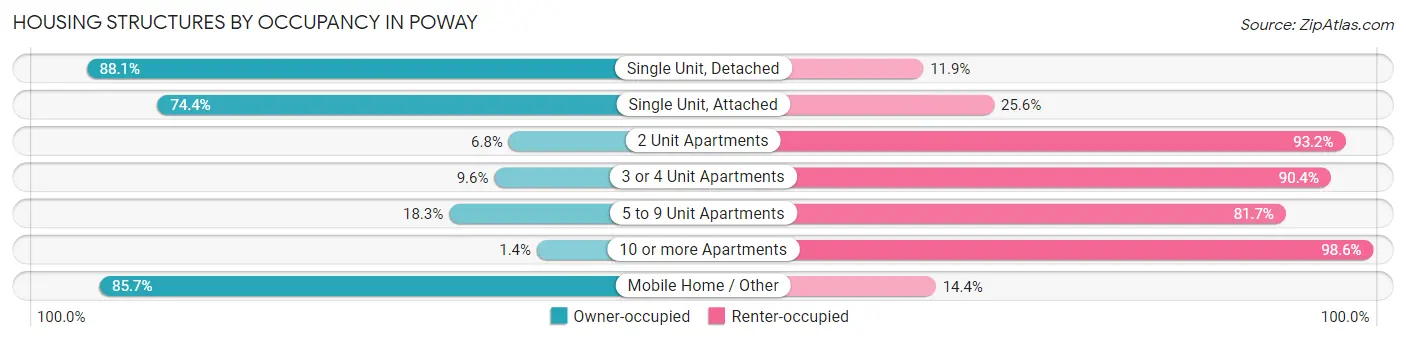
| Structure Type | Owner-occupied | Renter-occupied |
| Single Unit, Detached | 10,963 (88.1%) | 1,487 (11.9%) |
| Single Unit, Attached | 547 (74.4%) | 188 (25.6%) |
| 2 Unit Apartments | 7 (6.8%) | 96 (93.2%) |
| 3 or 4 Unit Apartments | 27 (9.6%) | 255 (90.4%) |
| 5 to 9 Unit Apartments | 78 (18.3%) | 349 (81.7%) |
| 10 or more Apartments | 21 (1.4%) | 1,507 (98.6%) |
| Mobile Home / Other | 543 (85.7%) | 91 (14.3%) |
| Total | 12,186 (75.4%) | 3,973 (24.6%) |
Housing Structures by Number of Rooms in Poway
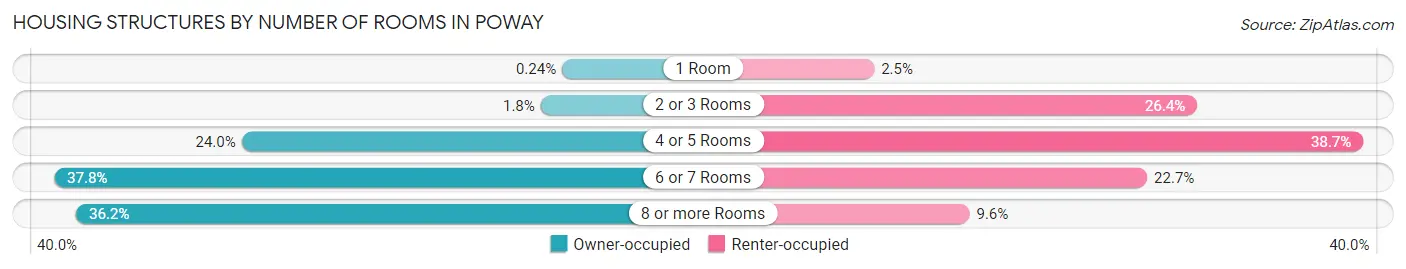
| Number of Rooms | Owner-occupied | Renter-occupied |
| 1 Room | 29 (0.2%) | 101 (2.5%) |
| 2 or 3 Rooms | 222 (1.8%) | 1,050 (26.4%) |
| 4 or 5 Rooms | 2,918 (23.9%) | 1,538 (38.7%) |
| 6 or 7 Rooms | 4,607 (37.8%) | 903 (22.7%) |
| 8 or more Rooms | 4,410 (36.2%) | 381 (9.6%) |
| Total | 12,186 (100.0%) | 3,973 (100.0%) |
Housing Structure by Heating Type in Poway
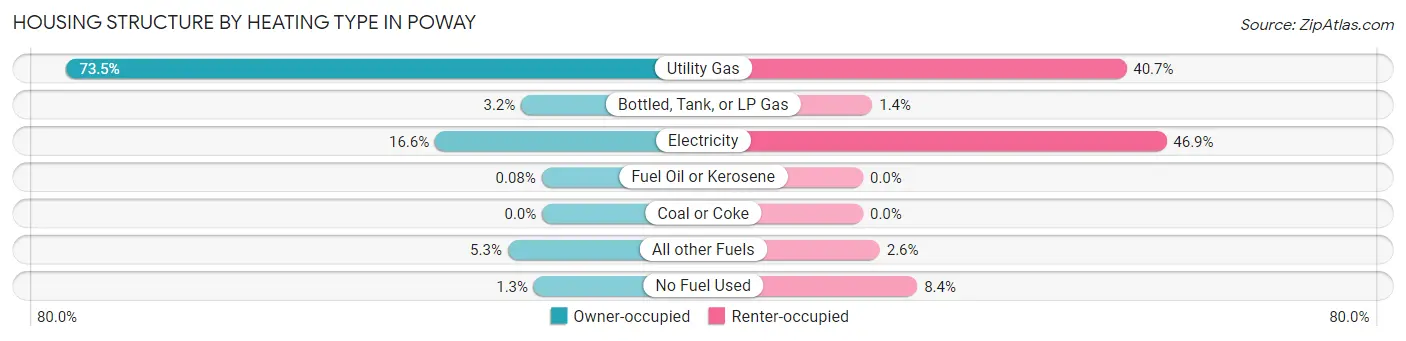
| Heating Type | Owner-occupied | Renter-occupied |
| Utility Gas | 8,962 (73.5%) | 1,617 (40.7%) |
| Bottled, Tank, or LP Gas | 395 (3.2%) | 57 (1.4%) |
| Electricity | 2,017 (16.6%) | 1,863 (46.9%) |
| Fuel Oil or Kerosene | 10 (0.1%) | 0 (0.0%) |
| Coal or Coke | 0 (0.0%) | 0 (0.0%) |
| All other Fuels | 647 (5.3%) | 103 (2.6%) |
| No Fuel Used | 155 (1.3%) | 333 (8.4%) |
| Total | 12,186 (100.0%) | 3,973 (100.0%) |
Household Vehicle Usage in Poway
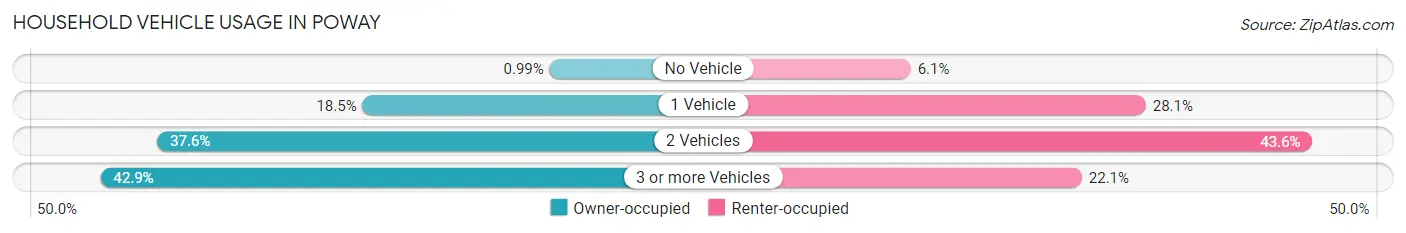
| Vehicles per Household | Owner-occupied | Renter-occupied |
| No Vehicle | 121 (1.0%) | 244 (6.1%) |
| 1 Vehicle | 2,250 (18.5%) | 1,116 (28.1%) |
| 2 Vehicles | 4,585 (37.6%) | 1,734 (43.6%) |
| 3 or more Vehicles | 5,230 (42.9%) | 879 (22.1%) |
| Total | 12,186 (100.0%) | 3,973 (100.0%) |
Real Estate & Mortgages in Poway
Real Estate and Mortgage Overview in Poway
| Characteristic | Without Mortgage | With Mortgage |
| Housing Units | 3,311 | 8,875 |
| Median Property Value | $875,200 | $922,900 |
| Median Household Income | $106,125 | $5,296 |
| Monthly Housing Costs | $903 | $5,384 |
| Real Estate Taxes | $4,774 | $147 |
Property Value by Mortgage Status in Poway
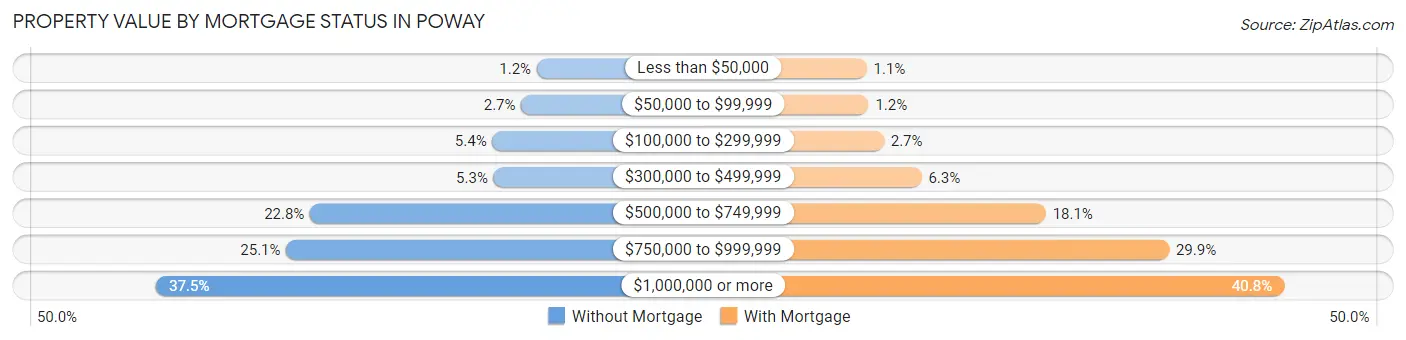
| Property Value | Without Mortgage | With Mortgage |
| Less than $50,000 | 40 (1.2%) | 93 (1.1%) |
| $50,000 to $99,999 | 89 (2.7%) | 109 (1.2%) |
| $100,000 to $299,999 | 180 (5.4%) | 239 (2.7%) |
| $300,000 to $499,999 | 176 (5.3%) | 557 (6.3%) |
| $500,000 to $749,999 | 755 (22.8%) | 1,607 (18.1%) |
| $750,000 to $999,999 | 830 (25.1%) | 2,649 (29.8%) |
| $1,000,000 or more | 1,241 (37.5%) | 3,621 (40.8%) |
| Total | 3,311 (100.0%) | 8,875 (100.0%) |
Household Income by Mortgage Status in Poway
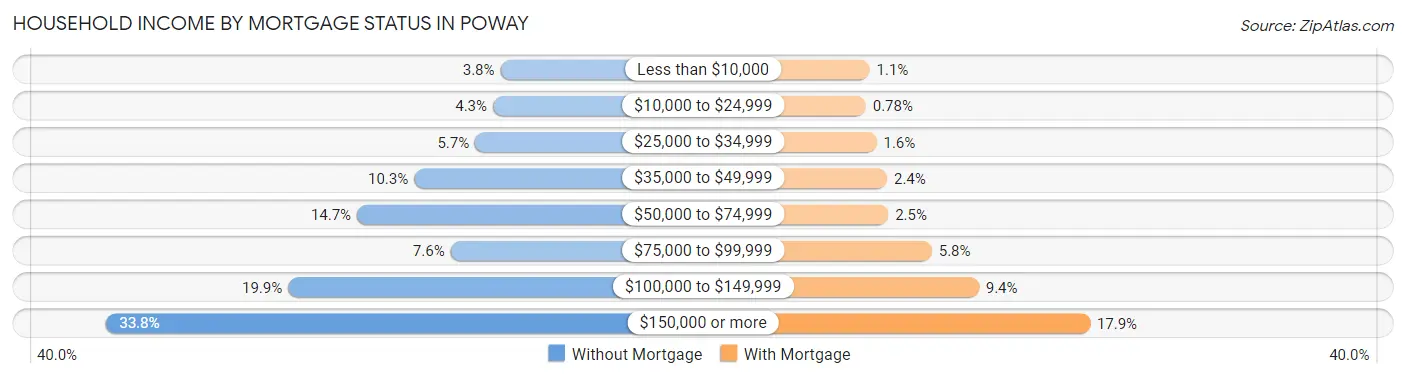
| Household Income | Without Mortgage | With Mortgage |
| Less than $10,000 | 124 (3.7%) | 95 (1.1%) |
| $10,000 to $24,999 | 143 (4.3%) | 69 (0.8%) |
| $25,000 to $34,999 | 188 (5.7%) | 142 (1.6%) |
| $35,000 to $49,999 | 342 (10.3%) | 213 (2.4%) |
| $50,000 to $74,999 | 486 (14.7%) | 221 (2.5%) |
| $75,000 to $99,999 | 250 (7.5%) | 516 (5.8%) |
| $100,000 to $149,999 | 660 (19.9%) | 833 (9.4%) |
| $150,000 or more | 1,118 (33.8%) | 1,585 (17.9%) |
| Total | 3,311 (100.0%) | 8,875 (100.0%) |
Property Value to Household Income Ratio in Poway
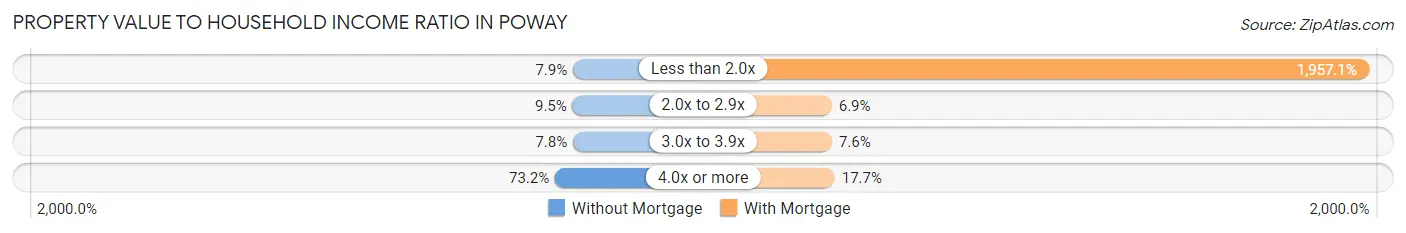
| Value-to-Income Ratio | Without Mortgage | With Mortgage |
| Less than 2.0x | 260 (7.9%) | 173,695 (1,957.1%) |
| 2.0x to 2.9x | 313 (9.5%) | 610 (6.9%) |
| 3.0x to 3.9x | 257 (7.8%) | 670 (7.5%) |
| 4.0x or more | 2,423 (73.2%) | 1,571 (17.7%) |
| Total | 3,311 (100.0%) | 8,875 (100.0%) |
Real Estate Taxes by Mortgage Status in Poway
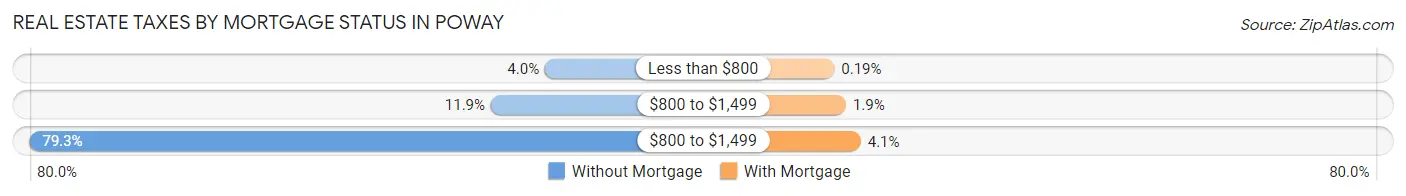
| Property Taxes | Without Mortgage | With Mortgage |
| Less than $800 | 131 (4.0%) | 17 (0.2%) |
| $800 to $1,499 | 393 (11.9%) | 168 (1.9%) |
| $800 to $1,499 | 2,626 (79.3%) | 359 (4.1%) |
| Total | 3,311 (100.0%) | 8,875 (100.0%) |
Health & Disability in Poway
Health Insurance Coverage by Age in Poway
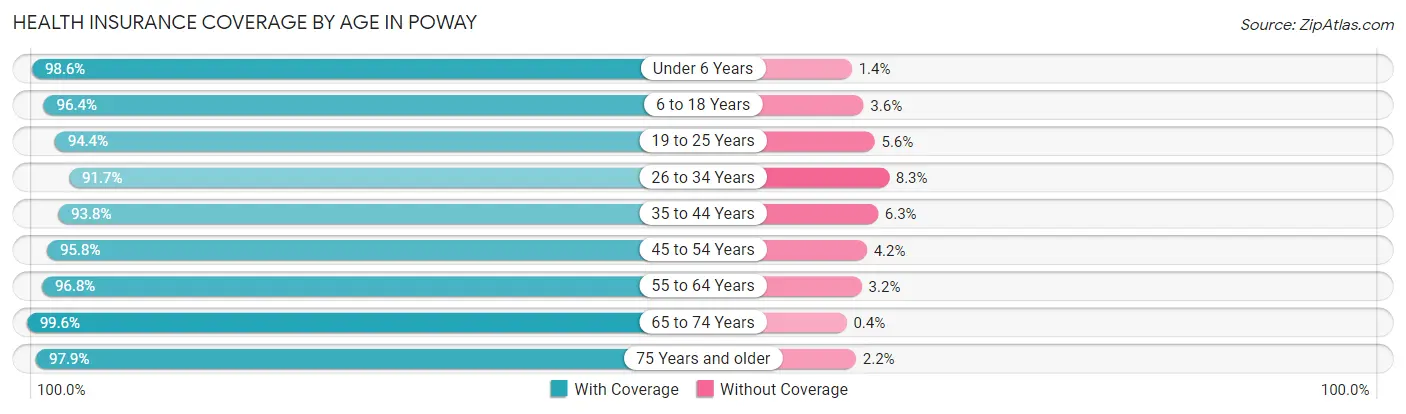
| Age Bracket | With Coverage | Without Coverage |
| Under 6 Years | 3,425 (98.6%) | 48 (1.4%) |
| 6 to 18 Years | 7,856 (96.4%) | 290 (3.6%) |
| 19 to 25 Years | 2,725 (94.4%) | 163 (5.6%) |
| 26 to 34 Years | 4,876 (91.7%) | 441 (8.3%) |
| 35 to 44 Years | 5,951 (93.8%) | 397 (6.2%) |
| 45 to 54 Years | 5,850 (95.8%) | 255 (4.2%) |
| 55 to 64 Years | 6,534 (96.8%) | 219 (3.2%) |
| 65 to 74 Years | 5,446 (99.6%) | 22 (0.4%) |
| 75 Years and older | 3,557 (97.9%) | 78 (2.1%) |
| Total | 46,220 (96.0%) | 1,913 (4.0%) |
Health Insurance Coverage by Citizenship Status in Poway
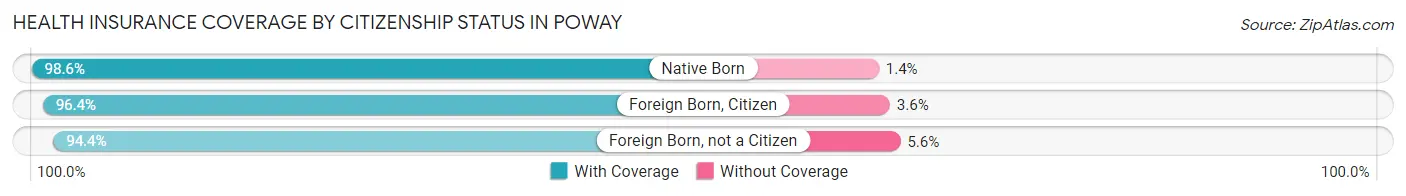
| Citizenship Status | With Coverage | Without Coverage |
| Native Born | 3,425 (98.6%) | 48 (1.4%) |
| Foreign Born, Citizen | 7,856 (96.4%) | 290 (3.6%) |
| Foreign Born, not a Citizen | 2,725 (94.4%) | 163 (5.6%) |
Health Insurance Coverage by Household Income in Poway
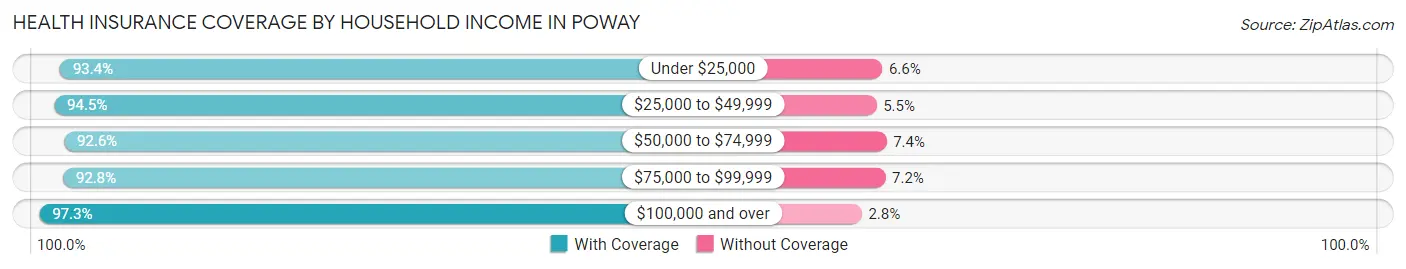
| Household Income | With Coverage | Without Coverage |
| Under $25,000 | 1,601 (93.4%) | 113 (6.6%) |
| $25,000 to $49,999 | 4,078 (94.5%) | 238 (5.5%) |
| $50,000 to $74,999 | 3,977 (92.6%) | 317 (7.4%) |
| $75,000 to $99,999 | 4,244 (92.8%) | 328 (7.2%) |
| $100,000 and over | 32,024 (97.3%) | 906 (2.8%) |
Public vs Private Health Insurance Coverage by Age in Poway
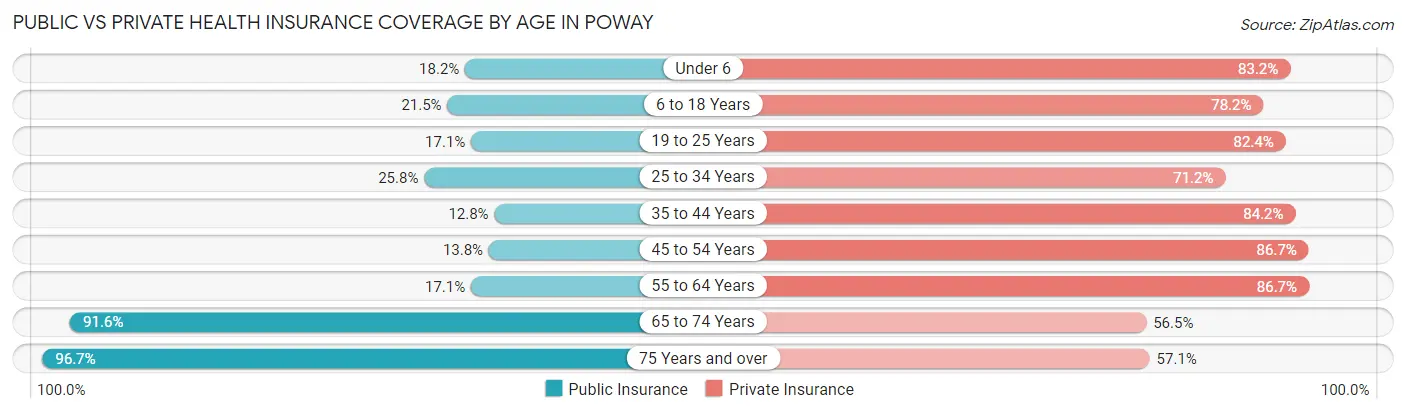
| Age Bracket | Public Insurance | Private Insurance |
| Under 6 | 633 (18.2%) | 2,890 (83.2%) |
| 6 to 18 Years | 1,752 (21.5%) | 6,373 (78.2%) |
| 19 to 25 Years | 494 (17.1%) | 2,379 (82.4%) |
| 25 to 34 Years | 1,373 (25.8%) | 3,784 (71.2%) |
| 35 to 44 Years | 812 (12.8%) | 5,344 (84.2%) |
| 45 to 54 Years | 843 (13.8%) | 5,290 (86.7%) |
| 55 to 64 Years | 1,157 (17.1%) | 5,854 (86.7%) |
| 65 to 74 Years | 5,006 (91.5%) | 3,090 (56.5%) |
| 75 Years and over | 3,515 (96.7%) | 2,077 (57.1%) |
| Total | 15,585 (32.4%) | 37,081 (77.0%) |
Disability Status by Sex by Age in Poway
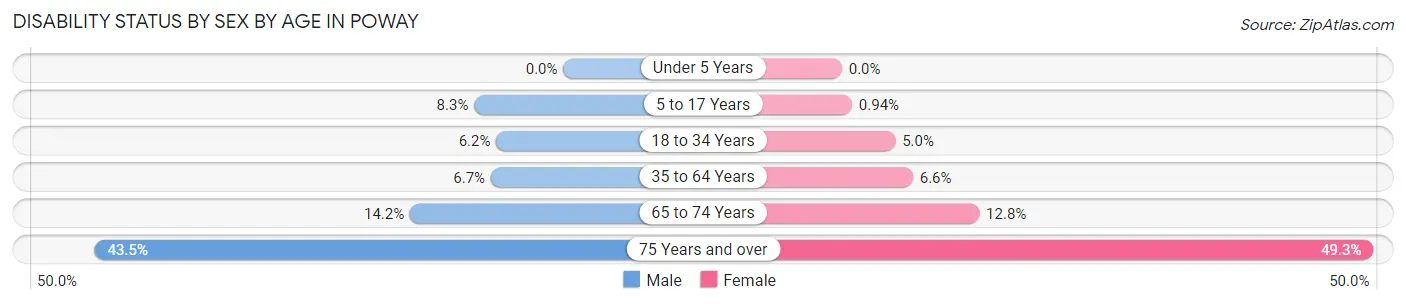
| Age Bracket | Male | Female |
| Under 5 Years | 0 (0.0%) | 0 (0.0%) |
| 5 to 17 Years | 338 (8.3%) | 37 (0.9%) |
| 18 to 34 Years | 303 (6.2%) | 205 (5.0%) |
| 35 to 64 Years | 659 (6.7%) | 619 (6.6%) |
| 65 to 74 Years | 374 (14.2%) | 362 (12.8%) |
| 75 Years and over | 687 (43.5%) | 1,014 (49.3%) |
Disability Class by Sex by Age in Poway
Disability Class: Hearing Difficulty
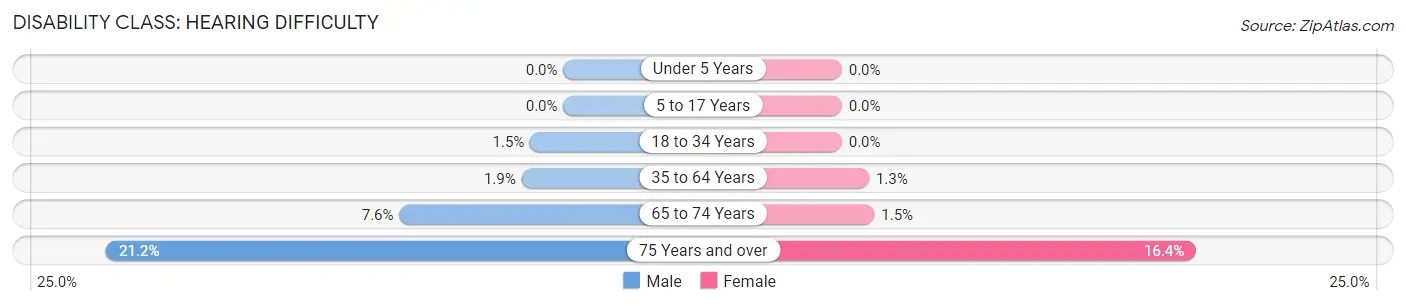
| Age Bracket | Male | Female |
| Under 5 Years | 0 (0.0%) | 0 (0.0%) |
| 5 to 17 Years | 0 (0.0%) | 0 (0.0%) |
| 18 to 34 Years | 75 (1.5%) | 0 (0.0%) |
| 35 to 64 Years | 190 (1.9%) | 118 (1.3%) |
| 65 to 74 Years | 200 (7.6%) | 43 (1.5%) |
| 75 Years and over | 335 (21.2%) | 338 (16.4%) |
Disability Class: Vision Difficulty
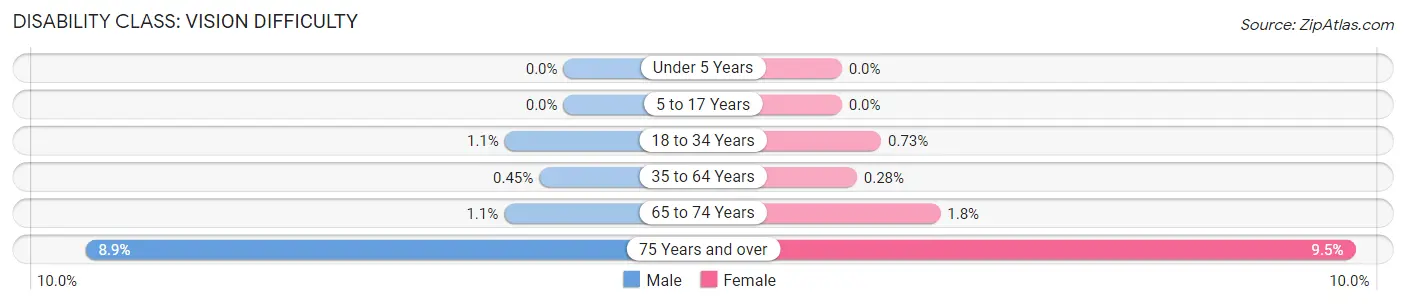
| Age Bracket | Male | Female |
| Under 5 Years | 0 (0.0%) | 0 (0.0%) |
| 5 to 17 Years | 0 (0.0%) | 0 (0.0%) |
| 18 to 34 Years | 53 (1.1%) | 30 (0.7%) |
| 35 to 64 Years | 44 (0.4%) | 26 (0.3%) |
| 65 to 74 Years | 29 (1.1%) | 52 (1.8%) |
| 75 Years and over | 140 (8.9%) | 196 (9.5%) |
Disability Class: Cognitive Difficulty
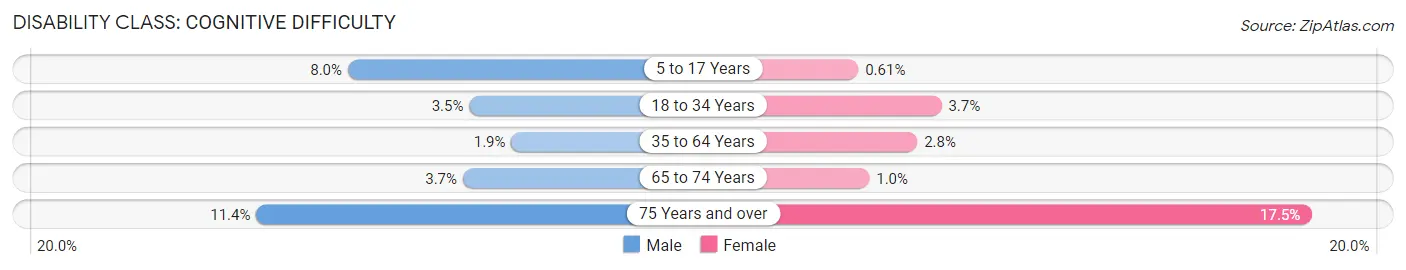
| Age Bracket | Male | Female |
| 5 to 17 Years | 327 (8.0%) | 24 (0.6%) |
| 18 to 34 Years | 170 (3.5%) | 153 (3.7%) |
| 35 to 64 Years | 189 (1.9%) | 263 (2.8%) |
| 65 to 74 Years | 98 (3.7%) | 29 (1.0%) |
| 75 Years and over | 180 (11.4%) | 359 (17.5%) |
Disability Class: Ambulatory Difficulty
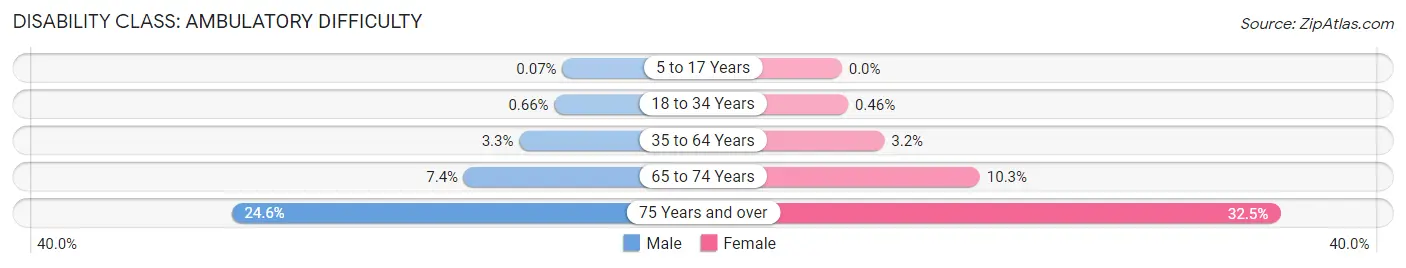
| Age Bracket | Male | Female |
| 5 to 17 Years | 3 (0.1%) | 0 (0.0%) |
| 18 to 34 Years | 32 (0.7%) | 19 (0.5%) |
| 35 to 64 Years | 321 (3.3%) | 297 (3.2%) |
| 65 to 74 Years | 194 (7.4%) | 291 (10.2%) |
| 75 Years and over | 389 (24.6%) | 669 (32.5%) |
Disability Class: Self-Care Difficulty
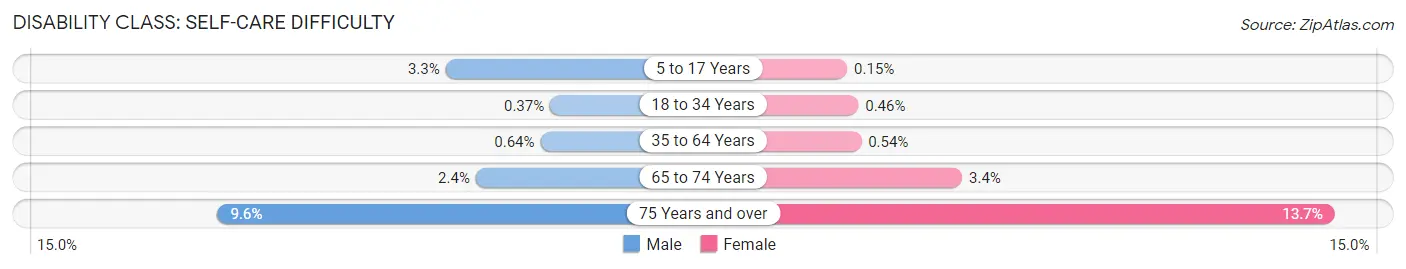
| Age Bracket | Male | Female |
| 5 to 17 Years | 134 (3.3%) | 6 (0.2%) |
| 18 to 34 Years | 18 (0.4%) | 19 (0.5%) |
| 35 to 64 Years | 63 (0.6%) | 51 (0.5%) |
| 65 to 74 Years | 64 (2.4%) | 95 (3.4%) |
| 75 Years and over | 152 (9.6%) | 282 (13.7%) |
Technology Access in Poway
Computing Device Access in Poway
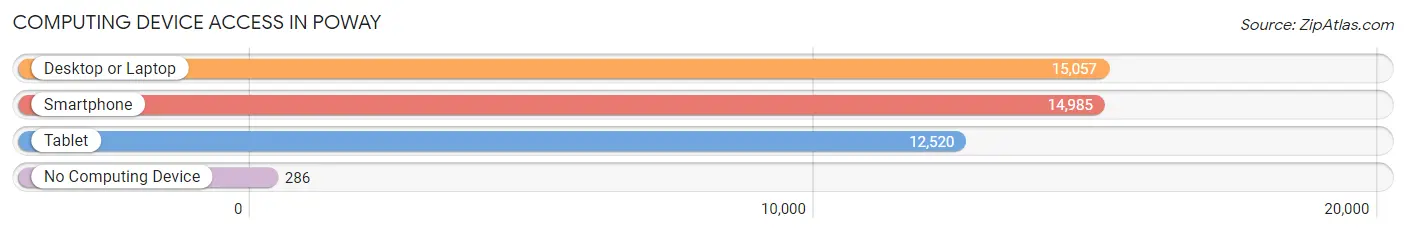
| Device Type | # Households | % Households |
| Desktop or Laptop | 15,057 | 93.2% |
| Smartphone | 14,985 | 92.7% |
| Tablet | 12,520 | 77.5% |
| No Computing Device | 286 | 1.8% |
| Total | 16,159 | 100.0% |
Internet Access in Poway
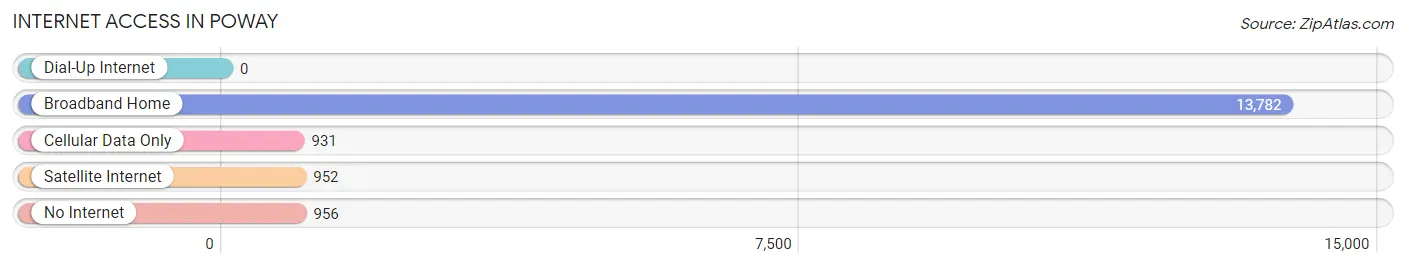
| Internet Type | # Households | % Households |
| Dial-Up Internet | 0 | 0.0% |
| Broadband Home | 13,782 | 85.3% |
| Cellular Data Only | 931 | 5.8% |
| Satellite Internet | 952 | 5.9% |
| No Internet | 956 | 5.9% |
| Total | 16,159 | 100.0% |
Poway Summary
Poway is a city located in San Diego County, California, United States. It is located about 20 miles (32 km) north of downtown San Diego and is part of the San Diego metropolitan area. The city is situated in the foothills of the Santa Rosa Mountains, and is surrounded by the communities of Rancho Bernardo, Scripps Ranch, Rancho Peñasquitos, and 4S Ranch.
History
The area now known as Poway was originally inhabited by the Kumeyaay people. The first European settlers arrived in the area in the late 1700s, and the area was officially established as a township in 1887. The area was originally known as “Paguay”, which is derived from the Kumeyaay word for “the meeting place”.
The area was primarily used for cattle ranching and farming until the 1950s, when the population began to grow rapidly due to the influx of people from the Los Angeles area. The city was officially incorporated in December 1980, and the population has continued to grow since then.
Geography
Poway is located in San Diego County, California, and is situated in the foothills of the Santa Rosa Mountains. The city covers an area of approximately 39 square miles (101 km2), and has an elevation of 1,200 feet (366 m). The city is bordered by the communities of Rancho Bernardo, Scripps Ranch, Rancho Peñasquitos, and 4S Ranch.
The city is located about 20 miles (32 km) north of downtown San Diego, and is part of the San Diego metropolitan area. The climate in Poway is generally mild, with temperatures ranging from the mid-50s to the mid-80s throughout the year.
Economy
Poway’s economy is primarily driven by the service sector, with the largest employers in the city being the Poway Unified School District, the City of Poway, and the County of San Diego. Other major employers in the city include the Poway Business Park, the Poway Center for the Performing Arts, and the Poway Library.
The city also has a thriving retail sector, with several shopping centers and retail outlets located throughout the city. The city is also home to several technology companies, including Qualcomm, Sony, and Hewlett-Packard.
Demographics
As of the 2010 census, the population of Poway was 47,811. The racial makeup of the city was 75.3% White, 11.2% Asian, 8.2% Hispanic or Latino, and 5.3% African American. The median household income in the city was $97,845, and the median age was 42.
Poway is a relatively affluent city, with a median household income that is significantly higher than the national average. The city is also home to a large number of families, with nearly half of all households having children under the age of 18. The city is also home to a large number of retirees, with nearly one-third of all households having at least one person over the age of 65.
Common Questions
What is Per Capita Income in Poway?
Per Capita income in Poway is $58,325.
What is the Median Family Income in Poway?
Median Family Income in Poway is $146,534.
What is the Median Household income in Poway?
Median Household Income in Poway is $135,605.
What is Income or Wage Gap in Poway?
Income or Wage Gap in Poway is 37.2%.
Women in Poway earn 62.8 cents for every dollar earned by a man.
What is Family Income Deficit in Poway?
Family Income Deficit in Poway is $12,356.
Families that are below poverty line in Poway earn $12,356 less on average than the poverty threshold level.
What is Inequality or Gini Index in Poway?
Inequality or Gini Index in Poway is 0.43.
What is the Total Population of Poway?
Total Population of Poway is 48,737.
What is the Total Male Population of Poway?
Total Male Population of Poway is 24,931.
What is the Total Female Population of Poway?
Total Female Population of Poway is 23,806.
What is the Ratio of Males per 100 Females in Poway?
There are 104.73 Males per 100 Females in Poway.
What is the Ratio of Females per 100 Males in Poway?
There are 95.49 Females per 100 Males in Poway.
What is the Median Population Age in Poway?
Median Population Age in Poway is 41.7 Years.
What is the Average Family Size in Poway
Average Family Size in Poway is 3.2 People.
What is the Average Household Size in Poway
Average Household Size in Poway is 3.0 People.
How Large is the Labor Force in Poway?
There are 24,667 People in the Labor Forcein in Poway.
What is the Percentage of People in the Labor Force in Poway?
63.3% of People are in the Labor Force in Poway.
What is the Unemployment Rate in Poway?
Unemployment Rate in Poway is 5.9%.