Portola, CA Map & Demographics
Portola Map
Portola Overview
$29,739
PER CAPITA INCOME
$71,146
AVG FAMILY INCOME
$52,500
AVG HOUSEHOLD INCOME
62.0%
WAGE / INCOME GAP [ % ]
38.0¢/ $1
WAGE / INCOME GAP [ $ ]
0.50
INEQUALITY / GINI INDEX
2,427
TOTAL POPULATION
1,078
MALE POPULATION
1,349
FEMALE POPULATION
79.91
MALES / 100 FEMALES
125.14
FEMALES / 100 MALES
39.6
MEDIAN AGE
3.0
AVG FAMILY SIZE
2.3
AVG HOUSEHOLD SIZE
1,095
LABOR FORCE [ PEOPLE ]
58.1%
PERCENT IN LABOR FORCE
7.0%
UNEMPLOYMENT RATE
Portola Zip Codes
Portola Area Codes
Income in Portola
Income Overview in Portola
Per Capita Income in Portola is $29,739, while median incomes of families and households are $71,146 and $52,500 respectively.
| Characteristic | Number | Measure |
| Per Capita Income | 2,427 | $29,739 |
| Median Family Income | 605 | $71,146 |
| Mean Family Income | 605 | $96,248 |
| Median Household Income | 1,044 | $52,500 |
| Mean Household Income | 1,044 | $73,922 |
| Income Deficit | 605 | $0 |
| Wage / Income Gap (%) | 2,427 | 62.02% |
| Wage / Income Gap ($) | 2,427 | 37.98¢ per $1 |
| Gini / Inequality Index | 2,427 | 0.50 |
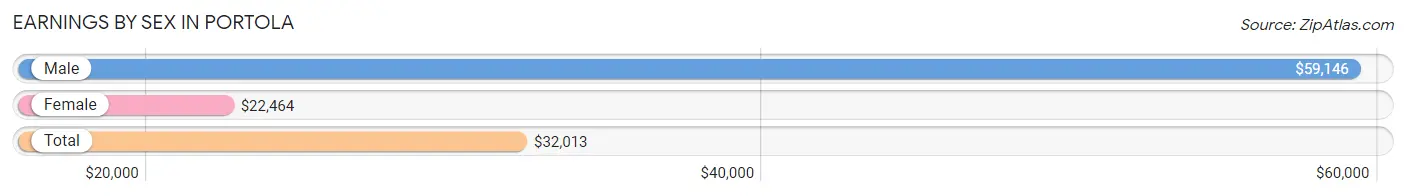
Earnings by Sex in Portola
Average Earnings in Portola are $32,013, $59,146 for men and $22,464 for women, a difference of 62.0%.
| Sex | Number | Average Earnings |
| Male | 470 (41.0%) | $59,146 |
| Female | 675 (59.0%) | $22,464 |
| Total | 1,145 (100.0%) | $32,013 |
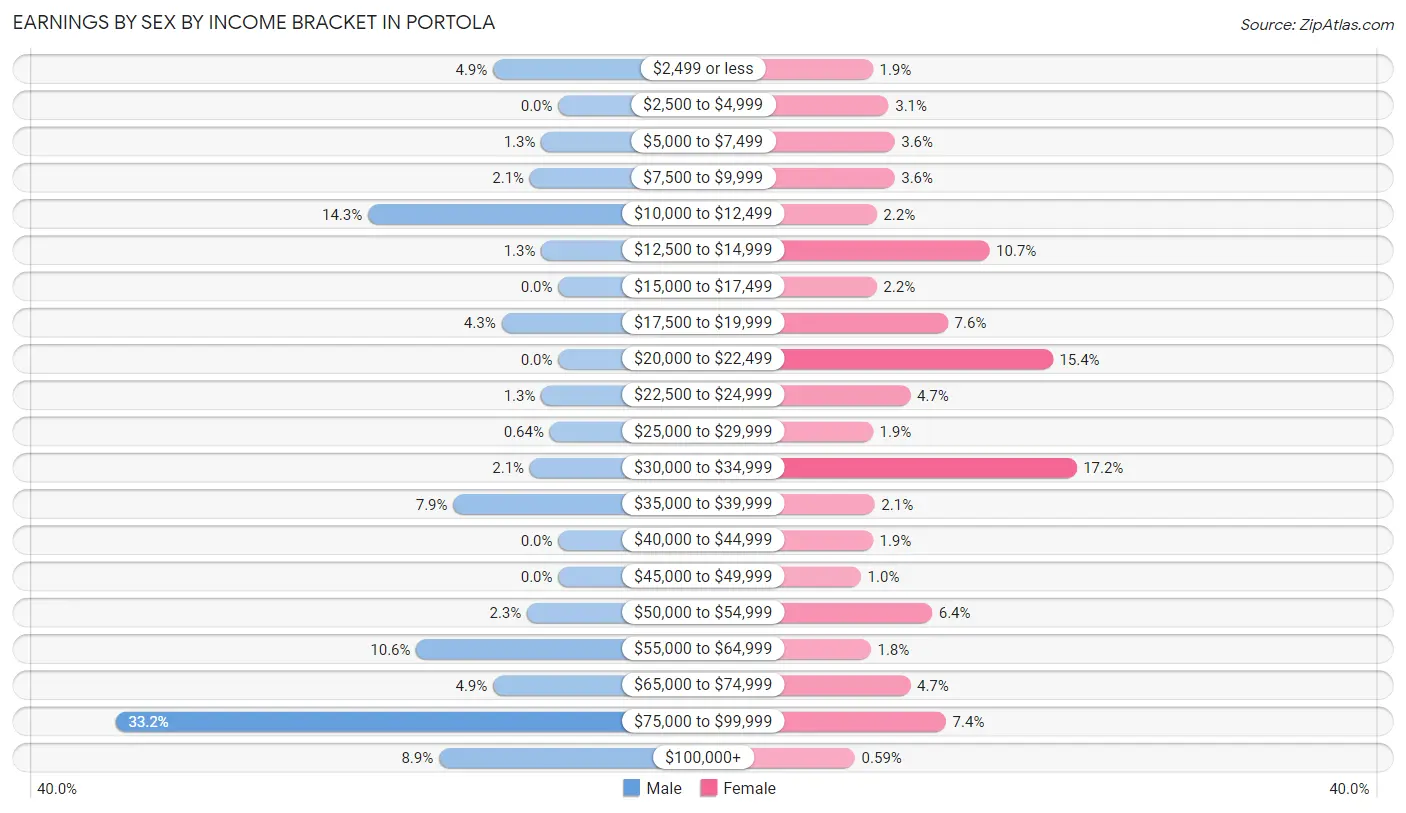
Earnings by Sex by Income Bracket in Portola
The most common earnings brackets in Portola are $75,000 to $99,999 for men (156 | 33.2%) and $30,000 to $34,999 for women (116 | 17.2%).
| Income | Male | Female |
| $2,499 or less | 23 (4.9%) | 13 (1.9%) |
| $2,500 to $4,999 | 0 (0.0%) | 21 (3.1%) |
| $5,000 to $7,499 | 6 (1.3%) | 24 (3.6%) |
| $7,500 to $9,999 | 10 (2.1%) | 24 (3.6%) |
| $10,000 to $12,499 | 67 (14.3%) | 15 (2.2%) |
| $12,500 to $14,999 | 6 (1.3%) | 72 (10.7%) |
| $15,000 to $17,499 | 0 (0.0%) | 15 (2.2%) |
| $17,500 to $19,999 | 20 (4.3%) | 51 (7.6%) |
| $20,000 to $22,499 | 0 (0.0%) | 104 (15.4%) |
| $22,500 to $24,999 | 6 (1.3%) | 32 (4.7%) |
| $25,000 to $29,999 | 3 (0.6%) | 13 (1.9%) |
| $30,000 to $34,999 | 10 (2.1%) | 116 (17.2%) |
| $35,000 to $39,999 | 37 (7.9%) | 14 (2.1%) |
| $40,000 to $44,999 | 0 (0.0%) | 13 (1.9%) |
| $45,000 to $49,999 | 0 (0.0%) | 7 (1.0%) |
| $50,000 to $54,999 | 11 (2.3%) | 43 (6.4%) |
| $55,000 to $64,999 | 50 (10.6%) | 12 (1.8%) |
| $65,000 to $74,999 | 23 (4.9%) | 32 (4.7%) |
| $75,000 to $99,999 | 156 (33.2%) | 50 (7.4%) |
| $100,000+ | 42 (8.9%) | 4 (0.6%) |
| Total | 470 (100.0%) | 675 (100.0%) |
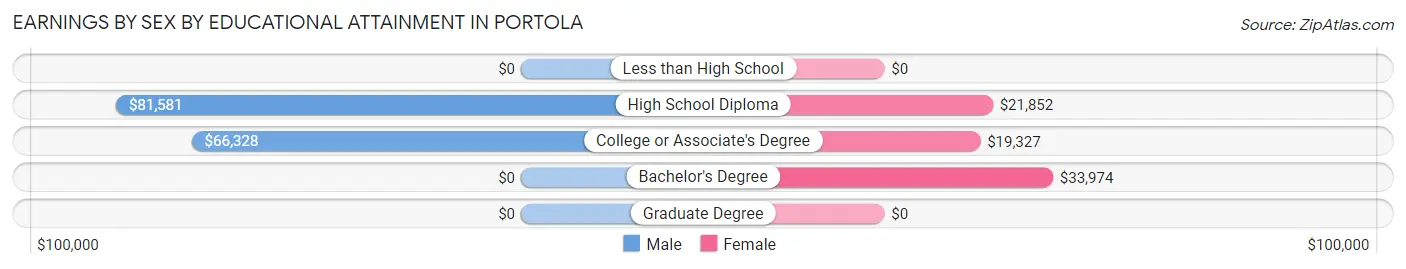
Earnings by Sex by Educational Attainment in Portola
Average earnings in Portola are $67,344 for men and $23,906 for women, a difference of 64.5%. Men with an educational attainment of high school diploma enjoy the highest average annual earnings of $81,581, while those with college or associate's degree education earn the least with $66,328. Women with an educational attainment of bachelor's degree earn the most with the average annual earnings of $33,974, while those with college or associate's degree education have the smallest earnings of $19,327.
| Educational Attainment | Male Income | Female Income |
| Less than High School | - | - |
| High School Diploma | $81,581 | $21,852 |
| College or Associate's Degree | $66,328 | $19,327 |
| Bachelor's Degree | - | - |
| Graduate Degree | - | - |
| Total | $67,344 | $23,906 |
Family Income in Portola
Family Income Brackets in Portola
According to the Portola family income data, there are 123 families falling into the $50,000 to $74,999 income range, which is the most common income bracket and makes up 20.3% of all families. Conversely, the $25,000 to $34,999 income bracket is the least frequent group with only 6 families (1.0%) belonging to this category.
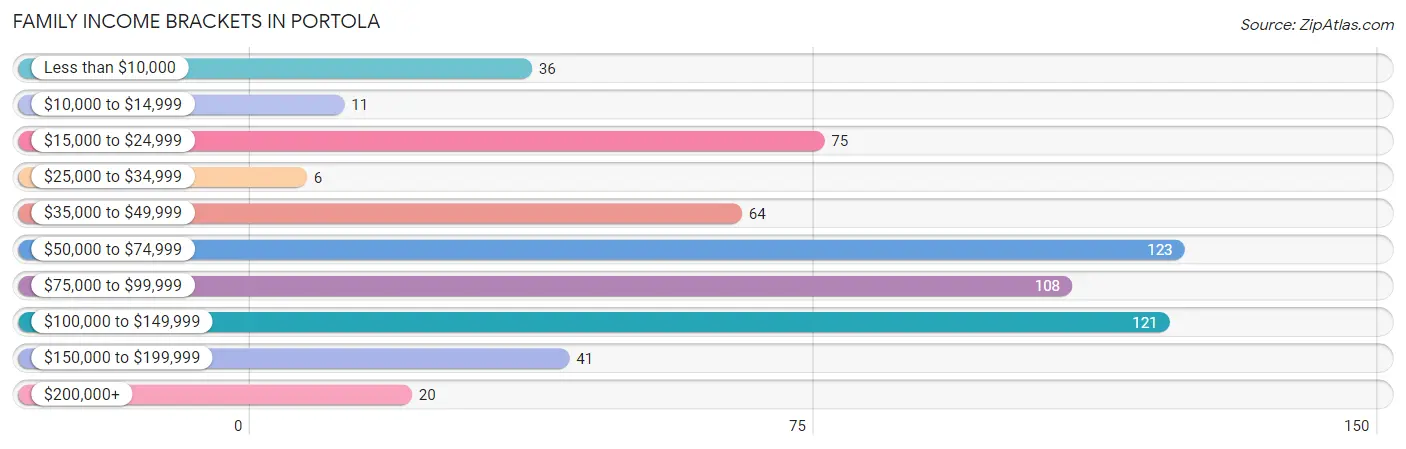
| Income Bracket | # Families | % Families |
| Less than $10,000 | 36 | 6.0% |
| $10,000 to $14,999 | 11 | 1.8% |
| $15,000 to $24,999 | 75 | 12.4% |
| $25,000 to $34,999 | 6 | 1.0% |
| $35,000 to $49,999 | 64 | 10.6% |
| $50,000 to $74,999 | 123 | 20.3% |
| $75,000 to $99,999 | 108 | 17.9% |
| $100,000 to $149,999 | 121 | 20.0% |
| $150,000 to $199,999 | 41 | 6.8% |
| $200,000+ | 20 | 3.3% |
Family Income by Famaliy Size in Portola
5-person families (49 | 8.1%) account for the highest median family income in Portola with $150,144 per family, while 2-person families (245 | 40.5%) have the highest median income of $40,199 per family member.
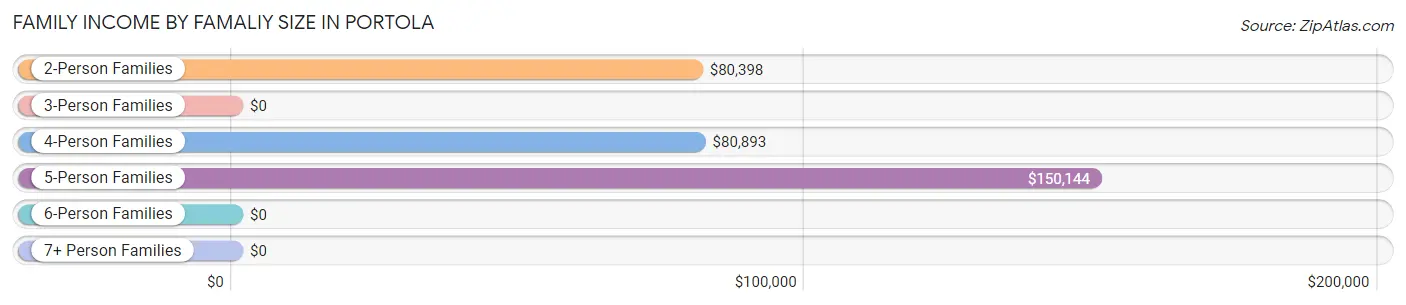
| Income Bracket | # Families | Median Income |
| 2-Person Families | 245 (40.5%) | $80,398 |
| 3-Person Families | 252 (41.6%) | $0 |
| 4-Person Families | 29 (4.8%) | $80,893 |
| 5-Person Families | 49 (8.1%) | $150,144 |
| 6-Person Families | 10 (1.7%) | $0 |
| 7+ Person Families | 20 (3.3%) | $0 |
| Total | 605 (100.0%) | $71,146 |
Family Income by Number of Earners in Portola
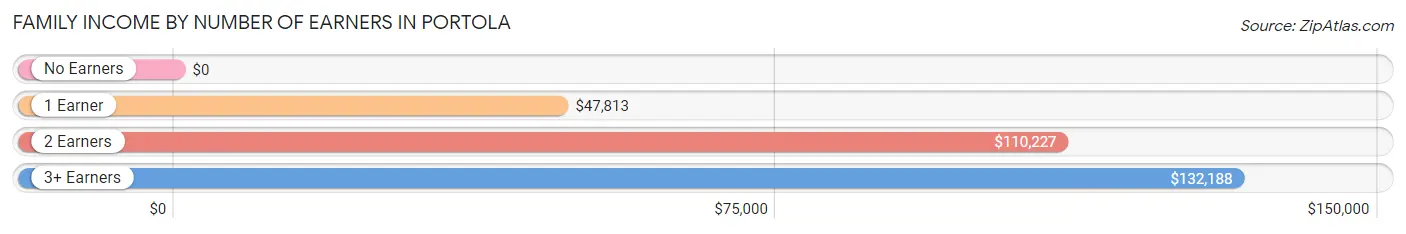
| Number of Earners | # Families | Median Income |
| No Earners | 89 (14.7%) | $0 |
| 1 Earner | 251 (41.5%) | $47,813 |
| 2 Earners | 212 (35.0%) | $110,227 |
| 3+ Earners | 53 (8.8%) | $132,188 |
| Total | 605 (100.0%) | $71,146 |
Household Income in Portola
Household Income Brackets in Portola
With 208 households falling in the category, the $15,000 to $24,999 income range is the most frequent in Portola, accounting for 19.9% of all households. In contrast, only 15 households (1.4%) fall into the $25,000 to $34,999 income bracket, making it the least populous group.
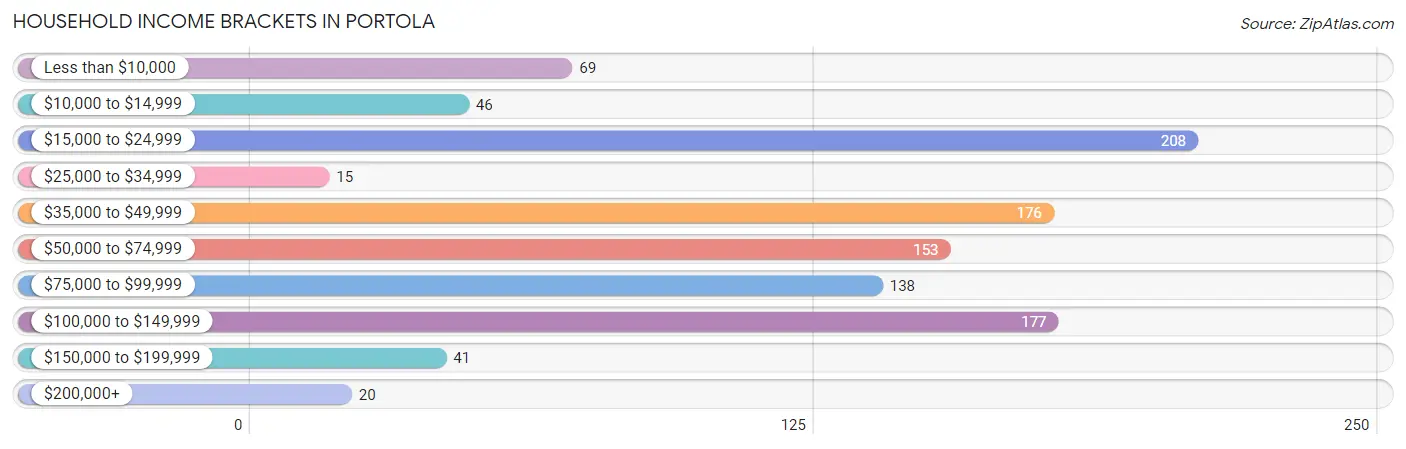
| Income Bracket | # Households | % Households |
| Less than $10,000 | 69 | 6.6% |
| $10,000 to $14,999 | 46 | 4.4% |
| $15,000 to $24,999 | 208 | 19.9% |
| $25,000 to $34,999 | 15 | 1.4% |
| $35,000 to $49,999 | 176 | 16.9% |
| $50,000 to $74,999 | 153 | 14.7% |
| $75,000 to $99,999 | 138 | 13.2% |
| $100,000 to $149,999 | 177 | 17.0% |
| $150,000 to $199,999 | 41 | 3.9% |
| $200,000+ | 20 | 1.9% |
Household Income by Householder Age in Portola
The median household income in Portola is $52,500, with the highest median household income of $80,511 found in the 45 to 64 years age bracket for the primary householder. A total of 287 households (27.5%) fall into this category. Meanwhile, the 15 to 24 years age bracket for the primary householder has the lowest median household income of $0, with 21 households (2.0%) in this group.
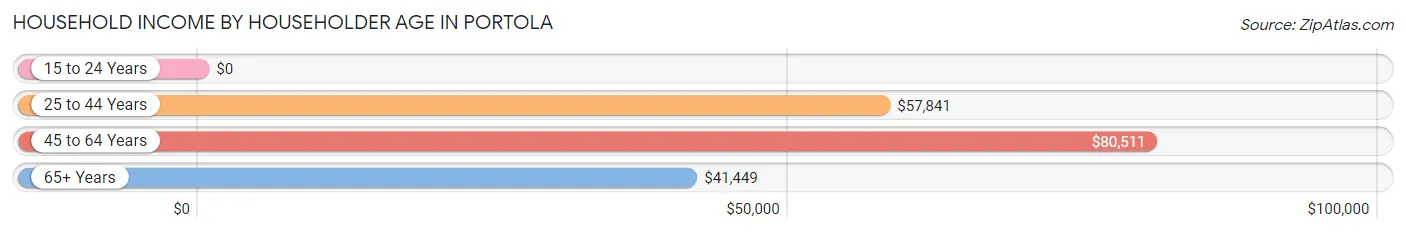
| Income Bracket | # Households | Median Income |
| 15 to 24 Years | 21 (2.0%) | $0 |
| 25 to 44 Years | 417 (39.9%) | $57,841 |
| 45 to 64 Years | 287 (27.5%) | $80,511 |
| 65+ Years | 319 (30.6%) | $41,449 |
| Total | 1,044 (100.0%) | $52,500 |
Poverty in Portola
Income Below Poverty by Sex and Age in Portola
With 13.0% poverty level for males and 27.6% for females among the residents of Portola, under 5 year old males and under 5 year old females are the most vulnerable to poverty, with 30 males (30.3%) and 77 females (60.2%) in their respective age groups living below the poverty level.
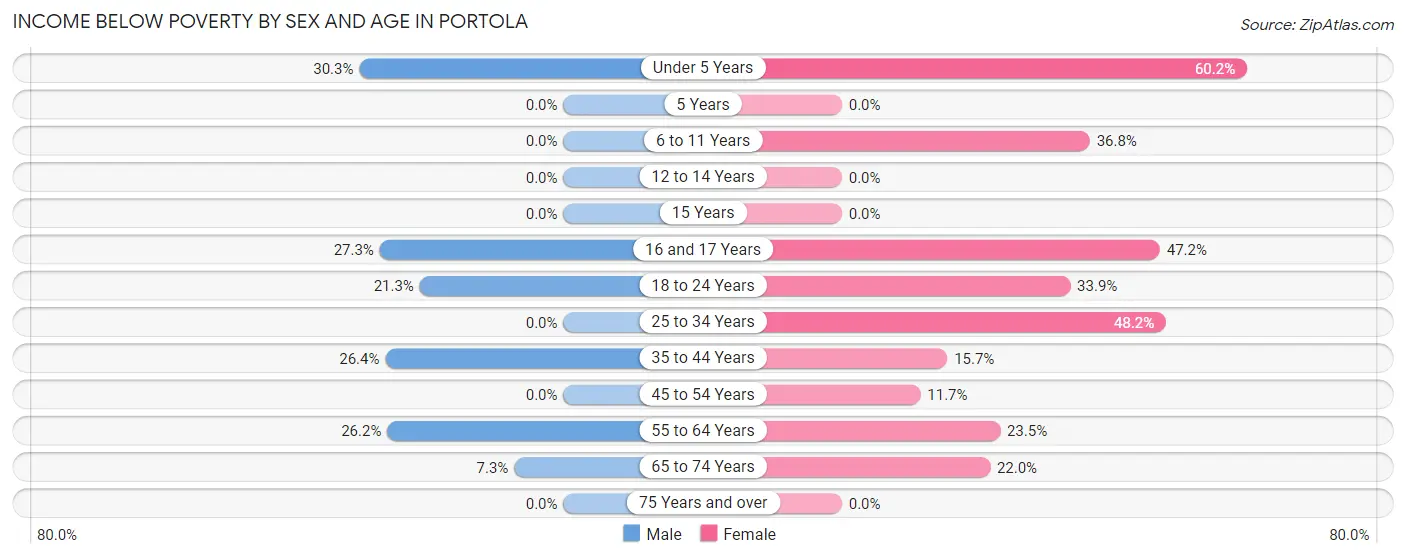
| Age Bracket | Male | Female |
| Under 5 Years | 30 (30.3%) | 77 (60.2%) |
| 5 Years | 0 (0.0%) | 0 (0.0%) |
| 6 to 11 Years | 0 (0.0%) | 53 (36.8%) |
| 12 to 14 Years | 0 (0.0%) | 0 (0.0%) |
| 15 Years | 0 (0.0%) | 0 (0.0%) |
| 16 and 17 Years | 6 (27.3%) | 17 (47.2%) |
| 18 to 24 Years | 16 (21.3%) | 39 (33.9%) |
| 25 to 34 Years | 0 (0.0%) | 52 (48.1%) |
| 35 to 44 Years | 23 (26.4%) | 59 (15.7%) |
| 45 to 54 Years | 0 (0.0%) | 14 (11.7%) |
| 55 to 64 Years | 51 (26.2%) | 35 (23.5%) |
| 65 to 74 Years | 13 (7.3%) | 22 (22.0%) |
| 75 Years and over | 0 (0.0%) | 0 (0.0%) |
| Total | 139 (13.0%) | 368 (27.6%) |
Income Above Poverty by Sex and Age in Portola
According to the poverty statistics in Portola, males aged 5 years and females aged 12 to 14 years are the age groups that are most secure financially, with 100.0% of males and 100.0% of females in these age groups living above the poverty line.
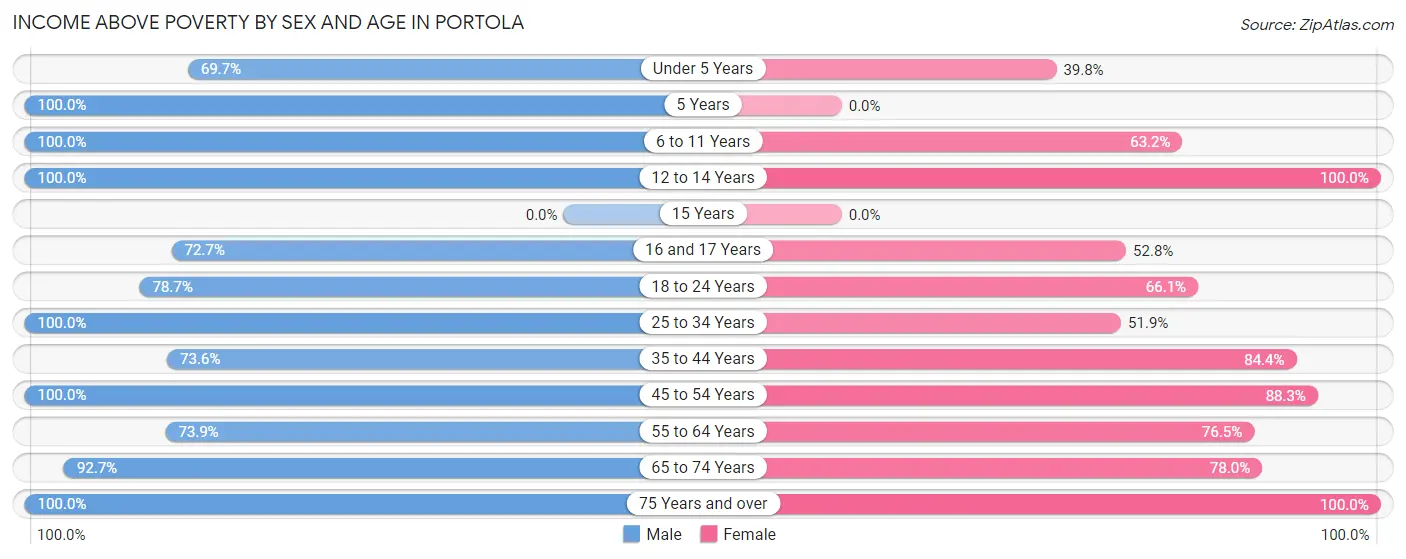
| Age Bracket | Male | Female |
| Under 5 Years | 69 (69.7%) | 51 (39.8%) |
| 5 Years | 5 (100.0%) | 0 (0.0%) |
| 6 to 11 Years | 86 (100.0%) | 91 (63.2%) |
| 12 to 14 Years | 49 (100.0%) | 31 (100.0%) |
| 15 Years | 0 (0.0%) | 0 (0.0%) |
| 16 and 17 Years | 16 (72.7%) | 19 (52.8%) |
| 18 to 24 Years | 59 (78.7%) | 76 (66.1%) |
| 25 to 34 Years | 81 (100.0%) | 56 (51.8%) |
| 35 to 44 Years | 64 (73.6%) | 318 (84.4%) |
| 45 to 54 Years | 124 (100.0%) | 106 (88.3%) |
| 55 to 64 Years | 144 (73.9%) | 114 (76.5%) |
| 65 to 74 Years | 165 (92.7%) | 78 (78.0%) |
| 75 Years and over | 71 (100.0%) | 26 (100.0%) |
| Total | 933 (87.0%) | 966 (72.4%) |
Income Below Poverty Among Married-Couple Families in Portola
The poverty statistics for married-couple families in Portola show that 0.9% or 4 of the total 420 families live below the poverty line. Families with 1 or 2 children have the highest poverty rate of 4.5%, comprising of 4 families. On the other hand, families with no children have the lowest poverty rate of 0.0%, which includes 0 families.
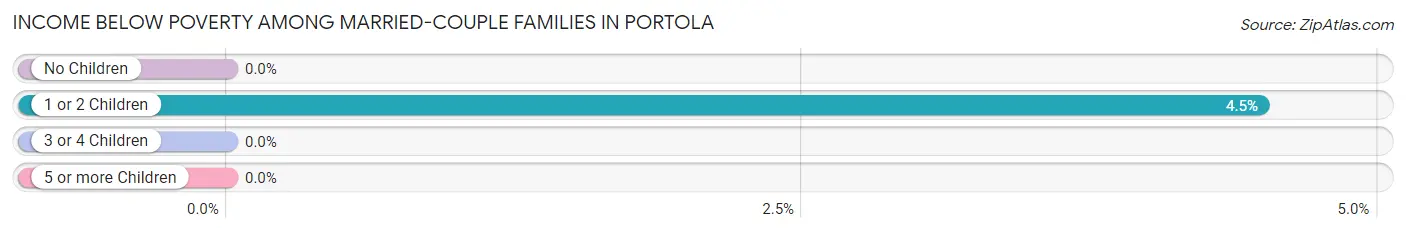
| Children | Above Poverty | Below Poverty |
| No Children | 282 (100.0%) | 0 (0.0%) |
| 1 or 2 Children | 85 (95.5%) | 4 (4.5%) |
| 3 or 4 Children | 29 (100.0%) | 0 (0.0%) |
| 5 or more Children | 20 (100.0%) | 0 (0.0%) |
| Total | 416 (99.1%) | 4 (0.9%) |
Income Below Poverty Among Single-Parent Households in Portola
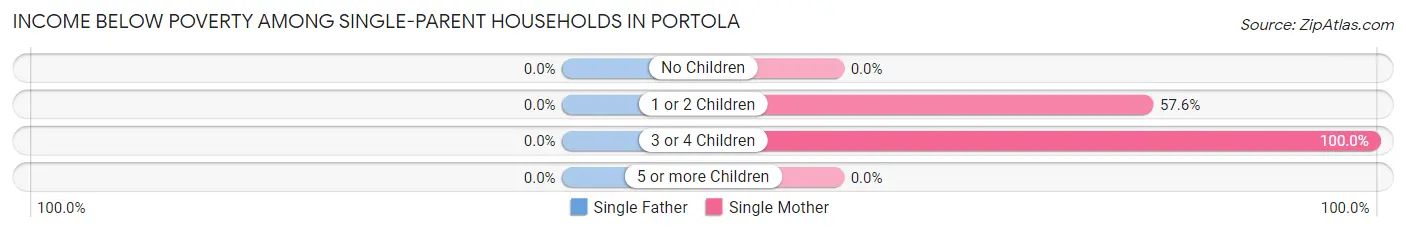
| Children | Single Father | Single Mother |
| No Children | 0 (0.0%) | 0 (0.0%) |
| 1 or 2 Children | 0 (0.0%) | 87 (57.6%) |
| 3 or 4 Children | 0 (0.0%) | 10 (100.0%) |
| 5 or more Children | 0 (0.0%) | 0 (0.0%) |
| Total | 0 (0.0%) | 97 (58.8%) |
Income Below Poverty Among Married-Couple vs Single-Parent Households in Portola
The poverty data for Portola shows that 4 of the married-couple family households (0.9%) and 97 of the single-parent households (52.4%) are living below the poverty level. Within the married-couple family households, those with 1 or 2 children have the highest poverty rate, with 4 households (4.5%) falling below the poverty line. Among the single-parent households, those with 3 or 4 children have the highest poverty rate, with 10 household (100.0%) living below poverty.
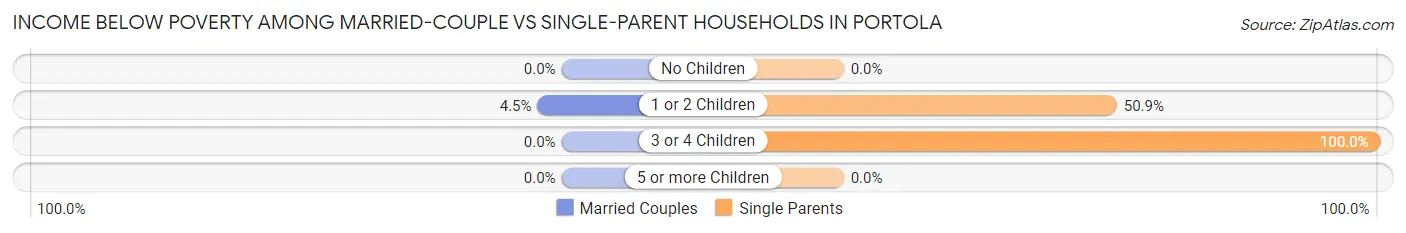
| Children | Married-Couple Families | Single-Parent Households |
| No Children | 0 (0.0%) | 0 (0.0%) |
| 1 or 2 Children | 4 (4.5%) | 87 (50.9%) |
| 3 or 4 Children | 0 (0.0%) | 10 (100.0%) |
| 5 or more Children | 0 (0.0%) | 0 (0.0%) |
| Total | 4 (0.9%) | 97 (52.4%) |
Race in Portola
The most populous races in Portola are White / Caucasian (2,202 | 90.7%), Hispanic or Latino (459 | 18.9%), and Two or more Races (195 | 8.0%).
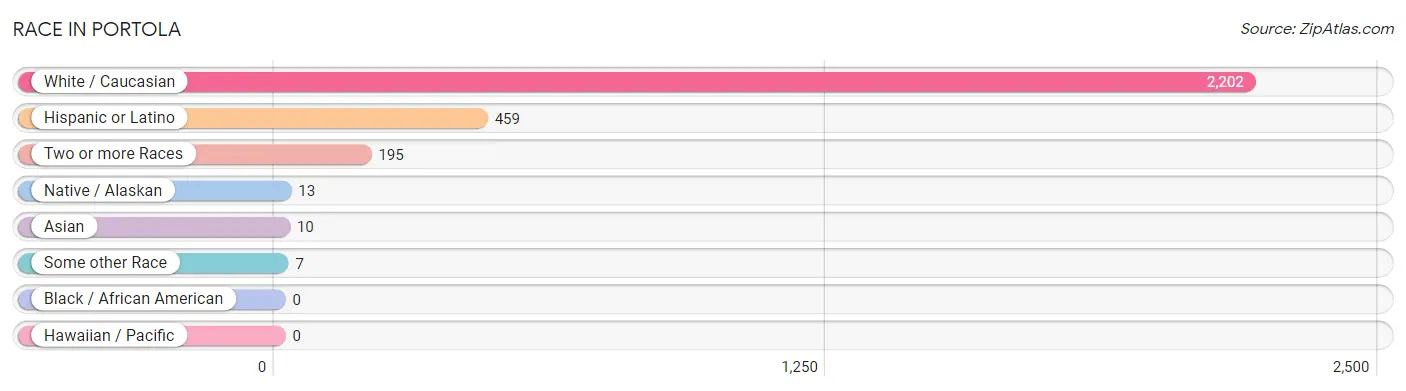
| Race | # Population | % Population |
| Asian | 10 | 0.4% |
| Black / African American | 0 | 0.0% |
| Hawaiian / Pacific | 0 | 0.0% |
| Hispanic or Latino | 459 | 18.9% |
| Native / Alaskan | 13 | 0.5% |
| White / Caucasian | 2,202 | 90.7% |
| Two or more Races | 195 | 8.0% |
| Some other Race | 7 | 0.3% |
| Total | 2,427 | 100.0% |
Ancestry in Portola
The most populous ancestries reported in Portola are Mexican (402 | 16.6%), German (371 | 15.3%), English (312 | 12.9%), Italian (249 | 10.3%), and French (190 | 7.8%), together accounting for 62.8% of all Portola residents.
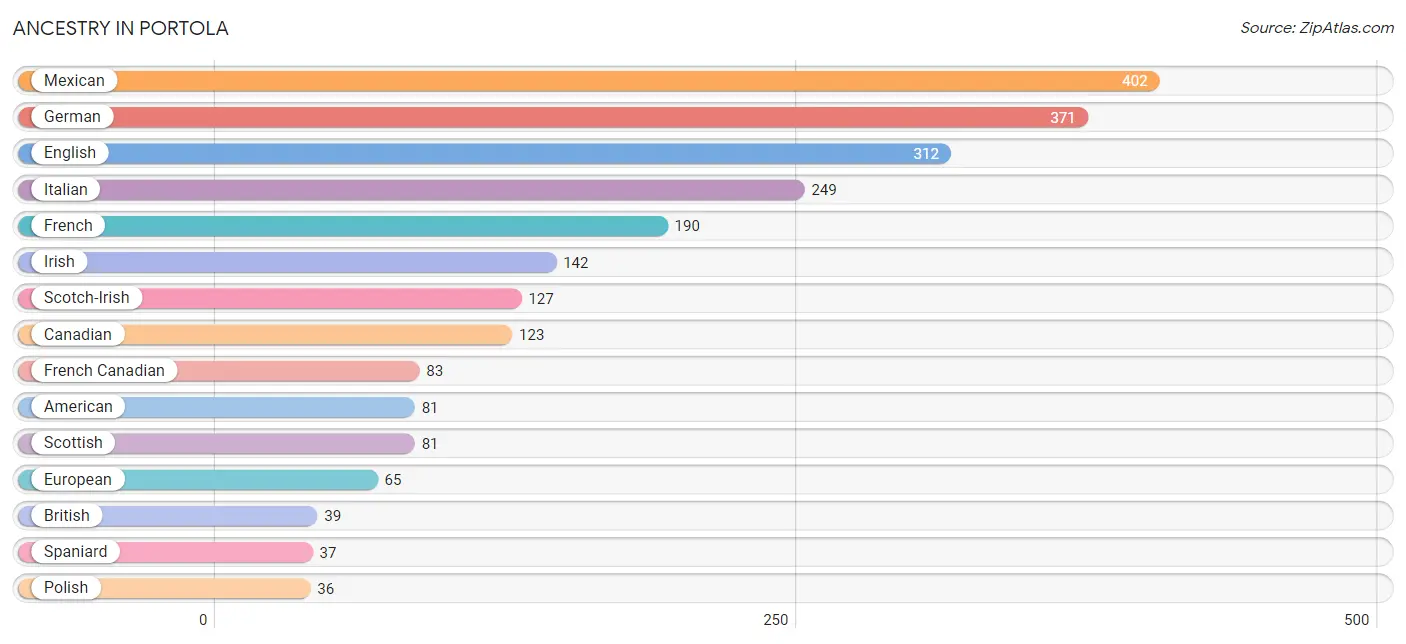
| Ancestry | # Population | % Population |
| American | 81 | 3.3% |
| Arab | 11 | 0.4% |
| Basque | 11 | 0.4% |
| British | 39 | 1.6% |
| Canadian | 123 | 5.1% |
| Central American | 10 | 0.4% |
| Cherokee | 25 | 1.0% |
| Danish | 7 | 0.3% |
| Eastern European | 25 | 1.0% |
| Ecuadorian | 5 | 0.2% |
| English | 312 | 12.9% |
| European | 65 | 2.7% |
| French | 190 | 7.8% |
| French Canadian | 83 | 3.4% |
| German | 371 | 15.3% |
| Indian (Asian) | 13 | 0.5% |
| Iranian | 4 | 0.2% |
| Irish | 142 | 5.9% |
| Italian | 249 | 10.3% |
| Mexican | 402 | 16.6% |
| Northern European | 14 | 0.6% |
| Norwegian | 11 | 0.4% |
| Osage | 5 | 0.2% |
| Pakistani | 3 | 0.1% |
| Palestinian | 11 | 0.4% |
| Polish | 36 | 1.5% |
| Portuguese | 29 | 1.2% |
| Russian | 13 | 0.5% |
| Salvadoran | 10 | 0.4% |
| Samoan | 8 | 0.3% |
| Scotch-Irish | 127 | 5.2% |
| Scottish | 81 | 3.3% |
| Sioux | 7 | 0.3% |
| South American | 5 | 0.2% |
| Spaniard | 37 | 1.5% |
| Spanish | 5 | 0.2% |
| Swedish | 25 | 1.0% |
| Swiss | 24 | 1.0% |
| Welsh | 28 | 1.1% | View All 39 Rows |
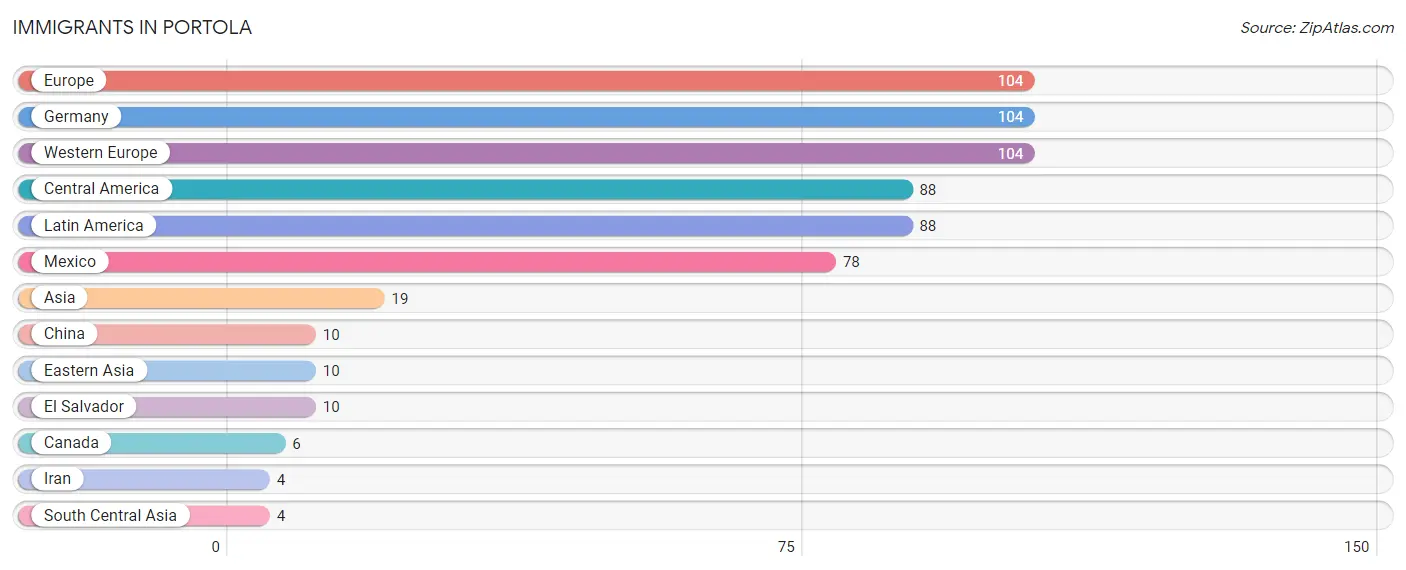
Immigrants in Portola
The most numerous immigrant groups reported in Portola came from Europe (104 | 4.3%), Germany (104 | 4.3%), Western Europe (104 | 4.3%), Central America (88 | 3.6%), and Latin America (88 | 3.6%), together accounting for 20.1% of all Portola residents.
| Immigration Origin | # Population | % Population |
| Asia | 19 | 0.8% |
| Canada | 6 | 0.3% |
| Central America | 88 | 3.6% |
| China | 10 | 0.4% |
| Eastern Asia | 10 | 0.4% |
| El Salvador | 10 | 0.4% |
| Europe | 104 | 4.3% |
| Germany | 104 | 4.3% |
| Iran | 4 | 0.2% |
| Latin America | 88 | 3.6% |
| Mexico | 78 | 3.2% |
| South Central Asia | 4 | 0.2% |
| Western Europe | 104 | 4.3% | View All 13 Rows |
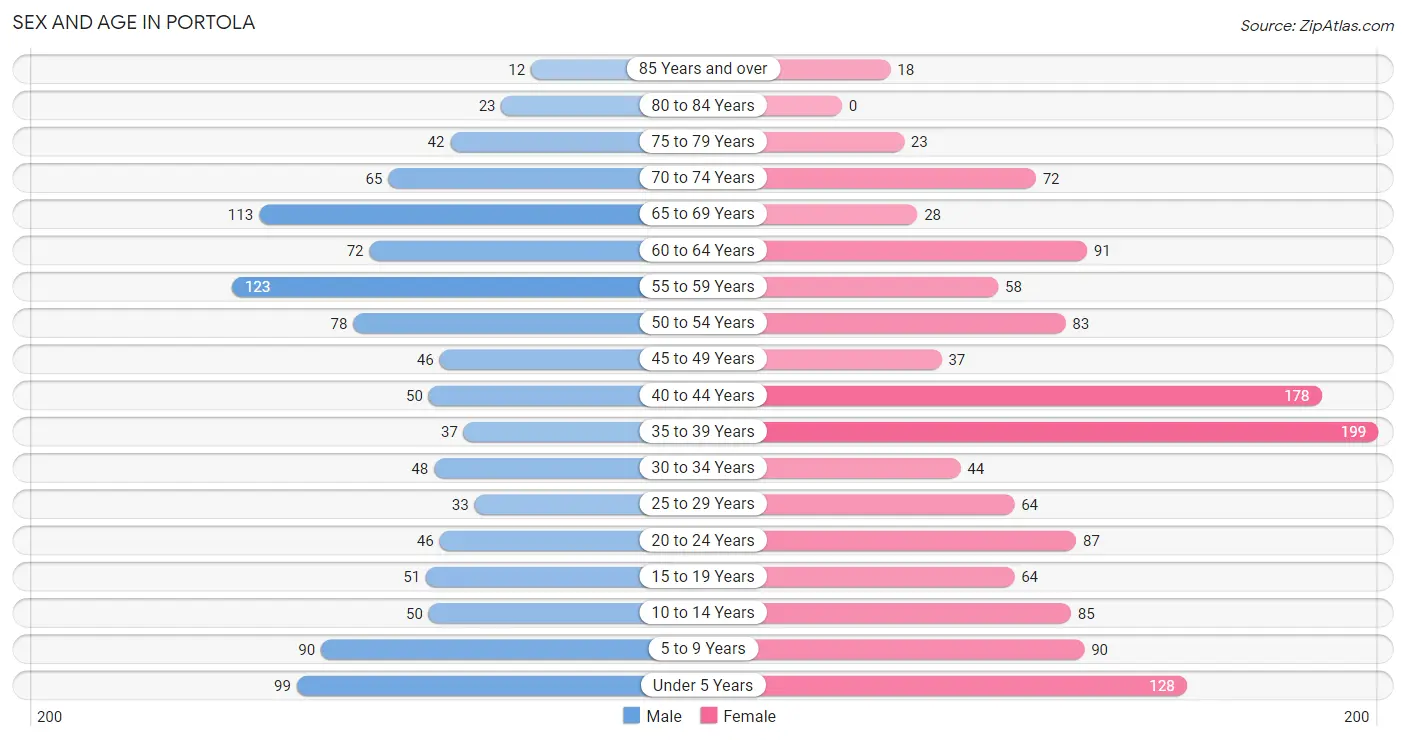
Sex and Age in Portola
Sex and Age in Portola
The most populous age groups in Portola are 55 to 59 Years (123 | 11.4%) for men and 35 to 39 Years (199 | 14.7%) for women.
| Age Bracket | Male | Female |
| Under 5 Years | 99 (9.2%) | 128 (9.5%) |
| 5 to 9 Years | 90 (8.4%) | 90 (6.7%) |
| 10 to 14 Years | 50 (4.6%) | 85 (6.3%) |
| 15 to 19 Years | 51 (4.7%) | 64 (4.7%) |
| 20 to 24 Years | 46 (4.3%) | 87 (6.5%) |
| 25 to 29 Years | 33 (3.1%) | 64 (4.7%) |
| 30 to 34 Years | 48 (4.4%) | 44 (3.3%) |
| 35 to 39 Years | 37 (3.4%) | 199 (14.7%) |
| 40 to 44 Years | 50 (4.6%) | 178 (13.2%) |
| 45 to 49 Years | 46 (4.3%) | 37 (2.7%) |
| 50 to 54 Years | 78 (7.2%) | 83 (6.1%) |
| 55 to 59 Years | 123 (11.4%) | 58 (4.3%) |
| 60 to 64 Years | 72 (6.7%) | 91 (6.8%) |
| 65 to 69 Years | 113 (10.5%) | 28 (2.1%) |
| 70 to 74 Years | 65 (6.0%) | 72 (5.3%) |
| 75 to 79 Years | 42 (3.9%) | 23 (1.7%) |
| 80 to 84 Years | 23 (2.1%) | 0 (0.0%) |
| 85 Years and over | 12 (1.1%) | 18 (1.3%) |
| Total | 1,078 (100.0%) | 1,349 (100.0%) |
Families and Households in Portola
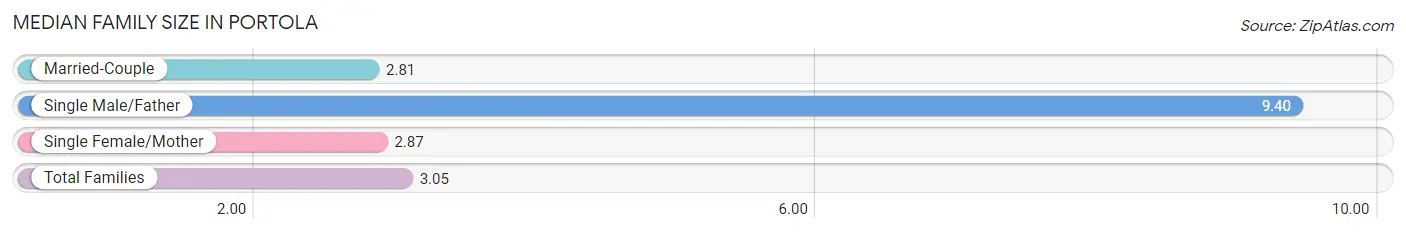
Median Family Size in Portola
The median family size in Portola is 3.05 persons per family, with single male/father families (20 | 3.3%) accounting for the largest median family size of 9.4 persons per family. On the other hand, married-couple families (420 | 69.4%) represent the smallest median family size with 2.81 persons per family.
| Family Type | # Families | Family Size |
| Married-Couple | 420 (69.4%) | 2.81 |
| Single Male/Father | 20 (3.3%) | 9.40 |
| Single Female/Mother | 165 (27.3%) | 2.87 |
| Total Families | 605 (100.0%) | 3.05 |
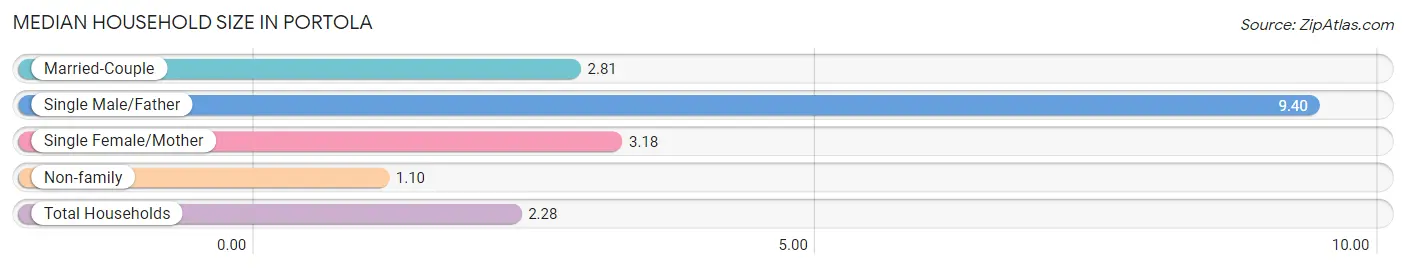
Median Household Size in Portola
The median household size in Portola is 2.28 persons per household, with single male/father households (20 | 1.9%) accounting for the largest median household size of 9.4 persons per household. non-family households (439 | 42.0%) represent the smallest median household size with 1.10 persons per household.
| Household Type | # Households | Household Size |
| Married-Couple | 420 (40.2%) | 2.81 |
| Single Male/Father | 20 (1.9%) | 9.40 |
| Single Female/Mother | 165 (15.8%) | 3.18 |
| Non-family | 439 (42.0%) | 1.10 |
| Total Households | 1,044 (100.0%) | 2.28 |
Household Size by Marriage Status in Portola
Out of a total of 1,044 households in Portola, 605 (58.0%) are family households, while 439 (42.0%) are nonfamily households. The most numerous type of family households are 2-person households, comprising 230, and the most common type of nonfamily households are 1-person households, comprising 404.
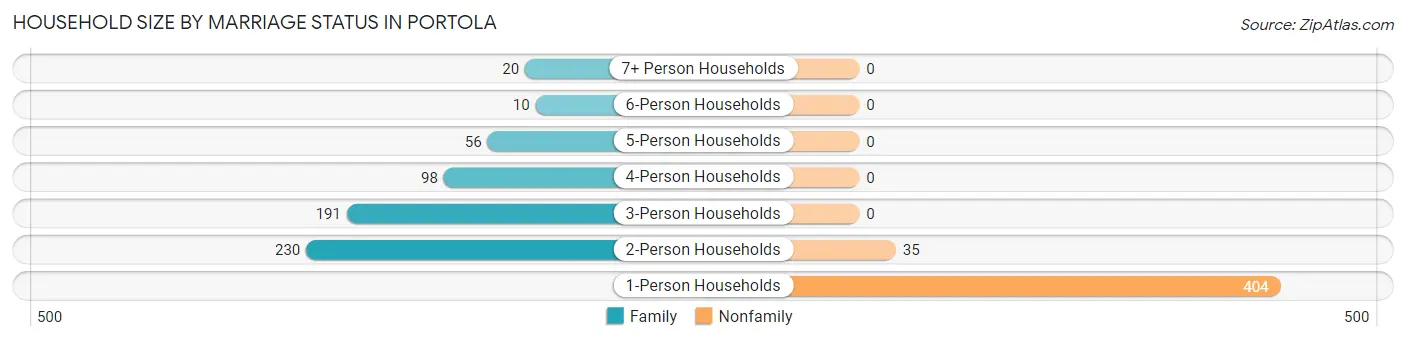
| Household Size | Family Households | Nonfamily Households |
| 1-Person Households | - | 404 (38.7%) |
| 2-Person Households | 230 (22.0%) | 35 (3.4%) |
| 3-Person Households | 191 (18.3%) | 0 (0.0%) |
| 4-Person Households | 98 (9.4%) | 0 (0.0%) |
| 5-Person Households | 56 (5.4%) | 0 (0.0%) |
| 6-Person Households | 10 (1.0%) | 0 (0.0%) |
| 7+ Person Households | 20 (1.9%) | 0 (0.0%) |
| Total | 605 (58.0%) | 439 (42.0%) |
Female Fertility in Portola
Fertility by Age in Portola
Average fertility rate in Portola is 162.0 births per 1,000 women. Women in the age bracket of 20 to 34 years have the highest fertility rate with 200.0 births per 1,000 women. Women in the age bracket of 35 to 50 years acount for 64.2% of all women with births.
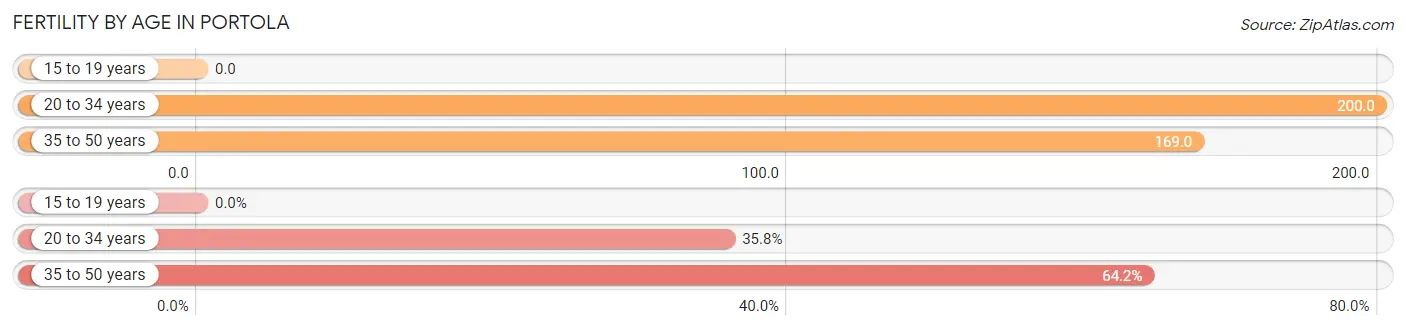
| Age Bracket | Women with Births | Births / 1,000 Women |
| 15 to 19 years | 0 (0.0%) | 0.0 |
| 20 to 34 years | 39 (35.8%) | 200.0 |
| 35 to 50 years | 70 (64.2%) | 169.0 |
| Total | 109 (100.0%) | 162.0 |
Fertility by Age by Marriage Status in Portola
30.3% of women with births (109) in Portola are married. The highest percentage of unmarried women with births falls into 35 to 50 years age bracket with 71.4% of them unmarried at the time of birth, while the lowest percentage of unmarried women with births belong to 20 to 34 years age bracket with 66.7% of them unmarried.
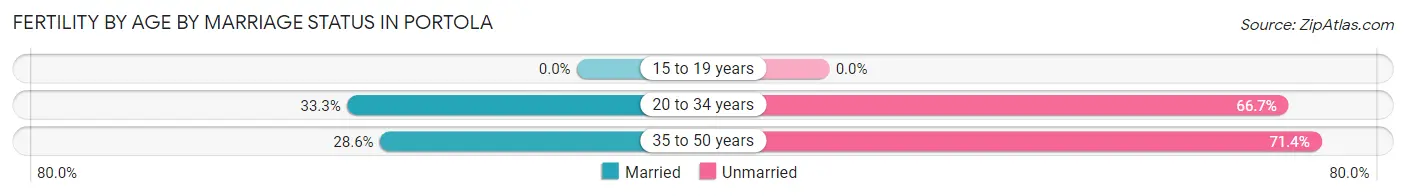
| Age Bracket | Married | Unmarried |
| 15 to 19 years | 0 (0.0%) | 0 (0.0%) |
| 20 to 34 years | 13 (33.3%) | 26 (66.7%) |
| 35 to 50 years | 20 (28.6%) | 50 (71.4%) |
| Total | 33 (30.3%) | 76 (69.7%) |
Fertility by Education in Portola
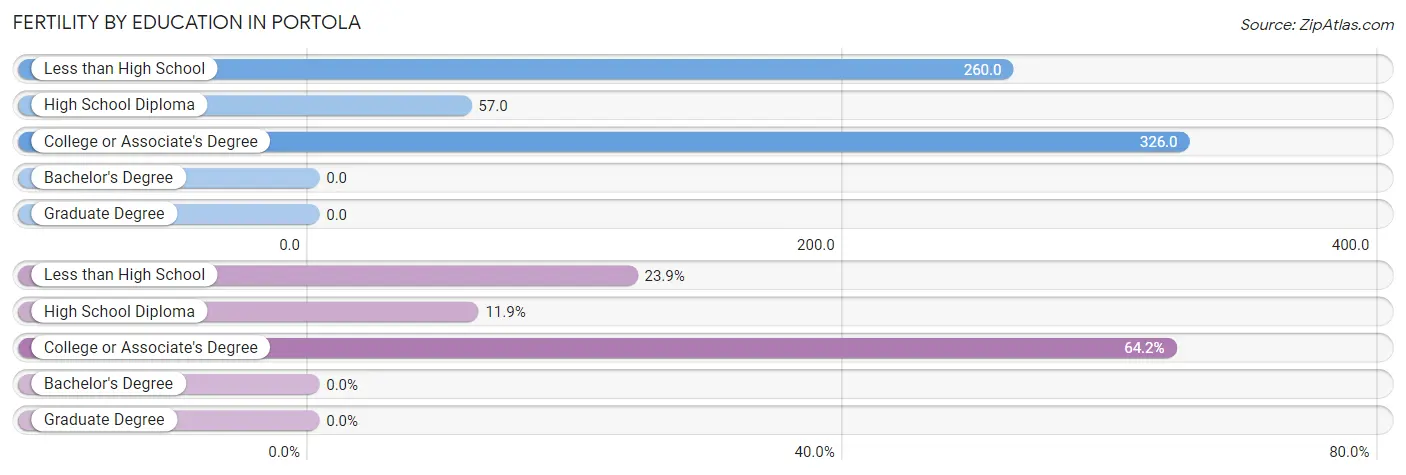
| Educational Attainment | Women with Births | Births / 1,000 Women |
| Less than High School | 26 (23.8%) | 260.0 |
| High School Diploma | 13 (11.9%) | 57.0 |
| College or Associate's Degree | 70 (64.2%) | 326.0 |
| Bachelor's Degree | 0 (0.0%) | 0.0 |
| Graduate Degree | 0 (0.0%) | 0.0 |
| Total | 109 (100.0%) | 162.0 |
Fertility by Education by Marriage Status in Portola
69.7% of women with births in Portola are unmarried. Women with the educational attainment of high school diploma are most likely to be married with 100.0% of them married at childbirth, while women with the educational attainment of less than high school are least likely to be married with 100.0% of them unmarried at childbirth.
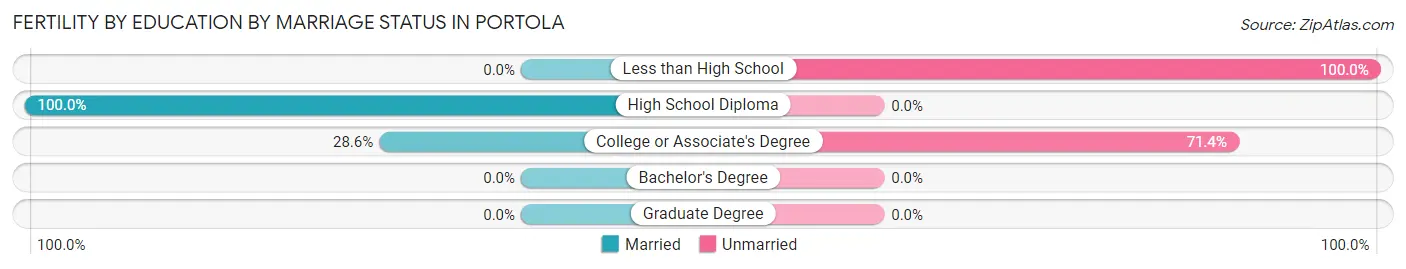
| Educational Attainment | Married | Unmarried |
| Less than High School | 0 (0.0%) | 26 (100.0%) |
| High School Diploma | 13 (100.0%) | 0 (0.0%) |
| College or Associate's Degree | 20 (28.6%) | 50 (71.4%) |
| Bachelor's Degree | 0 (0.0%) | 0 (0.0%) |
| Graduate Degree | 0 (0.0%) | 0 (0.0%) |
| Total | 33 (30.3%) | 76 (69.7%) |
Employment Characteristics in Portola
Employment by Class of Employer in Portola
Among the 969 employed individuals in Portola, private company employees (508 | 52.4%), self-employed (incorporated) (106 | 10.9%), and federal government employees (104 | 10.7%) make up the most common classes of employment.
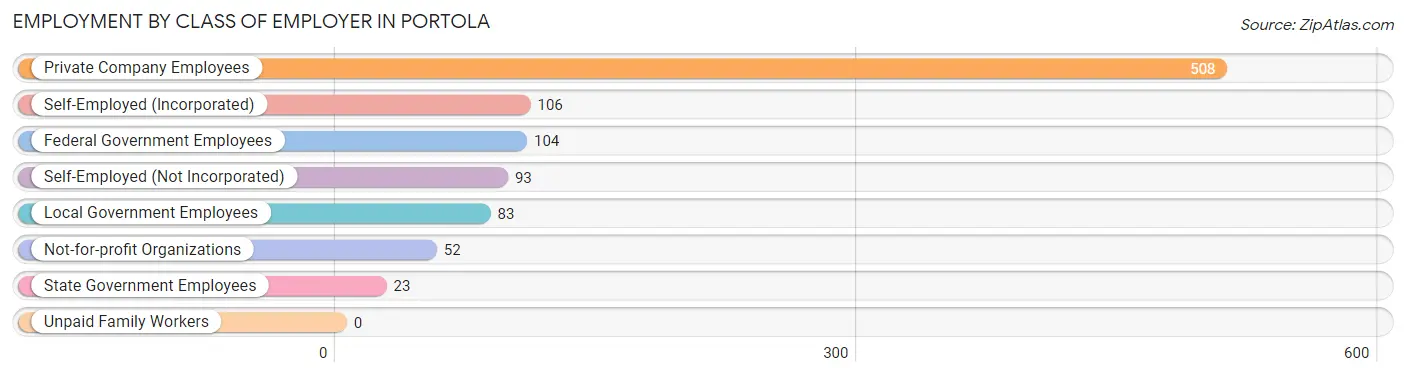
| Employer Class | # Employees | % Employees |
| Private Company Employees | 508 | 52.4% |
| Self-Employed (Incorporated) | 106 | 10.9% |
| Self-Employed (Not Incorporated) | 93 | 9.6% |
| Not-for-profit Organizations | 52 | 5.4% |
| Local Government Employees | 83 | 8.6% |
| State Government Employees | 23 | 2.4% |
| Federal Government Employees | 104 | 10.7% |
| Unpaid Family Workers | 0 | 0.0% |
| Total | 969 | 100.0% |
Employment Status by Age in Portola
According to the labor force statistics for Portola, out of the total population over 16 years of age (1,885), 58.1% or 1,095 individuals are in the labor force, with 7.0% or 77 of them unemployed. The age group with the highest labor force participation rate is 35 to 44 years, with 91.6% or 425 individuals in the labor force. Within the labor force, the 16 to 19 years age range has the highest percentage of unemployed individuals, with 57.1% or 16 of them being unemployed.
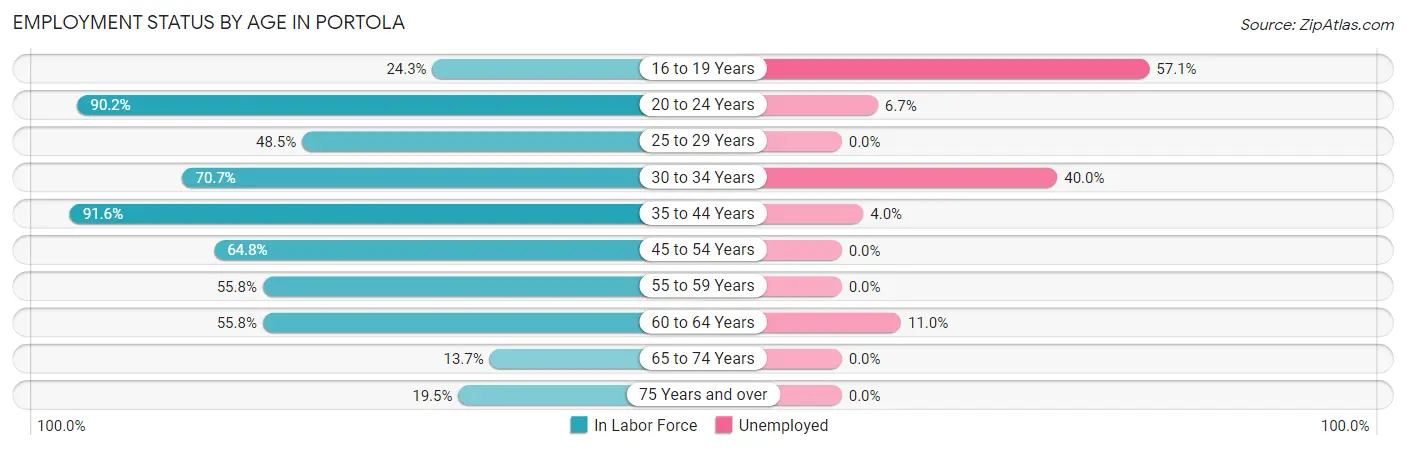
| Age Bracket | In Labor Force | Unemployed |
| 16 to 19 Years | 28 (24.3%) | 16 (57.1%) |
| 20 to 24 Years | 120 (90.2%) | 8 (6.7%) |
| 25 to 29 Years | 47 (48.5%) | 0 (0.0%) |
| 30 to 34 Years | 65 (70.7%) | 26 (40.0%) |
| 35 to 44 Years | 425 (91.6%) | 17 (4.0%) |
| 45 to 54 Years | 158 (64.8%) | 0 (0.0%) |
| 55 to 59 Years | 101 (55.8%) | 0 (0.0%) |
| 60 to 64 Years | 91 (55.8%) | 10 (11.0%) |
| 65 to 74 Years | 38 (13.7%) | 0 (0.0%) |
| 75 Years and over | 23 (19.5%) | 0 (0.0%) |
| Total | 1,095 (58.1%) | 77 (7.0%) |
Employment Status by Educational Attainment in Portola
According to labor force statistics for Portola, 71.5% of individuals (887) out of the total population between 25 and 64 years of age (1,241) are in the labor force, with 6.0% or 53 of them being unemployed. The group with the highest labor force participation rate are those with the educational attainment of bachelor's degree or higher, with 86.3% or 126 individuals in the labor force. Within the labor force, individuals with less than high school education have the highest percentage of unemployment, with 72.4% or 21 of them being unemployed.
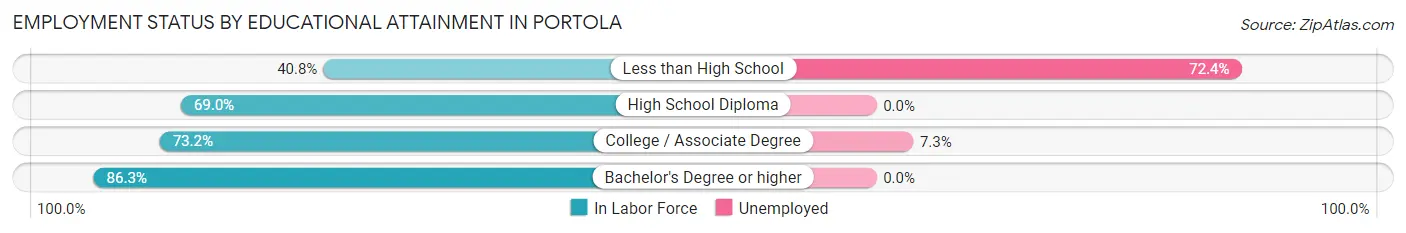
| Educational Attainment | In Labor Force | Unemployed |
| Less than High School | 29 (40.8%) | 51 (72.4%) |
| High School Diploma | 294 (69.0%) | 0 (0.0%) |
| College / Associate Degree | 438 (73.2%) | 44 (7.3%) |
| Bachelor's Degree or higher | 126 (86.3%) | 0 (0.0%) |
| Total | 887 (71.5%) | 74 (6.0%) |
Employment Occupations by Sex in Portola
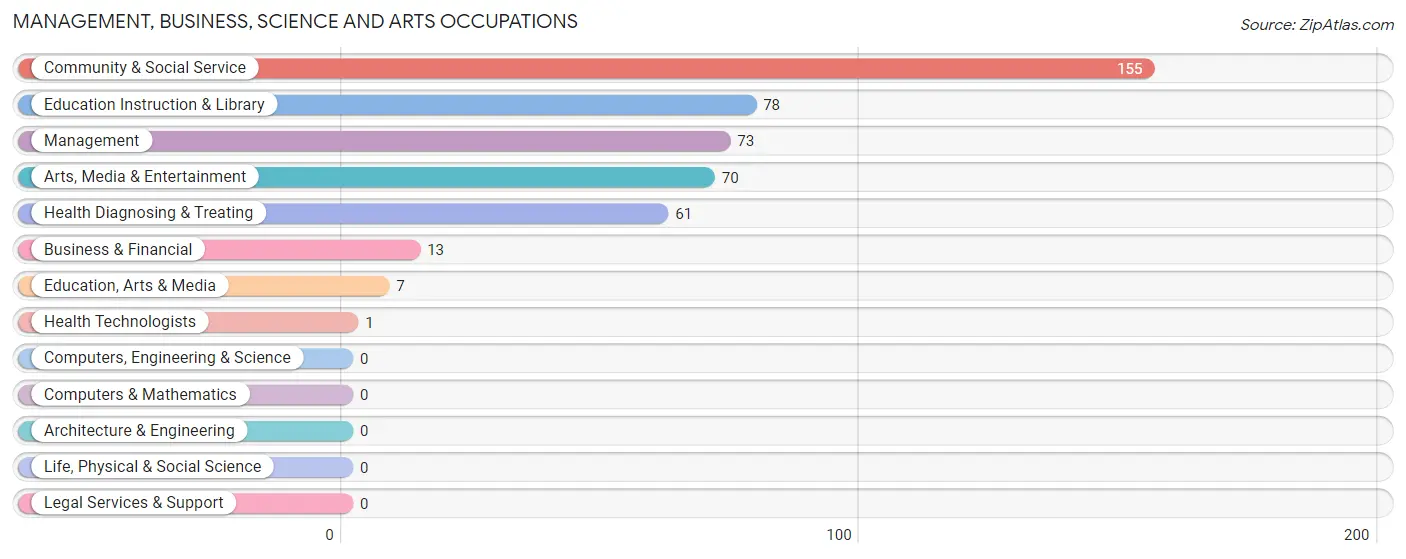
Management, Business, Science and Arts Occupations
The most common Management, Business, Science and Arts occupations in Portola are Community & Social Service (155 | 15.2%), Education Instruction & Library (78 | 7.6%), Management (73 | 7.2%), Arts, Media & Entertainment (70 | 6.9%), and Health Diagnosing & Treating (61 | 6.0%).
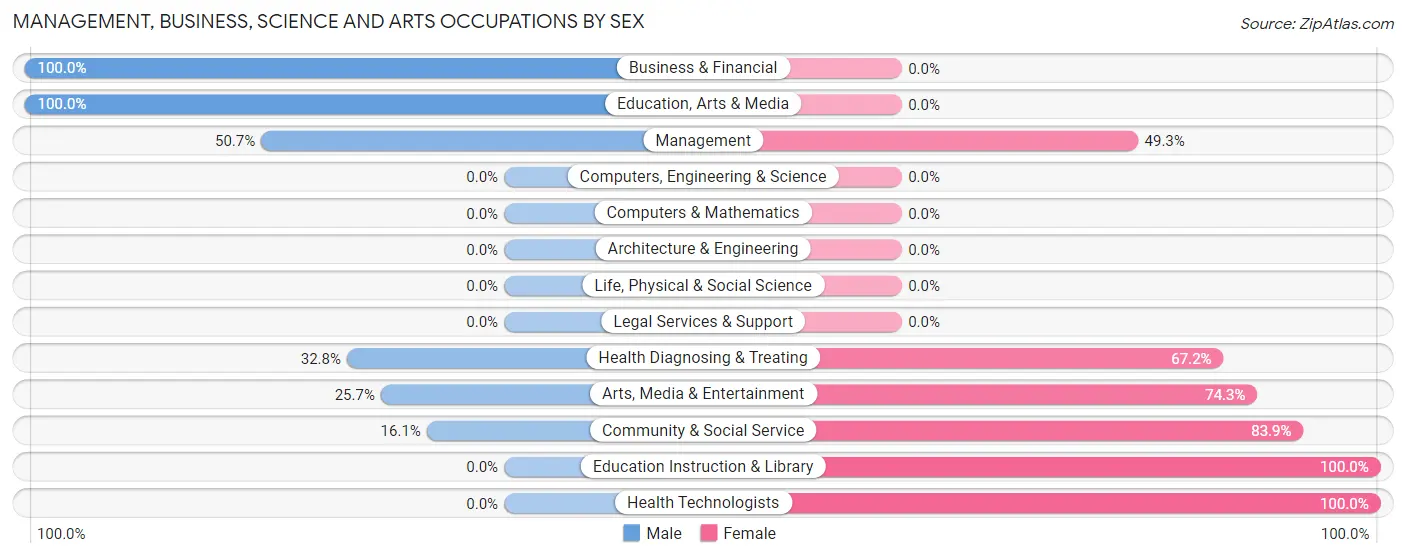
Management, Business, Science and Arts Occupations by Sex
Within the Management, Business, Science and Arts occupations in Portola, the most male-oriented occupations are Business & Financial (100.0%), Education, Arts & Media (100.0%), and Management (50.7%), while the most female-oriented occupations are Education Instruction & Library (100.0%), Health Technologists (100.0%), and Community & Social Service (83.9%).
| Occupation | Male | Female |
| Management | 37 (50.7%) | 36 (49.3%) |
| Business & Financial | 13 (100.0%) | 0 (0.0%) |
| Computers, Engineering & Science | 0 (0.0%) | 0 (0.0%) |
| Computers & Mathematics | 0 (0.0%) | 0 (0.0%) |
| Architecture & Engineering | 0 (0.0%) | 0 (0.0%) |
| Life, Physical & Social Science | 0 (0.0%) | 0 (0.0%) |
| Community & Social Service | 25 (16.1%) | 130 (83.9%) |
| Education, Arts & Media | 7 (100.0%) | 0 (0.0%) |
| Legal Services & Support | 0 (0.0%) | 0 (0.0%) |
| Education Instruction & Library | 0 (0.0%) | 78 (100.0%) |
| Arts, Media & Entertainment | 18 (25.7%) | 52 (74.3%) |
| Health Diagnosing & Treating | 20 (32.8%) | 41 (67.2%) |
| Health Technologists | 0 (0.0%) | 1 (100.0%) |
| Total (Category) | 95 (31.5%) | 207 (68.5%) |
| Total (Overall) | 428 (42.0%) | 591 (58.0%) |
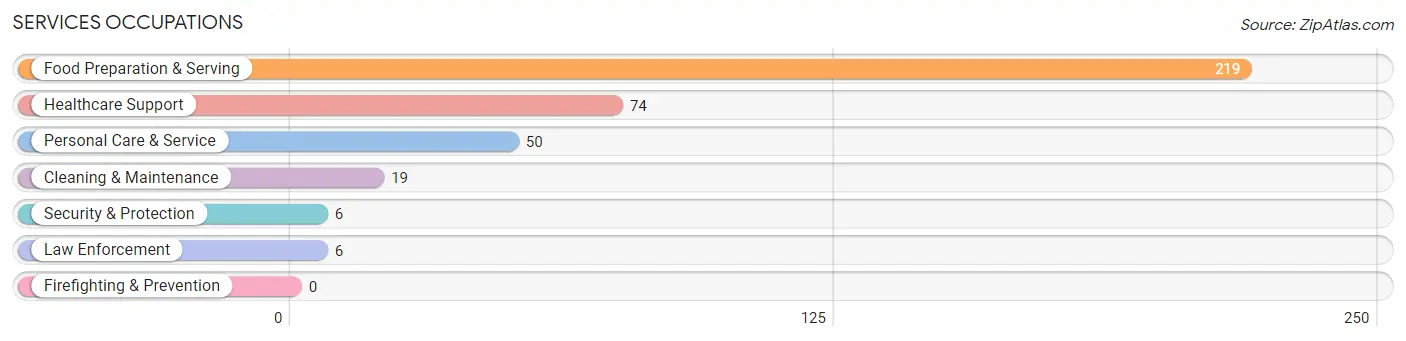
Services Occupations
The most common Services occupations in Portola are Food Preparation & Serving (219 | 21.5%), Healthcare Support (74 | 7.3%), Personal Care & Service (50 | 4.9%), Cleaning & Maintenance (19 | 1.9%), and Security & Protection (6 | 0.6%).
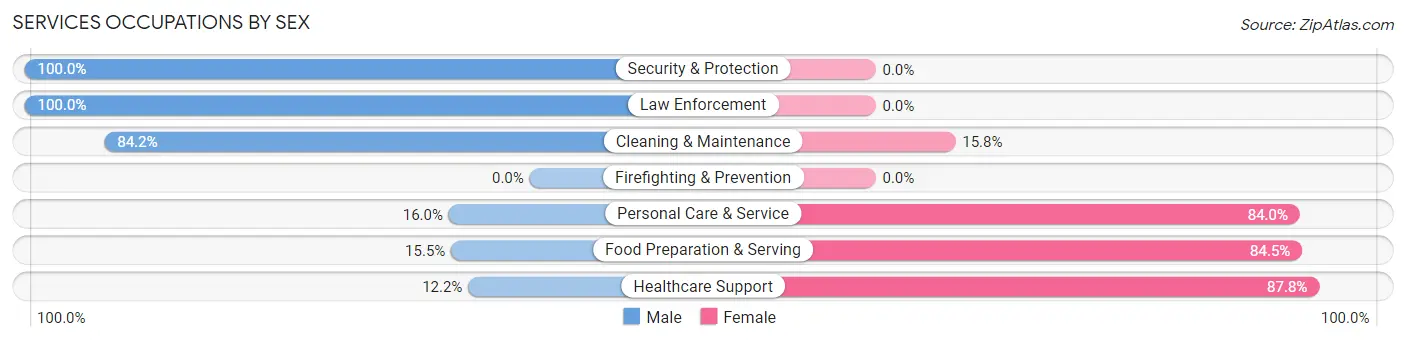
Services Occupations by Sex
Within the Services occupations in Portola, the most male-oriented occupations are Security & Protection (100.0%), Law Enforcement (100.0%), and Cleaning & Maintenance (84.2%), while the most female-oriented occupations are Healthcare Support (87.8%), Food Preparation & Serving (84.5%), and Personal Care & Service (84.0%).
| Occupation | Male | Female |
| Healthcare Support | 9 (12.2%) | 65 (87.8%) |
| Security & Protection | 6 (100.0%) | 0 (0.0%) |
| Firefighting & Prevention | 0 (0.0%) | 0 (0.0%) |
| Law Enforcement | 6 (100.0%) | 0 (0.0%) |
| Food Preparation & Serving | 34 (15.5%) | 185 (84.5%) |
| Cleaning & Maintenance | 16 (84.2%) | 3 (15.8%) |
| Personal Care & Service | 8 (16.0%) | 42 (84.0%) |
| Total (Category) | 73 (19.8%) | 295 (80.2%) |
| Total (Overall) | 428 (42.0%) | 591 (58.0%) |
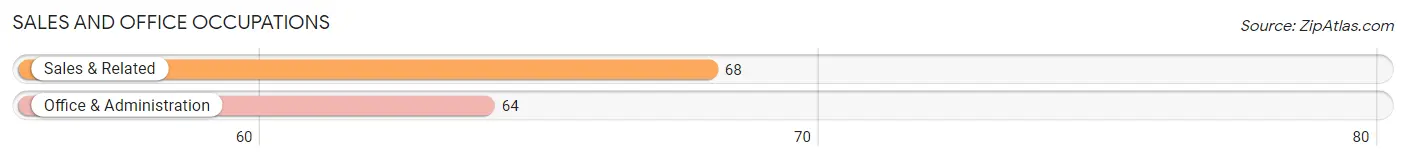
Sales and Office Occupations
The most common Sales and Office occupations in Portola are Sales & Related (68 | 6.7%), and Office & Administration (64 | 6.3%).
Sales and Office Occupations by Sex
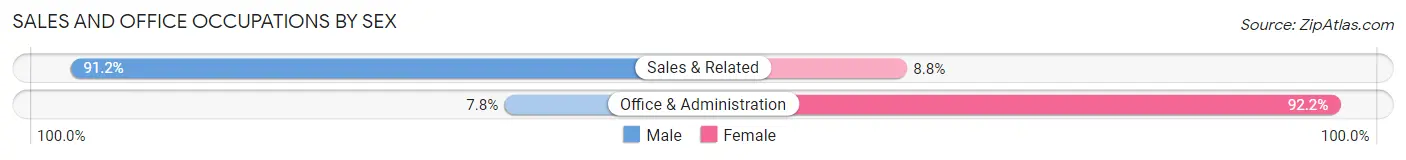
| Occupation | Male | Female |
| Sales & Related | 62 (91.2%) | 6 (8.8%) |
| Office & Administration | 5 (7.8%) | 59 (92.2%) |
| Total (Category) | 67 (50.8%) | 65 (49.2%) |
| Total (Overall) | 428 (42.0%) | 591 (58.0%) |
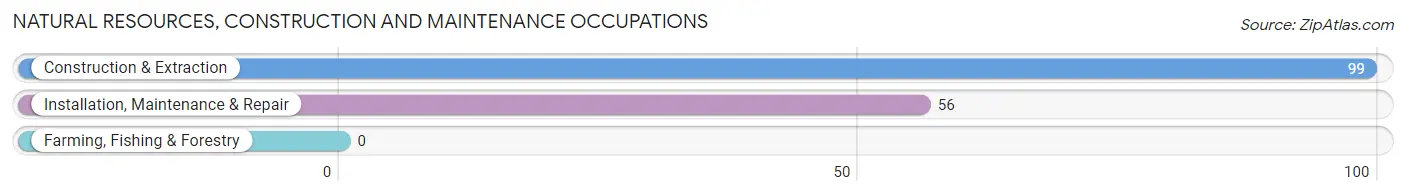
Natural Resources, Construction and Maintenance Occupations
The most common Natural Resources, Construction and Maintenance occupations in Portola are Construction & Extraction (99 | 9.7%), and Installation, Maintenance & Repair (56 | 5.5%).
Natural Resources, Construction and Maintenance Occupations by Sex
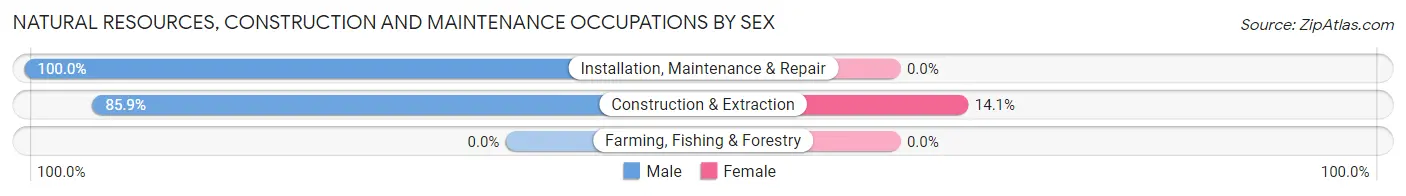
| Occupation | Male | Female |
| Farming, Fishing & Forestry | 0 (0.0%) | 0 (0.0%) |
| Construction & Extraction | 85 (85.9%) | 14 (14.1%) |
| Installation, Maintenance & Repair | 56 (100.0%) | 0 (0.0%) |
| Total (Category) | 141 (91.0%) | 14 (9.0%) |
| Total (Overall) | 428 (42.0%) | 591 (58.0%) |
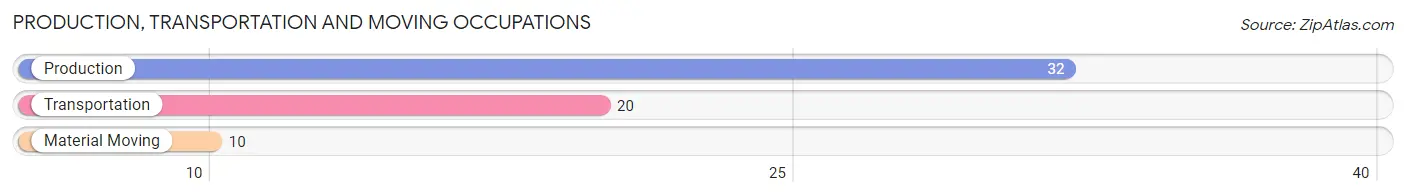
Production, Transportation and Moving Occupations
The most common Production, Transportation and Moving occupations in Portola are Production (32 | 3.1%), Transportation (20 | 2.0%), and Material Moving (10 | 1.0%).
Production, Transportation and Moving Occupations by Sex
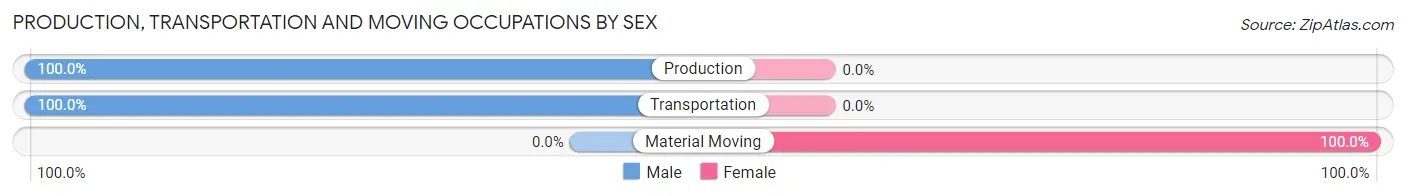
| Occupation | Male | Female |
| Production | 32 (100.0%) | 0 (0.0%) |
| Transportation | 20 (100.0%) | 0 (0.0%) |
| Material Moving | 0 (0.0%) | 10 (100.0%) |
| Total (Category) | 52 (83.9%) | 10 (16.1%) |
| Total (Overall) | 428 (42.0%) | 591 (58.0%) |
Employment Industries by Sex in Portola
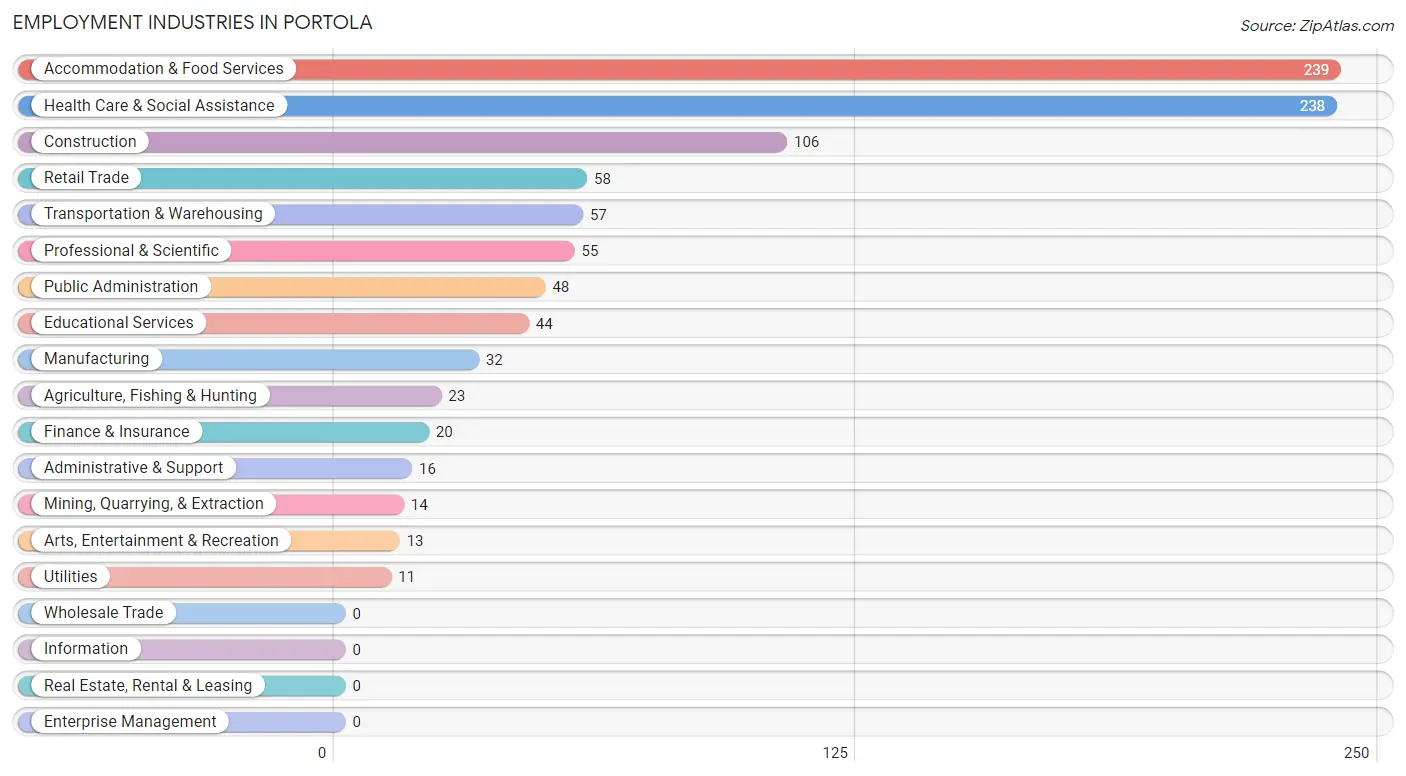
Employment Industries in Portola
The major employment industries in Portola include Accommodation & Food Services (239 | 23.4%), Health Care & Social Assistance (238 | 23.4%), Construction (106 | 10.4%), Retail Trade (58 | 5.7%), and Transportation & Warehousing (57 | 5.6%).
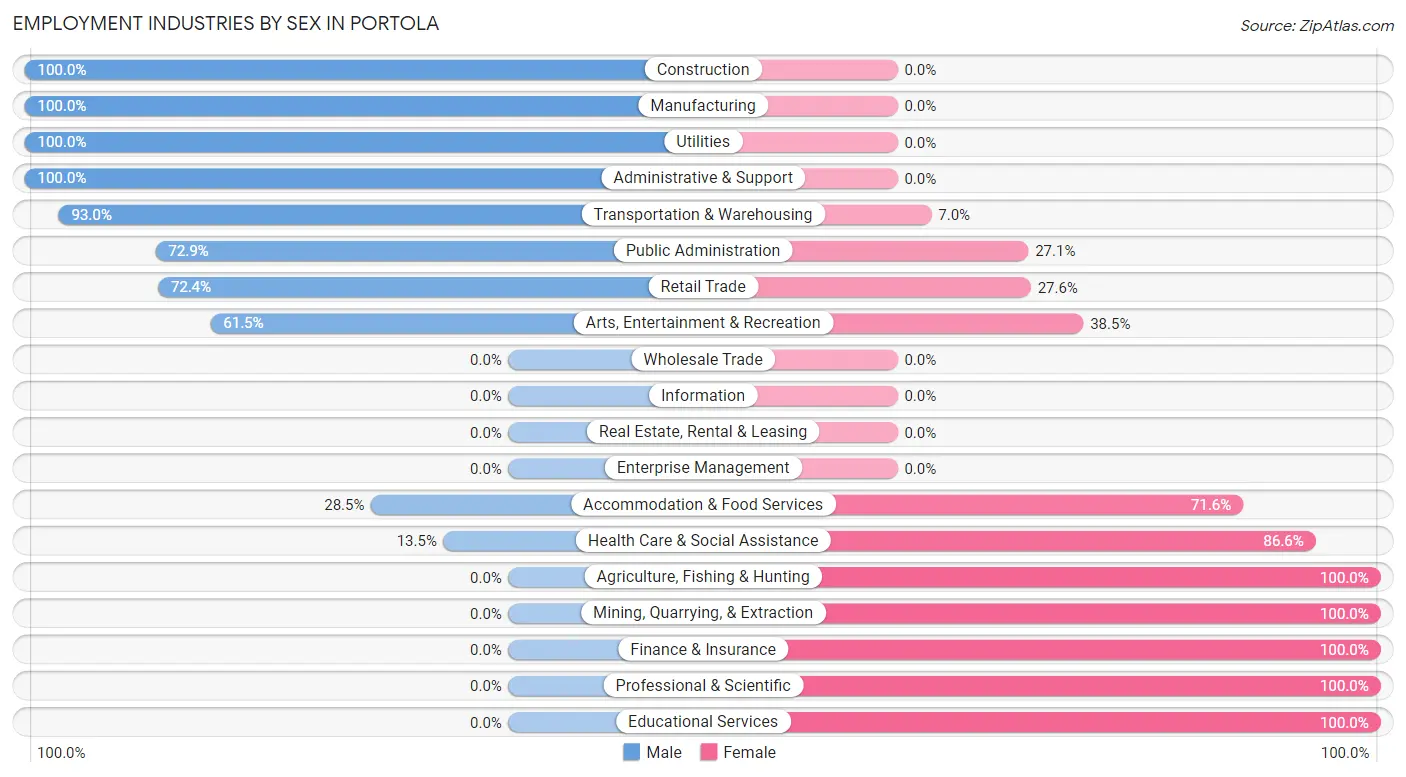
Employment Industries by Sex in Portola
The Portola industries that see more men than women are Construction (100.0%), Manufacturing (100.0%), and Utilities (100.0%), whereas the industries that tend to have a higher number of women are Agriculture, Fishing & Hunting (100.0%), Mining, Quarrying, & Extraction (100.0%), and Finance & Insurance (100.0%).
| Industry | Male | Female |
| Agriculture, Fishing & Hunting | 0 (0.0%) | 23 (100.0%) |
| Mining, Quarrying, & Extraction | 0 (0.0%) | 14 (100.0%) |
| Construction | 106 (100.0%) | 0 (0.0%) |
| Manufacturing | 32 (100.0%) | 0 (0.0%) |
| Wholesale Trade | 0 (0.0%) | 0 (0.0%) |
| Retail Trade | 42 (72.4%) | 16 (27.6%) |
| Transportation & Warehousing | 53 (93.0%) | 4 (7.0%) |
| Utilities | 11 (100.0%) | 0 (0.0%) |
| Information | 0 (0.0%) | 0 (0.0%) |
| Finance & Insurance | 0 (0.0%) | 20 (100.0%) |
| Real Estate, Rental & Leasing | 0 (0.0%) | 0 (0.0%) |
| Professional & Scientific | 0 (0.0%) | 55 (100.0%) |
| Enterprise Management | 0 (0.0%) | 0 (0.0%) |
| Administrative & Support | 16 (100.0%) | 0 (0.0%) |
| Educational Services | 0 (0.0%) | 44 (100.0%) |
| Health Care & Social Assistance | 32 (13.5%) | 206 (86.6%) |
| Arts, Entertainment & Recreation | 8 (61.5%) | 5 (38.5%) |
| Accommodation & Food Services | 68 (28.4%) | 171 (71.6%) |
| Public Administration | 35 (72.9%) | 13 (27.1%) |
| Total | 428 (42.0%) | 591 (58.0%) |
Education in Portola
School Enrollment in Portola
The most common levels of schooling among the 569 students in Portola are elementary school (154 | 27.1%), college / undergraduate (140 | 24.6%), and middle school (129 | 22.7%).
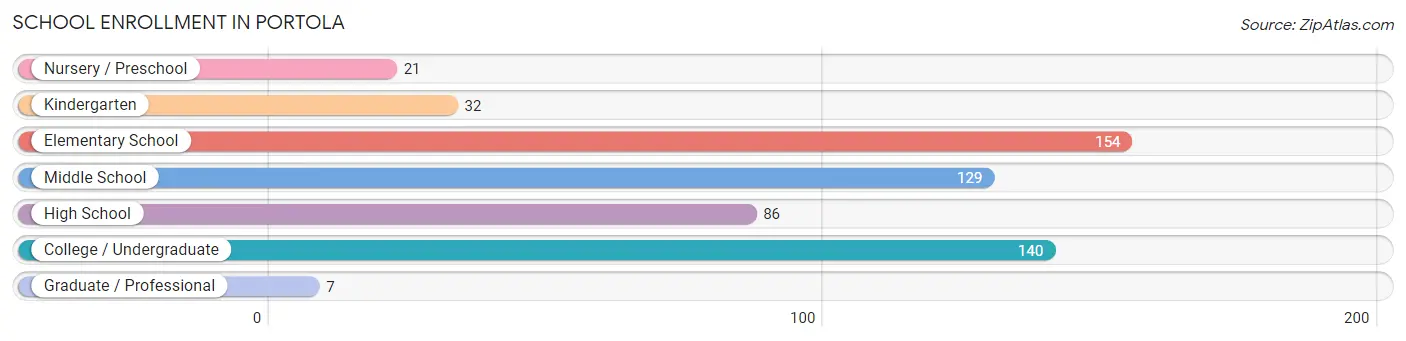
| School Level | # Students | % Students |
| Nursery / Preschool | 21 | 3.7% |
| Kindergarten | 32 | 5.6% |
| Elementary School | 154 | 27.1% |
| Middle School | 129 | 22.7% |
| High School | 86 | 15.1% |
| College / Undergraduate | 140 | 24.6% |
| Graduate / Professional | 7 | 1.2% |
| Total | 569 | 100.0% |
School Enrollment by Age by Funding Source in Portola
Out of a total of 569 students who are enrolled in schools in Portola, 146 (25.7%) attend a private institution, while the remaining 423 (74.3%) are enrolled in public schools. The age group of 3 to 4 year olds has the highest likelihood of being enrolled in private schools, with 21 (100.0% in the age bracket) enrolled. Conversely, the age group of 18 to 19 year olds has the lowest likelihood of being enrolled in a private school, with 57 (100.0% in the age bracket) attending a public institution.
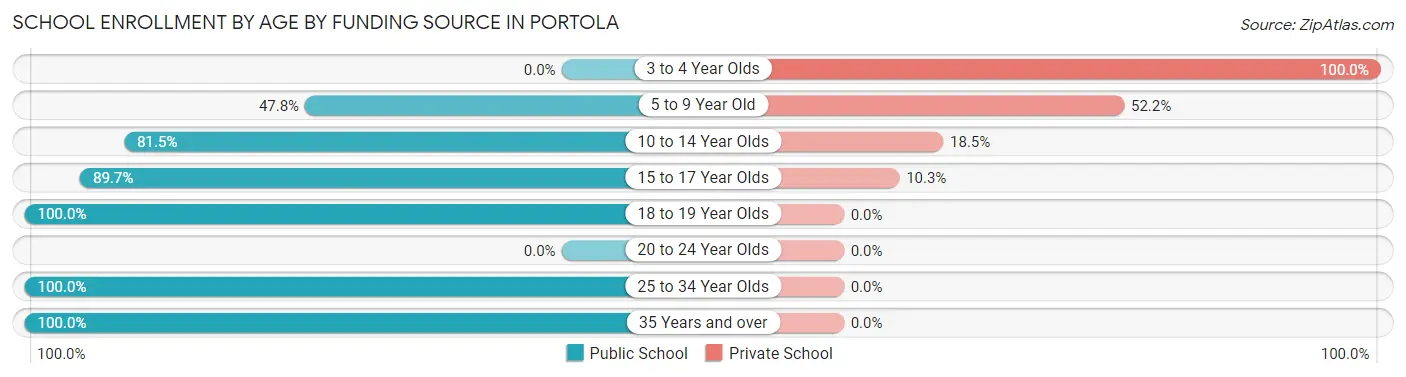
| Age Bracket | Public School | Private School |
| 3 to 4 Year Olds | 0 (0.0%) | 21 (100.0%) |
| 5 to 9 Year Old | 86 (47.8%) | 94 (52.2%) |
| 10 to 14 Year Olds | 110 (81.5%) | 25 (18.5%) |
| 15 to 17 Year Olds | 52 (89.7%) | 6 (10.3%) |
| 18 to 19 Year Olds | 57 (100.0%) | 0 (0.0%) |
| 20 to 24 Year Olds | 0 (0.0%) | 0 (0.0%) |
| 25 to 34 Year Olds | 39 (100.0%) | 0 (0.0%) |
| 35 Years and over | 79 (100.0%) | 0 (0.0%) |
| Total | 423 (74.3%) | 146 (25.7%) |
Educational Attainment by Field of Study in Portola
Education (76 | 35.8%), bio, nature & agricultural (42 | 19.8%), social sciences (24 | 11.3%), science & technology (24 | 11.3%), and business (24 | 11.3%) are the most common fields of study among 212 individuals in Portola who have obtained a bachelor's degree or higher.
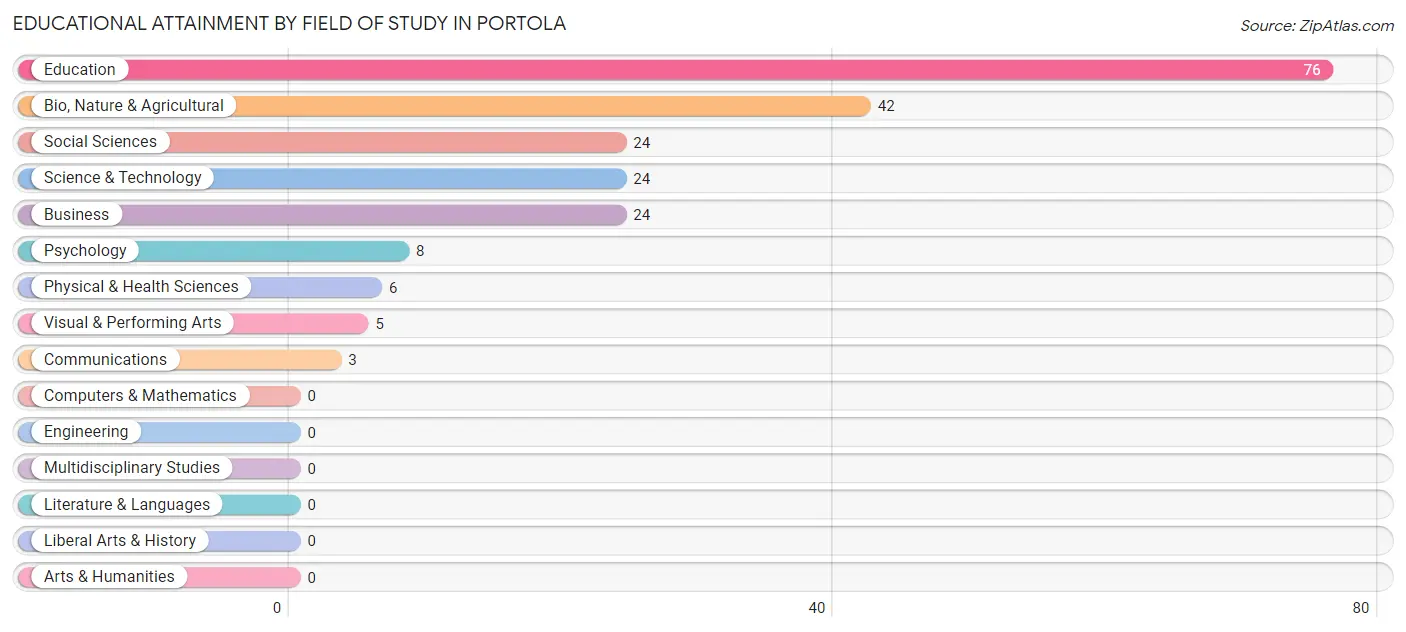
| Field of Study | # Graduates | % Graduates |
| Computers & Mathematics | 0 | 0.0% |
| Bio, Nature & Agricultural | 42 | 19.8% |
| Physical & Health Sciences | 6 | 2.8% |
| Psychology | 8 | 3.8% |
| Social Sciences | 24 | 11.3% |
| Engineering | 0 | 0.0% |
| Multidisciplinary Studies | 0 | 0.0% |
| Science & Technology | 24 | 11.3% |
| Business | 24 | 11.3% |
| Education | 76 | 35.8% |
| Literature & Languages | 0 | 0.0% |
| Liberal Arts & History | 0 | 0.0% |
| Visual & Performing Arts | 5 | 2.4% |
| Communications | 3 | 1.4% |
| Arts & Humanities | 0 | 0.0% |
| Total | 212 | 100.0% |
Transportation & Commute in Portola
Vehicle Availability by Sex in Portola
The most prevalent vehicle ownership categories in Portola are males with 2 vehicles (166, accounting for 38.8%) and females with 2 vehicles (283, making up 30.7%).
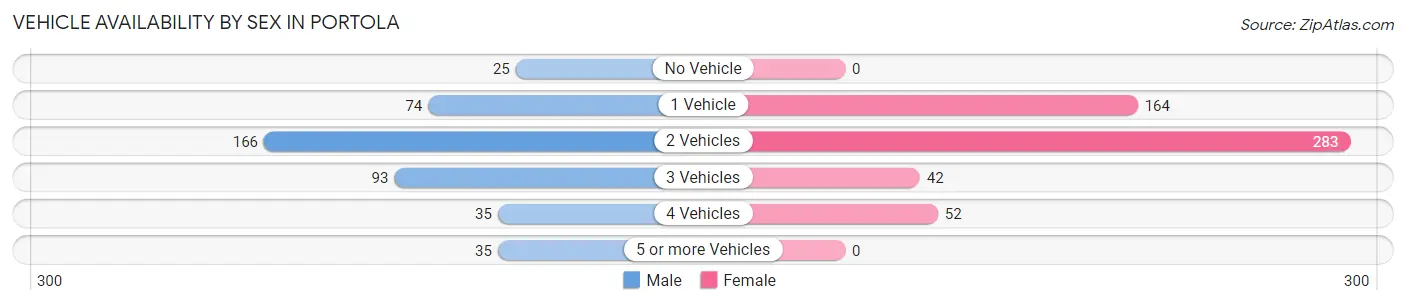
| Vehicles Available | Male | Female |
| No Vehicle | 25 (5.8%) | 0 (0.0%) |
| 1 Vehicle | 74 (17.3%) | 164 (30.3%) |
| 2 Vehicles | 166 (38.8%) | 283 (52.3%) |
| 3 Vehicles | 93 (21.7%) | 42 (7.8%) |
| 4 Vehicles | 35 (8.2%) | 52 (9.6%) |
| 5 or more Vehicles | 35 (8.2%) | 0 (0.0%) |
| Total | 428 (100.0%) | 541 (100.0%) |
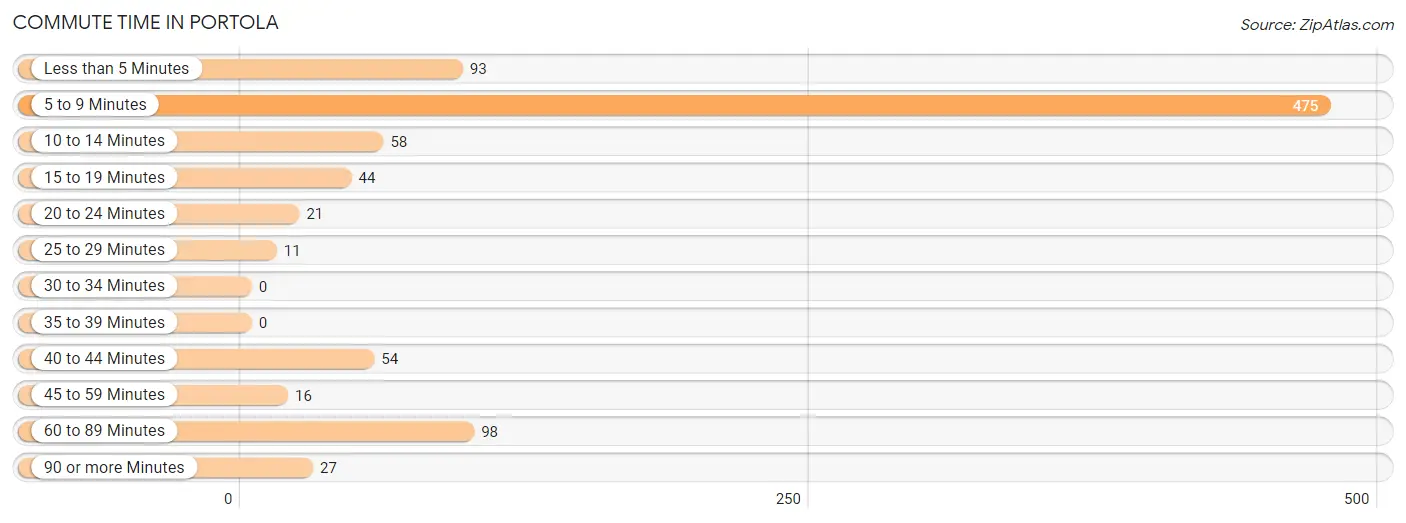
Commute Time in Portola
The most frequently occuring commute durations in Portola are 5 to 9 minutes (475 commuters, 52.9%), 60 to 89 minutes (98 commuters, 10.9%), and less than 5 minutes (93 commuters, 10.4%).
| Commute Time | # Commuters | % Commuters |
| Less than 5 Minutes | 93 | 10.4% |
| 5 to 9 Minutes | 475 | 52.9% |
| 10 to 14 Minutes | 58 | 6.5% |
| 15 to 19 Minutes | 44 | 4.9% |
| 20 to 24 Minutes | 21 | 2.3% |
| 25 to 29 Minutes | 11 | 1.2% |
| 30 to 34 Minutes | 0 | 0.0% |
| 35 to 39 Minutes | 0 | 0.0% |
| 40 to 44 Minutes | 54 | 6.0% |
| 45 to 59 Minutes | 16 | 1.8% |
| 60 to 89 Minutes | 98 | 10.9% |
| 90 or more Minutes | 27 | 3.0% |
Commute Time by Sex in Portola
The most common commute times in Portola are 5 to 9 minutes (129 commuters, 31.8%) for males and 5 to 9 minutes (346 commuters, 70.5%) for females.
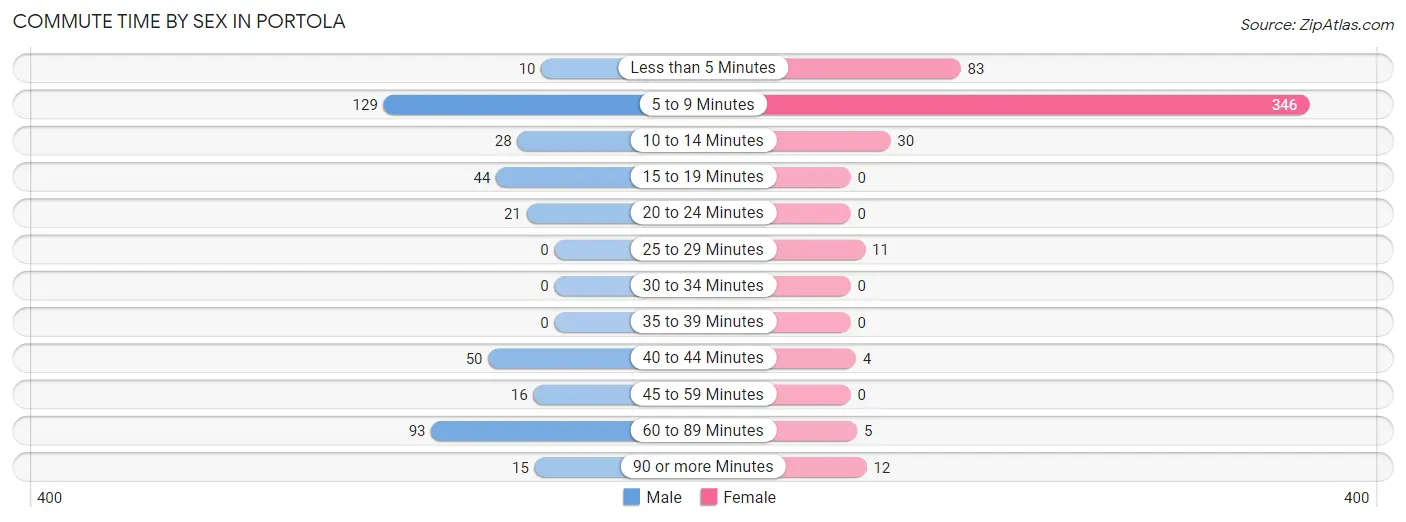
| Commute Time | Male | Female |
| Less than 5 Minutes | 10 (2.5%) | 83 (16.9%) |
| 5 to 9 Minutes | 129 (31.8%) | 346 (70.5%) |
| 10 to 14 Minutes | 28 (6.9%) | 30 (6.1%) |
| 15 to 19 Minutes | 44 (10.8%) | 0 (0.0%) |
| 20 to 24 Minutes | 21 (5.2%) | 0 (0.0%) |
| 25 to 29 Minutes | 0 (0.0%) | 11 (2.2%) |
| 30 to 34 Minutes | 0 (0.0%) | 0 (0.0%) |
| 35 to 39 Minutes | 0 (0.0%) | 0 (0.0%) |
| 40 to 44 Minutes | 50 (12.3%) | 4 (0.8%) |
| 45 to 59 Minutes | 16 (3.9%) | 0 (0.0%) |
| 60 to 89 Minutes | 93 (22.9%) | 5 (1.0%) |
| 90 or more Minutes | 15 (3.7%) | 12 (2.4%) |
Time of Departure to Work by Sex in Portola
The most frequent times of departure to work in Portola are 7:30 AM to 7:59 AM (93, 22.9%) for males and 12:00 AM to 4:59 AM (112, 22.8%) for females.
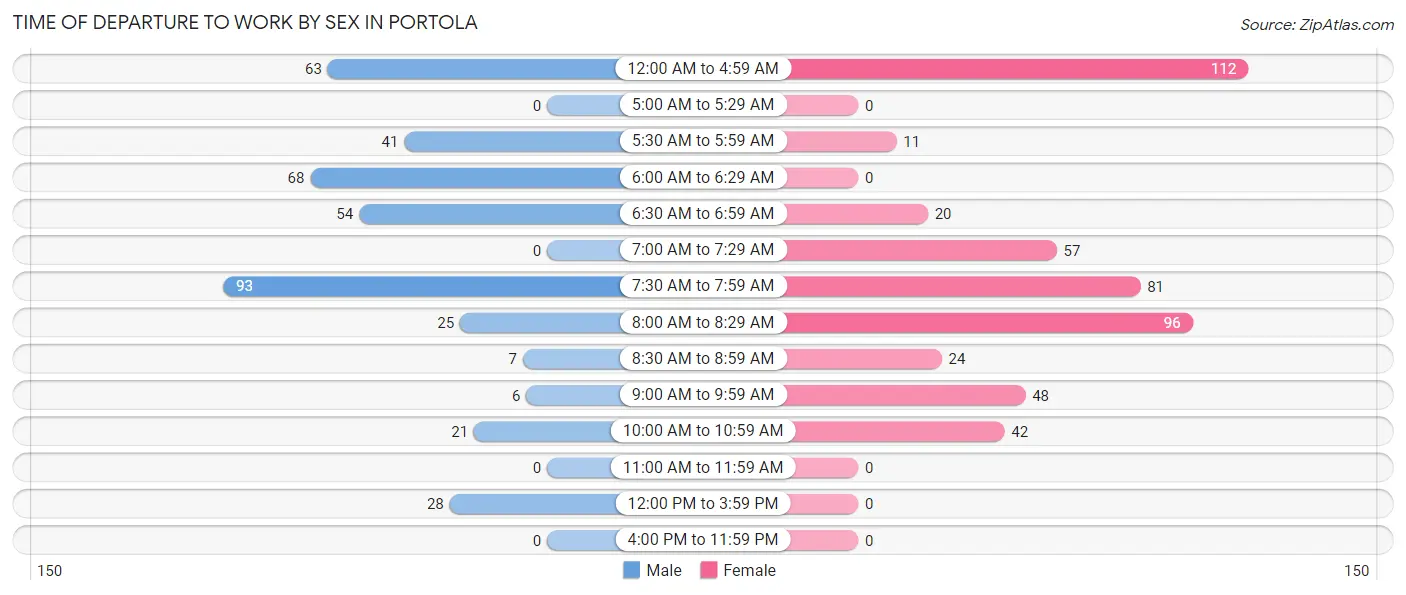
| Time of Departure | Male | Female |
| 12:00 AM to 4:59 AM | 63 (15.5%) | 112 (22.8%) |
| 5:00 AM to 5:29 AM | 0 (0.0%) | 0 (0.0%) |
| 5:30 AM to 5:59 AM | 41 (10.1%) | 11 (2.2%) |
| 6:00 AM to 6:29 AM | 68 (16.8%) | 0 (0.0%) |
| 6:30 AM to 6:59 AM | 54 (13.3%) | 20 (4.1%) |
| 7:00 AM to 7:29 AM | 0 (0.0%) | 57 (11.6%) |
| 7:30 AM to 7:59 AM | 93 (22.9%) | 81 (16.5%) |
| 8:00 AM to 8:29 AM | 25 (6.2%) | 96 (19.6%) |
| 8:30 AM to 8:59 AM | 7 (1.7%) | 24 (4.9%) |
| 9:00 AM to 9:59 AM | 6 (1.5%) | 48 (9.8%) |
| 10:00 AM to 10:59 AM | 21 (5.2%) | 42 (8.6%) |
| 11:00 AM to 11:59 AM | 0 (0.0%) | 0 (0.0%) |
| 12:00 PM to 3:59 PM | 28 (6.9%) | 0 (0.0%) |
| 4:00 PM to 11:59 PM | 0 (0.0%) | 0 (0.0%) |
| Total | 406 (100.0%) | 491 (100.0%) |
Housing Occupancy in Portola
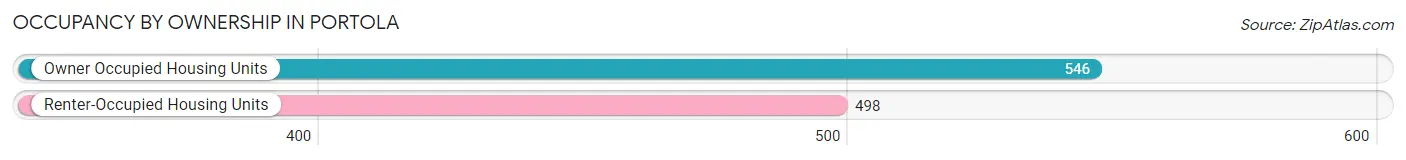
Occupancy by Ownership in Portola
Of the total 1,044 dwellings in Portola, owner-occupied units account for 546 (52.3%), while renter-occupied units make up 498 (47.7%).
| Occupancy | # Housing Units | % Housing Units |
| Owner Occupied Housing Units | 546 | 52.3% |
| Renter-Occupied Housing Units | 498 | 47.7% |
| Total Occupied Housing Units | 1,044 | 100.0% |
Occupancy by Household Size in Portola
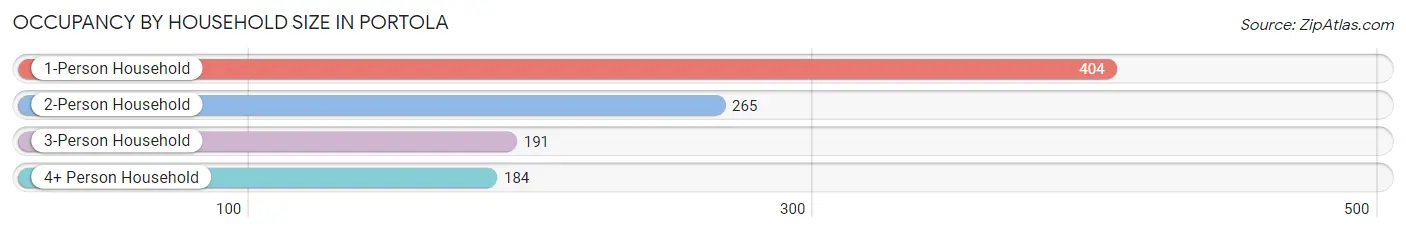
| Household Size | # Housing Units | % Housing Units |
| 1-Person Household | 404 | 38.7% |
| 2-Person Household | 265 | 25.4% |
| 3-Person Household | 191 | 18.3% |
| 4+ Person Household | 184 | 17.6% |
| Total Housing Units | 1,044 | 100.0% |
Occupancy by Ownership by Household Size in Portola
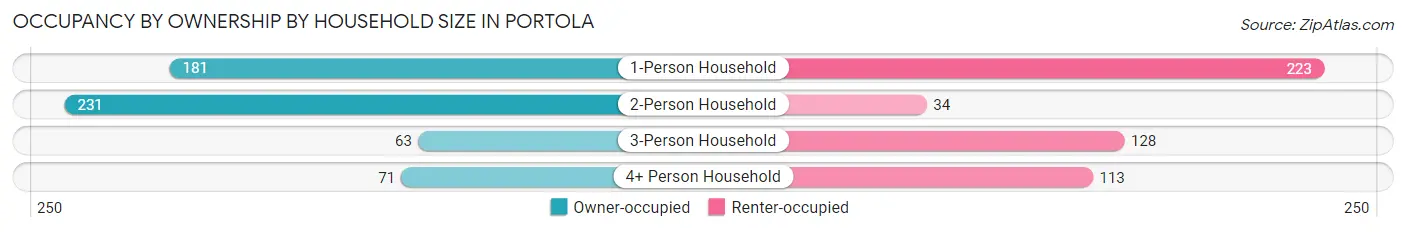
| Household Size | Owner-occupied | Renter-occupied |
| 1-Person Household | 181 (44.8%) | 223 (55.2%) |
| 2-Person Household | 231 (87.2%) | 34 (12.8%) |
| 3-Person Household | 63 (33.0%) | 128 (67.0%) |
| 4+ Person Household | 71 (38.6%) | 113 (61.4%) |
| Total Housing Units | 546 (52.3%) | 498 (47.7%) |
Occupancy by Educational Attainment in Portola
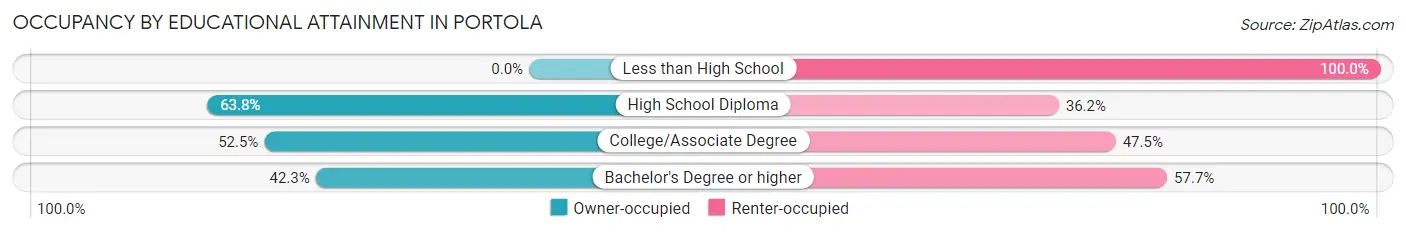
| Household Size | Owner-occupied | Renter-occupied |
| Less than High School | 0 (0.0%) | 26 (100.0%) |
| High School Diploma | 155 (63.8%) | 88 (36.2%) |
| College/Associate Degree | 325 (52.5%) | 294 (47.5%) |
| Bachelor's Degree or higher | 66 (42.3%) | 90 (57.7%) |
Occupancy by Age of Householder in Portola
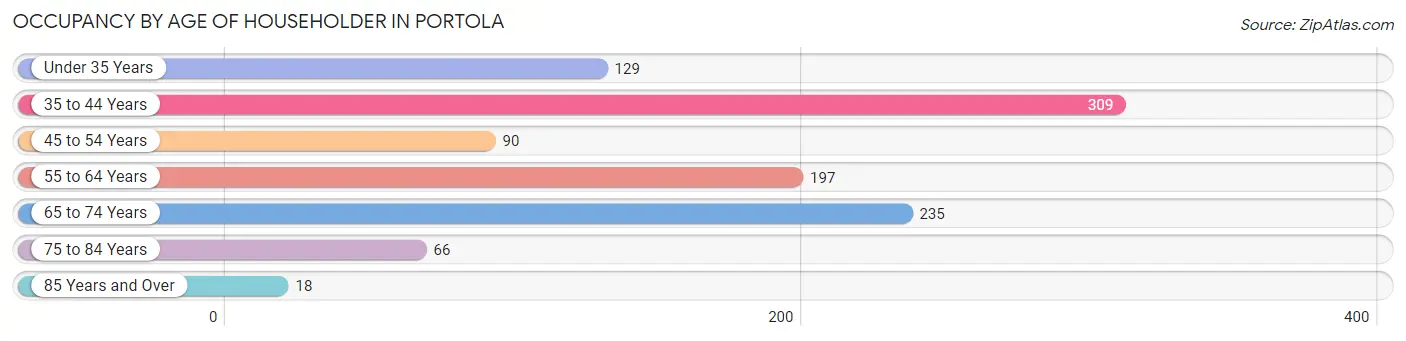
| Age Bracket | # Households | % Households |
| Under 35 Years | 129 | 12.4% |
| 35 to 44 Years | 309 | 29.6% |
| 45 to 54 Years | 90 | 8.6% |
| 55 to 64 Years | 197 | 18.9% |
| 65 to 74 Years | 235 | 22.5% |
| 75 to 84 Years | 66 | 6.3% |
| 85 Years and Over | 18 | 1.7% |
| Total | 1,044 | 100.0% |
Housing Finances in Portola
Median Income by Occupancy in Portola
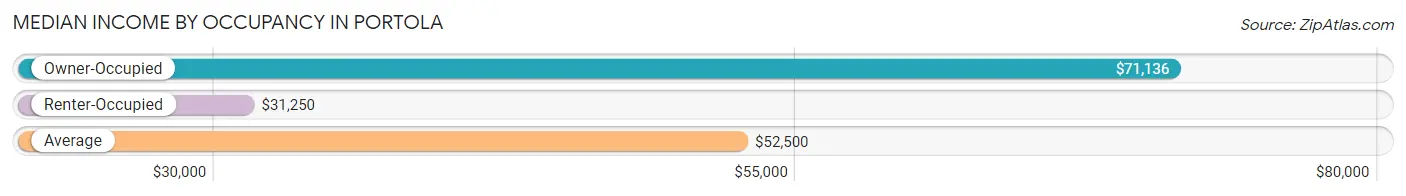
| Occupancy Type | # Households | Median Income |
| Owner-Occupied | 546 (52.3%) | $71,136 |
| Renter-Occupied | 498 (47.7%) | $31,250 |
| Average | 1,044 (100.0%) | $52,500 |
Occupancy by Householder Income Bracket in Portola
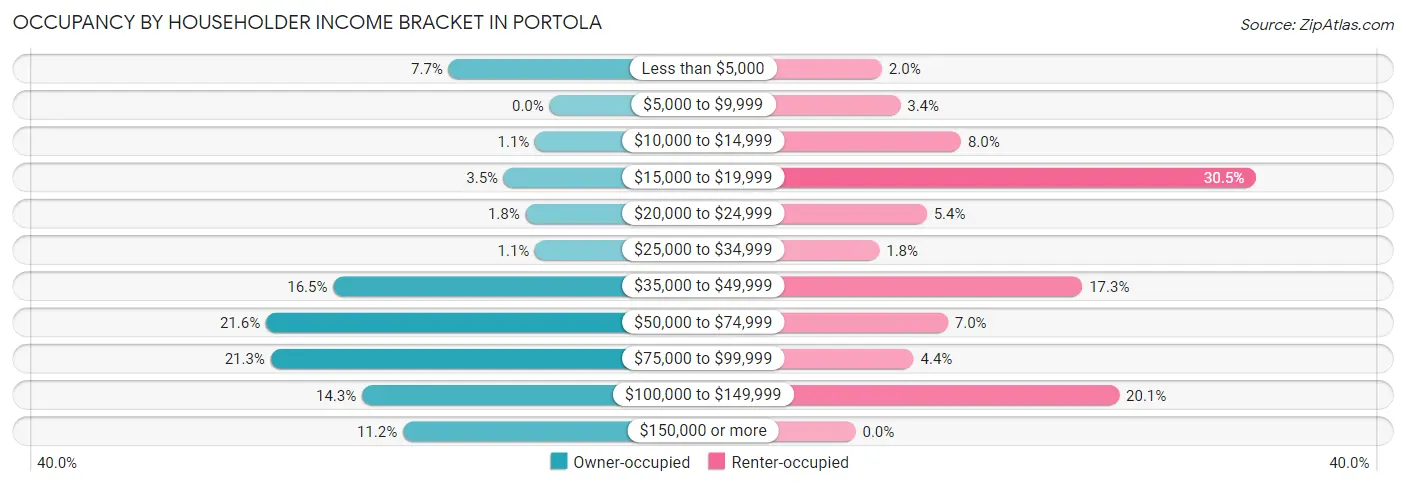
| Income Bracket | Owner-occupied | Renter-occupied |
| Less than $5,000 | 42 (7.7%) | 10 (2.0%) |
| $5,000 to $9,999 | 0 (0.0%) | 17 (3.4%) |
| $10,000 to $14,999 | 6 (1.1%) | 40 (8.0%) |
| $15,000 to $19,999 | 19 (3.5%) | 152 (30.5%) |
| $20,000 to $24,999 | 10 (1.8%) | 27 (5.4%) |
| $25,000 to $34,999 | 6 (1.1%) | 9 (1.8%) |
| $35,000 to $49,999 | 90 (16.5%) | 86 (17.3%) |
| $50,000 to $74,999 | 118 (21.6%) | 35 (7.0%) |
| $75,000 to $99,999 | 116 (21.2%) | 22 (4.4%) |
| $100,000 to $149,999 | 78 (14.3%) | 100 (20.1%) |
| $150,000 or more | 61 (11.2%) | 0 (0.0%) |
| Total | 546 (100.0%) | 498 (100.0%) |
Monthly Housing Cost Tiers in Portola
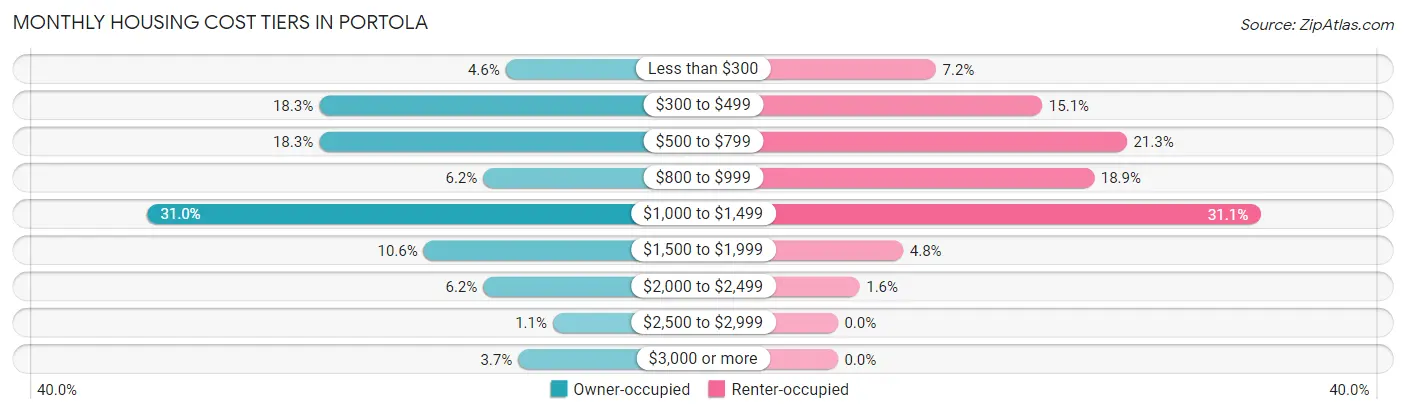
| Monthly Cost | Owner-occupied | Renter-occupied |
| Less than $300 | 25 (4.6%) | 36 (7.2%) |
| $300 to $499 | 100 (18.3%) | 75 (15.1%) |
| $500 to $799 | 100 (18.3%) | 106 (21.3%) |
| $800 to $999 | 34 (6.2%) | 94 (18.9%) |
| $1,000 to $1,499 | 169 (30.9%) | 155 (31.1%) |
| $1,500 to $1,999 | 58 (10.6%) | 24 (4.8%) |
| $2,000 to $2,499 | 34 (6.2%) | 8 (1.6%) |
| $2,500 to $2,999 | 6 (1.1%) | 0 (0.0%) |
| $3,000 or more | 20 (3.7%) | 0 (0.0%) |
| Total | 546 (100.0%) | 498 (100.0%) |
Physical Housing Characteristics in Portola
Housing Structures in Portola
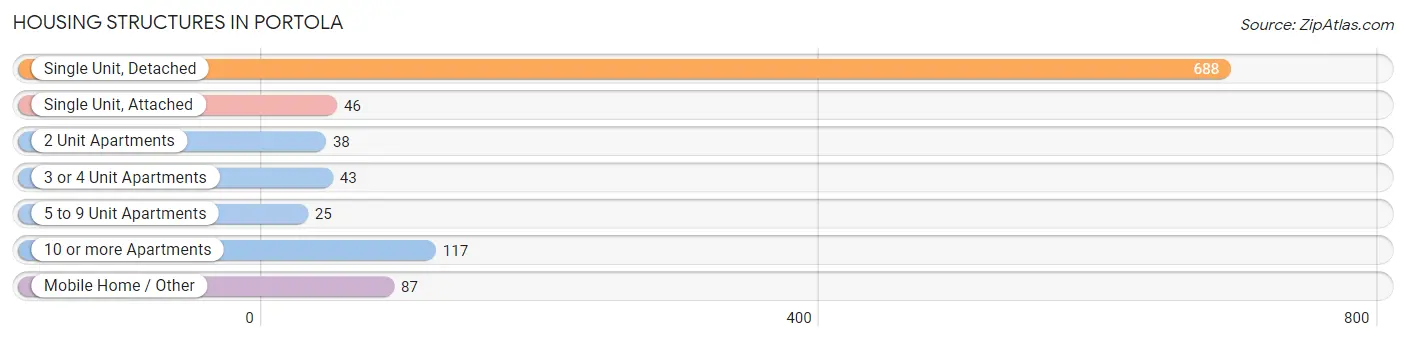
| Structure Type | # Housing Units | % Housing Units |
| Single Unit, Detached | 688 | 65.9% |
| Single Unit, Attached | 46 | 4.4% |
| 2 Unit Apartments | 38 | 3.6% |
| 3 or 4 Unit Apartments | 43 | 4.1% |
| 5 to 9 Unit Apartments | 25 | 2.4% |
| 10 or more Apartments | 117 | 11.2% |
| Mobile Home / Other | 87 | 8.3% |
| Total | 1,044 | 100.0% |
Housing Structures by Occupancy in Portola
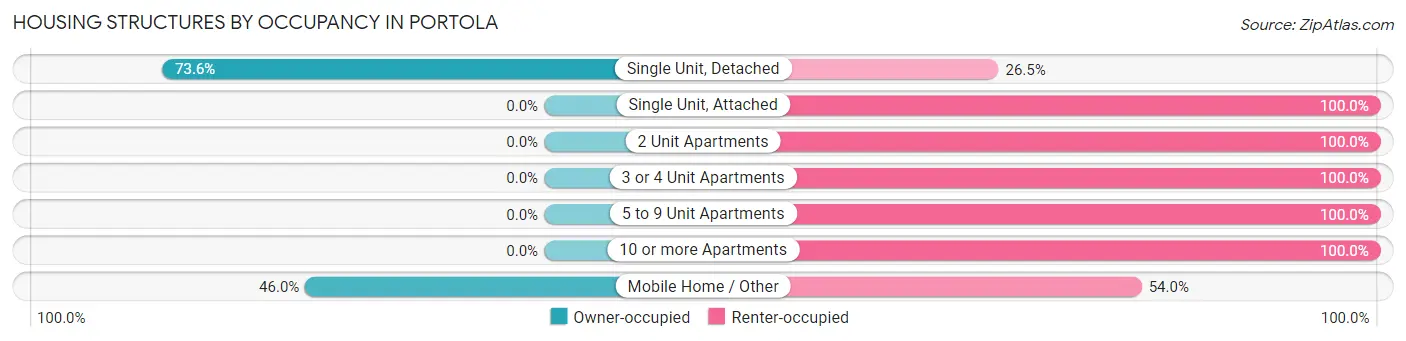
| Structure Type | Owner-occupied | Renter-occupied |
| Single Unit, Detached | 506 (73.6%) | 182 (26.5%) |
| Single Unit, Attached | 0 (0.0%) | 46 (100.0%) |
| 2 Unit Apartments | 0 (0.0%) | 38 (100.0%) |
| 3 or 4 Unit Apartments | 0 (0.0%) | 43 (100.0%) |
| 5 to 9 Unit Apartments | 0 (0.0%) | 25 (100.0%) |
| 10 or more Apartments | 0 (0.0%) | 117 (100.0%) |
| Mobile Home / Other | 40 (46.0%) | 47 (54.0%) |
| Total | 546 (52.3%) | 498 (47.7%) |
Housing Structures by Number of Rooms in Portola
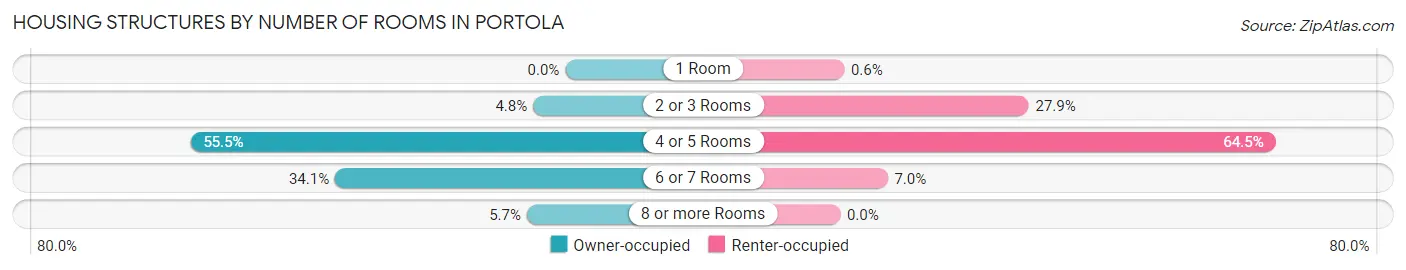
| Number of Rooms | Owner-occupied | Renter-occupied |
| 1 Room | 0 (0.0%) | 3 (0.6%) |
| 2 or 3 Rooms | 26 (4.8%) | 139 (27.9%) |
| 4 or 5 Rooms | 303 (55.5%) | 321 (64.5%) |
| 6 or 7 Rooms | 186 (34.1%) | 35 (7.0%) |
| 8 or more Rooms | 31 (5.7%) | 0 (0.0%) |
| Total | 546 (100.0%) | 498 (100.0%) |
Housing Structure by Heating Type in Portola
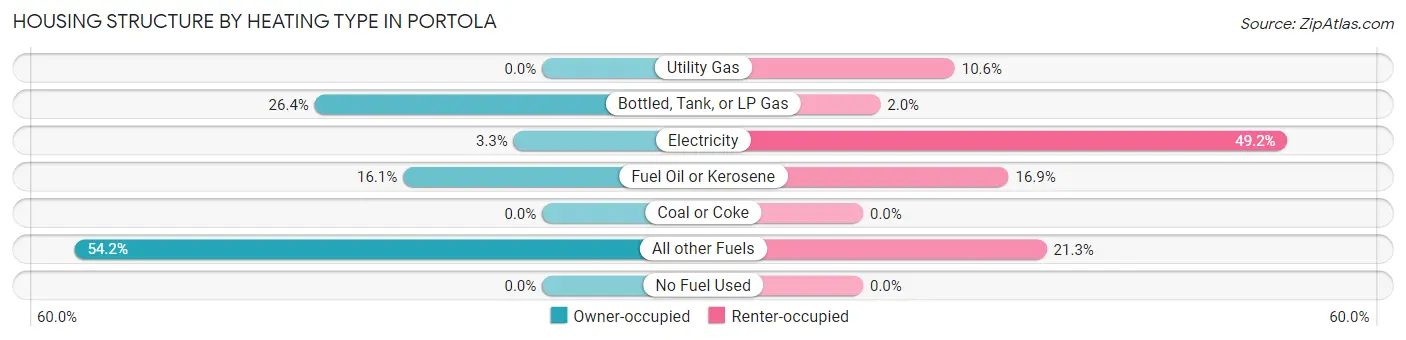
| Heating Type | Owner-occupied | Renter-occupied |
| Utility Gas | 0 (0.0%) | 53 (10.6%) |
| Bottled, Tank, or LP Gas | 144 (26.4%) | 10 (2.0%) |
| Electricity | 18 (3.3%) | 245 (49.2%) |
| Fuel Oil or Kerosene | 88 (16.1%) | 84 (16.9%) |
| Coal or Coke | 0 (0.0%) | 0 (0.0%) |
| All other Fuels | 296 (54.2%) | 106 (21.3%) |
| No Fuel Used | 0 (0.0%) | 0 (0.0%) |
| Total | 546 (100.0%) | 498 (100.0%) |
Household Vehicle Usage in Portola
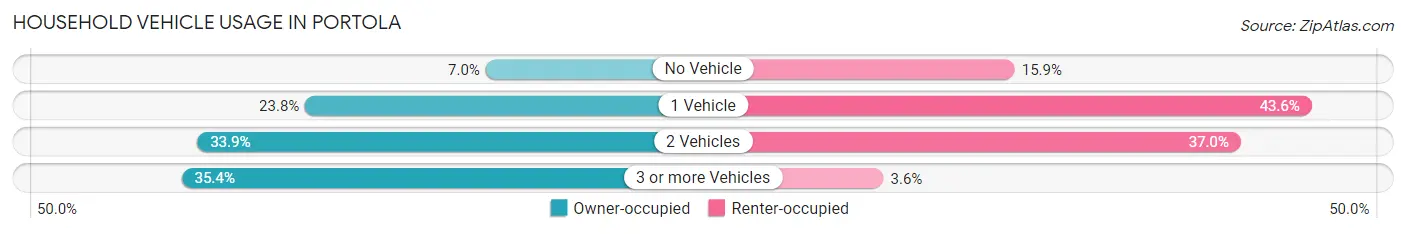
| Vehicles per Household | Owner-occupied | Renter-occupied |
| No Vehicle | 38 (7.0%) | 79 (15.9%) |
| 1 Vehicle | 130 (23.8%) | 217 (43.6%) |
| 2 Vehicles | 185 (33.9%) | 184 (36.9%) |
| 3 or more Vehicles | 193 (35.3%) | 18 (3.6%) |
| Total | 546 (100.0%) | 498 (100.0%) |
Real Estate & Mortgages in Portola
Real Estate and Mortgage Overview in Portola
| Characteristic | Without Mortgage | With Mortgage |
| Housing Units | 241 | 305 |
| Median Property Value | $182,000 | $212,200 |
| Median Household Income | - | - |
| Monthly Housing Costs | $472 | $20 |
| Real Estate Taxes | $650 | $0 |
Property Value by Mortgage Status in Portola
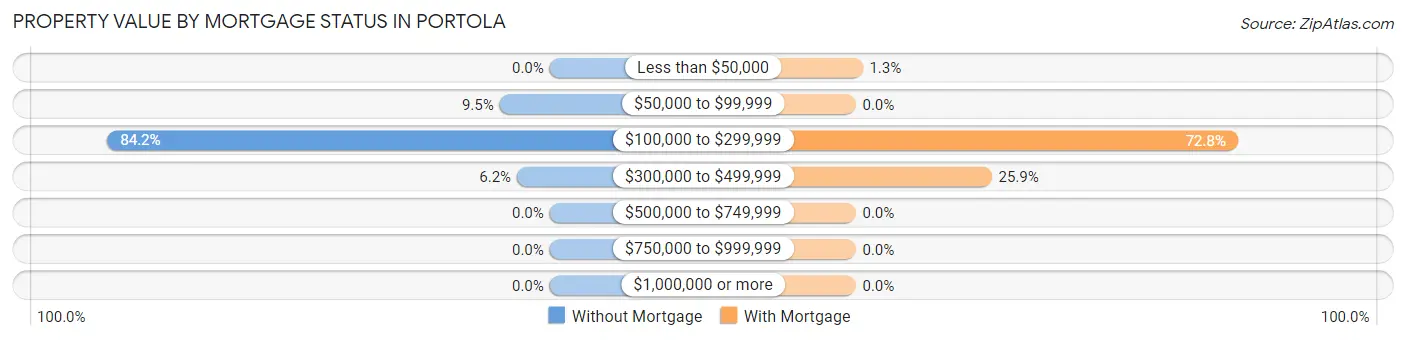
| Property Value | Without Mortgage | With Mortgage |
| Less than $50,000 | 0 (0.0%) | 4 (1.3%) |
| $50,000 to $99,999 | 23 (9.5%) | 0 (0.0%) |
| $100,000 to $299,999 | 203 (84.2%) | 222 (72.8%) |
| $300,000 to $499,999 | 15 (6.2%) | 79 (25.9%) |
| $500,000 to $749,999 | 0 (0.0%) | 0 (0.0%) |
| $750,000 to $999,999 | 0 (0.0%) | 0 (0.0%) |
| $1,000,000 or more | 0 (0.0%) | 0 (0.0%) |
| Total | 241 (100.0%) | 305 (100.0%) |
Household Income by Mortgage Status in Portola
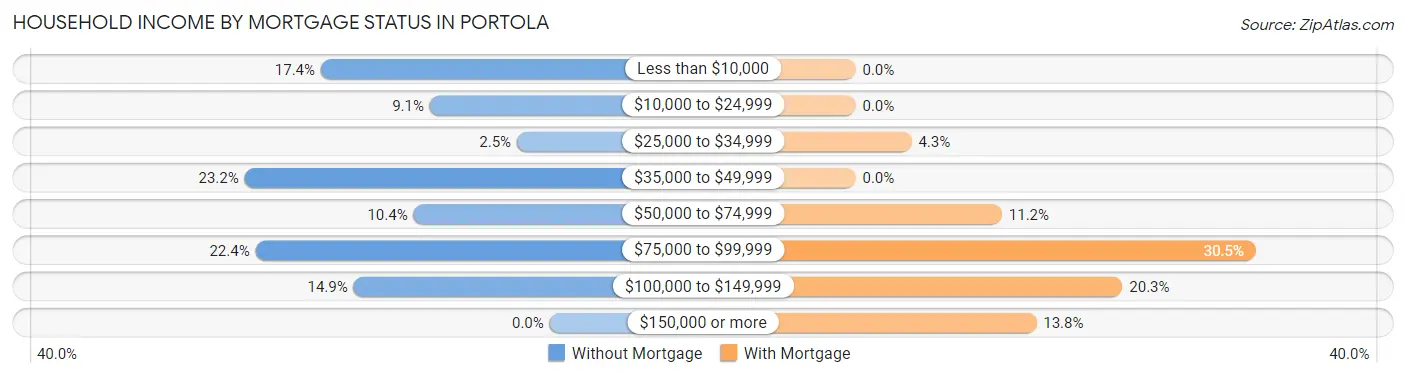
| Household Income | Without Mortgage | With Mortgage |
| Less than $10,000 | 42 (17.4%) | 0 (0.0%) |
| $10,000 to $24,999 | 22 (9.1%) | 0 (0.0%) |
| $25,000 to $34,999 | 6 (2.5%) | 13 (4.3%) |
| $35,000 to $49,999 | 56 (23.2%) | 0 (0.0%) |
| $50,000 to $74,999 | 25 (10.4%) | 34 (11.2%) |
| $75,000 to $99,999 | 54 (22.4%) | 93 (30.5%) |
| $100,000 to $149,999 | 36 (14.9%) | 62 (20.3%) |
| $150,000 or more | 0 (0.0%) | 42 (13.8%) |
| Total | 241 (100.0%) | 305 (100.0%) |
Property Value to Household Income Ratio in Portola
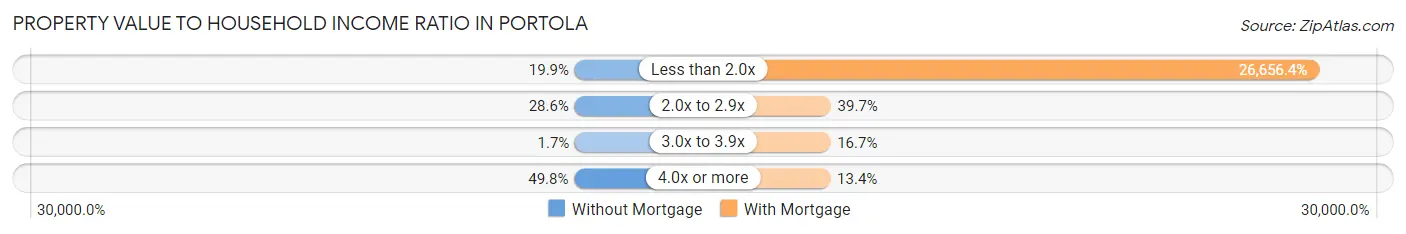
| Value-to-Income Ratio | Without Mortgage | With Mortgage |
| Less than 2.0x | 48 (19.9%) | 81,302 (26,656.4%) |
| 2.0x to 2.9x | 69 (28.6%) | 121 (39.7%) |
| 3.0x to 3.9x | 4 (1.7%) | 51 (16.7%) |
| 4.0x or more | 120 (49.8%) | 41 (13.4%) |
| Total | 241 (100.0%) | 305 (100.0%) |
Real Estate Taxes by Mortgage Status in Portola
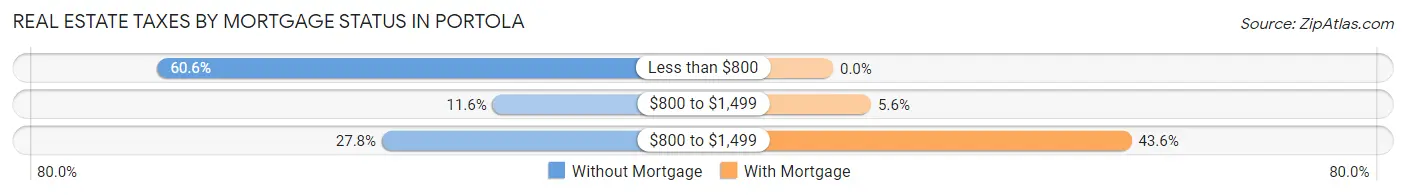
| Property Taxes | Without Mortgage | With Mortgage |
| Less than $800 | 146 (60.6%) | 0 (0.0%) |
| $800 to $1,499 | 28 (11.6%) | 17 (5.6%) |
| $800 to $1,499 | 67 (27.8%) | 133 (43.6%) |
| Total | 241 (100.0%) | 305 (100.0%) |
Health & Disability in Portola
Health Insurance Coverage by Age in Portola
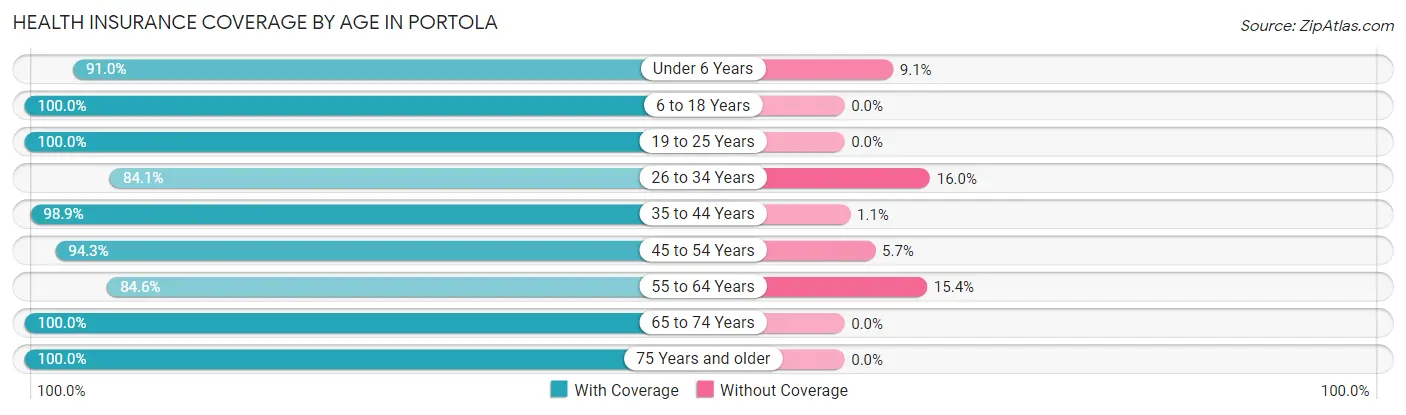
| Age Bracket | With Coverage | Without Coverage |
| Under 6 Years | 211 (90.9%) | 21 (9.0%) |
| 6 to 18 Years | 396 (100.0%) | 0 (0.0%) |
| 19 to 25 Years | 188 (100.0%) | 0 (0.0%) |
| 26 to 34 Years | 137 (84.1%) | 26 (16.0%) |
| 35 to 44 Years | 459 (98.9%) | 5 (1.1%) |
| 45 to 54 Years | 230 (94.3%) | 14 (5.7%) |
| 55 to 64 Years | 291 (84.6%) | 53 (15.4%) |
| 65 to 74 Years | 278 (100.0%) | 0 (0.0%) |
| 75 Years and older | 97 (100.0%) | 0 (0.0%) |
| Total | 2,287 (95.1%) | 119 (5.0%) |
Health Insurance Coverage by Citizenship Status in Portola
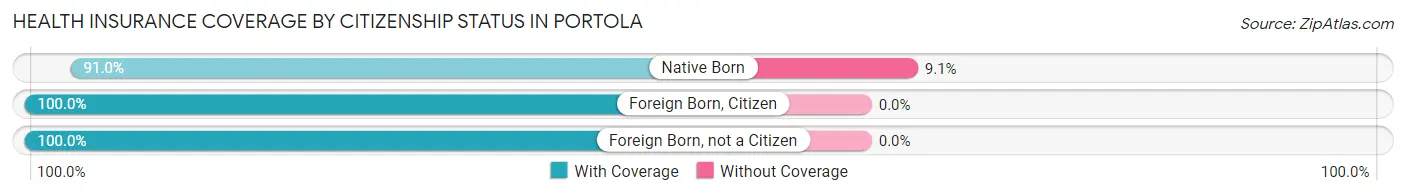
| Citizenship Status | With Coverage | Without Coverage |
| Native Born | 211 (90.9%) | 21 (9.0%) |
| Foreign Born, Citizen | 396 (100.0%) | 0 (0.0%) |
| Foreign Born, not a Citizen | 188 (100.0%) | 0 (0.0%) |
Health Insurance Coverage by Household Income in Portola
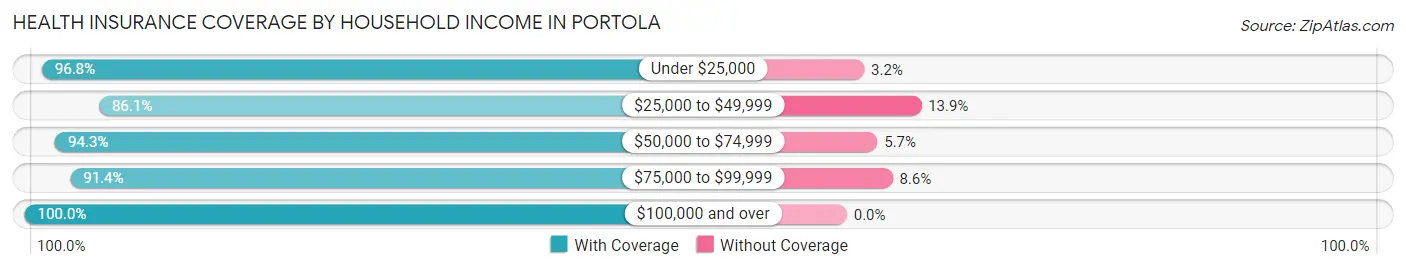
| Household Income | With Coverage | Without Coverage |
| Under $25,000 | 507 (96.8%) | 17 (3.2%) |
| $25,000 to $49,999 | 321 (86.1%) | 52 (13.9%) |
| $50,000 to $74,999 | 413 (94.3%) | 25 (5.7%) |
| $75,000 to $99,999 | 267 (91.4%) | 25 (8.6%) |
| $100,000 and over | 751 (100.0%) | 0 (0.0%) |
Public vs Private Health Insurance Coverage by Age in Portola
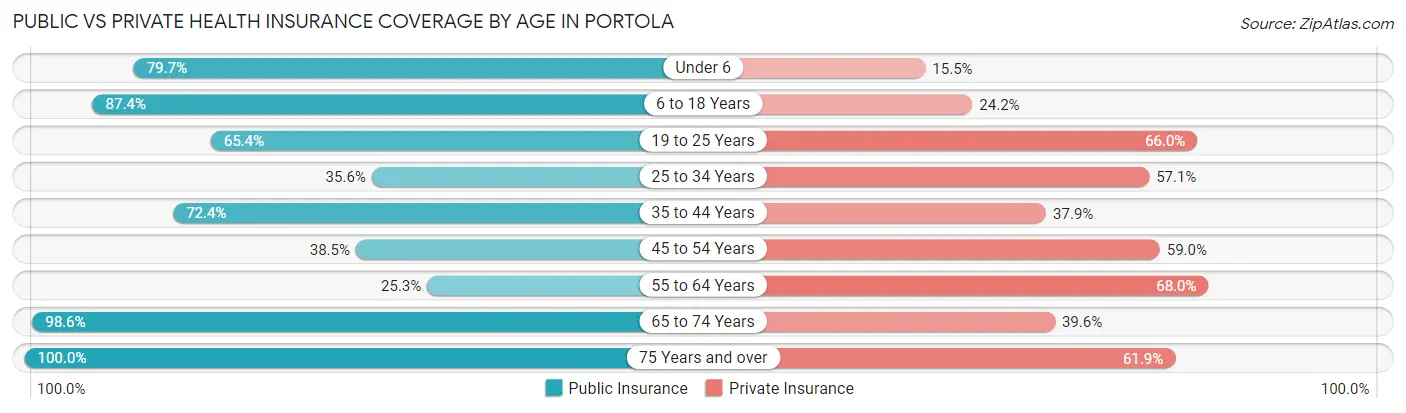
| Age Bracket | Public Insurance | Private Insurance |
| Under 6 | 185 (79.7%) | 36 (15.5%) |
| 6 to 18 Years | 346 (87.4%) | 96 (24.2%) |
| 19 to 25 Years | 123 (65.4%) | 124 (66.0%) |
| 25 to 34 Years | 58 (35.6%) | 93 (57.1%) |
| 35 to 44 Years | 336 (72.4%) | 176 (37.9%) |
| 45 to 54 Years | 94 (38.5%) | 144 (59.0%) |
| 55 to 64 Years | 87 (25.3%) | 234 (68.0%) |
| 65 to 74 Years | 274 (98.6%) | 110 (39.6%) |
| 75 Years and over | 97 (100.0%) | 60 (61.9%) |
| Total | 1,600 (66.5%) | 1,073 (44.6%) |
Disability Status by Sex by Age in Portola
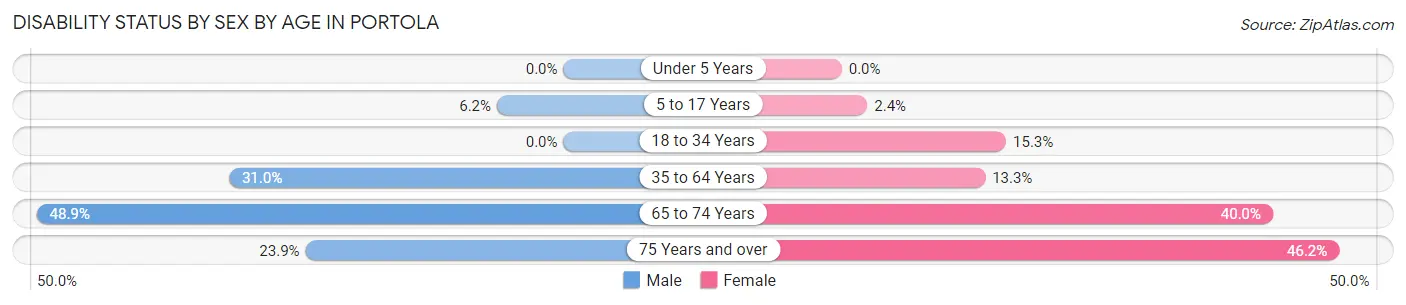
| Age Bracket | Male | Female |
| Under 5 Years | 0 (0.0%) | 0 (0.0%) |
| 5 to 17 Years | 10 (6.2%) | 5 (2.4%) |
| 18 to 34 Years | 0 (0.0%) | 34 (15.2%) |
| 35 to 64 Years | 126 (31.0%) | 86 (13.3%) |
| 65 to 74 Years | 87 (48.9%) | 40 (40.0%) |
| 75 Years and over | 17 (23.9%) | 12 (46.2%) |
Disability Class by Sex by Age in Portola
Disability Class: Hearing Difficulty
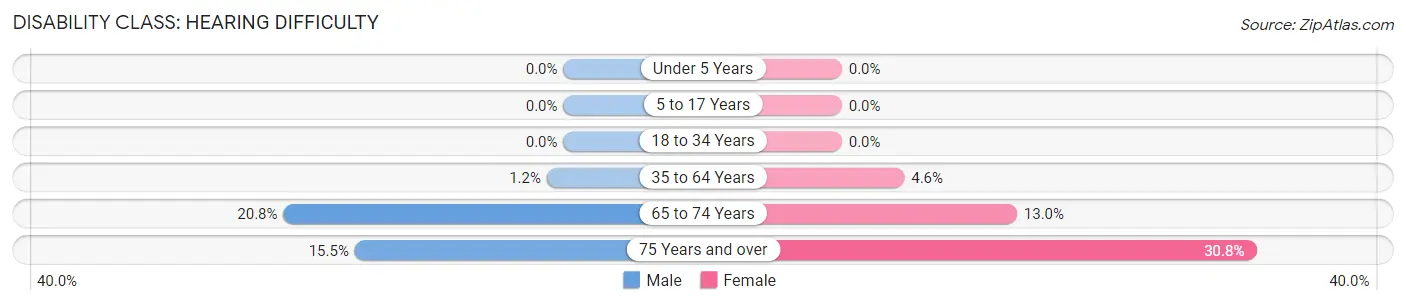
| Age Bracket | Male | Female |
| Under 5 Years | 0 (0.0%) | 0 (0.0%) |
| 5 to 17 Years | 0 (0.0%) | 0 (0.0%) |
| 18 to 34 Years | 0 (0.0%) | 0 (0.0%) |
| 35 to 64 Years | 5 (1.2%) | 30 (4.6%) |
| 65 to 74 Years | 37 (20.8%) | 13 (13.0%) |
| 75 Years and over | 11 (15.5%) | 8 (30.8%) |
Disability Class: Vision Difficulty
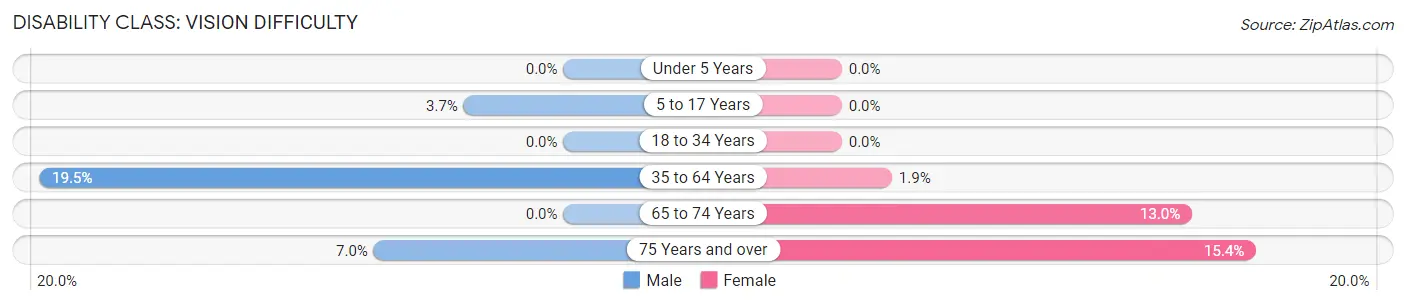
| Age Bracket | Male | Female |
| Under 5 Years | 0 (0.0%) | 0 (0.0%) |
| 5 to 17 Years | 6 (3.7%) | 0 (0.0%) |
| 18 to 34 Years | 0 (0.0%) | 0 (0.0%) |
| 35 to 64 Years | 79 (19.5%) | 12 (1.9%) |
| 65 to 74 Years | 0 (0.0%) | 13 (13.0%) |
| 75 Years and over | 5 (7.0%) | 4 (15.4%) |
Disability Class: Cognitive Difficulty
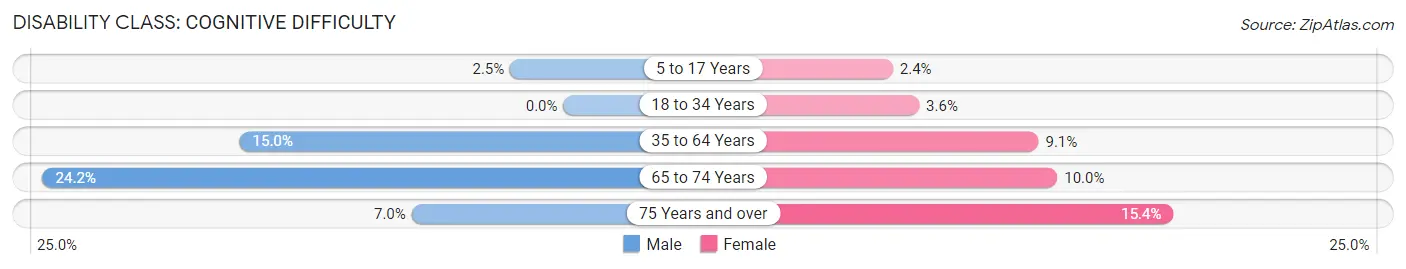
| Age Bracket | Male | Female |
| 5 to 17 Years | 4 (2.5%) | 5 (2.4%) |
| 18 to 34 Years | 0 (0.0%) | 8 (3.6%) |
| 35 to 64 Years | 61 (15.0%) | 59 (9.1%) |
| 65 to 74 Years | 43 (24.2%) | 10 (10.0%) |
| 75 Years and over | 5 (7.0%) | 4 (15.4%) |
Disability Class: Ambulatory Difficulty
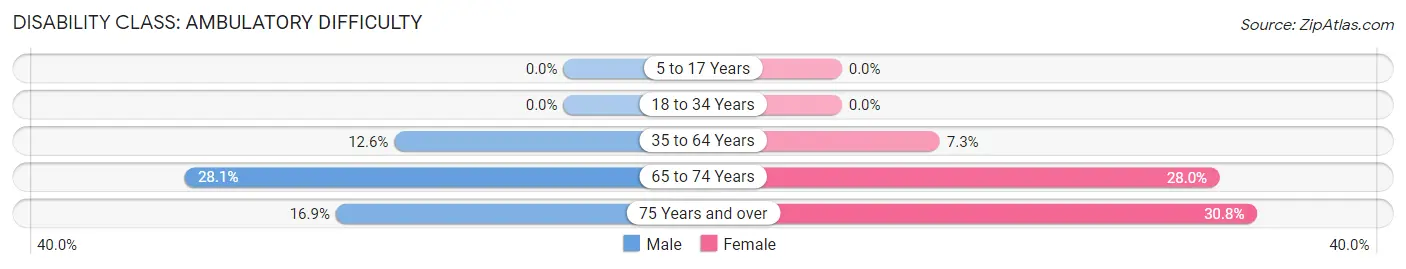
| Age Bracket | Male | Female |
| 5 to 17 Years | 0 (0.0%) | 0 (0.0%) |
| 18 to 34 Years | 0 (0.0%) | 0 (0.0%) |
| 35 to 64 Years | 51 (12.6%) | 47 (7.3%) |
| 65 to 74 Years | 50 (28.1%) | 28 (28.0%) |
| 75 Years and over | 12 (16.9%) | 8 (30.8%) |
Disability Class: Self-Care Difficulty
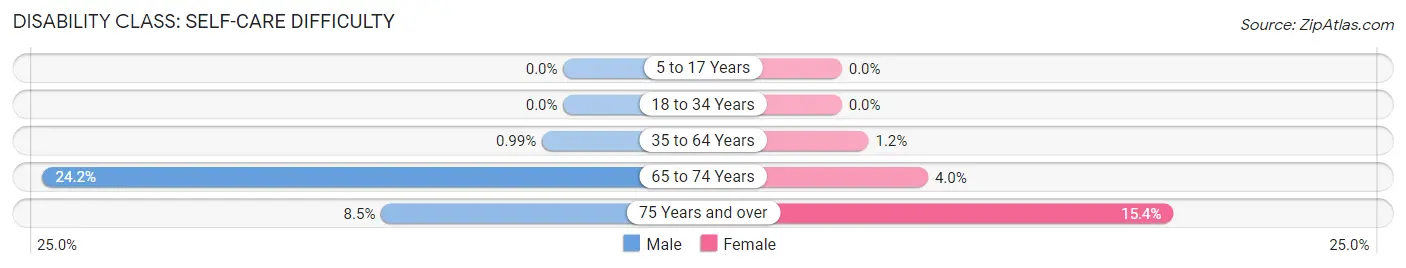
| Age Bracket | Male | Female |
| 5 to 17 Years | 0 (0.0%) | 0 (0.0%) |
| 18 to 34 Years | 0 (0.0%) | 0 (0.0%) |
| 35 to 64 Years | 4 (1.0%) | 8 (1.2%) |
| 65 to 74 Years | 43 (24.2%) | 4 (4.0%) |
| 75 Years and over | 6 (8.5%) | 4 (15.4%) |
Technology Access in Portola
Computing Device Access in Portola
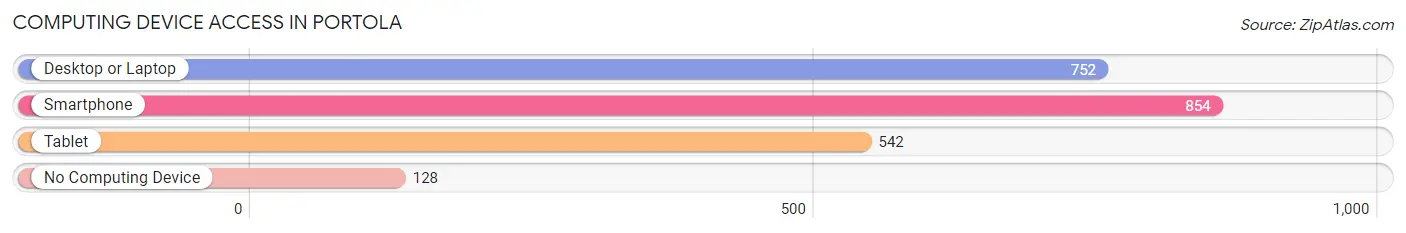
| Device Type | # Households | % Households |
| Desktop or Laptop | 752 | 72.0% |
| Smartphone | 854 | 81.8% |
| Tablet | 542 | 51.9% |
| No Computing Device | 128 | 12.3% |
| Total | 1,044 | 100.0% |
Internet Access in Portola
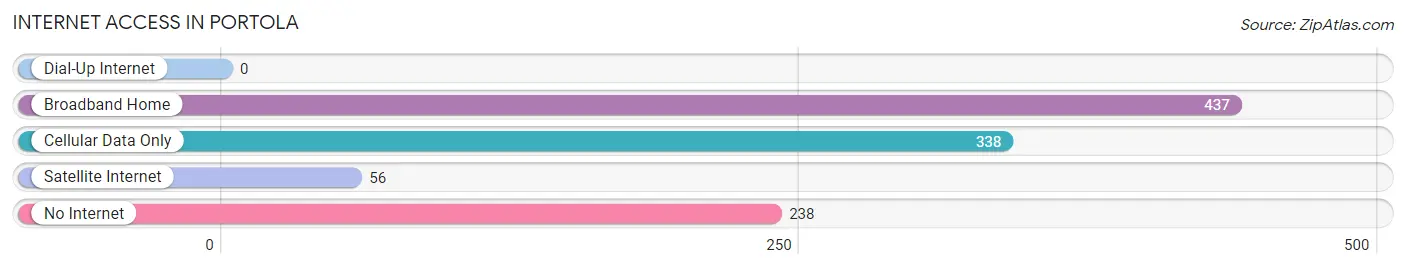
| Internet Type | # Households | % Households |
| Dial-Up Internet | 0 | 0.0% |
| Broadband Home | 437 | 41.9% |
| Cellular Data Only | 338 | 32.4% |
| Satellite Internet | 56 | 5.4% |
| No Internet | 238 | 22.8% |
| Total | 1,044 | 100.0% |
Portola Summary
Portola, California is a small city located in Plumas County, in the Sierra Nevada mountain range. It is situated at an elevation of 4,735 feet and is the county seat of Plumas County. The city has a population of 2,104 as of the 2010 census.
History
Portola was founded in 1856 by a group of miners who were searching for gold in the area. The town was named after Spanish explorer Gaspar de Portola, who was the first European to explore the area in 1769. The town was incorporated in 1874 and was the first incorporated city in Plumas County.
In the late 19th century, Portola was a bustling center of commerce and industry. It was home to several sawmills, a brickyard, a tannery, and a woolen mill. The town also had a railroad station, which connected it to the rest of the state.
In the early 20th century, the timber industry began to decline and the town’s economy shifted to agriculture. The town was also home to a large number of Italian immigrants who worked in the local farms and ranches.
Geography
Portola is located in the Sierra Nevada mountain range, at an elevation of 4,735 feet. The city is situated in a valley surrounded by mountains, including the Sierra Buttes to the east and the Sierra Nevada to the west. The city is located on the Middle Fork of the Feather River, which flows through the city.
The climate in Portola is classified as a Mediterranean climate, with hot, dry summers and cool, wet winters. The average annual temperature is 54°F, with an average high of 79°F in the summer and an average low of 28°F in the winter.
Economy
The economy of Portola is largely based on agriculture and tourism. The city is home to several farms and ranches, which produce a variety of crops, including hay, alfalfa, wheat, and oats. The city is also home to several wineries, which produce a variety of wines.
Tourism is also an important part of the local economy. The city is home to several attractions, including the Plumas County Museum, the Portola Railroad Museum, and the Sierra Buttes Lookout Tower. The city is also home to several outdoor recreation areas, including the Lakes Basin Recreation Area and the Sierra Valley Wildlife Area.
Demographics
As of the 2010 census, the population of Portola was 2,104. The racial makeup of the city was 91.2% White, 0.7% African American, 0.7% Native American, 0.7% Asian, 0.2% Pacific Islander, 4.2% from other races, and 2.2% from two or more races. Hispanic or Latino of any race were 8.2% of the population.
The median household income in Portola was $37,917, and the median family income was $45,938. The per capita income for the city was $20,945. About 11.2% of families and 14.2% of the population were below the poverty line, including 19.2% of those under age 18 and 8.2% of those age 65 or over.
Portola is a small city with a rich history and a diverse economy. The city is home to a variety of industries, including agriculture, tourism, and winemaking. The city is also home to a diverse population, with a variety of ethnic backgrounds. Portola is a great place to live, work, and visit.
Common Questions
What is Per Capita Income in Portola?
Per Capita income in Portola is $29,739.
What is the Median Family Income in Portola?
Median Family Income in Portola is $71,146.
What is the Median Household income in Portola?
Median Household Income in Portola is $52,500.
What is Income or Wage Gap in Portola?
Income or Wage Gap in Portola is 62.0%.
Women in Portola earn 38.0 cents for every dollar earned by a man.
What is Inequality or Gini Index in Portola?
Inequality or Gini Index in Portola is 0.50.
What is the Total Population of Portola?
Total Population of Portola is 2,427.
What is the Total Male Population of Portola?
Total Male Population of Portola is 1,078.
What is the Total Female Population of Portola?
Total Female Population of Portola is 1,349.
What is the Ratio of Males per 100 Females in Portola?
There are 79.91 Males per 100 Females in Portola.
What is the Ratio of Females per 100 Males in Portola?
There are 125.14 Females per 100 Males in Portola.
What is the Median Population Age in Portola?
Median Population Age in Portola is 39.6 Years.
What is the Average Family Size in Portola
Average Family Size in Portola is 3.0 People.
What is the Average Household Size in Portola
Average Household Size in Portola is 2.3 People.
How Large is the Labor Force in Portola?
There are 1,095 People in the Labor Forcein in Portola.
What is the Percentage of People in the Labor Force in Portola?
58.1% of People are in the Labor Force in Portola.
What is the Unemployment Rate in Portola?
Unemployment Rate in Portola is 7.0%.