Pollock Pines, CA Map & Demographics
Pollock Pines Map
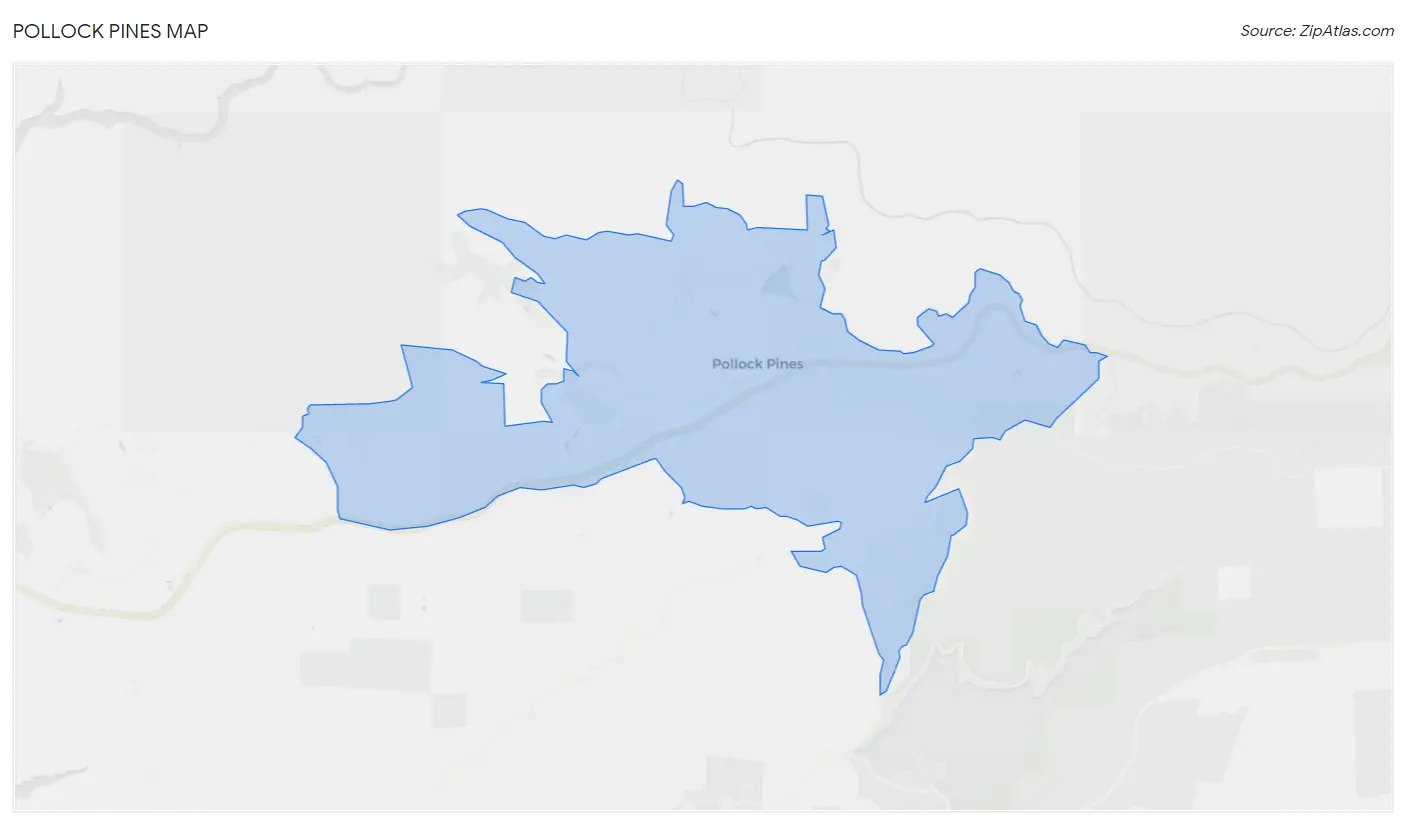
Pollock Pines Overview
$42,927
PER CAPITA INCOME
$88,583
AVG FAMILY INCOME
$70,489
AVG HOUSEHOLD INCOME
40.4%
WAGE / INCOME GAP [ % ]
59.6¢/ $1
WAGE / INCOME GAP [ $ ]
0.48
INEQUALITY / GINI INDEX
5,917
TOTAL POPULATION
3,068
MALE POPULATION
2,849
FEMALE POPULATION
107.69
MALES / 100 FEMALES
92.86
FEMALES / 100 MALES
45.8
MEDIAN AGE
2.8
AVG FAMILY SIZE
2.2
AVG HOUSEHOLD SIZE
2,686
LABOR FORCE [ PEOPLE ]
54.5%
PERCENT IN LABOR FORCE
5.2%
UNEMPLOYMENT RATE
Pollock Pines Zip Codes
Pollock Pines Area Codes
Income in Pollock Pines
Income Overview in Pollock Pines
Per Capita Income in Pollock Pines is $42,927, while median incomes of families and households are $88,583 and $70,489 respectively.
| Characteristic | Number | Measure |
| Per Capita Income | 5,917 | $42,927 |
| Median Family Income | 1,497 | $88,583 |
| Mean Family Income | 1,497 | $104,619 |
| Median Household Income | 2,712 | $70,489 |
| Mean Household Income | 2,712 | $93,576 |
| Income Deficit | 1,497 | $0 |
| Wage / Income Gap (%) | 5,917 | 40.36% |
| Wage / Income Gap ($) | 5,917 | 59.64¢ per $1 |
| Gini / Inequality Index | 5,917 | 0.48 |
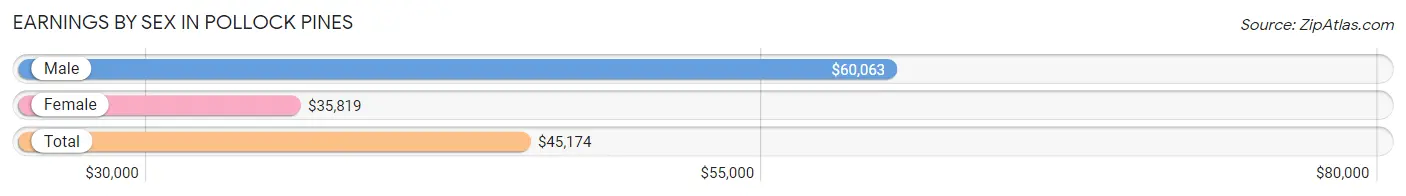
Earnings by Sex in Pollock Pines
Average Earnings in Pollock Pines are $45,174, $60,063 for men and $35,819 for women, a difference of 40.4%.
| Sex | Number | Average Earnings |
| Male | 1,723 (60.7%) | $60,063 |
| Female | 1,115 (39.3%) | $35,819 |
| Total | 2,838 (100.0%) | $45,174 |
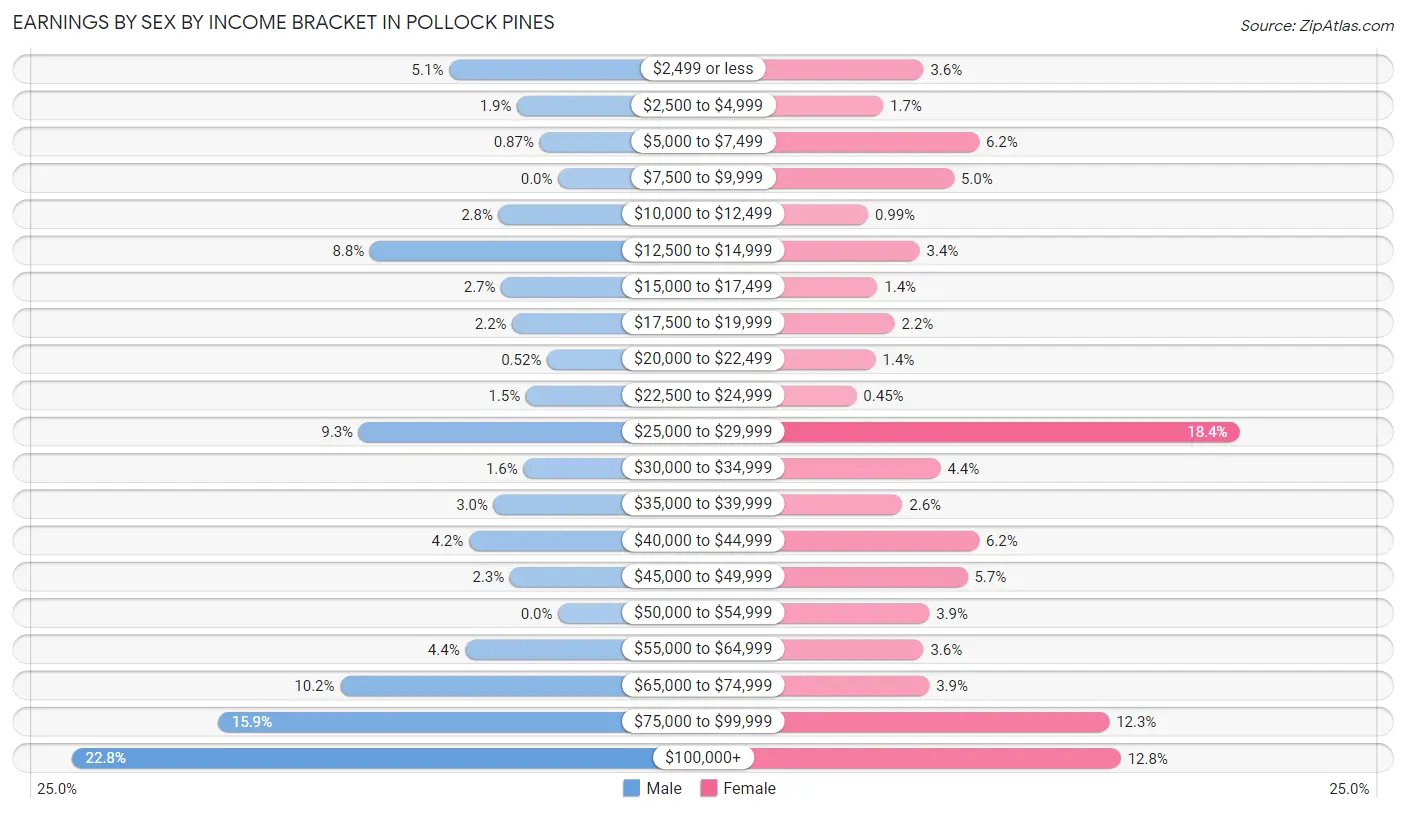
Earnings by Sex by Income Bracket in Pollock Pines
The most common earnings brackets in Pollock Pines are $100,000+ for men (392 | 22.8%) and $25,000 to $29,999 for women (205 | 18.4%).
| Income | Male | Female |
| $2,499 or less | 88 (5.1%) | 40 (3.6%) |
| $2,500 to $4,999 | 33 (1.9%) | 19 (1.7%) |
| $5,000 to $7,499 | 15 (0.9%) | 69 (6.2%) |
| $7,500 to $9,999 | 0 (0.0%) | 56 (5.0%) |
| $10,000 to $12,499 | 48 (2.8%) | 11 (1.0%) |
| $12,500 to $14,999 | 152 (8.8%) | 38 (3.4%) |
| $15,000 to $17,499 | 46 (2.7%) | 16 (1.4%) |
| $17,500 to $19,999 | 37 (2.1%) | 25 (2.2%) |
| $20,000 to $22,499 | 9 (0.5%) | 15 (1.3%) |
| $22,500 to $24,999 | 26 (1.5%) | 5 (0.4%) |
| $25,000 to $29,999 | 161 (9.3%) | 205 (18.4%) |
| $30,000 to $34,999 | 28 (1.6%) | 49 (4.4%) |
| $35,000 to $39,999 | 52 (3.0%) | 29 (2.6%) |
| $40,000 to $44,999 | 72 (4.2%) | 69 (6.2%) |
| $45,000 to $49,999 | 39 (2.3%) | 63 (5.7%) |
| $50,000 to $54,999 | 0 (0.0%) | 43 (3.9%) |
| $55,000 to $64,999 | 75 (4.3%) | 40 (3.6%) |
| $65,000 to $74,999 | 176 (10.2%) | 43 (3.9%) |
| $75,000 to $99,999 | 274 (15.9%) | 137 (12.3%) |
| $100,000+ | 392 (22.8%) | 143 (12.8%) |
| Total | 1,723 (100.0%) | 1,115 (100.0%) |
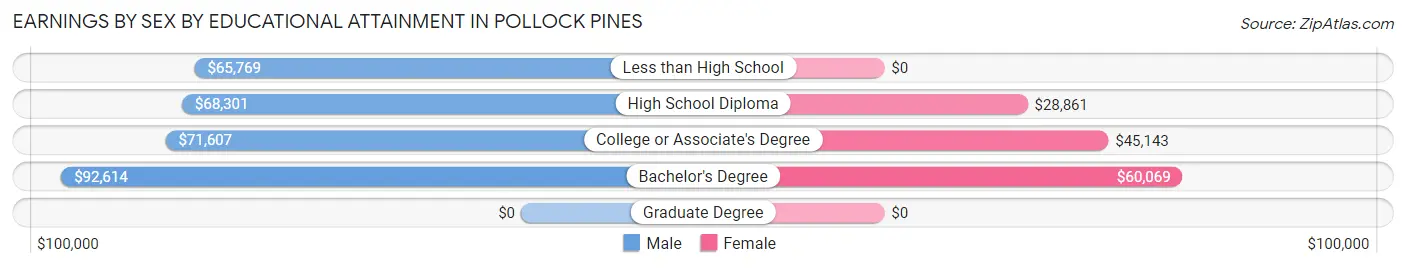
Earnings by Sex by Educational Attainment in Pollock Pines
Average earnings in Pollock Pines are $68,061 for men and $41,300 for women, a difference of 39.3%. Men with an educational attainment of bachelor's degree enjoy the highest average annual earnings of $92,614, while those with less than high school education earn the least with $65,769. Women with an educational attainment of bachelor's degree earn the most with the average annual earnings of $60,069, while those with high school diploma education have the smallest earnings of $28,861.
| Educational Attainment | Male Income | Female Income |
| Less than High School | $65,769 | $0 |
| High School Diploma | $68,301 | $28,861 |
| College or Associate's Degree | $71,607 | $45,143 |
| Bachelor's Degree | $92,614 | $60,069 |
| Graduate Degree | - | - |
| Total | $68,061 | $41,300 |
Family Income in Pollock Pines
Family Income Brackets in Pollock Pines
According to the Pollock Pines family income data, there are 344 families falling into the $100,000 to $149,999 income range, which is the most common income bracket and makes up 23.0% of all families. Conversely, the $10,000 to $14,999 income bracket is the least frequent group with only 4 families (0.3%) belonging to this category.
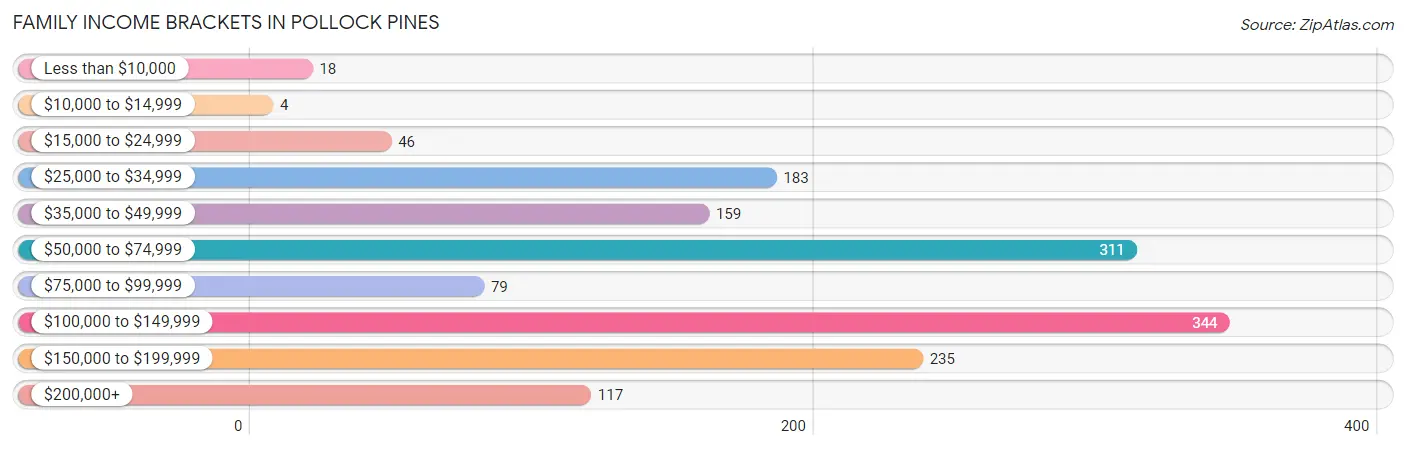
| Income Bracket | # Families | % Families |
| Less than $10,000 | 18 | 1.2% |
| $10,000 to $14,999 | 4 | 0.3% |
| $15,000 to $24,999 | 46 | 3.1% |
| $25,000 to $34,999 | 183 | 12.2% |
| $35,000 to $49,999 | 159 | 10.6% |
| $50,000 to $74,999 | 311 | 20.8% |
| $75,000 to $99,999 | 79 | 5.3% |
| $100,000 to $149,999 | 344 | 23.0% |
| $150,000 to $199,999 | 235 | 15.7% |
| $200,000+ | 117 | 7.8% |
Family Income by Famaliy Size in Pollock Pines
3-person families (279 | 18.6%) account for the highest median family income in Pollock Pines with $92,054 per family, while 2-person families (878 | 58.7%) have the highest median income of $40,375 per family member.
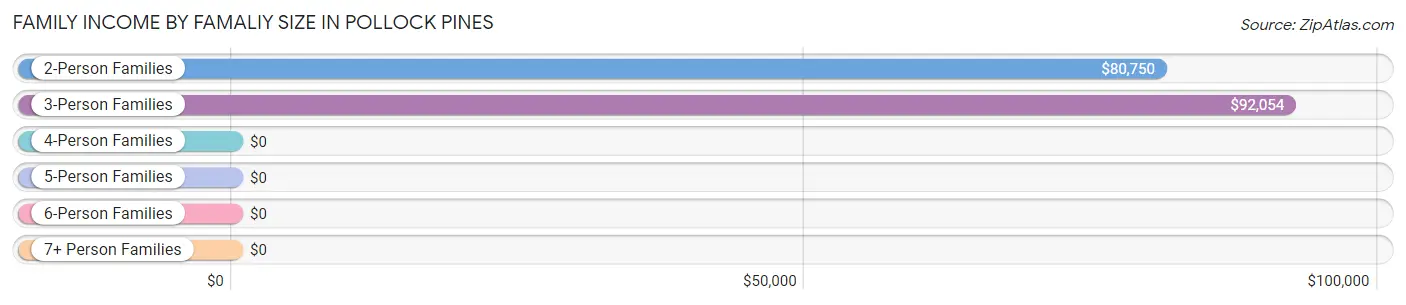
| Income Bracket | # Families | Median Income |
| 2-Person Families | 878 (58.7%) | $80,750 |
| 3-Person Families | 279 (18.6%) | $92,054 |
| 4-Person Families | 265 (17.7%) | $0 |
| 5-Person Families | 26 (1.7%) | $0 |
| 6-Person Families | 29 (1.9%) | $0 |
| 7+ Person Families | 20 (1.3%) | $0 |
| Total | 1,497 (100.0%) | $88,583 |
Family Income by Number of Earners in Pollock Pines
The median family income in Pollock Pines is $88,583, with families comprising 2 earners (430) having the highest median family income of $129,886, while families with no earners (429) have the lowest median family income of $48,920, accounting for 28.7% and 28.7% of families, respectively.
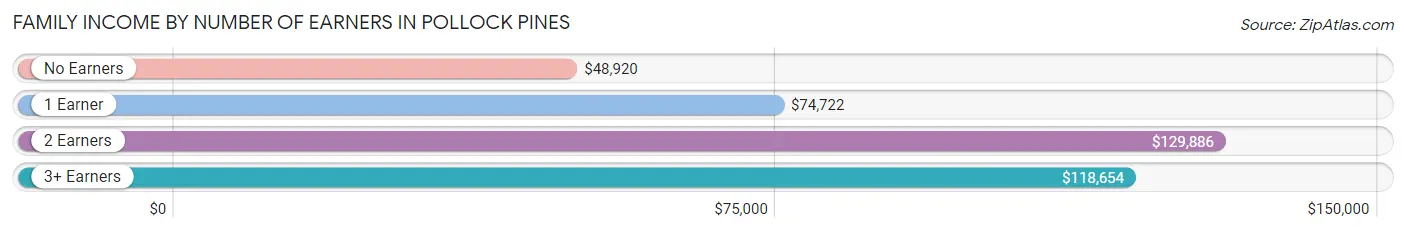
| Number of Earners | # Families | Median Income |
| No Earners | 429 (28.7%) | $48,920 |
| 1 Earner | 532 (35.5%) | $74,722 |
| 2 Earners | 430 (28.7%) | $129,886 |
| 3+ Earners | 106 (7.1%) | $118,654 |
| Total | 1,497 (100.0%) | $88,583 |
Household Income in Pollock Pines
Household Income Brackets in Pollock Pines
With 483 households falling in the category, the $100,000 to $149,999 income range is the most frequent in Pollock Pines, accounting for 17.8% of all households. In contrast, only 117 households (4.3%) fall into the less than $10,000 income bracket, making it the least populous group.
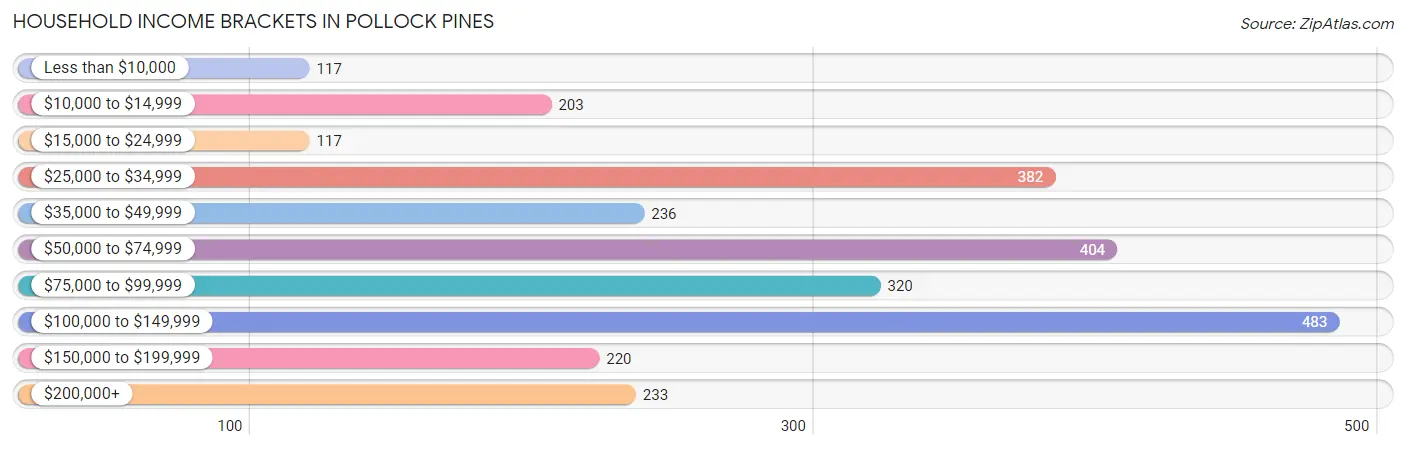
| Income Bracket | # Households | % Households |
| Less than $10,000 | 117 | 4.3% |
| $10,000 to $14,999 | 203 | 7.5% |
| $15,000 to $24,999 | 117 | 4.3% |
| $25,000 to $34,999 | 382 | 14.1% |
| $35,000 to $49,999 | 236 | 8.7% |
| $50,000 to $74,999 | 404 | 14.9% |
| $75,000 to $99,999 | 320 | 11.8% |
| $100,000 to $149,999 | 483 | 17.8% |
| $150,000 to $199,999 | 220 | 8.1% |
| $200,000+ | 233 | 8.6% |
Household Income by Householder Age in Pollock Pines
The median household income in Pollock Pines is $70,489, with the highest median household income of $78,612 found in the 25 to 44 years age bracket for the primary householder. A total of 785 households (28.9%) fall into this category. Meanwhile, the 15 to 24 years age bracket for the primary householder has the lowest median household income of $0, with 75 households (2.8%) in this group.
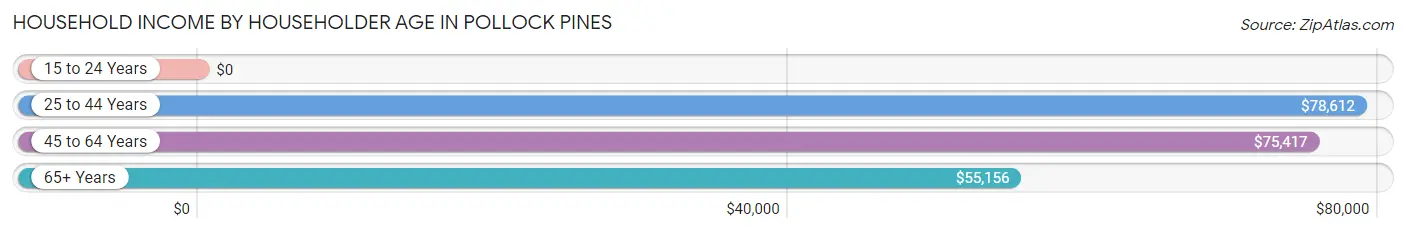
| Income Bracket | # Households | Median Income |
| 15 to 24 Years | 75 (2.8%) | $0 |
| 25 to 44 Years | 785 (28.9%) | $78,612 |
| 45 to 64 Years | 1,149 (42.4%) | $75,417 |
| 65+ Years | 703 (25.9%) | $55,156 |
| Total | 2,712 (100.0%) | $70,489 |
Poverty in Pollock Pines
Income Below Poverty by Sex and Age in Pollock Pines
With 21.4% poverty level for males and 20.1% for females among the residents of Pollock Pines, 6 to 11 year old males and 6 to 11 year old females are the most vulnerable to poverty, with 43 males (84.3%) and 120 females (68.6%) in their respective age groups living below the poverty level.
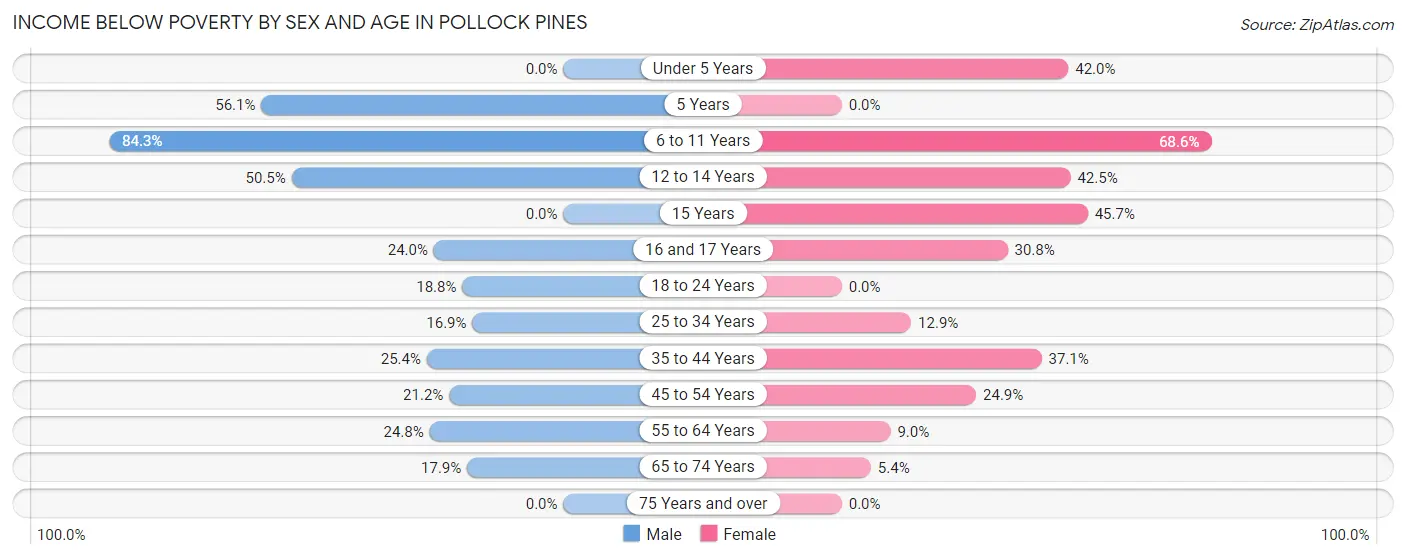
| Age Bracket | Male | Female |
| Under 5 Years | 0 (0.0%) | 66 (42.0%) |
| 5 Years | 37 (56.1%) | 0 (0.0%) |
| 6 to 11 Years | 43 (84.3%) | 120 (68.6%) |
| 12 to 14 Years | 56 (50.4%) | 59 (42.4%) |
| 15 Years | 0 (0.0%) | 21 (45.7%) |
| 16 and 17 Years | 25 (24.0%) | 4 (30.8%) |
| 18 to 24 Years | 33 (18.8%) | 0 (0.0%) |
| 25 to 34 Years | 87 (16.9%) | 39 (12.9%) |
| 35 to 44 Years | 90 (25.4%) | 102 (37.1%) |
| 45 to 54 Years | 78 (21.2%) | 86 (24.9%) |
| 55 to 64 Years | 155 (24.8%) | 50 (9.0%) |
| 65 to 74 Years | 45 (17.9%) | 21 (5.4%) |
| 75 Years and over | 0 (0.0%) | 0 (0.0%) |
| Total | 649 (21.4%) | 568 (20.1%) |
Income Above Poverty by Sex and Age in Pollock Pines
According to the poverty statistics in Pollock Pines, males aged under 5 years and females aged 5 years are the age groups that are most secure financially, with 100.0% of males and 100.0% of females in these age groups living above the poverty line.
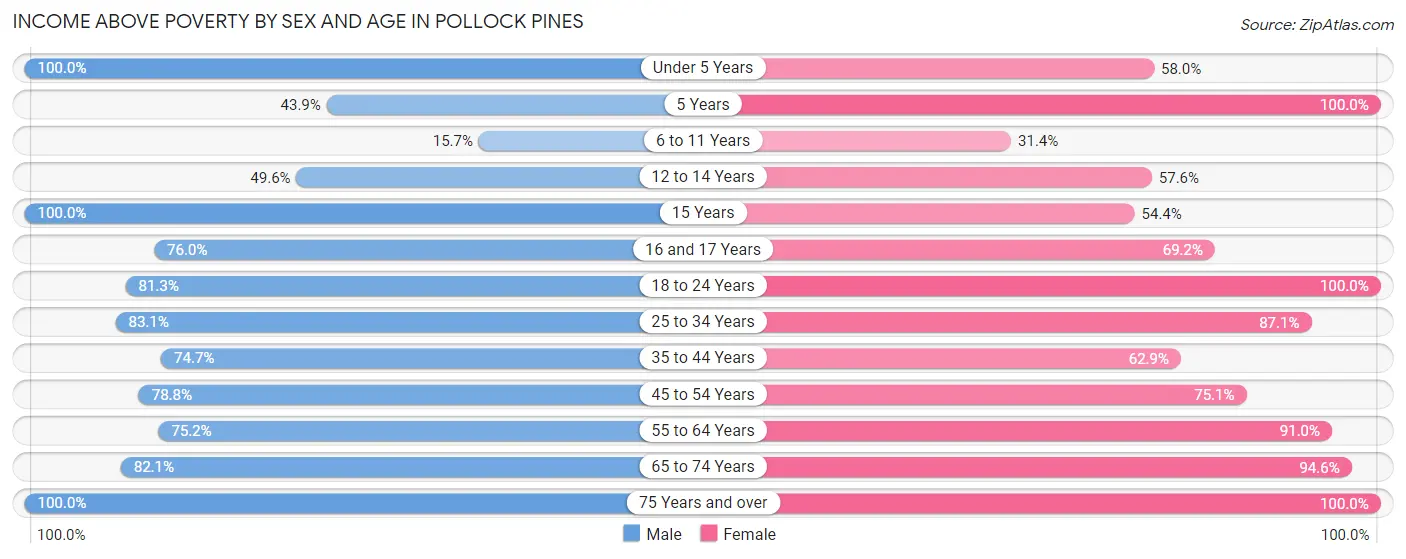
| Age Bracket | Male | Female |
| Under 5 Years | 118 (100.0%) | 91 (58.0%) |
| 5 Years | 29 (43.9%) | 27 (100.0%) |
| 6 to 11 Years | 8 (15.7%) | 55 (31.4%) |
| 12 to 14 Years | 55 (49.5%) | 80 (57.6%) |
| 15 Years | 41 (100.0%) | 25 (54.3%) |
| 16 and 17 Years | 79 (76.0%) | 9 (69.2%) |
| 18 to 24 Years | 143 (81.2%) | 134 (100.0%) |
| 25 to 34 Years | 428 (83.1%) | 264 (87.1%) |
| 35 to 44 Years | 265 (74.7%) | 173 (62.9%) |
| 45 to 54 Years | 290 (78.8%) | 259 (75.1%) |
| 55 to 64 Years | 469 (75.2%) | 503 (91.0%) |
| 65 to 74 Years | 207 (82.1%) | 368 (94.6%) |
| 75 Years and over | 254 (100.0%) | 268 (100.0%) |
| Total | 2,386 (78.6%) | 2,256 (79.9%) |
Income Below Poverty Among Married-Couple Families in Pollock Pines
The poverty statistics for married-couple families in Pollock Pines show that 7.1% or 87 of the total 1,229 families live below the poverty line. Families with 5 or more children have the highest poverty rate of 100.0%, comprising of 20 families. On the other hand, families with no children have the lowest poverty rate of 0.0%, which includes 0 families.
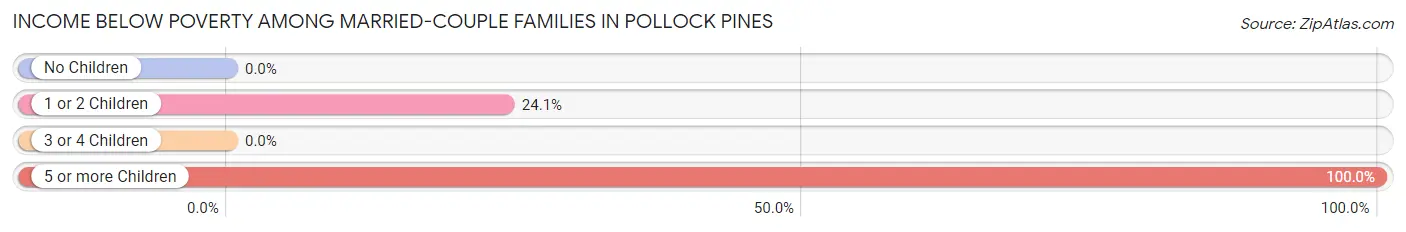
| Children | Above Poverty | Below Poverty |
| No Children | 900 (100.0%) | 0 (0.0%) |
| 1 or 2 Children | 211 (75.9%) | 67 (24.1%) |
| 3 or 4 Children | 31 (100.0%) | 0 (0.0%) |
| 5 or more Children | 0 (0.0%) | 20 (100.0%) |
| Total | 1,142 (92.9%) | 87 (7.1%) |
Income Below Poverty Among Single-Parent Households in Pollock Pines
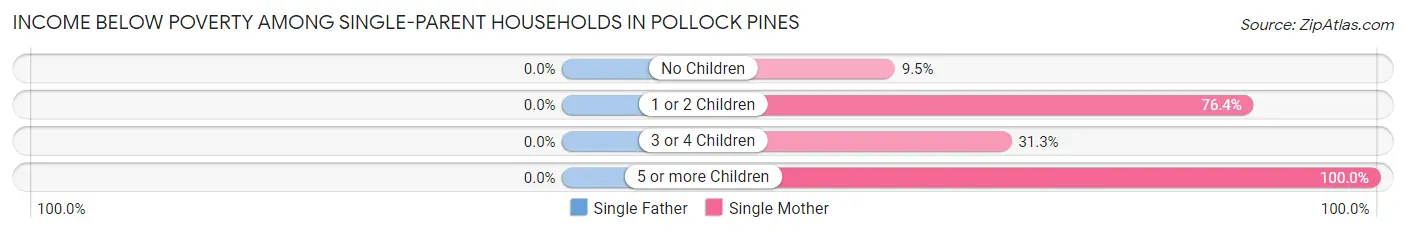
| Children | Single Father | Single Mother |
| No Children | 0 (0.0%) | 4 (9.5%) |
| 1 or 2 Children | 0 (0.0%) | 42 (76.4%) |
| 3 or 4 Children | 0 (0.0%) | 5 (31.2%) |
| 5 or more Children | 0 (0.0%) | 17 (100.0%) |
| Total | 0 (0.0%) | 68 (52.3%) |
Income Below Poverty Among Married-Couple vs Single-Parent Households in Pollock Pines
The poverty data for Pollock Pines shows that 87 of the married-couple family households (7.1%) and 68 of the single-parent households (25.4%) are living below the poverty level. Within the married-couple family households, those with 5 or more children have the highest poverty rate, with 20 households (100.0%) falling below the poverty line. Among the single-parent households, those with 5 or more children have the highest poverty rate, with 17 household (100.0%) living below poverty.
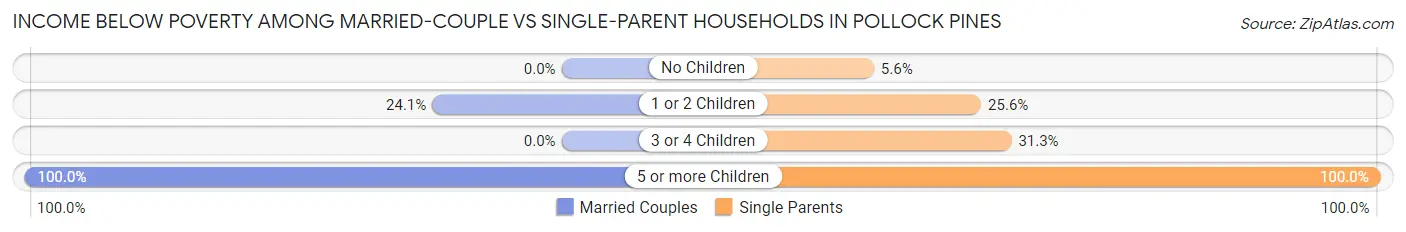
| Children | Married-Couple Families | Single-Parent Households |
| No Children | 0 (0.0%) | 4 (5.6%) |
| 1 or 2 Children | 67 (24.1%) | 42 (25.6%) |
| 3 or 4 Children | 0 (0.0%) | 5 (31.2%) |
| 5 or more Children | 20 (100.0%) | 17 (100.0%) |
| Total | 87 (7.1%) | 68 (25.4%) |
Race in Pollock Pines
The most populous races in Pollock Pines are White / Caucasian (5,346 | 90.3%), Hispanic or Latino (516 | 8.7%), and Two or more Races (282 | 4.8%).
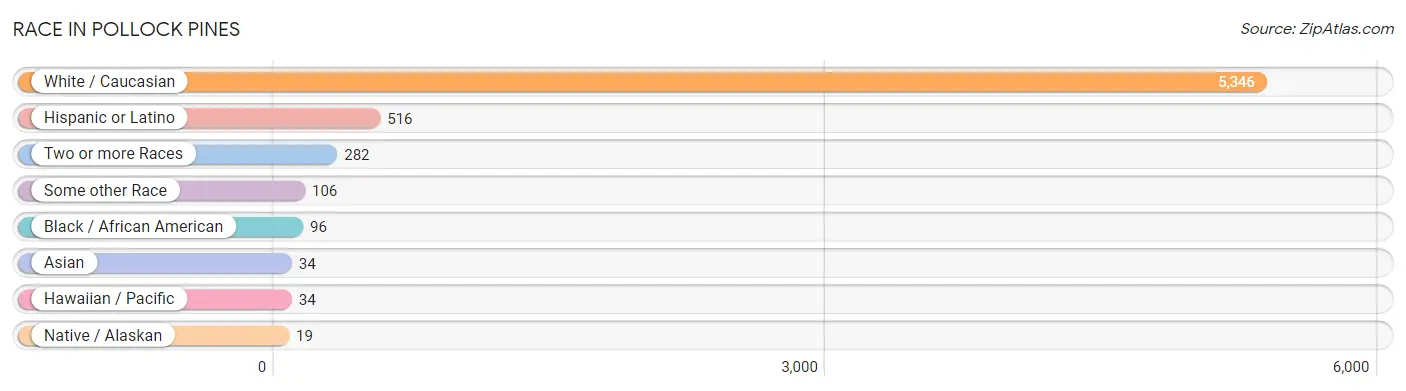
| Race | # Population | % Population |
| Asian | 34 | 0.6% |
| Black / African American | 96 | 1.6% |
| Hawaiian / Pacific | 34 | 0.6% |
| Hispanic or Latino | 516 | 8.7% |
| Native / Alaskan | 19 | 0.3% |
| White / Caucasian | 5,346 | 90.3% |
| Two or more Races | 282 | 4.8% |
| Some other Race | 106 | 1.8% |
| Total | 5,917 | 100.0% |
Ancestry in Pollock Pines
The most populous ancestries reported in Pollock Pines are German (849 | 14.3%), English (460 | 7.8%), Italian (390 | 6.6%), Irish (386 | 6.5%), and Mexican (379 | 6.4%), together accounting for 41.6% of all Pollock Pines residents.
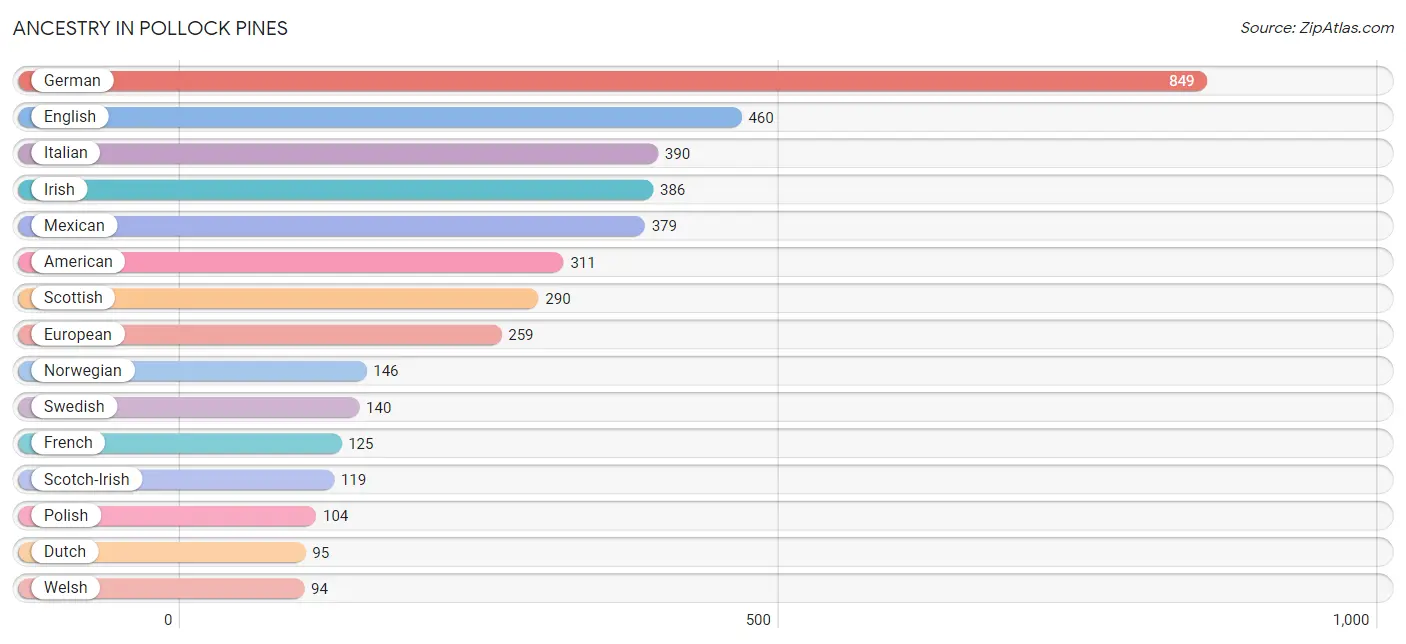
| Ancestry | # Population | % Population |
| American | 311 | 5.3% |
| Apache | 19 | 0.3% |
| Australian | 6 | 0.1% |
| British | 61 | 1.0% |
| Canadian | 16 | 0.3% |
| Cherokee | 12 | 0.2% |
| Choctaw | 9 | 0.2% |
| Cuban | 29 | 0.5% |
| Czechoslovakian | 31 | 0.5% |
| Danish | 15 | 0.3% |
| Dutch | 95 | 1.6% |
| Eastern European | 5 | 0.1% |
| English | 460 | 7.8% |
| European | 259 | 4.4% |
| Finnish | 11 | 0.2% |
| French | 125 | 2.1% |
| French Canadian | 17 | 0.3% |
| German | 849 | 14.3% |
| Greek | 17 | 0.3% |
| Inupiat | 8 | 0.1% |
| Irish | 386 | 6.5% |
| Italian | 390 | 6.6% |
| Korean | 23 | 0.4% |
| Mexican | 379 | 6.4% |
| Native Hawaiian | 8 | 0.1% |
| Navajo | 26 | 0.4% |
| Norwegian | 146 | 2.5% |
| Polish | 104 | 1.8% |
| Portuguese | 67 | 1.1% |
| Puerto Rican | 14 | 0.2% |
| Russian | 87 | 1.5% |
| Samoan | 34 | 0.6% |
| Scandinavian | 19 | 0.3% |
| Scotch-Irish | 119 | 2.0% |
| Scottish | 290 | 4.9% |
| Sioux | 3 | 0.1% |
| Spaniard | 23 | 0.4% |
| Spanish | 15 | 0.3% |
| Sri Lankan | 11 | 0.2% |
| Swedish | 140 | 2.4% |
| Swiss | 5 | 0.1% |
| Ukrainian | 67 | 1.1% |
| Welsh | 94 | 1.6% |
| Yugoslavian | 10 | 0.2% | View All 44 Rows |
Immigrants in Pollock Pines
The most numerous immigrant groups reported in Pollock Pines came from Latin America (122 | 2.1%), Central America (106 | 1.8%), Mexico (106 | 1.8%), Europe (38 | 0.6%), and Asia (30 | 0.5%), together accounting for 6.8% of all Pollock Pines residents.
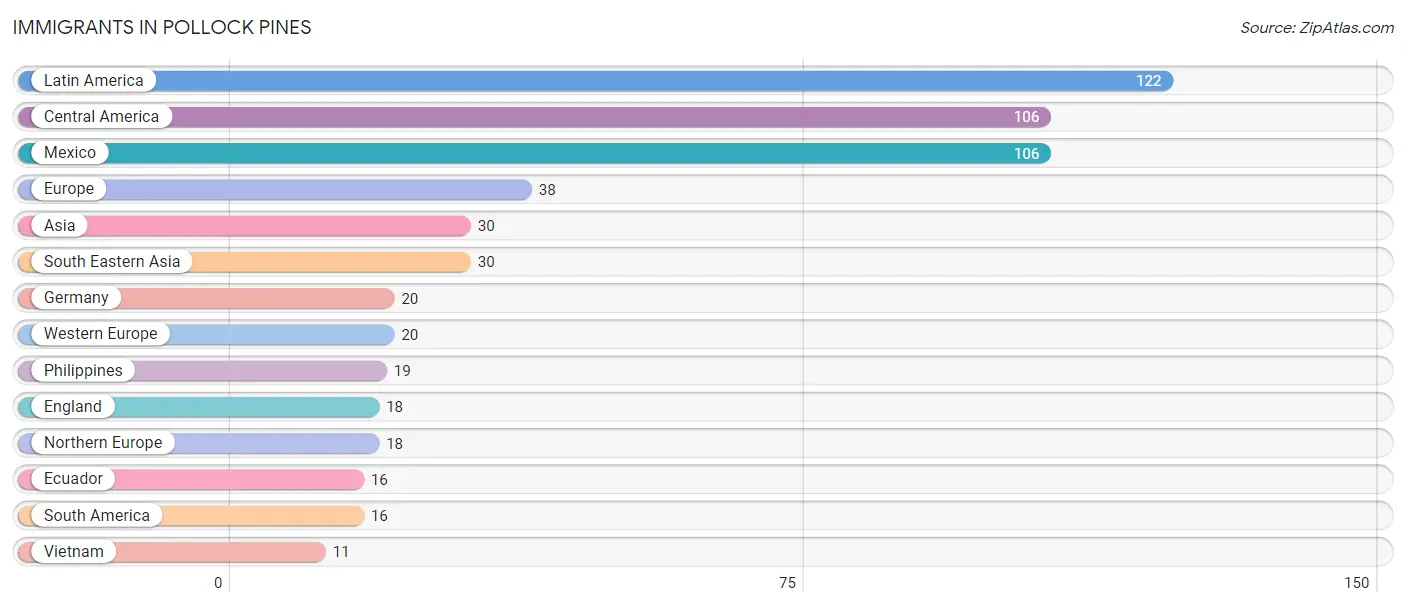
| Immigration Origin | # Population | % Population |
| Asia | 30 | 0.5% |
| Central America | 106 | 1.8% |
| Ecuador | 16 | 0.3% |
| England | 18 | 0.3% |
| Europe | 38 | 0.6% |
| Germany | 20 | 0.3% |
| Latin America | 122 | 2.1% |
| Mexico | 106 | 1.8% |
| Northern Europe | 18 | 0.3% |
| Philippines | 19 | 0.3% |
| South America | 16 | 0.3% |
| South Eastern Asia | 30 | 0.5% |
| Vietnam | 11 | 0.2% |
| Western Europe | 20 | 0.3% | View All 14 Rows |
Sex and Age in Pollock Pines
Sex and Age in Pollock Pines
The most populous age groups in Pollock Pines are 60 to 64 Years (331 | 10.8%) for men and 55 to 59 Years (304 | 10.7%) for women.
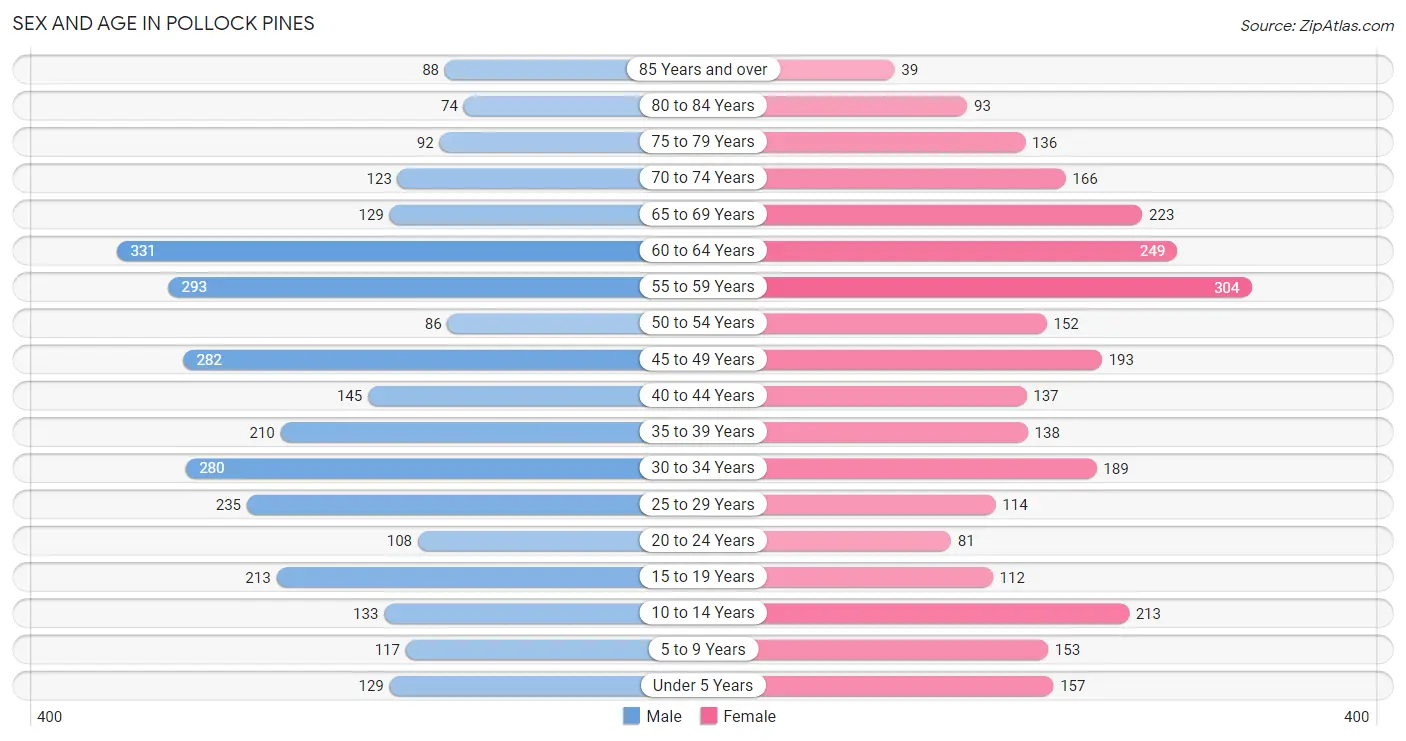
| Age Bracket | Male | Female |
| Under 5 Years | 129 (4.2%) | 157 (5.5%) |
| 5 to 9 Years | 117 (3.8%) | 153 (5.4%) |
| 10 to 14 Years | 133 (4.3%) | 213 (7.5%) |
| 15 to 19 Years | 213 (6.9%) | 112 (3.9%) |
| 20 to 24 Years | 108 (3.5%) | 81 (2.8%) |
| 25 to 29 Years | 235 (7.7%) | 114 (4.0%) |
| 30 to 34 Years | 280 (9.1%) | 189 (6.6%) |
| 35 to 39 Years | 210 (6.8%) | 138 (4.8%) |
| 40 to 44 Years | 145 (4.7%) | 137 (4.8%) |
| 45 to 49 Years | 282 (9.2%) | 193 (6.8%) |
| 50 to 54 Years | 86 (2.8%) | 152 (5.3%) |
| 55 to 59 Years | 293 (9.6%) | 304 (10.7%) |
| 60 to 64 Years | 331 (10.8%) | 249 (8.7%) |
| 65 to 69 Years | 129 (4.2%) | 223 (7.8%) |
| 70 to 74 Years | 123 (4.0%) | 166 (5.8%) |
| 75 to 79 Years | 92 (3.0%) | 136 (4.8%) |
| 80 to 84 Years | 74 (2.4%) | 93 (3.3%) |
| 85 Years and over | 88 (2.9%) | 39 (1.4%) |
| Total | 3,068 (100.0%) | 2,849 (100.0%) |
Families and Households in Pollock Pines
Median Family Size in Pollock Pines
The median family size in Pollock Pines is 2.81 persons per family, with single female/mother families (130 | 8.7%) accounting for the largest median family size of 3.48 persons per family. On the other hand, single male/father families (138 | 9.2%) represent the smallest median family size with 2.50 persons per family.
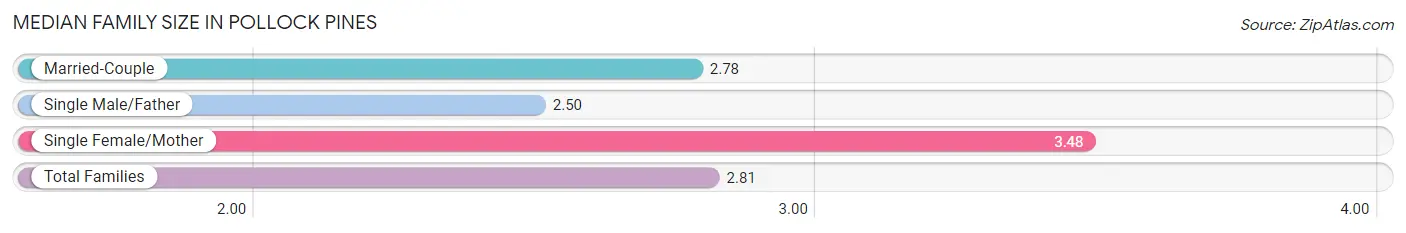
| Family Type | # Families | Family Size |
| Married-Couple | 1,229 (82.1%) | 2.78 |
| Single Male/Father | 138 (9.2%) | 2.50 |
| Single Female/Mother | 130 (8.7%) | 3.48 |
| Total Families | 1,497 (100.0%) | 2.81 |
Median Household Size in Pollock Pines
The median household size in Pollock Pines is 2.17 persons per household, with single female/mother households (130 | 4.8%) accounting for the largest median household size of 3.9 persons per household. non-family households (1,215 | 44.8%) represent the smallest median household size with 1.28 persons per household.
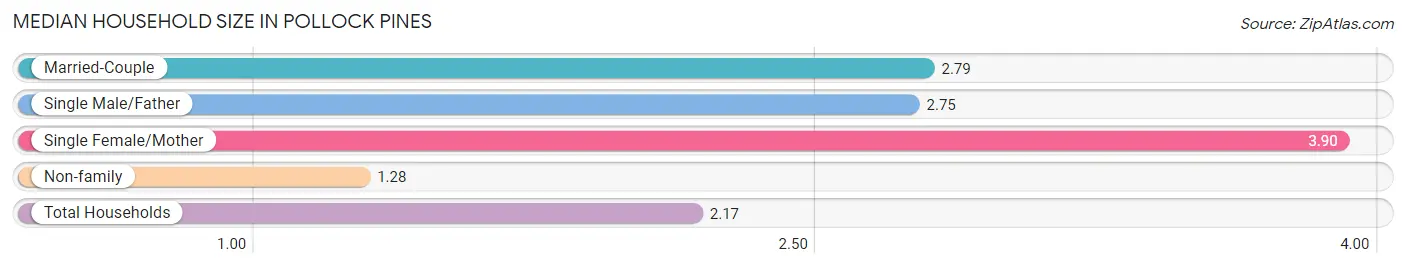
| Household Type | # Households | Household Size |
| Married-Couple | 1,229 (45.3%) | 2.79 |
| Single Male/Father | 138 (5.1%) | 2.75 |
| Single Female/Mother | 130 (4.8%) | 3.90 |
| Non-family | 1,215 (44.8%) | 1.28 |
| Total Households | 2,712 (100.0%) | 2.17 |
Household Size by Marriage Status in Pollock Pines
Out of a total of 2,712 households in Pollock Pines, 1,497 (55.2%) are family households, while 1,215 (44.8%) are nonfamily households. The most numerous type of family households are 2-person households, comprising 829, and the most common type of nonfamily households are 1-person households, comprising 1,050.
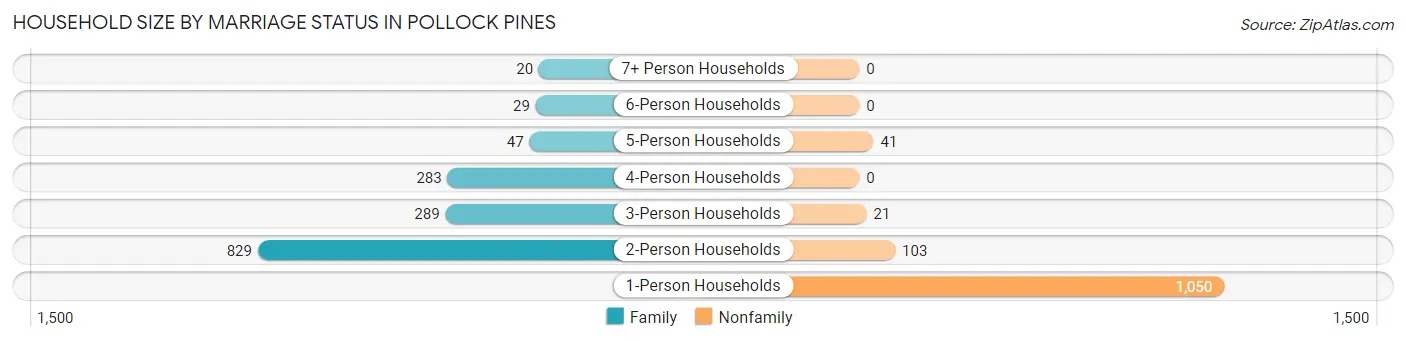
| Household Size | Family Households | Nonfamily Households |
| 1-Person Households | - | 1,050 (38.7%) |
| 2-Person Households | 829 (30.6%) | 103 (3.8%) |
| 3-Person Households | 289 (10.7%) | 21 (0.8%) |
| 4-Person Households | 283 (10.4%) | 0 (0.0%) |
| 5-Person Households | 47 (1.7%) | 41 (1.5%) |
| 6-Person Households | 29 (1.1%) | 0 (0.0%) |
| 7+ Person Households | 20 (0.7%) | 0 (0.0%) |
| Total | 1,497 (55.2%) | 1,215 (44.8%) |
Female Fertility in Pollock Pines
Fertility by Age in Pollock Pines
Average fertility rate in Pollock Pines is 92.0 births per 1,000 women. Women in the age bracket of 20 to 34 years have the highest fertility rate with 198.0 births per 1,000 women. Women in the age bracket of 20 to 34 years acount for 84.4% of all women with births.
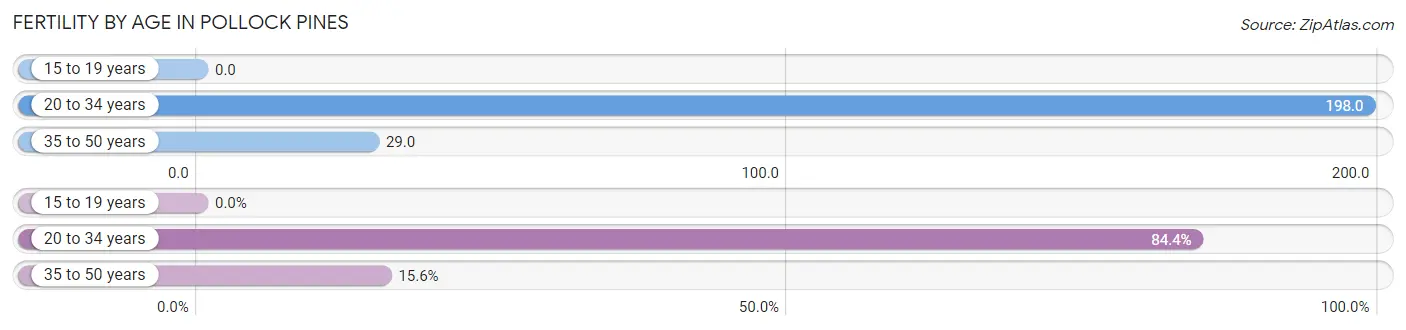
| Age Bracket | Women with Births | Births / 1,000 Women |
| 15 to 19 years | 0 (0.0%) | 0.0 |
| 20 to 34 years | 76 (84.4%) | 198.0 |
| 35 to 50 years | 14 (15.6%) | 29.0 |
| Total | 90 (100.0%) | 92.0 |
Fertility by Age by Marriage Status in Pollock Pines
68.9% of women with births (90) in Pollock Pines are married. The highest percentage of unmarried women with births falls into 35 to 50 years age bracket with 100.0% of them unmarried at the time of birth, while the lowest percentage of unmarried women with births belong to 20 to 34 years age bracket with 18.4% of them unmarried.
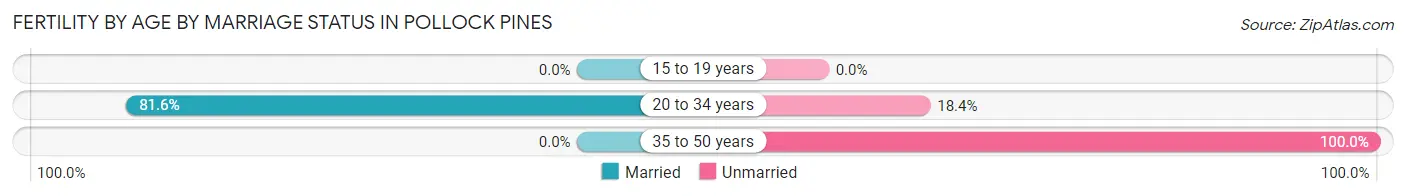
| Age Bracket | Married | Unmarried |
| 15 to 19 years | 0 (0.0%) | 0 (0.0%) |
| 20 to 34 years | 62 (81.6%) | 14 (18.4%) |
| 35 to 50 years | 0 (0.0%) | 14 (100.0%) |
| Total | 62 (68.9%) | 28 (31.1%) |
Fertility by Education in Pollock Pines
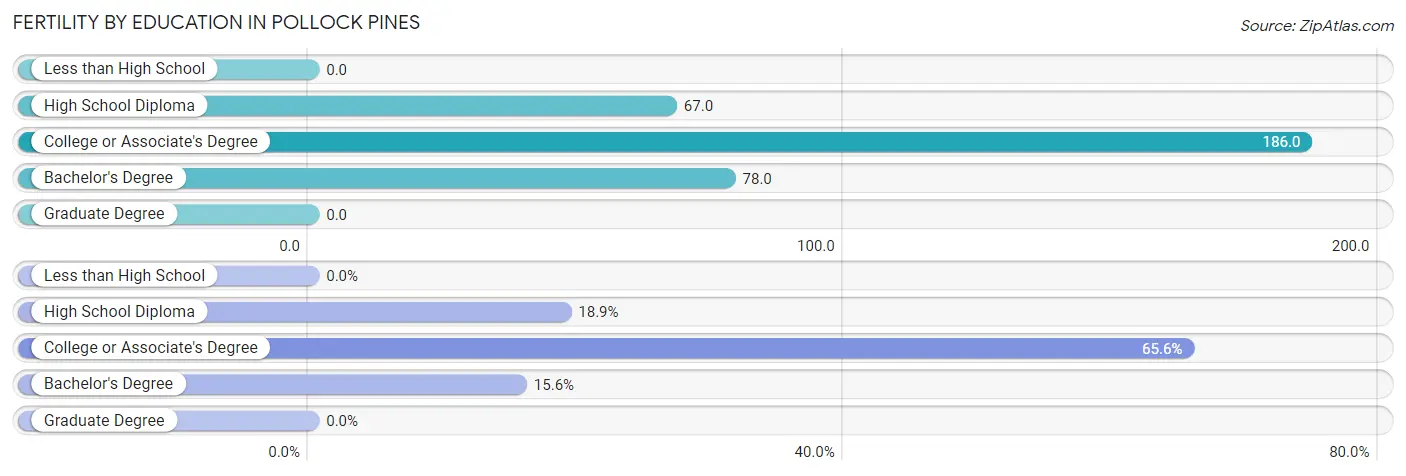
| Educational Attainment | Women with Births | Births / 1,000 Women |
| Less than High School | 0 (0.0%) | 0.0 |
| High School Diploma | 17 (18.9%) | 67.0 |
| College or Associate's Degree | 59 (65.6%) | 186.0 |
| Bachelor's Degree | 14 (15.6%) | 78.0 |
| Graduate Degree | 0 (0.0%) | 0.0 |
| Total | 90 (100.0%) | 92.0 |
Fertility by Education by Marriage Status in Pollock Pines
31.1% of women with births in Pollock Pines are unmarried. Women with the educational attainment of high school diploma are most likely to be married with 100.0% of them married at childbirth, while women with the educational attainment of bachelor's degree are least likely to be married with 100.0% of them unmarried at childbirth.
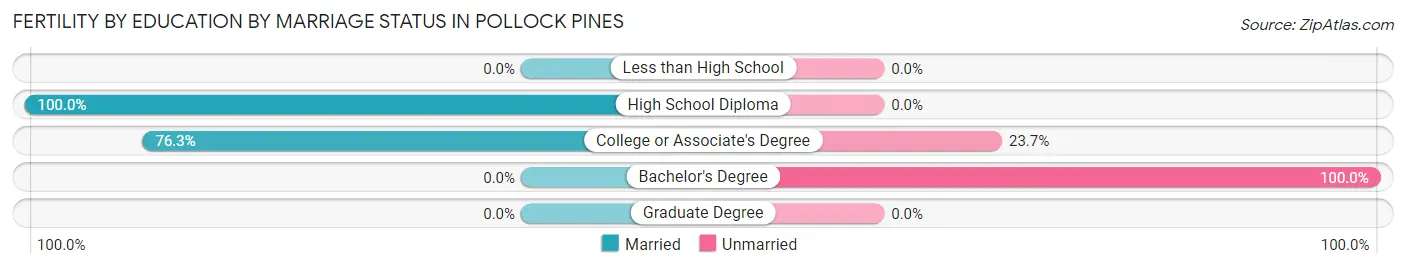
| Educational Attainment | Married | Unmarried |
| Less than High School | 0 (0.0%) | 0 (0.0%) |
| High School Diploma | 17 (100.0%) | 0 (0.0%) |
| College or Associate's Degree | 45 (76.3%) | 14 (23.7%) |
| Bachelor's Degree | 0 (0.0%) | 14 (100.0%) |
| Graduate Degree | 0 (0.0%) | 0 (0.0%) |
| Total | 62 (68.9%) | 28 (31.1%) |
Employment Characteristics in Pollock Pines
Employment by Class of Employer in Pollock Pines
Among the 2,527 employed individuals in Pollock Pines, private company employees (1,391 | 55.0%), not-for-profit organizations (360 | 14.2%), and local government employees (286 | 11.3%) make up the most common classes of employment.
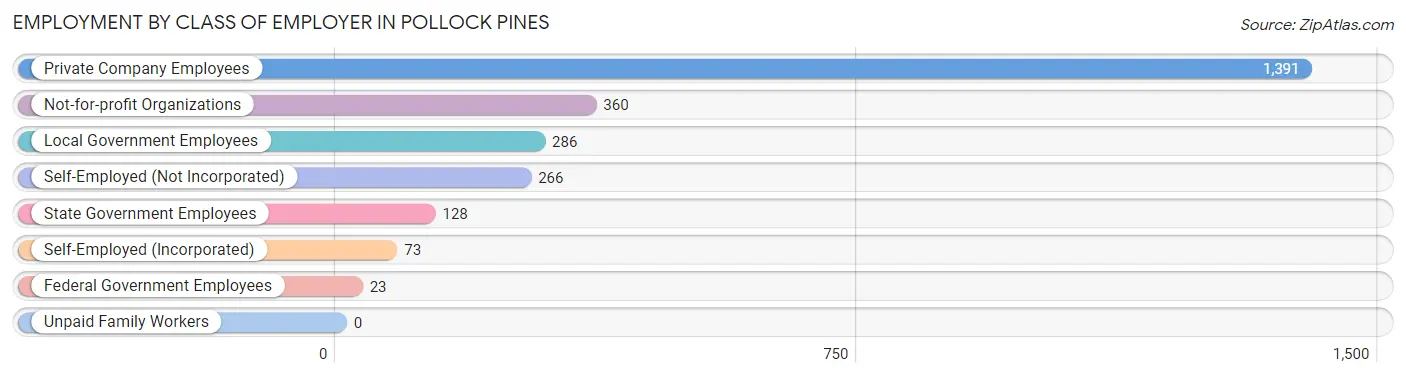
| Employer Class | # Employees | % Employees |
| Private Company Employees | 1,391 | 55.0% |
| Self-Employed (Incorporated) | 73 | 2.9% |
| Self-Employed (Not Incorporated) | 266 | 10.5% |
| Not-for-profit Organizations | 360 | 14.2% |
| Local Government Employees | 286 | 11.3% |
| State Government Employees | 128 | 5.1% |
| Federal Government Employees | 23 | 0.9% |
| Unpaid Family Workers | 0 | 0.0% |
| Total | 2,527 | 100.0% |
Employment Status by Age in Pollock Pines
According to the labor force statistics for Pollock Pines, out of the total population over 16 years of age (4,928), 54.5% or 2,686 individuals are in the labor force, with 5.2% or 140 of them unemployed. The age group with the highest labor force participation rate is 20 to 24 years, with 95.8% or 181 individuals in the labor force. Within the labor force, the 16 to 19 years age range has the highest percentage of unemployed individuals, with 29.8% or 31 of them being unemployed.
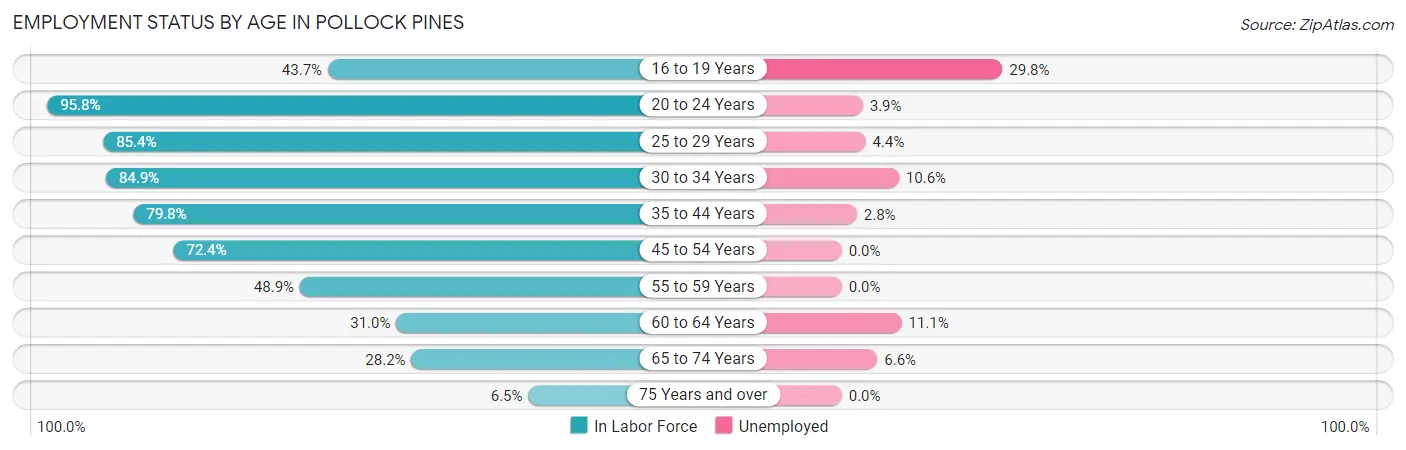
| Age Bracket | In Labor Force | Unemployed |
| 16 to 19 Years | 104 (43.7%) | 31 (29.8%) |
| 20 to 24 Years | 181 (95.8%) | 7 (3.9%) |
| 25 to 29 Years | 298 (85.4%) | 13 (4.4%) |
| 30 to 34 Years | 398 (84.9%) | 42 (10.6%) |
| 35 to 44 Years | 503 (79.8%) | 14 (2.8%) |
| 45 to 54 Years | 516 (72.4%) | 0 (0.0%) |
| 55 to 59 Years | 292 (48.9%) | 0 (0.0%) |
| 60 to 64 Years | 180 (31.0%) | 20 (11.1%) |
| 65 to 74 Years | 181 (28.2%) | 12 (6.6%) |
| 75 Years and over | 34 (6.5%) | 0 (0.0%) |
| Total | 2,686 (54.5%) | 140 (5.2%) |
Employment Status by Educational Attainment in Pollock Pines
According to labor force statistics for Pollock Pines, 65.5% of individuals (2,186) out of the total population between 25 and 64 years of age (3,338) are in the labor force, with 4.1% or 90 of them being unemployed. The group with the highest labor force participation rate are those with the educational attainment of bachelor's degree or higher, with 76.3% or 644 individuals in the labor force. Within the labor force, individuals with high school diploma education have the highest percentage of unemployment, with 5.9% or 34 of them being unemployed.
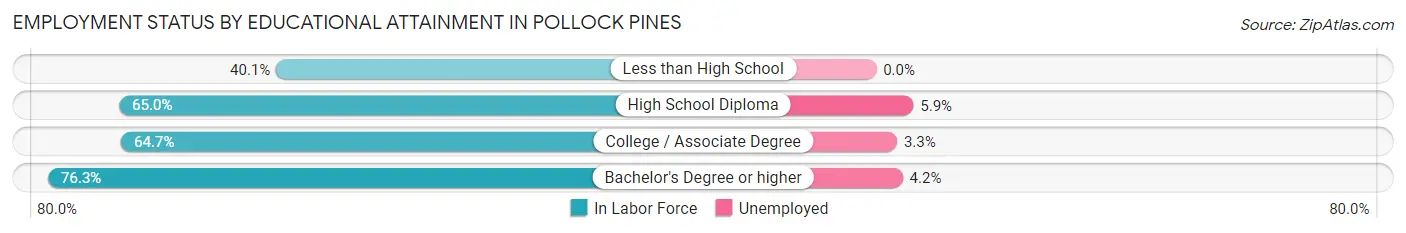
| Educational Attainment | In Labor Force | Unemployed |
| Less than High School | 120 (40.1%) | 0 (0.0%) |
| High School Diploma | 580 (65.0%) | 53 (5.9%) |
| College / Associate Degree | 843 (64.7%) | 43 (3.3%) |
| Bachelor's Degree or higher | 644 (76.3%) | 35 (4.2%) |
| Total | 2,186 (65.5%) | 137 (4.1%) |
Employment Occupations by Sex in Pollock Pines
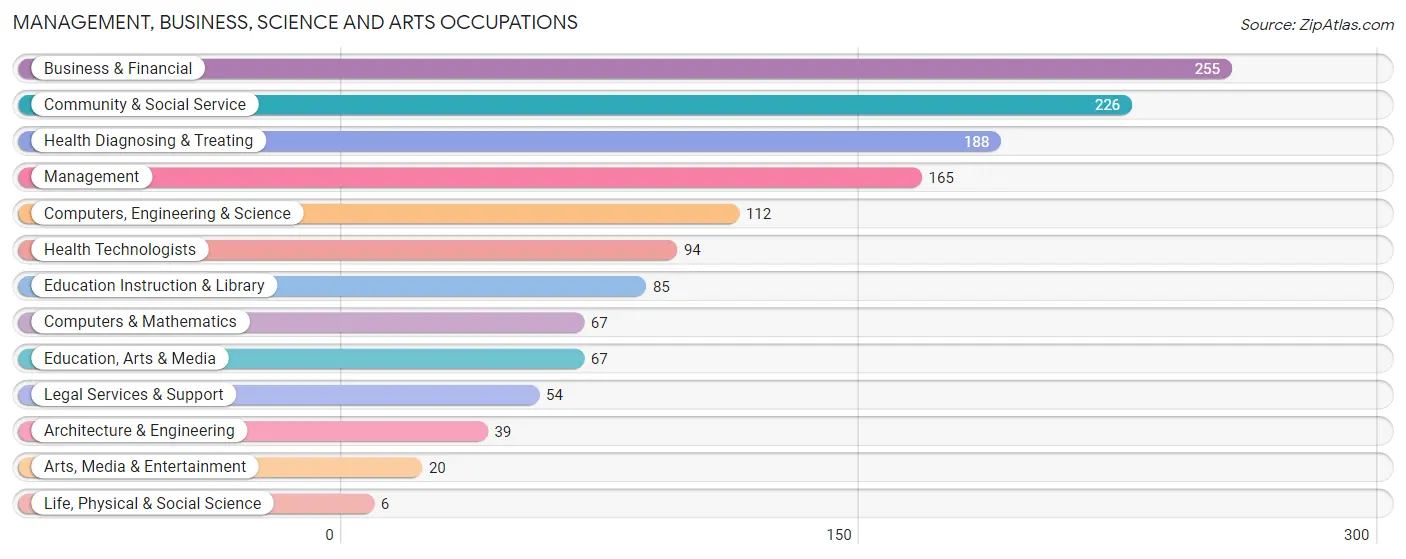
Management, Business, Science and Arts Occupations
The most common Management, Business, Science and Arts occupations in Pollock Pines are Business & Financial (255 | 10.0%), Community & Social Service (226 | 8.9%), Health Diagnosing & Treating (188 | 7.4%), Management (165 | 6.5%), and Computers, Engineering & Science (112 | 4.4%).
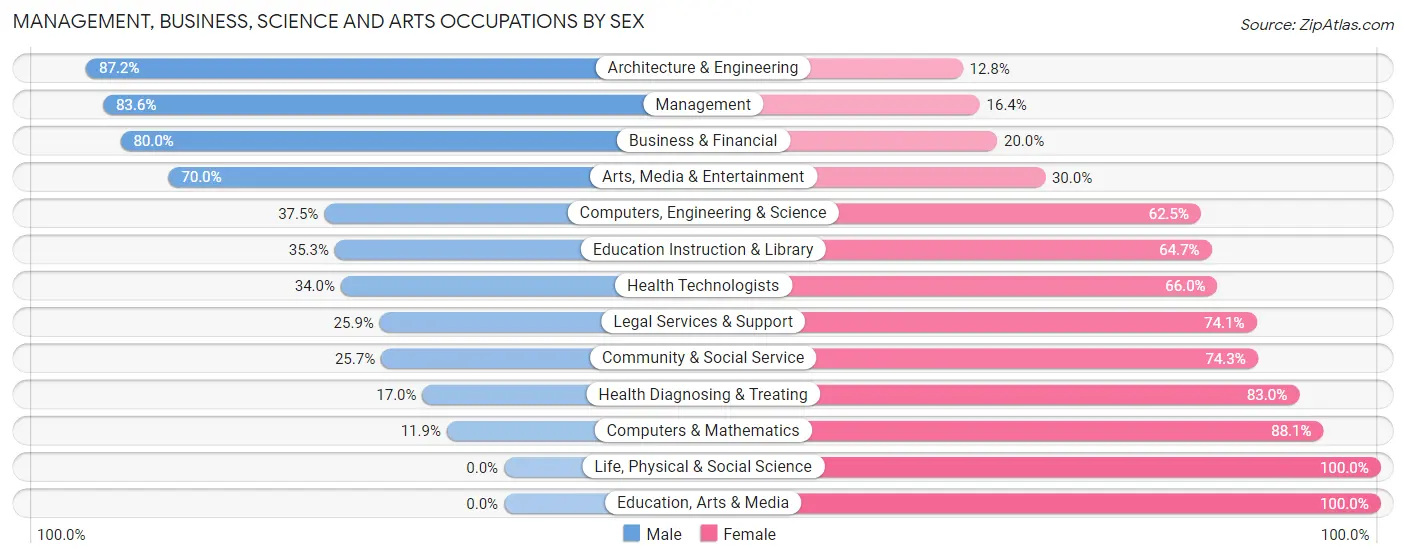
Management, Business, Science and Arts Occupations by Sex
Within the Management, Business, Science and Arts occupations in Pollock Pines, the most male-oriented occupations are Architecture & Engineering (87.2%), Management (83.6%), and Business & Financial (80.0%), while the most female-oriented occupations are Life, Physical & Social Science (100.0%), Education, Arts & Media (100.0%), and Computers & Mathematics (88.1%).
| Occupation | Male | Female |
| Management | 138 (83.6%) | 27 (16.4%) |
| Business & Financial | 204 (80.0%) | 51 (20.0%) |
| Computers, Engineering & Science | 42 (37.5%) | 70 (62.5%) |
| Computers & Mathematics | 8 (11.9%) | 59 (88.1%) |
| Architecture & Engineering | 34 (87.2%) | 5 (12.8%) |
| Life, Physical & Social Science | 0 (0.0%) | 6 (100.0%) |
| Community & Social Service | 58 (25.7%) | 168 (74.3%) |
| Education, Arts & Media | 0 (0.0%) | 67 (100.0%) |
| Legal Services & Support | 14 (25.9%) | 40 (74.1%) |
| Education Instruction & Library | 30 (35.3%) | 55 (64.7%) |
| Arts, Media & Entertainment | 14 (70.0%) | 6 (30.0%) |
| Health Diagnosing & Treating | 32 (17.0%) | 156 (83.0%) |
| Health Technologists | 32 (34.0%) | 62 (66.0%) |
| Total (Category) | 474 (50.1%) | 472 (49.9%) |
| Total (Overall) | 1,624 (63.7%) | 924 (36.3%) |
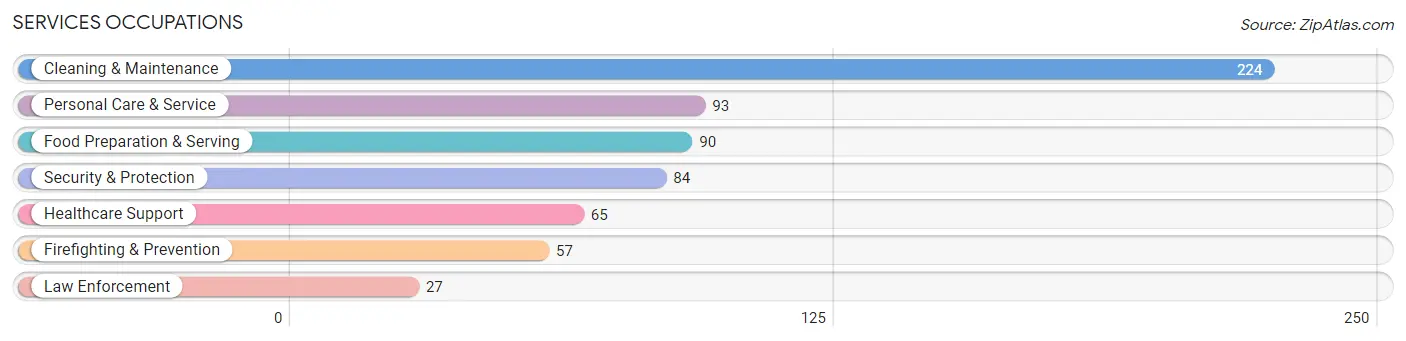
Services Occupations
The most common Services occupations in Pollock Pines are Cleaning & Maintenance (224 | 8.8%), Personal Care & Service (93 | 3.6%), Food Preparation & Serving (90 | 3.5%), Security & Protection (84 | 3.3%), and Healthcare Support (65 | 2.5%).
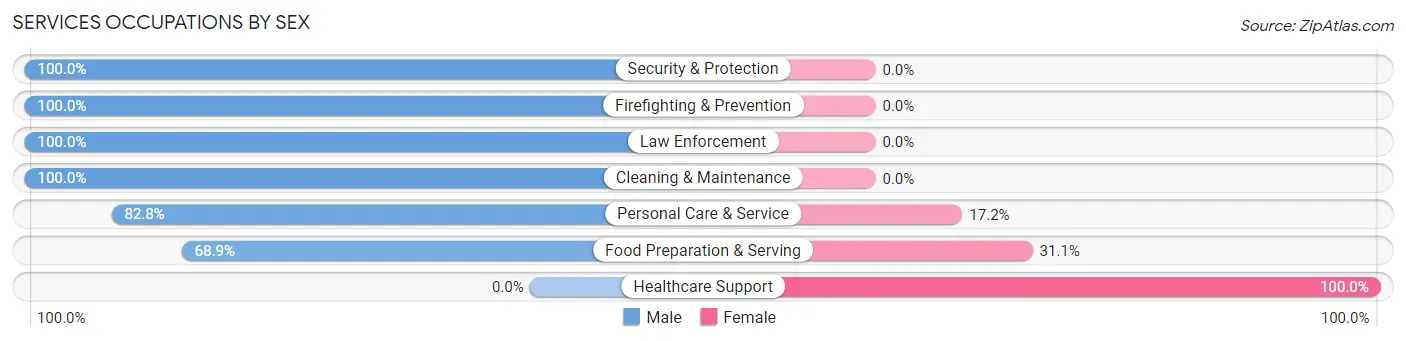
Services Occupations by Sex
Within the Services occupations in Pollock Pines, the most male-oriented occupations are Security & Protection (100.0%), Firefighting & Prevention (100.0%), and Law Enforcement (100.0%), while the most female-oriented occupations are Healthcare Support (100.0%), Food Preparation & Serving (31.1%), and Personal Care & Service (17.2%).
| Occupation | Male | Female |
| Healthcare Support | 0 (0.0%) | 65 (100.0%) |
| Security & Protection | 84 (100.0%) | 0 (0.0%) |
| Firefighting & Prevention | 57 (100.0%) | 0 (0.0%) |
| Law Enforcement | 27 (100.0%) | 0 (0.0%) |
| Food Preparation & Serving | 62 (68.9%) | 28 (31.1%) |
| Cleaning & Maintenance | 224 (100.0%) | 0 (0.0%) |
| Personal Care & Service | 77 (82.8%) | 16 (17.2%) |
| Total (Category) | 447 (80.4%) | 109 (19.6%) |
| Total (Overall) | 1,624 (63.7%) | 924 (36.3%) |
Sales and Office Occupations
The most common Sales and Office occupations in Pollock Pines are Office & Administration (334 | 13.1%), and Sales & Related (155 | 6.1%).
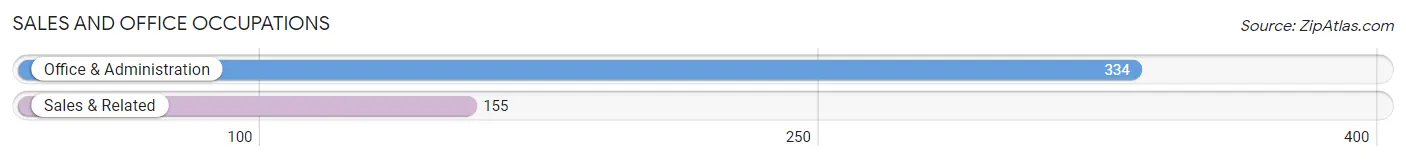
Sales and Office Occupations by Sex
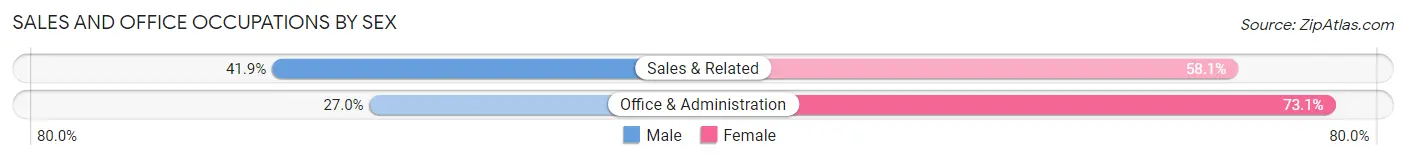
| Occupation | Male | Female |
| Sales & Related | 65 (41.9%) | 90 (58.1%) |
| Office & Administration | 90 (27.0%) | 244 (73.1%) |
| Total (Category) | 155 (31.7%) | 334 (68.3%) |
| Total (Overall) | 1,624 (63.7%) | 924 (36.3%) |
Natural Resources, Construction and Maintenance Occupations
The most common Natural Resources, Construction and Maintenance occupations in Pollock Pines are Installation, Maintenance & Repair (135 | 5.3%), and Construction & Extraction (130 | 5.1%).
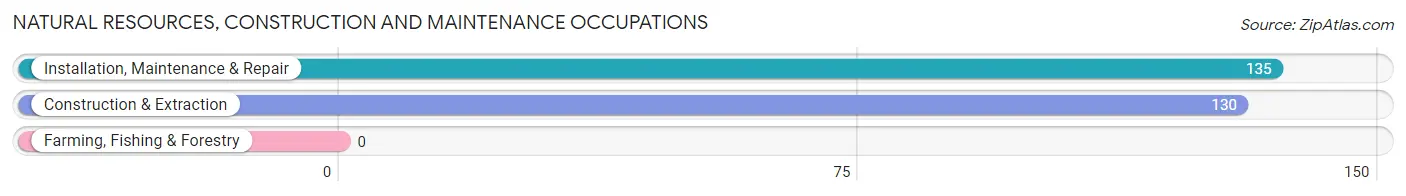
Natural Resources, Construction and Maintenance Occupations by Sex
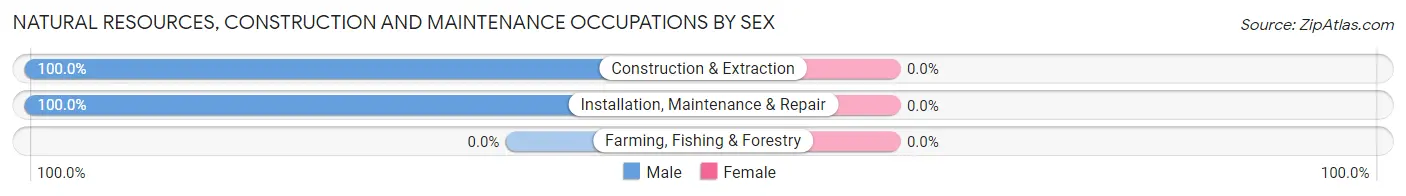
| Occupation | Male | Female |
| Farming, Fishing & Forestry | 0 (0.0%) | 0 (0.0%) |
| Construction & Extraction | 130 (100.0%) | 0 (0.0%) |
| Installation, Maintenance & Repair | 135 (100.0%) | 0 (0.0%) |
| Total (Category) | 265 (100.0%) | 0 (0.0%) |
| Total (Overall) | 1,624 (63.7%) | 924 (36.3%) |
Production, Transportation and Moving Occupations
The most common Production, Transportation and Moving occupations in Pollock Pines are Material Moving (105 | 4.1%), Production (96 | 3.8%), and Transportation (91 | 3.6%).
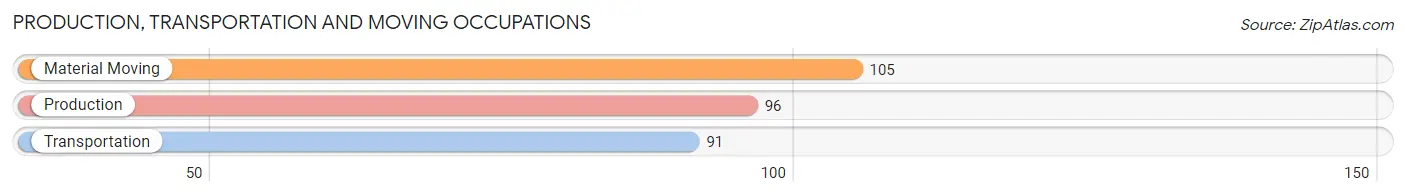
Production, Transportation and Moving Occupations by Sex

| Occupation | Male | Female |
| Production | 92 (95.8%) | 4 (4.2%) |
| Transportation | 86 (94.5%) | 5 (5.5%) |
| Material Moving | 105 (100.0%) | 0 (0.0%) |
| Total (Category) | 283 (96.9%) | 9 (3.1%) |
| Total (Overall) | 1,624 (63.7%) | 924 (36.3%) |
Employment Industries by Sex in Pollock Pines
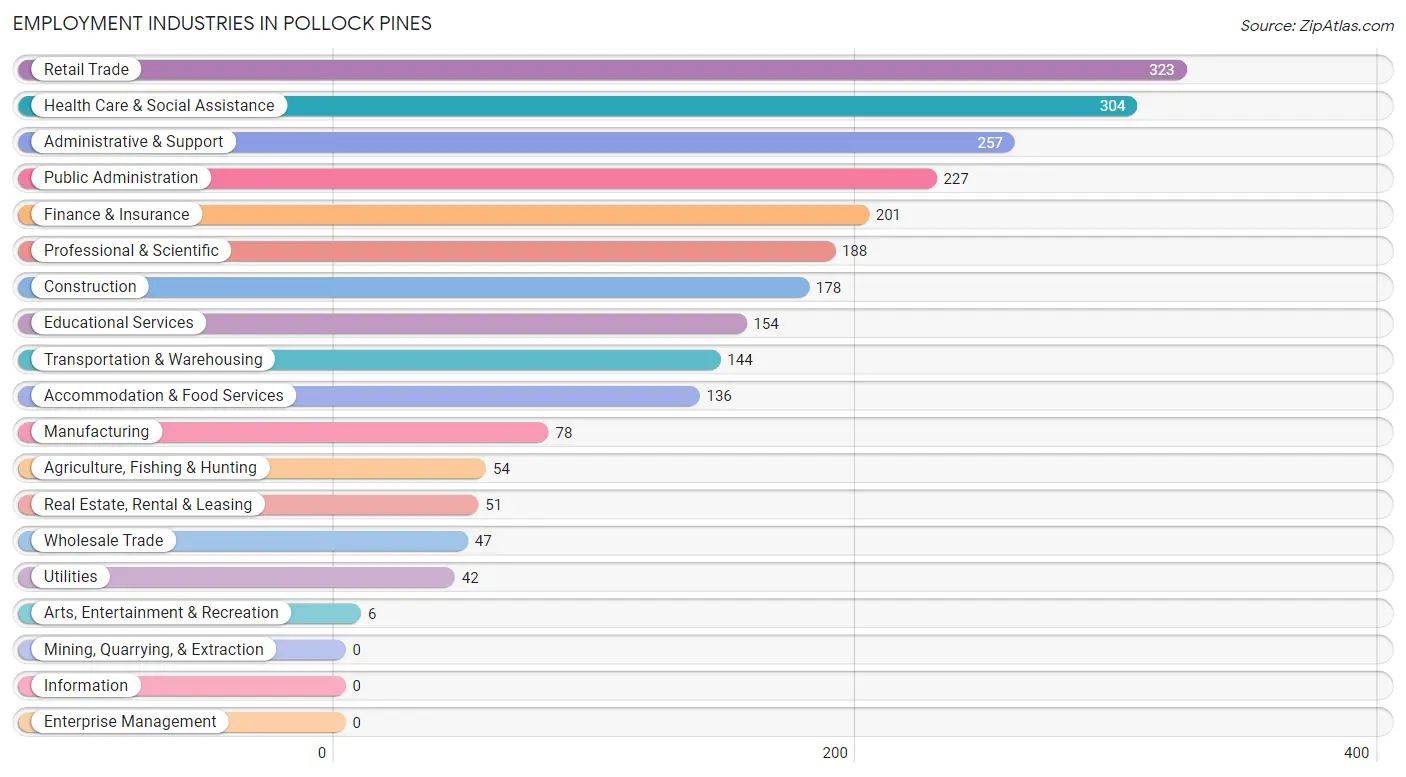
Employment Industries in Pollock Pines
The major employment industries in Pollock Pines include Retail Trade (323 | 12.7%), Health Care & Social Assistance (304 | 11.9%), Administrative & Support (257 | 10.1%), Public Administration (227 | 8.9%), and Finance & Insurance (201 | 7.9%).
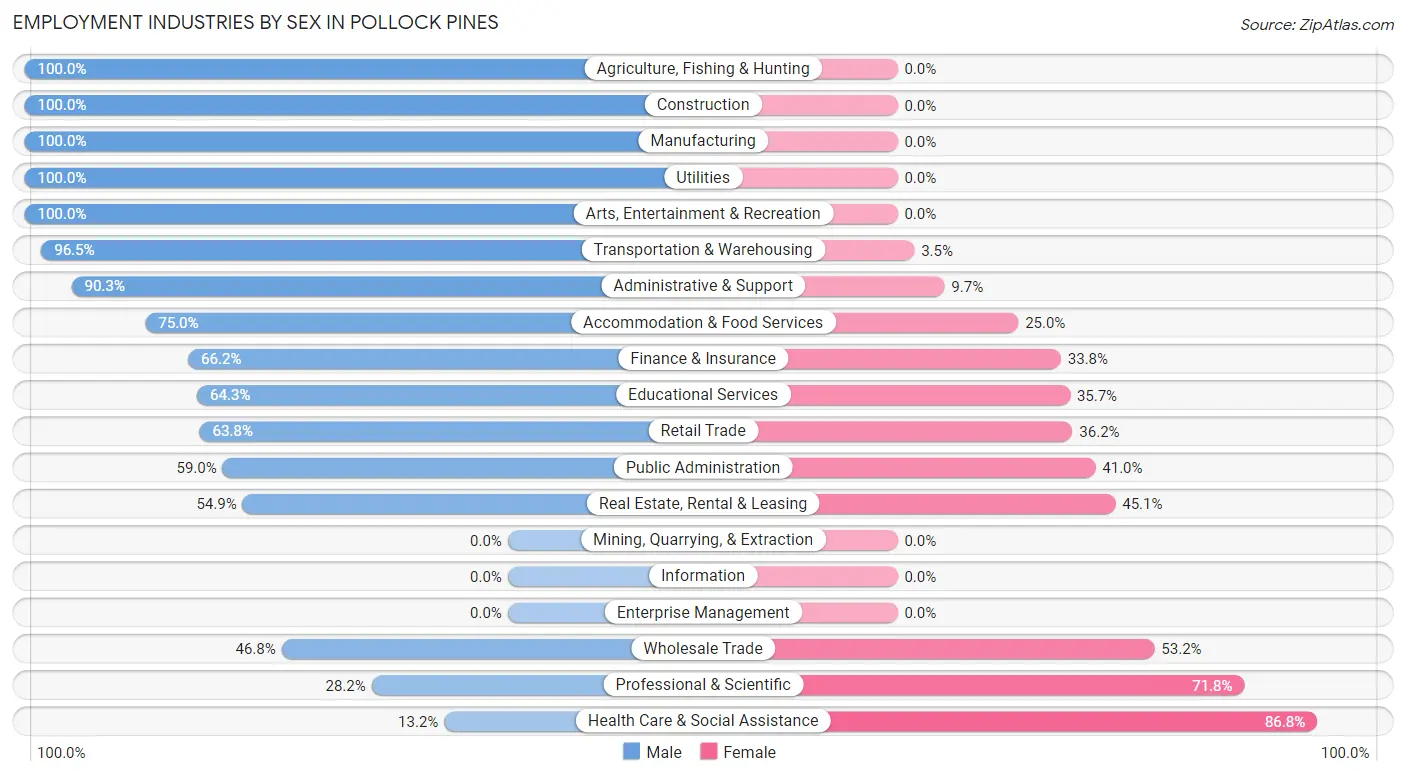
Employment Industries by Sex in Pollock Pines
The Pollock Pines industries that see more men than women are Agriculture, Fishing & Hunting (100.0%), Construction (100.0%), and Manufacturing (100.0%), whereas the industries that tend to have a higher number of women are Health Care & Social Assistance (86.8%), Professional & Scientific (71.8%), and Wholesale Trade (53.2%).
| Industry | Male | Female |
| Agriculture, Fishing & Hunting | 54 (100.0%) | 0 (0.0%) |
| Mining, Quarrying, & Extraction | 0 (0.0%) | 0 (0.0%) |
| Construction | 178 (100.0%) | 0 (0.0%) |
| Manufacturing | 78 (100.0%) | 0 (0.0%) |
| Wholesale Trade | 22 (46.8%) | 25 (53.2%) |
| Retail Trade | 206 (63.8%) | 117 (36.2%) |
| Transportation & Warehousing | 139 (96.5%) | 5 (3.5%) |
| Utilities | 42 (100.0%) | 0 (0.0%) |
| Information | 0 (0.0%) | 0 (0.0%) |
| Finance & Insurance | 133 (66.2%) | 68 (33.8%) |
| Real Estate, Rental & Leasing | 28 (54.9%) | 23 (45.1%) |
| Professional & Scientific | 53 (28.2%) | 135 (71.8%) |
| Enterprise Management | 0 (0.0%) | 0 (0.0%) |
| Administrative & Support | 232 (90.3%) | 25 (9.7%) |
| Educational Services | 99 (64.3%) | 55 (35.7%) |
| Health Care & Social Assistance | 40 (13.2%) | 264 (86.8%) |
| Arts, Entertainment & Recreation | 6 (100.0%) | 0 (0.0%) |
| Accommodation & Food Services | 102 (75.0%) | 34 (25.0%) |
| Public Administration | 134 (59.0%) | 93 (41.0%) |
| Total | 1,624 (63.7%) | 924 (36.3%) |
Education in Pollock Pines
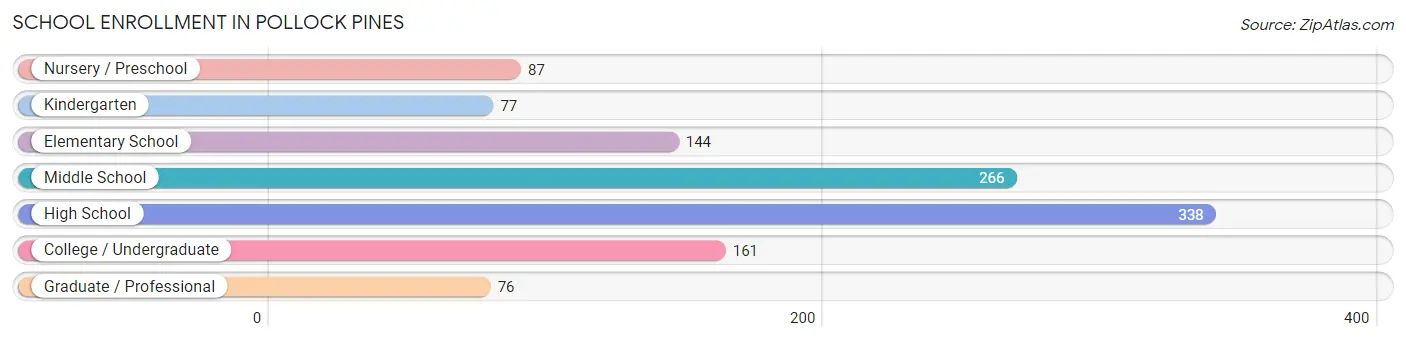
School Enrollment in Pollock Pines
The most common levels of schooling among the 1,149 students in Pollock Pines are high school (338 | 29.4%), middle school (266 | 23.2%), and college / undergraduate (161 | 14.0%).
| School Level | # Students | % Students |
| Nursery / Preschool | 87 | 7.6% |
| Kindergarten | 77 | 6.7% |
| Elementary School | 144 | 12.5% |
| Middle School | 266 | 23.2% |
| High School | 338 | 29.4% |
| College / Undergraduate | 161 | 14.0% |
| Graduate / Professional | 76 | 6.6% |
| Total | 1,149 | 100.0% |
School Enrollment by Age by Funding Source in Pollock Pines
Out of a total of 1,149 students who are enrolled in schools in Pollock Pines, 159 (13.8%) attend a private institution, while the remaining 990 (86.2%) are enrolled in public schools. The age group of 25 to 34 year olds has the highest likelihood of being enrolled in private schools, with 41 (83.7% in the age bracket) enrolled. Conversely, the age group of 20 to 24 year olds has the lowest likelihood of being enrolled in a private school, with 91 (100.0% in the age bracket) attending a public institution.
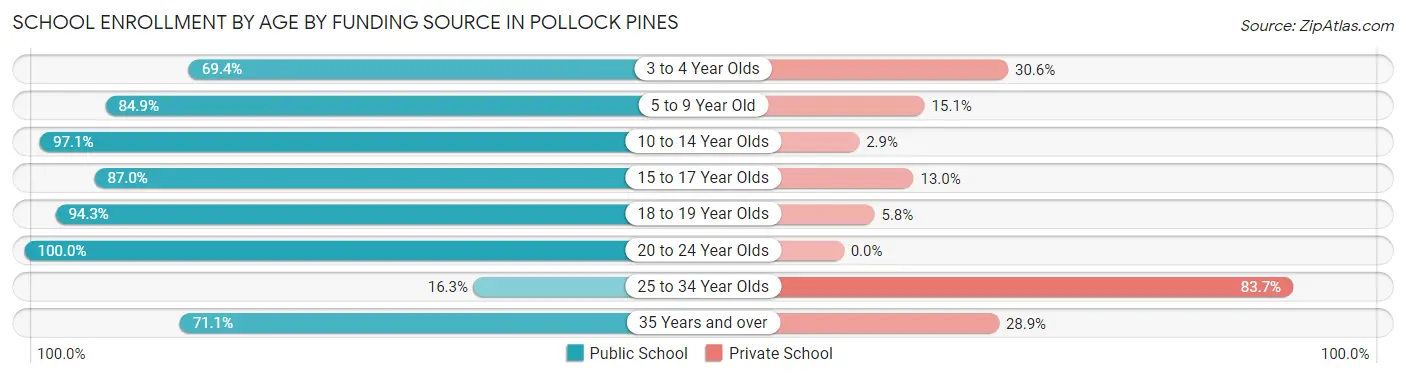
| Age Bracket | Public School | Private School |
| 3 to 4 Year Olds | 34 (69.4%) | 15 (30.6%) |
| 5 to 9 Year Old | 214 (84.9%) | 38 (15.1%) |
| 10 to 14 Year Olds | 336 (97.1%) | 10 (2.9%) |
| 15 to 17 Year Olds | 167 (87.0%) | 25 (13.0%) |
| 18 to 19 Year Olds | 82 (94.3%) | 5 (5.8%) |
| 20 to 24 Year Olds | 91 (100.0%) | 0 (0.0%) |
| 25 to 34 Year Olds | 8 (16.3%) | 41 (83.7%) |
| 35 Years and over | 59 (71.1%) | 24 (28.9%) |
| Total | 990 (86.2%) | 159 (13.8%) |
Educational Attainment by Field of Study in Pollock Pines
Business (148 | 14.2%), science & technology (94 | 9.0%), education (90 | 8.6%), social sciences (86 | 8.3%), and bio, nature & agricultural (83 | 8.0%) are the most common fields of study among 1,040 individuals in Pollock Pines who have obtained a bachelor's degree or higher.
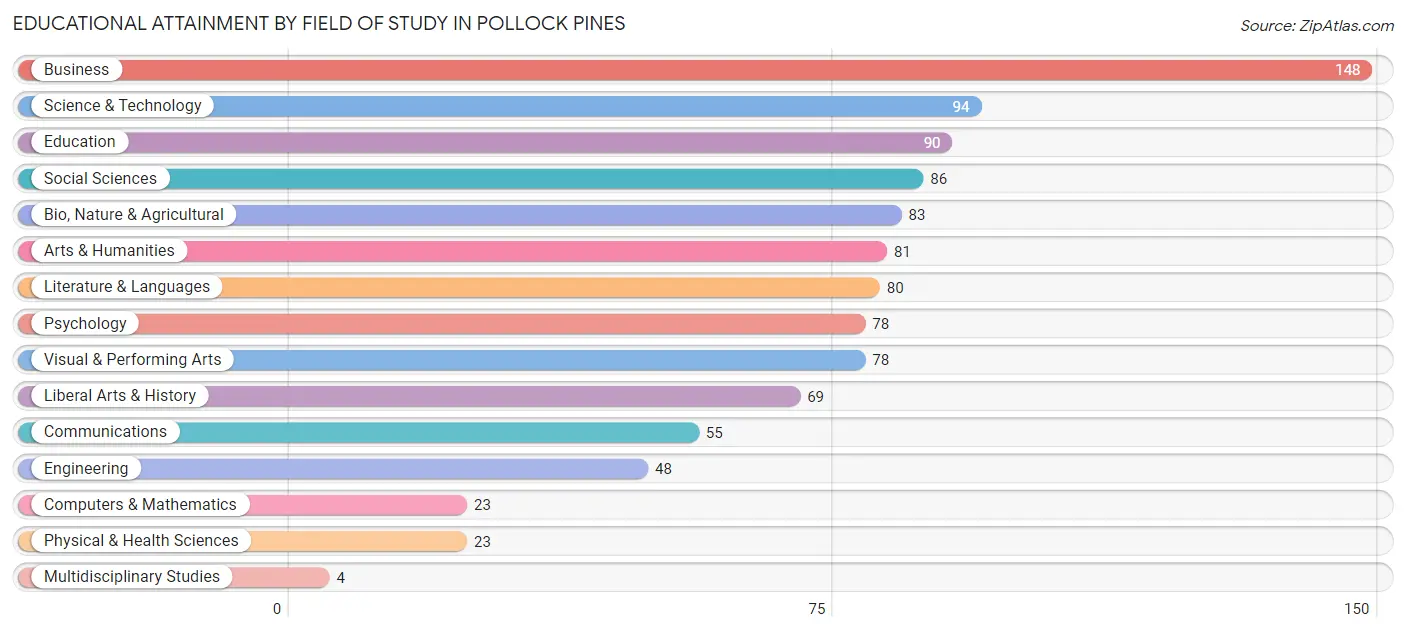
| Field of Study | # Graduates | % Graduates |
| Computers & Mathematics | 23 | 2.2% |
| Bio, Nature & Agricultural | 83 | 8.0% |
| Physical & Health Sciences | 23 | 2.2% |
| Psychology | 78 | 7.5% |
| Social Sciences | 86 | 8.3% |
| Engineering | 48 | 4.6% |
| Multidisciplinary Studies | 4 | 0.4% |
| Science & Technology | 94 | 9.0% |
| Business | 148 | 14.2% |
| Education | 90 | 8.6% |
| Literature & Languages | 80 | 7.7% |
| Liberal Arts & History | 69 | 6.6% |
| Visual & Performing Arts | 78 | 7.5% |
| Communications | 55 | 5.3% |
| Arts & Humanities | 81 | 7.8% |
| Total | 1,040 | 100.0% |
Transportation & Commute in Pollock Pines
Vehicle Availability by Sex in Pollock Pines
The most prevalent vehicle ownership categories in Pollock Pines are males with 2 vehicles (497, accounting for 30.6%) and females with 2 vehicles (336, making up 55.0%).
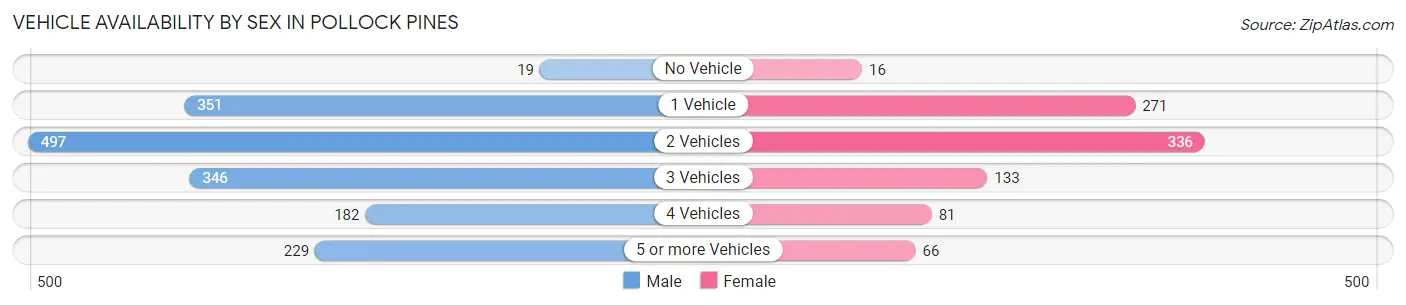
| Vehicles Available | Male | Female |
| No Vehicle | 19 (1.2%) | 16 (1.8%) |
| 1 Vehicle | 351 (21.6%) | 271 (30.0%) |
| 2 Vehicles | 497 (30.6%) | 336 (37.2%) |
| 3 Vehicles | 346 (21.3%) | 133 (14.7%) |
| 4 Vehicles | 182 (11.2%) | 81 (9.0%) |
| 5 or more Vehicles | 229 (14.1%) | 66 (7.3%) |
| Total | 1,624 (100.0%) | 903 (100.0%) |
Commute Time in Pollock Pines
The most frequently occuring commute durations in Pollock Pines are 20 to 24 minutes (390 commuters, 17.4%), 30 to 34 minutes (388 commuters, 17.3%), and 15 to 19 minutes (235 commuters, 10.5%).
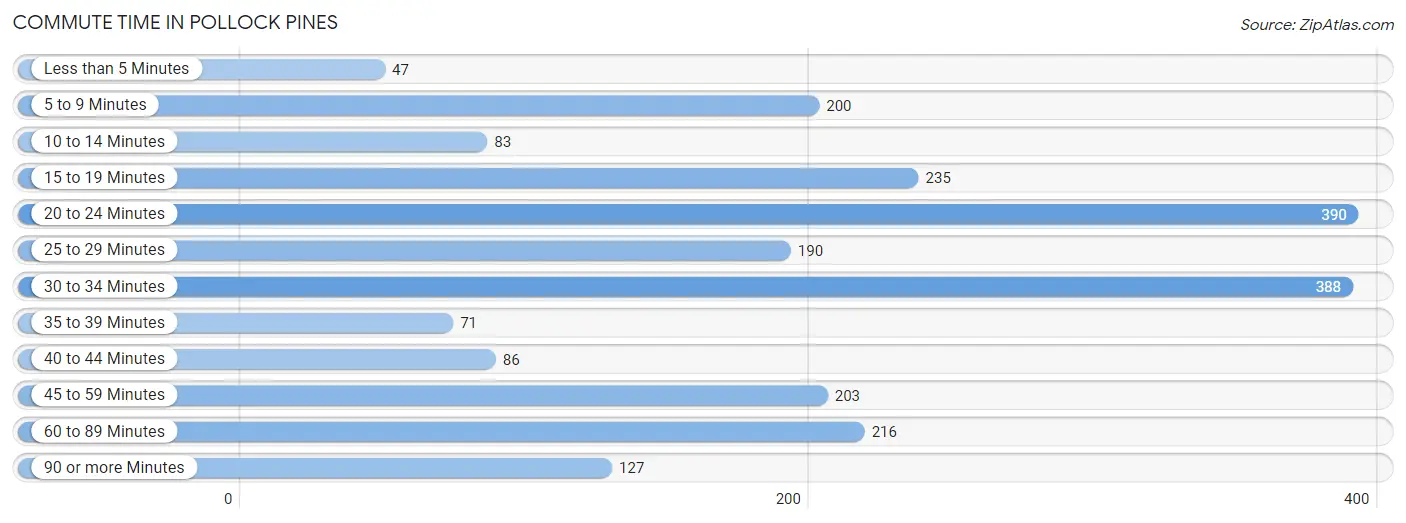
| Commute Time | # Commuters | % Commuters |
| Less than 5 Minutes | 47 | 2.1% |
| 5 to 9 Minutes | 200 | 8.9% |
| 10 to 14 Minutes | 83 | 3.7% |
| 15 to 19 Minutes | 235 | 10.5% |
| 20 to 24 Minutes | 390 | 17.4% |
| 25 to 29 Minutes | 190 | 8.5% |
| 30 to 34 Minutes | 388 | 17.3% |
| 35 to 39 Minutes | 71 | 3.2% |
| 40 to 44 Minutes | 86 | 3.8% |
| 45 to 59 Minutes | 203 | 9.1% |
| 60 to 89 Minutes | 216 | 9.7% |
| 90 or more Minutes | 127 | 5.7% |
Commute Time by Sex in Pollock Pines
The most common commute times in Pollock Pines are 20 to 24 minutes (321 commuters, 22.3%) for males and 15 to 19 minutes (160 commuters, 20.0%) for females.
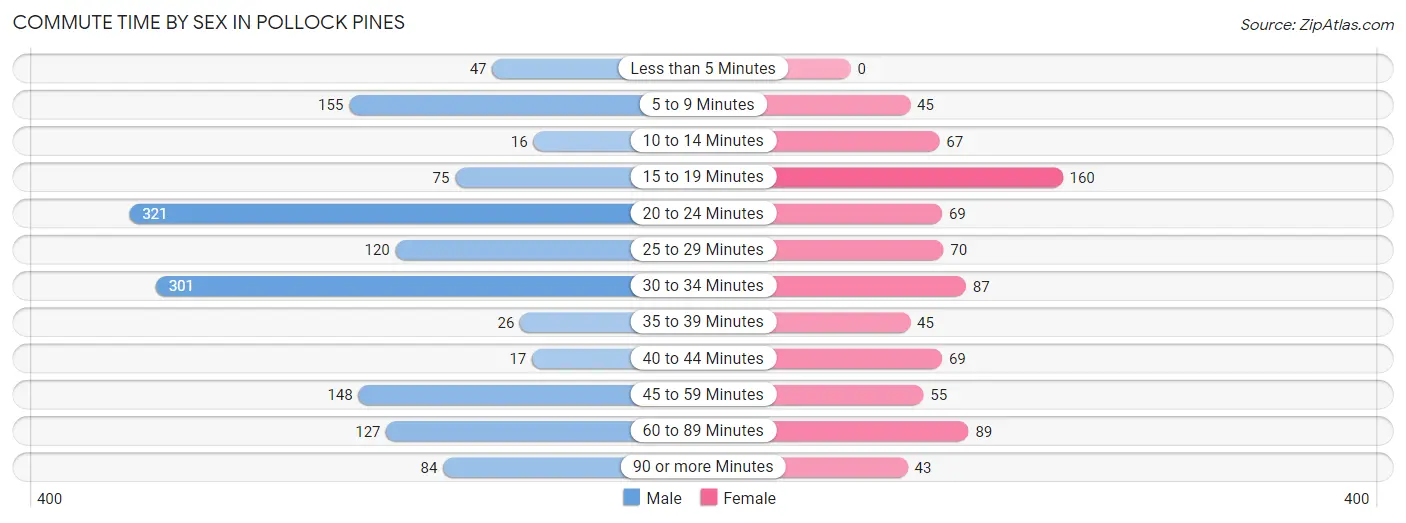
| Commute Time | Male | Female |
| Less than 5 Minutes | 47 (3.3%) | 0 (0.0%) |
| 5 to 9 Minutes | 155 (10.8%) | 45 (5.6%) |
| 10 to 14 Minutes | 16 (1.1%) | 67 (8.4%) |
| 15 to 19 Minutes | 75 (5.2%) | 160 (20.0%) |
| 20 to 24 Minutes | 321 (22.3%) | 69 (8.6%) |
| 25 to 29 Minutes | 120 (8.4%) | 70 (8.8%) |
| 30 to 34 Minutes | 301 (20.9%) | 87 (10.9%) |
| 35 to 39 Minutes | 26 (1.8%) | 45 (5.6%) |
| 40 to 44 Minutes | 17 (1.2%) | 69 (8.6%) |
| 45 to 59 Minutes | 148 (10.3%) | 55 (6.9%) |
| 60 to 89 Minutes | 127 (8.8%) | 89 (11.1%) |
| 90 or more Minutes | 84 (5.9%) | 43 (5.4%) |
Time of Departure to Work by Sex in Pollock Pines
The most frequent times of departure to work in Pollock Pines are 7:30 AM to 7:59 AM (337, 23.4%) for males and 7:30 AM to 7:59 AM (230, 28.8%) for females.
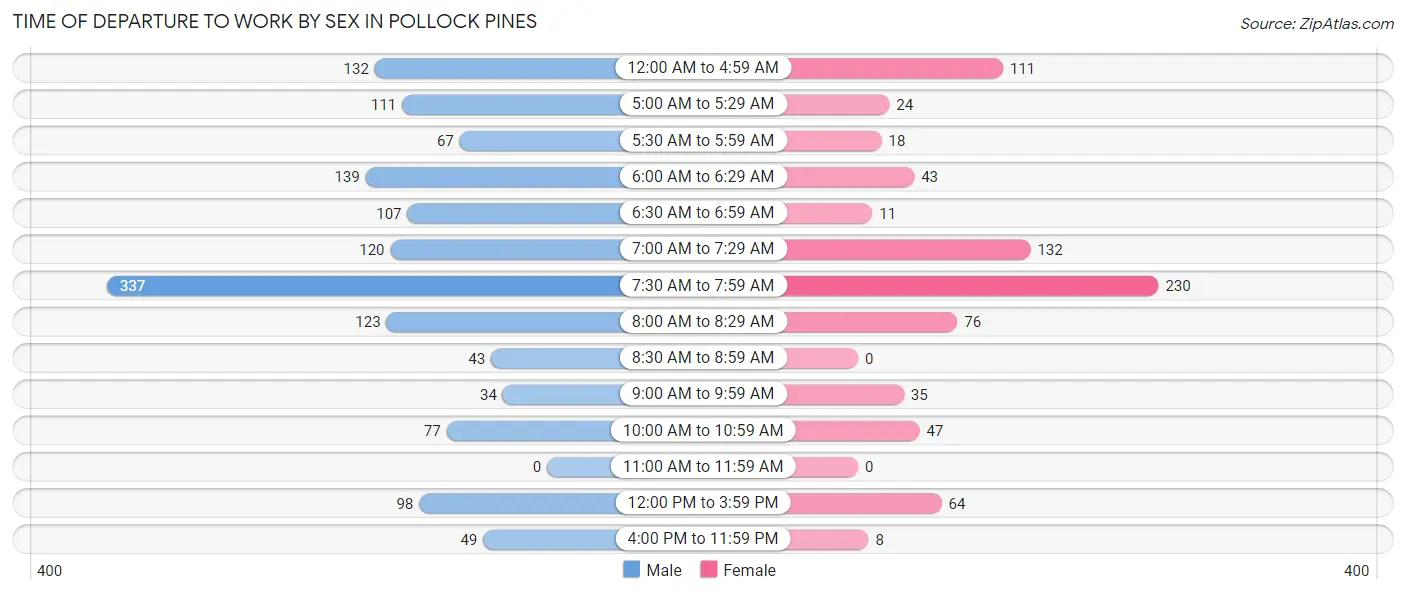
| Time of Departure | Male | Female |
| 12:00 AM to 4:59 AM | 132 (9.2%) | 111 (13.9%) |
| 5:00 AM to 5:29 AM | 111 (7.7%) | 24 (3.0%) |
| 5:30 AM to 5:59 AM | 67 (4.7%) | 18 (2.2%) |
| 6:00 AM to 6:29 AM | 139 (9.7%) | 43 (5.4%) |
| 6:30 AM to 6:59 AM | 107 (7.4%) | 11 (1.4%) |
| 7:00 AM to 7:29 AM | 120 (8.4%) | 132 (16.5%) |
| 7:30 AM to 7:59 AM | 337 (23.4%) | 230 (28.8%) |
| 8:00 AM to 8:29 AM | 123 (8.6%) | 76 (9.5%) |
| 8:30 AM to 8:59 AM | 43 (3.0%) | 0 (0.0%) |
| 9:00 AM to 9:59 AM | 34 (2.4%) | 35 (4.4%) |
| 10:00 AM to 10:59 AM | 77 (5.4%) | 47 (5.9%) |
| 11:00 AM to 11:59 AM | 0 (0.0%) | 0 (0.0%) |
| 12:00 PM to 3:59 PM | 98 (6.8%) | 64 (8.0%) |
| 4:00 PM to 11:59 PM | 49 (3.4%) | 8 (1.0%) |
| Total | 1,437 (100.0%) | 799 (100.0%) |
Housing Occupancy in Pollock Pines
Occupancy by Ownership in Pollock Pines
Of the total 2,712 dwellings in Pollock Pines, owner-occupied units account for 1,993 (73.5%), while renter-occupied units make up 719 (26.5%).
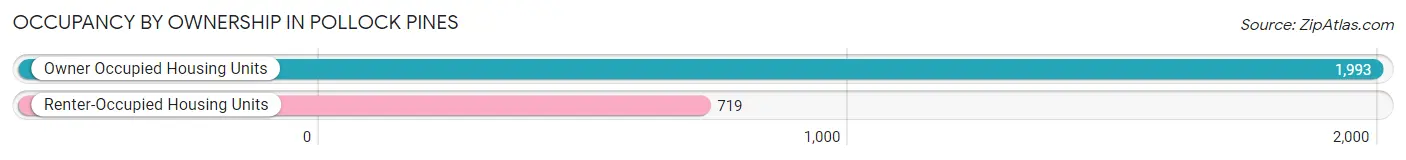
| Occupancy | # Housing Units | % Housing Units |
| Owner Occupied Housing Units | 1,993 | 73.5% |
| Renter-Occupied Housing Units | 719 | 26.5% |
| Total Occupied Housing Units | 2,712 | 100.0% |
Occupancy by Household Size in Pollock Pines
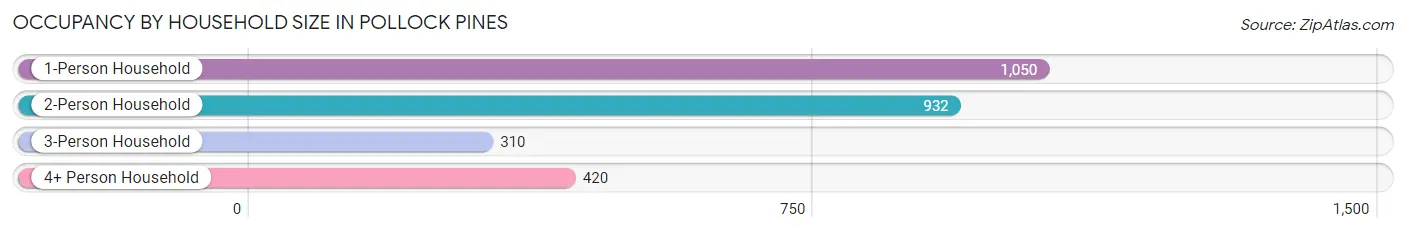
| Household Size | # Housing Units | % Housing Units |
| 1-Person Household | 1,050 | 38.7% |
| 2-Person Household | 932 | 34.4% |
| 3-Person Household | 310 | 11.4% |
| 4+ Person Household | 420 | 15.5% |
| Total Housing Units | 2,712 | 100.0% |
Occupancy by Ownership by Household Size in Pollock Pines
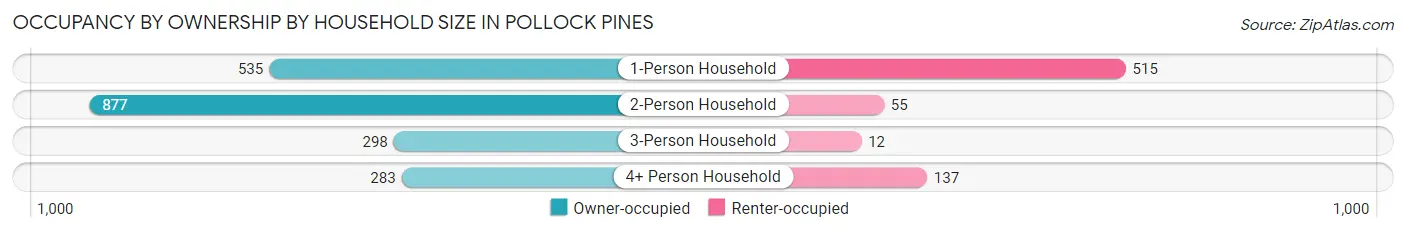
| Household Size | Owner-occupied | Renter-occupied |
| 1-Person Household | 535 (50.9%) | 515 (49.0%) |
| 2-Person Household | 877 (94.1%) | 55 (5.9%) |
| 3-Person Household | 298 (96.1%) | 12 (3.9%) |
| 4+ Person Household | 283 (67.4%) | 137 (32.6%) |
| Total Housing Units | 1,993 (73.5%) | 719 (26.5%) |
Occupancy by Educational Attainment in Pollock Pines
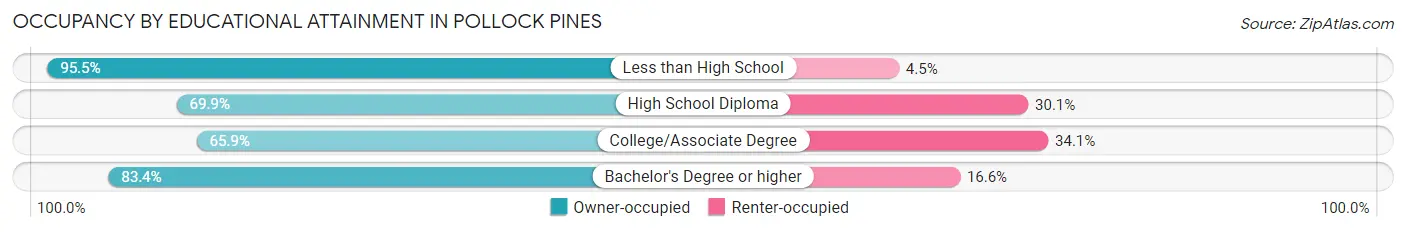
| Household Size | Owner-occupied | Renter-occupied |
| Less than High School | 254 (95.5%) | 12 (4.5%) |
| High School Diploma | 436 (69.9%) | 188 (30.1%) |
| College/Associate Degree | 816 (65.9%) | 422 (34.1%) |
| Bachelor's Degree or higher | 487 (83.4%) | 97 (16.6%) |
Occupancy by Age of Householder in Pollock Pines
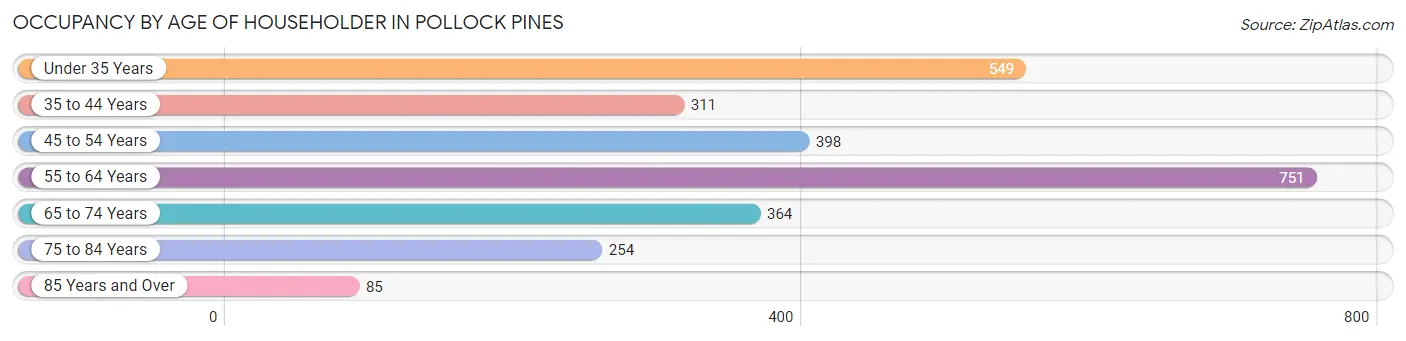
| Age Bracket | # Households | % Households |
| Under 35 Years | 549 | 20.2% |
| 35 to 44 Years | 311 | 11.5% |
| 45 to 54 Years | 398 | 14.7% |
| 55 to 64 Years | 751 | 27.7% |
| 65 to 74 Years | 364 | 13.4% |
| 75 to 84 Years | 254 | 9.4% |
| 85 Years and Over | 85 | 3.1% |
| Total | 2,712 | 100.0% |
Housing Finances in Pollock Pines
Median Income by Occupancy in Pollock Pines
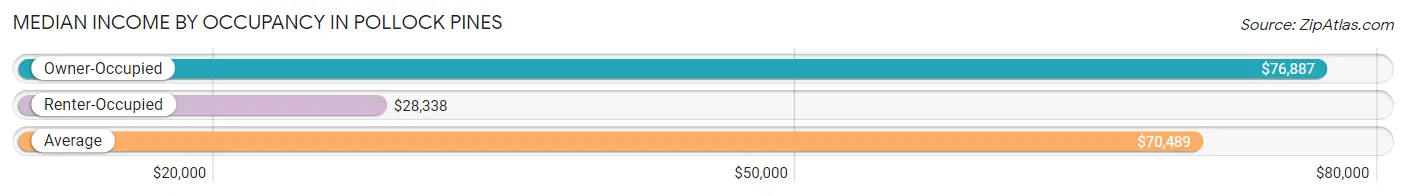
| Occupancy Type | # Households | Median Income |
| Owner-Occupied | 1,993 (73.5%) | $76,887 |
| Renter-Occupied | 719 (26.5%) | $28,338 |
| Average | 2,712 (100.0%) | $70,489 |
Occupancy by Householder Income Bracket in Pollock Pines
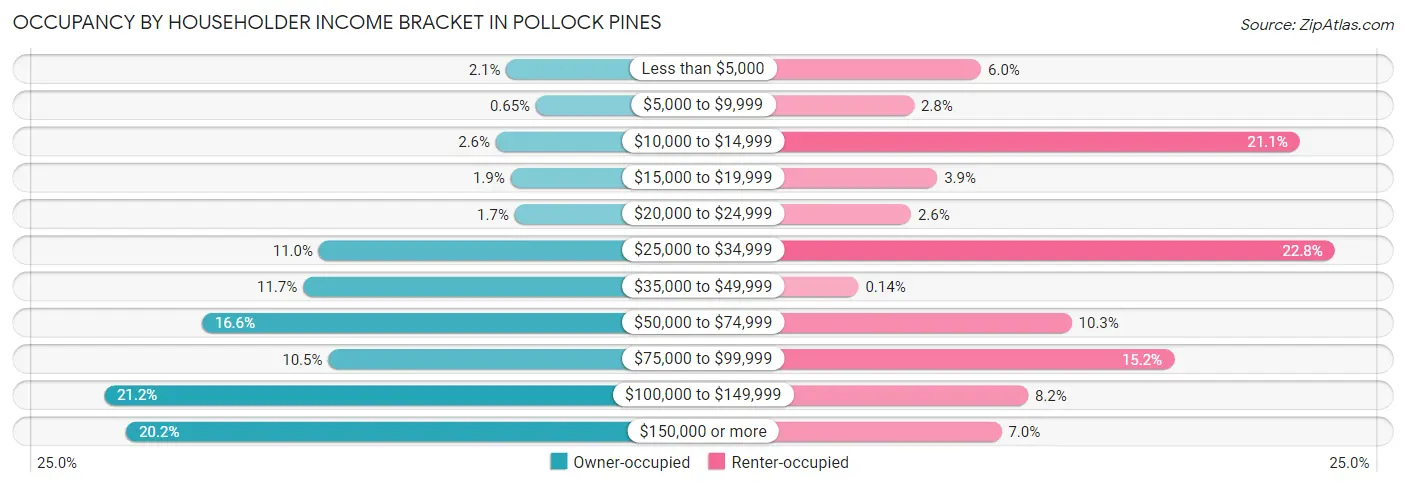
| Income Bracket | Owner-occupied | Renter-occupied |
| Less than $5,000 | 41 (2.1%) | 43 (6.0%) |
| $5,000 to $9,999 | 13 (0.6%) | 20 (2.8%) |
| $10,000 to $14,999 | 51 (2.6%) | 152 (21.1%) |
| $15,000 to $19,999 | 37 (1.9%) | 28 (3.9%) |
| $20,000 to $24,999 | 33 (1.7%) | 19 (2.6%) |
| $25,000 to $34,999 | 219 (11.0%) | 164 (22.8%) |
| $35,000 to $49,999 | 234 (11.7%) | 1 (0.1%) |
| $50,000 to $74,999 | 330 (16.6%) | 74 (10.3%) |
| $75,000 to $99,999 | 210 (10.5%) | 109 (15.2%) |
| $100,000 to $149,999 | 423 (21.2%) | 59 (8.2%) |
| $150,000 or more | 402 (20.2%) | 50 (7.0%) |
| Total | 1,993 (100.0%) | 719 (100.0%) |
Monthly Housing Cost Tiers in Pollock Pines
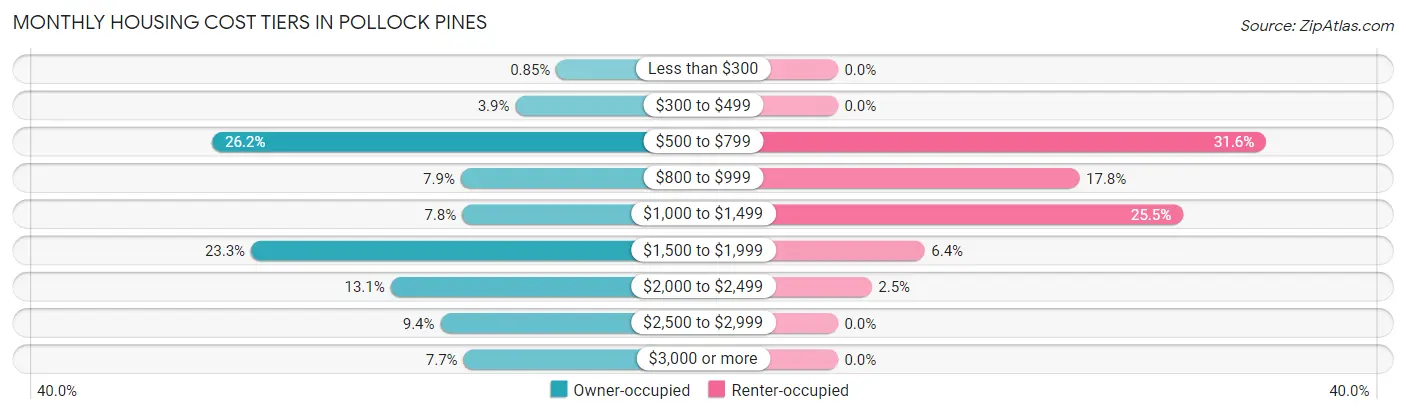
| Monthly Cost | Owner-occupied | Renter-occupied |
| Less than $300 | 17 (0.9%) | 0 (0.0%) |
| $300 to $499 | 77 (3.9%) | 0 (0.0%) |
| $500 to $799 | 522 (26.2%) | 227 (31.6%) |
| $800 to $999 | 157 (7.9%) | 128 (17.8%) |
| $1,000 to $1,499 | 155 (7.8%) | 183 (25.5%) |
| $1,500 to $1,999 | 465 (23.3%) | 46 (6.4%) |
| $2,000 to $2,499 | 260 (13.1%) | 18 (2.5%) |
| $2,500 to $2,999 | 187 (9.4%) | 0 (0.0%) |
| $3,000 or more | 153 (7.7%) | 0 (0.0%) |
| Total | 1,993 (100.0%) | 719 (100.0%) |
Physical Housing Characteristics in Pollock Pines
Housing Structures in Pollock Pines
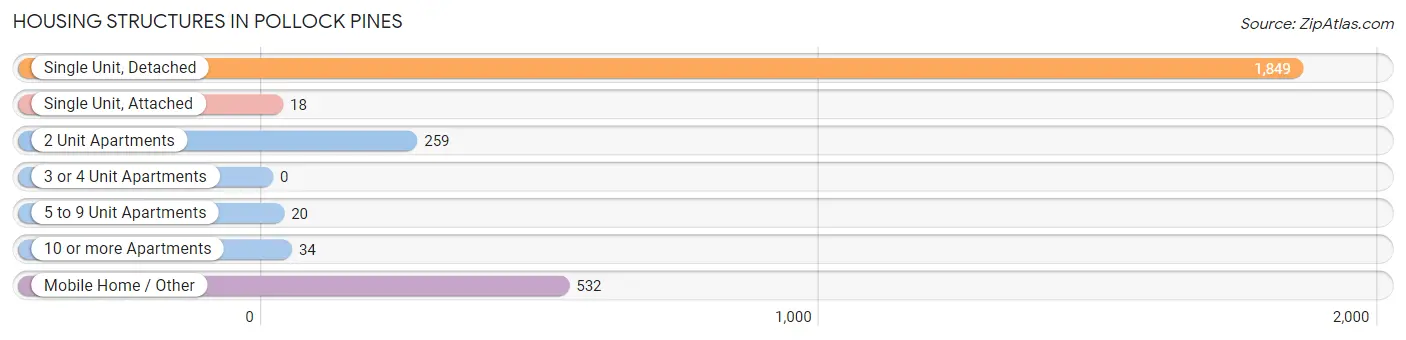
| Structure Type | # Housing Units | % Housing Units |
| Single Unit, Detached | 1,849 | 68.2% |
| Single Unit, Attached | 18 | 0.7% |
| 2 Unit Apartments | 259 | 9.6% |
| 3 or 4 Unit Apartments | 0 | 0.0% |
| 5 to 9 Unit Apartments | 20 | 0.7% |
| 10 or more Apartments | 34 | 1.3% |
| Mobile Home / Other | 532 | 19.6% |
| Total | 2,712 | 100.0% |
Housing Structures by Occupancy in Pollock Pines
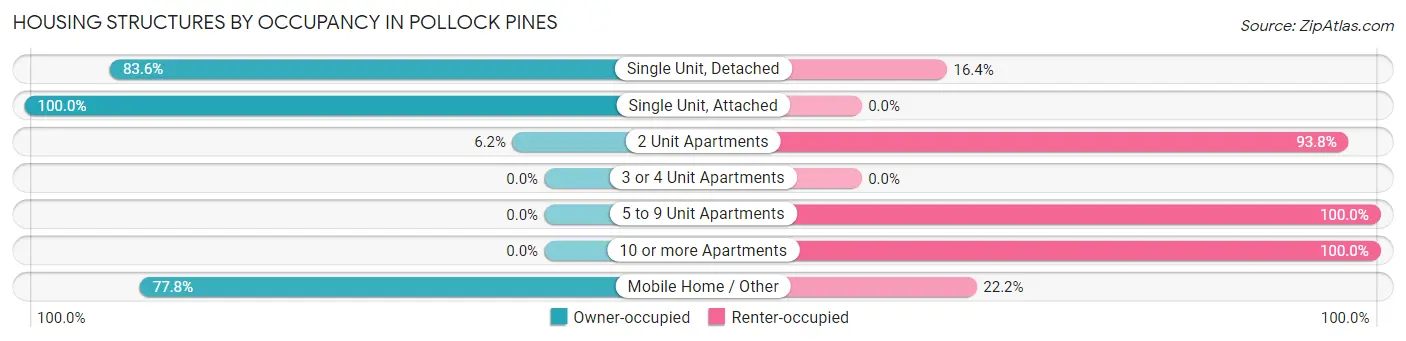
| Structure Type | Owner-occupied | Renter-occupied |
| Single Unit, Detached | 1,545 (83.6%) | 304 (16.4%) |
| Single Unit, Attached | 18 (100.0%) | 0 (0.0%) |
| 2 Unit Apartments | 16 (6.2%) | 243 (93.8%) |
| 3 or 4 Unit Apartments | 0 (0.0%) | 0 (0.0%) |
| 5 to 9 Unit Apartments | 0 (0.0%) | 20 (100.0%) |
| 10 or more Apartments | 0 (0.0%) | 34 (100.0%) |
| Mobile Home / Other | 414 (77.8%) | 118 (22.2%) |
| Total | 1,993 (73.5%) | 719 (26.5%) |
Housing Structures by Number of Rooms in Pollock Pines
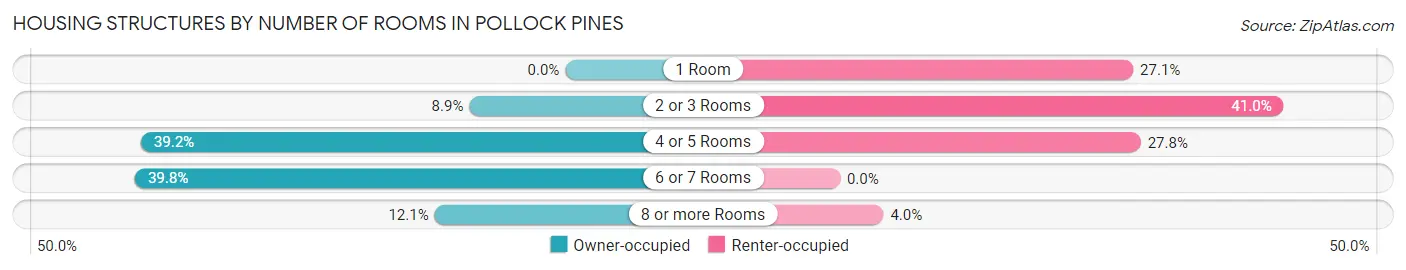
| Number of Rooms | Owner-occupied | Renter-occupied |
| 1 Room | 0 (0.0%) | 195 (27.1%) |
| 2 or 3 Rooms | 177 (8.9%) | 295 (41.0%) |
| 4 or 5 Rooms | 782 (39.2%) | 200 (27.8%) |
| 6 or 7 Rooms | 793 (39.8%) | 0 (0.0%) |
| 8 or more Rooms | 241 (12.1%) | 29 (4.0%) |
| Total | 1,993 (100.0%) | 719 (100.0%) |
Housing Structure by Heating Type in Pollock Pines
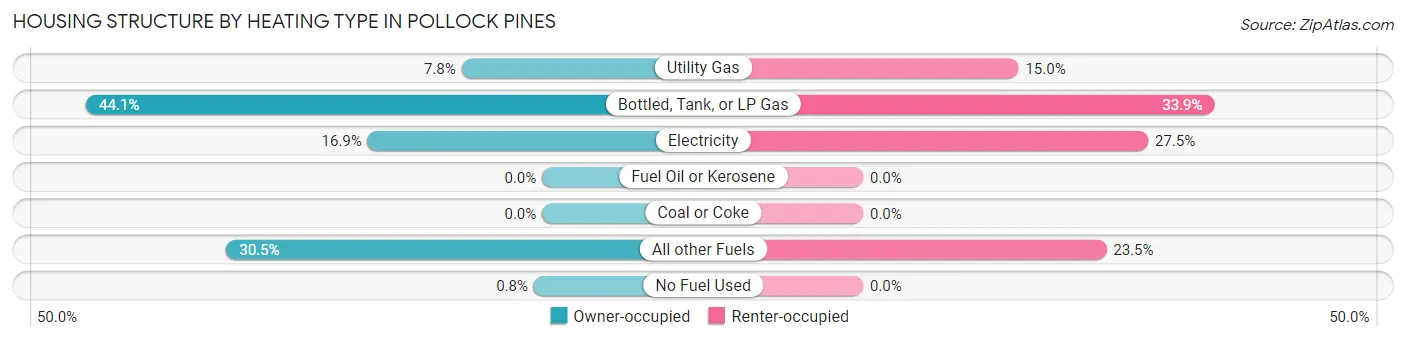
| Heating Type | Owner-occupied | Renter-occupied |
| Utility Gas | 155 (7.8%) | 108 (15.0%) |
| Bottled, Tank, or LP Gas | 878 (44.1%) | 244 (33.9%) |
| Electricity | 336 (16.9%) | 198 (27.5%) |
| Fuel Oil or Kerosene | 0 (0.0%) | 0 (0.0%) |
| Coal or Coke | 0 (0.0%) | 0 (0.0%) |
| All other Fuels | 608 (30.5%) | 169 (23.5%) |
| No Fuel Used | 16 (0.8%) | 0 (0.0%) |
| Total | 1,993 (100.0%) | 719 (100.0%) |
Household Vehicle Usage in Pollock Pines
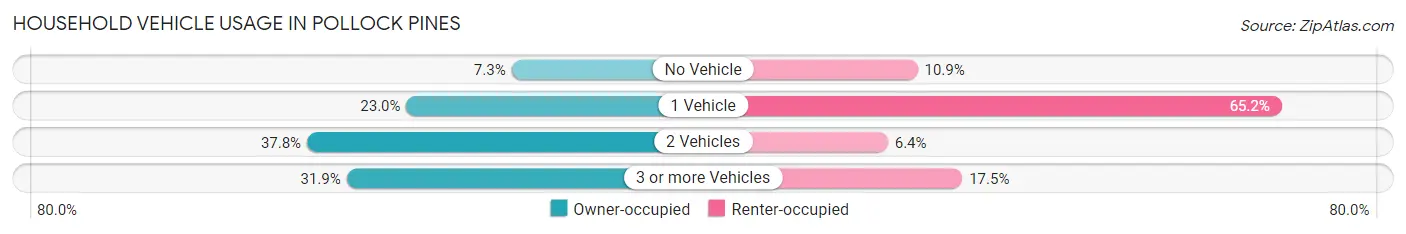
| Vehicles per Household | Owner-occupied | Renter-occupied |
| No Vehicle | 145 (7.3%) | 78 (10.8%) |
| 1 Vehicle | 458 (23.0%) | 469 (65.2%) |
| 2 Vehicles | 754 (37.8%) | 46 (6.4%) |
| 3 or more Vehicles | 636 (31.9%) | 126 (17.5%) |
| Total | 1,993 (100.0%) | 719 (100.0%) |
Real Estate & Mortgages in Pollock Pines
Real Estate and Mortgage Overview in Pollock Pines
| Characteristic | Without Mortgage | With Mortgage |
| Housing Units | 819 | 1,174 |
| Median Property Value | $285,000 | $400,500 |
| Median Household Income | $63,073 | $262 |
| Monthly Housing Costs | $665 | $153 |
| Real Estate Taxes | $1,805 | $21 |
Property Value by Mortgage Status in Pollock Pines
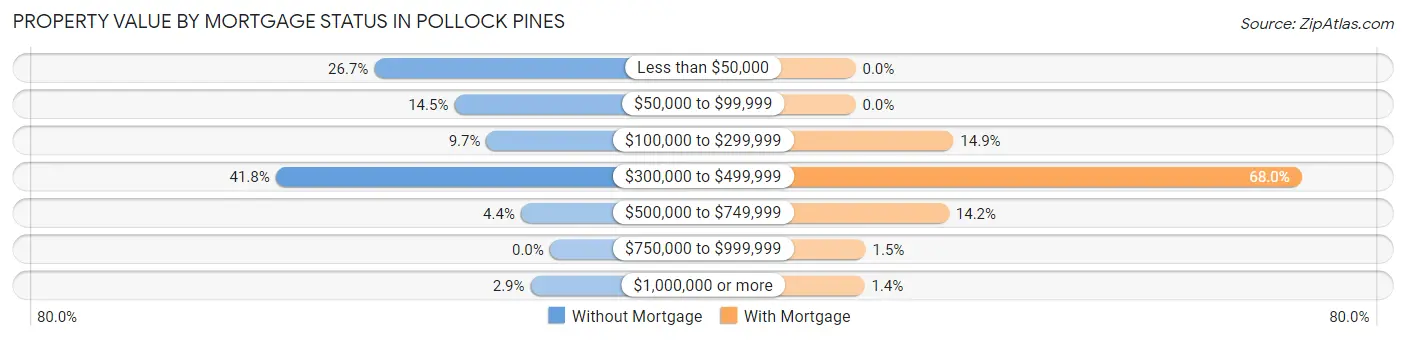
| Property Value | Without Mortgage | With Mortgage |
| Less than $50,000 | 219 (26.7%) | 0 (0.0%) |
| $50,000 to $99,999 | 119 (14.5%) | 0 (0.0%) |
| $100,000 to $299,999 | 79 (9.7%) | 175 (14.9%) |
| $300,000 to $499,999 | 342 (41.8%) | 798 (68.0%) |
| $500,000 to $749,999 | 36 (4.4%) | 167 (14.2%) |
| $750,000 to $999,999 | 0 (0.0%) | 18 (1.5%) |
| $1,000,000 or more | 24 (2.9%) | 16 (1.4%) |
| Total | 819 (100.0%) | 1,174 (100.0%) |
Household Income by Mortgage Status in Pollock Pines
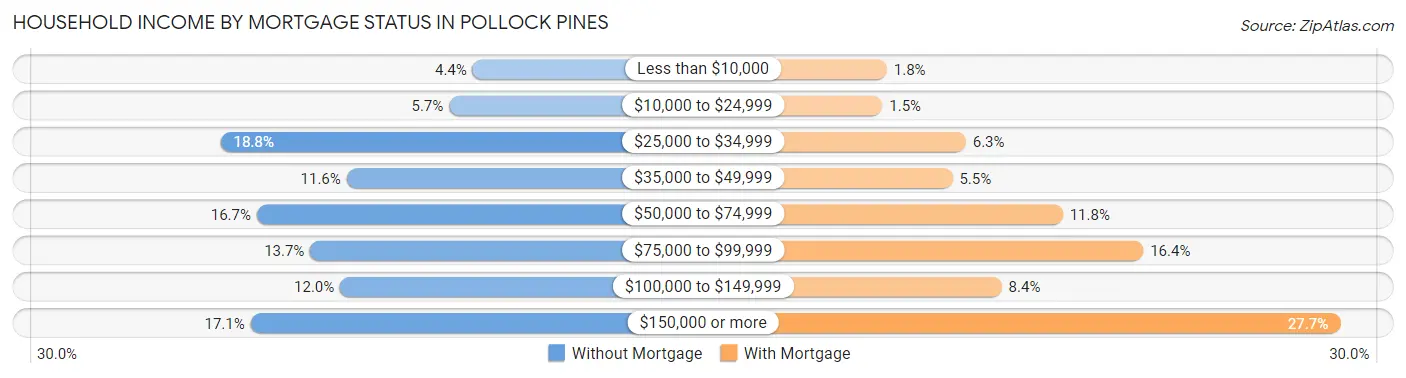
| Household Income | Without Mortgage | With Mortgage |
| Less than $10,000 | 36 (4.4%) | 21 (1.8%) |
| $10,000 to $24,999 | 47 (5.7%) | 18 (1.5%) |
| $25,000 to $34,999 | 154 (18.8%) | 74 (6.3%) |
| $35,000 to $49,999 | 95 (11.6%) | 65 (5.5%) |
| $50,000 to $74,999 | 137 (16.7%) | 139 (11.8%) |
| $75,000 to $99,999 | 112 (13.7%) | 193 (16.4%) |
| $100,000 to $149,999 | 98 (12.0%) | 98 (8.4%) |
| $150,000 or more | 140 (17.1%) | 325 (27.7%) |
| Total | 819 (100.0%) | 1,174 (100.0%) |
Property Value to Household Income Ratio in Pollock Pines
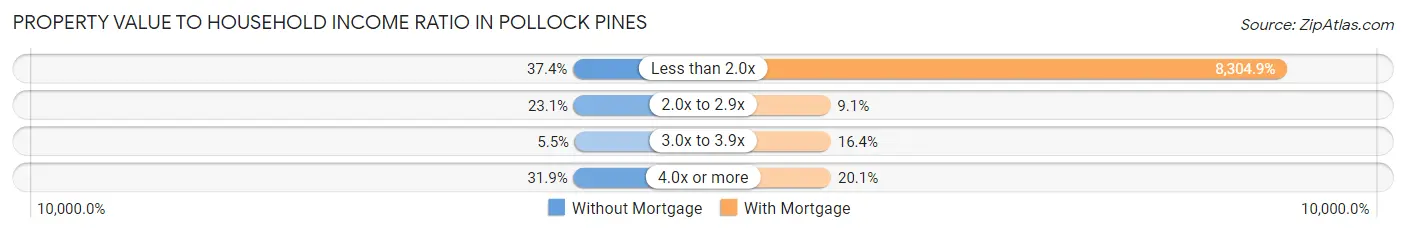
| Value-to-Income Ratio | Without Mortgage | With Mortgage |
| Less than 2.0x | 306 (37.4%) | 97,500 (8,304.9%) |
| 2.0x to 2.9x | 189 (23.1%) | 107 (9.1%) |
| 3.0x to 3.9x | 45 (5.5%) | 192 (16.4%) |
| 4.0x or more | 261 (31.9%) | 236 (20.1%) |
| Total | 819 (100.0%) | 1,174 (100.0%) |
Real Estate Taxes by Mortgage Status in Pollock Pines
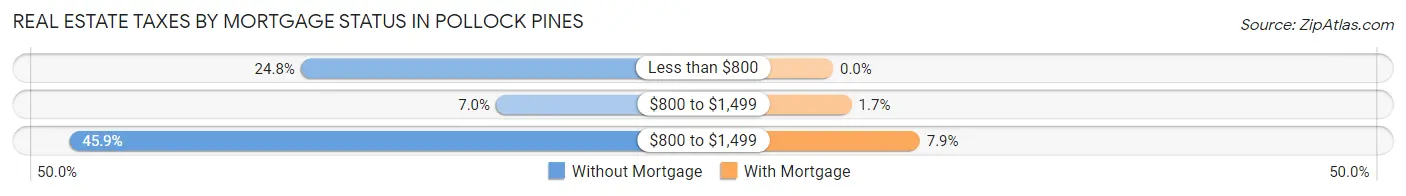
| Property Taxes | Without Mortgage | With Mortgage |
| Less than $800 | 203 (24.8%) | 0 (0.0%) |
| $800 to $1,499 | 57 (7.0%) | 20 (1.7%) |
| $800 to $1,499 | 376 (45.9%) | 93 (7.9%) |
| Total | 819 (100.0%) | 1,174 (100.0%) |
Health & Disability in Pollock Pines
Health Insurance Coverage by Age in Pollock Pines
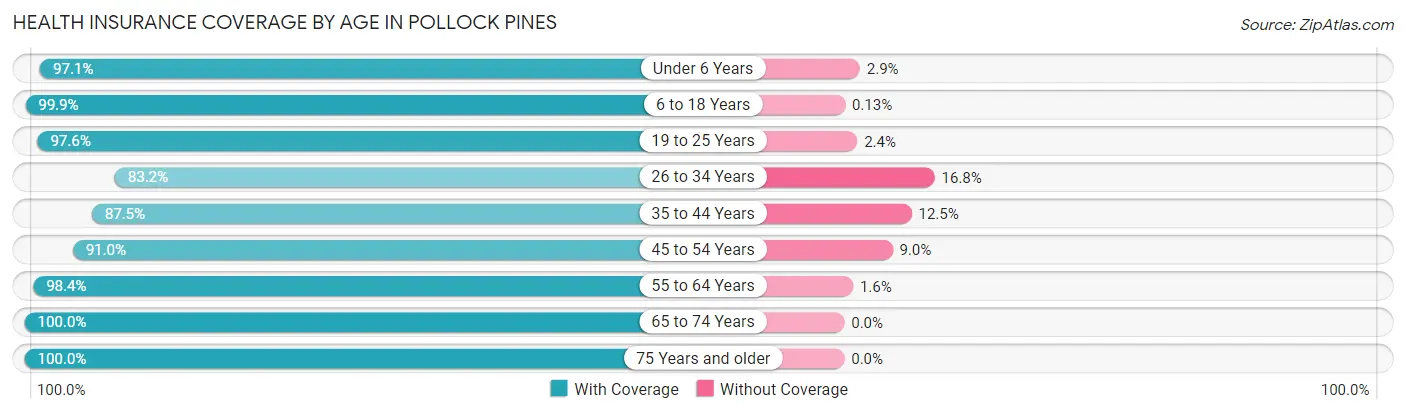
| Age Bracket | With Coverage | Without Coverage |
| Under 6 Years | 368 (97.1%) | 11 (2.9%) |
| 6 to 18 Years | 798 (99.9%) | 1 (0.1%) |
| 19 to 25 Years | 283 (97.6%) | 7 (2.4%) |
| 26 to 34 Years | 637 (83.2%) | 129 (16.8%) |
| 35 to 44 Years | 551 (87.5%) | 79 (12.5%) |
| 45 to 54 Years | 649 (91.0%) | 64 (9.0%) |
| 55 to 64 Years | 1,158 (98.4%) | 19 (1.6%) |
| 65 to 74 Years | 641 (100.0%) | 0 (0.0%) |
| 75 Years and older | 522 (100.0%) | 0 (0.0%) |
| Total | 5,607 (94.8%) | 310 (5.2%) |
Health Insurance Coverage by Citizenship Status in Pollock Pines
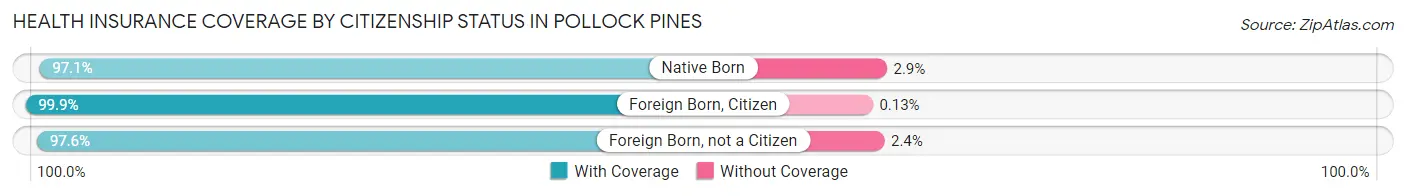
| Citizenship Status | With Coverage | Without Coverage |
| Native Born | 368 (97.1%) | 11 (2.9%) |
| Foreign Born, Citizen | 798 (99.9%) | 1 (0.1%) |
| Foreign Born, not a Citizen | 283 (97.6%) | 7 (2.4%) |
Health Insurance Coverage by Household Income in Pollock Pines
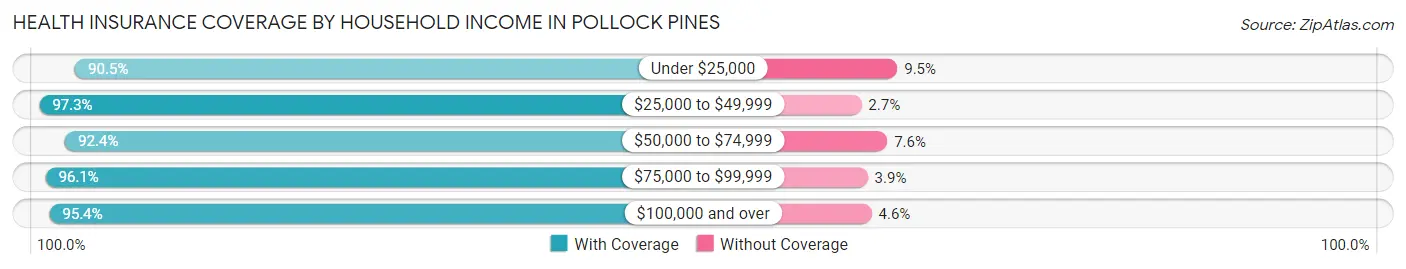
| Household Income | With Coverage | Without Coverage |
| Under $25,000 | 574 (90.5%) | 60 (9.5%) |
| $25,000 to $49,999 | 1,315 (97.3%) | 37 (2.7%) |
| $50,000 to $74,999 | 817 (92.4%) | 67 (7.6%) |
| $75,000 to $99,999 | 565 (96.1%) | 23 (3.9%) |
| $100,000 and over | 2,303 (95.4%) | 112 (4.6%) |
Public vs Private Health Insurance Coverage by Age in Pollock Pines
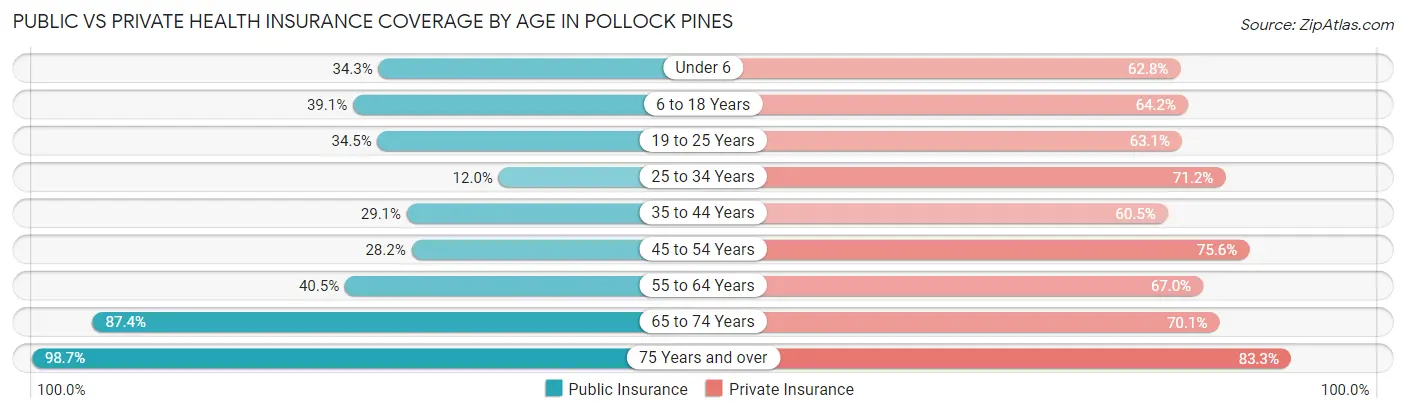
| Age Bracket | Public Insurance | Private Insurance |
| Under 6 | 130 (34.3%) | 238 (62.8%) |
| 6 to 18 Years | 312 (39.1%) | 513 (64.2%) |
| 19 to 25 Years | 100 (34.5%) | 183 (63.1%) |
| 25 to 34 Years | 92 (12.0%) | 545 (71.2%) |
| 35 to 44 Years | 183 (29.0%) | 381 (60.5%) |
| 45 to 54 Years | 201 (28.2%) | 539 (75.6%) |
| 55 to 64 Years | 477 (40.5%) | 789 (67.0%) |
| 65 to 74 Years | 560 (87.4%) | 449 (70.1%) |
| 75 Years and over | 515 (98.7%) | 435 (83.3%) |
| Total | 2,570 (43.4%) | 4,072 (68.8%) |
Disability Status by Sex by Age in Pollock Pines
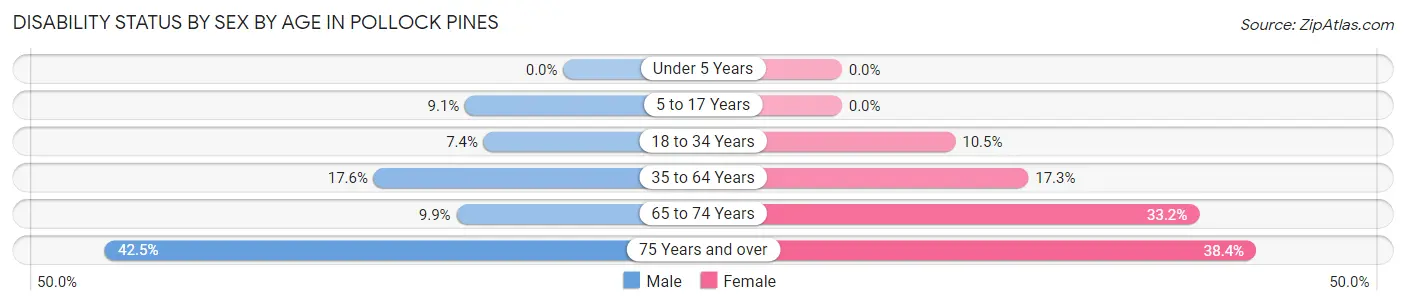
| Age Bracket | Male | Female |
| Under 5 Years | 0 (0.0%) | 0 (0.0%) |
| 5 to 17 Years | 36 (9.1%) | 0 (0.0%) |
| 18 to 34 Years | 51 (7.4%) | 46 (10.5%) |
| 35 to 64 Years | 237 (17.6%) | 203 (17.3%) |
| 65 to 74 Years | 25 (9.9%) | 129 (33.2%) |
| 75 Years and over | 108 (42.5%) | 103 (38.4%) |
Disability Class by Sex by Age in Pollock Pines
Disability Class: Hearing Difficulty
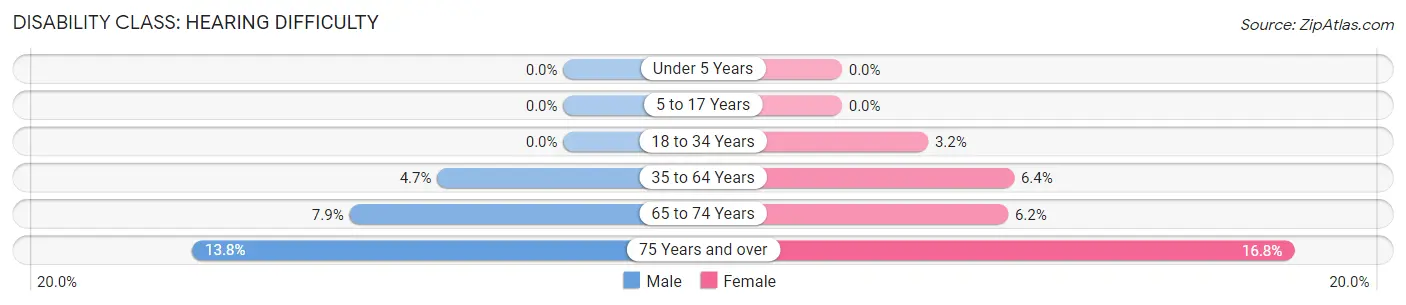
| Age Bracket | Male | Female |
| Under 5 Years | 0 (0.0%) | 0 (0.0%) |
| 5 to 17 Years | 0 (0.0%) | 0 (0.0%) |
| 18 to 34 Years | 0 (0.0%) | 14 (3.2%) |
| 35 to 64 Years | 63 (4.7%) | 75 (6.4%) |
| 65 to 74 Years | 20 (7.9%) | 24 (6.2%) |
| 75 Years and over | 35 (13.8%) | 45 (16.8%) |
Disability Class: Vision Difficulty
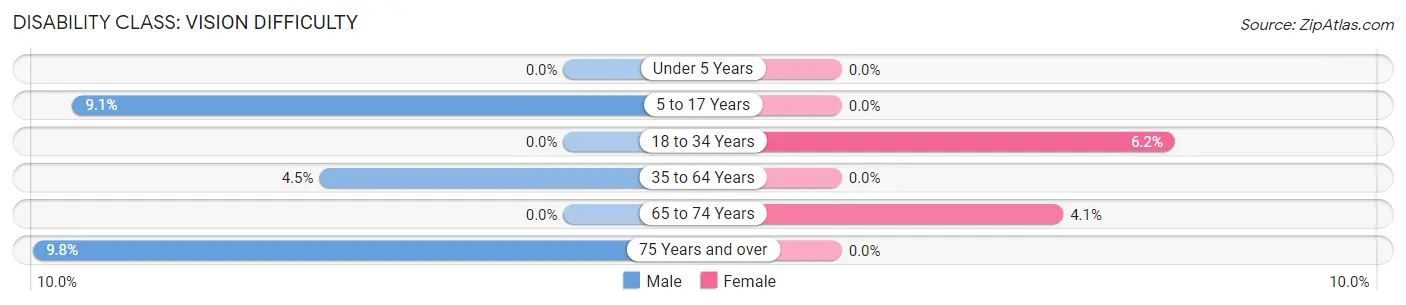
| Age Bracket | Male | Female |
| Under 5 Years | 0 (0.0%) | 0 (0.0%) |
| 5 to 17 Years | 36 (9.1%) | 0 (0.0%) |
| 18 to 34 Years | 0 (0.0%) | 27 (6.2%) |
| 35 to 64 Years | 61 (4.5%) | 0 (0.0%) |
| 65 to 74 Years | 0 (0.0%) | 16 (4.1%) |
| 75 Years and over | 25 (9.8%) | 0 (0.0%) |
Disability Class: Cognitive Difficulty
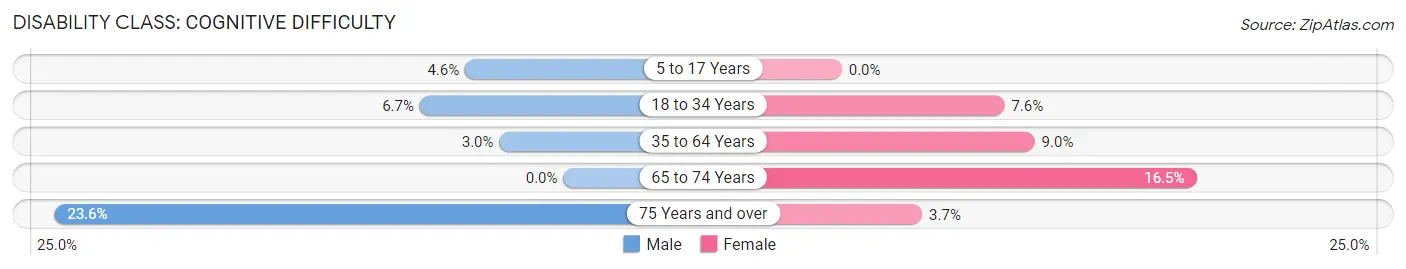
| Age Bracket | Male | Female |
| 5 to 17 Years | 18 (4.6%) | 0 (0.0%) |
| 18 to 34 Years | 46 (6.7%) | 33 (7.5%) |
| 35 to 64 Years | 40 (3.0%) | 105 (8.9%) |
| 65 to 74 Years | 0 (0.0%) | 64 (16.5%) |
| 75 Years and over | 60 (23.6%) | 10 (3.7%) |
Disability Class: Ambulatory Difficulty
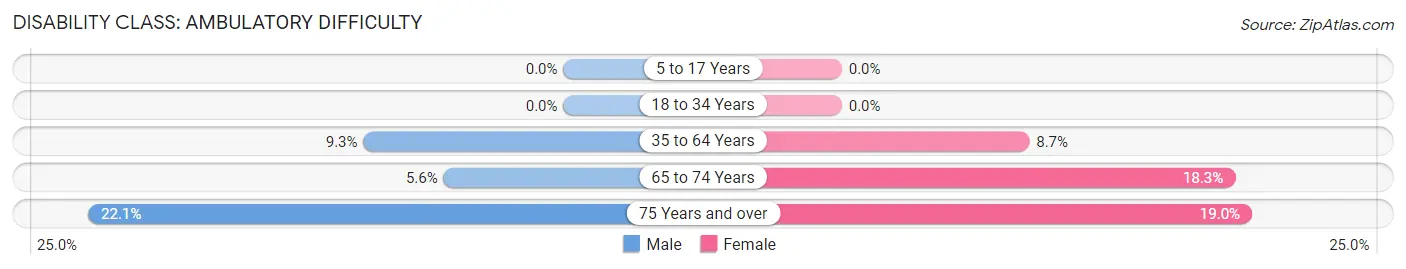
| Age Bracket | Male | Female |
| 5 to 17 Years | 0 (0.0%) | 0 (0.0%) |
| 18 to 34 Years | 0 (0.0%) | 0 (0.0%) |
| 35 to 64 Years | 125 (9.3%) | 102 (8.7%) |
| 65 to 74 Years | 14 (5.6%) | 71 (18.2%) |
| 75 Years and over | 56 (22.1%) | 51 (19.0%) |
Disability Class: Self-Care Difficulty
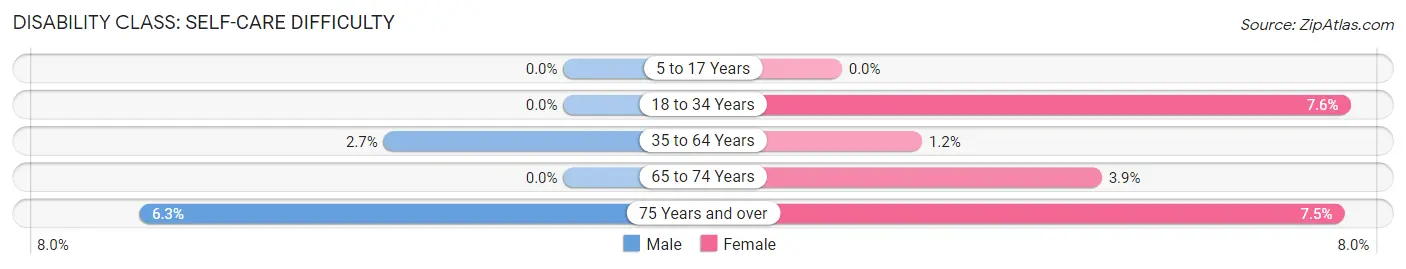
| Age Bracket | Male | Female |
| 5 to 17 Years | 0 (0.0%) | 0 (0.0%) |
| 18 to 34 Years | 0 (0.0%) | 33 (7.5%) |
| 35 to 64 Years | 36 (2.7%) | 14 (1.2%) |
| 65 to 74 Years | 0 (0.0%) | 15 (3.9%) |
| 75 Years and over | 16 (6.3%) | 20 (7.5%) |
Technology Access in Pollock Pines
Computing Device Access in Pollock Pines
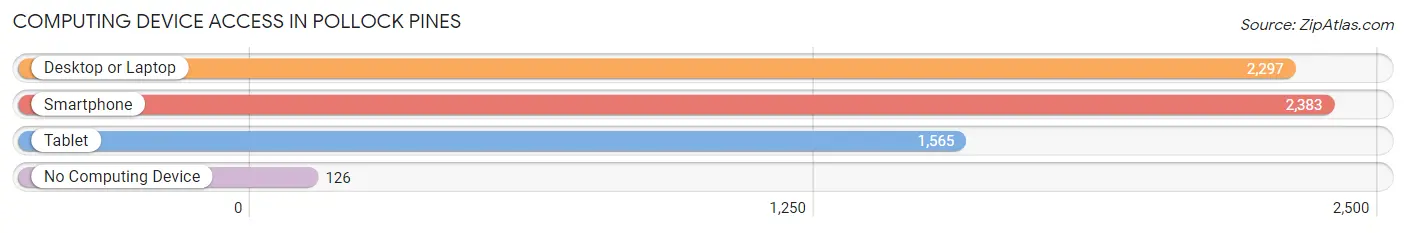
| Device Type | # Households | % Households |
| Desktop or Laptop | 2,297 | 84.7% |
| Smartphone | 2,383 | 87.9% |
| Tablet | 1,565 | 57.7% |
| No Computing Device | 126 | 4.6% |
| Total | 2,712 | 100.0% |
Internet Access in Pollock Pines
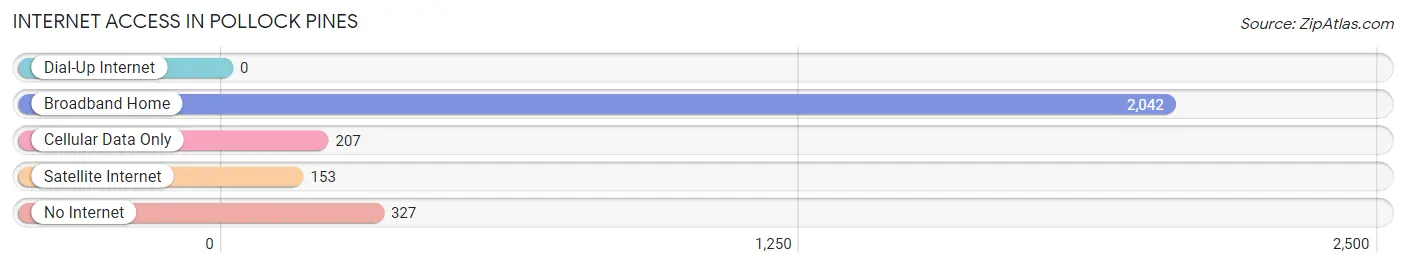
| Internet Type | # Households | % Households |
| Dial-Up Internet | 0 | 0.0% |
| Broadband Home | 2,042 | 75.3% |
| Cellular Data Only | 207 | 7.6% |
| Satellite Internet | 153 | 5.6% |
| No Internet | 327 | 12.1% |
| Total | 2,712 | 100.0% |
Pollock Pines Summary
History
The area now known as Pollock Pines, California was originally inhabited by the Washoe people, who lived in the area for thousands of years before the arrival of European settlers. The first Europeans to settle in the area were miners, who arrived in the 1850s in search of gold. The town of Pollock Pines was founded in 1856 by William Pollock, who established a sawmill and a store in the area. The town quickly grew, and by the late 19th century, it had become a popular destination for tourists and outdoor enthusiasts.
Geography
Pollock Pines is located in El Dorado County, California, about 50 miles east of Sacramento. The town is situated in the Sierra Nevada mountain range, at an elevation of approximately 3,000 feet. The area is known for its scenic beauty, with rolling hills, dense forests, and numerous lakes and streams. The town is surrounded by the Eldorado National Forest, which provides a variety of recreational activities, including camping, hiking, fishing, and skiing.
Economy
Pollock Pines is a small, rural community with a population of approximately 6,000 people. The town’s economy is largely based on tourism, with many visitors coming to the area to enjoy the outdoor activities and scenic beauty. The town is also home to several small businesses, including restaurants, shops, and lodging. The town is also home to a number of wineries, which produce a variety of wines.
Demographics
As of the 2010 census, the population of Pollock Pines was 6,073. The racial makeup of the town was 90.2% White, 0.7% African American, 1.2% Native American, 0.7% Asian, 0.1% Pacific Islander, 4.2% from other races, and 2.7% from two or more races. The median household income was $50,945, and the median family income was $58,958. The town’s population is largely made up of families, with nearly half of the population under the age of 18. The town is also home to a large number of retirees, with nearly a quarter of the population over the age of 65.
Common Questions
What is Per Capita Income in Pollock Pines?
Per Capita income in Pollock Pines is $42,927.
What is the Median Family Income in Pollock Pines?
Median Family Income in Pollock Pines is $88,583.
What is the Median Household income in Pollock Pines?
Median Household Income in Pollock Pines is $70,489.
What is Income or Wage Gap in Pollock Pines?
Income or Wage Gap in Pollock Pines is 40.4%.
Women in Pollock Pines earn 59.6 cents for every dollar earned by a man.
What is Inequality or Gini Index in Pollock Pines?
Inequality or Gini Index in Pollock Pines is 0.48.
What is the Total Population of Pollock Pines?
Total Population of Pollock Pines is 5,917.
What is the Total Male Population of Pollock Pines?
Total Male Population of Pollock Pines is 3,068.
What is the Total Female Population of Pollock Pines?
Total Female Population of Pollock Pines is 2,849.
What is the Ratio of Males per 100 Females in Pollock Pines?
There are 107.69 Males per 100 Females in Pollock Pines.
What is the Ratio of Females per 100 Males in Pollock Pines?
There are 92.86 Females per 100 Males in Pollock Pines.
What is the Median Population Age in Pollock Pines?
Median Population Age in Pollock Pines is 45.8 Years.
What is the Average Family Size in Pollock Pines
Average Family Size in Pollock Pines is 2.8 People.
What is the Average Household Size in Pollock Pines
Average Household Size in Pollock Pines is 2.2 People.
How Large is the Labor Force in Pollock Pines?
There are 2,686 People in the Labor Forcein in Pollock Pines.
What is the Percentage of People in the Labor Force in Pollock Pines?
54.5% of People are in the Labor Force in Pollock Pines.
What is the Unemployment Rate in Pollock Pines?
Unemployment Rate in Pollock Pines is 5.2%.