Zip Codes with the Highest Percentage of Population Employed in Agriculture, Fishing & Hunting in Pleasanton, CA
RELATED REPORTS & OPTIONS
Agriculture, Fishing & Hunting
Pleasanton
Compare Zip Codes
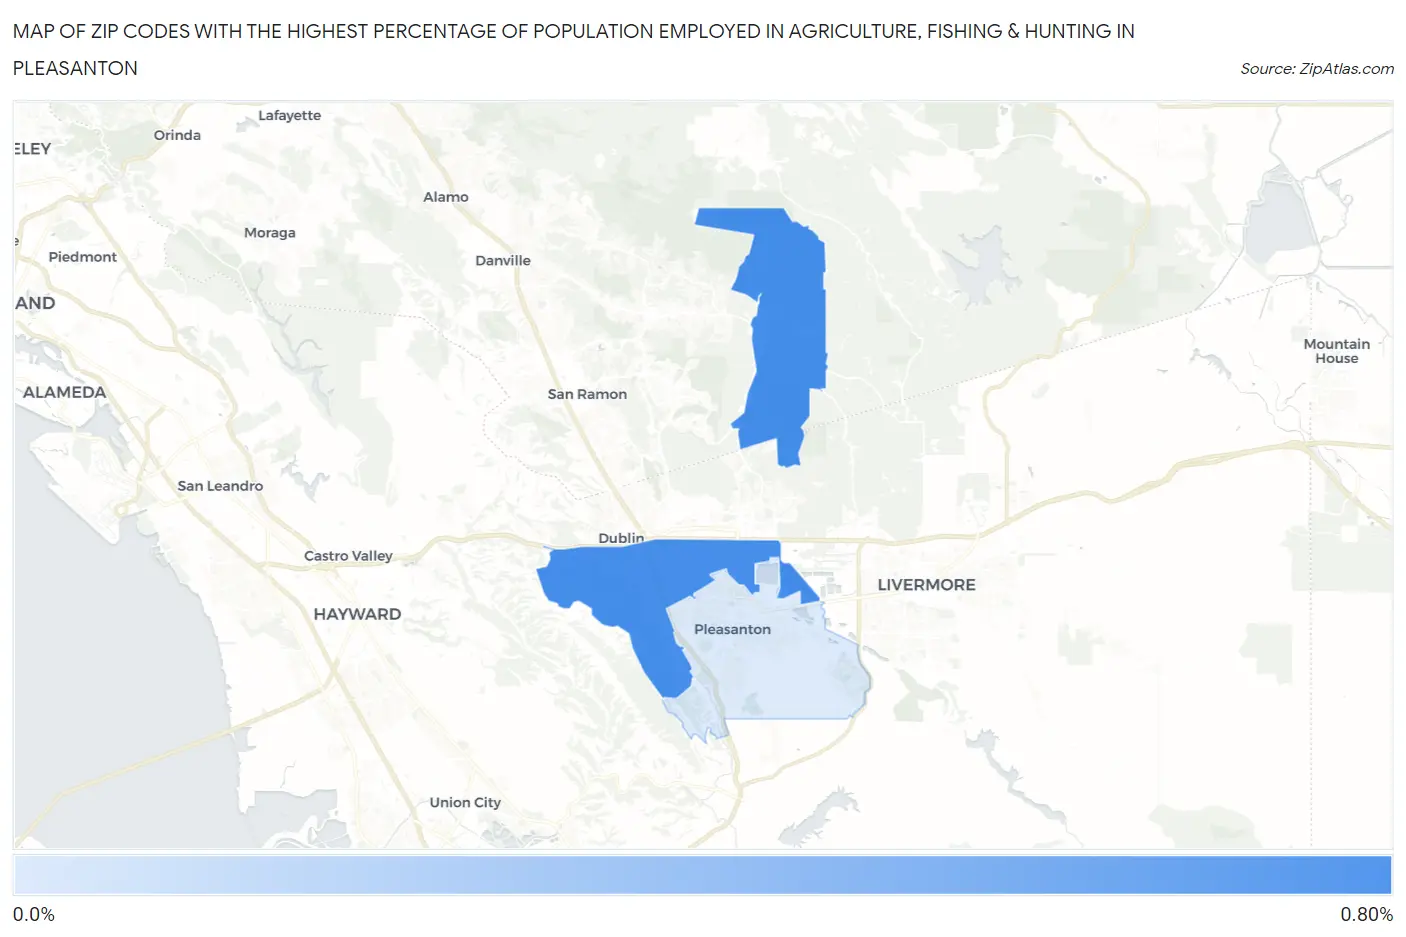
Map of Zip Codes with the Highest Percentage of Population Employed in Agriculture, Fishing & Hunting in Pleasanton
0.16%
0.66%
Zip Codes with the Highest Percentage of Population Employed in Agriculture, Fishing & Hunting in Pleasanton, CA
| Zip Code | % Employed | vs State | vs National | |
| 1. | 94588 | 0.66% | 2.0%(-1.33)#867 | 1.2%(-0.544)#18,103 |
| 2. | 94566 | 0.16% | 2.0%(-1.83)#1,268 | 1.2%(-1.04)#22,935 |
1
Common Questions
What are the Top Zip Codes with the Highest Percentage of Population Employed in Agriculture, Fishing & Hunting in Pleasanton, CA?
Top Zip Codes with the Highest Percentage of Population Employed in Agriculture, Fishing & Hunting in Pleasanton, CA are:
What zip code has the Highest Percentage of Population Employed in Agriculture, Fishing & Hunting in Pleasanton, CA?
94588 has the Highest Percentage of Population Employed in Agriculture, Fishing & Hunting in Pleasanton, CA with 0.66%.
What is the Percentage of Population Employed in Agriculture, Fishing & Hunting in Pleasanton, CA?
Percentage of Population Employed in Agriculture, Fishing & Hunting in Pleasanton is 0.32%.
What is the Percentage of Population Employed in Agriculture, Fishing & Hunting in California?
Percentage of Population Employed in Agriculture, Fishing & Hunting in California is 2.0%.
What is the Percentage of Population Employed in Agriculture, Fishing & Hunting in the United States?
Percentage of Population Employed in Agriculture, Fishing & Hunting in the United States is 1.2%.