Placerville, CA Map & Demographics
Placerville Map
Placerville Overview
$36,024
PER CAPITA INCOME
$74,179
AVG FAMILY INCOME
$68,640
AVG HOUSEHOLD INCOME
29.2%
WAGE / INCOME GAP [ % ]
70.8¢/ $1
WAGE / INCOME GAP [ $ ]
0.42
INEQUALITY / GINI INDEX
10,744
TOTAL POPULATION
4,884
MALE POPULATION
5,860
FEMALE POPULATION
83.34
MALES / 100 FEMALES
119.98
FEMALES / 100 MALES
43.4
MEDIAN AGE
2.8
AVG FAMILY SIZE
2.2
AVG HOUSEHOLD SIZE
5,181
LABOR FORCE [ PEOPLE ]
59.0%
PERCENT IN LABOR FORCE
5.1%
UNEMPLOYMENT RATE
Placerville Zip Codes
Placerville Area Codes
Income in Placerville
Income Overview in Placerville
Per Capita Income in Placerville is $36,024, while median incomes of families and households are $74,179 and $68,640 respectively.
| Characteristic | Number | Measure |
| Per Capita Income | 10,744 | $36,024 |
| Median Family Income | 2,787 | $74,179 |
| Mean Family Income | 2,787 | $92,430 |
| Median Household Income | 4,529 | $68,640 |
| Mean Household Income | 4,529 | $81,856 |
| Income Deficit | 2,787 | $0 |
| Wage / Income Gap (%) | 10,744 | 29.24% |
| Wage / Income Gap ($) | 10,744 | 70.76¢ per $1 |
| Gini / Inequality Index | 10,744 | 0.42 |
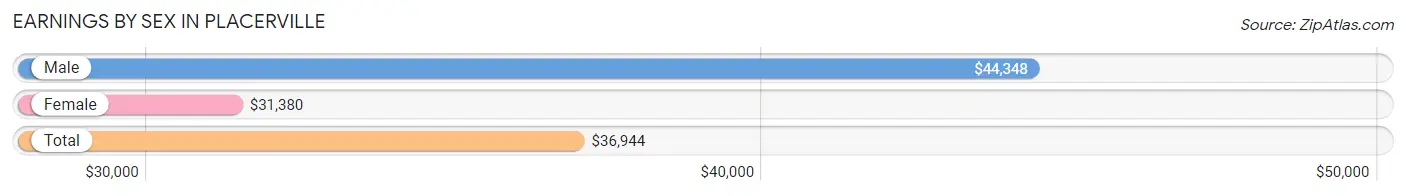
Earnings by Sex in Placerville
Average Earnings in Placerville are $36,944, $44,348 for men and $31,380 for women, a difference of 29.2%.
| Sex | Number | Average Earnings |
| Male | 2,548 (46.3%) | $44,348 |
| Female | 2,951 (53.7%) | $31,380 |
| Total | 5,499 (100.0%) | $36,944 |
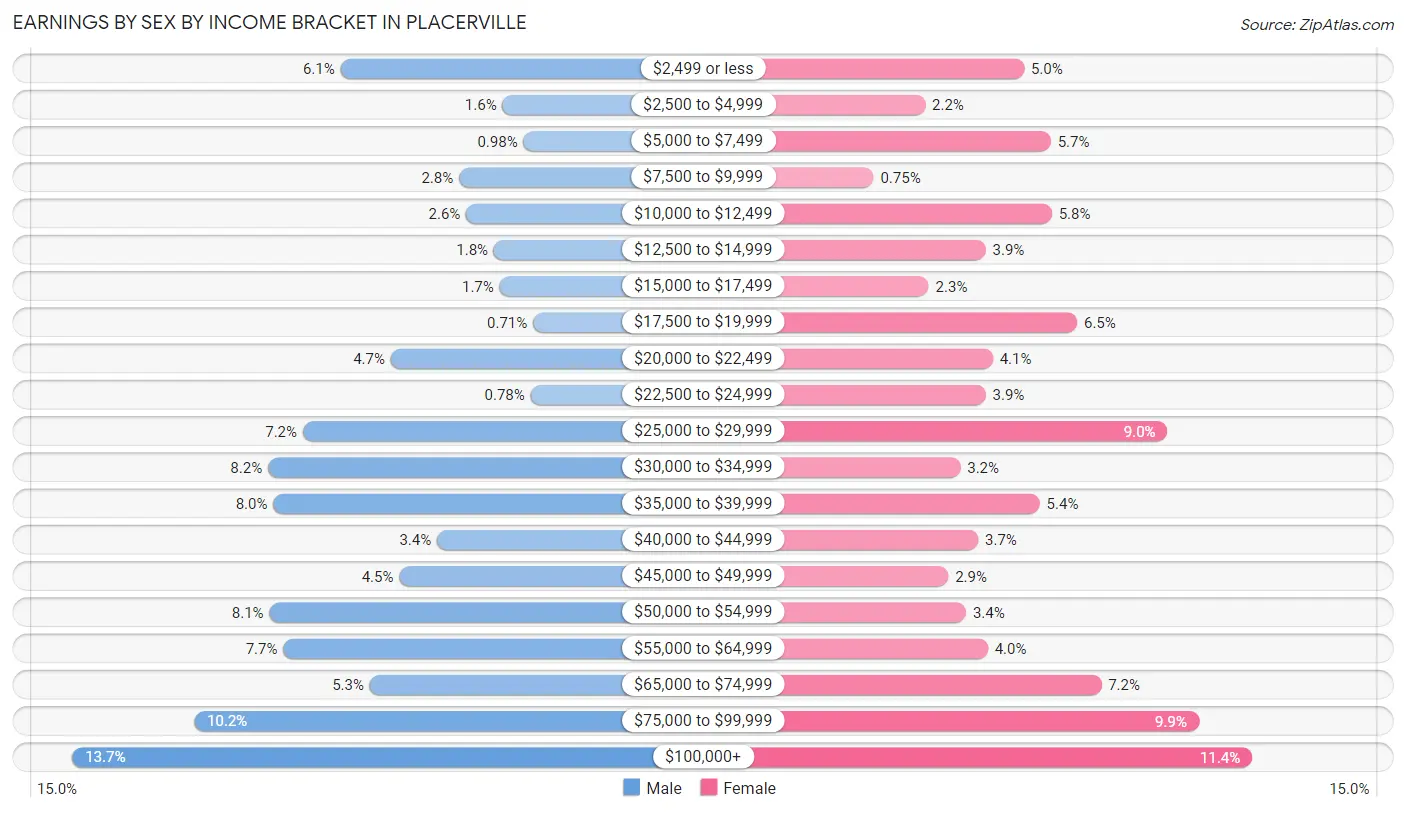
Earnings by Sex by Income Bracket in Placerville
The most common earnings brackets in Placerville are $100,000+ for men (348 | 13.7%) and $100,000+ for women (336 | 11.4%).
| Income | Male | Female |
| $2,499 or less | 156 (6.1%) | 147 (5.0%) |
| $2,500 to $4,999 | 40 (1.6%) | 65 (2.2%) |
| $5,000 to $7,499 | 25 (1.0%) | 169 (5.7%) |
| $7,500 to $9,999 | 71 (2.8%) | 22 (0.7%) |
| $10,000 to $12,499 | 66 (2.6%) | 170 (5.8%) |
| $12,500 to $14,999 | 46 (1.8%) | 115 (3.9%) |
| $15,000 to $17,499 | 42 (1.7%) | 68 (2.3%) |
| $17,500 to $19,999 | 18 (0.7%) | 191 (6.5%) |
| $20,000 to $22,499 | 120 (4.7%) | 121 (4.1%) |
| $22,500 to $24,999 | 20 (0.8%) | 115 (3.9%) |
| $25,000 to $29,999 | 183 (7.2%) | 266 (9.0%) |
| $30,000 to $34,999 | 208 (8.2%) | 94 (3.2%) |
| $35,000 to $39,999 | 204 (8.0%) | 160 (5.4%) |
| $40,000 to $44,999 | 87 (3.4%) | 109 (3.7%) |
| $45,000 to $49,999 | 114 (4.5%) | 84 (2.9%) |
| $50,000 to $54,999 | 207 (8.1%) | 99 (3.4%) |
| $55,000 to $64,999 | 197 (7.7%) | 117 (4.0%) |
| $65,000 to $74,999 | 135 (5.3%) | 211 (7.1%) |
| $75,000 to $99,999 | 261 (10.2%) | 292 (9.9%) |
| $100,000+ | 348 (13.7%) | 336 (11.4%) |
| Total | 2,548 (100.0%) | 2,951 (100.0%) |
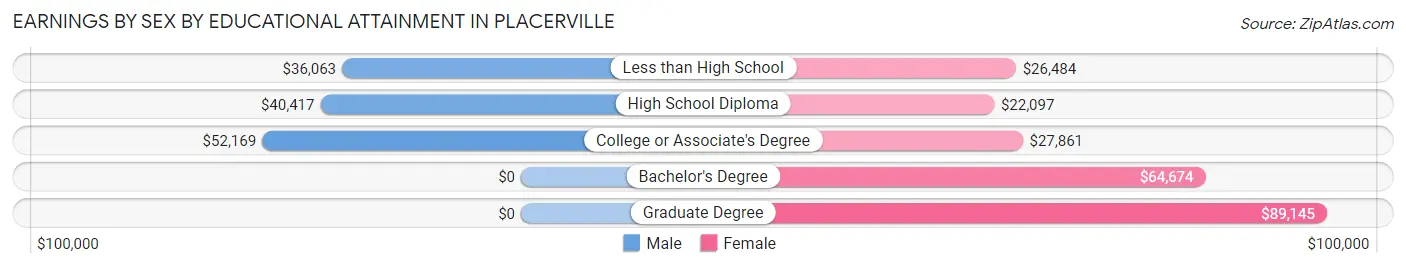
Earnings by Sex by Educational Attainment in Placerville
Average earnings in Placerville are $44,538 for men and $34,185 for women, a difference of 23.3%. Men with an educational attainment of college or associate's degree enjoy the highest average annual earnings of $52,169, while those with less than high school education earn the least with $36,063. Women with an educational attainment of graduate degree earn the most with the average annual earnings of $89,145, while those with high school diploma education have the smallest earnings of $22,097.
| Educational Attainment | Male Income | Female Income |
| Less than High School | $36,063 | $26,484 |
| High School Diploma | $40,417 | $22,097 |
| College or Associate's Degree | $52,169 | $27,861 |
| Bachelor's Degree | - | - |
| Graduate Degree | - | - |
| Total | $44,538 | $34,185 |
Family Income in Placerville
Family Income Brackets in Placerville
According to the Placerville family income data, there are 541 families falling into the $50,000 to $74,999 income range, which is the most common income bracket and makes up 19.4% of all families. Conversely, the less than $10,000 income bracket is the least frequent group with only 106 families (3.8%) belonging to this category.
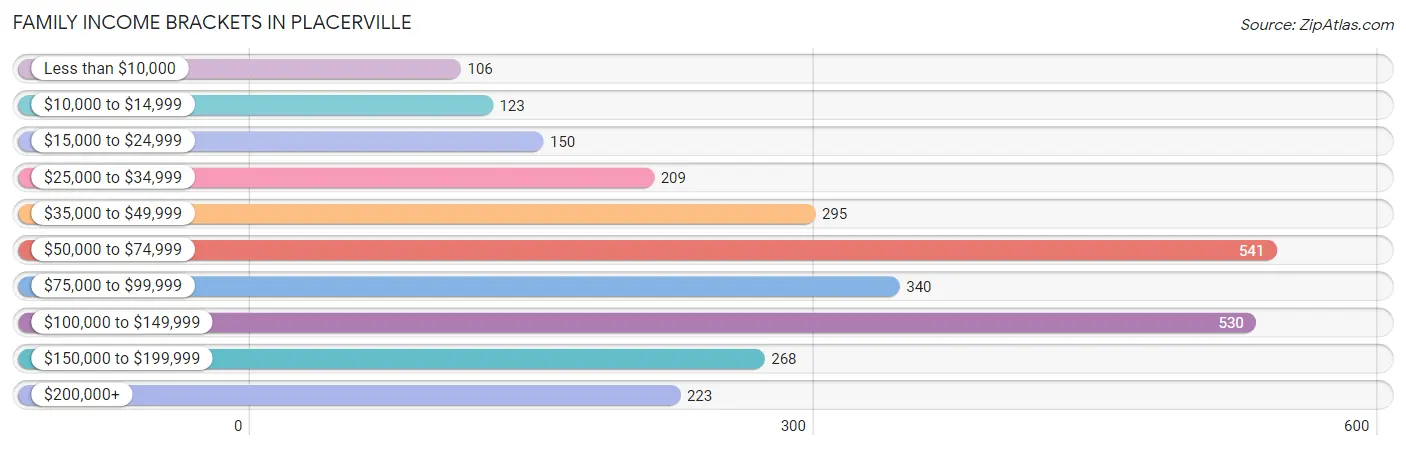
| Income Bracket | # Families | % Families |
| Less than $10,000 | 106 | 3.8% |
| $10,000 to $14,999 | 123 | 4.4% |
| $15,000 to $24,999 | 150 | 5.4% |
| $25,000 to $34,999 | 209 | 7.5% |
| $35,000 to $49,999 | 295 | 10.6% |
| $50,000 to $74,999 | 541 | 19.4% |
| $75,000 to $99,999 | 340 | 12.2% |
| $100,000 to $149,999 | 530 | 19.0% |
| $150,000 to $199,999 | 268 | 9.6% |
| $200,000+ | 223 | 8.0% |
Family Income by Famaliy Size in Placerville
4-person families (387 | 13.9%) account for the highest median family income in Placerville with $109,613 per family, while 2-person families (1,624 | 58.3%) have the highest median income of $32,500 per family member.
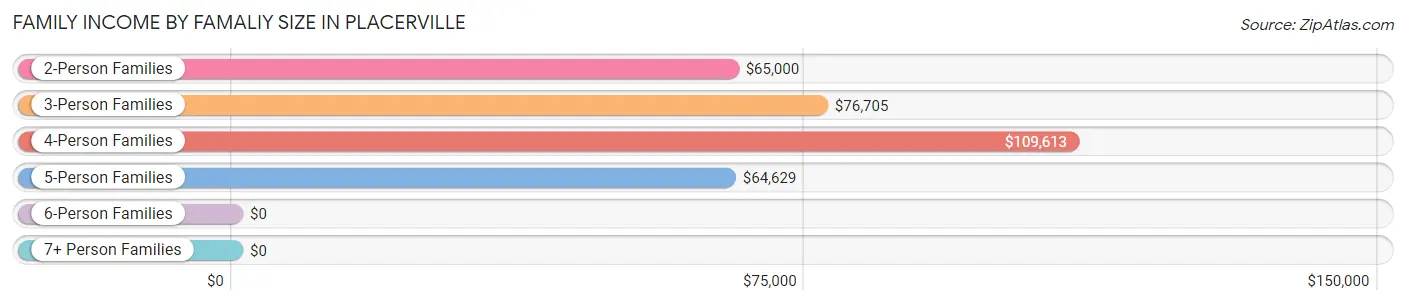
| Income Bracket | # Families | Median Income |
| 2-Person Families | 1,624 (58.3%) | $65,000 |
| 3-Person Families | 470 (16.9%) | $76,705 |
| 4-Person Families | 387 (13.9%) | $109,613 |
| 5-Person Families | 287 (10.3%) | $64,629 |
| 6-Person Families | 19 (0.7%) | $0 |
| 7+ Person Families | 0 (0.0%) | $0 |
| Total | 2,787 (100.0%) | $74,179 |
Family Income by Number of Earners in Placerville
The median family income in Placerville is $74,179, with families comprising 3+ earners (204) having the highest median family income of $151,250, while families with no earners (421) have the lowest median family income of $47,058, accounting for 7.3% and 15.1% of families, respectively.
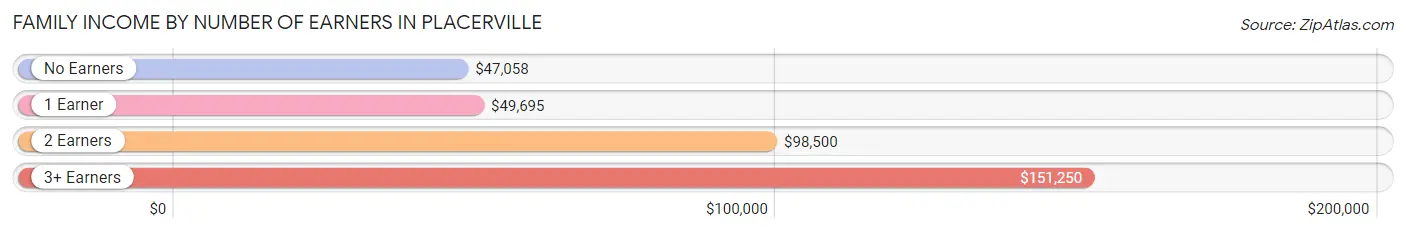
| Number of Earners | # Families | Median Income |
| No Earners | 421 (15.1%) | $47,058 |
| 1 Earner | 1,166 (41.8%) | $49,695 |
| 2 Earners | 996 (35.7%) | $98,500 |
| 3+ Earners | 204 (7.3%) | $151,250 |
| Total | 2,787 (100.0%) | $74,179 |
Household Income in Placerville
Household Income Brackets in Placerville
With 870 households falling in the category, the $50,000 to $74,999 income range is the most frequent in Placerville, accounting for 19.2% of all households. In contrast, only 245 households (5.4%) fall into the less than $10,000 income bracket, making it the least populous group.
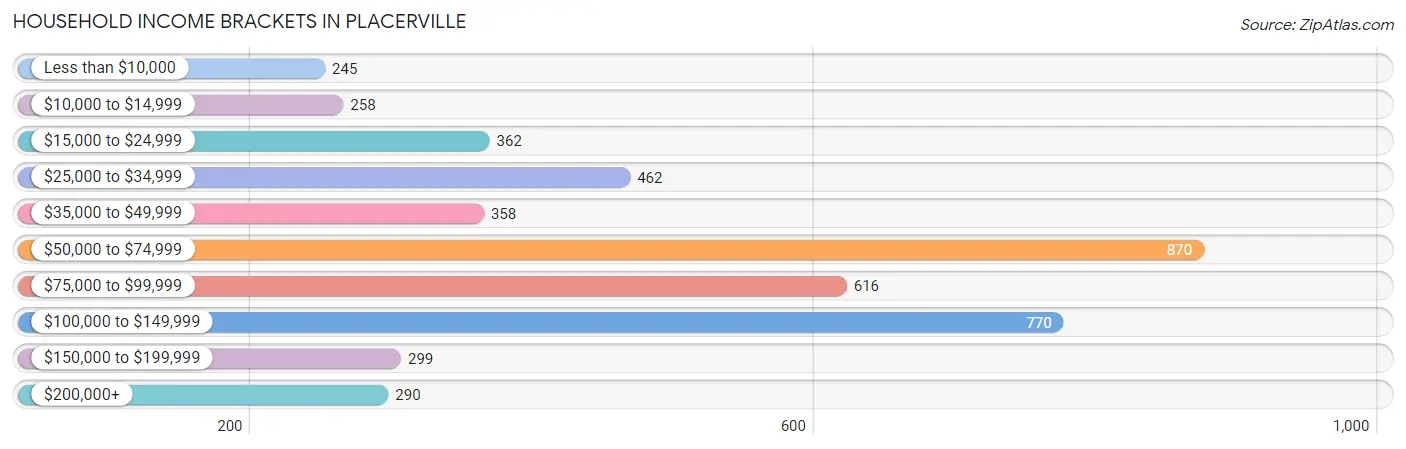
| Income Bracket | # Households | % Households |
| Less than $10,000 | 245 | 5.4% |
| $10,000 to $14,999 | 258 | 5.7% |
| $15,000 to $24,999 | 362 | 8.0% |
| $25,000 to $34,999 | 462 | 10.2% |
| $35,000 to $49,999 | 358 | 7.9% |
| $50,000 to $74,999 | 870 | 19.2% |
| $75,000 to $99,999 | 616 | 13.6% |
| $100,000 to $149,999 | 770 | 17.0% |
| $150,000 to $199,999 | 299 | 6.6% |
| $200,000+ | 290 | 6.4% |
Household Income by Householder Age in Placerville
The median household income in Placerville is $68,640, with the highest median household income of $82,083 found in the 45 to 64 years age bracket for the primary householder. A total of 1,812 households (40.0%) fall into this category. Meanwhile, the 15 to 24 years age bracket for the primary householder has the lowest median household income of $0, with 33 households (0.7%) in this group.
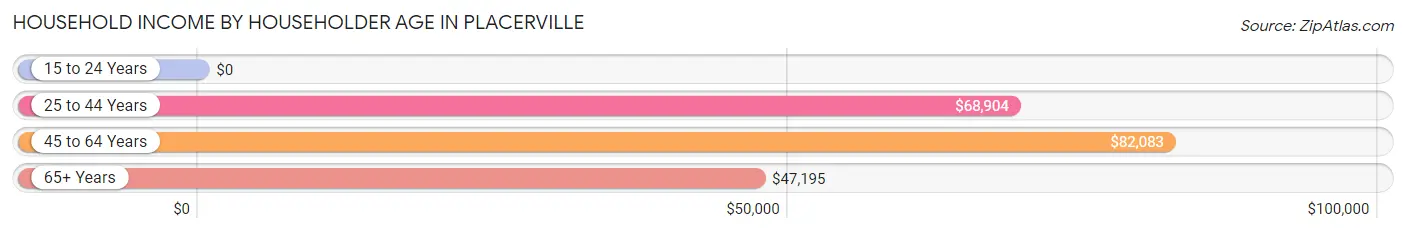
| Income Bracket | # Households | Median Income |
| 15 to 24 Years | 33 (0.7%) | $0 |
| 25 to 44 Years | 1,255 (27.7%) | $68,904 |
| 45 to 64 Years | 1,812 (40.0%) | $82,083 |
| 65+ Years | 1,429 (31.6%) | $47,195 |
| Total | 4,529 (100.0%) | $68,640 |
Poverty in Placerville
Income Below Poverty by Sex and Age in Placerville
With 9.6% poverty level for males and 21.3% for females among the residents of Placerville, 55 to 64 year old males and 5 year old females are the most vulnerable to poverty, with 164 males (20.4%) and 90 females (75.0%) in their respective age groups living below the poverty level.
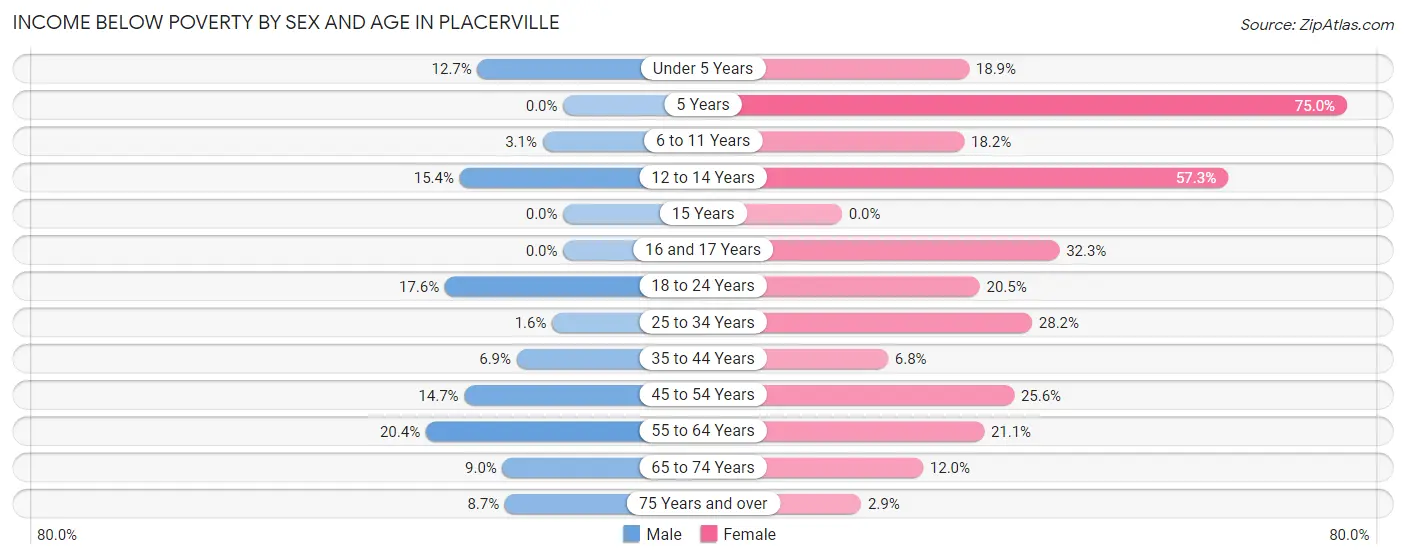
| Age Bracket | Male | Female |
| Under 5 Years | 34 (12.7%) | 20 (18.9%) |
| 5 Years | 0 (0.0%) | 90 (75.0%) |
| 6 to 11 Years | 17 (3.0%) | 57 (18.1%) |
| 12 to 14 Years | 16 (15.4%) | 207 (57.3%) |
| 15 Years | 0 (0.0%) | 0 (0.0%) |
| 16 and 17 Years | 0 (0.0%) | 41 (32.3%) |
| 18 to 24 Years | 13 (17.6%) | 82 (20.4%) |
| 25 to 34 Years | 13 (1.6%) | 206 (28.2%) |
| 35 to 44 Years | 28 (6.9%) | 46 (6.8%) |
| 45 to 54 Years | 89 (14.7%) | 172 (25.6%) |
| 55 to 64 Years | 164 (20.4%) | 179 (21.1%) |
| 65 to 74 Years | 43 (9.0%) | 86 (12.0%) |
| 75 Years and over | 29 (8.7%) | 16 (2.9%) |
| Total | 446 (9.6%) | 1,202 (21.3%) |
Income Above Poverty by Sex and Age in Placerville
According to the poverty statistics in Placerville, males aged 5 years and females aged 15 years are the age groups that are most secure financially, with 100.0% of males and 100.0% of females in these age groups living above the poverty line.
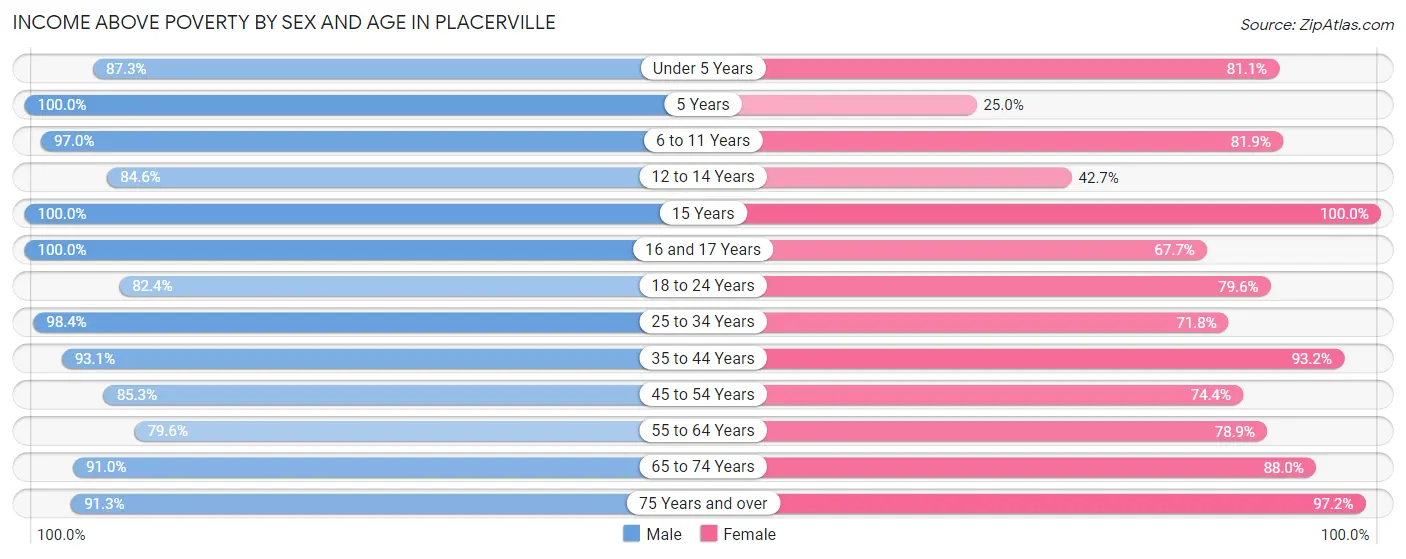
| Age Bracket | Male | Female |
| Under 5 Years | 233 (87.3%) | 86 (81.1%) |
| 5 Years | 73 (100.0%) | 30 (25.0%) |
| 6 to 11 Years | 540 (97.0%) | 257 (81.9%) |
| 12 to 14 Years | 88 (84.6%) | 154 (42.7%) |
| 15 Years | 48 (100.0%) | 12 (100.0%) |
| 16 and 17 Years | 105 (100.0%) | 86 (67.7%) |
| 18 to 24 Years | 61 (82.4%) | 319 (79.5%) |
| 25 to 34 Years | 778 (98.4%) | 524 (71.8%) |
| 35 to 44 Years | 378 (93.1%) | 627 (93.2%) |
| 45 to 54 Years | 517 (85.3%) | 501 (74.4%) |
| 55 to 64 Years | 640 (79.6%) | 669 (78.9%) |
| 65 to 74 Years | 434 (91.0%) | 628 (88.0%) |
| 75 Years and over | 306 (91.3%) | 545 (97.2%) |
| Total | 4,201 (90.4%) | 4,438 (78.7%) |
Income Below Poverty Among Married-Couple Families in Placerville
The poverty statistics for married-couple families in Placerville show that 9.1% or 166 of the total 1,818 families live below the poverty line. Families with 1 or 2 children have the highest poverty rate of 13.5%, comprising of 75 families. On the other hand, families with 3 or 4 children have the lowest poverty rate of 5.7%, which includes 15 families.
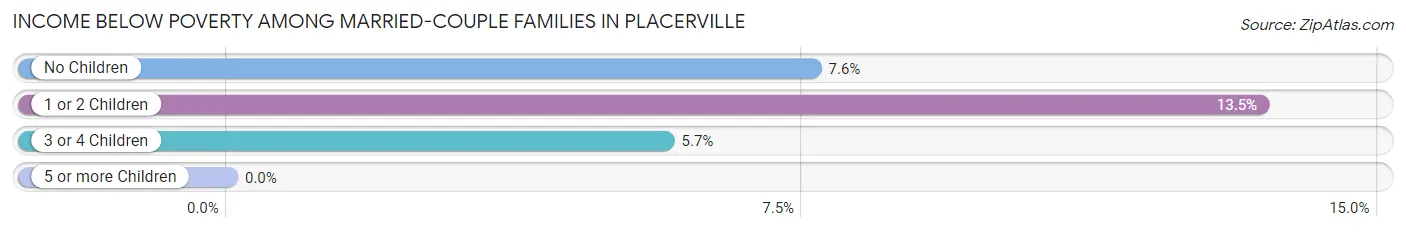
| Children | Above Poverty | Below Poverty |
| No Children | 922 (92.4%) | 76 (7.6%) |
| 1 or 2 Children | 482 (86.5%) | 75 (13.5%) |
| 3 or 4 Children | 248 (94.3%) | 15 (5.7%) |
| 5 or more Children | 0 (0.0%) | 0 (0.0%) |
| Total | 1,652 (90.9%) | 166 (9.1%) |
Income Below Poverty Among Single-Parent Households in Placerville
According to the poverty data in Placerville, 17.2% or 49 single-father households and 32.3% or 221 single-mother households are living below the poverty line. Among single-father households, those with no children have the highest poverty rate, with 49 households (38.9%) experiencing poverty. Likewise, among single-mother households, those with 3 or 4 children have the highest poverty rate, with 16 households (100.0%) falling below the poverty line.
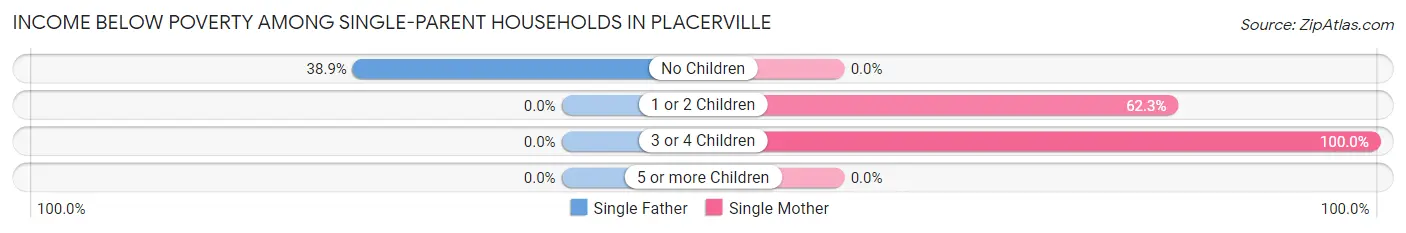
| Children | Single Father | Single Mother |
| No Children | 49 (38.9%) | 0 (0.0%) |
| 1 or 2 Children | 0 (0.0%) | 205 (62.3%) |
| 3 or 4 Children | 0 (0.0%) | 16 (100.0%) |
| 5 or more Children | 0 (0.0%) | 0 (0.0%) |
| Total | 49 (17.2%) | 221 (32.3%) |
Income Below Poverty Among Married-Couple vs Single-Parent Households in Placerville
The poverty data for Placerville shows that 166 of the married-couple family households (9.1%) and 270 of the single-parent households (27.9%) are living below the poverty level. Within the married-couple family households, those with 1 or 2 children have the highest poverty rate, with 75 households (13.5%) falling below the poverty line. Among the single-parent households, those with 3 or 4 children have the highest poverty rate, with 16 household (100.0%) living below poverty.
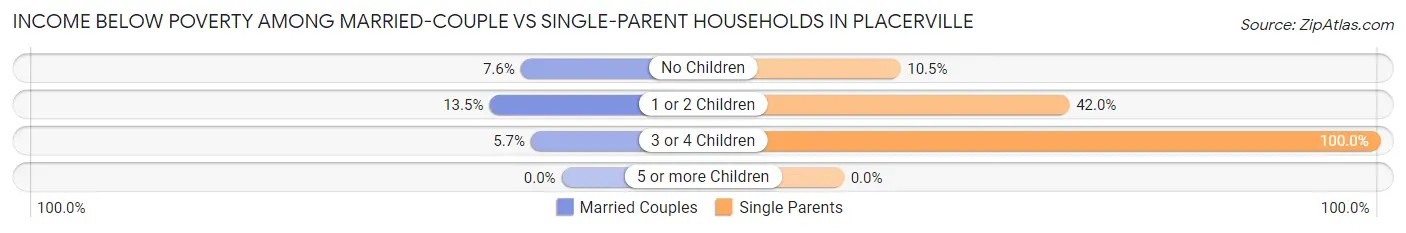
| Children | Married-Couple Families | Single-Parent Households |
| No Children | 76 (7.6%) | 49 (10.5%) |
| 1 or 2 Children | 75 (13.5%) | 205 (42.0%) |
| 3 or 4 Children | 15 (5.7%) | 16 (100.0%) |
| 5 or more Children | 0 (0.0%) | 0 (0.0%) |
| Total | 166 (9.1%) | 270 (27.9%) |
Race in Placerville
The most populous races in Placerville are White / Caucasian (9,393 | 87.4%), Hispanic or Latino (2,306 | 21.5%), and Two or more Races (739 | 6.9%).
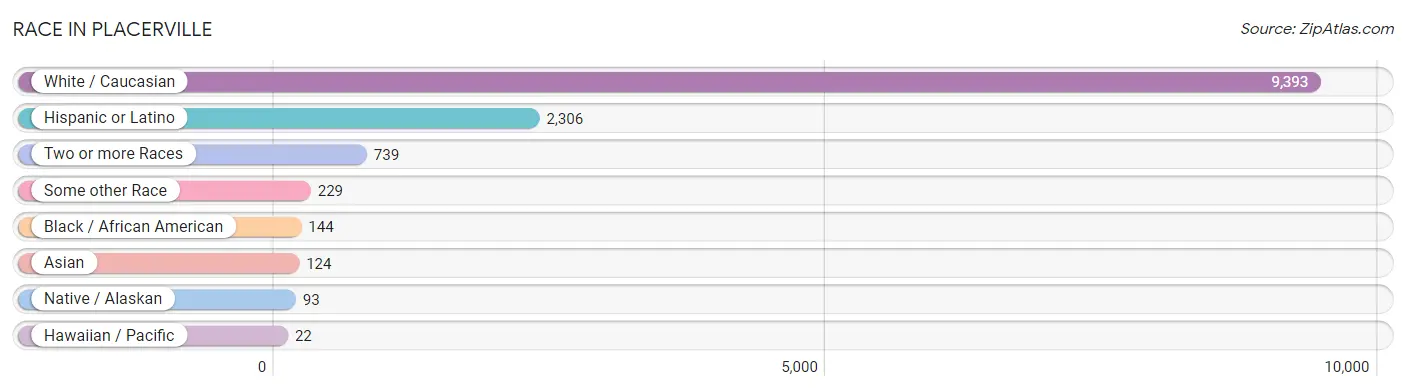
| Race | # Population | % Population |
| Asian | 124 | 1.1% |
| Black / African American | 144 | 1.3% |
| Hawaiian / Pacific | 22 | 0.2% |
| Hispanic or Latino | 2,306 | 21.5% |
| Native / Alaskan | 93 | 0.9% |
| White / Caucasian | 9,393 | 87.4% |
| Two or more Races | 739 | 6.9% |
| Some other Race | 229 | 2.1% |
| Total | 10,744 | 100.0% |
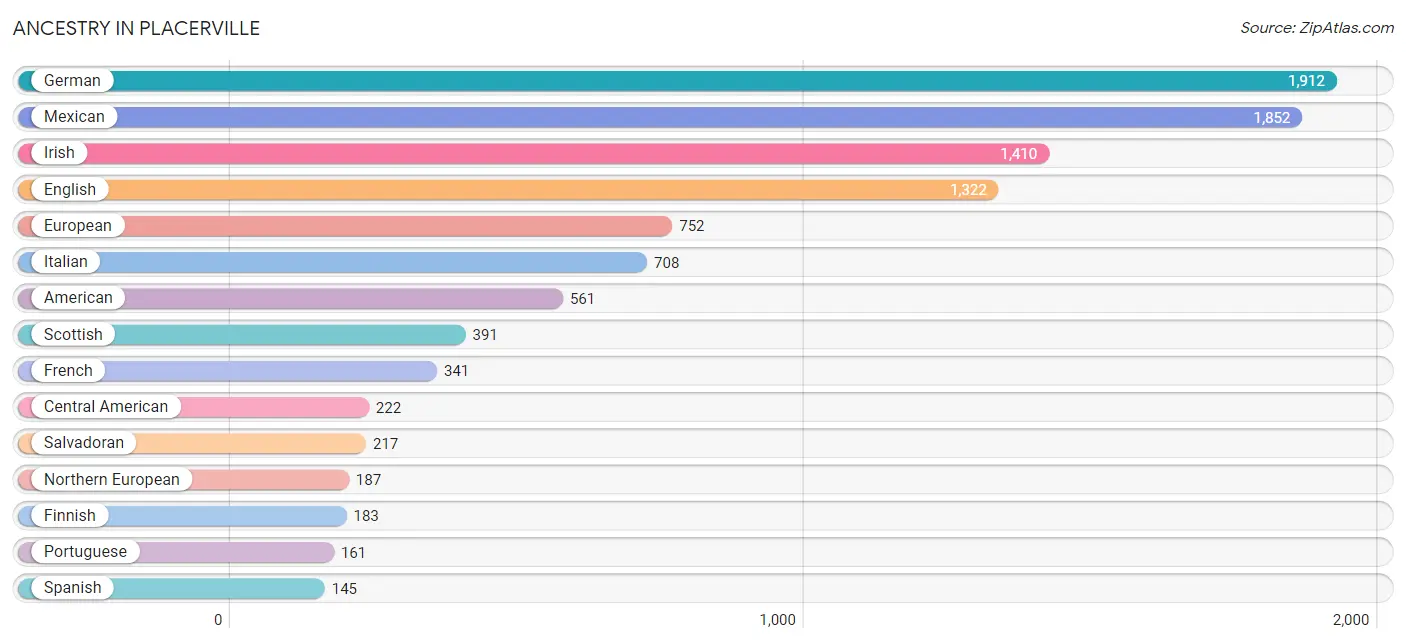
Ancestry in Placerville
The most populous ancestries reported in Placerville are German (1,912 | 17.8%), Mexican (1,852 | 17.2%), Irish (1,410 | 13.1%), English (1,322 | 12.3%), and European (752 | 7.0%), together accounting for 67.5% of all Placerville residents.
| Ancestry | # Population | % Population |
| Afghan | 7 | 0.1% |
| American | 561 | 5.2% |
| Apache | 28 | 0.3% |
| Argentinean | 27 | 0.3% |
| Armenian | 11 | 0.1% |
| Australian | 17 | 0.2% |
| Belgian | 28 | 0.3% |
| Bhutanese | 22 | 0.2% |
| Blackfeet | 34 | 0.3% |
| British | 68 | 0.6% |
| Burmese | 105 | 1.0% |
| Canadian | 29 | 0.3% |
| Central American | 222 | 2.1% |
| Cherokee | 121 | 1.1% |
| Cheyenne | 25 | 0.2% |
| Chippewa | 18 | 0.2% |
| Choctaw | 7 | 0.1% |
| Croatian | 14 | 0.1% |
| Czech | 69 | 0.6% |
| Danish | 97 | 0.9% |
| Dutch | 32 | 0.3% |
| English | 1,322 | 12.3% |
| Ethiopian | 4 | 0.0% |
| European | 752 | 7.0% |
| Finnish | 183 | 1.7% |
| French | 341 | 3.2% |
| German | 1,912 | 17.8% |
| Greek | 137 | 1.3% |
| Guatemalan | 5 | 0.1% |
| Hungarian | 17 | 0.2% |
| Indian (Asian) | 67 | 0.6% |
| Irish | 1,410 | 13.1% |
| Italian | 708 | 6.6% |
| Japanese | 13 | 0.1% |
| Korean | 98 | 0.9% |
| Laotian | 7 | 0.1% |
| Mexican | 1,852 | 17.2% |
| Native Hawaiian | 72 | 0.7% |
| Navajo | 13 | 0.1% |
| Northern European | 187 | 1.7% |
| Norwegian | 136 | 1.3% |
| Polish | 117 | 1.1% |
| Portuguese | 161 | 1.5% |
| Puerto Rican | 6 | 0.1% |
| Russian | 89 | 0.8% |
| Salvadoran | 217 | 2.0% |
| Scotch-Irish | 94 | 0.9% |
| Scottish | 391 | 3.6% |
| Sioux | 28 | 0.3% |
| Slovak | 20 | 0.2% |
| South American | 27 | 0.3% |
| Spaniard | 37 | 0.3% |
| Spanish | 145 | 1.3% |
| Sri Lankan | 23 | 0.2% |
| Subsaharan African | 4 | 0.0% |
| Swedish | 120 | 1.1% |
| Swiss | 91 | 0.9% |
| Thai | 36 | 0.3% |
| Welsh | 30 | 0.3% | View All 59 Rows |
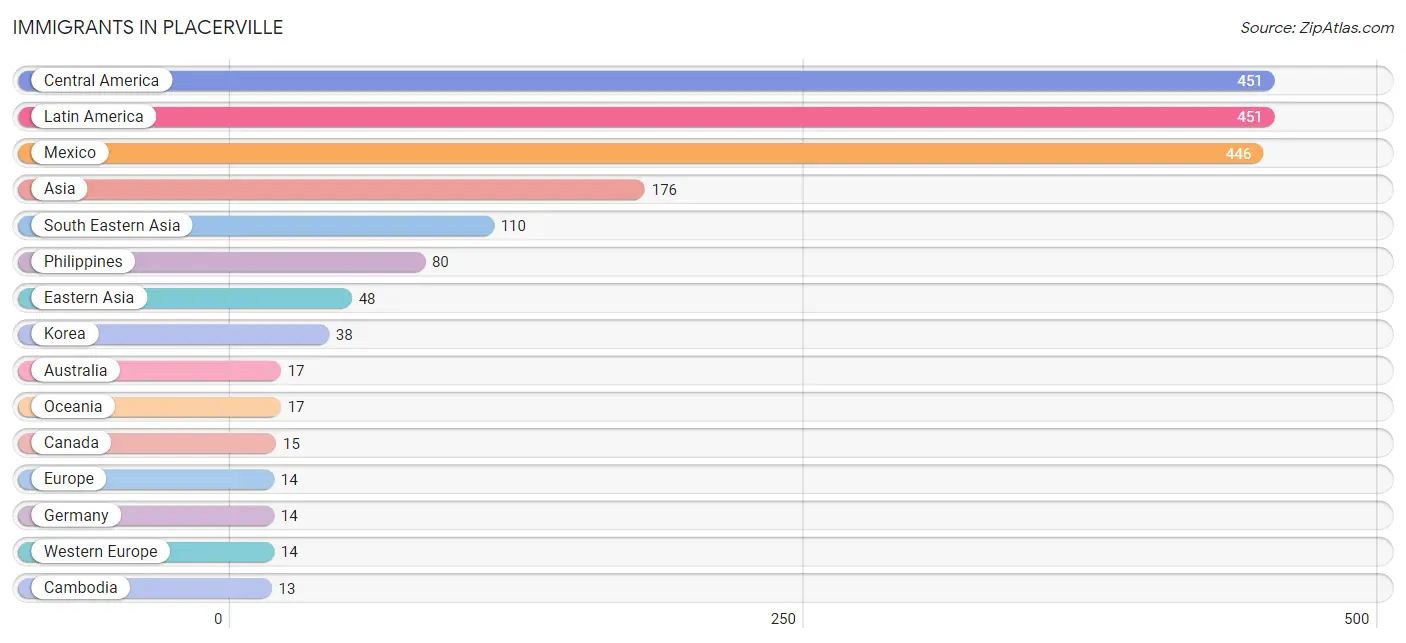
Immigrants in Placerville
The most numerous immigrant groups reported in Placerville came from Central America (451 | 4.2%), Latin America (451 | 4.2%), Mexico (446 | 4.2%), Asia (176 | 1.6%), and South Eastern Asia (110 | 1.0%), together accounting for 15.2% of all Placerville residents.
| Immigration Origin | # Population | % Population |
| Afghanistan | 7 | 0.1% |
| Africa | 4 | 0.0% |
| Asia | 176 | 1.6% |
| Australia | 17 | 0.2% |
| Cambodia | 13 | 0.1% |
| Canada | 15 | 0.1% |
| Central America | 451 | 4.2% |
| China | 10 | 0.1% |
| Eastern Africa | 4 | 0.0% |
| Eastern Asia | 48 | 0.4% |
| Eritrea | 4 | 0.0% |
| Europe | 14 | 0.1% |
| Germany | 14 | 0.1% |
| Guatemala | 5 | 0.1% |
| Indonesia | 7 | 0.1% |
| Korea | 38 | 0.4% |
| Latin America | 451 | 4.2% |
| Lebanon | 11 | 0.1% |
| Mexico | 446 | 4.2% |
| Oceania | 17 | 0.2% |
| Philippines | 80 | 0.7% |
| South Central Asia | 7 | 0.1% |
| South Eastern Asia | 110 | 1.0% |
| Vietnam | 10 | 0.1% |
| Western Asia | 11 | 0.1% |
| Western Europe | 14 | 0.1% | View All 26 Rows |
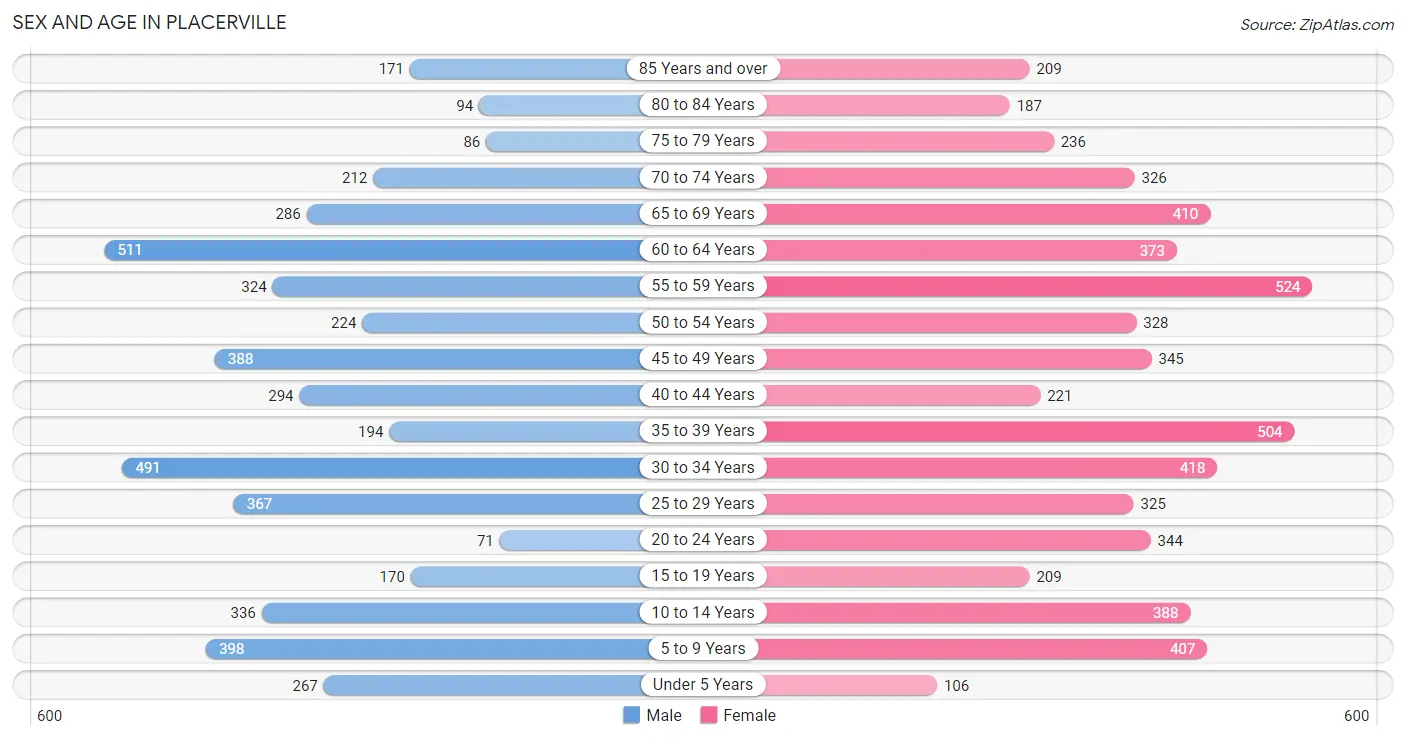
Sex and Age in Placerville
Sex and Age in Placerville
The most populous age groups in Placerville are 60 to 64 Years (511 | 10.5%) for men and 55 to 59 Years (524 | 8.9%) for women.
| Age Bracket | Male | Female |
| Under 5 Years | 267 (5.5%) | 106 (1.8%) |
| 5 to 9 Years | 398 (8.2%) | 407 (7.0%) |
| 10 to 14 Years | 336 (6.9%) | 388 (6.6%) |
| 15 to 19 Years | 170 (3.5%) | 209 (3.6%) |
| 20 to 24 Years | 71 (1.5%) | 344 (5.9%) |
| 25 to 29 Years | 367 (7.5%) | 325 (5.6%) |
| 30 to 34 Years | 491 (10.1%) | 418 (7.1%) |
| 35 to 39 Years | 194 (4.0%) | 504 (8.6%) |
| 40 to 44 Years | 294 (6.0%) | 221 (3.8%) |
| 45 to 49 Years | 388 (7.9%) | 345 (5.9%) |
| 50 to 54 Years | 224 (4.6%) | 328 (5.6%) |
| 55 to 59 Years | 324 (6.6%) | 524 (8.9%) |
| 60 to 64 Years | 511 (10.5%) | 373 (6.4%) |
| 65 to 69 Years | 286 (5.9%) | 410 (7.0%) |
| 70 to 74 Years | 212 (4.3%) | 326 (5.6%) |
| 75 to 79 Years | 86 (1.8%) | 236 (4.0%) |
| 80 to 84 Years | 94 (1.9%) | 187 (3.2%) |
| 85 Years and over | 171 (3.5%) | 209 (3.6%) |
| Total | 4,884 (100.0%) | 5,860 (100.0%) |
Families and Households in Placerville
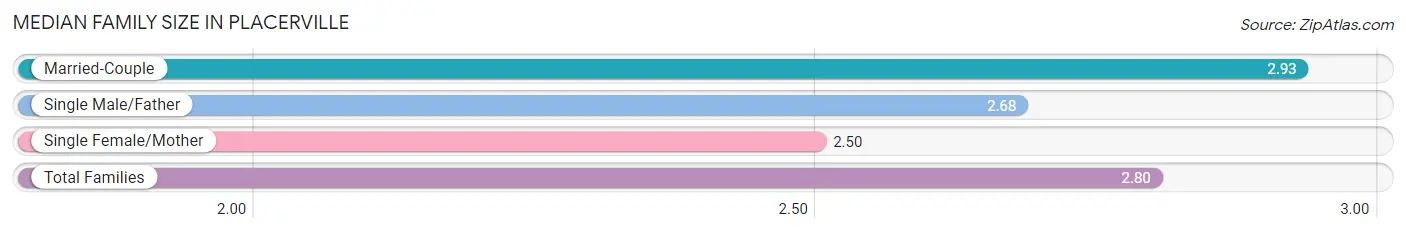
Median Family Size in Placerville
The median family size in Placerville is 2.80 persons per family, with married-couple families (1,818 | 65.2%) accounting for the largest median family size of 2.93 persons per family. On the other hand, single female/mother families (684 | 24.5%) represent the smallest median family size with 2.50 persons per family.
| Family Type | # Families | Family Size |
| Married-Couple | 1,818 (65.2%) | 2.93 |
| Single Male/Father | 285 (10.2%) | 2.68 |
| Single Female/Mother | 684 (24.5%) | 2.50 |
| Total Families | 2,787 (100.0%) | 2.80 |
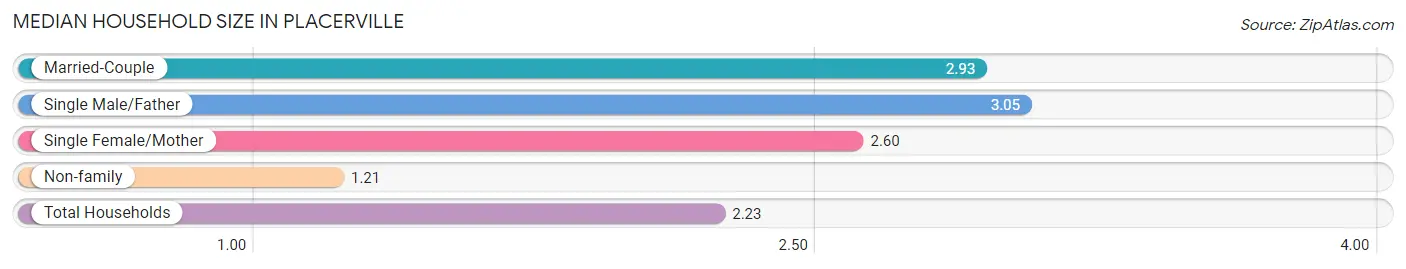
Median Household Size in Placerville
The median household size in Placerville is 2.23 persons per household, with single male/father households (285 | 6.3%) accounting for the largest median household size of 3.05 persons per household. non-family households (1,742 | 38.5%) represent the smallest median household size with 1.21 persons per household.
| Household Type | # Households | Household Size |
| Married-Couple | 1,818 (40.1%) | 2.93 |
| Single Male/Father | 285 (6.3%) | 3.05 |
| Single Female/Mother | 684 (15.1%) | 2.60 |
| Non-family | 1,742 (38.5%) | 1.21 |
| Total Households | 4,529 (100.0%) | 2.23 |
Household Size by Marriage Status in Placerville
Out of a total of 4,529 households in Placerville, 2,787 (61.5%) are family households, while 1,742 (38.5%) are nonfamily households. The most numerous type of family households are 2-person households, comprising 1,527, and the most common type of nonfamily households are 1-person households, comprising 1,427.
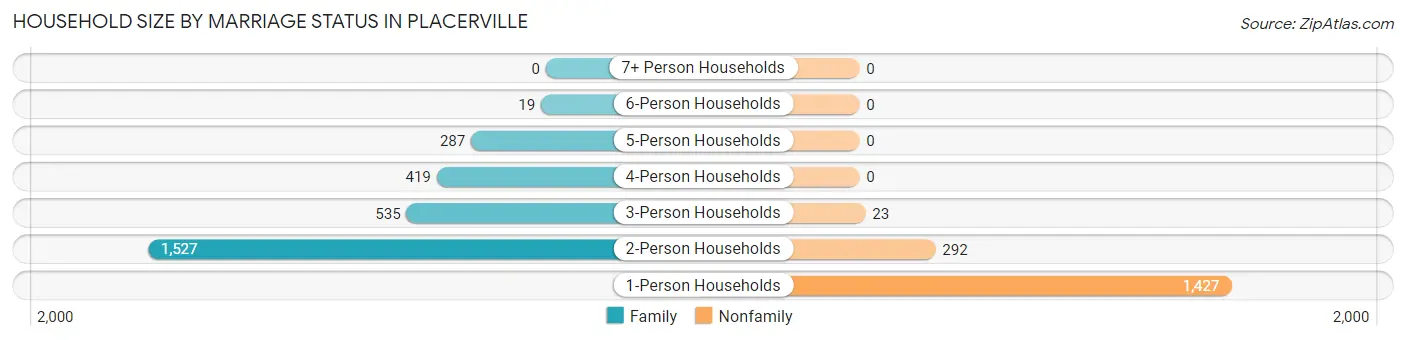
| Household Size | Family Households | Nonfamily Households |
| 1-Person Households | - | 1,427 (31.5%) |
| 2-Person Households | 1,527 (33.7%) | 292 (6.5%) |
| 3-Person Households | 535 (11.8%) | 23 (0.5%) |
| 4-Person Households | 419 (9.2%) | 0 (0.0%) |
| 5-Person Households | 287 (6.3%) | 0 (0.0%) |
| 6-Person Households | 19 (0.4%) | 0 (0.0%) |
| 7+ Person Households | 0 (0.0%) | 0 (0.0%) |
| Total | 2,787 (61.5%) | 1,742 (38.5%) |
Female Fertility in Placerville
Fertility by Age in Placerville
Average fertility rate in Placerville is 110.0 births per 1,000 women. Women in the age bracket of 20 to 34 years have the highest fertility rate with 243.0 births per 1,000 women. Women in the age bracket of 20 to 34 years acount for 95.7% of all women with births.
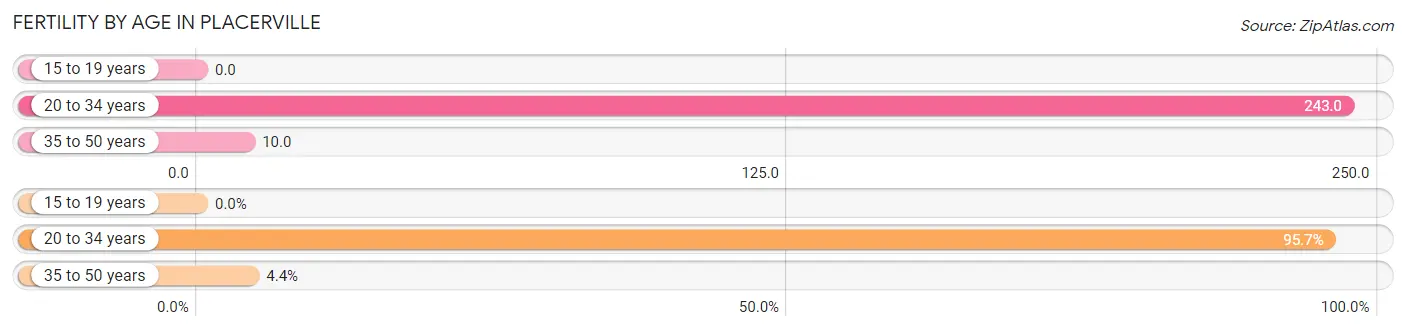
| Age Bracket | Women with Births | Births / 1,000 Women |
| 15 to 19 years | 0 (0.0%) | 0.0 |
| 20 to 34 years | 264 (95.7%) | 243.0 |
| 35 to 50 years | 12 (4.3%) | 10.0 |
| Total | 276 (100.0%) | 110.0 |
Fertility by Age by Marriage Status in Placerville
58.0% of women with births (276) in Placerville are married. The highest percentage of unmarried women with births falls into 20 to 34 years age bracket with 43.9% of them unmarried at the time of birth, while the lowest percentage of unmarried women with births belong to 35 to 50 years age bracket with 0.0% of them unmarried.
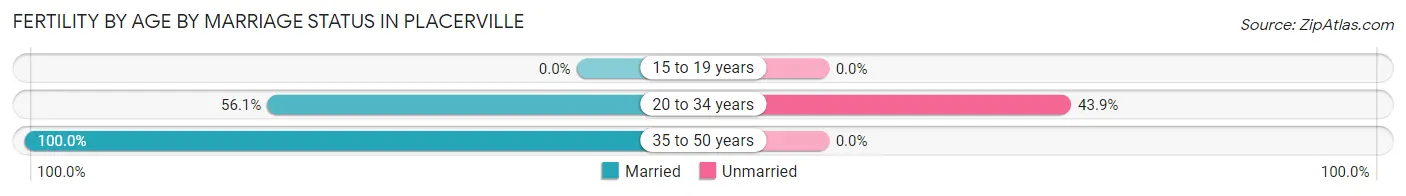
| Age Bracket | Married | Unmarried |
| 15 to 19 years | 0 (0.0%) | 0 (0.0%) |
| 20 to 34 years | 148 (56.1%) | 116 (43.9%) |
| 35 to 50 years | 12 (100.0%) | 0 (0.0%) |
| Total | 160 (58.0%) | 116 (42.0%) |
Fertility by Education in Placerville
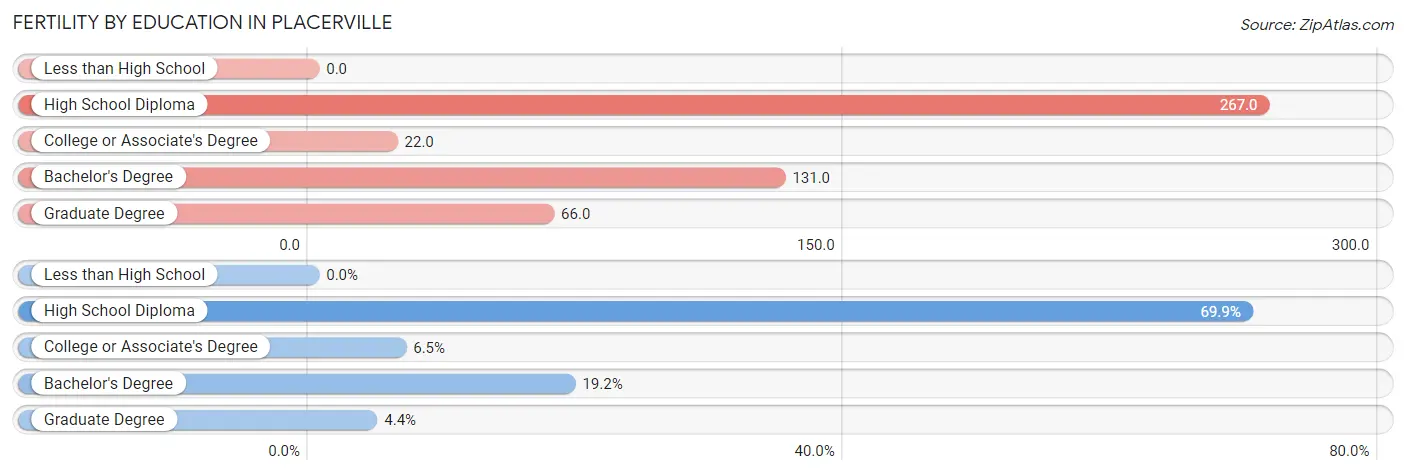
| Educational Attainment | Women with Births | Births / 1,000 Women |
| Less than High School | 0 (0.0%) | 0.0 |
| High School Diploma | 193 (69.9%) | 267.0 |
| College or Associate's Degree | 18 (6.5%) | 22.0 |
| Bachelor's Degree | 53 (19.2%) | 131.0 |
| Graduate Degree | 12 (4.3%) | 66.0 |
| Total | 276 (100.0%) | 110.0 |
Fertility by Education by Marriage Status in Placerville
42.0% of women with births in Placerville are unmarried. Women with the educational attainment of college or associate's degree are most likely to be married with 100.0% of them married at childbirth, while women with the educational attainment of high school diploma are least likely to be married with 60.1% of them unmarried at childbirth.
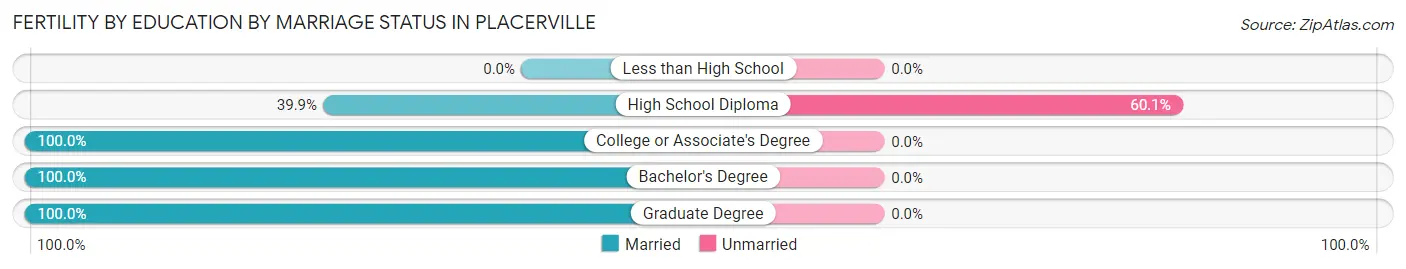
| Educational Attainment | Married | Unmarried |
| Less than High School | 0 (0.0%) | 0 (0.0%) |
| High School Diploma | 77 (39.9%) | 116 (60.1%) |
| College or Associate's Degree | 18 (100.0%) | 0 (0.0%) |
| Bachelor's Degree | 53 (100.0%) | 0 (0.0%) |
| Graduate Degree | 12 (100.0%) | 0 (0.0%) |
| Total | 160 (58.0%) | 116 (42.0%) |
Employment Characteristics in Placerville
Employment by Class of Employer in Placerville
Among the 4,808 employed individuals in Placerville, private company employees (2,472 | 51.4%), local government employees (680 | 14.1%), and not-for-profit organizations (572 | 11.9%) make up the most common classes of employment.
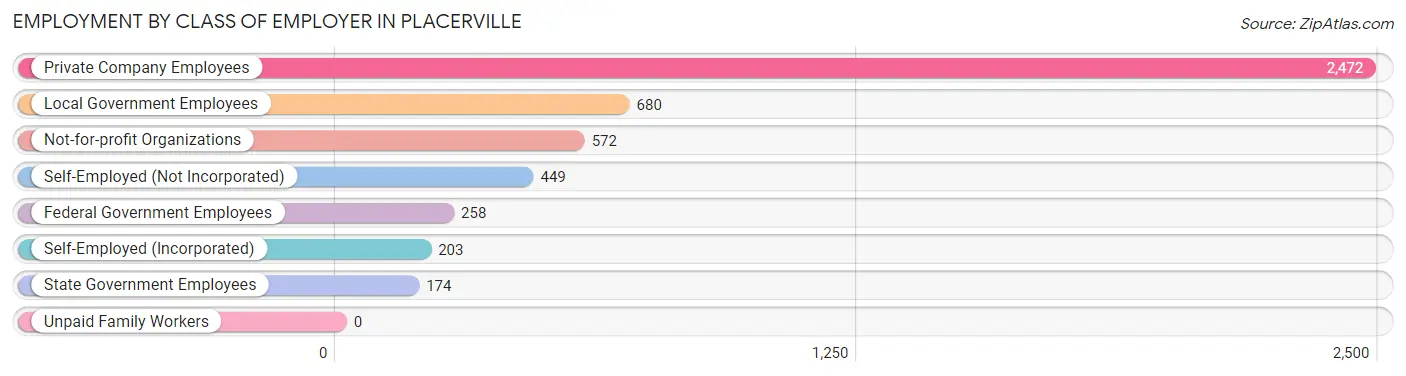
| Employer Class | # Employees | % Employees |
| Private Company Employees | 2,472 | 51.4% |
| Self-Employed (Incorporated) | 203 | 4.2% |
| Self-Employed (Not Incorporated) | 449 | 9.3% |
| Not-for-profit Organizations | 572 | 11.9% |
| Local Government Employees | 680 | 14.1% |
| State Government Employees | 174 | 3.6% |
| Federal Government Employees | 258 | 5.4% |
| Unpaid Family Workers | 0 | 0.0% |
| Total | 4,808 | 100.0% |
Employment Status by Age in Placerville
According to the labor force statistics for Placerville, out of the total population over 16 years of age (8,782), 59.0% or 5,181 individuals are in the labor force, with 5.1% or 264 of them unemployed. The age group with the highest labor force participation rate is 30 to 34 years, with 89.0% or 809 individuals in the labor force. Within the labor force, the 75 years and over age range has the highest percentage of unemployed individuals, with 25.4% or 30 of them being unemployed.
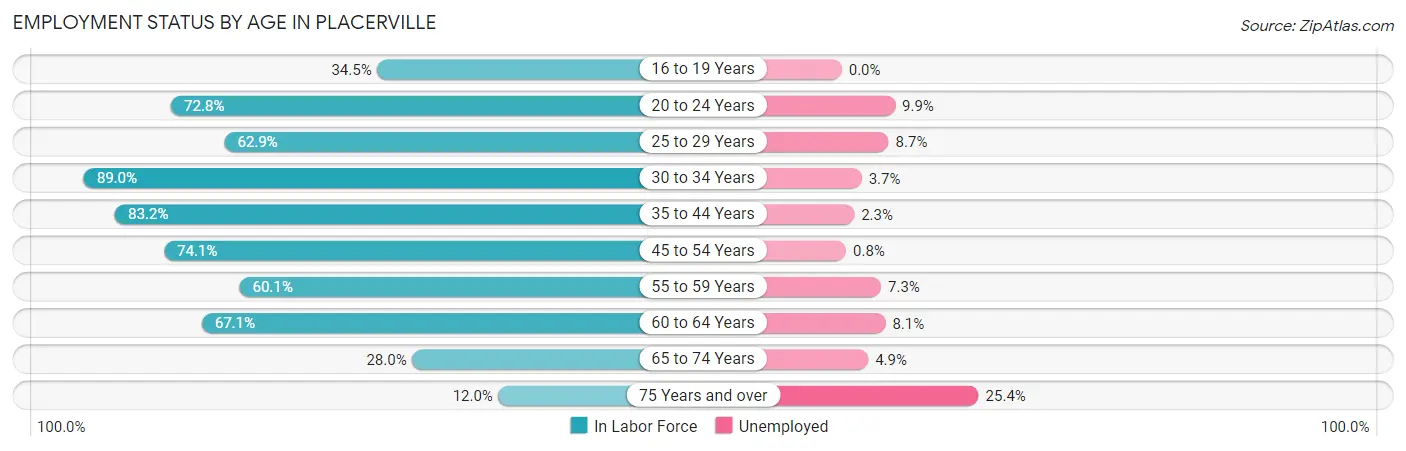
| Age Bracket | In Labor Force | Unemployed |
| 16 to 19 Years | 110 (34.5%) | 0 (0.0%) |
| 20 to 24 Years | 302 (72.8%) | 30 (9.9%) |
| 25 to 29 Years | 435 (62.9%) | 38 (8.7%) |
| 30 to 34 Years | 809 (89.0%) | 30 (3.7%) |
| 35 to 44 Years | 1,009 (83.2%) | 23 (2.3%) |
| 45 to 54 Years | 952 (74.1%) | 8 (0.8%) |
| 55 to 59 Years | 510 (60.1%) | 37 (7.3%) |
| 60 to 64 Years | 593 (67.1%) | 48 (8.1%) |
| 65 to 74 Years | 346 (28.0%) | 17 (4.9%) |
| 75 Years and over | 118 (12.0%) | 30 (25.4%) |
| Total | 5,181 (59.0%) | 264 (5.1%) |
Employment Status by Educational Attainment in Placerville
According to labor force statistics for Placerville, 73.9% of individuals (4,309) out of the total population between 25 and 64 years of age (5,831) are in the labor force, with 4.3% or 185 of them being unemployed. The group with the highest labor force participation rate are those with the educational attainment of bachelor's degree or higher, with 92.1% or 1,134 individuals in the labor force. Within the labor force, individuals with less than high school education have the highest percentage of unemployment, with 5.8% or 33 of them being unemployed.
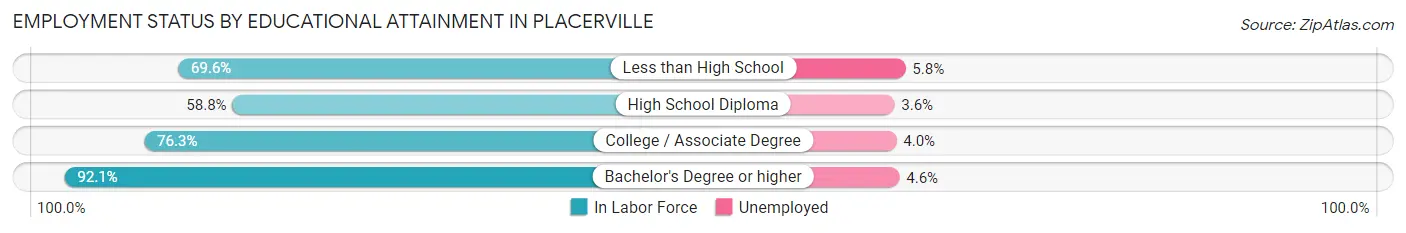
| Educational Attainment | In Labor Force | Unemployed |
| Less than High School | 571 (69.6%) | 48 (5.8%) |
| High School Diploma | 947 (58.8%) | 58 (3.6%) |
| College / Associate Degree | 1,655 (76.3%) | 87 (4.0%) |
| Bachelor's Degree or higher | 1,134 (92.1%) | 57 (4.6%) |
| Total | 4,309 (73.9%) | 251 (4.3%) |
Employment Occupations by Sex in Placerville
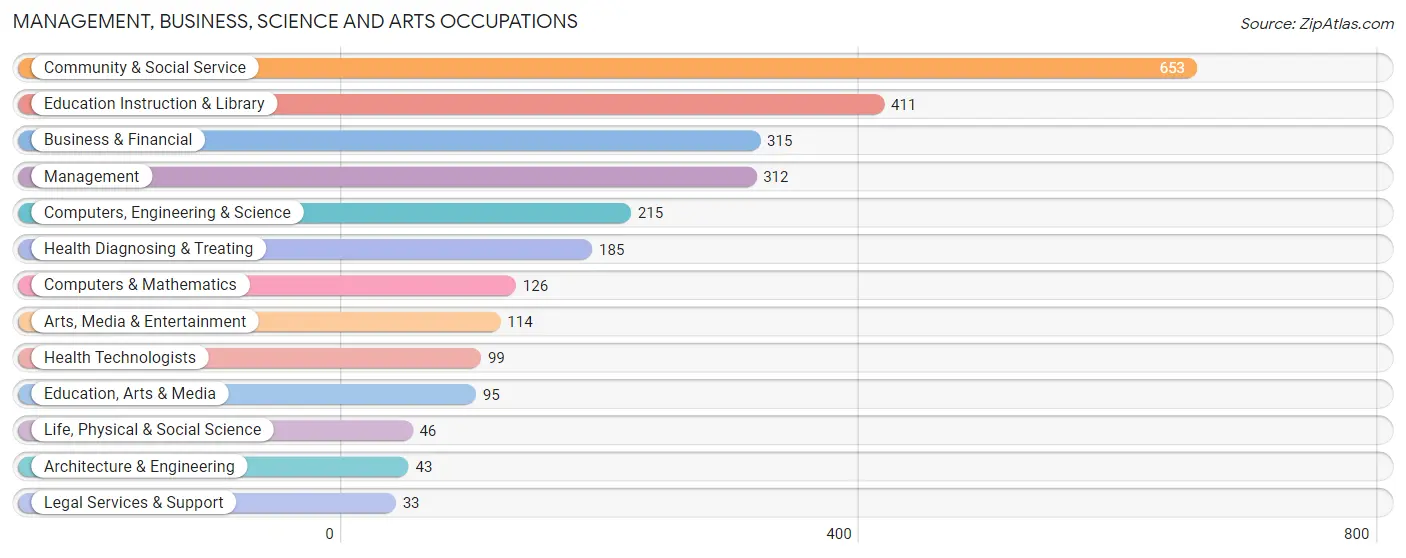
Management, Business, Science and Arts Occupations
The most common Management, Business, Science and Arts occupations in Placerville are Community & Social Service (653 | 13.4%), Education Instruction & Library (411 | 8.4%), Business & Financial (315 | 6.5%), Management (312 | 6.4%), and Computers, Engineering & Science (215 | 4.4%).
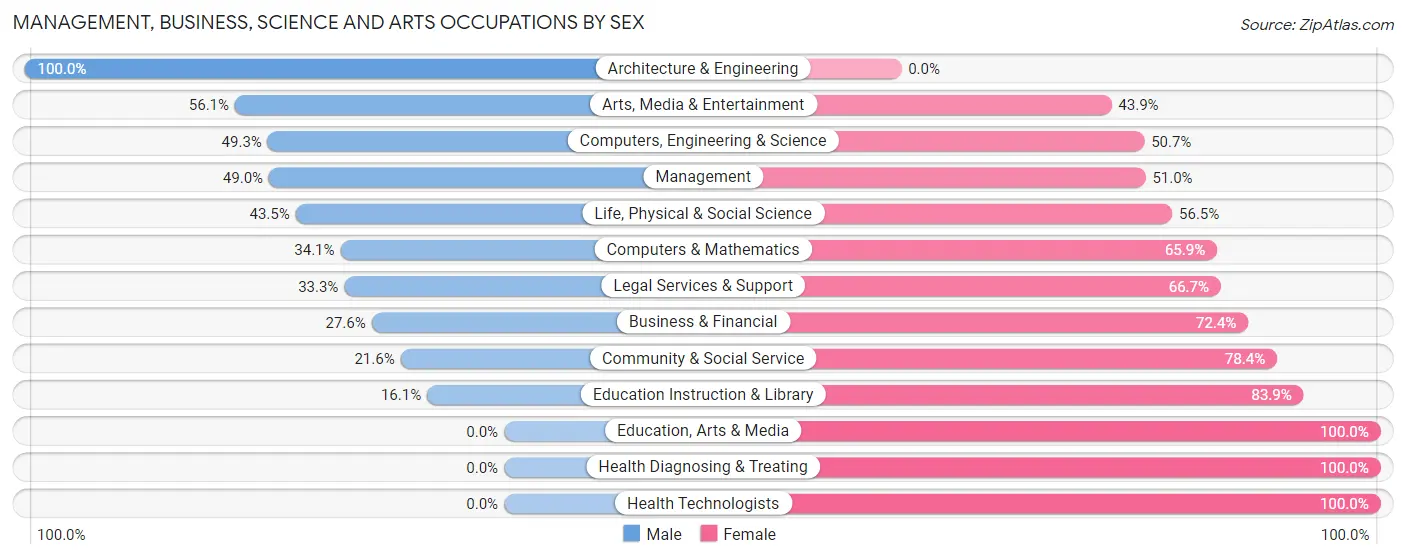
Management, Business, Science and Arts Occupations by Sex
Within the Management, Business, Science and Arts occupations in Placerville, the most male-oriented occupations are Architecture & Engineering (100.0%), Arts, Media & Entertainment (56.1%), and Computers, Engineering & Science (49.3%), while the most female-oriented occupations are Education, Arts & Media (100.0%), Health Diagnosing & Treating (100.0%), and Health Technologists (100.0%).
| Occupation | Male | Female |
| Management | 153 (49.0%) | 159 (51.0%) |
| Business & Financial | 87 (27.6%) | 228 (72.4%) |
| Computers, Engineering & Science | 106 (49.3%) | 109 (50.7%) |
| Computers & Mathematics | 43 (34.1%) | 83 (65.9%) |
| Architecture & Engineering | 43 (100.0%) | 0 (0.0%) |
| Life, Physical & Social Science | 20 (43.5%) | 26 (56.5%) |
| Community & Social Service | 141 (21.6%) | 512 (78.4%) |
| Education, Arts & Media | 0 (0.0%) | 95 (100.0%) |
| Legal Services & Support | 11 (33.3%) | 22 (66.7%) |
| Education Instruction & Library | 66 (16.1%) | 345 (83.9%) |
| Arts, Media & Entertainment | 64 (56.1%) | 50 (43.9%) |
| Health Diagnosing & Treating | 0 (0.0%) | 185 (100.0%) |
| Health Technologists | 0 (0.0%) | 99 (100.0%) |
| Total (Category) | 487 (29.0%) | 1,193 (71.0%) |
| Total (Overall) | 2,249 (46.0%) | 2,637 (54.0%) |
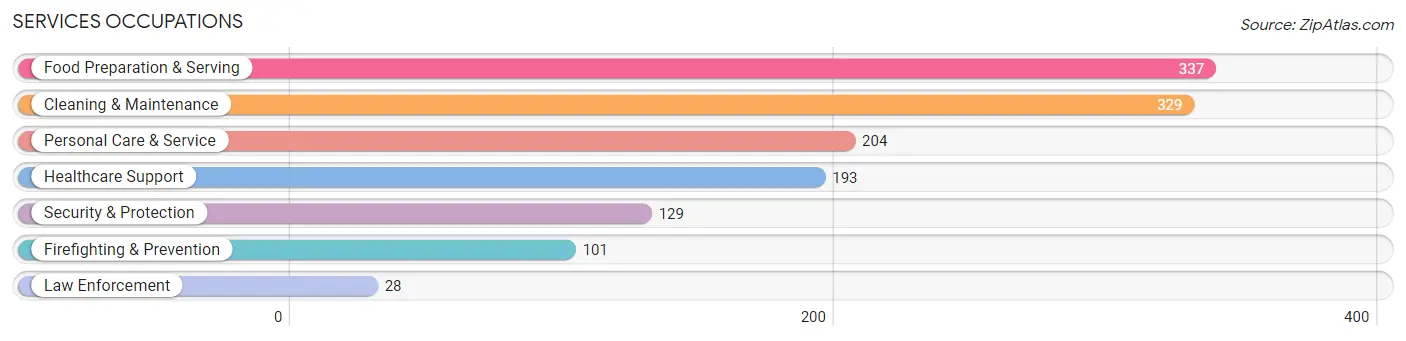
Services Occupations
The most common Services occupations in Placerville are Food Preparation & Serving (337 | 6.9%), Cleaning & Maintenance (329 | 6.7%), Personal Care & Service (204 | 4.2%), Healthcare Support (193 | 4.0%), and Security & Protection (129 | 2.6%).
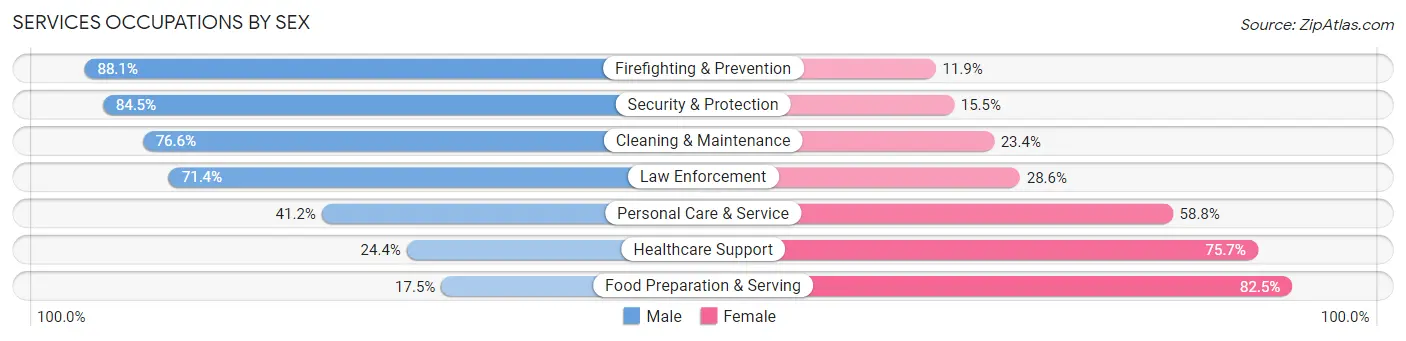
Services Occupations by Sex
Within the Services occupations in Placerville, the most male-oriented occupations are Firefighting & Prevention (88.1%), Security & Protection (84.5%), and Cleaning & Maintenance (76.6%), while the most female-oriented occupations are Food Preparation & Serving (82.5%), Healthcare Support (75.6%), and Personal Care & Service (58.8%).
| Occupation | Male | Female |
| Healthcare Support | 47 (24.3%) | 146 (75.6%) |
| Security & Protection | 109 (84.5%) | 20 (15.5%) |
| Firefighting & Prevention | 89 (88.1%) | 12 (11.9%) |
| Law Enforcement | 20 (71.4%) | 8 (28.6%) |
| Food Preparation & Serving | 59 (17.5%) | 278 (82.5%) |
| Cleaning & Maintenance | 252 (76.6%) | 77 (23.4%) |
| Personal Care & Service | 84 (41.2%) | 120 (58.8%) |
| Total (Category) | 551 (46.2%) | 641 (53.8%) |
| Total (Overall) | 2,249 (46.0%) | 2,637 (54.0%) |
Sales and Office Occupations
The most common Sales and Office occupations in Placerville are Office & Administration (589 | 12.0%), and Sales & Related (548 | 11.2%).

Sales and Office Occupations by Sex
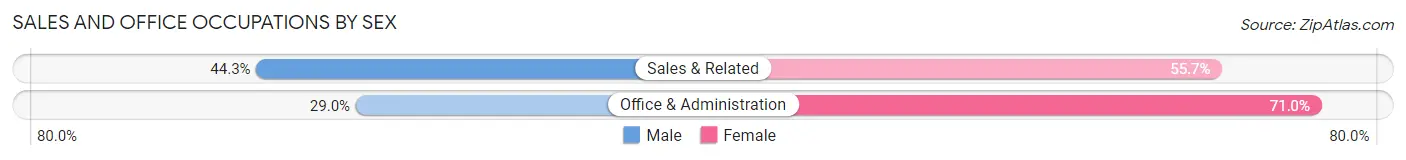
| Occupation | Male | Female |
| Sales & Related | 243 (44.3%) | 305 (55.7%) |
| Office & Administration | 171 (29.0%) | 418 (71.0%) |
| Total (Category) | 414 (36.4%) | 723 (63.6%) |
| Total (Overall) | 2,249 (46.0%) | 2,637 (54.0%) |
Natural Resources, Construction and Maintenance Occupations
The most common Natural Resources, Construction and Maintenance occupations in Placerville are Construction & Extraction (294 | 6.0%), Installation, Maintenance & Repair (32 | 0.6%), and Farming, Fishing & Forestry (19 | 0.4%).
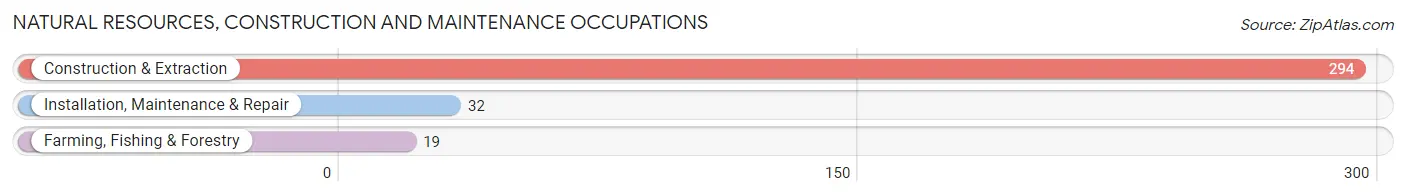
Natural Resources, Construction and Maintenance Occupations by Sex

| Occupation | Male | Female |
| Farming, Fishing & Forestry | 19 (100.0%) | 0 (0.0%) |
| Construction & Extraction | 294 (100.0%) | 0 (0.0%) |
| Installation, Maintenance & Repair | 0 (0.0%) | 32 (100.0%) |
| Total (Category) | 313 (90.7%) | 32 (9.3%) |
| Total (Overall) | 2,249 (46.0%) | 2,637 (54.0%) |
Production, Transportation and Moving Occupations
The most common Production, Transportation and Moving occupations in Placerville are Production (321 | 6.6%), Material Moving (109 | 2.2%), and Transportation (102 | 2.1%).
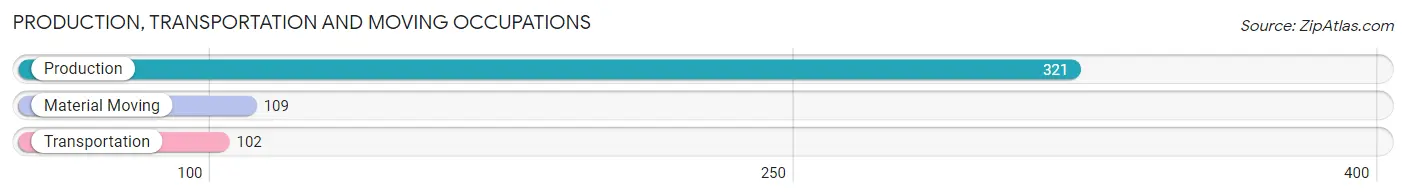
Production, Transportation and Moving Occupations by Sex
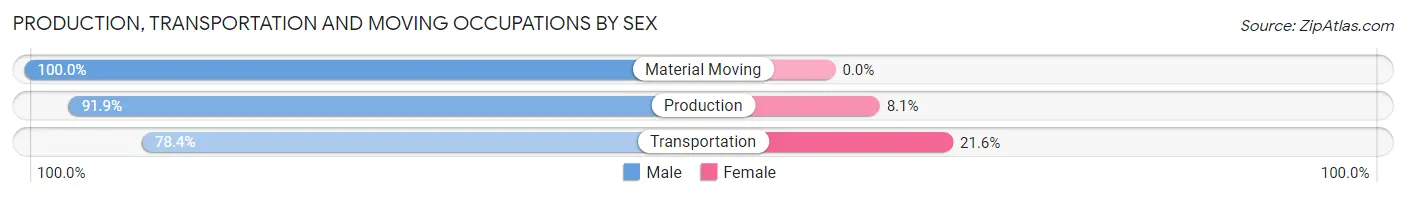
| Occupation | Male | Female |
| Production | 295 (91.9%) | 26 (8.1%) |
| Transportation | 80 (78.4%) | 22 (21.6%) |
| Material Moving | 109 (100.0%) | 0 (0.0%) |
| Total (Category) | 484 (91.0%) | 48 (9.0%) |
| Total (Overall) | 2,249 (46.0%) | 2,637 (54.0%) |
Employment Industries by Sex in Placerville
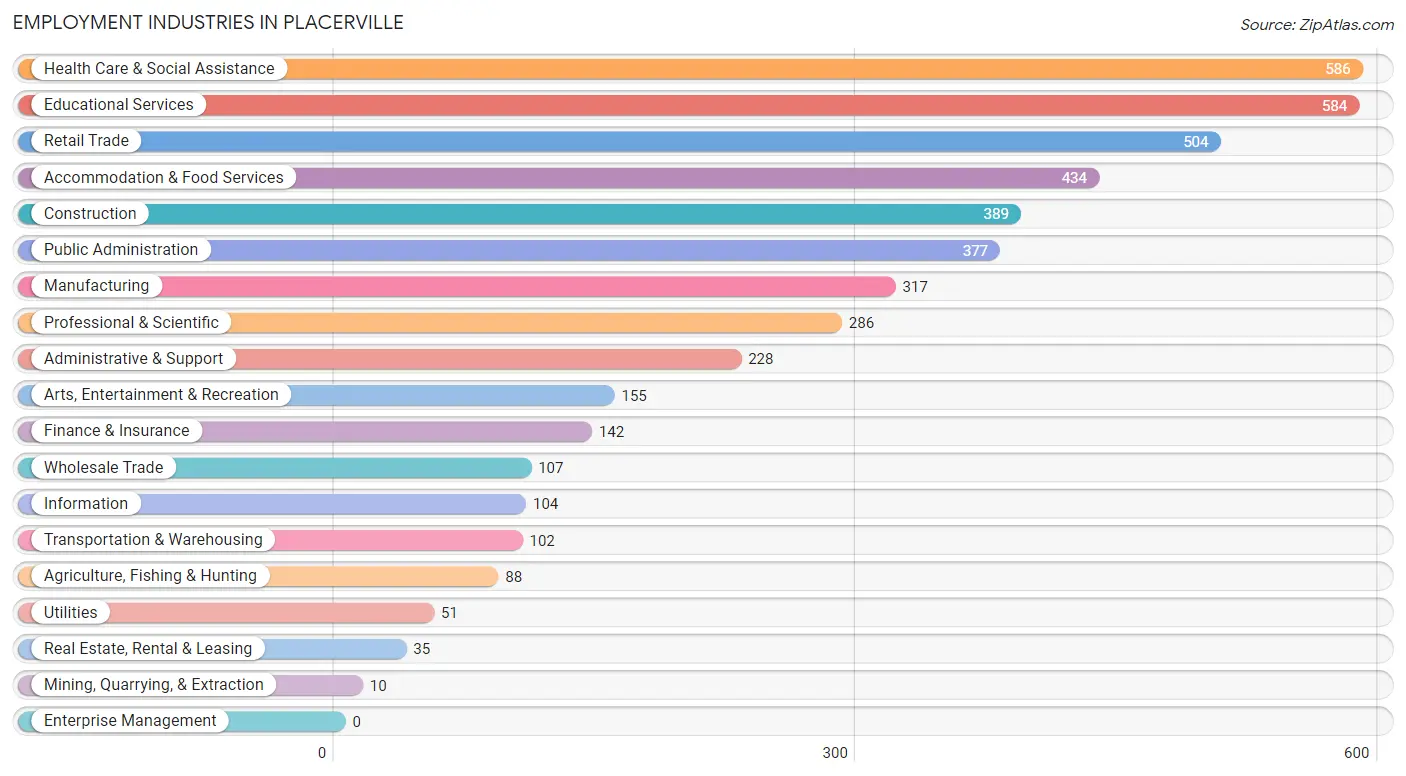
Employment Industries in Placerville
The major employment industries in Placerville include Health Care & Social Assistance (586 | 12.0%), Educational Services (584 | 11.9%), Retail Trade (504 | 10.3%), Accommodation & Food Services (434 | 8.9%), and Construction (389 | 8.0%).
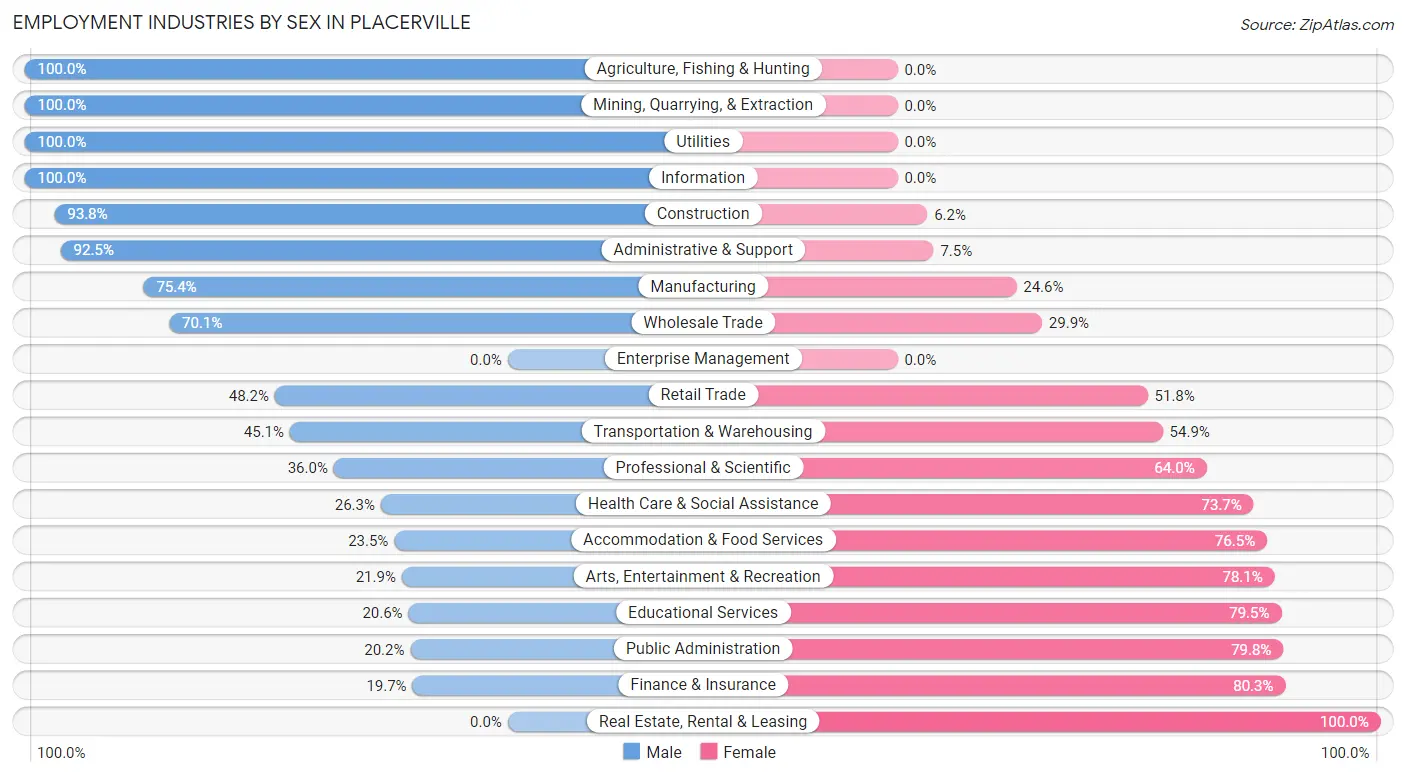
Employment Industries by Sex in Placerville
The Placerville industries that see more men than women are Agriculture, Fishing & Hunting (100.0%), Mining, Quarrying, & Extraction (100.0%), and Utilities (100.0%), whereas the industries that tend to have a higher number of women are Real Estate, Rental & Leasing (100.0%), Finance & Insurance (80.3%), and Public Administration (79.8%).
| Industry | Male | Female |
| Agriculture, Fishing & Hunting | 88 (100.0%) | 0 (0.0%) |
| Mining, Quarrying, & Extraction | 10 (100.0%) | 0 (0.0%) |
| Construction | 365 (93.8%) | 24 (6.2%) |
| Manufacturing | 239 (75.4%) | 78 (24.6%) |
| Wholesale Trade | 75 (70.1%) | 32 (29.9%) |
| Retail Trade | 243 (48.2%) | 261 (51.8%) |
| Transportation & Warehousing | 46 (45.1%) | 56 (54.9%) |
| Utilities | 51 (100.0%) | 0 (0.0%) |
| Information | 104 (100.0%) | 0 (0.0%) |
| Finance & Insurance | 28 (19.7%) | 114 (80.3%) |
| Real Estate, Rental & Leasing | 0 (0.0%) | 35 (100.0%) |
| Professional & Scientific | 103 (36.0%) | 183 (64.0%) |
| Enterprise Management | 0 (0.0%) | 0 (0.0%) |
| Administrative & Support | 211 (92.5%) | 17 (7.5%) |
| Educational Services | 120 (20.5%) | 464 (79.4%) |
| Health Care & Social Assistance | 154 (26.3%) | 432 (73.7%) |
| Arts, Entertainment & Recreation | 34 (21.9%) | 121 (78.1%) |
| Accommodation & Food Services | 102 (23.5%) | 332 (76.5%) |
| Public Administration | 76 (20.2%) | 301 (79.8%) |
| Total | 2,249 (46.0%) | 2,637 (54.0%) |
Education in Placerville
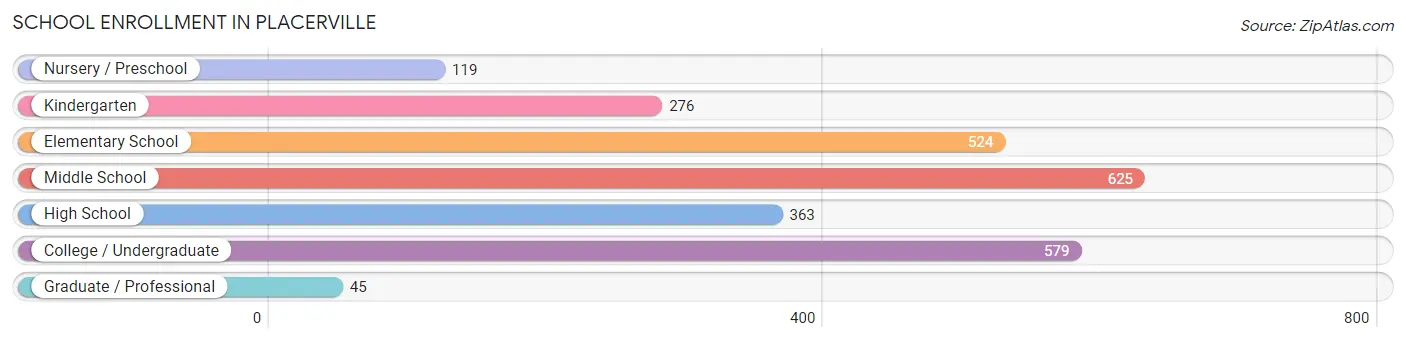
School Enrollment in Placerville
The most common levels of schooling among the 2,531 students in Placerville are middle school (625 | 24.7%), college / undergraduate (579 | 22.9%), and elementary school (524 | 20.7%).
| School Level | # Students | % Students |
| Nursery / Preschool | 119 | 4.7% |
| Kindergarten | 276 | 10.9% |
| Elementary School | 524 | 20.7% |
| Middle School | 625 | 24.7% |
| High School | 363 | 14.3% |
| College / Undergraduate | 579 | 22.9% |
| Graduate / Professional | 45 | 1.8% |
| Total | 2,531 | 100.0% |
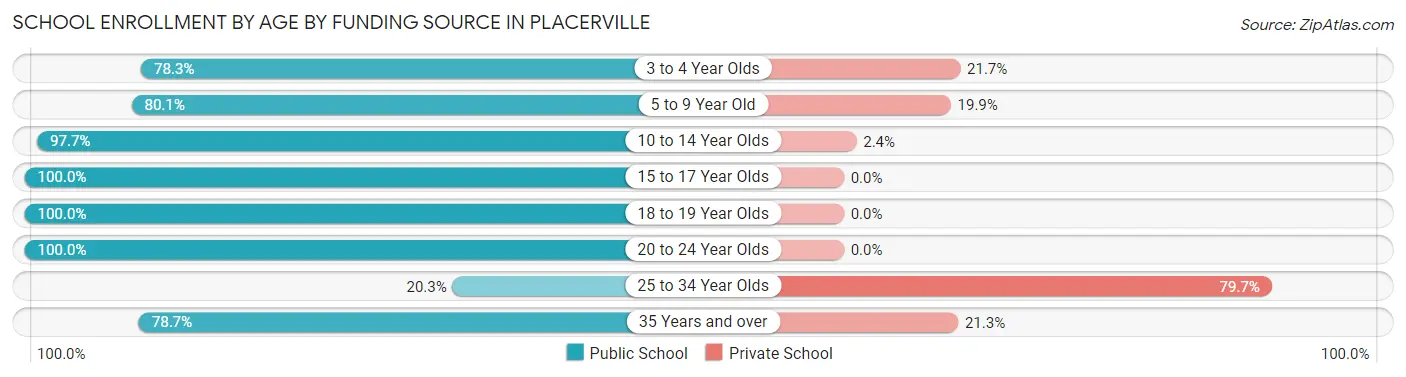
School Enrollment by Age by Funding Source in Placerville
Out of a total of 2,531 students who are enrolled in schools in Placerville, 405 (16.0%) attend a private institution, while the remaining 2,126 (84.0%) are enrolled in public schools. The age group of 25 to 34 year olds has the highest likelihood of being enrolled in private schools, with 165 (79.7% in the age bracket) enrolled. Conversely, the age group of 15 to 17 year olds has the lowest likelihood of being enrolled in a private school, with 292 (100.0% in the age bracket) attending a public institution.
| Age Bracket | Public School | Private School |
| 3 to 4 Year Olds | 65 (78.3%) | 18 (21.7%) |
| 5 to 9 Year Old | 607 (80.1%) | 151 (19.9%) |
| 10 to 14 Year Olds | 707 (97.7%) | 17 (2.4%) |
| 15 to 17 Year Olds | 292 (100.0%) | 0 (0.0%) |
| 18 to 19 Year Olds | 16 (100.0%) | 0 (0.0%) |
| 20 to 24 Year Olds | 202 (100.0%) | 0 (0.0%) |
| 25 to 34 Year Olds | 42 (20.3%) | 165 (79.7%) |
| 35 Years and over | 196 (78.7%) | 53 (21.3%) |
| Total | 2,126 (84.0%) | 405 (16.0%) |
Educational Attainment by Field of Study in Placerville
Bio, nature & agricultural (340 | 15.7%), business (308 | 14.3%), education (303 | 14.0%), arts & humanities (251 | 11.6%), and social sciences (195 | 9.0%) are the most common fields of study among 2,160 individuals in Placerville who have obtained a bachelor's degree or higher.
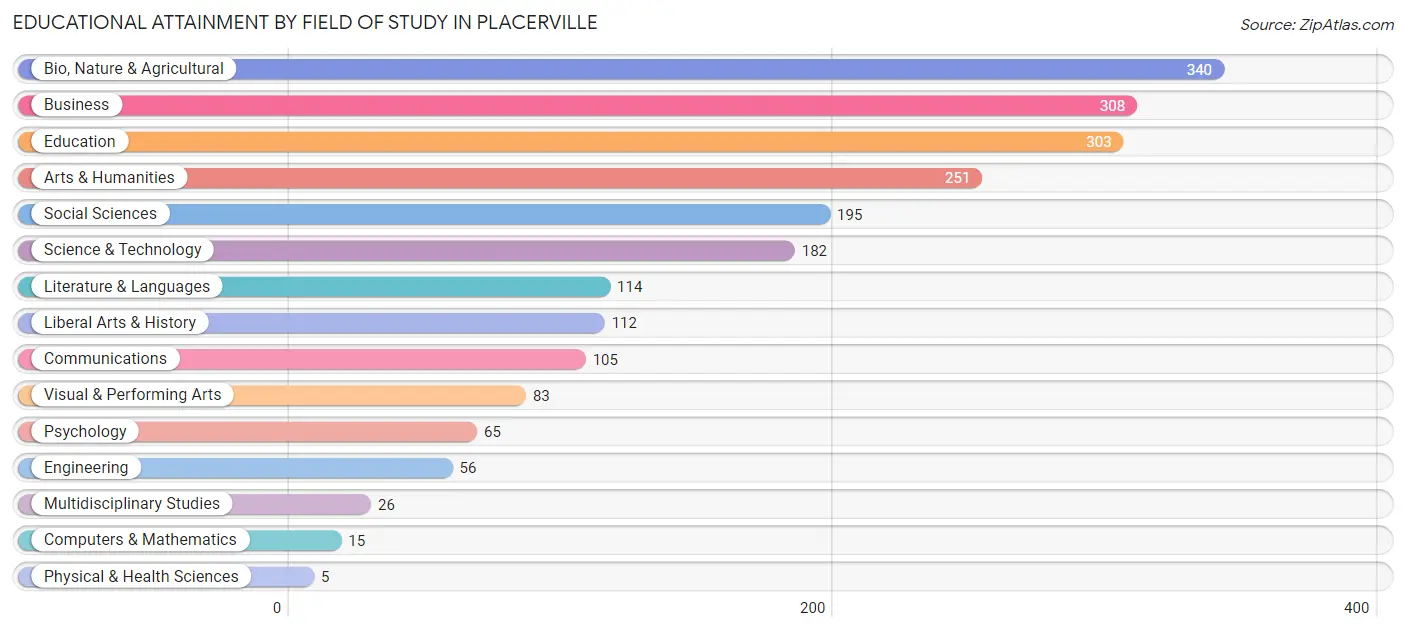
| Field of Study | # Graduates | % Graduates |
| Computers & Mathematics | 15 | 0.7% |
| Bio, Nature & Agricultural | 340 | 15.7% |
| Physical & Health Sciences | 5 | 0.2% |
| Psychology | 65 | 3.0% |
| Social Sciences | 195 | 9.0% |
| Engineering | 56 | 2.6% |
| Multidisciplinary Studies | 26 | 1.2% |
| Science & Technology | 182 | 8.4% |
| Business | 308 | 14.3% |
| Education | 303 | 14.0% |
| Literature & Languages | 114 | 5.3% |
| Liberal Arts & History | 112 | 5.2% |
| Visual & Performing Arts | 83 | 3.8% |
| Communications | 105 | 4.9% |
| Arts & Humanities | 251 | 11.6% |
| Total | 2,160 | 100.0% |
Transportation & Commute in Placerville
Vehicle Availability by Sex in Placerville
The most prevalent vehicle ownership categories in Placerville are males with 2 vehicles (1,084, accounting for 48.4%) and females with 2 vehicles (793, making up 42.7%).
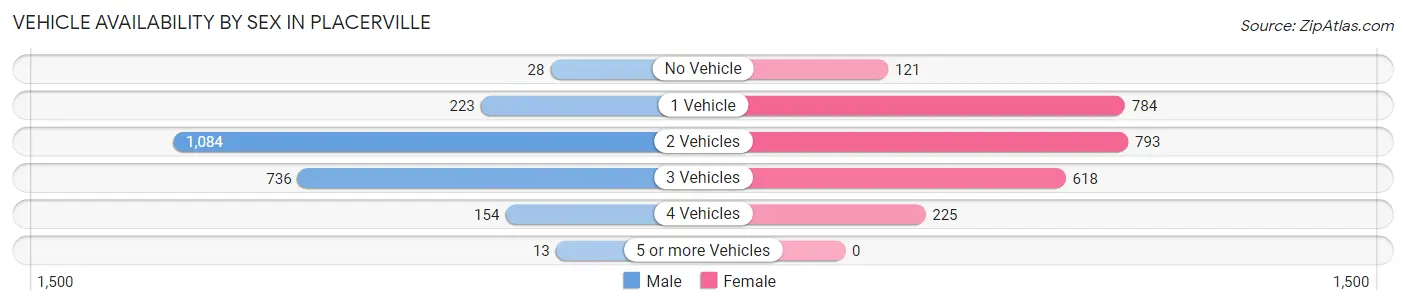
| Vehicles Available | Male | Female |
| No Vehicle | 28 (1.3%) | 121 (4.8%) |
| 1 Vehicle | 223 (10.0%) | 784 (30.8%) |
| 2 Vehicles | 1,084 (48.4%) | 793 (31.2%) |
| 3 Vehicles | 736 (32.9%) | 618 (24.3%) |
| 4 Vehicles | 154 (6.9%) | 225 (8.8%) |
| 5 or more Vehicles | 13 (0.6%) | 0 (0.0%) |
| Total | 2,238 (100.0%) | 2,541 (100.0%) |
Commute Time in Placerville
The most frequently occuring commute durations in Placerville are 10 to 14 minutes (785 commuters, 19.1%), 45 to 59 minutes (600 commuters, 14.6%), and 15 to 19 minutes (581 commuters, 14.1%).
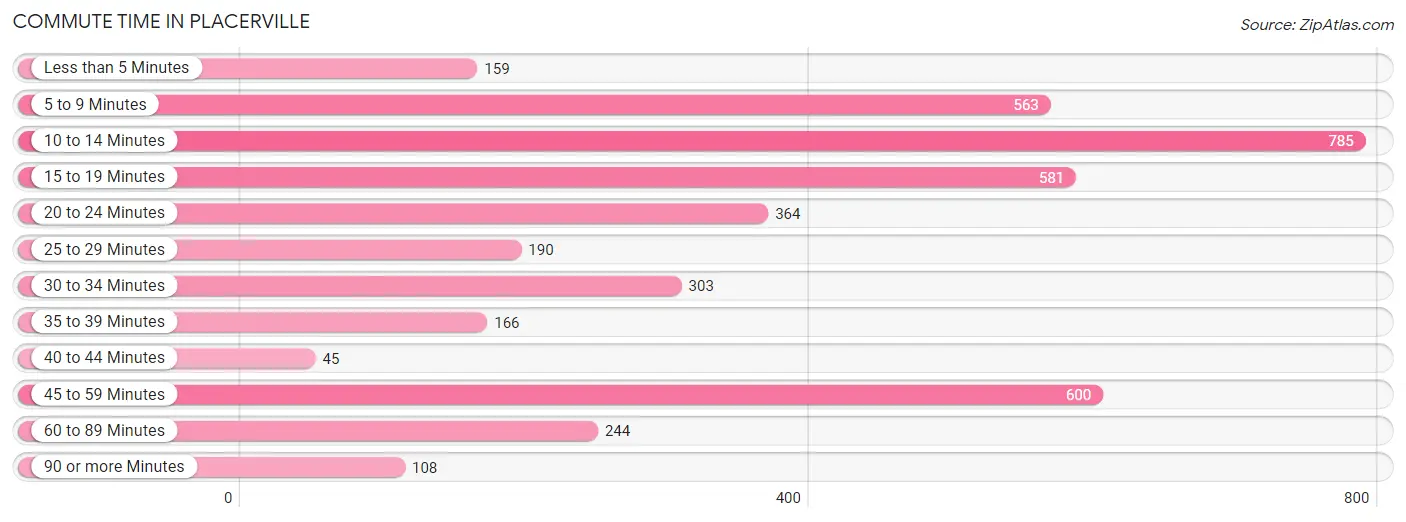
| Commute Time | # Commuters | % Commuters |
| Less than 5 Minutes | 159 | 3.9% |
| 5 to 9 Minutes | 563 | 13.7% |
| 10 to 14 Minutes | 785 | 19.1% |
| 15 to 19 Minutes | 581 | 14.1% |
| 20 to 24 Minutes | 364 | 8.9% |
| 25 to 29 Minutes | 190 | 4.6% |
| 30 to 34 Minutes | 303 | 7.4% |
| 35 to 39 Minutes | 166 | 4.0% |
| 40 to 44 Minutes | 45 | 1.1% |
| 45 to 59 Minutes | 600 | 14.6% |
| 60 to 89 Minutes | 244 | 5.9% |
| 90 or more Minutes | 108 | 2.6% |
Commute Time by Sex in Placerville
The most common commute times in Placerville are 45 to 59 minutes (383 commuters, 19.7%) for males and 10 to 14 minutes (445 commuters, 20.5%) for females.
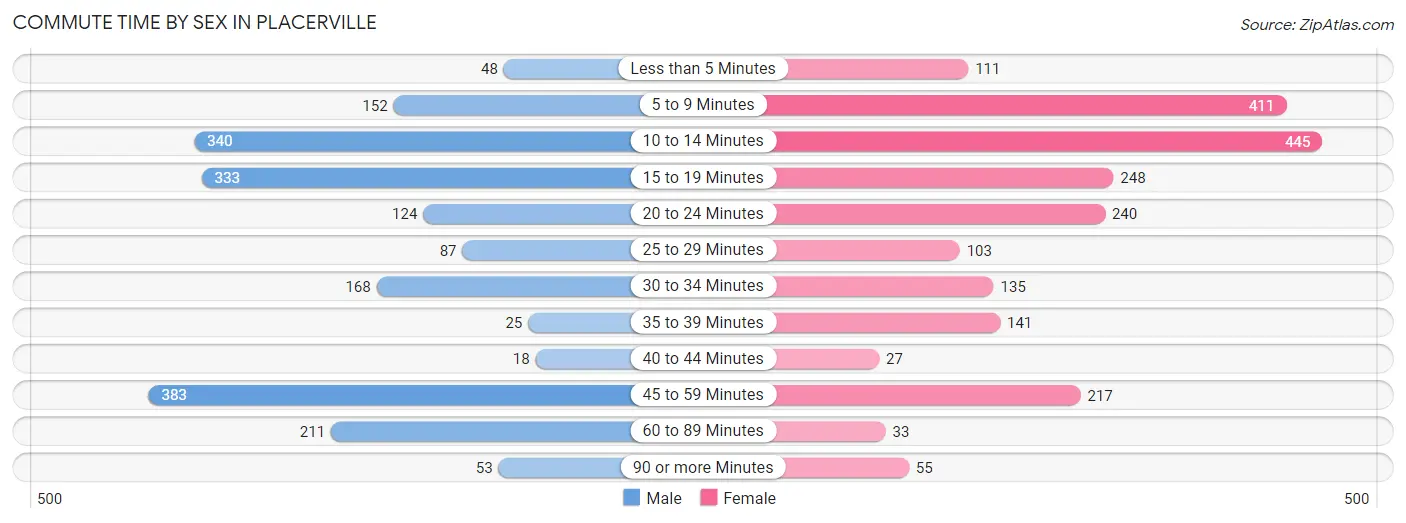
| Commute Time | Male | Female |
| Less than 5 Minutes | 48 (2.5%) | 111 (5.1%) |
| 5 to 9 Minutes | 152 (7.8%) | 411 (19.0%) |
| 10 to 14 Minutes | 340 (17.5%) | 445 (20.5%) |
| 15 to 19 Minutes | 333 (17.2%) | 248 (11.5%) |
| 20 to 24 Minutes | 124 (6.4%) | 240 (11.1%) |
| 25 to 29 Minutes | 87 (4.5%) | 103 (4.8%) |
| 30 to 34 Minutes | 168 (8.6%) | 135 (6.2%) |
| 35 to 39 Minutes | 25 (1.3%) | 141 (6.5%) |
| 40 to 44 Minutes | 18 (0.9%) | 27 (1.3%) |
| 45 to 59 Minutes | 383 (19.7%) | 217 (10.0%) |
| 60 to 89 Minutes | 211 (10.9%) | 33 (1.5%) |
| 90 or more Minutes | 53 (2.7%) | 55 (2.5%) |
Time of Departure to Work by Sex in Placerville
The most frequent times of departure to work in Placerville are 7:00 AM to 7:29 AM (392, 20.2%) for males and 7:00 AM to 7:29 AM (349, 16.1%) for females.
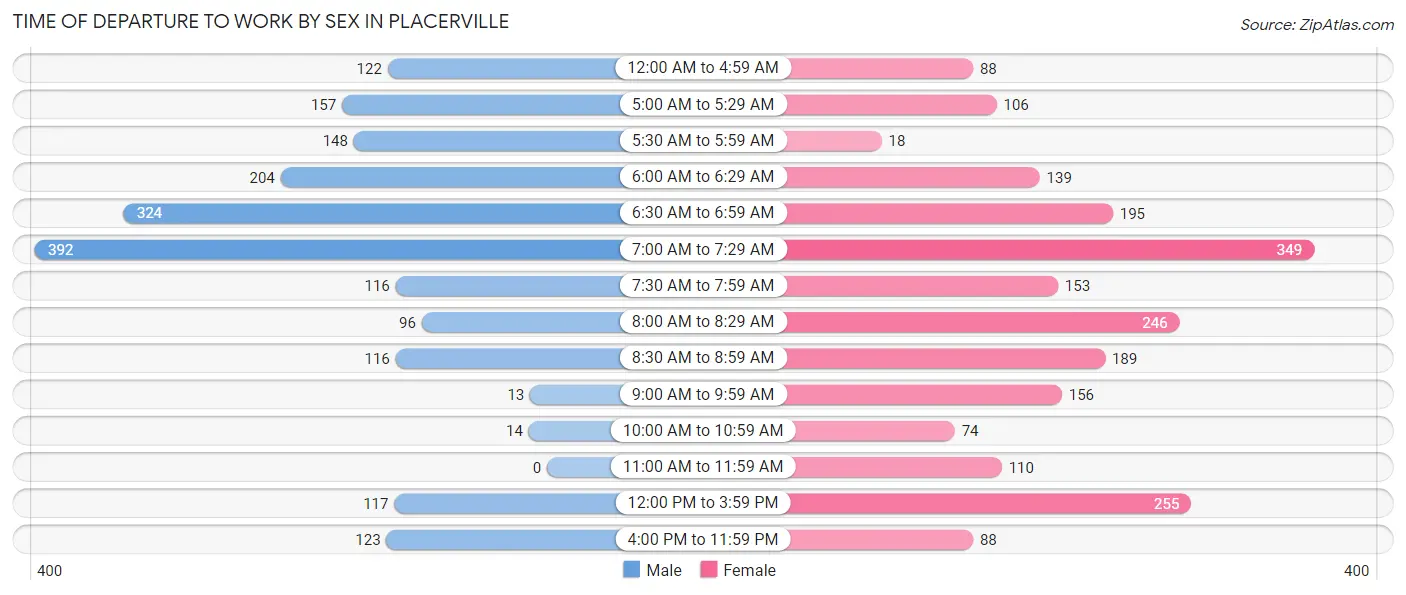
| Time of Departure | Male | Female |
| 12:00 AM to 4:59 AM | 122 (6.3%) | 88 (4.1%) |
| 5:00 AM to 5:29 AM | 157 (8.1%) | 106 (4.9%) |
| 5:30 AM to 5:59 AM | 148 (7.6%) | 18 (0.8%) |
| 6:00 AM to 6:29 AM | 204 (10.5%) | 139 (6.4%) |
| 6:30 AM to 6:59 AM | 324 (16.7%) | 195 (9.0%) |
| 7:00 AM to 7:29 AM | 392 (20.2%) | 349 (16.1%) |
| 7:30 AM to 7:59 AM | 116 (6.0%) | 153 (7.1%) |
| 8:00 AM to 8:29 AM | 96 (4.9%) | 246 (11.4%) |
| 8:30 AM to 8:59 AM | 116 (6.0%) | 189 (8.7%) |
| 9:00 AM to 9:59 AM | 13 (0.7%) | 156 (7.2%) |
| 10:00 AM to 10:59 AM | 14 (0.7%) | 74 (3.4%) |
| 11:00 AM to 11:59 AM | 0 (0.0%) | 110 (5.1%) |
| 12:00 PM to 3:59 PM | 117 (6.0%) | 255 (11.8%) |
| 4:00 PM to 11:59 PM | 123 (6.3%) | 88 (4.1%) |
| Total | 1,942 (100.0%) | 2,166 (100.0%) |
Housing Occupancy in Placerville
Occupancy by Ownership in Placerville
Of the total 4,529 dwellings in Placerville, owner-occupied units account for 2,823 (62.3%), while renter-occupied units make up 1,706 (37.7%).
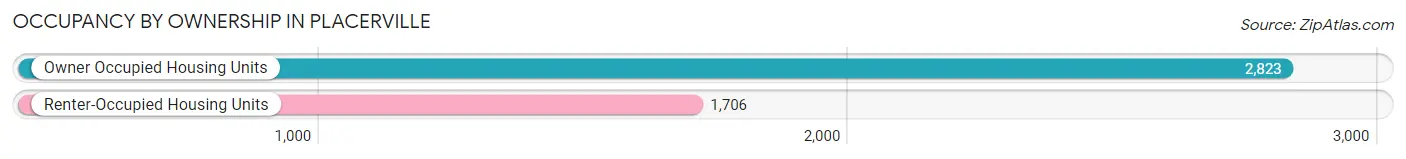
| Occupancy | # Housing Units | % Housing Units |
| Owner Occupied Housing Units | 2,823 | 62.3% |
| Renter-Occupied Housing Units | 1,706 | 37.7% |
| Total Occupied Housing Units | 4,529 | 100.0% |
Occupancy by Household Size in Placerville
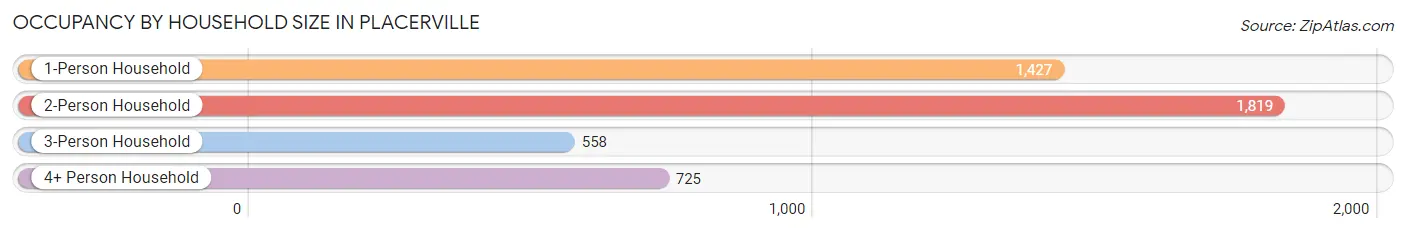
| Household Size | # Housing Units | % Housing Units |
| 1-Person Household | 1,427 | 31.5% |
| 2-Person Household | 1,819 | 40.2% |
| 3-Person Household | 558 | 12.3% |
| 4+ Person Household | 725 | 16.0% |
| Total Housing Units | 4,529 | 100.0% |
Occupancy by Ownership by Household Size in Placerville
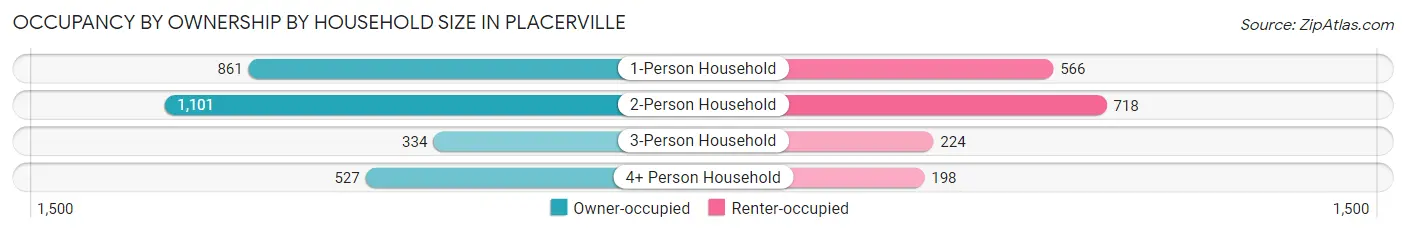
| Household Size | Owner-occupied | Renter-occupied |
| 1-Person Household | 861 (60.3%) | 566 (39.7%) |
| 2-Person Household | 1,101 (60.5%) | 718 (39.5%) |
| 3-Person Household | 334 (59.9%) | 224 (40.1%) |
| 4+ Person Household | 527 (72.7%) | 198 (27.3%) |
| Total Housing Units | 2,823 (62.3%) | 1,706 (37.7%) |
Occupancy by Educational Attainment in Placerville
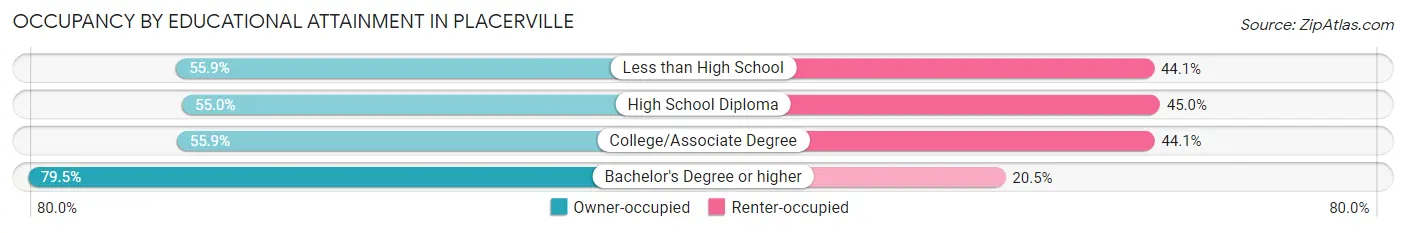
| Household Size | Owner-occupied | Renter-occupied |
| Less than High School | 245 (55.9%) | 193 (44.1%) |
| High School Diploma | 609 (55.0%) | 498 (45.0%) |
| College/Associate Degree | 953 (55.9%) | 753 (44.1%) |
| Bachelor's Degree or higher | 1,016 (79.5%) | 262 (20.5%) |
Occupancy by Age of Householder in Placerville
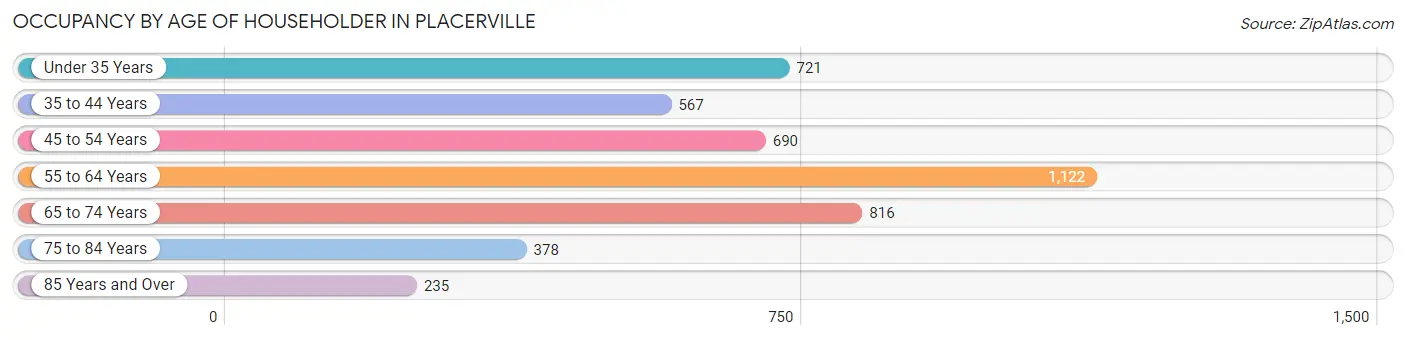
| Age Bracket | # Households | % Households |
| Under 35 Years | 721 | 15.9% |
| 35 to 44 Years | 567 | 12.5% |
| 45 to 54 Years | 690 | 15.2% |
| 55 to 64 Years | 1,122 | 24.8% |
| 65 to 74 Years | 816 | 18.0% |
| 75 to 84 Years | 378 | 8.4% |
| 85 Years and Over | 235 | 5.2% |
| Total | 4,529 | 100.0% |
Housing Finances in Placerville
Median Income by Occupancy in Placerville
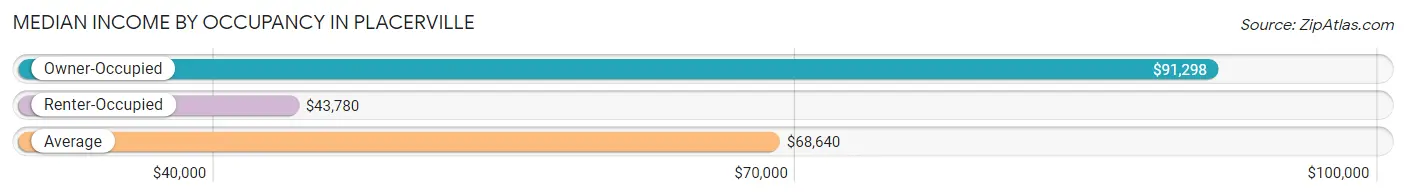
| Occupancy Type | # Households | Median Income |
| Owner-Occupied | 2,823 (62.3%) | $91,298 |
| Renter-Occupied | 1,706 (37.7%) | $43,780 |
| Average | 4,529 (100.0%) | $68,640 |
Occupancy by Householder Income Bracket in Placerville
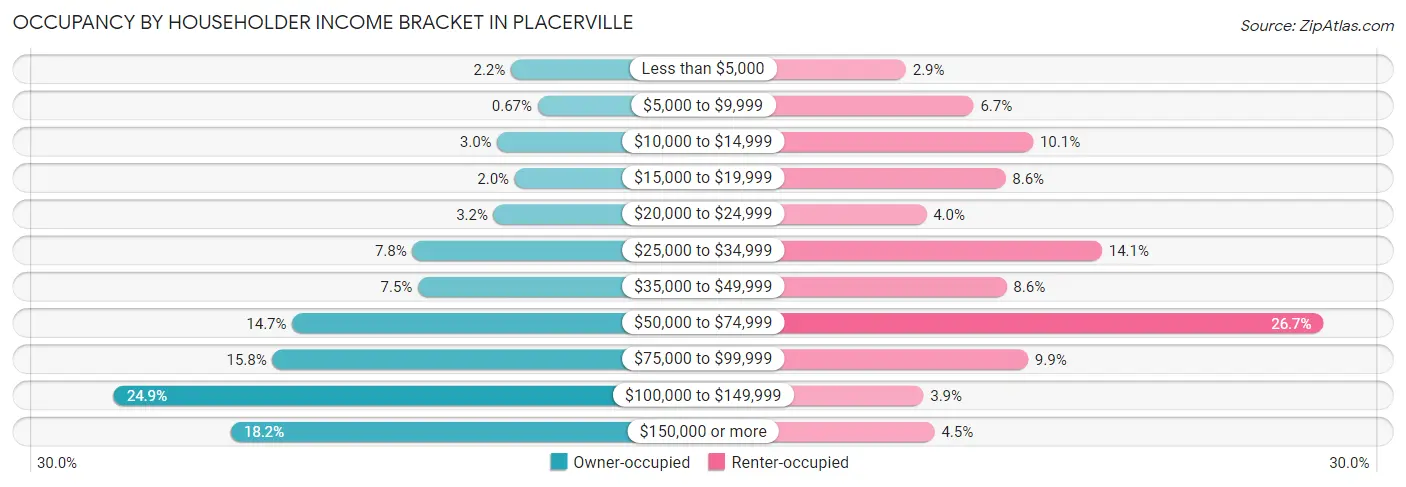
| Income Bracket | Owner-occupied | Renter-occupied |
| Less than $5,000 | 62 (2.2%) | 49 (2.9%) |
| $5,000 to $9,999 | 19 (0.7%) | 115 (6.7%) |
| $10,000 to $14,999 | 84 (3.0%) | 173 (10.1%) |
| $15,000 to $19,999 | 56 (2.0%) | 146 (8.6%) |
| $20,000 to $24,999 | 90 (3.2%) | 69 (4.0%) |
| $25,000 to $34,999 | 221 (7.8%) | 240 (14.1%) |
| $35,000 to $49,999 | 212 (7.5%) | 147 (8.6%) |
| $50,000 to $74,999 | 415 (14.7%) | 456 (26.7%) |
| $75,000 to $99,999 | 447 (15.8%) | 168 (9.9%) |
| $100,000 to $149,999 | 703 (24.9%) | 66 (3.9%) |
| $150,000 or more | 514 (18.2%) | 77 (4.5%) |
| Total | 2,823 (100.0%) | 1,706 (100.0%) |
Monthly Housing Cost Tiers in Placerville
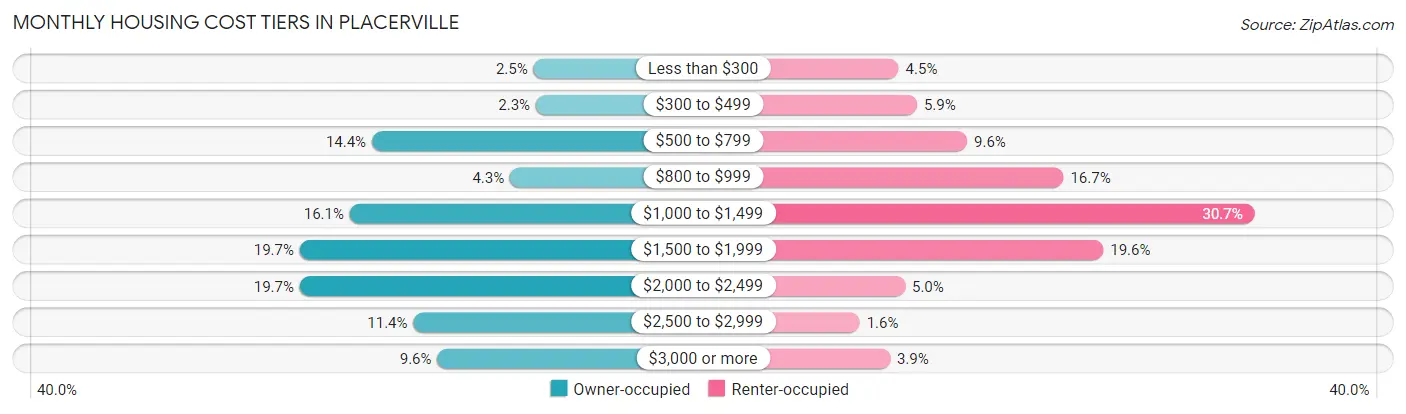
| Monthly Cost | Owner-occupied | Renter-occupied |
| Less than $300 | 71 (2.5%) | 77 (4.5%) |
| $300 to $499 | 66 (2.3%) | 100 (5.9%) |
| $500 to $799 | 407 (14.4%) | 163 (9.6%) |
| $800 to $999 | 120 (4.3%) | 284 (16.7%) |
| $1,000 to $1,499 | 453 (16.1%) | 524 (30.7%) |
| $1,500 to $1,999 | 557 (19.7%) | 334 (19.6%) |
| $2,000 to $2,499 | 557 (19.7%) | 85 (5.0%) |
| $2,500 to $2,999 | 321 (11.4%) | 28 (1.6%) |
| $3,000 or more | 271 (9.6%) | 66 (3.9%) |
| Total | 2,823 (100.0%) | 1,706 (100.0%) |
Physical Housing Characteristics in Placerville
Housing Structures in Placerville
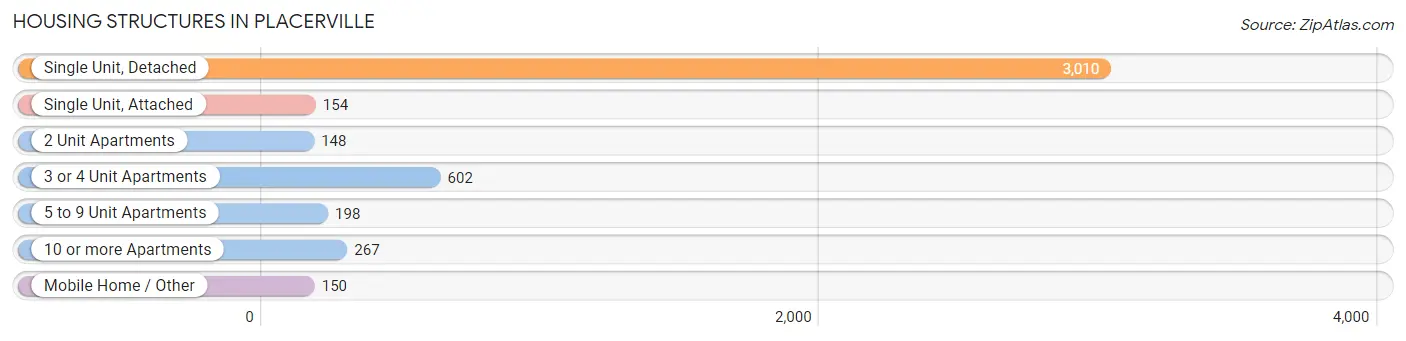
| Structure Type | # Housing Units | % Housing Units |
| Single Unit, Detached | 3,010 | 66.5% |
| Single Unit, Attached | 154 | 3.4% |
| 2 Unit Apartments | 148 | 3.3% |
| 3 or 4 Unit Apartments | 602 | 13.3% |
| 5 to 9 Unit Apartments | 198 | 4.4% |
| 10 or more Apartments | 267 | 5.9% |
| Mobile Home / Other | 150 | 3.3% |
| Total | 4,529 | 100.0% |
Housing Structures by Occupancy in Placerville
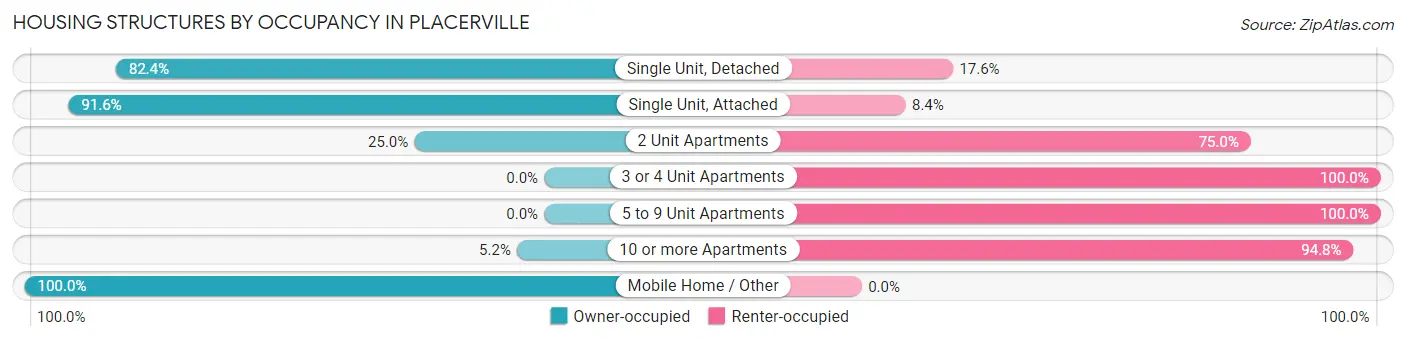
| Structure Type | Owner-occupied | Renter-occupied |
| Single Unit, Detached | 2,481 (82.4%) | 529 (17.6%) |
| Single Unit, Attached | 141 (91.6%) | 13 (8.4%) |
| 2 Unit Apartments | 37 (25.0%) | 111 (75.0%) |
| 3 or 4 Unit Apartments | 0 (0.0%) | 602 (100.0%) |
| 5 to 9 Unit Apartments | 0 (0.0%) | 198 (100.0%) |
| 10 or more Apartments | 14 (5.2%) | 253 (94.8%) |
| Mobile Home / Other | 150 (100.0%) | 0 (0.0%) |
| Total | 2,823 (62.3%) | 1,706 (37.7%) |
Housing Structures by Number of Rooms in Placerville
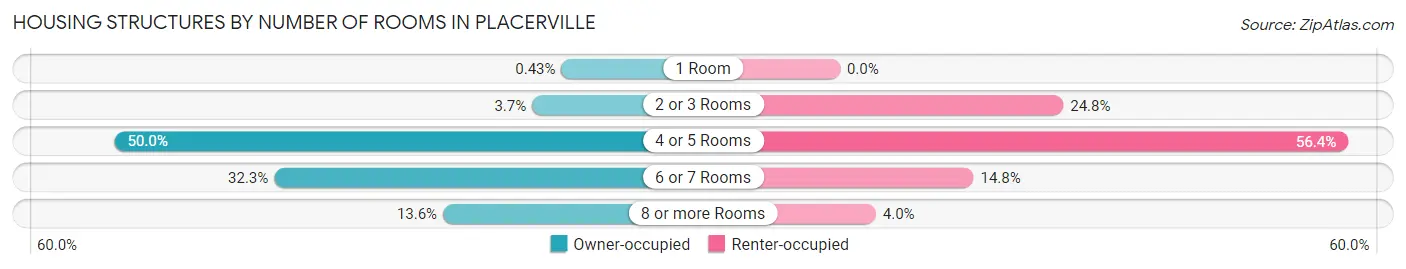
| Number of Rooms | Owner-occupied | Renter-occupied |
| 1 Room | 12 (0.4%) | 0 (0.0%) |
| 2 or 3 Rooms | 104 (3.7%) | 423 (24.8%) |
| 4 or 5 Rooms | 1,412 (50.0%) | 962 (56.4%) |
| 6 or 7 Rooms | 912 (32.3%) | 253 (14.8%) |
| 8 or more Rooms | 383 (13.6%) | 68 (4.0%) |
| Total | 2,823 (100.0%) | 1,706 (100.0%) |
Housing Structure by Heating Type in Placerville
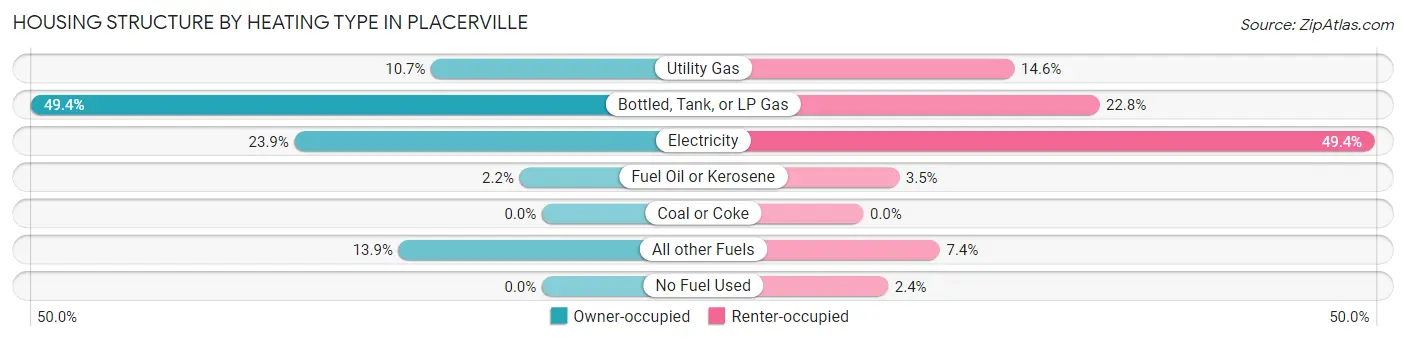
| Heating Type | Owner-occupied | Renter-occupied |
| Utility Gas | 302 (10.7%) | 249 (14.6%) |
| Bottled, Tank, or LP Gas | 1,394 (49.4%) | 389 (22.8%) |
| Electricity | 675 (23.9%) | 842 (49.4%) |
| Fuel Oil or Kerosene | 61 (2.2%) | 59 (3.5%) |
| Coal or Coke | 0 (0.0%) | 0 (0.0%) |
| All other Fuels | 391 (13.9%) | 126 (7.4%) |
| No Fuel Used | 0 (0.0%) | 41 (2.4%) |
| Total | 2,823 (100.0%) | 1,706 (100.0%) |
Household Vehicle Usage in Placerville
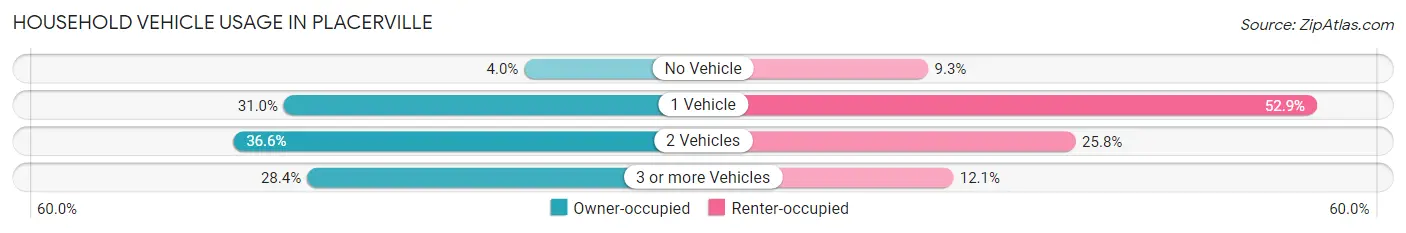
| Vehicles per Household | Owner-occupied | Renter-occupied |
| No Vehicle | 114 (4.0%) | 158 (9.3%) |
| 1 Vehicle | 874 (31.0%) | 902 (52.9%) |
| 2 Vehicles | 1,034 (36.6%) | 440 (25.8%) |
| 3 or more Vehicles | 801 (28.4%) | 206 (12.1%) |
| Total | 2,823 (100.0%) | 1,706 (100.0%) |
Real Estate & Mortgages in Placerville
Real Estate and Mortgage Overview in Placerville
| Characteristic | Without Mortgage | With Mortgage |
| Housing Units | 811 | 2,012 |
| Median Property Value | $419,800 | $429,600 |
| Median Household Income | $46,030 | $420 |
| Monthly Housing Costs | $675 | $271 |
| Real Estate Taxes | $2,756 | $22 |
Property Value by Mortgage Status in Placerville
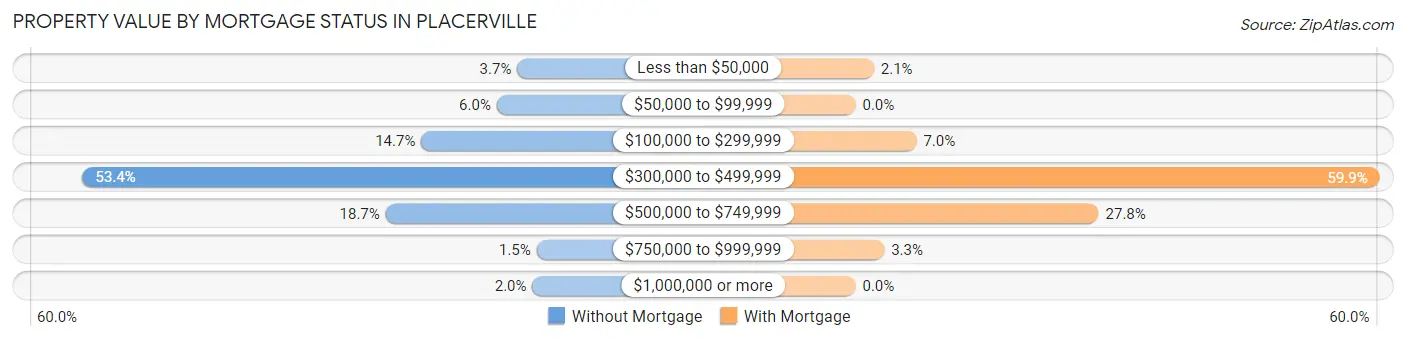
| Property Value | Without Mortgage | With Mortgage |
| Less than $50,000 | 30 (3.7%) | 42 (2.1%) |
| $50,000 to $99,999 | 49 (6.0%) | 0 (0.0%) |
| $100,000 to $299,999 | 119 (14.7%) | 140 (7.0%) |
| $300,000 to $499,999 | 433 (53.4%) | 1,205 (59.9%) |
| $500,000 to $749,999 | 152 (18.7%) | 559 (27.8%) |
| $750,000 to $999,999 | 12 (1.5%) | 66 (3.3%) |
| $1,000,000 or more | 16 (2.0%) | 0 (0.0%) |
| Total | 811 (100.0%) | 2,012 (100.0%) |
Household Income by Mortgage Status in Placerville
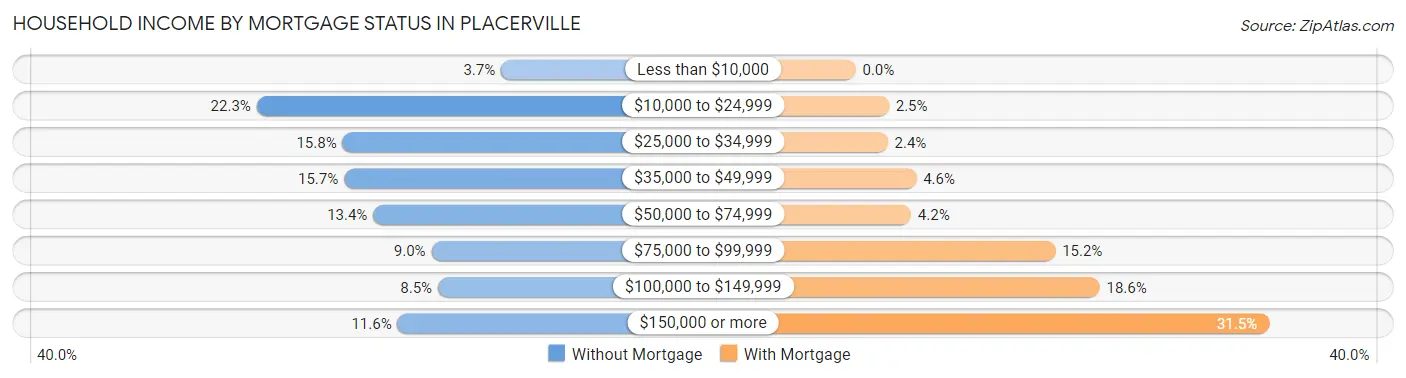
| Household Income | Without Mortgage | With Mortgage |
| Less than $10,000 | 30 (3.7%) | 0 (0.0%) |
| $10,000 to $24,999 | 181 (22.3%) | 51 (2.5%) |
| $25,000 to $34,999 | 128 (15.8%) | 49 (2.4%) |
| $35,000 to $49,999 | 127 (15.7%) | 93 (4.6%) |
| $50,000 to $74,999 | 109 (13.4%) | 85 (4.2%) |
| $75,000 to $99,999 | 73 (9.0%) | 306 (15.2%) |
| $100,000 to $149,999 | 69 (8.5%) | 374 (18.6%) |
| $150,000 or more | 94 (11.6%) | 634 (31.5%) |
| Total | 811 (100.0%) | 2,012 (100.0%) |
Property Value to Household Income Ratio in Placerville
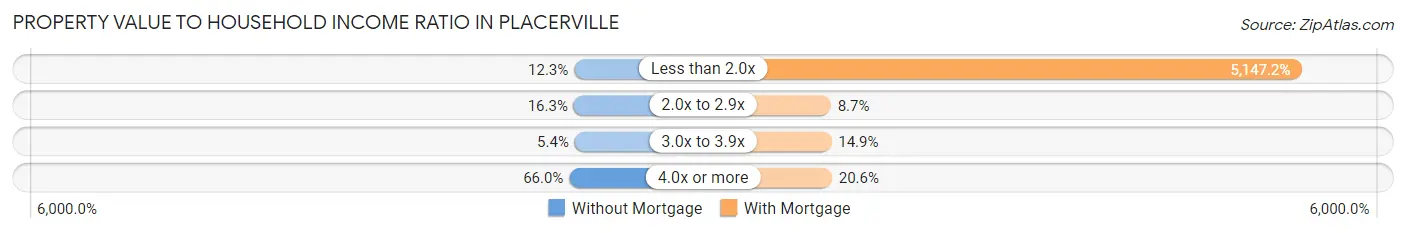
| Value-to-Income Ratio | Without Mortgage | With Mortgage |
| Less than 2.0x | 100 (12.3%) | 103,561 (5,147.2%) |
| 2.0x to 2.9x | 132 (16.3%) | 175 (8.7%) |
| 3.0x to 3.9x | 44 (5.4%) | 300 (14.9%) |
| 4.0x or more | 535 (66.0%) | 414 (20.6%) |
| Total | 811 (100.0%) | 2,012 (100.0%) |
Real Estate Taxes by Mortgage Status in Placerville
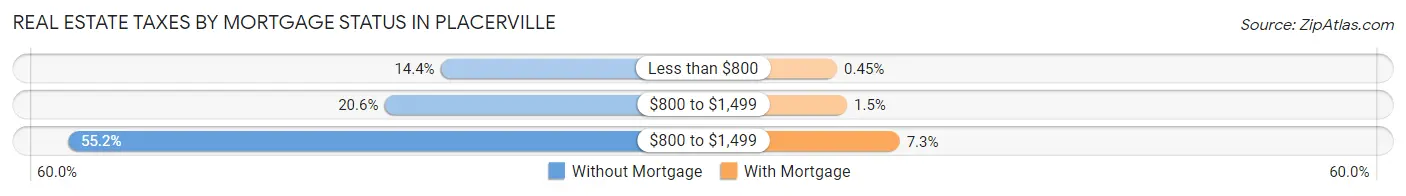
| Property Taxes | Without Mortgage | With Mortgage |
| Less than $800 | 117 (14.4%) | 9 (0.4%) |
| $800 to $1,499 | 167 (20.6%) | 31 (1.5%) |
| $800 to $1,499 | 448 (55.2%) | 147 (7.3%) |
| Total | 811 (100.0%) | 2,012 (100.0%) |
Health & Disability in Placerville
Health Insurance Coverage by Age in Placerville
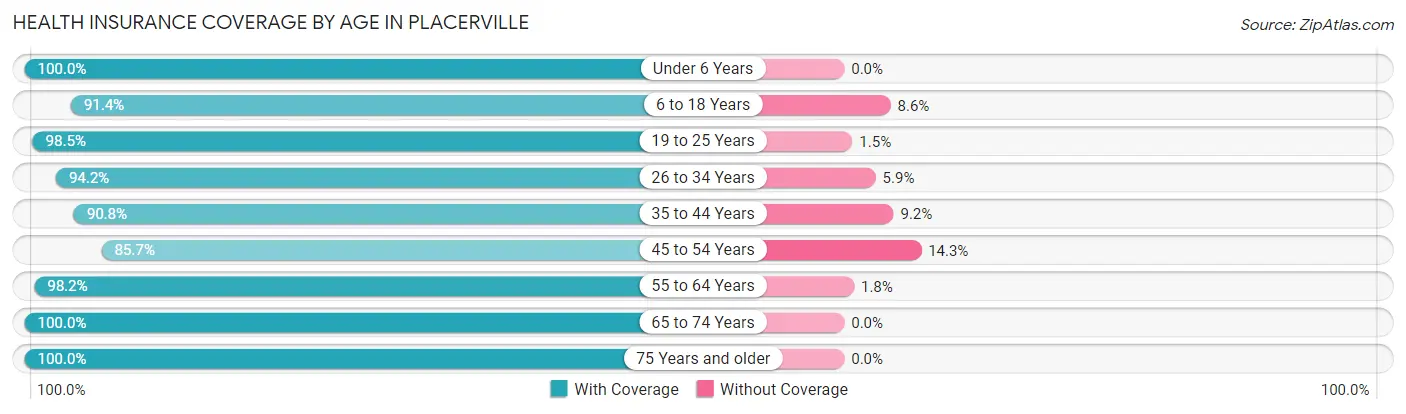
| Age Bracket | With Coverage | Without Coverage |
| Under 6 Years | 566 (100.0%) | 0 (0.0%) |
| 6 to 18 Years | 1,502 (91.4%) | 142 (8.6%) |
| 19 to 25 Years | 586 (98.5%) | 9 (1.5%) |
| 26 to 34 Years | 1,304 (94.2%) | 81 (5.9%) |
| 35 to 44 Years | 980 (90.8%) | 99 (9.2%) |
| 45 to 54 Years | 1,063 (85.7%) | 178 (14.3%) |
| 55 to 64 Years | 1,622 (98.2%) | 30 (1.8%) |
| 65 to 74 Years | 1,191 (100.0%) | 0 (0.0%) |
| 75 Years and older | 896 (100.0%) | 0 (0.0%) |
| Total | 9,710 (94.7%) | 539 (5.3%) |
Health Insurance Coverage by Citizenship Status in Placerville
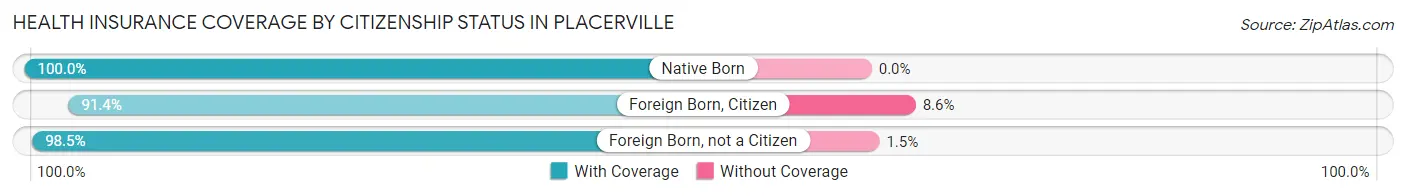
| Citizenship Status | With Coverage | Without Coverage |
| Native Born | 566 (100.0%) | 0 (0.0%) |
| Foreign Born, Citizen | 1,502 (91.4%) | 142 (8.6%) |
| Foreign Born, not a Citizen | 586 (98.5%) | 9 (1.5%) |
Health Insurance Coverage by Household Income in Placerville
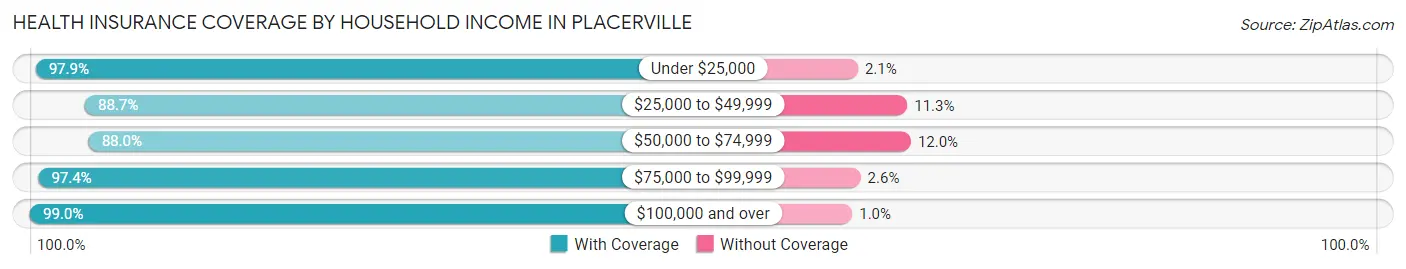
| Household Income | With Coverage | Without Coverage |
| Under $25,000 | 1,313 (97.9%) | 28 (2.1%) |
| $25,000 to $49,999 | 1,315 (88.7%) | 168 (11.3%) |
| $50,000 to $74,999 | 1,889 (88.0%) | 258 (12.0%) |
| $75,000 to $99,999 | 1,349 (97.4%) | 36 (2.6%) |
| $100,000 and over | 3,667 (99.0%) | 38 (1.0%) |
Public vs Private Health Insurance Coverage by Age in Placerville
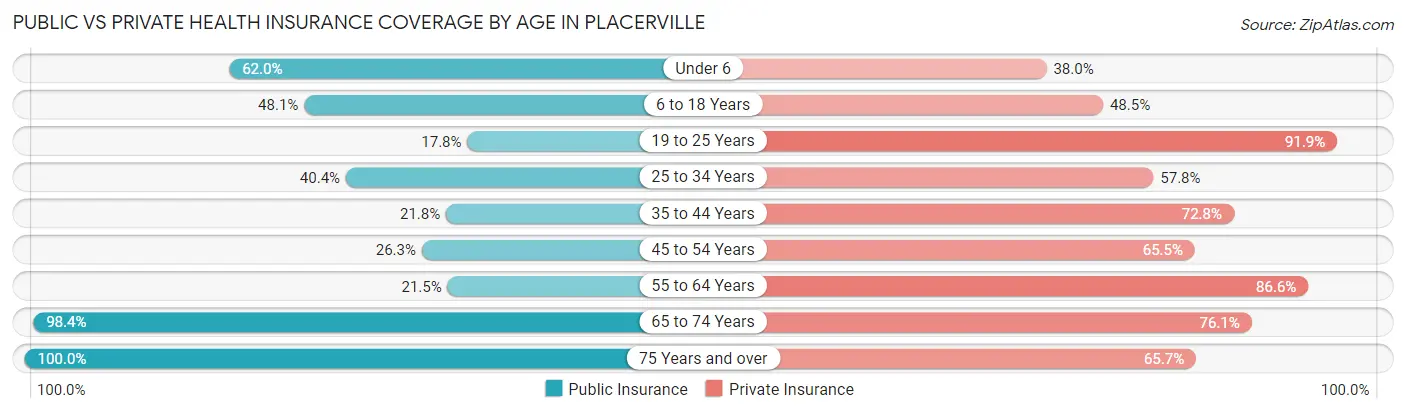
| Age Bracket | Public Insurance | Private Insurance |
| Under 6 | 351 (62.0%) | 215 (38.0%) |
| 6 to 18 Years | 791 (48.1%) | 797 (48.5%) |
| 19 to 25 Years | 106 (17.8%) | 547 (91.9%) |
| 25 to 34 Years | 559 (40.4%) | 801 (57.8%) |
| 35 to 44 Years | 235 (21.8%) | 785 (72.8%) |
| 45 to 54 Years | 326 (26.3%) | 813 (65.5%) |
| 55 to 64 Years | 355 (21.5%) | 1,430 (86.6%) |
| 65 to 74 Years | 1,172 (98.4%) | 906 (76.1%) |
| 75 Years and over | 896 (100.0%) | 589 (65.7%) |
| Total | 4,791 (46.8%) | 6,883 (67.2%) |
Disability Status by Sex by Age in Placerville
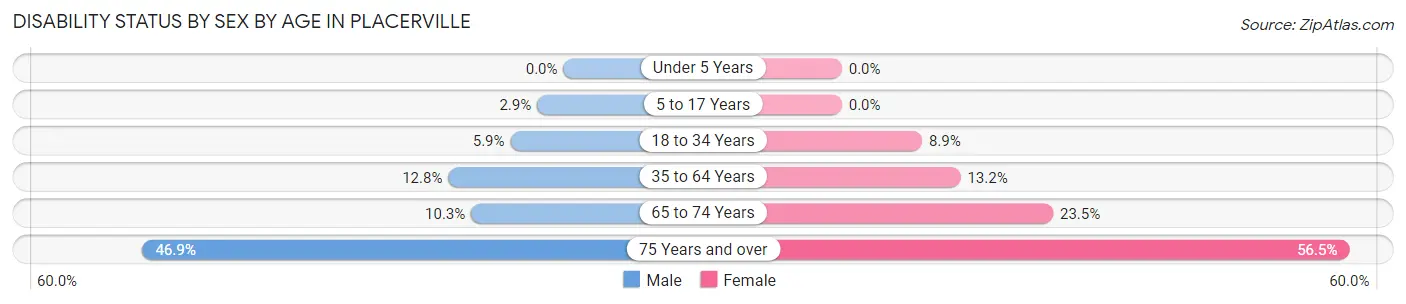
| Age Bracket | Male | Female |
| Under 5 Years | 0 (0.0%) | 0 (0.0%) |
| 5 to 17 Years | 26 (2.9%) | 0 (0.0%) |
| 18 to 34 Years | 51 (5.9%) | 101 (8.9%) |
| 35 to 64 Years | 228 (12.8%) | 290 (13.2%) |
| 65 to 74 Years | 49 (10.3%) | 168 (23.5%) |
| 75 Years and over | 157 (46.9%) | 317 (56.5%) |
Disability Class by Sex by Age in Placerville
Disability Class: Hearing Difficulty
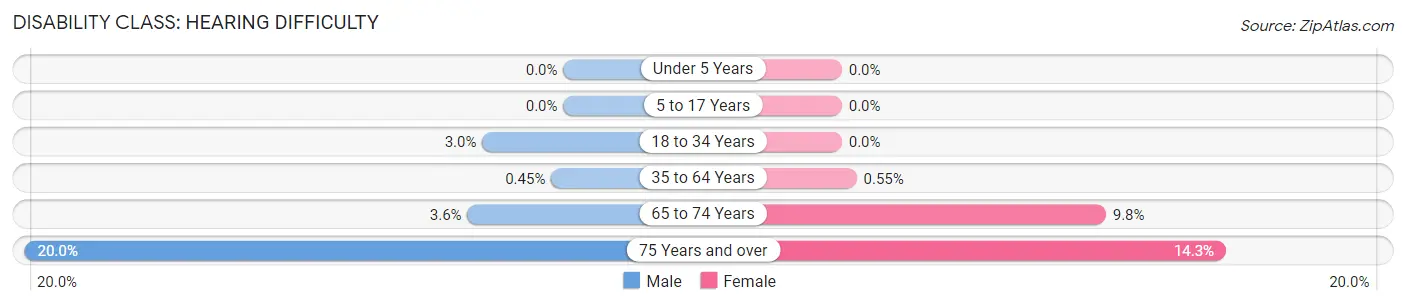
| Age Bracket | Male | Female |
| Under 5 Years | 0 (0.0%) | 0 (0.0%) |
| 5 to 17 Years | 0 (0.0%) | 0 (0.0%) |
| 18 to 34 Years | 26 (3.0%) | 0 (0.0%) |
| 35 to 64 Years | 8 (0.4%) | 12 (0.5%) |
| 65 to 74 Years | 17 (3.6%) | 70 (9.8%) |
| 75 Years and over | 67 (20.0%) | 80 (14.3%) |
Disability Class: Vision Difficulty
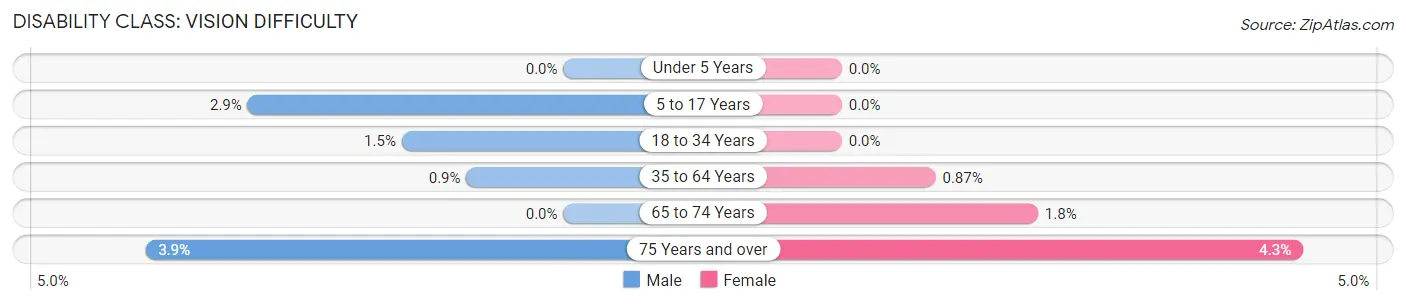
| Age Bracket | Male | Female |
| Under 5 Years | 0 (0.0%) | 0 (0.0%) |
| 5 to 17 Years | 26 (2.9%) | 0 (0.0%) |
| 18 to 34 Years | 13 (1.5%) | 0 (0.0%) |
| 35 to 64 Years | 16 (0.9%) | 19 (0.9%) |
| 65 to 74 Years | 0 (0.0%) | 13 (1.8%) |
| 75 Years and over | 13 (3.9%) | 24 (4.3%) |
Disability Class: Cognitive Difficulty
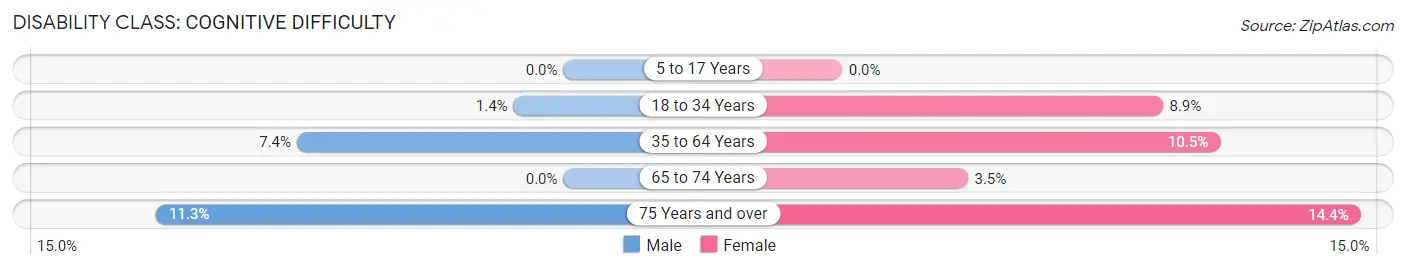
| Age Bracket | Male | Female |
| 5 to 17 Years | 0 (0.0%) | 0 (0.0%) |
| 18 to 34 Years | 12 (1.4%) | 101 (8.9%) |
| 35 to 64 Years | 132 (7.4%) | 231 (10.5%) |
| 65 to 74 Years | 0 (0.0%) | 25 (3.5%) |
| 75 Years and over | 38 (11.3%) | 81 (14.4%) |
Disability Class: Ambulatory Difficulty
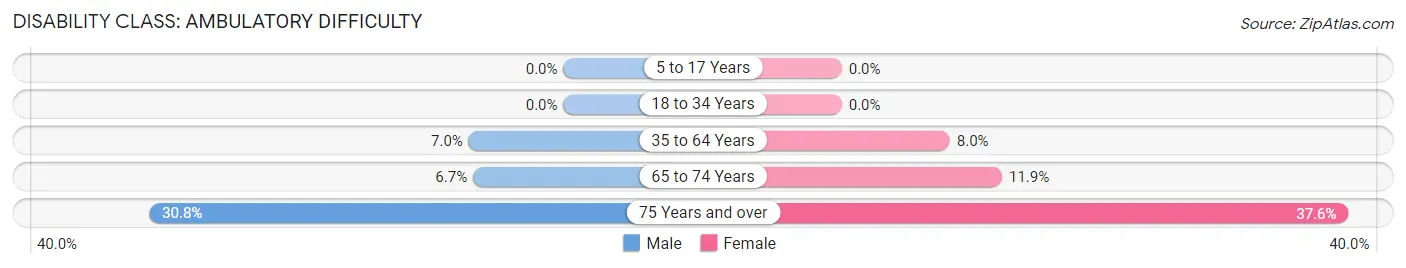
| Age Bracket | Male | Female |
| 5 to 17 Years | 0 (0.0%) | 0 (0.0%) |
| 18 to 34 Years | 0 (0.0%) | 0 (0.0%) |
| 35 to 64 Years | 125 (7.0%) | 176 (8.0%) |
| 65 to 74 Years | 32 (6.7%) | 85 (11.9%) |
| 75 Years and over | 103 (30.7%) | 211 (37.6%) |
Disability Class: Self-Care Difficulty
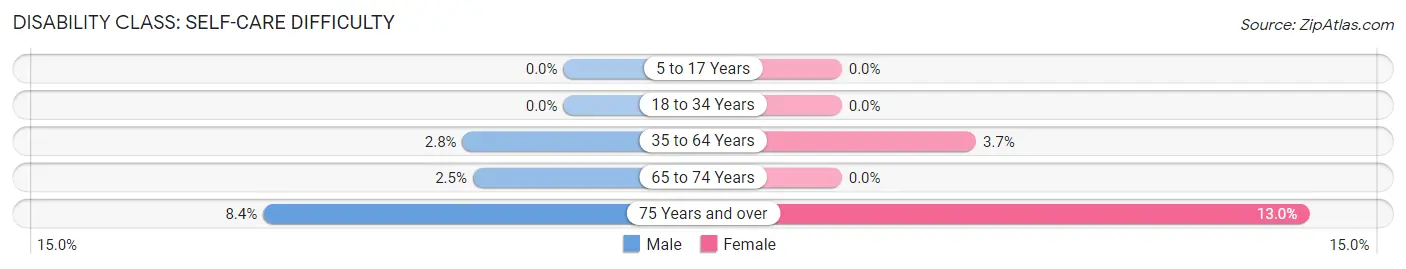
| Age Bracket | Male | Female |
| 5 to 17 Years | 0 (0.0%) | 0 (0.0%) |
| 18 to 34 Years | 0 (0.0%) | 0 (0.0%) |
| 35 to 64 Years | 50 (2.8%) | 82 (3.7%) |
| 65 to 74 Years | 12 (2.5%) | 0 (0.0%) |
| 75 Years and over | 28 (8.4%) | 73 (13.0%) |
Technology Access in Placerville
Computing Device Access in Placerville
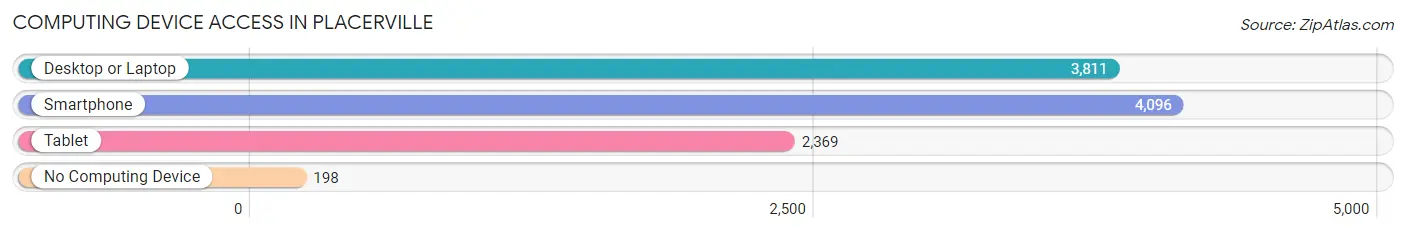
| Device Type | # Households | % Households |
| Desktop or Laptop | 3,811 | 84.2% |
| Smartphone | 4,096 | 90.4% |
| Tablet | 2,369 | 52.3% |
| No Computing Device | 198 | 4.4% |
| Total | 4,529 | 100.0% |
Internet Access in Placerville
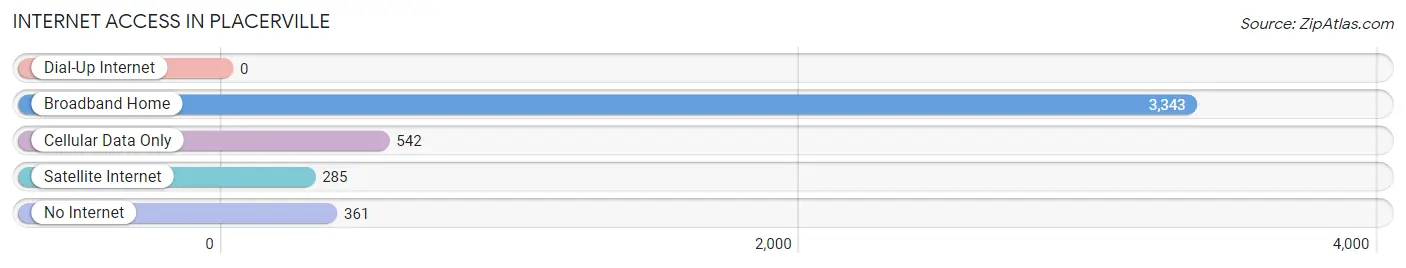
| Internet Type | # Households | % Households |
| Dial-Up Internet | 0 | 0.0% |
| Broadband Home | 3,343 | 73.8% |
| Cellular Data Only | 542 | 12.0% |
| Satellite Internet | 285 | 6.3% |
| No Internet | 361 | 8.0% |
| Total | 4,529 | 100.0% |
Placerville Summary
Placerville, California is a small city located in El Dorado County, California. It is situated in the Sierra Nevada foothills, about 40 miles east of Sacramento. The city is known for its rich history, beautiful geography, and vibrant economy.
History
Placerville was founded in 1848 by a group of miners who named the city after the placer gold deposits they found in the area. The city quickly grew to become a major hub for the gold rush, and it was the site of the first California State Fair in 1854. During the Civil War, Placerville was a major supply center for the Union Army. After the war, the city continued to grow and prosper, becoming a major agricultural center in the region.
In the late 19th century, Placerville was known as “Hangtown” due to its reputation as a lawless town. This reputation was due to the fact that the city was a major stop on the stagecoach route between Sacramento and Virginia City, Nevada. During this time, the city was home to many saloons, gambling halls, and brothels.
Geography
Placerville is located in the Sierra Nevada foothills, about 40 miles east of Sacramento. The city is situated at an elevation of 2,000 feet, and it is surrounded by rolling hills and lush forests. The city is located in the American River watershed, and it is home to several creeks and rivers, including the South Fork of the American River.
The climate in Placerville is mild and temperate, with hot summers and cool winters. The average annual temperature is around 60 degrees Fahrenheit, and the average annual precipitation is around 20 inches.
Economy
Placerville’s economy is largely based on tourism, agriculture, and retail. The city is home to several wineries, and it is a popular destination for wine tasting and other activities. The city is also home to several retail stores, restaurants, and other businesses.
The city is also home to several government offices, including the El Dorado County Courthouse and the El Dorado County Sheriff’s Office. The city is also home to several educational institutions, including the University of California, Davis, and Sierra College.
Demographics
As of the 2010 census, Placerville had a population of 10,389. The racial makeup of the city was 79.3% White, 0.7% African American, 1.2% Native American, 1.3% Asian, 0.2% Pacific Islander, 13.2% from other races, and 4.3% from two or more races. Hispanic or Latino of any race were 22.2% of the population.
The median income for a household in Placerville was $45,813, and the median income for a family was $51,919. The per capita income for the city was $22,945. About 11.2% of families and 14.3% of the population were below the poverty line, including 19.2% of those under age 18 and 6.2% of those age 65 or over.
Placerville is a small city with a rich history, beautiful geography, and vibrant economy. The city is home to a diverse population, and it is a popular destination for tourists and locals alike. With its unique culture and history, Placerville is a great place to live and visit.
Common Questions
What is Per Capita Income in Placerville?
Per Capita income in Placerville is $36,024.
What is the Median Family Income in Placerville?
Median Family Income in Placerville is $74,179.
What is the Median Household income in Placerville?
Median Household Income in Placerville is $68,640.
What is Income or Wage Gap in Placerville?
Income or Wage Gap in Placerville is 29.2%.
Women in Placerville earn 70.8 cents for every dollar earned by a man.
What is Inequality or Gini Index in Placerville?
Inequality or Gini Index in Placerville is 0.42.
What is the Total Population of Placerville?
Total Population of Placerville is 10,744.
What is the Total Male Population of Placerville?
Total Male Population of Placerville is 4,884.
What is the Total Female Population of Placerville?
Total Female Population of Placerville is 5,860.
What is the Ratio of Males per 100 Females in Placerville?
There are 83.34 Males per 100 Females in Placerville.
What is the Ratio of Females per 100 Males in Placerville?
There are 119.98 Females per 100 Males in Placerville.
What is the Median Population Age in Placerville?
Median Population Age in Placerville is 43.4 Years.
What is the Average Family Size in Placerville
Average Family Size in Placerville is 2.8 People.
What is the Average Household Size in Placerville
Average Household Size in Placerville is 2.2 People.
How Large is the Labor Force in Placerville?
There are 5,181 People in the Labor Forcein in Placerville.
What is the Percentage of People in the Labor Force in Placerville?
59.0% of People are in the Labor Force in Placerville.
What is the Unemployment Rate in Placerville?
Unemployment Rate in Placerville is 5.1%.