Pixley, CA Map & Demographics
Pixley Map
Pixley Overview
$16,291
PER CAPITA INCOME
$49,271
AVG FAMILY INCOME
$48,975
AVG HOUSEHOLD INCOME
46.9%
WAGE / INCOME GAP [ % ]
53.1¢/ $1
WAGE / INCOME GAP [ $ ]
0.38
INEQUALITY / GINI INDEX
3,811
TOTAL POPULATION
1,973
MALE POPULATION
1,838
FEMALE POPULATION
107.34
MALES / 100 FEMALES
93.16
FEMALES / 100 MALES
26.9
MEDIAN AGE
4.0
AVG FAMILY SIZE
3.8
AVG HOUSEHOLD SIZE
1,524
LABOR FORCE [ PEOPLE ]
55.2%
PERCENT IN LABOR FORCE
13.8%
UNEMPLOYMENT RATE
Pixley Zip Codes
Pixley Area Codes
Income in Pixley
Income Overview in Pixley
Per Capita Income in Pixley is $16,291, while median incomes of families and households are $49,271 and $48,975 respectively.
| Characteristic | Number | Measure |
| Per Capita Income | 3,811 | $16,291 |
| Median Family Income | 783 | $49,271 |
| Mean Family Income | 783 | $57,979 |
| Median Household Income | 1,013 | $48,975 |
| Mean Household Income | 1,013 | $58,615 |
| Income Deficit | 783 | $0 |
| Wage / Income Gap (%) | 3,811 | 46.89% |
| Wage / Income Gap ($) | 3,811 | 53.11¢ per $1 |
| Gini / Inequality Index | 3,811 | 0.38 |
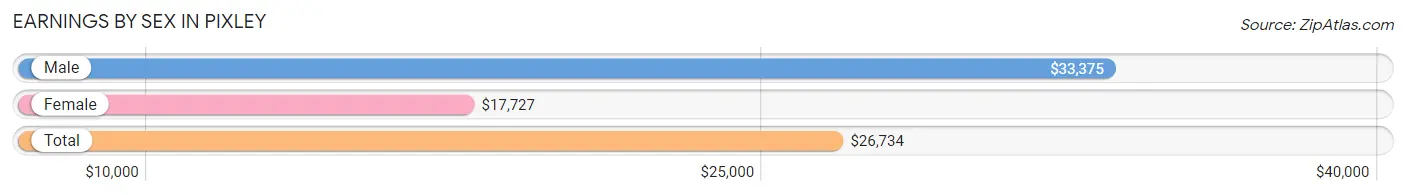
Earnings by Sex in Pixley
Average Earnings in Pixley are $26,734, $33,375 for men and $17,727 for women, a difference of 46.9%.
| Sex | Number | Average Earnings |
| Male | 840 (53.3%) | $33,375 |
| Female | 736 (46.7%) | $17,727 |
| Total | 1,576 (100.0%) | $26,734 |
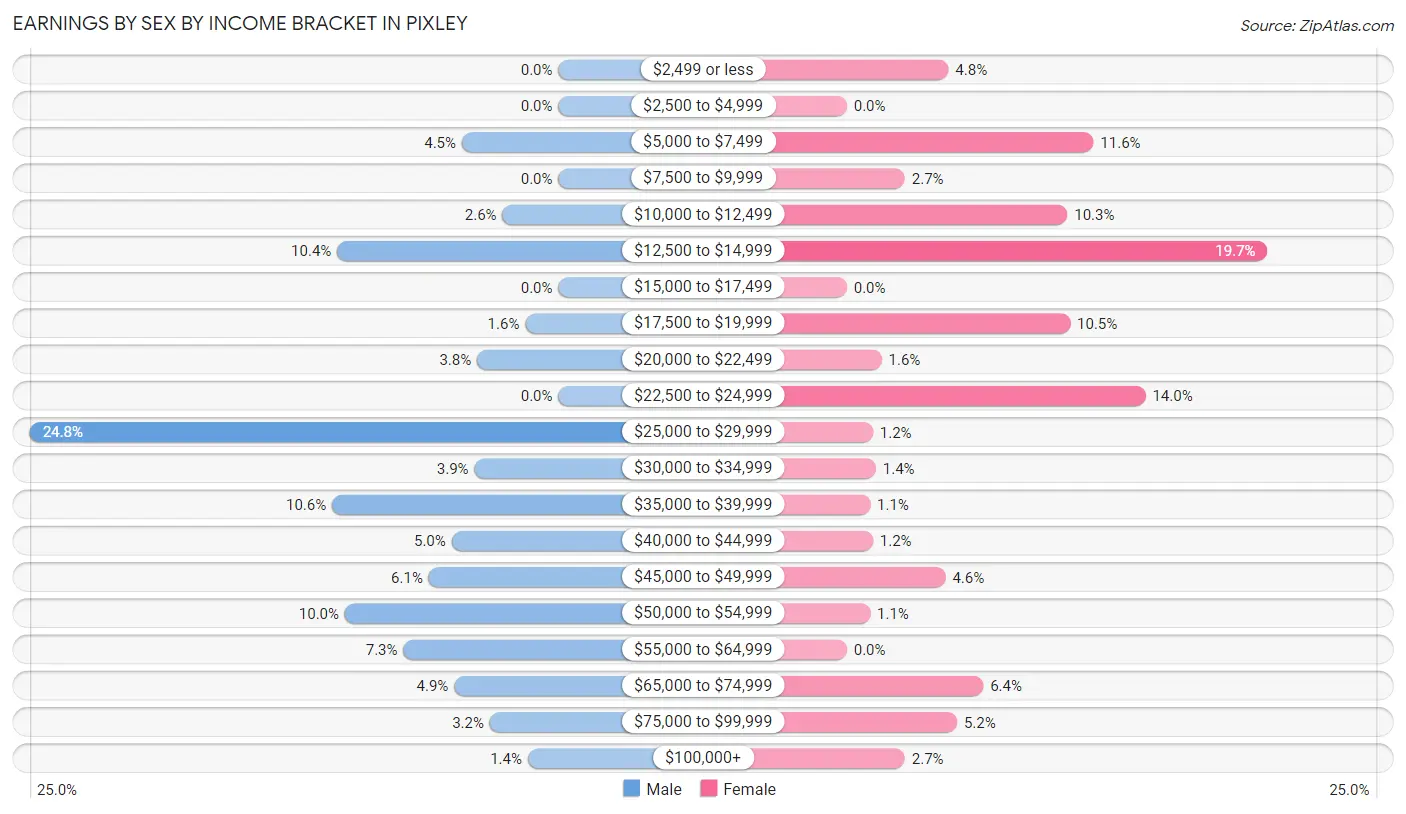
Earnings by Sex by Income Bracket in Pixley
The most common earnings brackets in Pixley are $25,000 to $29,999 for men (208 | 24.8%) and $12,500 to $14,999 for women (145 | 19.7%).
| Income | Male | Female |
| $2,499 or less | 0 (0.0%) | 35 (4.8%) |
| $2,500 to $4,999 | 0 (0.0%) | 0 (0.0%) |
| $5,000 to $7,499 | 38 (4.5%) | 85 (11.6%) |
| $7,500 to $9,999 | 0 (0.0%) | 20 (2.7%) |
| $10,000 to $12,499 | 22 (2.6%) | 76 (10.3%) |
| $12,500 to $14,999 | 87 (10.4%) | 145 (19.7%) |
| $15,000 to $17,499 | 0 (0.0%) | 0 (0.0%) |
| $17,500 to $19,999 | 13 (1.5%) | 77 (10.5%) |
| $20,000 to $22,499 | 32 (3.8%) | 12 (1.6%) |
| $22,500 to $24,999 | 0 (0.0%) | 103 (14.0%) |
| $25,000 to $29,999 | 208 (24.8%) | 9 (1.2%) |
| $30,000 to $34,999 | 33 (3.9%) | 10 (1.4%) |
| $35,000 to $39,999 | 89 (10.6%) | 8 (1.1%) |
| $40,000 to $44,999 | 42 (5.0%) | 9 (1.2%) |
| $45,000 to $49,999 | 51 (6.1%) | 34 (4.6%) |
| $50,000 to $54,999 | 84 (10.0%) | 8 (1.1%) |
| $55,000 to $64,999 | 61 (7.3%) | 0 (0.0%) |
| $65,000 to $74,999 | 41 (4.9%) | 47 (6.4%) |
| $75,000 to $99,999 | 27 (3.2%) | 38 (5.2%) |
| $100,000+ | 12 (1.4%) | 20 (2.7%) |
| Total | 840 (100.0%) | 736 (100.0%) |
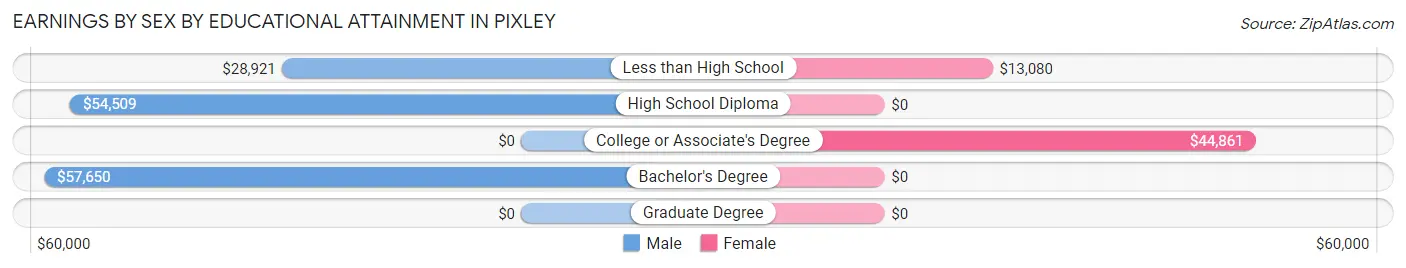
Earnings by Sex by Educational Attainment in Pixley
Average earnings in Pixley are $35,211 for men and $21,146 for women, a difference of 39.9%. Men with an educational attainment of bachelor's degree enjoy the highest average annual earnings of $57,650, while those with less than high school education earn the least with $28,921. Women with an educational attainment of college or associate's degree earn the most with the average annual earnings of $44,861, while those with less than high school education have the smallest earnings of $13,080.
| Educational Attainment | Male Income | Female Income |
| Less than High School | $28,921 | $13,080 |
| High School Diploma | $54,509 | $0 |
| College or Associate's Degree | - | - |
| Bachelor's Degree | $57,650 | $0 |
| Graduate Degree | - | - |
| Total | $35,211 | $21,146 |
Family Income in Pixley
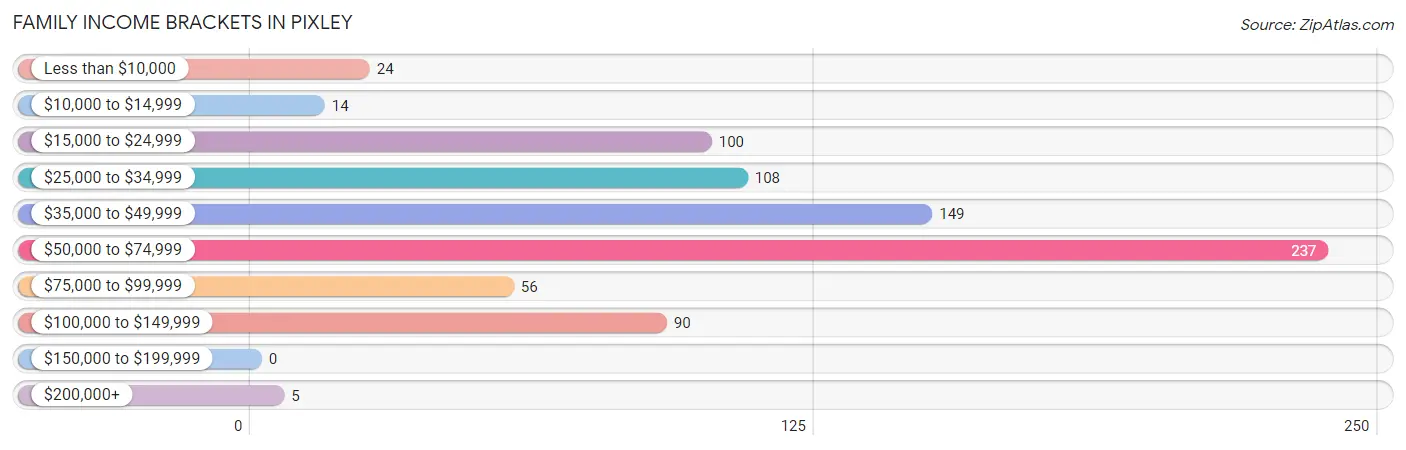
Family Income Brackets in Pixley
According to the Pixley family income data, there are 237 families falling into the $50,000 to $74,999 income range, which is the most common income bracket and makes up 30.3% of all families.
| Income Bracket | # Families | % Families |
| Less than $10,000 | 24 | 3.1% |
| $10,000 to $14,999 | 14 | 1.8% |
| $15,000 to $24,999 | 100 | 12.8% |
| $25,000 to $34,999 | 108 | 13.8% |
| $35,000 to $49,999 | 149 | 19.0% |
| $50,000 to $74,999 | 237 | 30.3% |
| $75,000 to $99,999 | 56 | 7.2% |
| $100,000 to $149,999 | 90 | 11.5% |
| $150,000 to $199,999 | 0 | 0.0% |
| $200,000+ | 5 | 0.6% |
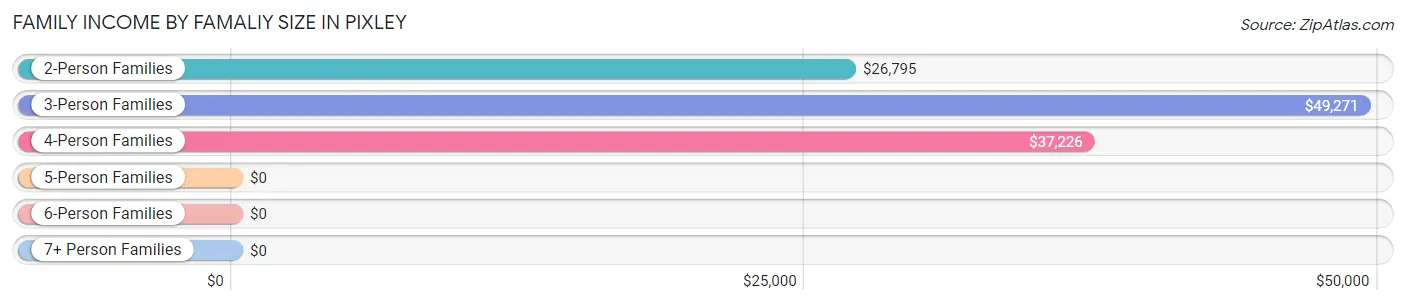
Family Income by Famaliy Size in Pixley
3-person families (165 | 21.1%) account for the highest median family income in Pixley with $49,271 per family, while 3-person families (165 | 21.1%) have the highest median income of $16,424 per family member.
| Income Bracket | # Families | Median Income |
| 2-Person Families | 146 (18.6%) | $26,795 |
| 3-Person Families | 165 (21.1%) | $49,271 |
| 4-Person Families | 227 (29.0%) | $37,226 |
| 5-Person Families | 141 (18.0%) | $0 |
| 6-Person Families | 90 (11.5%) | $0 |
| 7+ Person Families | 14 (1.8%) | $0 |
| Total | 783 (100.0%) | $49,271 |
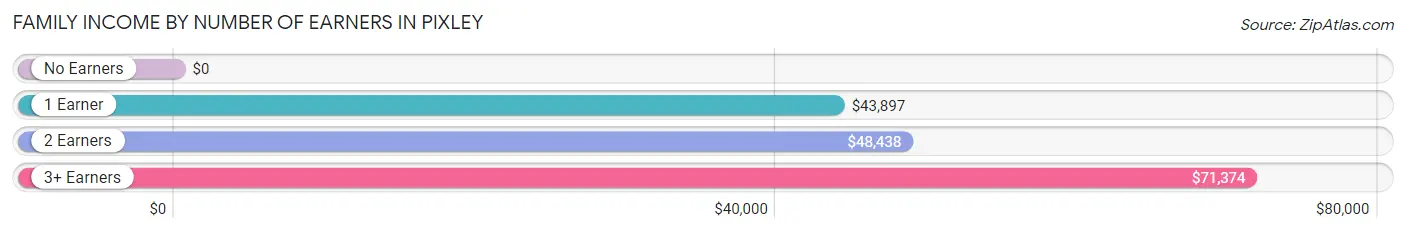
Family Income by Number of Earners in Pixley
| Number of Earners | # Families | Median Income |
| No Earners | 96 (12.3%) | $0 |
| 1 Earner | 292 (37.3%) | $43,897 |
| 2 Earners | 295 (37.7%) | $48,438 |
| 3+ Earners | 100 (12.8%) | $71,374 |
| Total | 783 (100.0%) | $49,271 |
Household Income in Pixley
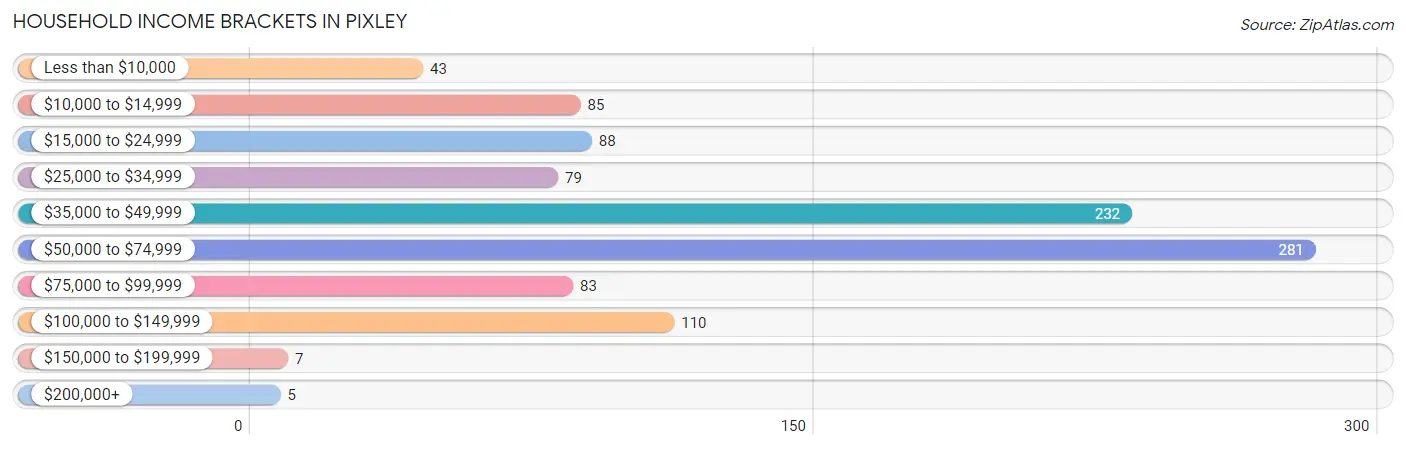
Household Income Brackets in Pixley
With 281 households falling in the category, the $50,000 to $74,999 income range is the most frequent in Pixley, accounting for 27.7% of all households. In contrast, only 5 households (0.5%) fall into the $200,000+ income bracket, making it the least populous group.
| Income Bracket | # Households | % Households |
| Less than $10,000 | 43 | 4.2% |
| $10,000 to $14,999 | 85 | 8.4% |
| $15,000 to $24,999 | 88 | 8.7% |
| $25,000 to $34,999 | 79 | 7.8% |
| $35,000 to $49,999 | 232 | 22.9% |
| $50,000 to $74,999 | 281 | 27.7% |
| $75,000 to $99,999 | 83 | 8.2% |
| $100,000 to $149,999 | 110 | 10.9% |
| $150,000 to $199,999 | 7 | 0.7% |
| $200,000+ | 5 | 0.5% |
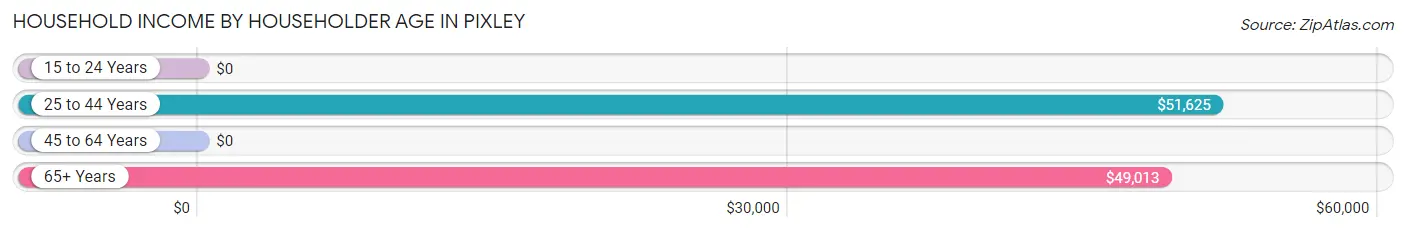
Household Income by Householder Age in Pixley
The median household income in Pixley is $48,975, with the highest median household income of $51,625 found in the 25 to 44 years age bracket for the primary householder. A total of 662 households (65.3%) fall into this category.
| Income Bracket | # Households | Median Income |
| 15 to 24 Years | 0 (0.0%) | $0 |
| 25 to 44 Years | 662 (65.3%) | $51,625 |
| 45 to 64 Years | 163 (16.1%) | $0 |
| 65+ Years | 188 (18.6%) | $49,013 |
| Total | 1,013 (100.0%) | $48,975 |
Poverty in Pixley
Income Below Poverty by Sex and Age in Pixley
With 18.2% poverty level for males and 34.4% for females among the residents of Pixley, 15 year old males and 16 and 17 year old females are the most vulnerable to poverty, with 55 males (100.0%) and 120 females (96.8%) in their respective age groups living below the poverty level.
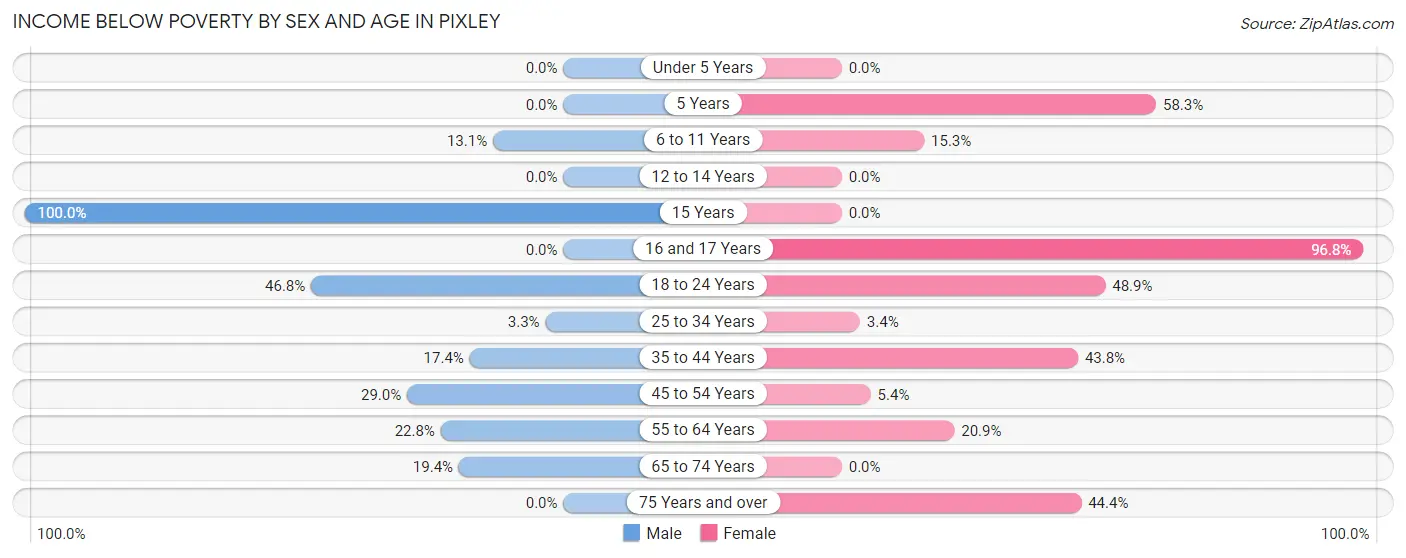
| Age Bracket | Male | Female |
| Under 5 Years | 0 (0.0%) | 0 (0.0%) |
| 5 Years | 0 (0.0%) | 21 (58.3%) |
| 6 to 11 Years | 38 (13.1%) | 33 (15.3%) |
| 12 to 14 Years | 0 (0.0%) | 0 (0.0%) |
| 15 Years | 55 (100.0%) | 0 (0.0%) |
| 16 and 17 Years | 0 (0.0%) | 120 (96.8%) |
| 18 to 24 Years | 81 (46.8%) | 180 (48.9%) |
| 25 to 34 Years | 5 (3.3%) | 5 (3.4%) |
| 35 to 44 Years | 80 (17.4%) | 181 (43.8%) |
| 45 to 54 Years | 38 (29.0%) | 6 (5.4%) |
| 55 to 64 Years | 23 (22.8%) | 19 (20.9%) |
| 65 to 74 Years | 19 (19.4%) | 0 (0.0%) |
| 75 Years and over | 0 (0.0%) | 48 (44.4%) |
| Total | 339 (18.2%) | 613 (34.4%) |
Income Above Poverty by Sex and Age in Pixley
According to the poverty statistics in Pixley, males aged under 5 years and females aged under 5 years are the age groups that are most secure financially, with 100.0% of males and 100.0% of females in these age groups living above the poverty line.
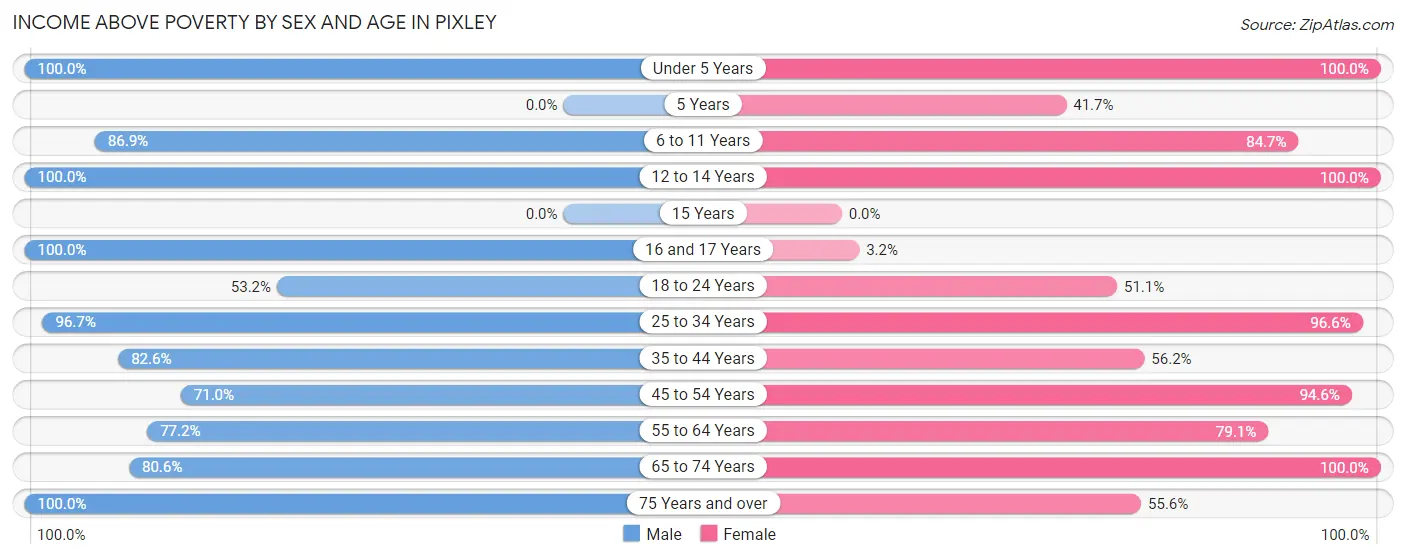
| Age Bracket | Male | Female |
| Under 5 Years | 115 (100.0%) | 48 (100.0%) |
| 5 Years | 0 (0.0%) | 15 (41.7%) |
| 6 to 11 Years | 253 (86.9%) | 183 (84.7%) |
| 12 to 14 Years | 85 (100.0%) | 41 (100.0%) |
| 15 Years | 0 (0.0%) | 0 (0.0%) |
| 16 and 17 Years | 144 (100.0%) | 4 (3.2%) |
| 18 to 24 Years | 92 (53.2%) | 188 (51.1%) |
| 25 to 34 Years | 145 (96.7%) | 144 (96.6%) |
| 35 to 44 Years | 380 (82.6%) | 232 (56.2%) |
| 45 to 54 Years | 93 (71.0%) | 106 (94.6%) |
| 55 to 64 Years | 78 (77.2%) | 72 (79.1%) |
| 65 to 74 Years | 79 (80.6%) | 78 (100.0%) |
| 75 Years and over | 60 (100.0%) | 60 (55.6%) |
| Total | 1,524 (81.8%) | 1,171 (65.6%) |
Income Below Poverty Among Married-Couple Families in Pixley
The poverty statistics for married-couple families in Pixley show that 11.0% or 55 of the total 501 families live below the poverty line. Families with 3 or 4 children have the highest poverty rate of 18.9%, comprising of 31 families. On the other hand, families with 1 or 2 children have the lowest poverty rate of 2.4%, which includes 5 families.
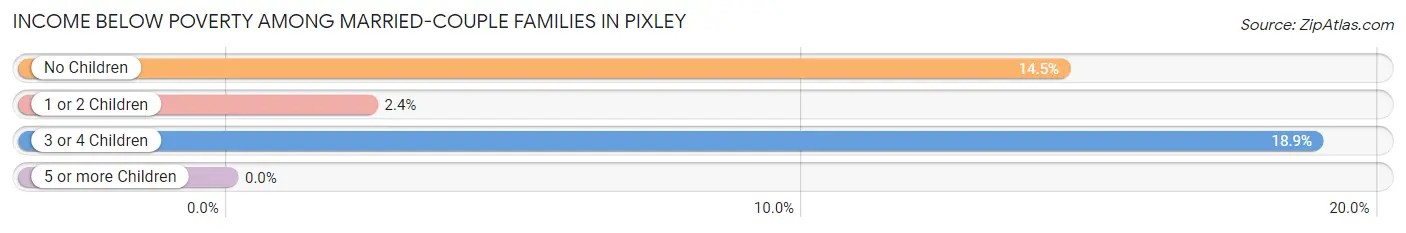
| Children | Above Poverty | Below Poverty |
| No Children | 112 (85.5%) | 19 (14.5%) |
| 1 or 2 Children | 201 (97.6%) | 5 (2.4%) |
| 3 or 4 Children | 133 (81.1%) | 31 (18.9%) |
| 5 or more Children | 0 (0.0%) | 0 (0.0%) |
| Total | 446 (89.0%) | 55 (11.0%) |
Income Below Poverty Among Single-Parent Households in Pixley
According to the poverty data in Pixley, 21.2% or 14 single-father households and 41.7% or 90 single-mother households are living below the poverty line. Among single-father households, those with no children have the highest poverty rate, with 14 households (53.8%) experiencing poverty. Likewise, among single-mother households, those with 1 or 2 children have the highest poverty rate, with 52 households (100.0%) falling below the poverty line.
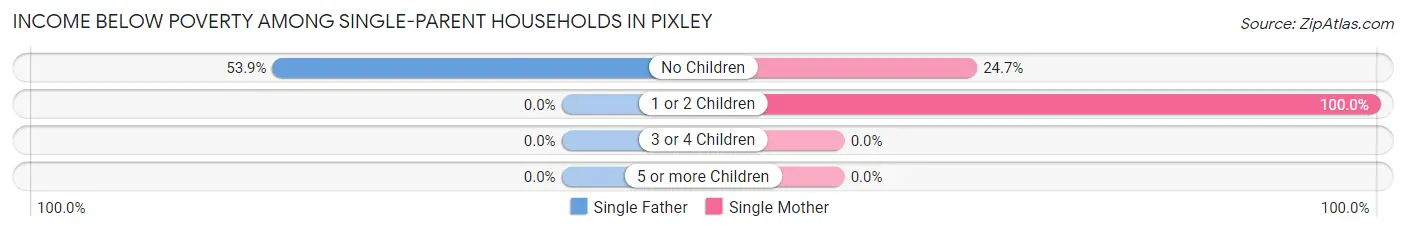
| Children | Single Father | Single Mother |
| No Children | 14 (53.8%) | 38 (24.7%) |
| 1 or 2 Children | 0 (0.0%) | 52 (100.0%) |
| 3 or 4 Children | 0 (0.0%) | 0 (0.0%) |
| 5 or more Children | 0 (0.0%) | 0 (0.0%) |
| Total | 14 (21.2%) | 90 (41.7%) |
Income Below Poverty Among Married-Couple vs Single-Parent Households in Pixley
The poverty data for Pixley shows that 55 of the married-couple family households (11.0%) and 104 of the single-parent households (36.9%) are living below the poverty level. Within the married-couple family households, those with 3 or 4 children have the highest poverty rate, with 31 households (18.9%) falling below the poverty line. Among the single-parent households, those with 1 or 2 children have the highest poverty rate, with 52 household (72.2%) living below poverty.
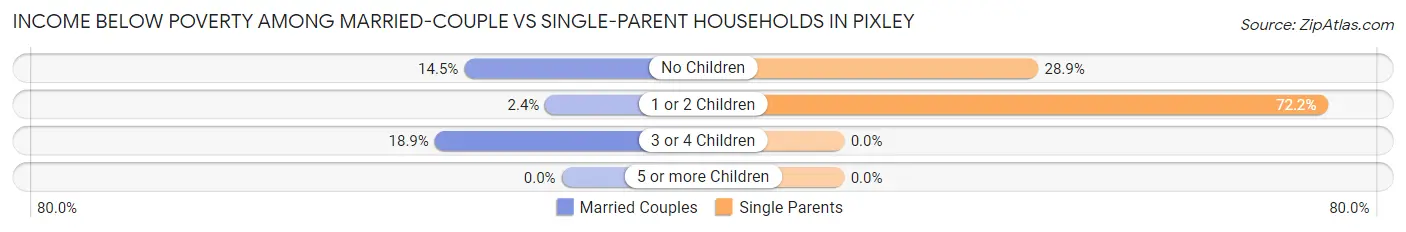
| Children | Married-Couple Families | Single-Parent Households |
| No Children | 19 (14.5%) | 52 (28.9%) |
| 1 or 2 Children | 5 (2.4%) | 52 (72.2%) |
| 3 or 4 Children | 31 (18.9%) | 0 (0.0%) |
| 5 or more Children | 0 (0.0%) | 0 (0.0%) |
| Total | 55 (11.0%) | 104 (36.9%) |
Race in Pixley
The most populous races in Pixley are Hispanic or Latino (3,282 | 86.1%), Two or more Races (1,453 | 38.1%), and White / Caucasian (1,445 | 37.9%).
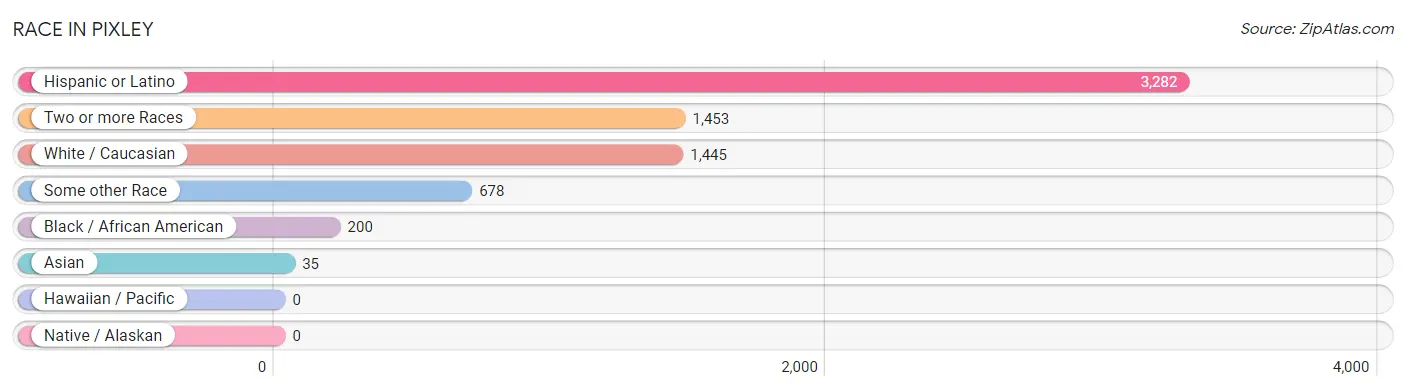
| Race | # Population | % Population |
| Asian | 35 | 0.9% |
| Black / African American | 200 | 5.2% |
| Hawaiian / Pacific | 0 | 0.0% |
| Hispanic or Latino | 3,282 | 86.1% |
| Native / Alaskan | 0 | 0.0% |
| White / Caucasian | 1,445 | 37.9% |
| Two or more Races | 1,453 | 38.1% |
| Some other Race | 678 | 17.8% |
| Total | 3,811 | 100.0% |
Ancestry in Pixley
The most populous ancestries reported in Pixley are Mexican (3,093 | 81.2%), Central American (175 | 4.6%), Salvadoran (175 | 4.6%), Korean (85 | 2.2%), and American (24 | 0.6%), together accounting for 93.2% of all Pixley residents.
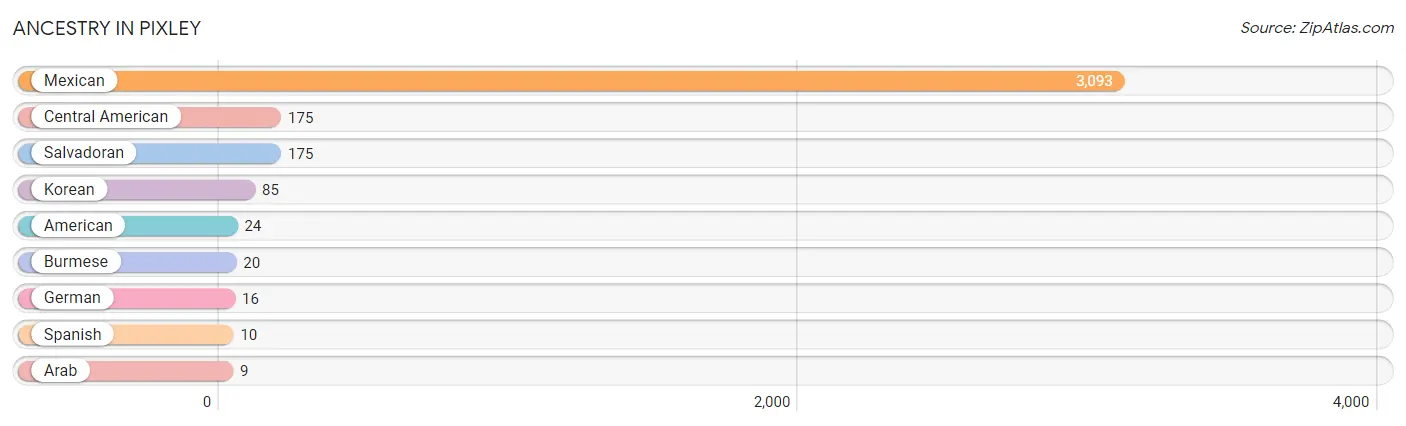
| Ancestry | # Population | % Population |
| American | 24 | 0.6% |
| Arab | 9 | 0.2% |
| Burmese | 20 | 0.5% |
| Central American | 175 | 4.6% |
| German | 16 | 0.4% |
| Korean | 85 | 2.2% |
| Mexican | 3,093 | 81.2% |
| Salvadoran | 175 | 4.6% |
| Spanish | 10 | 0.3% | View All 9 Rows |
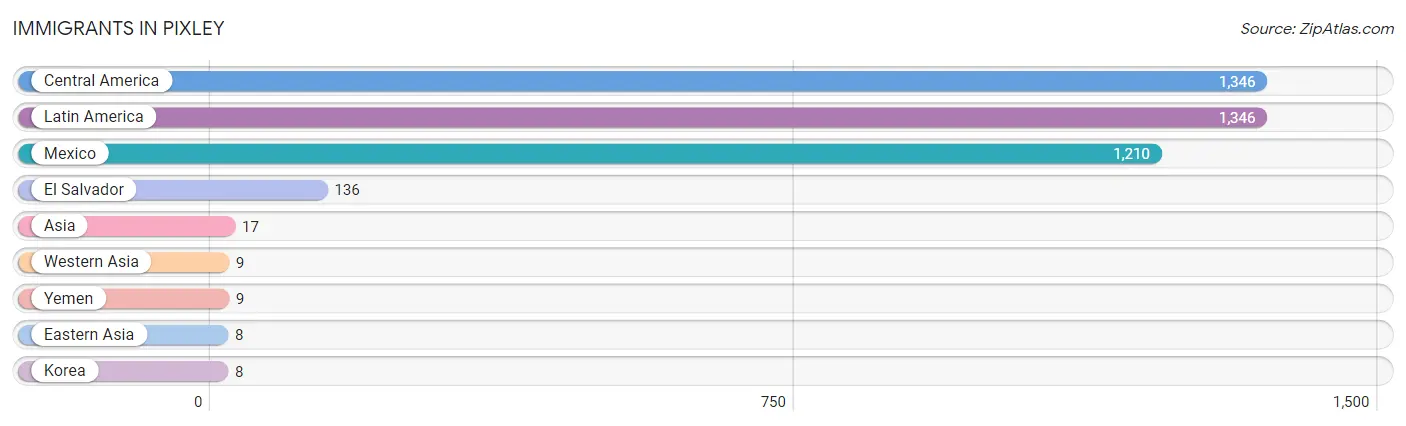
Immigrants in Pixley
The most numerous immigrant groups reported in Pixley came from Central America (1,346 | 35.3%), Latin America (1,346 | 35.3%), Mexico (1,210 | 31.8%), El Salvador (136 | 3.6%), and Asia (17 | 0.4%), together accounting for 106.4% of all Pixley residents.
| Immigration Origin | # Population | % Population |
| Asia | 17 | 0.4% |
| Central America | 1,346 | 35.3% |
| Eastern Asia | 8 | 0.2% |
| El Salvador | 136 | 3.6% |
| Korea | 8 | 0.2% |
| Latin America | 1,346 | 35.3% |
| Mexico | 1,210 | 31.8% |
| Western Asia | 9 | 0.2% |
| Yemen | 9 | 0.2% | View All 9 Rows |
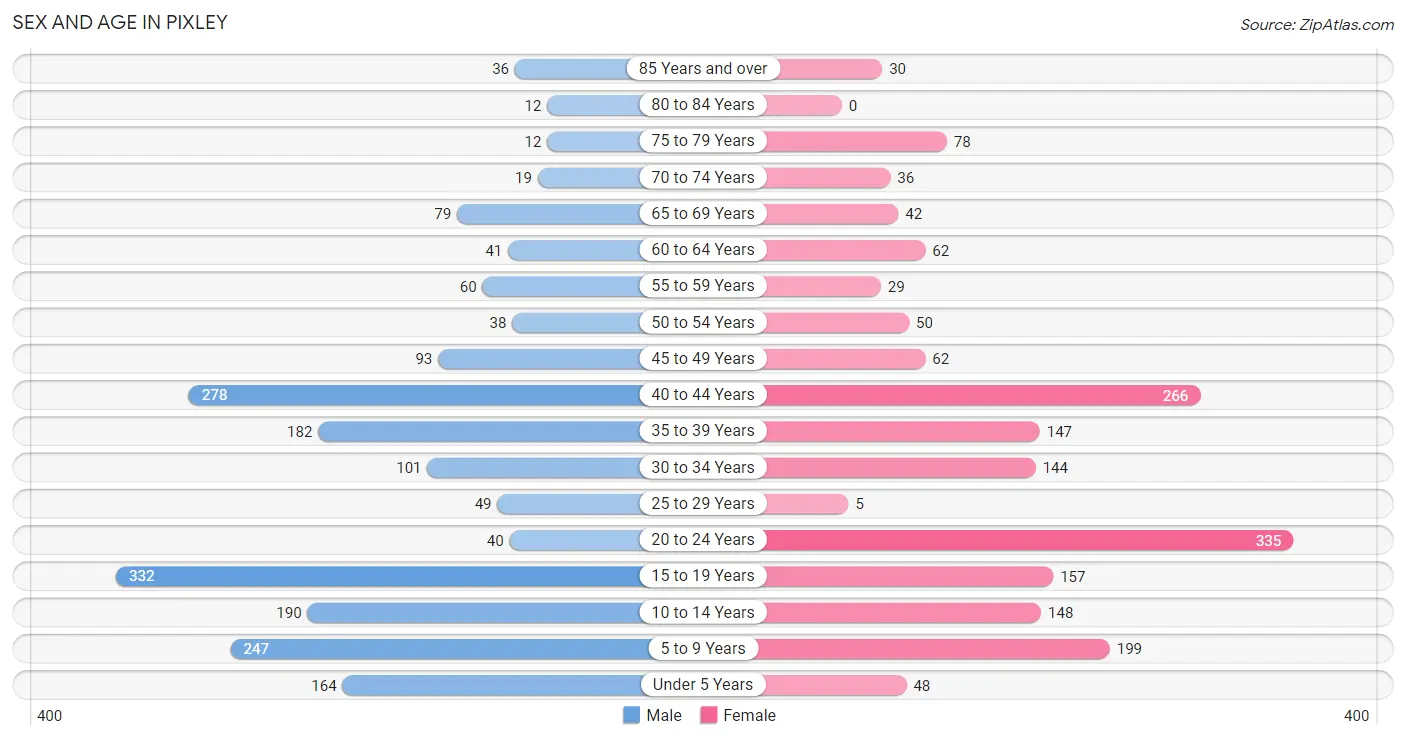
Sex and Age in Pixley
Sex and Age in Pixley
The most populous age groups in Pixley are 15 to 19 Years (332 | 16.8%) for men and 20 to 24 Years (335 | 18.2%) for women.
| Age Bracket | Male | Female |
| Under 5 Years | 164 (8.3%) | 48 (2.6%) |
| 5 to 9 Years | 247 (12.5%) | 199 (10.8%) |
| 10 to 14 Years | 190 (9.6%) | 148 (8.1%) |
| 15 to 19 Years | 332 (16.8%) | 157 (8.5%) |
| 20 to 24 Years | 40 (2.0%) | 335 (18.2%) |
| 25 to 29 Years | 49 (2.5%) | 5 (0.3%) |
| 30 to 34 Years | 101 (5.1%) | 144 (7.8%) |
| 35 to 39 Years | 182 (9.2%) | 147 (8.0%) |
| 40 to 44 Years | 278 (14.1%) | 266 (14.5%) |
| 45 to 49 Years | 93 (4.7%) | 62 (3.4%) |
| 50 to 54 Years | 38 (1.9%) | 50 (2.7%) |
| 55 to 59 Years | 60 (3.0%) | 29 (1.6%) |
| 60 to 64 Years | 41 (2.1%) | 62 (3.4%) |
| 65 to 69 Years | 79 (4.0%) | 42 (2.3%) |
| 70 to 74 Years | 19 (1.0%) | 36 (2.0%) |
| 75 to 79 Years | 12 (0.6%) | 78 (4.2%) |
| 80 to 84 Years | 12 (0.6%) | 0 (0.0%) |
| 85 Years and over | 36 (1.8%) | 30 (1.6%) |
| Total | 1,973 (100.0%) | 1,838 (100.0%) |
Families and Households in Pixley
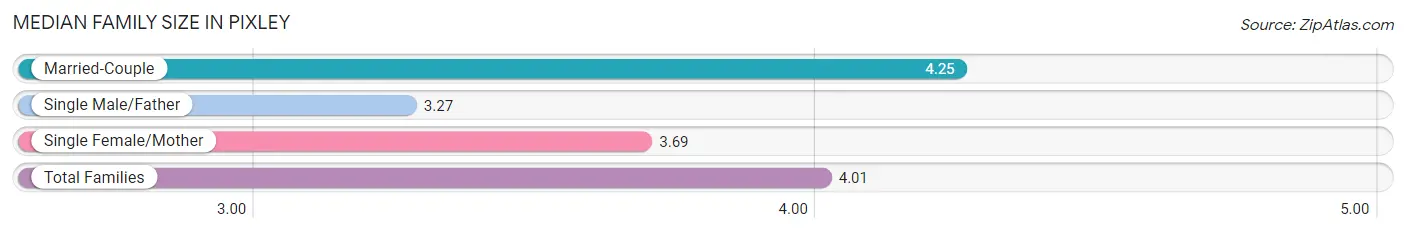
Median Family Size in Pixley
The median family size in Pixley is 4.01 persons per family, with married-couple families (501 | 64.0%) accounting for the largest median family size of 4.25 persons per family. On the other hand, single male/father families (66 | 8.4%) represent the smallest median family size with 3.27 persons per family.
| Family Type | # Families | Family Size |
| Married-Couple | 501 (64.0%) | 4.25 |
| Single Male/Father | 66 (8.4%) | 3.27 |
| Single Female/Mother | 216 (27.6%) | 3.69 |
| Total Families | 783 (100.0%) | 4.01 |
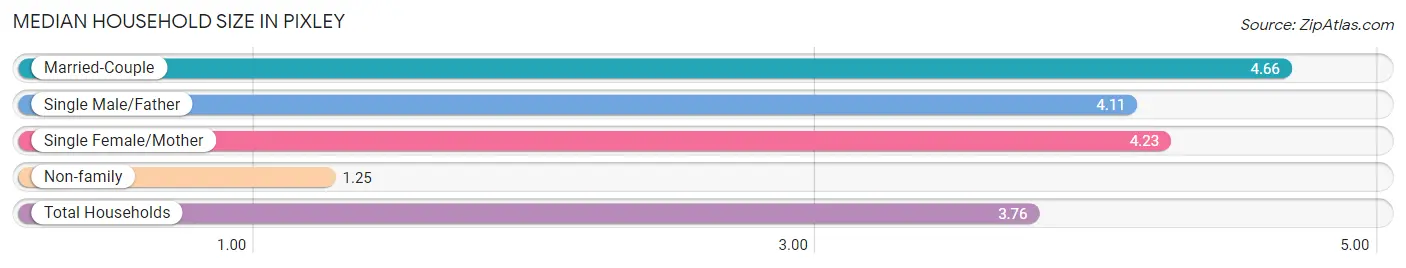
Median Household Size in Pixley
The median household size in Pixley is 3.76 persons per household, with married-couple households (501 | 49.5%) accounting for the largest median household size of 4.66 persons per household. non-family households (230 | 22.7%) represent the smallest median household size with 1.25 persons per household.
| Household Type | # Households | Household Size |
| Married-Couple | 501 (49.5%) | 4.66 |
| Single Male/Father | 66 (6.5%) | 4.11 |
| Single Female/Mother | 216 (21.3%) | 4.23 |
| Non-family | 230 (22.7%) | 1.25 |
| Total Households | 1,013 (100.0%) | 3.76 |
Household Size by Marriage Status in Pixley
Out of a total of 1,013 households in Pixley, 783 (77.3%) are family households, while 230 (22.7%) are nonfamily households. The most numerous type of family households are 4-person households, comprising 221, and the most common type of nonfamily households are 1-person households, comprising 185.
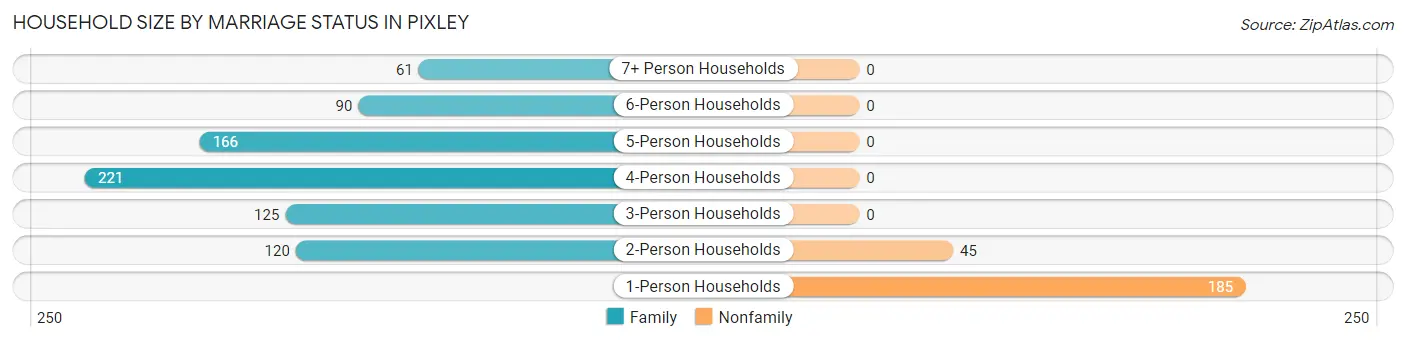
| Household Size | Family Households | Nonfamily Households |
| 1-Person Households | - | 185 (18.3%) |
| 2-Person Households | 120 (11.8%) | 45 (4.4%) |
| 3-Person Households | 125 (12.3%) | 0 (0.0%) |
| 4-Person Households | 221 (21.8%) | 0 (0.0%) |
| 5-Person Households | 166 (16.4%) | 0 (0.0%) |
| 6-Person Households | 90 (8.9%) | 0 (0.0%) |
| 7+ Person Households | 61 (6.0%) | 0 (0.0%) |
| Total | 783 (77.3%) | 230 (22.7%) |
Female Fertility in Pixley
Fertility by Age in Pixley
Average fertility rate in Pixley is 11.0 births per 1,000 women. Women in the age bracket of 35 to 50 years have the highest fertility rate with 25.0 births per 1,000 women. Women in the age bracket of 35 to 50 years acount for 100.0% of all women with births.
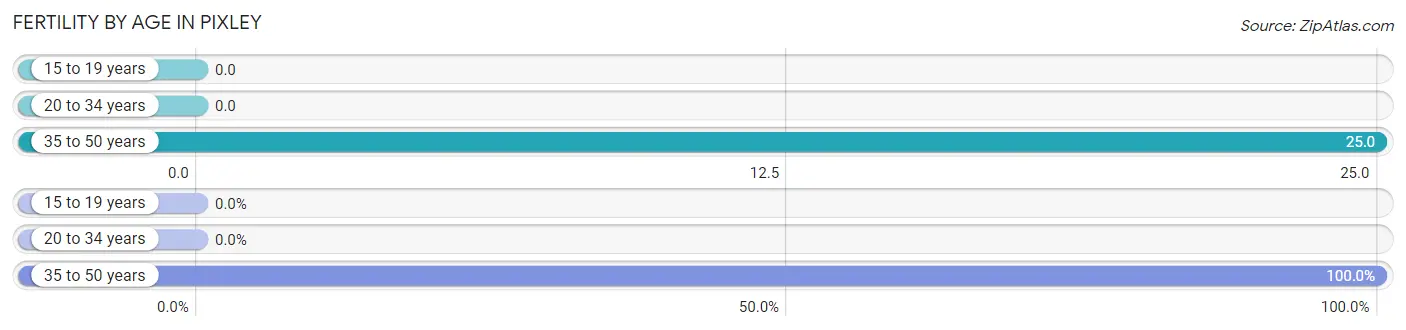
| Age Bracket | Women with Births | Births / 1,000 Women |
| 15 to 19 years | 0 (0.0%) | 0.0 |
| 20 to 34 years | 0 (0.0%) | 0.0 |
| 35 to 50 years | 12 (100.0%) | 25.0 |
| Total | 12 (100.0%) | 11.0 |
Fertility by Age by Marriage Status in Pixley
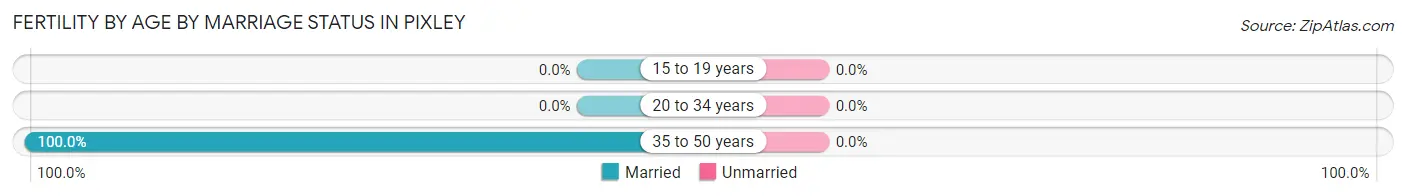
| Age Bracket | Married | Unmarried |
| 15 to 19 years | 0 (0.0%) | 0 (0.0%) |
| 20 to 34 years | 0 (0.0%) | 0 (0.0%) |
| 35 to 50 years | 12 (100.0%) | 0 (0.0%) |
| Total | 12 (100.0%) | 0 (0.0%) |
Fertility by Education in Pixley
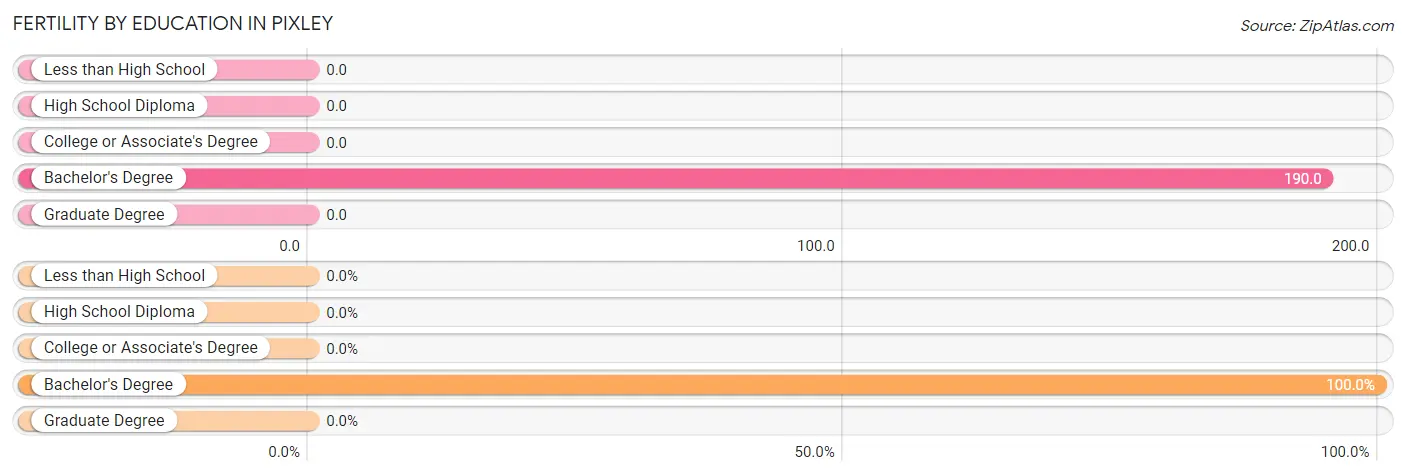
| Educational Attainment | Women with Births | Births / 1,000 Women |
| Less than High School | 0 (0.0%) | 0.0 |
| High School Diploma | 0 (0.0%) | 0.0 |
| College or Associate's Degree | 0 (0.0%) | 0.0 |
| Bachelor's Degree | 12 (100.0%) | 190.0 |
| Graduate Degree | 0 (0.0%) | 0.0 |
| Total | 12 (100.0%) | 11.0 |
Fertility by Education by Marriage Status in Pixley
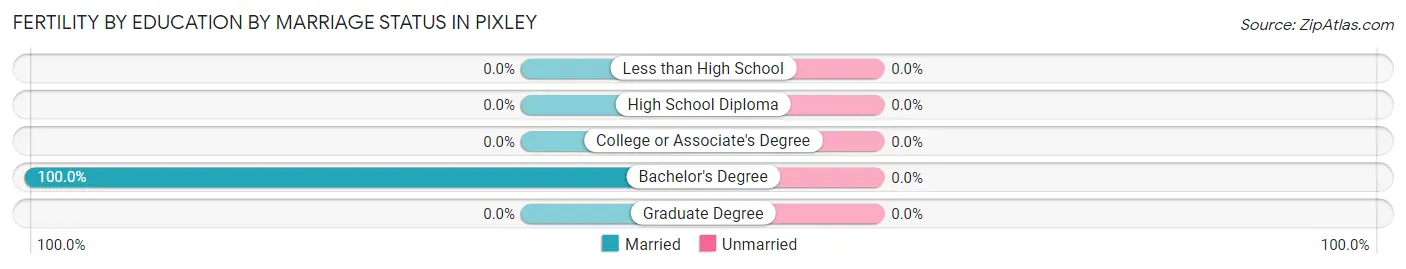
| Educational Attainment | Married | Unmarried |
| Less than High School | 0 (0.0%) | 0 (0.0%) |
| High School Diploma | 0 (0.0%) | 0 (0.0%) |
| College or Associate's Degree | 0 (0.0%) | 0 (0.0%) |
| Bachelor's Degree | 12 (100.0%) | 0 (0.0%) |
| Graduate Degree | 0 (0.0%) | 0 (0.0%) |
| Total | 12 (100.0%) | 0 (0.0%) |
Employment Characteristics in Pixley
Employment by Class of Employer in Pixley
Among the 1,298 employed individuals in Pixley, private company employees (969 | 74.7%), local government employees (134 | 10.3%), and self-employed (not incorporated) (102 | 7.9%) make up the most common classes of employment.
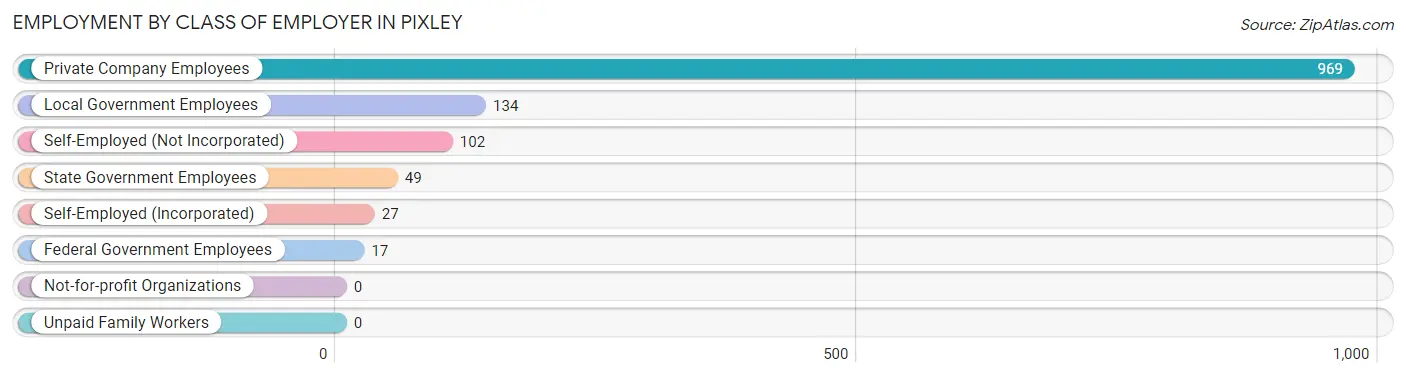
| Employer Class | # Employees | % Employees |
| Private Company Employees | 969 | 74.7% |
| Self-Employed (Incorporated) | 27 | 2.1% |
| Self-Employed (Not Incorporated) | 102 | 7.9% |
| Not-for-profit Organizations | 0 | 0.0% |
| Local Government Employees | 134 | 10.3% |
| State Government Employees | 49 | 3.8% |
| Federal Government Employees | 17 | 1.3% |
| Unpaid Family Workers | 0 | 0.0% |
| Total | 1,298 | 100.0% |
Employment Status by Age in Pixley
According to the labor force statistics for Pixley, out of the total population over 16 years of age (2,760), 55.2% or 1,524 individuals are in the labor force, with 13.8% or 210 of them unemployed. The age group with the highest labor force participation rate is 25 to 29 years, with 90.7% or 49 individuals in the labor force. Within the labor force, the 45 to 54 years age range has the highest percentage of unemployed individuals, with 21.6% or 38 of them being unemployed.
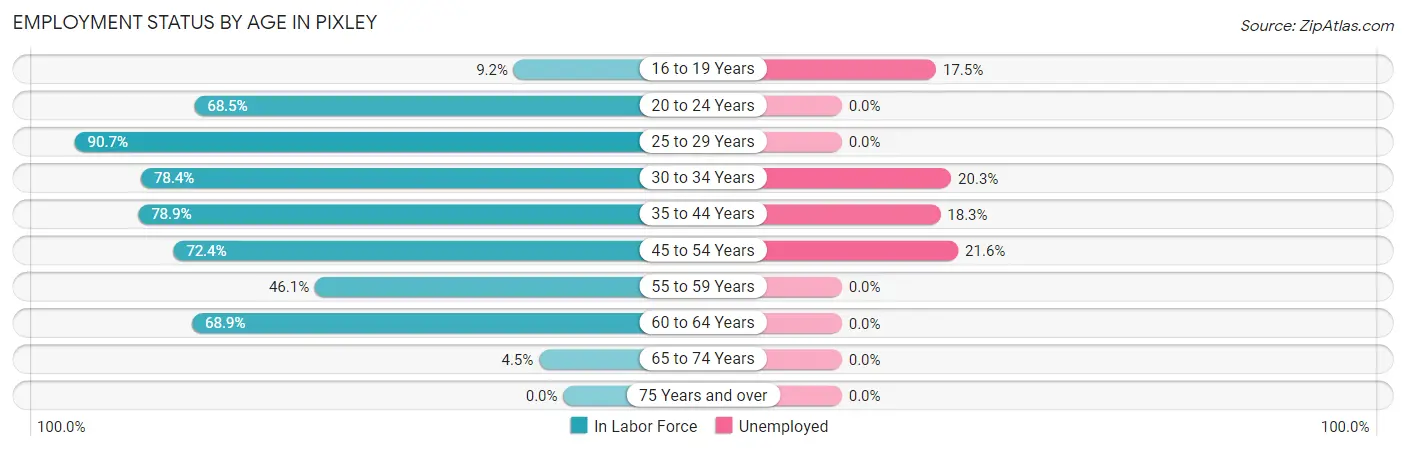
| Age Bracket | In Labor Force | Unemployed |
| 16 to 19 Years | 40 (9.2%) | 7 (17.5%) |
| 20 to 24 Years | 257 (68.5%) | 0 (0.0%) |
| 25 to 29 Years | 49 (90.7%) | 0 (0.0%) |
| 30 to 34 Years | 192 (78.4%) | 39 (20.3%) |
| 35 to 44 Years | 689 (78.9%) | 126 (18.3%) |
| 45 to 54 Years | 176 (72.4%) | 38 (21.6%) |
| 55 to 59 Years | 41 (46.1%) | 0 (0.0%) |
| 60 to 64 Years | 71 (68.9%) | 0 (0.0%) |
| 65 to 74 Years | 8 (4.5%) | 0 (0.0%) |
| 75 Years and over | 0 (0.0%) | 0 (0.0%) |
| Total | 1,524 (55.2%) | 210 (13.8%) |
Employment Status by Educational Attainment in Pixley
According to labor force statistics for Pixley, 75.8% of individuals (1,218) out of the total population between 25 and 64 years of age (1,607) are in the labor force, with 16.7% or 203 of them being unemployed. The group with the highest labor force participation rate are those with the educational attainment of bachelor's degree or higher, with 100.0% or 116 individuals in the labor force. Within the labor force, individuals with less than high school education have the highest percentage of unemployment, with 26.7% or 203 of them being unemployed.
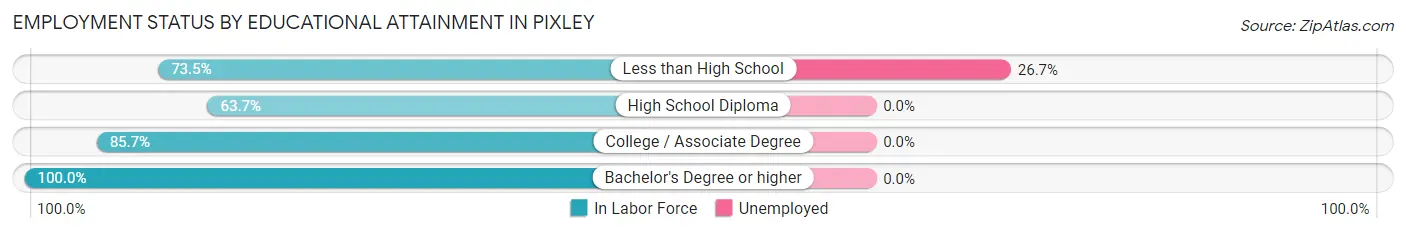
| Educational Attainment | In Labor Force | Unemployed |
| Less than High School | 760 (73.5%) | 276 (26.7%) |
| High School Diploma | 144 (63.7%) | 0 (0.0%) |
| College / Associate Degree | 198 (85.7%) | 0 (0.0%) |
| Bachelor's Degree or higher | 116 (100.0%) | 0 (0.0%) |
| Total | 1,218 (75.8%) | 268 (16.7%) |
Employment Occupations by Sex in Pixley
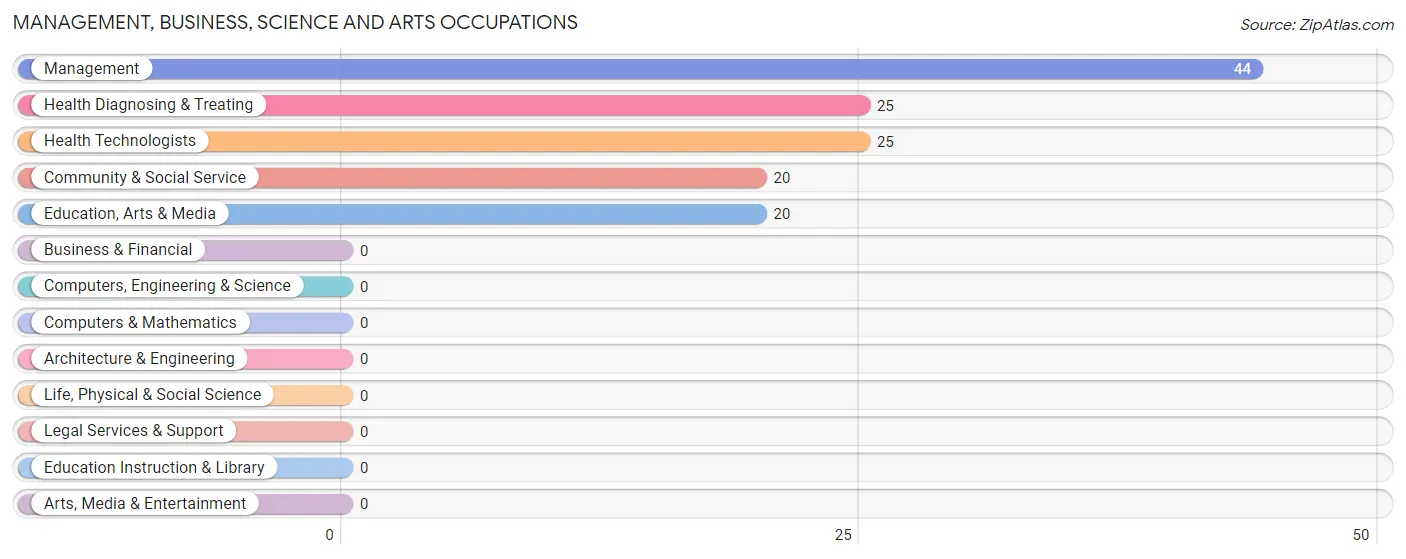
Management, Business, Science and Arts Occupations
The most common Management, Business, Science and Arts occupations in Pixley are Management (44 | 3.4%), Health Diagnosing & Treating (25 | 1.9%), Health Technologists (25 | 1.9%), Community & Social Service (20 | 1.5%), and Education, Arts & Media (20 | 1.5%).
Management, Business, Science and Arts Occupations by Sex
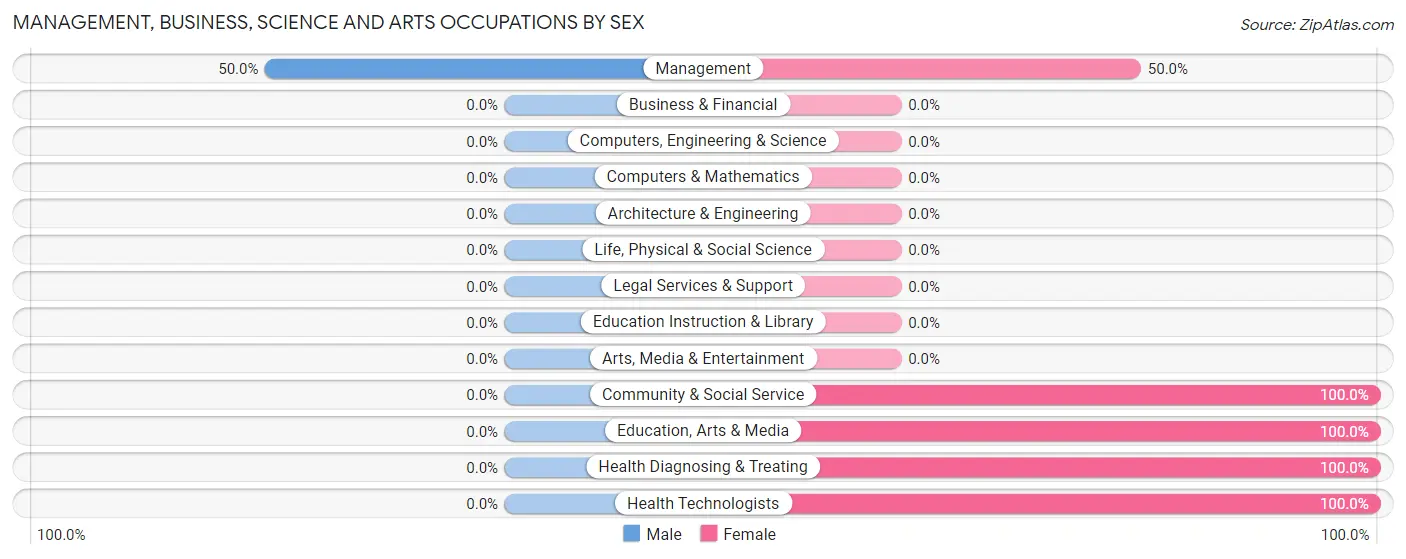
| Occupation | Male | Female |
| Management | 22 (50.0%) | 22 (50.0%) |
| Business & Financial | 0 (0.0%) | 0 (0.0%) |
| Computers, Engineering & Science | 0 (0.0%) | 0 (0.0%) |
| Computers & Mathematics | 0 (0.0%) | 0 (0.0%) |
| Architecture & Engineering | 0 (0.0%) | 0 (0.0%) |
| Life, Physical & Social Science | 0 (0.0%) | 0 (0.0%) |
| Community & Social Service | 0 (0.0%) | 20 (100.0%) |
| Education, Arts & Media | 0 (0.0%) | 20 (100.0%) |
| Legal Services & Support | 0 (0.0%) | 0 (0.0%) |
| Education Instruction & Library | 0 (0.0%) | 0 (0.0%) |
| Arts, Media & Entertainment | 0 (0.0%) | 0 (0.0%) |
| Health Diagnosing & Treating | 0 (0.0%) | 25 (100.0%) |
| Health Technologists | 0 (0.0%) | 25 (100.0%) |
| Total (Category) | 22 (24.7%) | 67 (75.3%) |
| Total (Overall) | 715 (54.5%) | 598 (45.5%) |
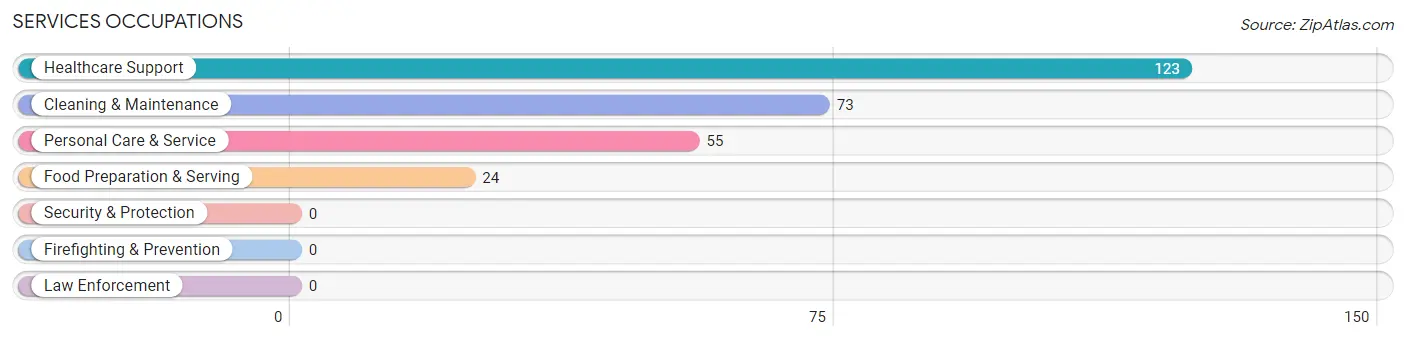
Services Occupations
The most common Services occupations in Pixley are Healthcare Support (123 | 9.4%), Cleaning & Maintenance (73 | 5.6%), Personal Care & Service (55 | 4.2%), and Food Preparation & Serving (24 | 1.8%).
Services Occupations by Sex
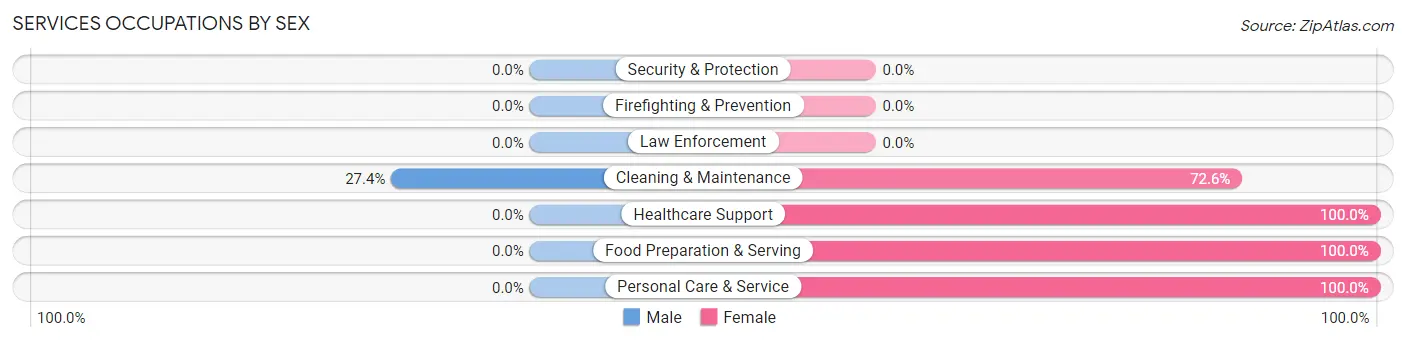
| Occupation | Male | Female |
| Healthcare Support | 0 (0.0%) | 123 (100.0%) |
| Security & Protection | 0 (0.0%) | 0 (0.0%) |
| Firefighting & Prevention | 0 (0.0%) | 0 (0.0%) |
| Law Enforcement | 0 (0.0%) | 0 (0.0%) |
| Food Preparation & Serving | 0 (0.0%) | 24 (100.0%) |
| Cleaning & Maintenance | 20 (27.4%) | 53 (72.6%) |
| Personal Care & Service | 0 (0.0%) | 55 (100.0%) |
| Total (Category) | 20 (7.3%) | 255 (92.7%) |
| Total (Overall) | 715 (54.5%) | 598 (45.5%) |
Sales and Office Occupations
The most common Sales and Office occupations in Pixley are Office & Administration (82 | 6.2%), and Sales & Related (63 | 4.8%).
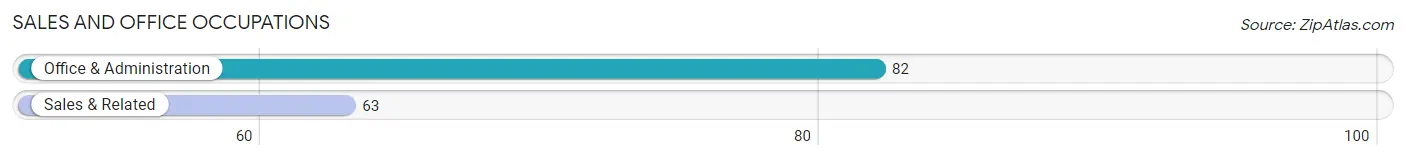
Sales and Office Occupations by Sex
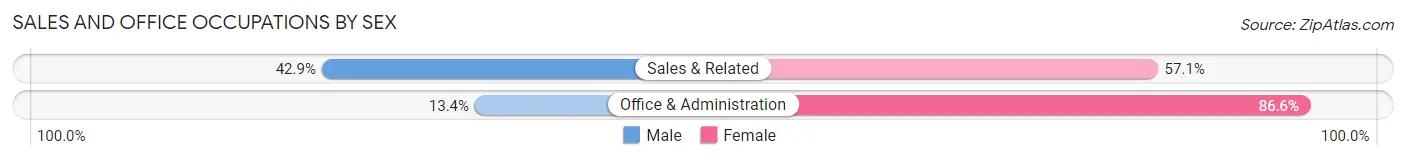
| Occupation | Male | Female |
| Sales & Related | 27 (42.9%) | 36 (57.1%) |
| Office & Administration | 11 (13.4%) | 71 (86.6%) |
| Total (Category) | 38 (26.2%) | 107 (73.8%) |
| Total (Overall) | 715 (54.5%) | 598 (45.5%) |
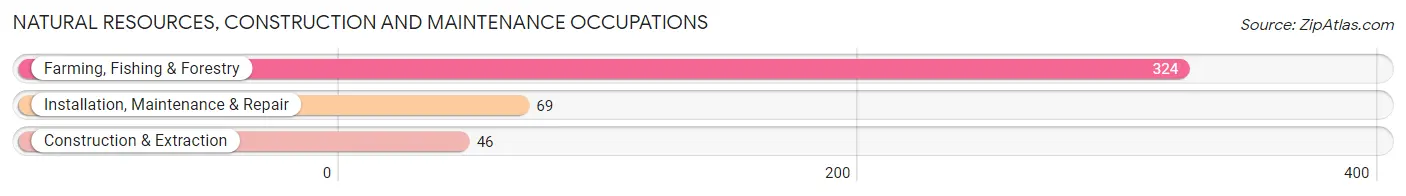
Natural Resources, Construction and Maintenance Occupations
The most common Natural Resources, Construction and Maintenance occupations in Pixley are Farming, Fishing & Forestry (324 | 24.7%), Installation, Maintenance & Repair (69 | 5.3%), and Construction & Extraction (46 | 3.5%).
Natural Resources, Construction and Maintenance Occupations by Sex
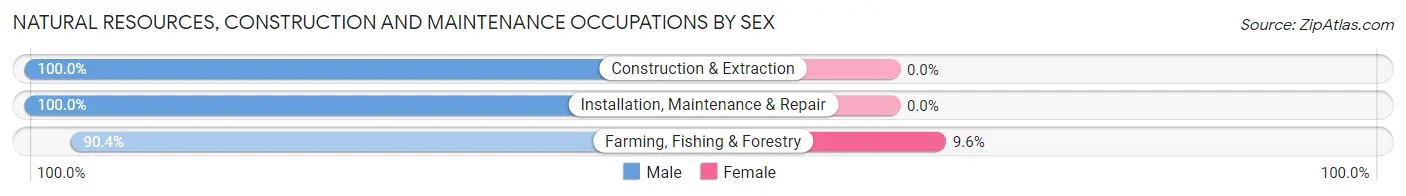
| Occupation | Male | Female |
| Farming, Fishing & Forestry | 293 (90.4%) | 31 (9.6%) |
| Construction & Extraction | 46 (100.0%) | 0 (0.0%) |
| Installation, Maintenance & Repair | 69 (100.0%) | 0 (0.0%) |
| Total (Category) | 408 (92.9%) | 31 (7.1%) |
| Total (Overall) | 715 (54.5%) | 598 (45.5%) |
Production, Transportation and Moving Occupations
The most common Production, Transportation and Moving occupations in Pixley are Production (216 | 16.5%), Transportation (91 | 6.9%), and Material Moving (58 | 4.4%).
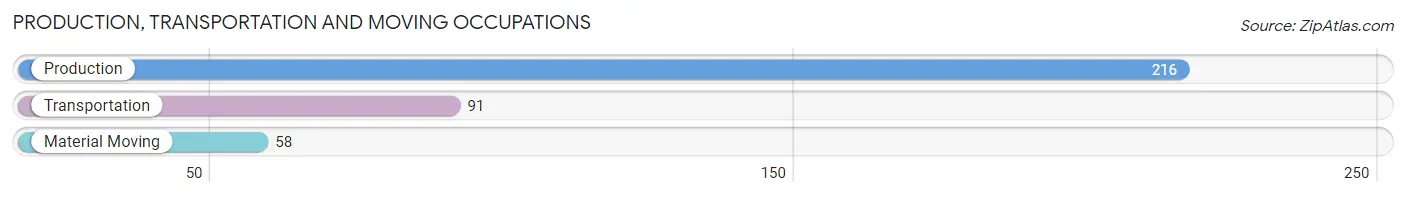
Production, Transportation and Moving Occupations by Sex
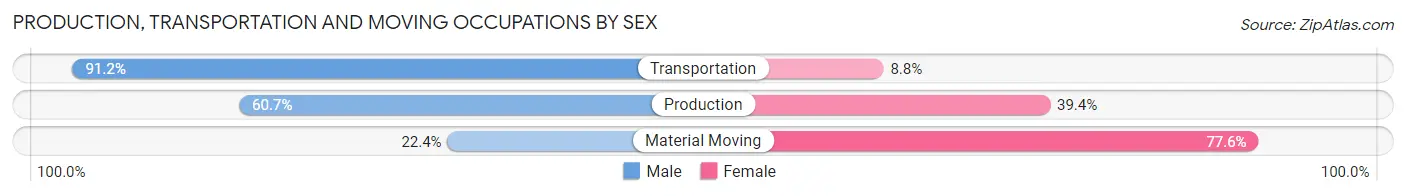
| Occupation | Male | Female |
| Production | 131 (60.7%) | 85 (39.4%) |
| Transportation | 83 (91.2%) | 8 (8.8%) |
| Material Moving | 13 (22.4%) | 45 (77.6%) |
| Total (Category) | 227 (62.2%) | 138 (37.8%) |
| Total (Overall) | 715 (54.5%) | 598 (45.5%) |
Employment Industries by Sex in Pixley
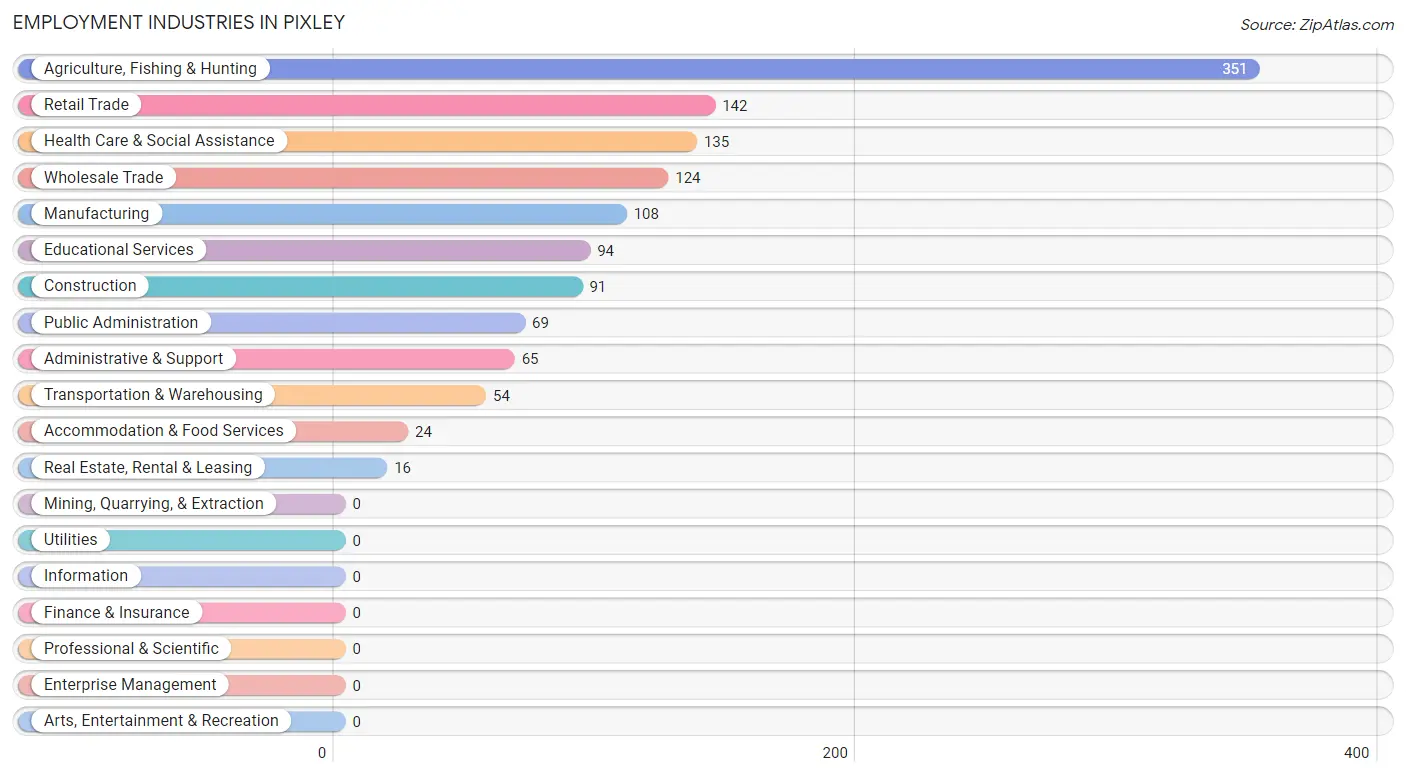
Employment Industries in Pixley
The major employment industries in Pixley include Agriculture, Fishing & Hunting (351 | 26.7%), Retail Trade (142 | 10.8%), Health Care & Social Assistance (135 | 10.3%), Wholesale Trade (124 | 9.4%), and Manufacturing (108 | 8.2%).
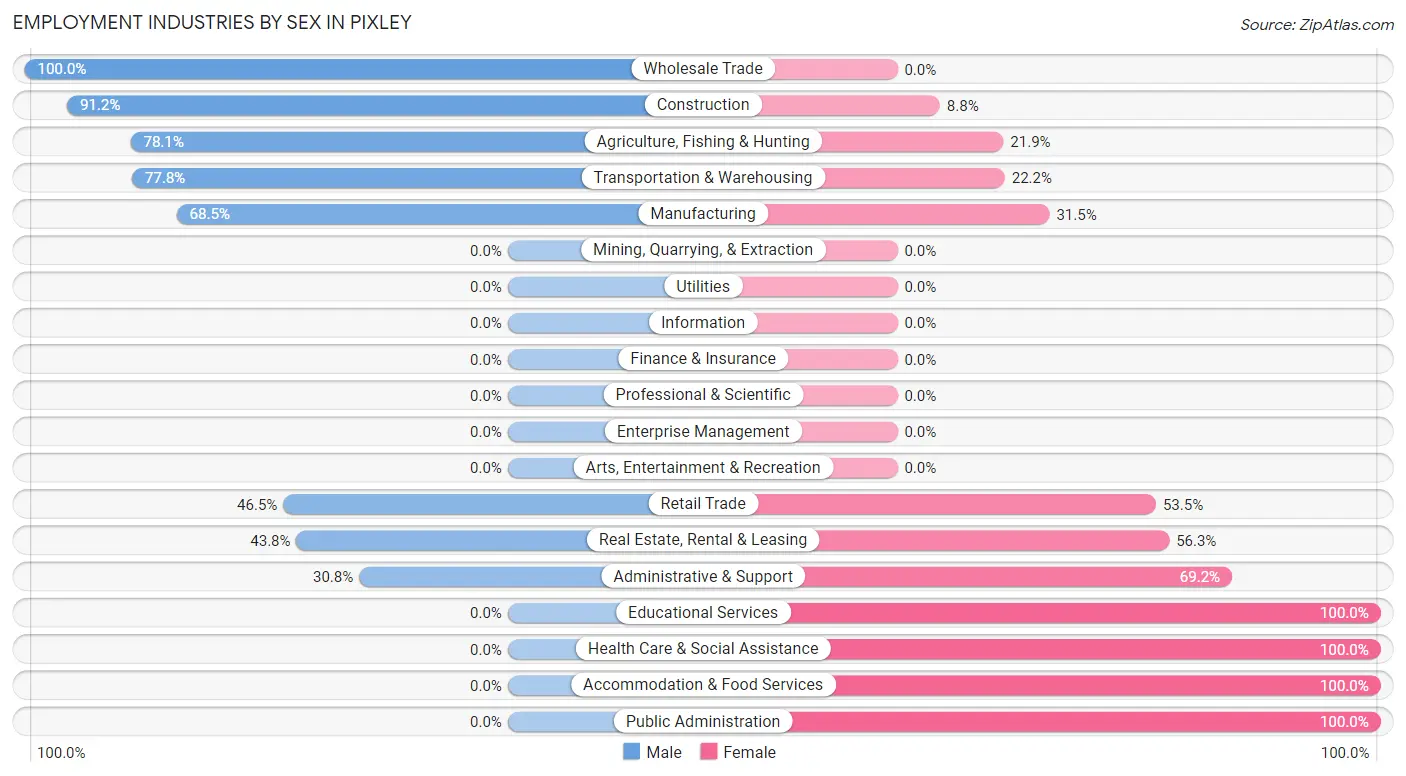
Employment Industries by Sex in Pixley
The Pixley industries that see more men than women are Wholesale Trade (100.0%), Construction (91.2%), and Agriculture, Fishing & Hunting (78.1%), whereas the industries that tend to have a higher number of women are Educational Services (100.0%), Health Care & Social Assistance (100.0%), and Accommodation & Food Services (100.0%).
| Industry | Male | Female |
| Agriculture, Fishing & Hunting | 274 (78.1%) | 77 (21.9%) |
| Mining, Quarrying, & Extraction | 0 (0.0%) | 0 (0.0%) |
| Construction | 83 (91.2%) | 8 (8.8%) |
| Manufacturing | 74 (68.5%) | 34 (31.5%) |
| Wholesale Trade | 124 (100.0%) | 0 (0.0%) |
| Retail Trade | 66 (46.5%) | 76 (53.5%) |
| Transportation & Warehousing | 42 (77.8%) | 12 (22.2%) |
| Utilities | 0 (0.0%) | 0 (0.0%) |
| Information | 0 (0.0%) | 0 (0.0%) |
| Finance & Insurance | 0 (0.0%) | 0 (0.0%) |
| Real Estate, Rental & Leasing | 7 (43.8%) | 9 (56.2%) |
| Professional & Scientific | 0 (0.0%) | 0 (0.0%) |
| Enterprise Management | 0 (0.0%) | 0 (0.0%) |
| Administrative & Support | 20 (30.8%) | 45 (69.2%) |
| Educational Services | 0 (0.0%) | 94 (100.0%) |
| Health Care & Social Assistance | 0 (0.0%) | 135 (100.0%) |
| Arts, Entertainment & Recreation | 0 (0.0%) | 0 (0.0%) |
| Accommodation & Food Services | 0 (0.0%) | 24 (100.0%) |
| Public Administration | 0 (0.0%) | 69 (100.0%) |
| Total | 715 (54.5%) | 598 (45.5%) |
Education in Pixley
School Enrollment in Pixley
The most common levels of schooling among the 1,298 students in Pixley are elementary school (456 | 35.1%), high school (349 | 26.9%), and middle school (261 | 20.1%).
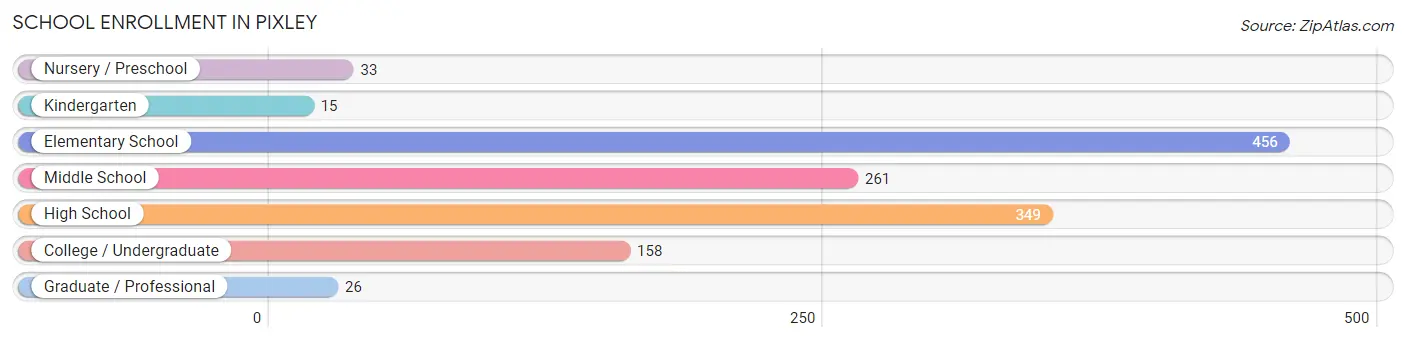
| School Level | # Students | % Students |
| Nursery / Preschool | 33 | 2.5% |
| Kindergarten | 15 | 1.2% |
| Elementary School | 456 | 35.1% |
| Middle School | 261 | 20.1% |
| High School | 349 | 26.9% |
| College / Undergraduate | 158 | 12.2% |
| Graduate / Professional | 26 | 2.0% |
| Total | 1,298 | 100.0% |
School Enrollment by Age by Funding Source in Pixley
Out of a total of 1,298 students who are enrolled in schools in Pixley, 32 (2.5%) attend a private institution, while the remaining 1,266 (97.5%) are enrolled in public schools. The age group of 3 to 4 year olds has the highest likelihood of being enrolled in private schools, with 33 (100.0% in the age bracket) enrolled. Conversely, the age group of 5 to 9 year old has the lowest likelihood of being enrolled in a private school, with 420 (100.0% in the age bracket) attending a public institution.
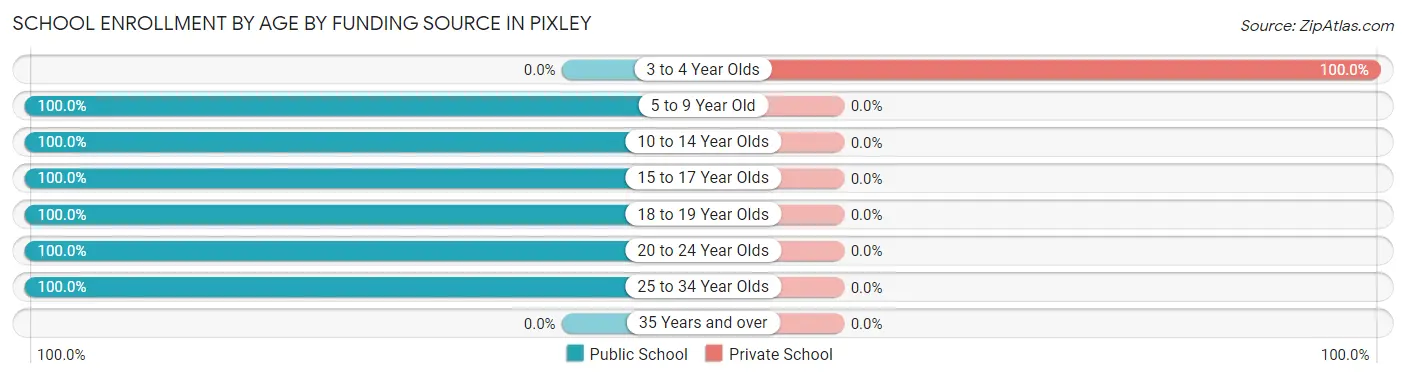
| Age Bracket | Public School | Private School |
| 3 to 4 Year Olds | 0 (0.0%) | 33 (100.0%) |
| 5 to 9 Year Old | 420 (100.0%) | 0 (0.0%) |
| 10 to 14 Year Olds | 338 (100.0%) | 0 (0.0%) |
| 15 to 17 Year Olds | 323 (100.0%) | 0 (0.0%) |
| 18 to 19 Year Olds | 45 (100.0%) | 0 (0.0%) |
| 20 to 24 Year Olds | 113 (100.0%) | 0 (0.0%) |
| 25 to 34 Year Olds | 26 (100.0%) | 0 (0.0%) |
| 35 Years and over | 0 (0.0%) | 0 (0.0%) |
| Total | 1,266 (97.5%) | 32 (2.5%) |
Educational Attainment by Field of Study in Pixley
Business (45 | 38.8%), multidisciplinary studies (26 | 22.4%), science & technology (25 | 21.5%), bio, nature & agricultural (12 | 10.3%), and social sciences (4 | 3.5%) are the most common fields of study among 116 individuals in Pixley who have obtained a bachelor's degree or higher.
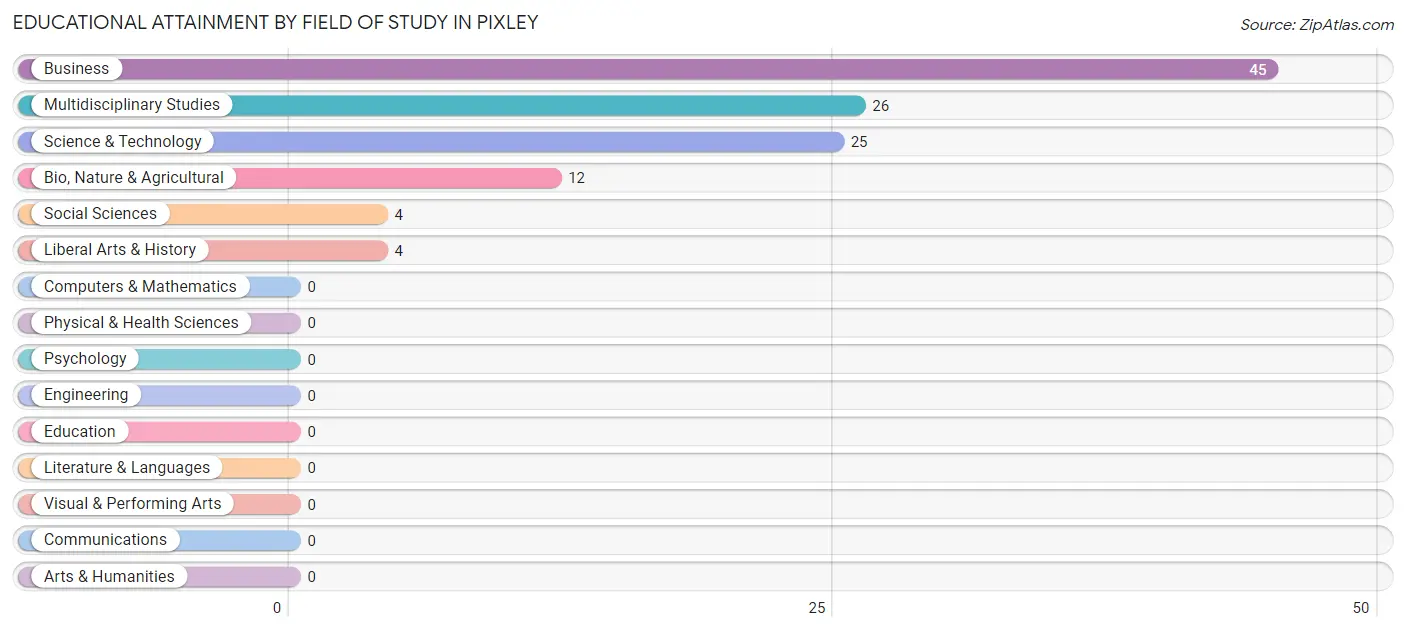
| Field of Study | # Graduates | % Graduates |
| Computers & Mathematics | 0 | 0.0% |
| Bio, Nature & Agricultural | 12 | 10.3% |
| Physical & Health Sciences | 0 | 0.0% |
| Psychology | 0 | 0.0% |
| Social Sciences | 4 | 3.5% |
| Engineering | 0 | 0.0% |
| Multidisciplinary Studies | 26 | 22.4% |
| Science & Technology | 25 | 21.5% |
| Business | 45 | 38.8% |
| Education | 0 | 0.0% |
| Literature & Languages | 0 | 0.0% |
| Liberal Arts & History | 4 | 3.5% |
| Visual & Performing Arts | 0 | 0.0% |
| Communications | 0 | 0.0% |
| Arts & Humanities | 0 | 0.0% |
| Total | 116 | 100.0% |
Transportation & Commute in Pixley
Vehicle Availability by Sex in Pixley
The most prevalent vehicle ownership categories in Pixley are males with 2 vehicles (287, accounting for 41.0%) and females with 2 vehicles (198, making up 48.0%).
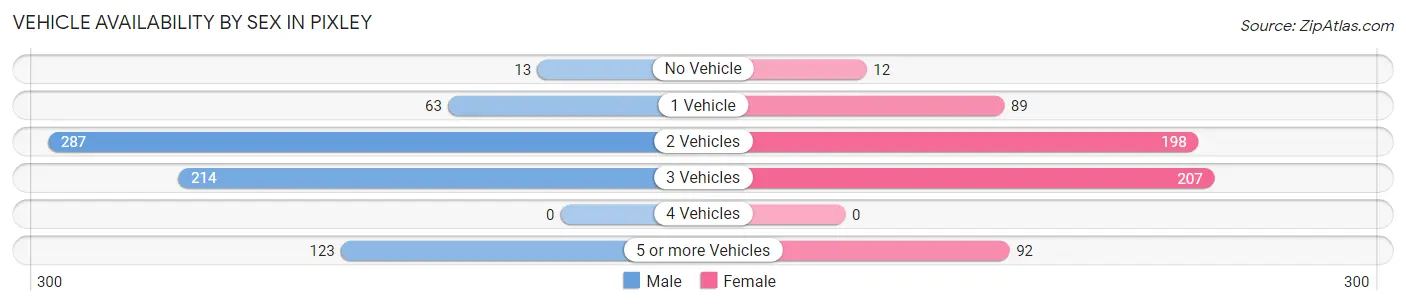
| Vehicles Available | Male | Female |
| No Vehicle | 13 (1.9%) | 12 (2.0%) |
| 1 Vehicle | 63 (9.0%) | 89 (14.9%) |
| 2 Vehicles | 287 (41.0%) | 198 (33.1%) |
| 3 Vehicles | 214 (30.6%) | 207 (34.6%) |
| 4 Vehicles | 0 (0.0%) | 0 (0.0%) |
| 5 or more Vehicles | 123 (17.6%) | 92 (15.4%) |
| Total | 700 (100.0%) | 598 (100.0%) |
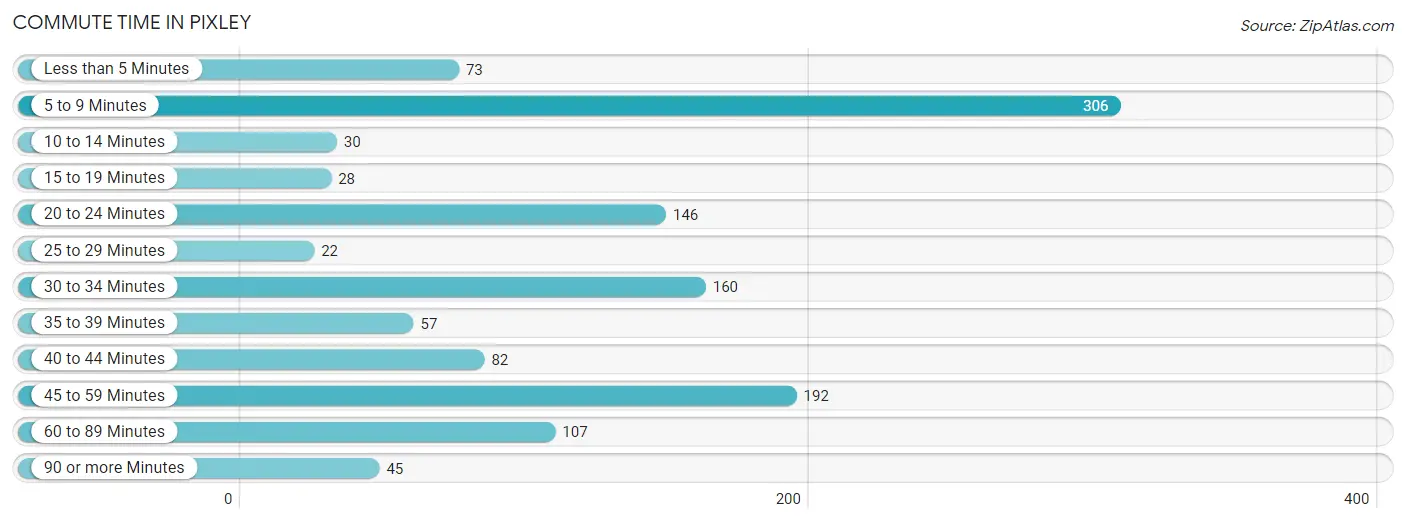
Commute Time in Pixley
The most frequently occuring commute durations in Pixley are 5 to 9 minutes (306 commuters, 24.5%), 45 to 59 minutes (192 commuters, 15.4%), and 30 to 34 minutes (160 commuters, 12.8%).
| Commute Time | # Commuters | % Commuters |
| Less than 5 Minutes | 73 | 5.9% |
| 5 to 9 Minutes | 306 | 24.5% |
| 10 to 14 Minutes | 30 | 2.4% |
| 15 to 19 Minutes | 28 | 2.2% |
| 20 to 24 Minutes | 146 | 11.7% |
| 25 to 29 Minutes | 22 | 1.8% |
| 30 to 34 Minutes | 160 | 12.8% |
| 35 to 39 Minutes | 57 | 4.6% |
| 40 to 44 Minutes | 82 | 6.6% |
| 45 to 59 Minutes | 192 | 15.4% |
| 60 to 89 Minutes | 107 | 8.6% |
| 90 or more Minutes | 45 | 3.6% |
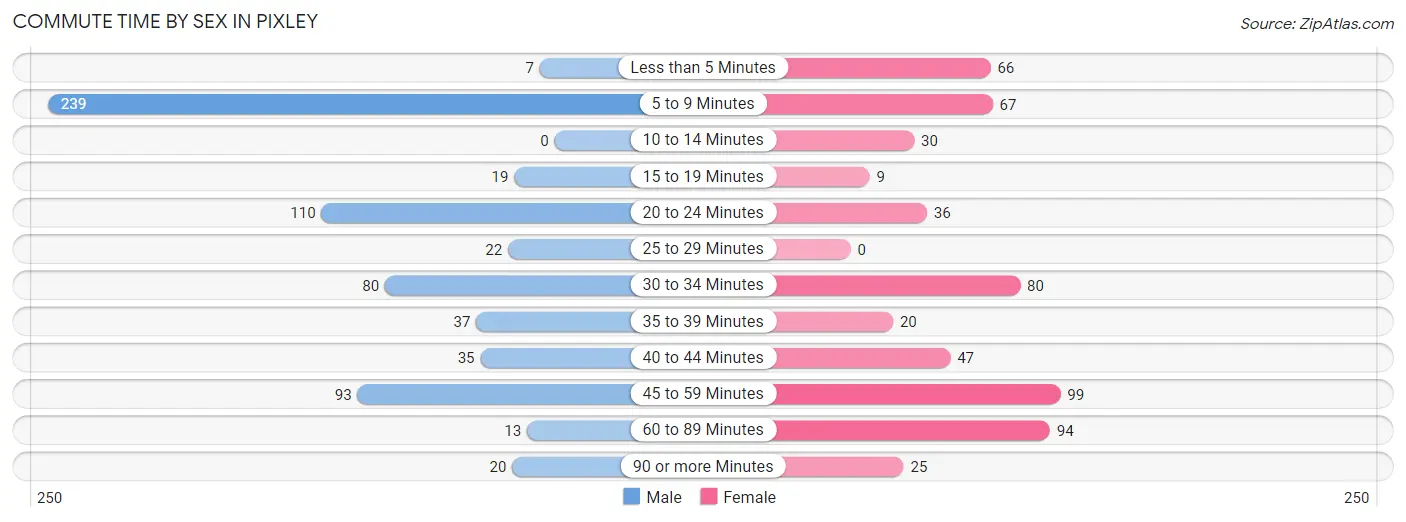
Commute Time by Sex in Pixley
The most common commute times in Pixley are 5 to 9 minutes (239 commuters, 35.4%) for males and 45 to 59 minutes (99 commuters, 17.3%) for females.
| Commute Time | Male | Female |
| Less than 5 Minutes | 7 (1.0%) | 66 (11.5%) |
| 5 to 9 Minutes | 239 (35.4%) | 67 (11.7%) |
| 10 to 14 Minutes | 0 (0.0%) | 30 (5.2%) |
| 15 to 19 Minutes | 19 (2.8%) | 9 (1.6%) |
| 20 to 24 Minutes | 110 (16.3%) | 36 (6.3%) |
| 25 to 29 Minutes | 22 (3.3%) | 0 (0.0%) |
| 30 to 34 Minutes | 80 (11.8%) | 80 (14.0%) |
| 35 to 39 Minutes | 37 (5.5%) | 20 (3.5%) |
| 40 to 44 Minutes | 35 (5.2%) | 47 (8.2%) |
| 45 to 59 Minutes | 93 (13.8%) | 99 (17.3%) |
| 60 to 89 Minutes | 13 (1.9%) | 94 (16.4%) |
| 90 or more Minutes | 20 (3.0%) | 25 (4.4%) |
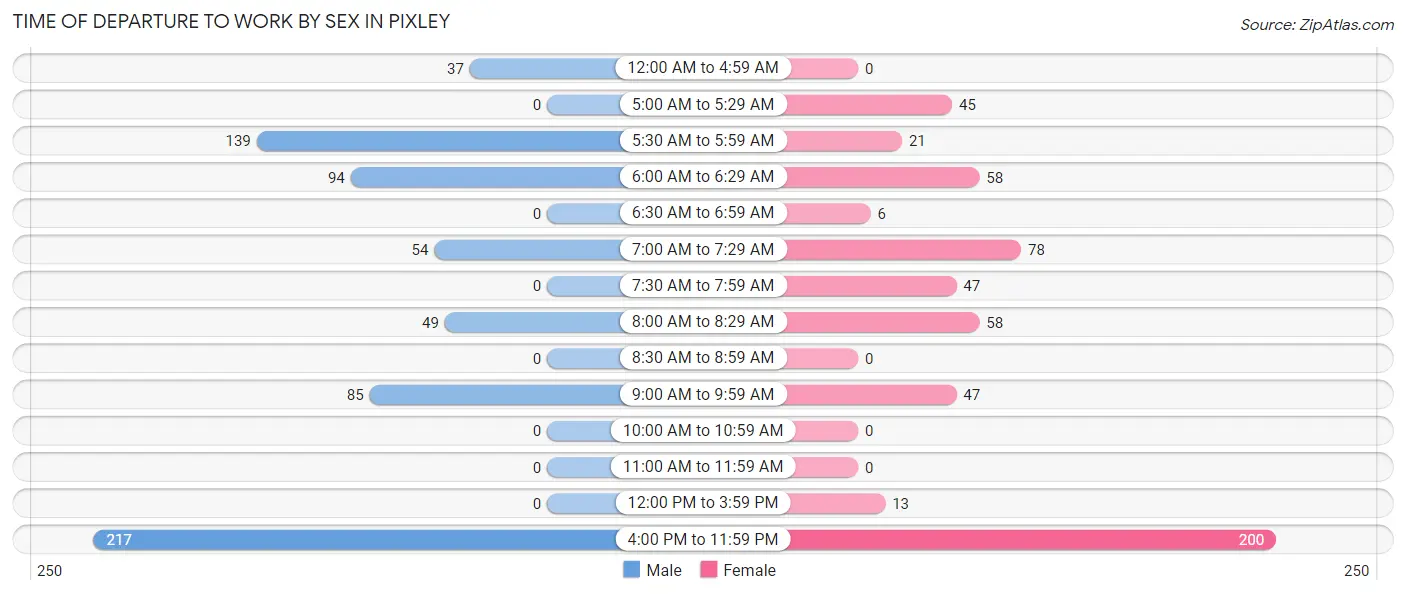
Time of Departure to Work by Sex in Pixley
The most frequent times of departure to work in Pixley are 4:00 PM to 11:59 PM (217, 32.2%) for males and 4:00 PM to 11:59 PM (200, 34.9%) for females.
| Time of Departure | Male | Female |
| 12:00 AM to 4:59 AM | 37 (5.5%) | 0 (0.0%) |
| 5:00 AM to 5:29 AM | 0 (0.0%) | 45 (7.9%) |
| 5:30 AM to 5:59 AM | 139 (20.6%) | 21 (3.7%) |
| 6:00 AM to 6:29 AM | 94 (13.9%) | 58 (10.1%) |
| 6:30 AM to 6:59 AM | 0 (0.0%) | 6 (1.1%) |
| 7:00 AM to 7:29 AM | 54 (8.0%) | 78 (13.6%) |
| 7:30 AM to 7:59 AM | 0 (0.0%) | 47 (8.2%) |
| 8:00 AM to 8:29 AM | 49 (7.3%) | 58 (10.1%) |
| 8:30 AM to 8:59 AM | 0 (0.0%) | 0 (0.0%) |
| 9:00 AM to 9:59 AM | 85 (12.6%) | 47 (8.2%) |
| 10:00 AM to 10:59 AM | 0 (0.0%) | 0 (0.0%) |
| 11:00 AM to 11:59 AM | 0 (0.0%) | 0 (0.0%) |
| 12:00 PM to 3:59 PM | 0 (0.0%) | 13 (2.3%) |
| 4:00 PM to 11:59 PM | 217 (32.2%) | 200 (34.9%) |
| Total | 675 (100.0%) | 573 (100.0%) |
Housing Occupancy in Pixley
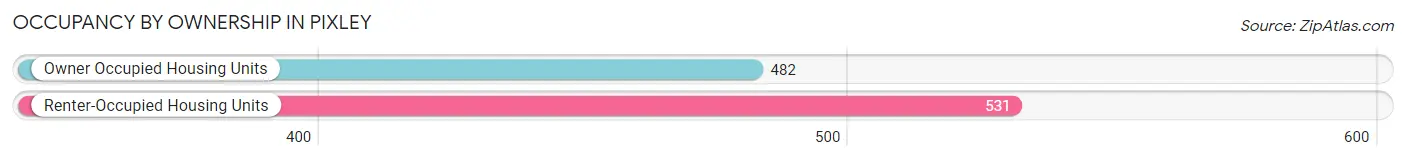
Occupancy by Ownership in Pixley
Of the total 1,013 dwellings in Pixley, owner-occupied units account for 482 (47.6%), while renter-occupied units make up 531 (52.4%).
| Occupancy | # Housing Units | % Housing Units |
| Owner Occupied Housing Units | 482 | 47.6% |
| Renter-Occupied Housing Units | 531 | 52.4% |
| Total Occupied Housing Units | 1,013 | 100.0% |
Occupancy by Household Size in Pixley
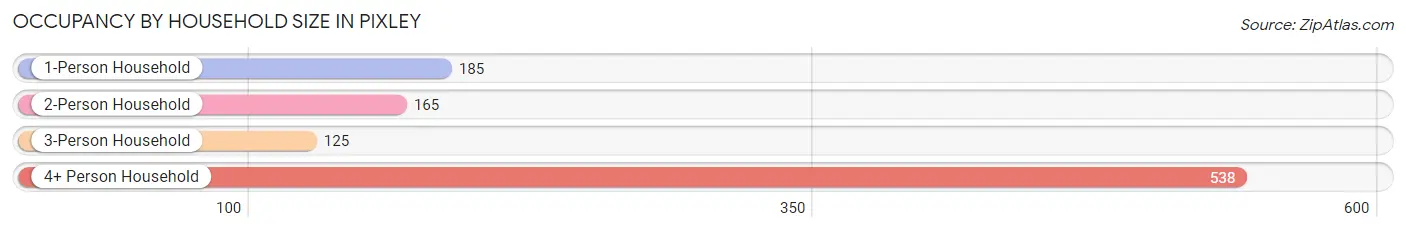
| Household Size | # Housing Units | % Housing Units |
| 1-Person Household | 185 | 18.3% |
| 2-Person Household | 165 | 16.3% |
| 3-Person Household | 125 | 12.3% |
| 4+ Person Household | 538 | 53.1% |
| Total Housing Units | 1,013 | 100.0% |
Occupancy by Ownership by Household Size in Pixley
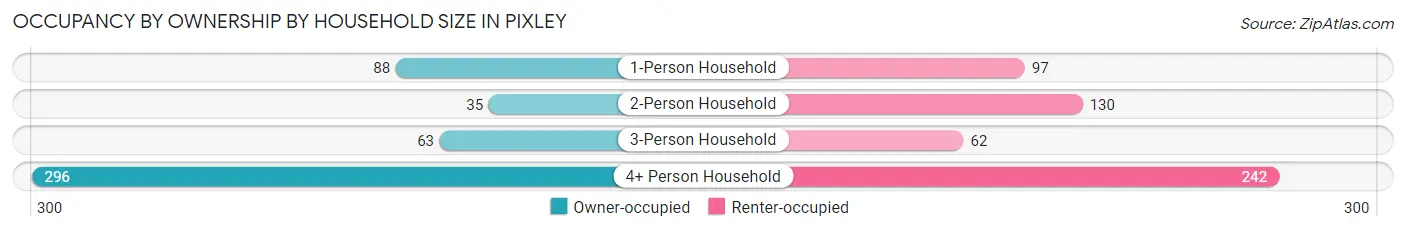
| Household Size | Owner-occupied | Renter-occupied |
| 1-Person Household | 88 (47.6%) | 97 (52.4%) |
| 2-Person Household | 35 (21.2%) | 130 (78.8%) |
| 3-Person Household | 63 (50.4%) | 62 (49.6%) |
| 4+ Person Household | 296 (55.0%) | 242 (45.0%) |
| Total Housing Units | 482 (47.6%) | 531 (52.4%) |
Occupancy by Educational Attainment in Pixley
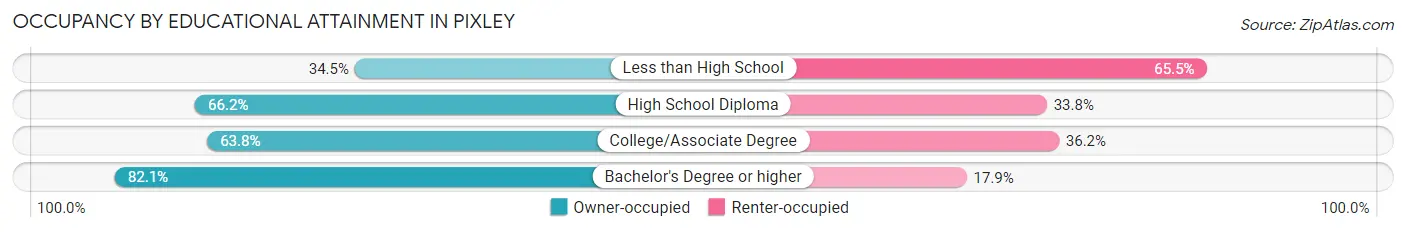
| Household Size | Owner-occupied | Renter-occupied |
| Less than High School | 212 (34.5%) | 402 (65.5%) |
| High School Diploma | 90 (66.2%) | 46 (33.8%) |
| College/Associate Degree | 125 (63.8%) | 71 (36.2%) |
| Bachelor's Degree or higher | 55 (82.1%) | 12 (17.9%) |
Occupancy by Age of Householder in Pixley
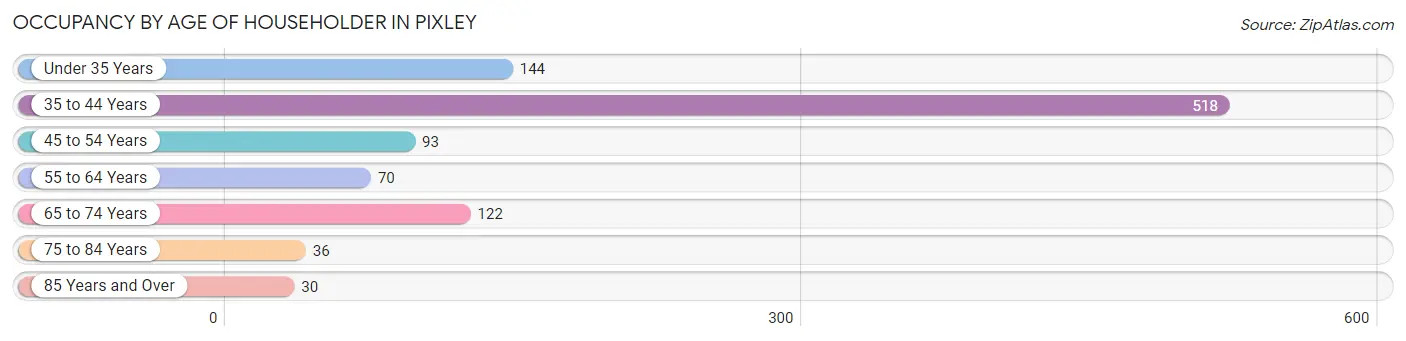
| Age Bracket | # Households | % Households |
| Under 35 Years | 144 | 14.2% |
| 35 to 44 Years | 518 | 51.1% |
| 45 to 54 Years | 93 | 9.2% |
| 55 to 64 Years | 70 | 6.9% |
| 65 to 74 Years | 122 | 12.0% |
| 75 to 84 Years | 36 | 3.5% |
| 85 Years and Over | 30 | 3.0% |
| Total | 1,013 | 100.0% |
Housing Finances in Pixley
Median Income by Occupancy in Pixley
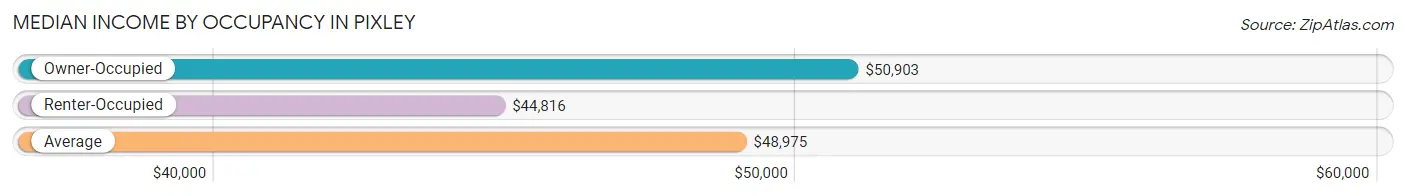
| Occupancy Type | # Households | Median Income |
| Owner-Occupied | 482 (47.6%) | $50,903 |
| Renter-Occupied | 531 (52.4%) | $44,816 |
| Average | 1,013 (100.0%) | $48,975 |
Occupancy by Householder Income Bracket in Pixley
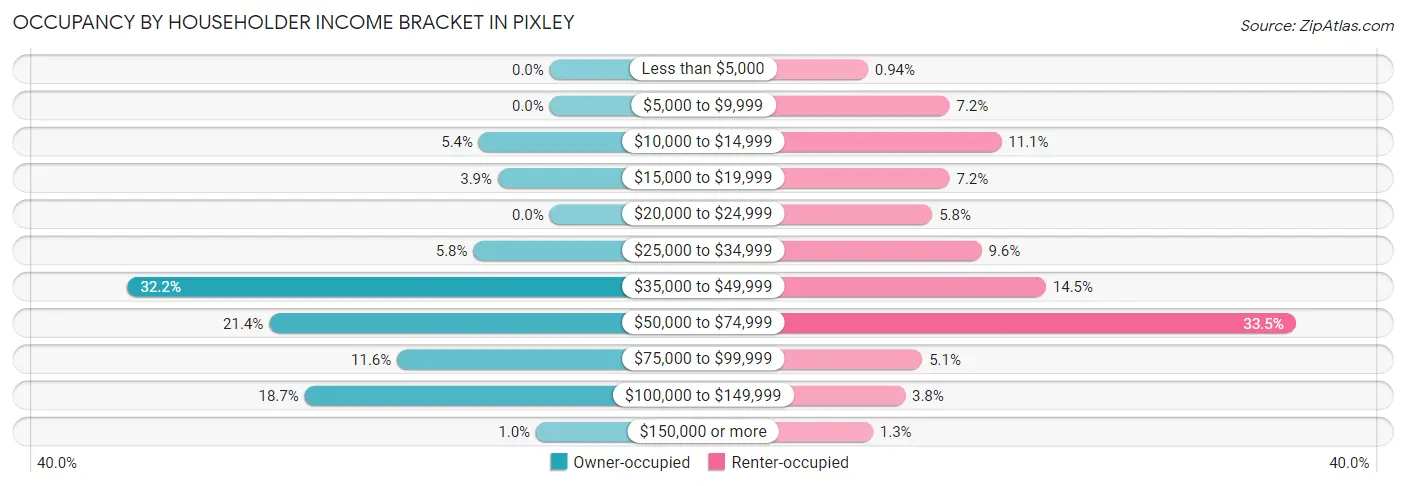
| Income Bracket | Owner-occupied | Renter-occupied |
| Less than $5,000 | 0 (0.0%) | 5 (0.9%) |
| $5,000 to $9,999 | 0 (0.0%) | 38 (7.2%) |
| $10,000 to $14,999 | 26 (5.4%) | 59 (11.1%) |
| $15,000 to $19,999 | 19 (3.9%) | 38 (7.2%) |
| $20,000 to $24,999 | 0 (0.0%) | 31 (5.8%) |
| $25,000 to $34,999 | 28 (5.8%) | 51 (9.6%) |
| $35,000 to $49,999 | 155 (32.2%) | 77 (14.5%) |
| $50,000 to $74,999 | 103 (21.4%) | 178 (33.5%) |
| $75,000 to $99,999 | 56 (11.6%) | 27 (5.1%) |
| $100,000 to $149,999 | 90 (18.7%) | 20 (3.8%) |
| $150,000 or more | 5 (1.0%) | 7 (1.3%) |
| Total | 482 (100.0%) | 531 (100.0%) |
Monthly Housing Cost Tiers in Pixley
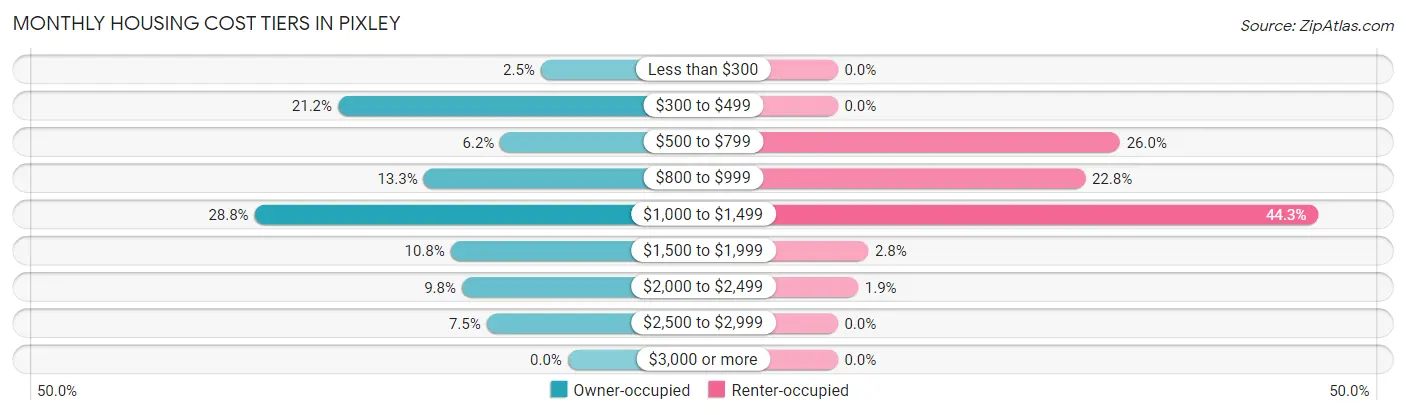
| Monthly Cost | Owner-occupied | Renter-occupied |
| Less than $300 | 12 (2.5%) | 0 (0.0%) |
| $300 to $499 | 102 (21.2%) | 0 (0.0%) |
| $500 to $799 | 30 (6.2%) | 138 (26.0%) |
| $800 to $999 | 64 (13.3%) | 121 (22.8%) |
| $1,000 to $1,499 | 139 (28.8%) | 235 (44.3%) |
| $1,500 to $1,999 | 52 (10.8%) | 15 (2.8%) |
| $2,000 to $2,499 | 47 (9.8%) | 10 (1.9%) |
| $2,500 to $2,999 | 36 (7.5%) | 0 (0.0%) |
| $3,000 or more | 0 (0.0%) | 0 (0.0%) |
| Total | 482 (100.0%) | 531 (100.0%) |
Physical Housing Characteristics in Pixley
Housing Structures in Pixley
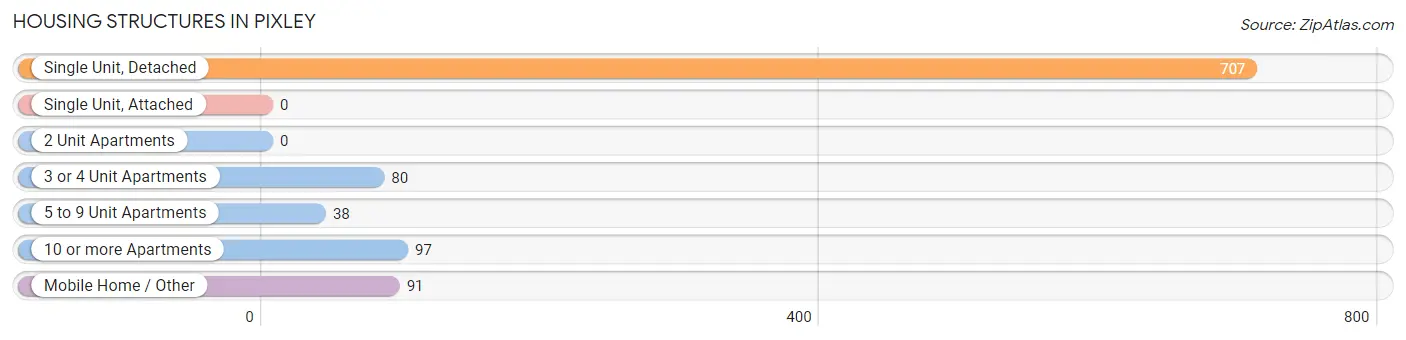
| Structure Type | # Housing Units | % Housing Units |
| Single Unit, Detached | 707 | 69.8% |
| Single Unit, Attached | 0 | 0.0% |
| 2 Unit Apartments | 0 | 0.0% |
| 3 or 4 Unit Apartments | 80 | 7.9% |
| 5 to 9 Unit Apartments | 38 | 3.7% |
| 10 or more Apartments | 97 | 9.6% |
| Mobile Home / Other | 91 | 9.0% |
| Total | 1,013 | 100.0% |
Housing Structures by Occupancy in Pixley
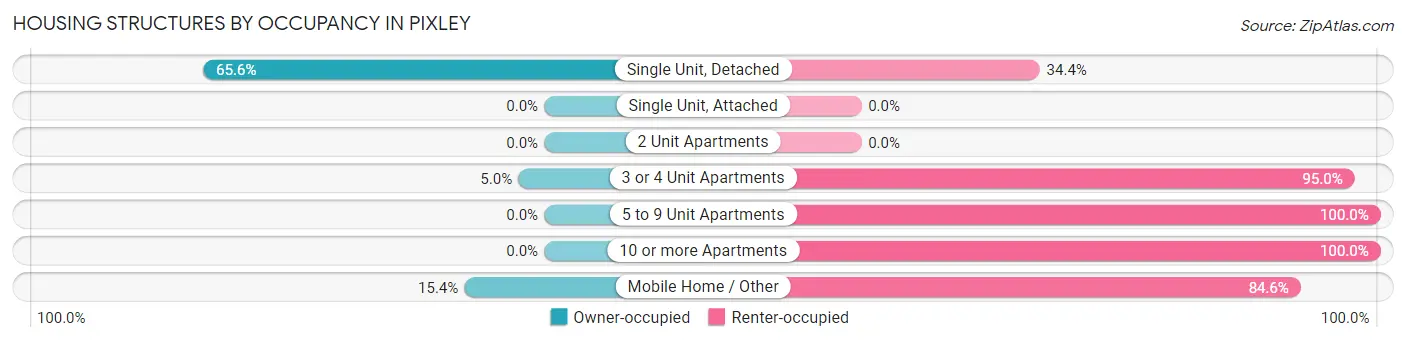
| Structure Type | Owner-occupied | Renter-occupied |
| Single Unit, Detached | 464 (65.6%) | 243 (34.4%) |
| Single Unit, Attached | 0 (0.0%) | 0 (0.0%) |
| 2 Unit Apartments | 0 (0.0%) | 0 (0.0%) |
| 3 or 4 Unit Apartments | 4 (5.0%) | 76 (95.0%) |
| 5 to 9 Unit Apartments | 0 (0.0%) | 38 (100.0%) |
| 10 or more Apartments | 0 (0.0%) | 97 (100.0%) |
| Mobile Home / Other | 14 (15.4%) | 77 (84.6%) |
| Total | 482 (47.6%) | 531 (52.4%) |
Housing Structures by Number of Rooms in Pixley
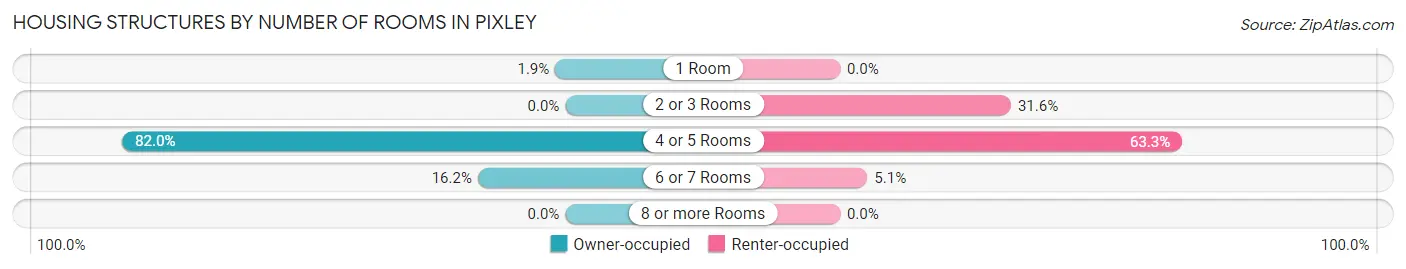
| Number of Rooms | Owner-occupied | Renter-occupied |
| 1 Room | 9 (1.9%) | 0 (0.0%) |
| 2 or 3 Rooms | 0 (0.0%) | 168 (31.6%) |
| 4 or 5 Rooms | 395 (82.0%) | 336 (63.3%) |
| 6 or 7 Rooms | 78 (16.2%) | 27 (5.1%) |
| 8 or more Rooms | 0 (0.0%) | 0 (0.0%) |
| Total | 482 (100.0%) | 531 (100.0%) |
Housing Structure by Heating Type in Pixley
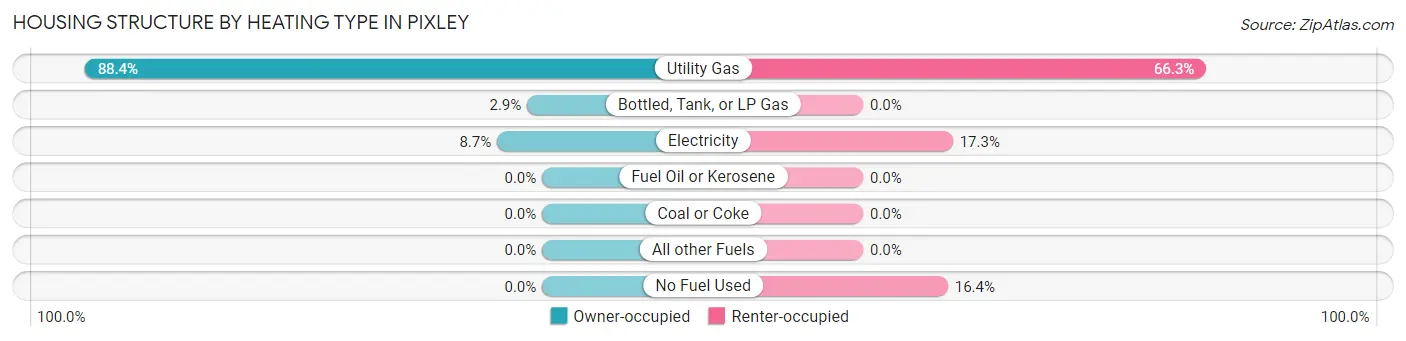
| Heating Type | Owner-occupied | Renter-occupied |
| Utility Gas | 426 (88.4%) | 352 (66.3%) |
| Bottled, Tank, or LP Gas | 14 (2.9%) | 0 (0.0%) |
| Electricity | 42 (8.7%) | 92 (17.3%) |
| Fuel Oil or Kerosene | 0 (0.0%) | 0 (0.0%) |
| Coal or Coke | 0 (0.0%) | 0 (0.0%) |
| All other Fuels | 0 (0.0%) | 0 (0.0%) |
| No Fuel Used | 0 (0.0%) | 87 (16.4%) |
| Total | 482 (100.0%) | 531 (100.0%) |
Household Vehicle Usage in Pixley
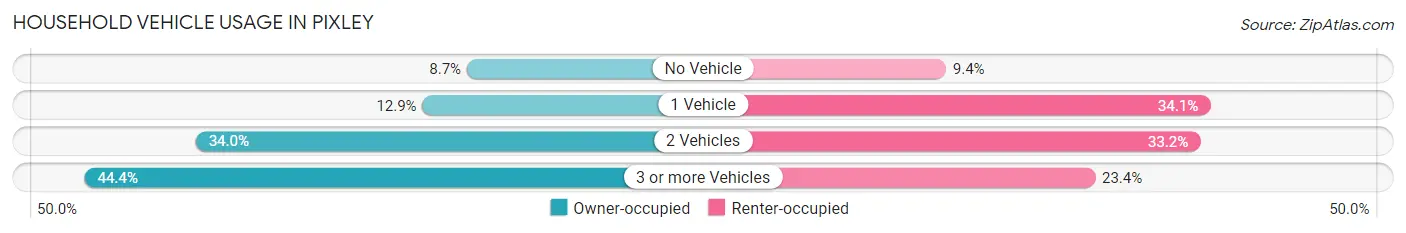
| Vehicles per Household | Owner-occupied | Renter-occupied |
| No Vehicle | 42 (8.7%) | 50 (9.4%) |
| 1 Vehicle | 62 (12.9%) | 181 (34.1%) |
| 2 Vehicles | 164 (34.0%) | 176 (33.2%) |
| 3 or more Vehicles | 214 (44.4%) | 124 (23.4%) |
| Total | 482 (100.0%) | 531 (100.0%) |
Real Estate & Mortgages in Pixley
Real Estate and Mortgage Overview in Pixley
| Characteristic | Without Mortgage | With Mortgage |
| Housing Units | 149 | 333 |
| Median Property Value | $93,900 | $207,700 |
| Median Household Income | $70,919 | $0 |
| Monthly Housing Costs | $442 | $0 |
| Real Estate Taxes | $1,151 | $21 |
Property Value by Mortgage Status in Pixley
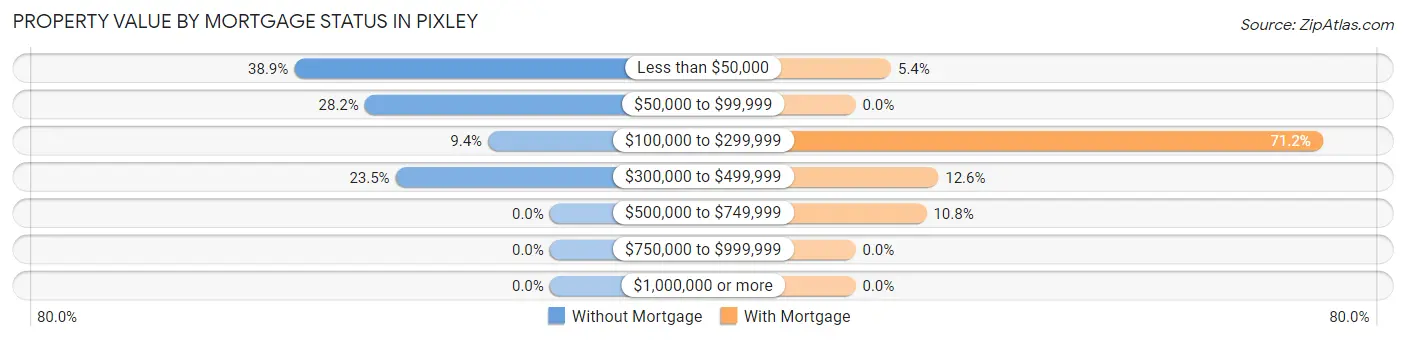
| Property Value | Without Mortgage | With Mortgage |
| Less than $50,000 | 58 (38.9%) | 18 (5.4%) |
| $50,000 to $99,999 | 42 (28.2%) | 0 (0.0%) |
| $100,000 to $299,999 | 14 (9.4%) | 237 (71.2%) |
| $300,000 to $499,999 | 35 (23.5%) | 42 (12.6%) |
| $500,000 to $749,999 | 0 (0.0%) | 36 (10.8%) |
| $750,000 to $999,999 | 0 (0.0%) | 0 (0.0%) |
| $1,000,000 or more | 0 (0.0%) | 0 (0.0%) |
| Total | 149 (100.0%) | 333 (100.0%) |
Household Income by Mortgage Status in Pixley
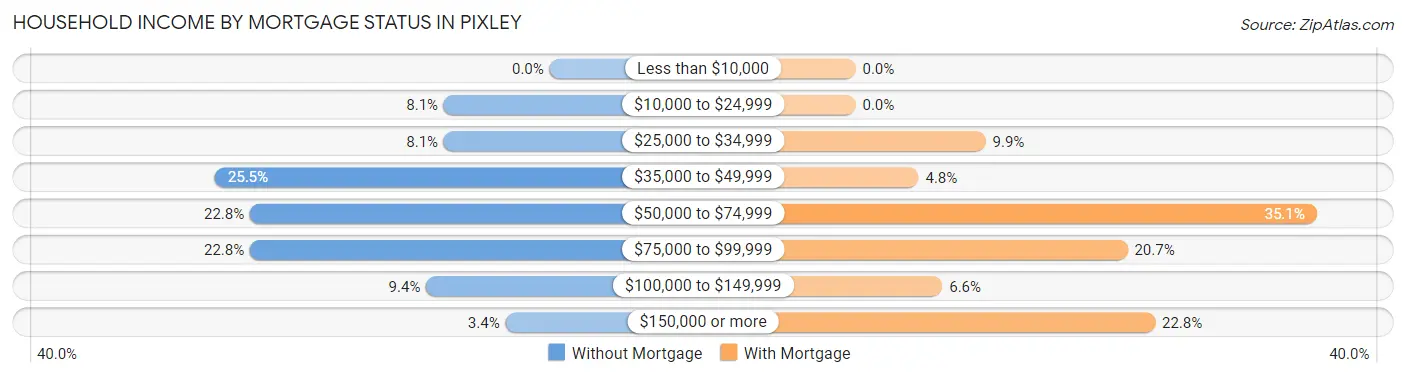
| Household Income | Without Mortgage | With Mortgage |
| Less than $10,000 | 0 (0.0%) | 0 (0.0%) |
| $10,000 to $24,999 | 12 (8.1%) | 0 (0.0%) |
| $25,000 to $34,999 | 12 (8.1%) | 33 (9.9%) |
| $35,000 to $49,999 | 38 (25.5%) | 16 (4.8%) |
| $50,000 to $74,999 | 34 (22.8%) | 117 (35.1%) |
| $75,000 to $99,999 | 34 (22.8%) | 69 (20.7%) |
| $100,000 to $149,999 | 14 (9.4%) | 22 (6.6%) |
| $150,000 or more | 5 (3.4%) | 76 (22.8%) |
| Total | 149 (100.0%) | 333 (100.0%) |
Property Value to Household Income Ratio in Pixley
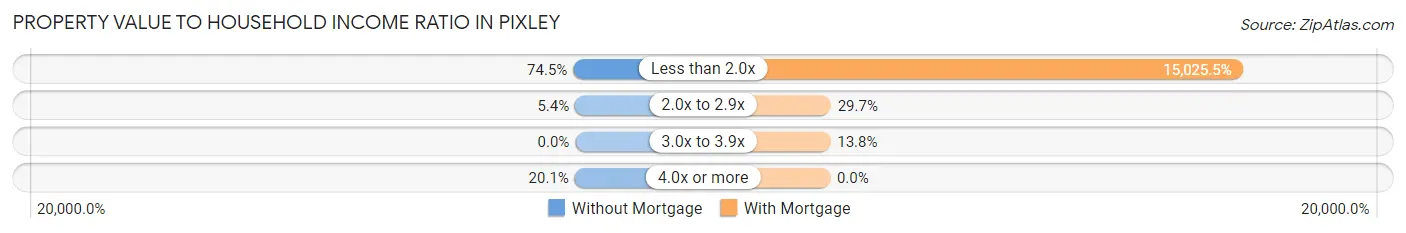
| Value-to-Income Ratio | Without Mortgage | With Mortgage |
| Less than 2.0x | 111 (74.5%) | 50,035 (15,025.5%) |
| 2.0x to 2.9x | 8 (5.4%) | 99 (29.7%) |
| 3.0x to 3.9x | 0 (0.0%) | 46 (13.8%) |
| 4.0x or more | 30 (20.1%) | 0 (0.0%) |
| Total | 149 (100.0%) | 333 (100.0%) |
Real Estate Taxes by Mortgage Status in Pixley
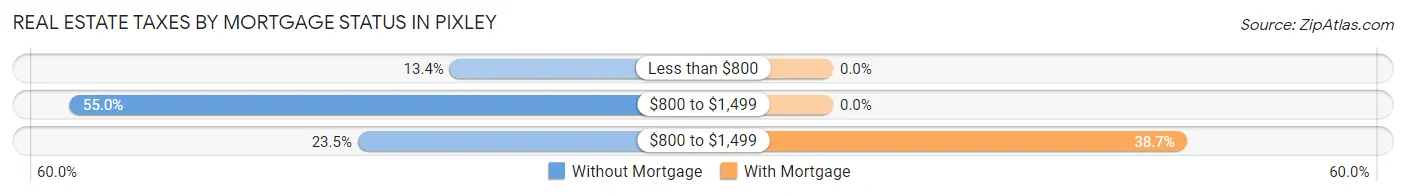
| Property Taxes | Without Mortgage | With Mortgage |
| Less than $800 | 20 (13.4%) | 0 (0.0%) |
| $800 to $1,499 | 82 (55.0%) | 0 (0.0%) |
| $800 to $1,499 | 35 (23.5%) | 129 (38.7%) |
| Total | 149 (100.0%) | 333 (100.0%) |
Health & Disability in Pixley
Health Insurance Coverage by Age in Pixley
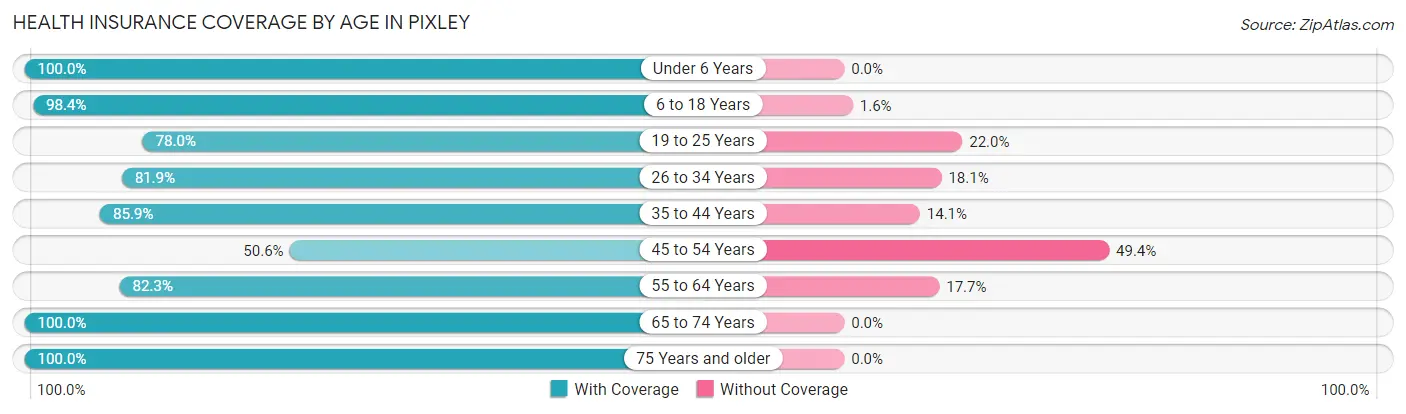
| Age Bracket | With Coverage | Without Coverage |
| Under 6 Years | 248 (100.0%) | 0 (0.0%) |
| 6 to 18 Years | 1,178 (98.4%) | 19 (1.6%) |
| 19 to 25 Years | 333 (78.0%) | 94 (22.0%) |
| 26 to 34 Years | 235 (81.9%) | 52 (18.1%) |
| 35 to 44 Years | 750 (85.9%) | 123 (14.1%) |
| 45 to 54 Years | 123 (50.6%) | 120 (49.4%) |
| 55 to 64 Years | 158 (82.3%) | 34 (17.7%) |
| 65 to 74 Years | 176 (100.0%) | 0 (0.0%) |
| 75 Years and older | 168 (100.0%) | 0 (0.0%) |
| Total | 3,369 (88.4%) | 442 (11.6%) |
Health Insurance Coverage by Citizenship Status in Pixley
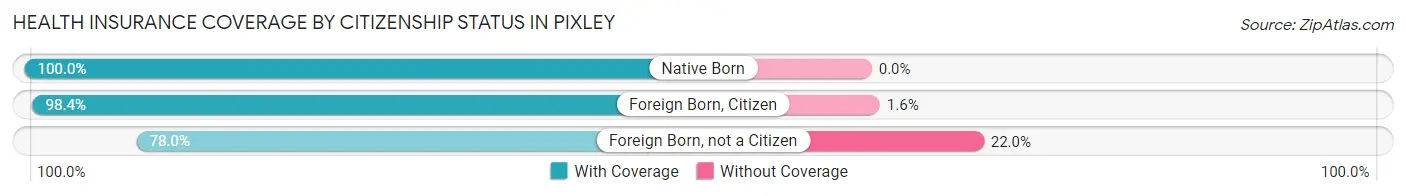
| Citizenship Status | With Coverage | Without Coverage |
| Native Born | 248 (100.0%) | 0 (0.0%) |
| Foreign Born, Citizen | 1,178 (98.4%) | 19 (1.6%) |
| Foreign Born, not a Citizen | 333 (78.0%) | 94 (22.0%) |
Health Insurance Coverage by Household Income in Pixley
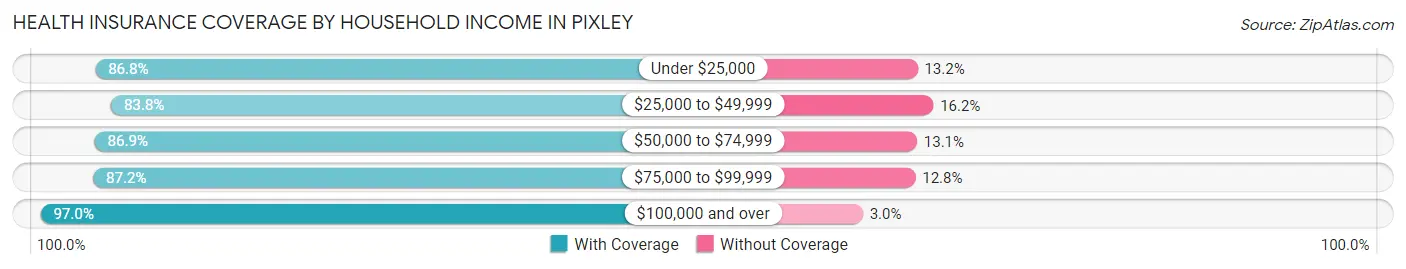
| Household Income | With Coverage | Without Coverage |
| Under $25,000 | 472 (86.8%) | 72 (13.2%) |
| $25,000 to $49,999 | 756 (83.8%) | 146 (16.2%) |
| $50,000 to $74,999 | 1,032 (86.9%) | 156 (13.1%) |
| $75,000 to $99,999 | 292 (87.2%) | 43 (12.8%) |
| $100,000 and over | 813 (97.0%) | 25 (3.0%) |
Public vs Private Health Insurance Coverage by Age in Pixley
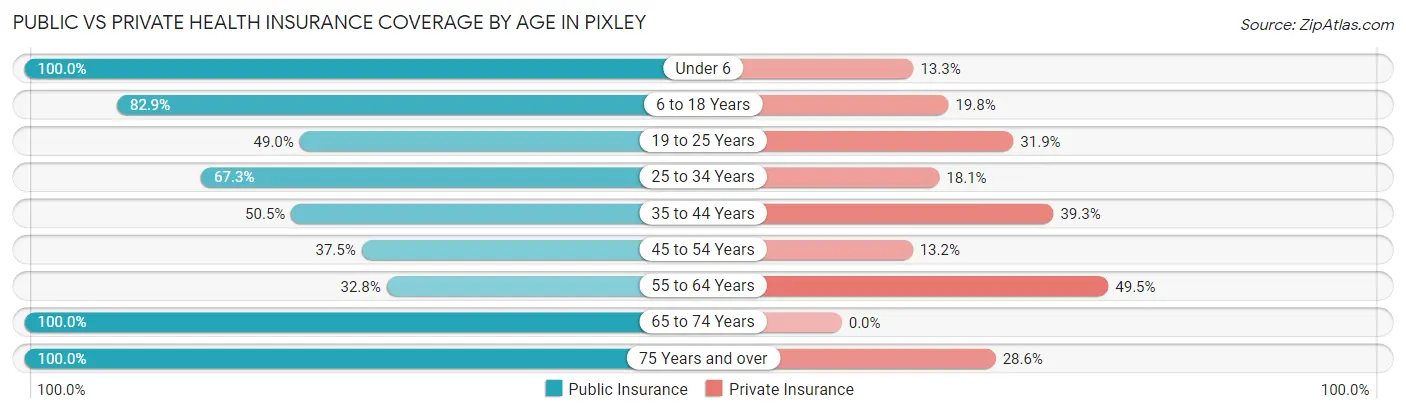
| Age Bracket | Public Insurance | Private Insurance |
| Under 6 | 248 (100.0%) | 33 (13.3%) |
| 6 to 18 Years | 992 (82.9%) | 237 (19.8%) |
| 19 to 25 Years | 209 (48.9%) | 136 (31.9%) |
| 25 to 34 Years | 193 (67.2%) | 52 (18.1%) |
| 35 to 44 Years | 441 (50.5%) | 343 (39.3%) |
| 45 to 54 Years | 91 (37.4%) | 32 (13.2%) |
| 55 to 64 Years | 63 (32.8%) | 95 (49.5%) |
| 65 to 74 Years | 176 (100.0%) | 0 (0.0%) |
| 75 Years and over | 168 (100.0%) | 48 (28.6%) |
| Total | 2,581 (67.7%) | 976 (25.6%) |
Disability Status by Sex by Age in Pixley
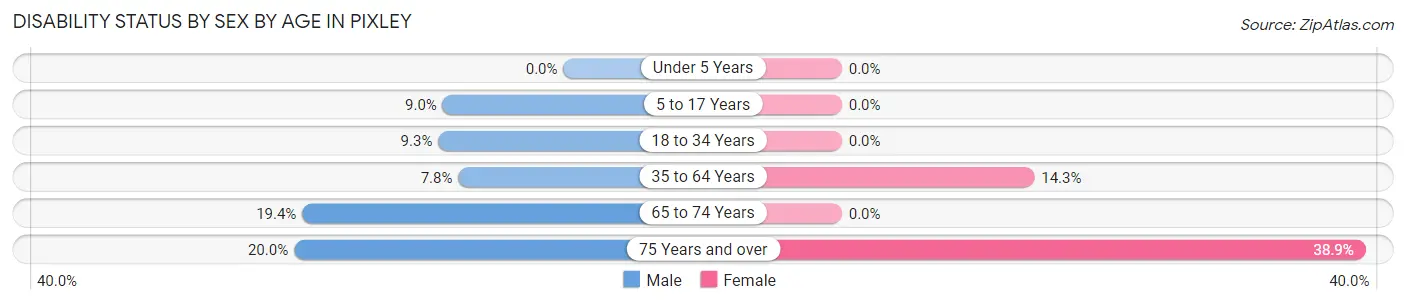
| Age Bracket | Male | Female |
| Under 5 Years | 0 (0.0%) | 0 (0.0%) |
| 5 to 17 Years | 57 (9.0%) | 0 (0.0%) |
| 18 to 34 Years | 30 (9.3%) | 0 (0.0%) |
| 35 to 64 Years | 54 (7.8%) | 88 (14.3%) |
| 65 to 74 Years | 19 (19.4%) | 0 (0.0%) |
| 75 Years and over | 12 (20.0%) | 42 (38.9%) |
Disability Class by Sex by Age in Pixley
Disability Class: Hearing Difficulty
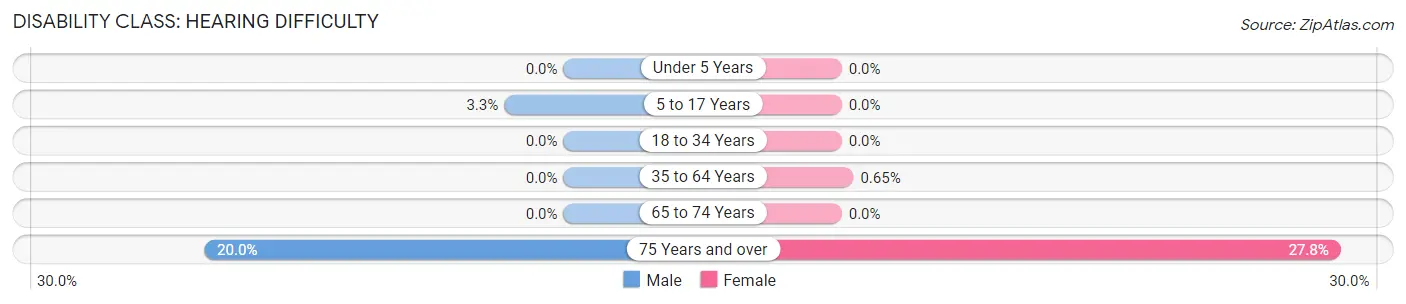
| Age Bracket | Male | Female |
| Under 5 Years | 0 (0.0%) | 0 (0.0%) |
| 5 to 17 Years | 21 (3.3%) | 0 (0.0%) |
| 18 to 34 Years | 0 (0.0%) | 0 (0.0%) |
| 35 to 64 Years | 0 (0.0%) | 4 (0.6%) |
| 65 to 74 Years | 0 (0.0%) | 0 (0.0%) |
| 75 Years and over | 12 (20.0%) | 30 (27.8%) |
Disability Class: Vision Difficulty
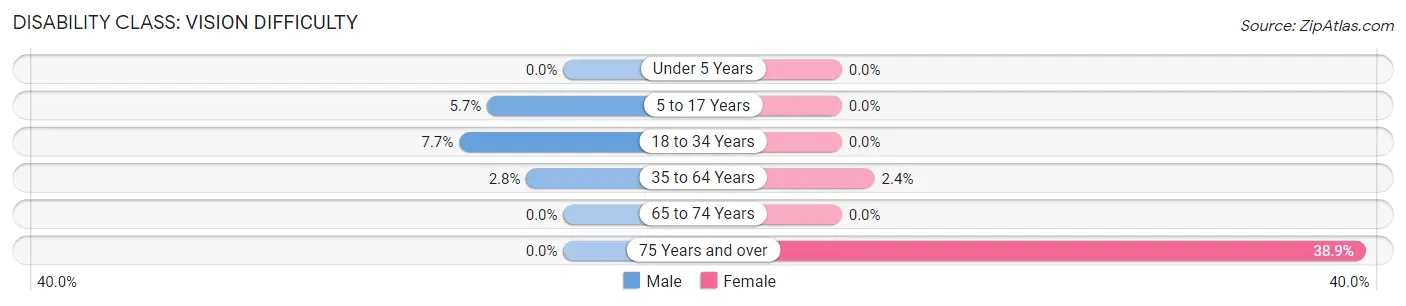
| Age Bracket | Male | Female |
| Under 5 Years | 0 (0.0%) | 0 (0.0%) |
| 5 to 17 Years | 36 (5.7%) | 0 (0.0%) |
| 18 to 34 Years | 25 (7.7%) | 0 (0.0%) |
| 35 to 64 Years | 19 (2.8%) | 15 (2.4%) |
| 65 to 74 Years | 0 (0.0%) | 0 (0.0%) |
| 75 Years and over | 0 (0.0%) | 42 (38.9%) |
Disability Class: Cognitive Difficulty
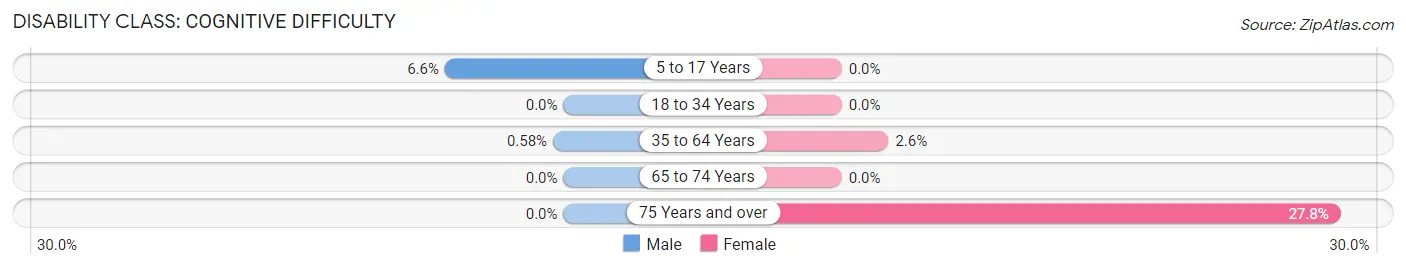
| Age Bracket | Male | Female |
| 5 to 17 Years | 42 (6.6%) | 0 (0.0%) |
| 18 to 34 Years | 0 (0.0%) | 0 (0.0%) |
| 35 to 64 Years | 4 (0.6%) | 16 (2.6%) |
| 65 to 74 Years | 0 (0.0%) | 0 (0.0%) |
| 75 Years and over | 0 (0.0%) | 30 (27.8%) |
Disability Class: Ambulatory Difficulty
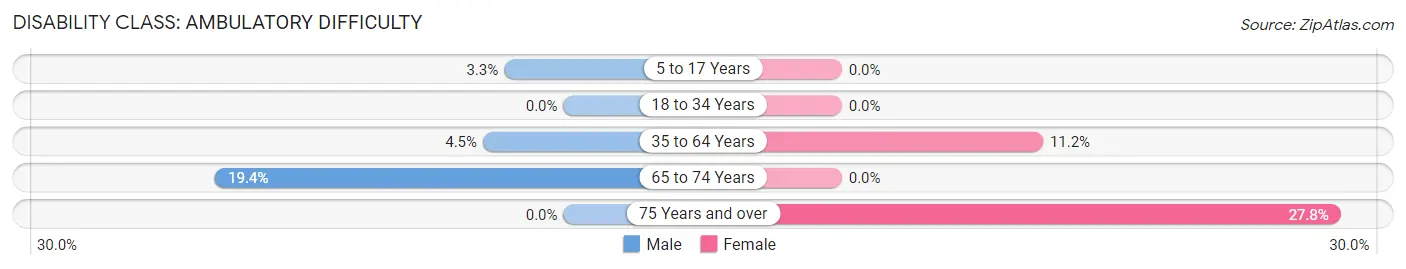
| Age Bracket | Male | Female |
| 5 to 17 Years | 21 (3.3%) | 0 (0.0%) |
| 18 to 34 Years | 0 (0.0%) | 0 (0.0%) |
| 35 to 64 Years | 31 (4.5%) | 69 (11.2%) |
| 65 to 74 Years | 19 (19.4%) | 0 (0.0%) |
| 75 Years and over | 0 (0.0%) | 30 (27.8%) |
Disability Class: Self-Care Difficulty
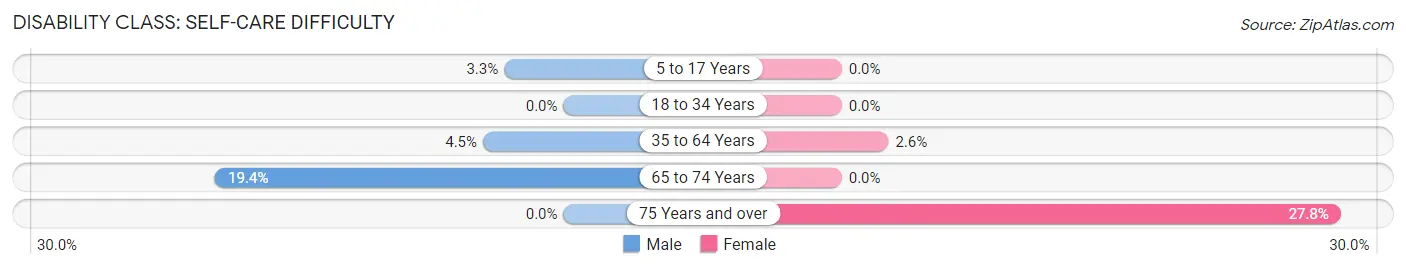
| Age Bracket | Male | Female |
| 5 to 17 Years | 21 (3.3%) | 0 (0.0%) |
| 18 to 34 Years | 0 (0.0%) | 0 (0.0%) |
| 35 to 64 Years | 31 (4.5%) | 16 (2.6%) |
| 65 to 74 Years | 19 (19.4%) | 0 (0.0%) |
| 75 Years and over | 0 (0.0%) | 30 (27.8%) |
Technology Access in Pixley
Computing Device Access in Pixley
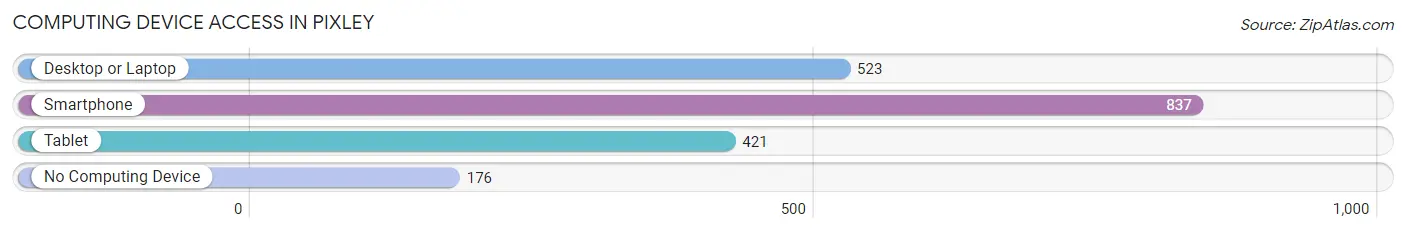
| Device Type | # Households | % Households |
| Desktop or Laptop | 523 | 51.6% |
| Smartphone | 837 | 82.6% |
| Tablet | 421 | 41.6% |
| No Computing Device | 176 | 17.4% |
| Total | 1,013 | 100.0% |
Internet Access in Pixley
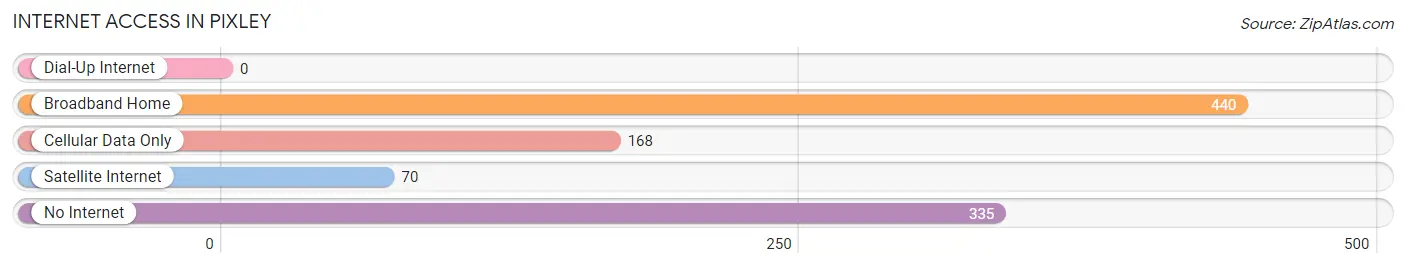
| Internet Type | # Households | % Households |
| Dial-Up Internet | 0 | 0.0% |
| Broadband Home | 440 | 43.4% |
| Cellular Data Only | 168 | 16.6% |
| Satellite Internet | 70 | 6.9% |
| No Internet | 335 | 33.1% |
| Total | 1,013 | 100.0% |
Pixley Summary
Pixley is a small town located in the San Joaquin Valley of California, approximately 20 miles south of the city of Visalia. The town was founded in 1884 by William Pixley, a rancher and businessman from the Midwest. The town was named after him and has since grown to a population of approximately 2,000 people.
Geography
Pixley is located in the San Joaquin Valley of California, approximately 20 miles south of the city of Visalia. The town is situated on the banks of the Tule River, which flows through the valley. The town is surrounded by rolling hills and farmland, and is located in the heart of the Central Valley. The climate in Pixley is generally mild, with temperatures ranging from the mid-50s in the winter to the mid-90s in the summer.
Economy
The economy of Pixley is largely based on agriculture. The town is home to a number of farms and ranches, which produce a variety of crops, including almonds, grapes, and cotton. The town is also home to a number of small businesses, including restaurants, shops, and other services.
Demographics
As of the 2010 census, the population of Pixley was 2,000. The racial makeup of the town was 65.2% White, 0.7% African American, 0.3% Native American, 0.2% Asian, 0.1% Pacific Islander, 30.2% from other races, and 3.4% from two or more races. The median household income in Pixley was $37,500, and the median family income was $41,250.
History
Pixley was founded in 1884 by William Pixley, a rancher and businessman from the Midwest. The town was named after him and has since grown to a population of approximately 2,000 people. The town was originally a small farming community, but has since grown to include a variety of businesses and services. In the early 1900s, the town was home to a number of saloons and gambling halls, which were eventually shut down by the state. In the 1950s, the town was home to a number of oil wells, which provided jobs and income for the town. In the late 1970s, the town was home to a number of migrant workers, who worked in the fields and orchards of the area. Today, Pixley is a small, quiet town, with a population of approximately 2,000 people.
Common Questions
What is Per Capita Income in Pixley?
Per Capita income in Pixley is $16,291.
What is the Median Family Income in Pixley?
Median Family Income in Pixley is $49,271.
What is the Median Household income in Pixley?
Median Household Income in Pixley is $48,975.
What is Income or Wage Gap in Pixley?
Income or Wage Gap in Pixley is 46.9%.
Women in Pixley earn 53.1 cents for every dollar earned by a man.
What is Inequality or Gini Index in Pixley?
Inequality or Gini Index in Pixley is 0.38.
What is the Total Population of Pixley?
Total Population of Pixley is 3,811.
What is the Total Male Population of Pixley?
Total Male Population of Pixley is 1,973.
What is the Total Female Population of Pixley?
Total Female Population of Pixley is 1,838.
What is the Ratio of Males per 100 Females in Pixley?
There are 107.34 Males per 100 Females in Pixley.
What is the Ratio of Females per 100 Males in Pixley?
There are 93.16 Females per 100 Males in Pixley.
What is the Median Population Age in Pixley?
Median Population Age in Pixley is 26.9 Years.
What is the Average Family Size in Pixley
Average Family Size in Pixley is 4.0 People.
What is the Average Household Size in Pixley
Average Household Size in Pixley is 3.8 People.
How Large is the Labor Force in Pixley?
There are 1,524 People in the Labor Forcein in Pixley.
What is the Percentage of People in the Labor Force in Pixley?
55.2% of People are in the Labor Force in Pixley.
What is the Unemployment Rate in Pixley?
Unemployment Rate in Pixley is 13.8%.