Pine Valley, CA Map & Demographics
Pine Valley Map
Pine Valley Overview
$43,775
PER CAPITA INCOME
$119,098
AVG FAMILY INCOME
$116,477
AVG HOUSEHOLD INCOME
67.8%
WAGE / INCOME GAP [ % ]
32.2¢/ $1
WAGE / INCOME GAP [ $ ]
0.33
INEQUALITY / GINI INDEX
1,778
TOTAL POPULATION
933
MALE POPULATION
845
FEMALE POPULATION
110.41
MALES / 100 FEMALES
90.57
FEMALES / 100 MALES
37.1
MEDIAN AGE
3.1
AVG FAMILY SIZE
2.7
AVG HOUSEHOLD SIZE
906
LABOR FORCE [ PEOPLE ]
65.0%
PERCENT IN LABOR FORCE
35.0%
UNEMPLOYMENT RATE
Pine Valley Zip Codes
Pine Valley Area Codes
Income in Pine Valley
Income Overview in Pine Valley
Per Capita Income in Pine Valley is $43,775, while median incomes of families and households are $119,098 and $116,477 respectively.
| Characteristic | Number | Measure |
| Per Capita Income | 1,778 | $43,775 |
| Median Family Income | 500 | $119,098 |
| Mean Family Income | 500 | $125,299 |
| Median Household Income | 665 | $116,477 |
| Mean Household Income | 665 | $116,974 |
| Income Deficit | 500 | $0 |
| Wage / Income Gap (%) | 1,778 | 67.75% |
| Wage / Income Gap ($) | 1,778 | 32.25¢ per $1 |
| Gini / Inequality Index | 1,778 | 0.33 |
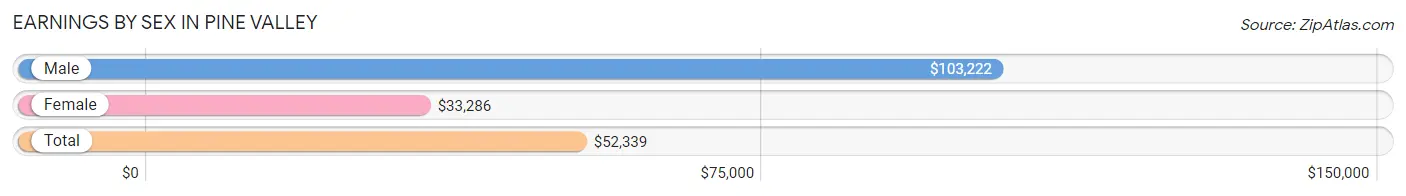
Earnings by Sex in Pine Valley
Average Earnings in Pine Valley are $52,339, $103,222 for men and $33,286 for women, a difference of 67.7%.
| Sex | Number | Average Earnings |
| Male | 440 (53.7%) | $103,222 |
| Female | 380 (46.3%) | $33,286 |
| Total | 820 (100.0%) | $52,339 |
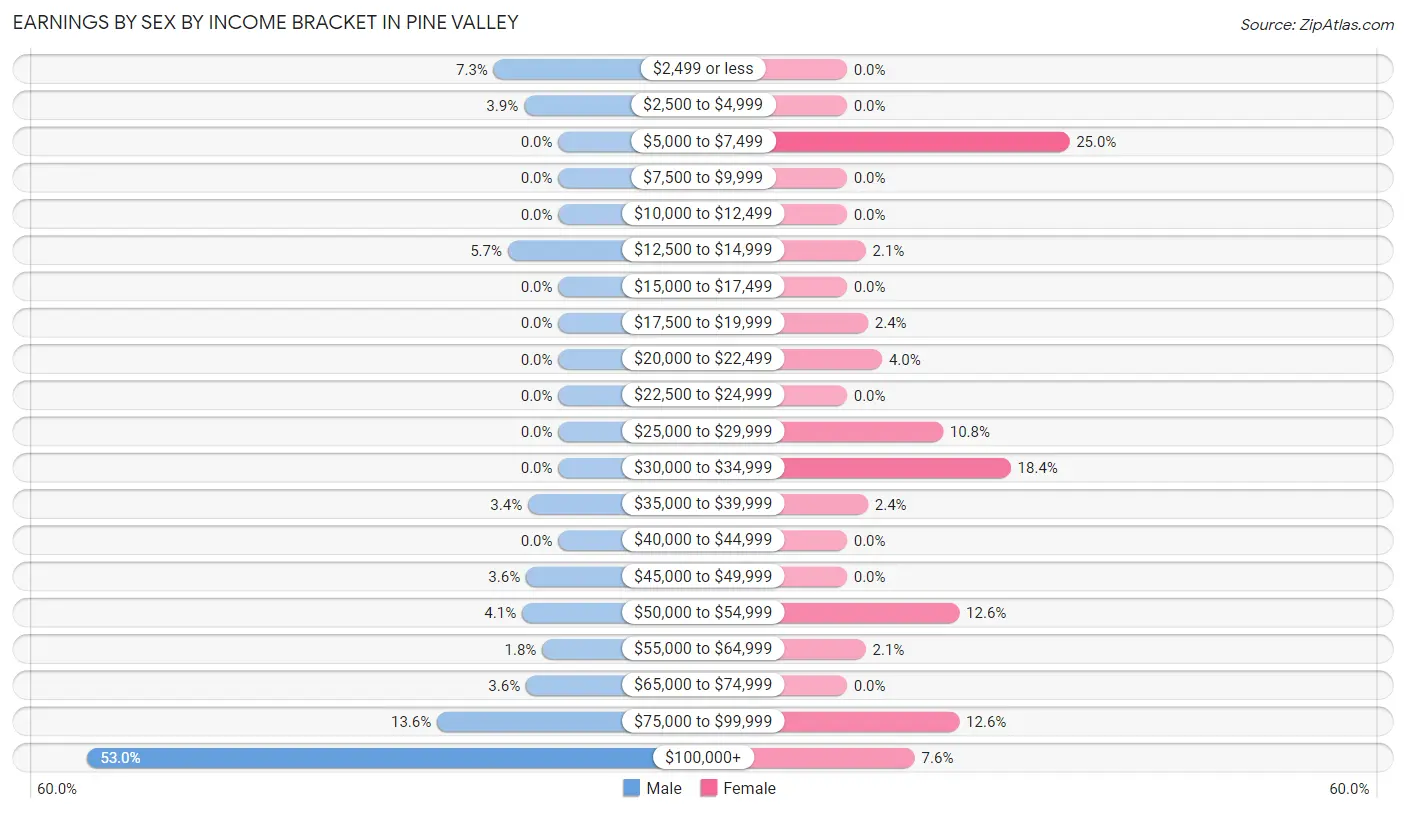
Earnings by Sex by Income Bracket in Pine Valley
The most common earnings brackets in Pine Valley are $100,000+ for men (233 | 52.9%) and $5,000 to $7,499 for women (95 | 25.0%).
| Income | Male | Female |
| $2,499 or less | 32 (7.3%) | 0 (0.0%) |
| $2,500 to $4,999 | 17 (3.9%) | 0 (0.0%) |
| $5,000 to $7,499 | 0 (0.0%) | 95 (25.0%) |
| $7,500 to $9,999 | 0 (0.0%) | 0 (0.0%) |
| $10,000 to $12,499 | 0 (0.0%) | 0 (0.0%) |
| $12,500 to $14,999 | 25 (5.7%) | 8 (2.1%) |
| $15,000 to $17,499 | 0 (0.0%) | 0 (0.0%) |
| $17,500 to $19,999 | 0 (0.0%) | 9 (2.4%) |
| $20,000 to $22,499 | 0 (0.0%) | 15 (4.0%) |
| $22,500 to $24,999 | 0 (0.0%) | 0 (0.0%) |
| $25,000 to $29,999 | 0 (0.0%) | 41 (10.8%) |
| $30,000 to $34,999 | 0 (0.0%) | 70 (18.4%) |
| $35,000 to $39,999 | 15 (3.4%) | 9 (2.4%) |
| $40,000 to $44,999 | 0 (0.0%) | 0 (0.0%) |
| $45,000 to $49,999 | 16 (3.6%) | 0 (0.0%) |
| $50,000 to $54,999 | 18 (4.1%) | 48 (12.6%) |
| $55,000 to $64,999 | 8 (1.8%) | 8 (2.1%) |
| $65,000 to $74,999 | 16 (3.6%) | 0 (0.0%) |
| $75,000 to $99,999 | 60 (13.6%) | 48 (12.6%) |
| $100,000+ | 233 (52.9%) | 29 (7.6%) |
| Total | 440 (100.0%) | 380 (100.0%) |
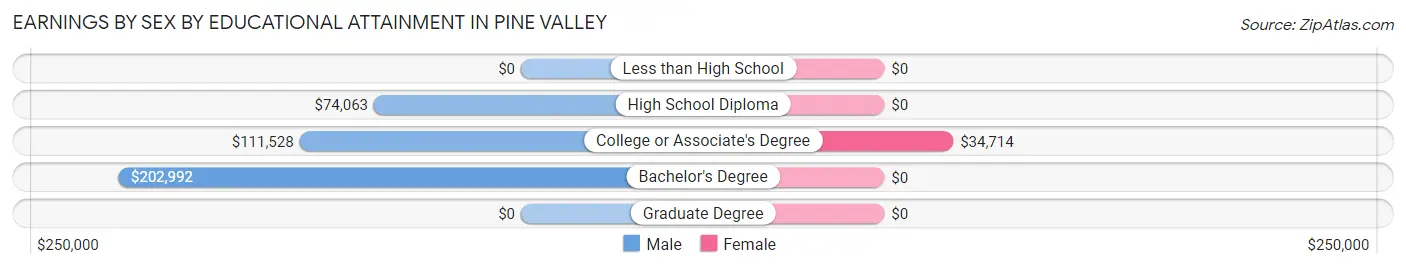
Earnings by Sex by Educational Attainment in Pine Valley
Average earnings in Pine Valley are $103,694 for men and $38,194 for women, a difference of 63.2%. Men with an educational attainment of bachelor's degree enjoy the highest average annual earnings of $202,992, while those with high school diploma education earn the least with $74,063. Women with an educational attainment of college or associate's degree earn the most with the average annual earnings of $34,714, while those with college or associate's degree education have the smallest earnings of $34,714.
| Educational Attainment | Male Income | Female Income |
| Less than High School | - | - |
| High School Diploma | $74,063 | $0 |
| College or Associate's Degree | $111,528 | $34,714 |
| Bachelor's Degree | $202,992 | $0 |
| Graduate Degree | - | - |
| Total | $103,694 | $38,194 |
Family Income in Pine Valley
Family Income Brackets in Pine Valley
According to the Pine Valley family income data, there are 157 families falling into the $100,000 to $149,999 income range, which is the most common income bracket and makes up 31.4% of all families.
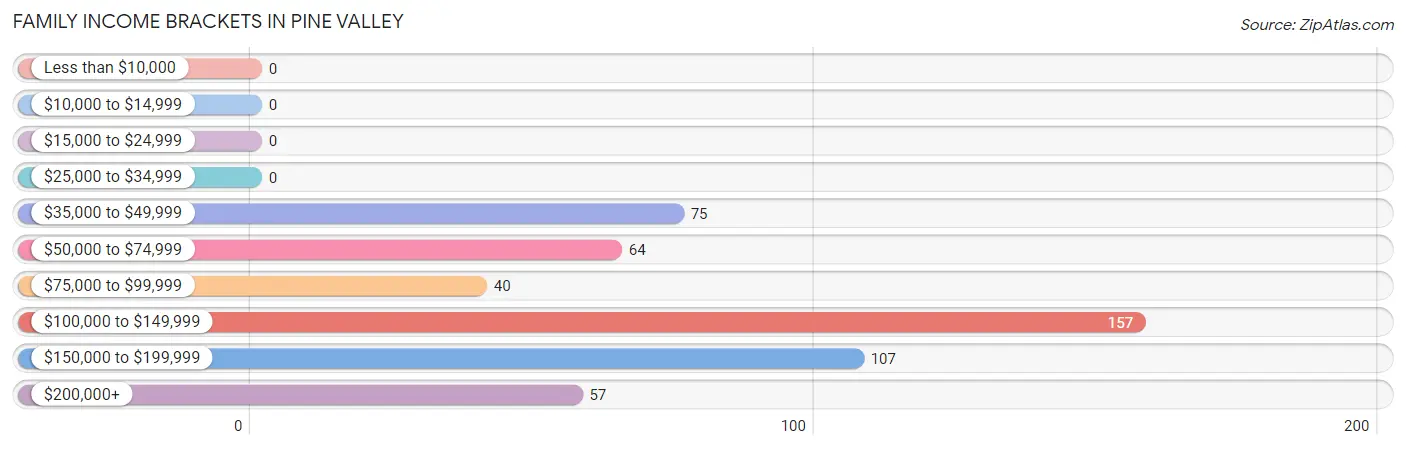
| Income Bracket | # Families | % Families |
| Less than $10,000 | 0 | 0.0% |
| $10,000 to $14,999 | 0 | 0.0% |
| $15,000 to $24,999 | 0 | 0.0% |
| $25,000 to $34,999 | 0 | 0.0% |
| $35,000 to $49,999 | 75 | 15.0% |
| $50,000 to $74,999 | 64 | 12.8% |
| $75,000 to $99,999 | 40 | 8.0% |
| $100,000 to $149,999 | 157 | 31.4% |
| $150,000 to $199,999 | 107 | 21.4% |
| $200,000+ | 57 | 11.4% |
Family Income by Famaliy Size in Pine Valley
4-person families (134 | 26.8%) account for the highest median family income in Pine Valley with $173,036 per family, while 4-person families (134 | 26.8%) have the highest median income of $43,259 per family member.
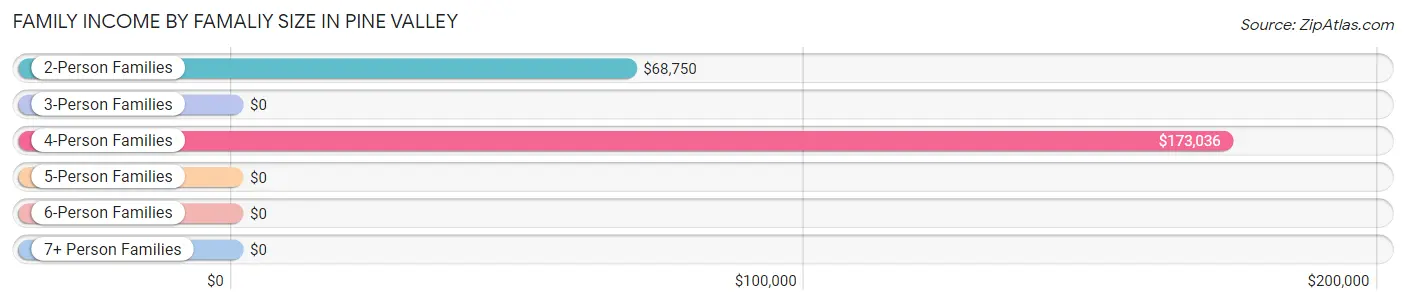
| Income Bracket | # Families | Median Income |
| 2-Person Families | 246 (49.2%) | $68,750 |
| 3-Person Families | 55 (11.0%) | $0 |
| 4-Person Families | 134 (26.8%) | $173,036 |
| 5-Person Families | 39 (7.8%) | $0 |
| 6-Person Families | 10 (2.0%) | $0 |
| 7+ Person Families | 16 (3.2%) | $0 |
| Total | 500 (100.0%) | $119,098 |
Family Income by Number of Earners in Pine Valley
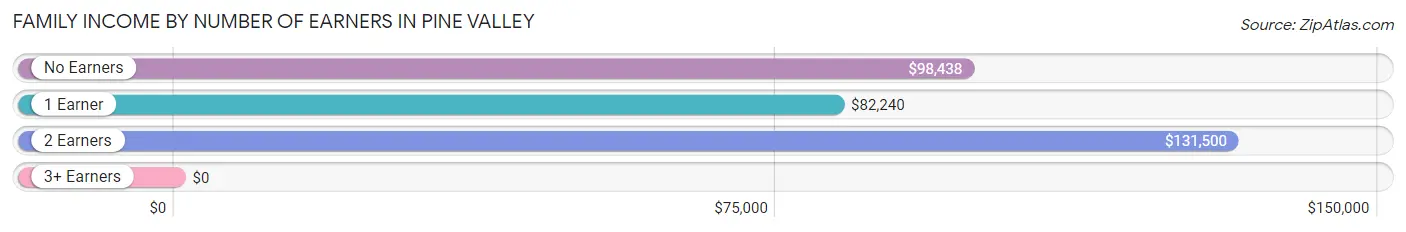
| Number of Earners | # Families | Median Income |
| No Earners | 45 (9.0%) | $98,438 |
| 1 Earner | 231 (46.2%) | $82,240 |
| 2 Earners | 160 (32.0%) | $131,500 |
| 3+ Earners | 64 (12.8%) | $0 |
| Total | 500 (100.0%) | $119,098 |
Household Income in Pine Valley
Household Income Brackets in Pine Valley
With 182 households falling in the category, the $100,000 to $149,999 income range is the most frequent in Pine Valley, accounting for 27.4% of all households.
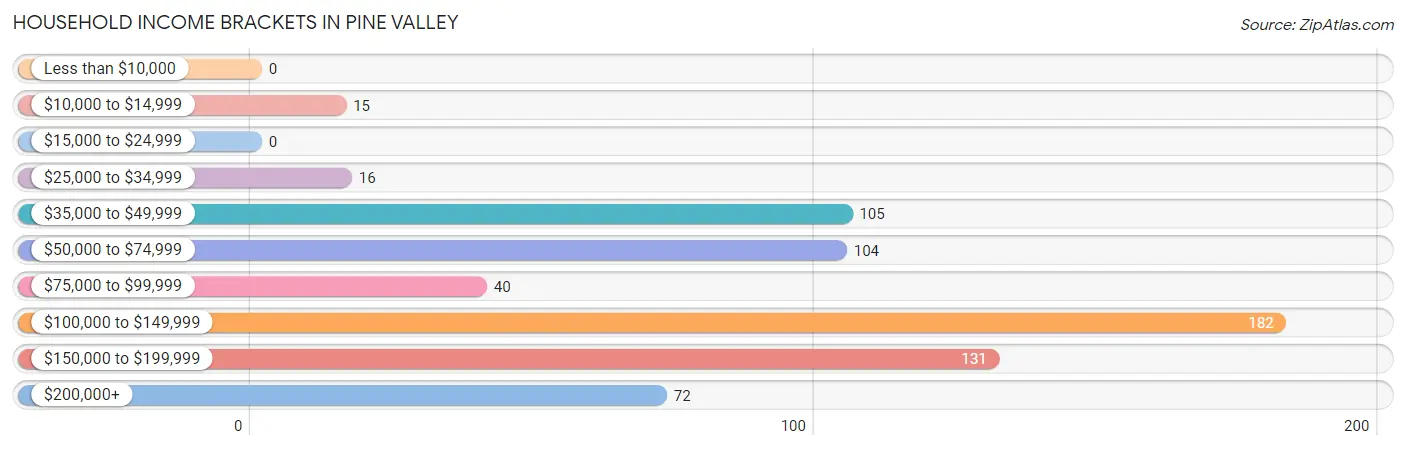
| Income Bracket | # Households | % Households |
| Less than $10,000 | 0 | 0.0% |
| $10,000 to $14,999 | 15 | 2.3% |
| $15,000 to $24,999 | 0 | 0.0% |
| $25,000 to $34,999 | 16 | 2.4% |
| $35,000 to $49,999 | 105 | 15.8% |
| $50,000 to $74,999 | 104 | 15.6% |
| $75,000 to $99,999 | 40 | 6.0% |
| $100,000 to $149,999 | 182 | 27.4% |
| $150,000 to $199,999 | 131 | 19.7% |
| $200,000+ | 72 | 10.8% |
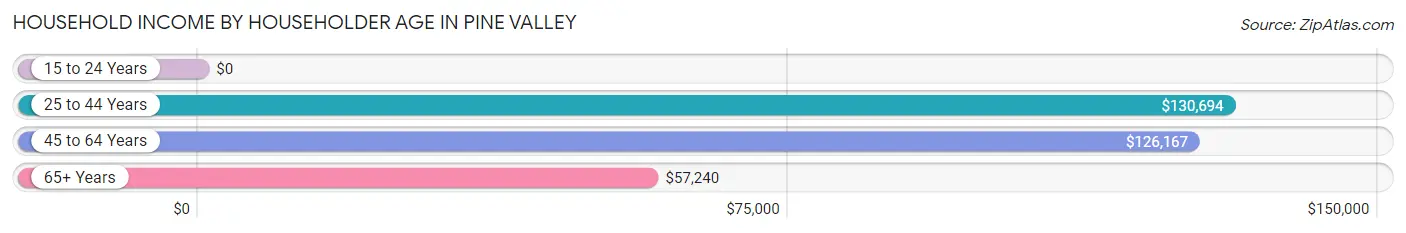
Household Income by Householder Age in Pine Valley
The median household income in Pine Valley is $116,477, with the highest median household income of $130,694 found in the 25 to 44 years age bracket for the primary householder. A total of 177 households (26.6%) fall into this category.
| Income Bracket | # Households | Median Income |
| 15 to 24 Years | 0 (0.0%) | $0 |
| 25 to 44 Years | 177 (26.6%) | $130,694 |
| 45 to 64 Years | 252 (37.9%) | $126,167 |
| 65+ Years | 236 (35.5%) | $57,240 |
| Total | 665 (100.0%) | $116,477 |
Poverty in Pine Valley
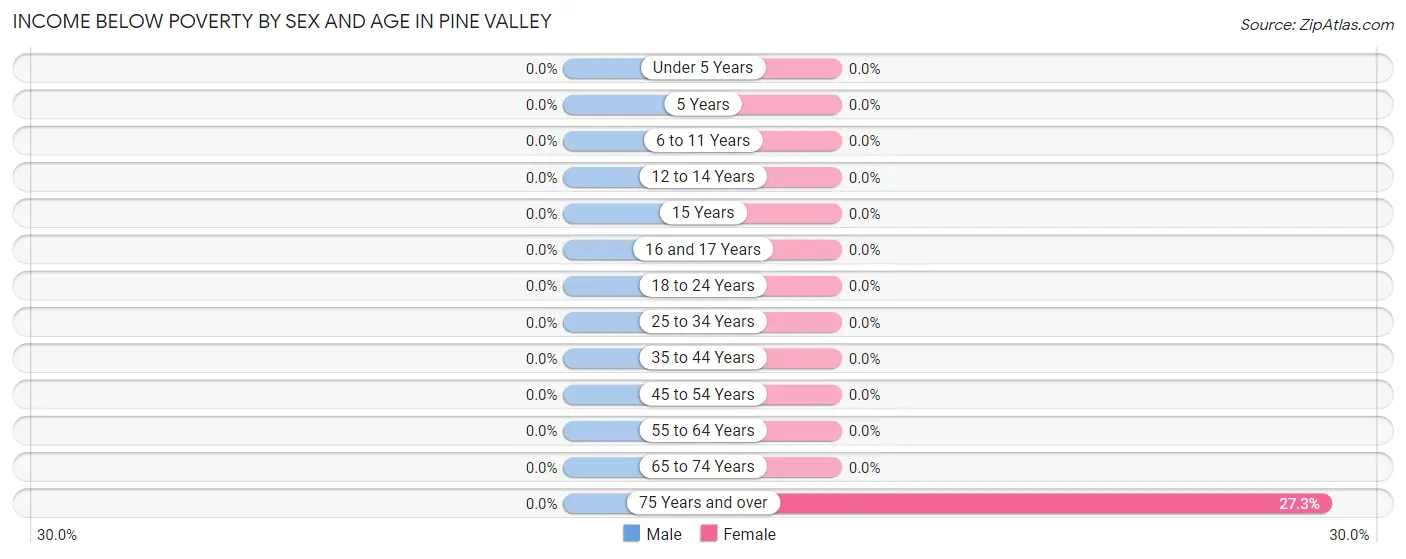
Income Below Poverty by Sex and Age in Pine Valley
| Age Bracket | Male | Female |
| Under 5 Years | 0 (0.0%) | 0 (0.0%) |
| 5 Years | 0 (0.0%) | 0 (0.0%) |
| 6 to 11 Years | 0 (0.0%) | 0 (0.0%) |
| 12 to 14 Years | 0 (0.0%) | 0 (0.0%) |
| 15 Years | 0 (0.0%) | 0 (0.0%) |
| 16 and 17 Years | 0 (0.0%) | 0 (0.0%) |
| 18 to 24 Years | 0 (0.0%) | 0 (0.0%) |
| 25 to 34 Years | 0 (0.0%) | 0 (0.0%) |
| 35 to 44 Years | 0 (0.0%) | 0 (0.0%) |
| 45 to 54 Years | 0 (0.0%) | 0 (0.0%) |
| 55 to 64 Years | 0 (0.0%) | 0 (0.0%) |
| 65 to 74 Years | 0 (0.0%) | 0 (0.0%) |
| 75 Years and over | 0 (0.0%) | 15 (27.3%) |
| Total | 0 (0.0%) | 15 (1.8%) |
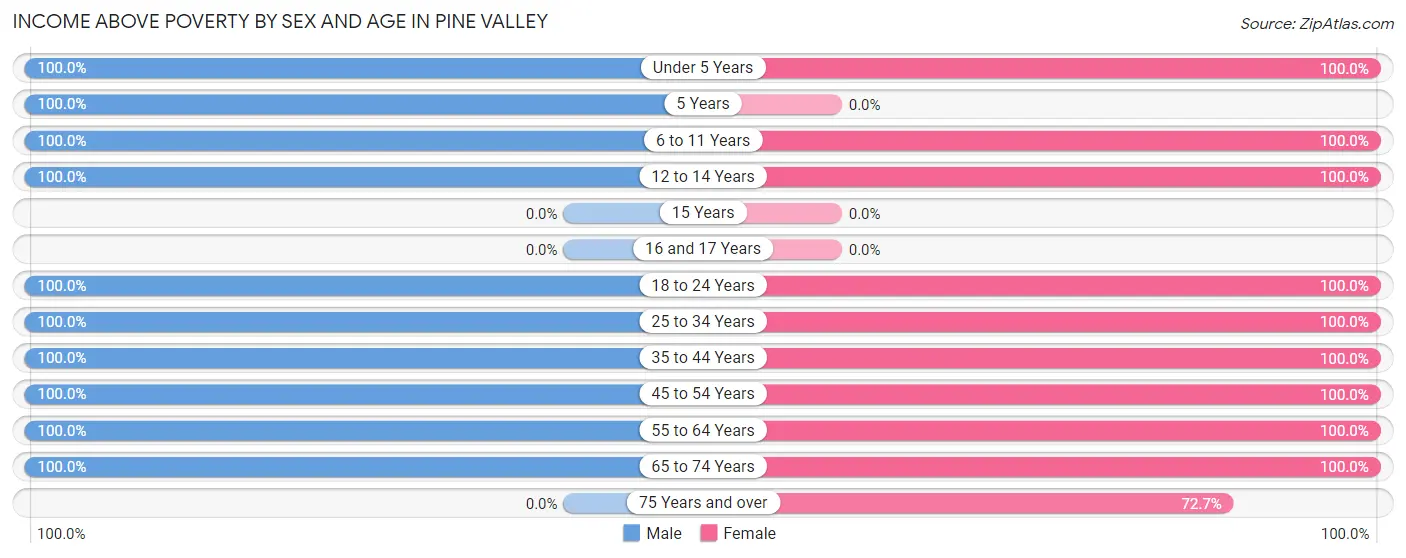
Income Above Poverty by Sex and Age in Pine Valley
According to the poverty statistics in Pine Valley, males aged under 5 years and females aged under 5 years are the age groups that are most secure financially, with 100.0% of males and 100.0% of females in these age groups living above the poverty line.
| Age Bracket | Male | Female |
| Under 5 Years | 56 (100.0%) | 89 (100.0%) |
| 5 Years | 16 (100.0%) | 0 (0.0%) |
| 6 to 11 Years | 119 (100.0%) | 29 (100.0%) |
| 12 to 14 Years | 23 (100.0%) | 41 (100.0%) |
| 15 Years | 0 (0.0%) | 0 (0.0%) |
| 16 and 17 Years | 0 (0.0%) | 0 (0.0%) |
| 18 to 24 Years | 50 (100.0%) | 101 (100.0%) |
| 25 to 34 Years | 246 (100.0%) | 105 (100.0%) |
| 35 to 44 Years | 81 (100.0%) | 43 (100.0%) |
| 45 to 54 Years | 52 (100.0%) | 125 (100.0%) |
| 55 to 64 Years | 144 (100.0%) | 118 (100.0%) |
| 65 to 74 Years | 146 (100.0%) | 128 (100.0%) |
| 75 Years and over | 0 (0.0%) | 40 (72.7%) |
| Total | 933 (100.0%) | 819 (98.2%) |
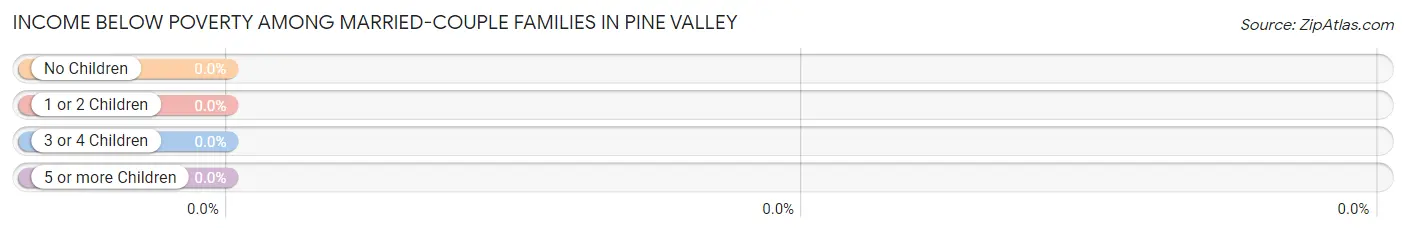
Income Below Poverty Among Married-Couple Families in Pine Valley
| Children | Above Poverty | Below Poverty |
| No Children | 274 (100.0%) | 0 (0.0%) |
| 1 or 2 Children | 70 (100.0%) | 0 (0.0%) |
| 3 or 4 Children | 49 (100.0%) | 0 (0.0%) |
| 5 or more Children | 16 (100.0%) | 0 (0.0%) |
| Total | 409 (100.0%) | 0 (0.0%) |
Income Below Poverty Among Single-Parent Households in Pine Valley
| Children | Single Father | Single Mother |
| No Children | 0 (0.0%) | 0 (0.0%) |
| 1 or 2 Children | 0 (0.0%) | 0 (0.0%) |
| 3 or 4 Children | 0 (0.0%) | 0 (0.0%) |
| 5 or more Children | 0 (0.0%) | 0 (0.0%) |
| Total | 0 (0.0%) | 0 (0.0%) |
Income Below Poverty Among Married-Couple vs Single-Parent Households in Pine Valley
| Children | Married-Couple Families | Single-Parent Households |
| No Children | 0 (0.0%) | 0 (0.0%) |
| 1 or 2 Children | 0 (0.0%) | 0 (0.0%) |
| 3 or 4 Children | 0 (0.0%) | 0 (0.0%) |
| 5 or more Children | 0 (0.0%) | 0 (0.0%) |
| Total | 0 (0.0%) | 0 (0.0%) |
Race in Pine Valley
The most populous races in Pine Valley are White / Caucasian (1,245 | 70.0%), Hispanic or Latino (419 | 23.6%), and Two or more Races (387 | 21.8%).
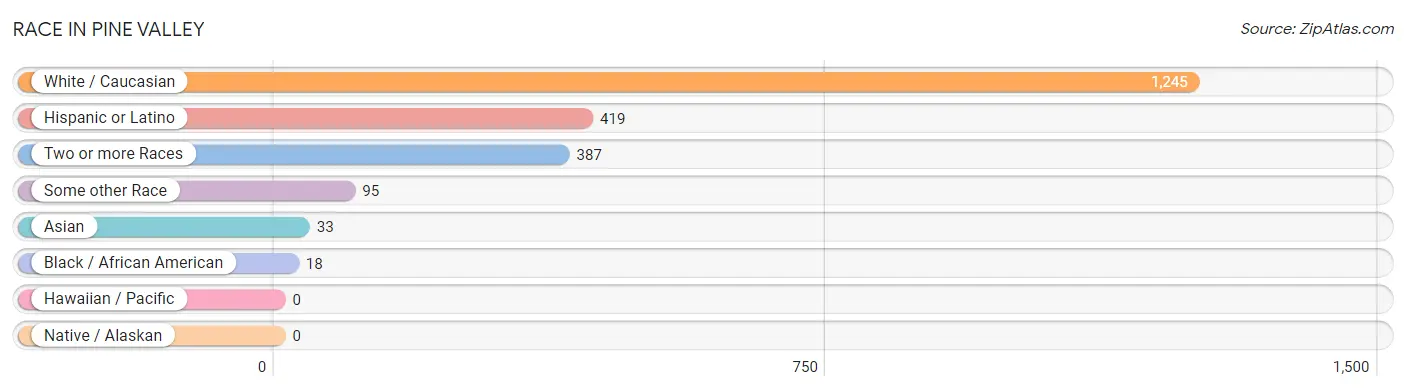
| Race | # Population | % Population |
| Asian | 33 | 1.9% |
| Black / African American | 18 | 1.0% |
| Hawaiian / Pacific | 0 | 0.0% |
| Hispanic or Latino | 419 | 23.6% |
| Native / Alaskan | 0 | 0.0% |
| White / Caucasian | 1,245 | 70.0% |
| Two or more Races | 387 | 21.8% |
| Some other Race | 95 | 5.3% |
| Total | 1,778 | 100.0% |
Ancestry in Pine Valley
The most populous ancestries reported in Pine Valley are German (440 | 24.7%), Mexican (419 | 23.6%), Irish (396 | 22.3%), English (208 | 11.7%), and Italian (176 | 9.9%), together accounting for 92.2% of all Pine Valley residents.
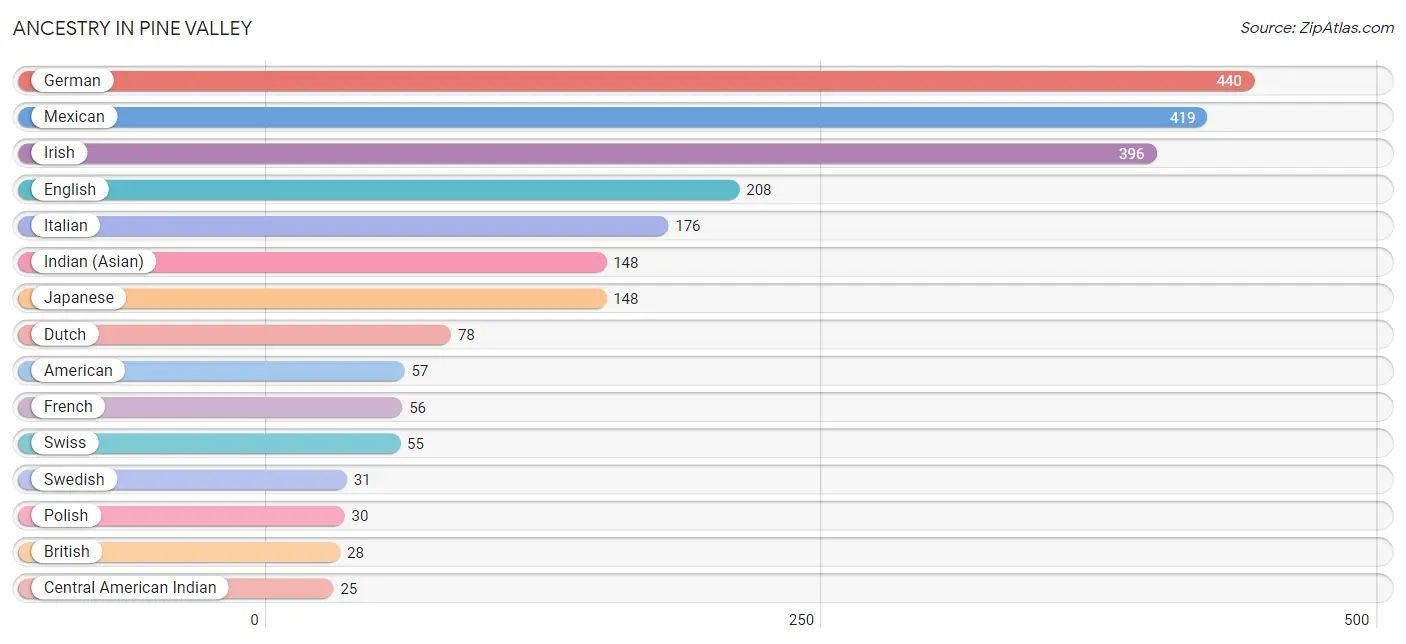
| Ancestry | # Population | % Population |
| American | 57 | 3.2% |
| British | 28 | 1.6% |
| Central American Indian | 25 | 1.4% |
| Dutch | 78 | 4.4% |
| Eastern European | 15 | 0.8% |
| English | 208 | 11.7% |
| European | 23 | 1.3% |
| Finnish | 10 | 0.6% |
| French | 56 | 3.2% |
| German | 440 | 24.7% |
| Indian (Asian) | 148 | 8.3% |
| Irish | 396 | 22.3% |
| Italian | 176 | 9.9% |
| Japanese | 148 | 8.3% |
| Lithuanian | 12 | 0.7% |
| Mexican | 419 | 23.6% |
| Norwegian | 15 | 0.8% |
| Polish | 30 | 1.7% |
| Portuguese | 14 | 0.8% |
| Scandinavian | 15 | 0.8% |
| Scottish | 4 | 0.2% |
| Slovak | 16 | 0.9% |
| Swedish | 31 | 1.7% |
| Swiss | 55 | 3.1% |
| Yaqui | 25 | 1.4% | View All 25 Rows |
Immigrants in Pine Valley
The most numerous immigrant groups reported in Pine Valley came from Asia (33 | 1.9%), South Eastern Asia (33 | 1.9%), Thailand (33 | 1.9%), Central America (27 | 1.5%), and Latin America (27 | 1.5%), together accounting for 8.6% of all Pine Valley residents.
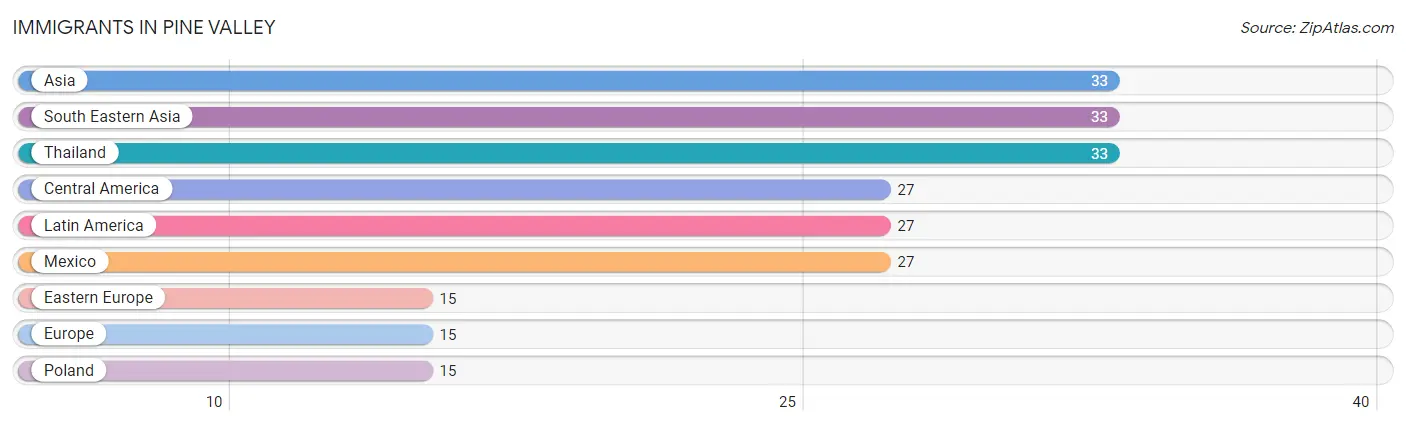
| Immigration Origin | # Population | % Population |
| Asia | 33 | 1.9% |
| Central America | 27 | 1.5% |
| Eastern Europe | 15 | 0.8% |
| Europe | 15 | 0.8% |
| Latin America | 27 | 1.5% |
| Mexico | 27 | 1.5% |
| Poland | 15 | 0.8% |
| South Eastern Asia | 33 | 1.9% |
| Thailand | 33 | 1.9% | View All 9 Rows |
Sex and Age in Pine Valley
Sex and Age in Pine Valley
The most populous age groups in Pine Valley are 30 to 34 Years (162 | 17.4%) for men and 30 to 34 Years (105 | 12.4%) for women.
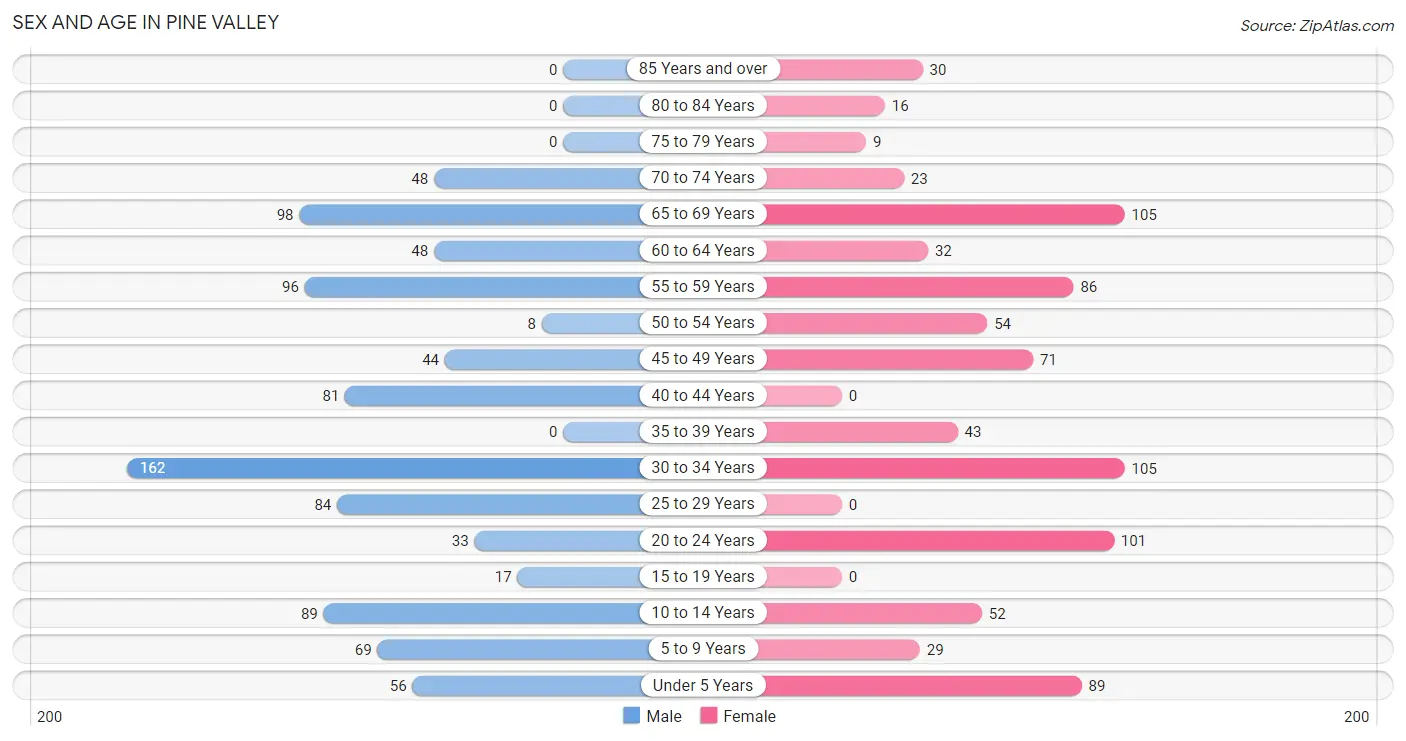
| Age Bracket | Male | Female |
| Under 5 Years | 56 (6.0%) | 89 (10.5%) |
| 5 to 9 Years | 69 (7.4%) | 29 (3.4%) |
| 10 to 14 Years | 89 (9.5%) | 52 (6.1%) |
| 15 to 19 Years | 17 (1.8%) | 0 (0.0%) |
| 20 to 24 Years | 33 (3.5%) | 101 (11.9%) |
| 25 to 29 Years | 84 (9.0%) | 0 (0.0%) |
| 30 to 34 Years | 162 (17.4%) | 105 (12.4%) |
| 35 to 39 Years | 0 (0.0%) | 43 (5.1%) |
| 40 to 44 Years | 81 (8.7%) | 0 (0.0%) |
| 45 to 49 Years | 44 (4.7%) | 71 (8.4%) |
| 50 to 54 Years | 8 (0.9%) | 54 (6.4%) |
| 55 to 59 Years | 96 (10.3%) | 86 (10.2%) |
| 60 to 64 Years | 48 (5.1%) | 32 (3.8%) |
| 65 to 69 Years | 98 (10.5%) | 105 (12.4%) |
| 70 to 74 Years | 48 (5.1%) | 23 (2.7%) |
| 75 to 79 Years | 0 (0.0%) | 9 (1.1%) |
| 80 to 84 Years | 0 (0.0%) | 16 (1.9%) |
| 85 Years and over | 0 (0.0%) | 30 (3.5%) |
| Total | 933 (100.0%) | 845 (100.0%) |
Families and Households in Pine Valley
Median Family Size in Pine Valley
The median family size in Pine Valley is 3.12 persons per family, with married-couple families (409 | 81.8%) accounting for the largest median family size of 3.31 persons per family. On the other hand, single male/father families (14 | 2.8%) represent the smallest median family size with 2.21 persons per family.
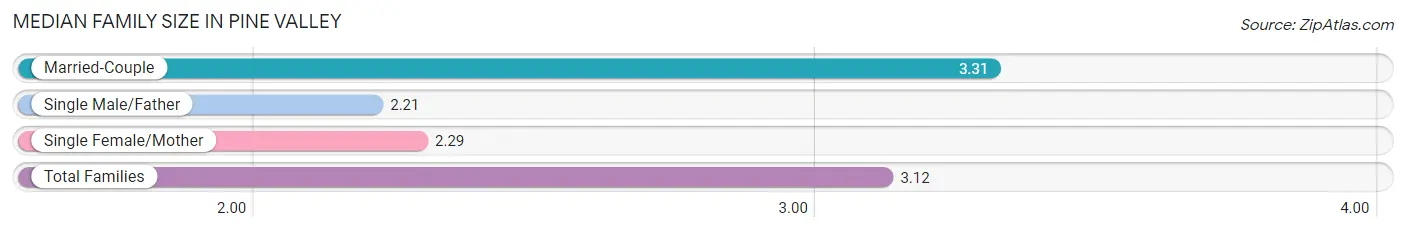
| Family Type | # Families | Family Size |
| Married-Couple | 409 (81.8%) | 3.31 |
| Single Male/Father | 14 (2.8%) | 2.21 |
| Single Female/Mother | 77 (15.4%) | 2.29 |
| Total Families | 500 (100.0%) | 3.12 |
Median Household Size in Pine Valley
The median household size in Pine Valley is 2.67 persons per household, with married-couple households (409 | 61.5%) accounting for the largest median household size of 3.33 persons per household. non-family households (165 | 24.8%) represent the smallest median household size with 1.17 persons per household.
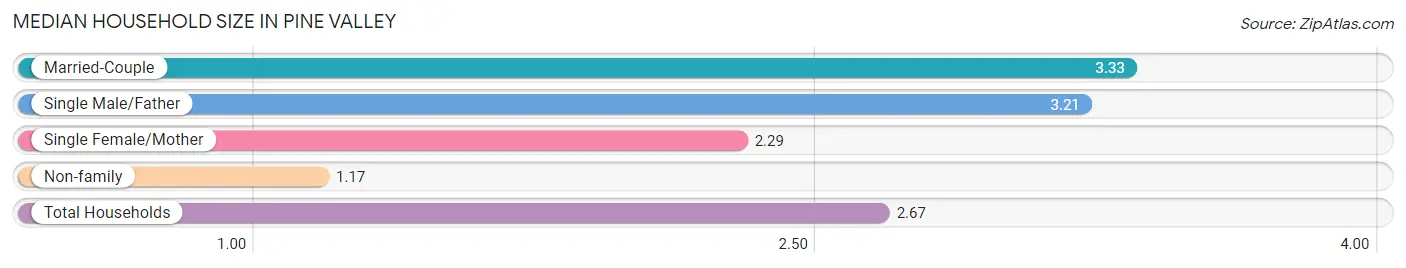
| Household Type | # Households | Household Size |
| Married-Couple | 409 (61.5%) | 3.33 |
| Single Male/Father | 14 (2.1%) | 3.21 |
| Single Female/Mother | 77 (11.6%) | 2.29 |
| Non-family | 165 (24.8%) | 1.17 |
| Total Households | 665 (100.0%) | 2.67 |
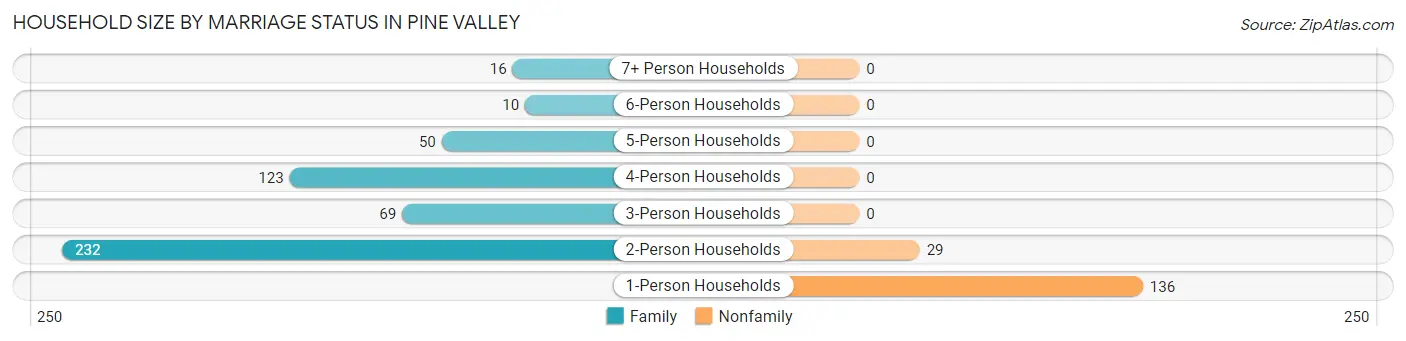
Household Size by Marriage Status in Pine Valley
Out of a total of 665 households in Pine Valley, 500 (75.2%) are family households, while 165 (24.8%) are nonfamily households. The most numerous type of family households are 2-person households, comprising 232, and the most common type of nonfamily households are 1-person households, comprising 136.
| Household Size | Family Households | Nonfamily Households |
| 1-Person Households | - | 136 (20.4%) |
| 2-Person Households | 232 (34.9%) | 29 (4.4%) |
| 3-Person Households | 69 (10.4%) | 0 (0.0%) |
| 4-Person Households | 123 (18.5%) | 0 (0.0%) |
| 5-Person Households | 50 (7.5%) | 0 (0.0%) |
| 6-Person Households | 10 (1.5%) | 0 (0.0%) |
| 7+ Person Households | 16 (2.4%) | 0 (0.0%) |
| Total | 500 (75.2%) | 165 (24.8%) |
Female Fertility in Pine Valley
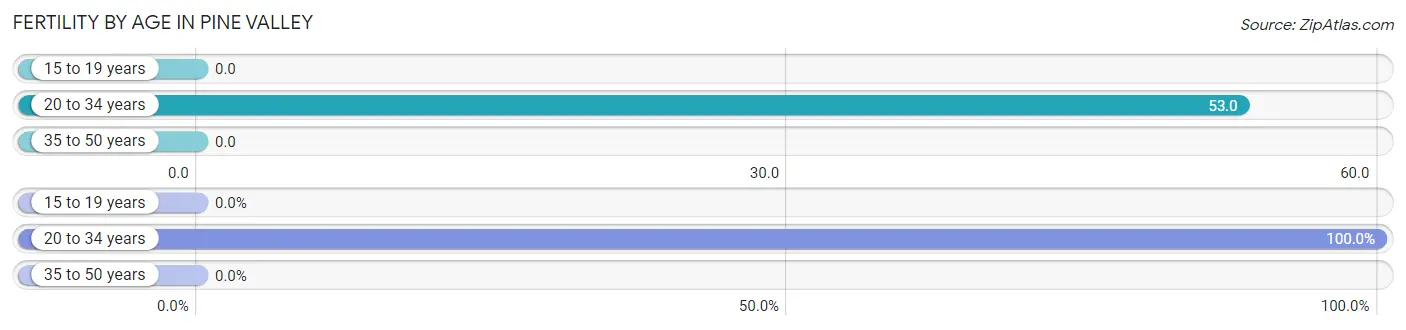
Fertility by Age in Pine Valley
Average fertility rate in Pine Valley is 34.0 births per 1,000 women. Women in the age bracket of 20 to 34 years have the highest fertility rate with 53.0 births per 1,000 women. Women in the age bracket of 20 to 34 years acount for 100.0% of all women with births.
| Age Bracket | Women with Births | Births / 1,000 Women |
| 15 to 19 years | 0 (0.0%) | 0.0 |
| 20 to 34 years | 11 (100.0%) | 53.0 |
| 35 to 50 years | 0 (0.0%) | 0.0 |
| Total | 11 (100.0%) | 34.0 |
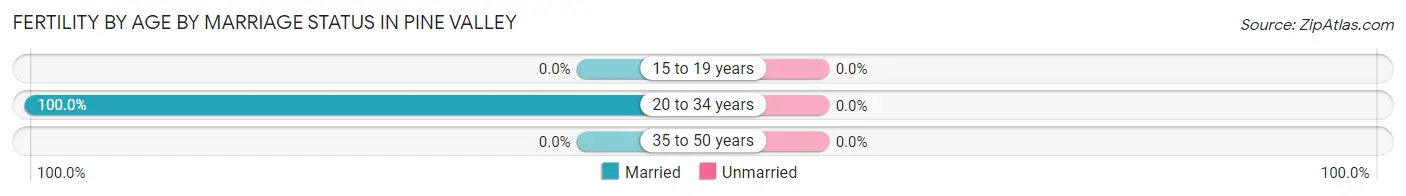
Fertility by Age by Marriage Status in Pine Valley
| Age Bracket | Married | Unmarried |
| 15 to 19 years | 0 (0.0%) | 0 (0.0%) |
| 20 to 34 years | 11 (100.0%) | 0 (0.0%) |
| 35 to 50 years | 0 (0.0%) | 0 (0.0%) |
| Total | 11 (100.0%) | 0 (0.0%) |
Fertility by Education in Pine Valley
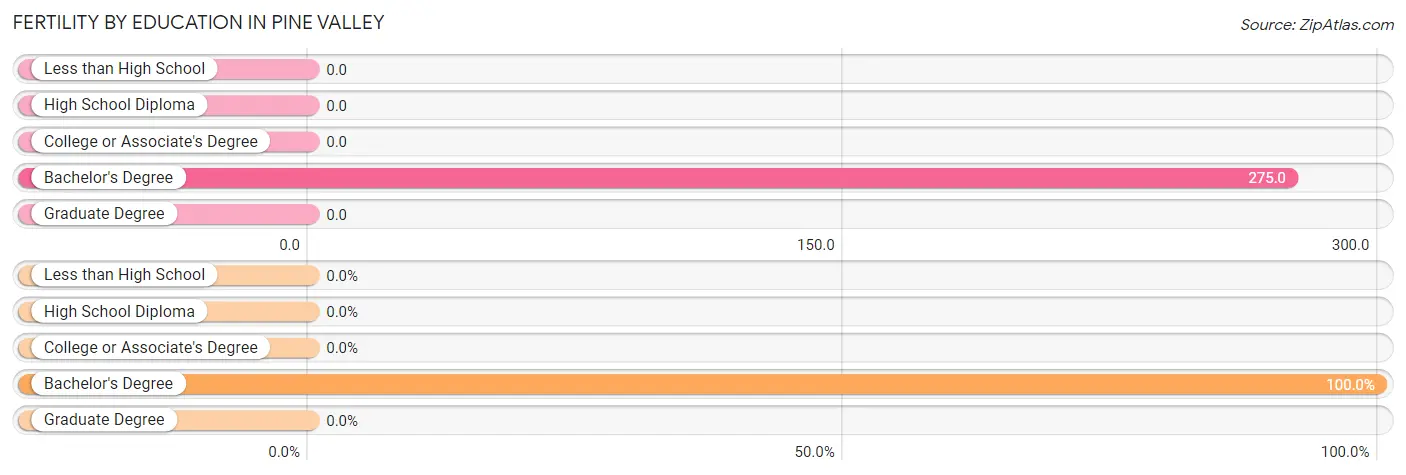
| Educational Attainment | Women with Births | Births / 1,000 Women |
| Less than High School | 0 (0.0%) | 0.0 |
| High School Diploma | 0 (0.0%) | 0.0 |
| College or Associate's Degree | 0 (0.0%) | 0.0 |
| Bachelor's Degree | 11 (100.0%) | 275.0 |
| Graduate Degree | 0 (0.0%) | 0.0 |
| Total | 11 (100.0%) | 34.0 |
Fertility by Education by Marriage Status in Pine Valley
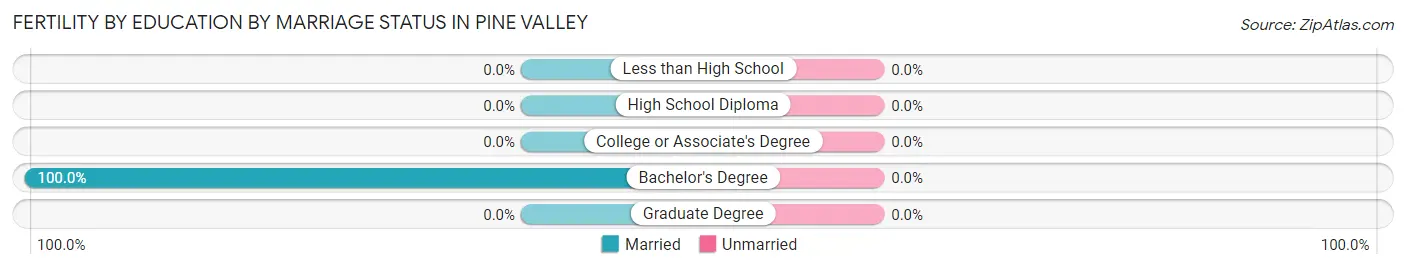
| Educational Attainment | Married | Unmarried |
| Less than High School | 0 (0.0%) | 0 (0.0%) |
| High School Diploma | 0 (0.0%) | 0 (0.0%) |
| College or Associate's Degree | 0 (0.0%) | 0 (0.0%) |
| Bachelor's Degree | 11 (100.0%) | 0 (0.0%) |
| Graduate Degree | 0 (0.0%) | 0 (0.0%) |
| Total | 11 (100.0%) | 0 (0.0%) |
Employment Characteristics in Pine Valley
Employment by Class of Employer in Pine Valley
Among the 529 employed individuals in Pine Valley, private company employees (268 | 50.7%), federal government employees (84 | 15.9%), and state government employees (61 | 11.5%) make up the most common classes of employment.
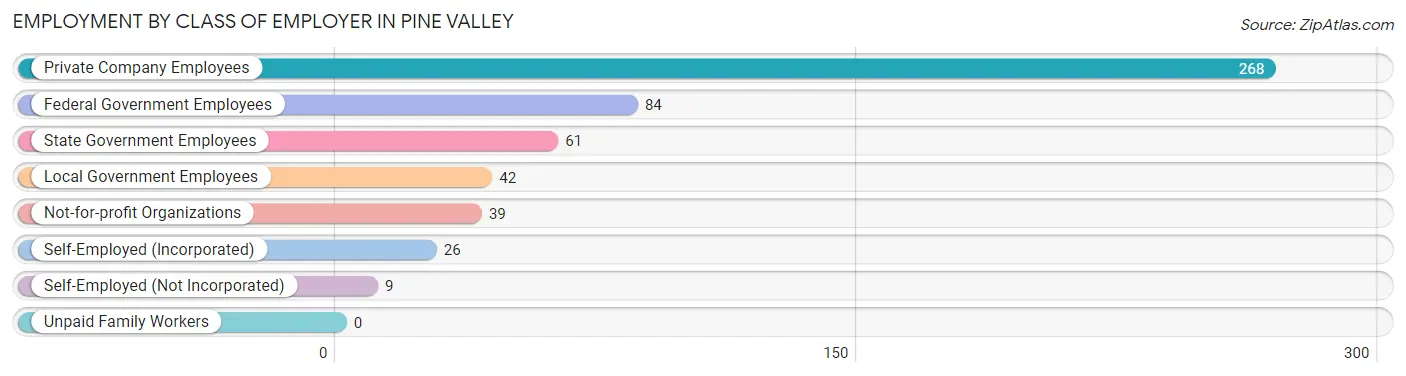
| Employer Class | # Employees | % Employees |
| Private Company Employees | 268 | 50.7% |
| Self-Employed (Incorporated) | 26 | 4.9% |
| Self-Employed (Not Incorporated) | 9 | 1.7% |
| Not-for-profit Organizations | 39 | 7.4% |
| Local Government Employees | 42 | 7.9% |
| State Government Employees | 61 | 11.5% |
| Federal Government Employees | 84 | 15.9% |
| Unpaid Family Workers | 0 | 0.0% |
| Total | 529 | 100.0% |
Employment Status by Age in Pine Valley
According to the labor force statistics for Pine Valley, out of the total population over 16 years of age (1,394), 65.0% or 906 individuals are in the labor force, with 35.0% or 317 of them unemployed. The age group with the highest labor force participation rate is 16 to 19 years, with 100.0% or 17 individuals in the labor force. Within the labor force, the 35 to 44 years age range has the highest percentage of unemployed individuals, with 76.5% or 62 of them being unemployed.
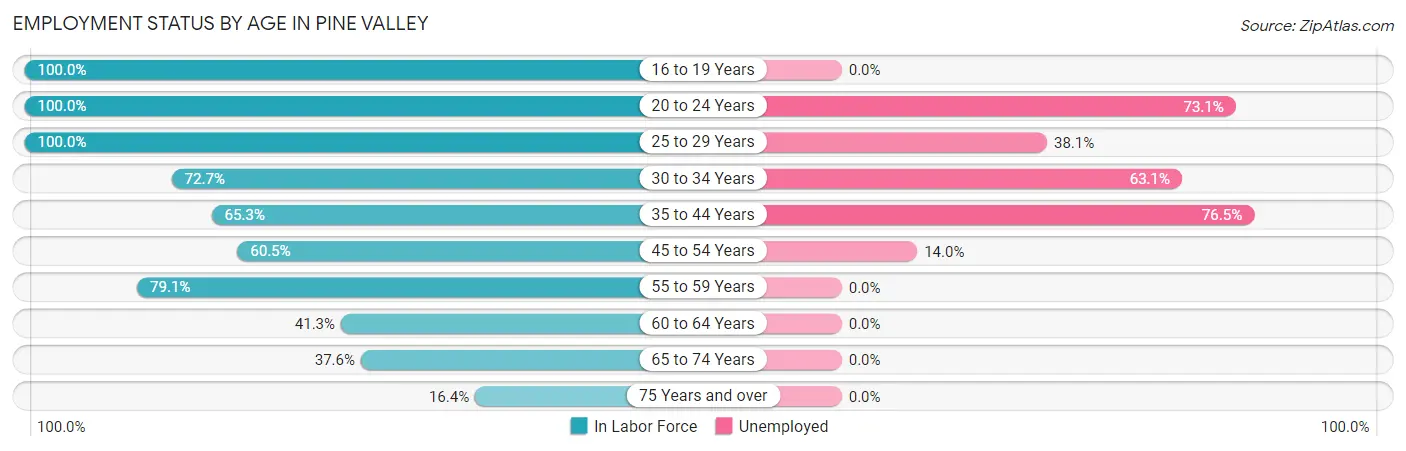
| Age Bracket | In Labor Force | Unemployed |
| 16 to 19 Years | 17 (100.0%) | 0 (0.0%) |
| 20 to 24 Years | 134 (100.0%) | 98 (73.1%) |
| 25 to 29 Years | 84 (100.0%) | 32 (38.1%) |
| 30 to 34 Years | 194 (72.7%) | 122 (63.1%) |
| 35 to 44 Years | 81 (65.3%) | 62 (76.5%) |
| 45 to 54 Years | 107 (60.5%) | 15 (14.0%) |
| 55 to 59 Years | 144 (79.1%) | 0 (0.0%) |
| 60 to 64 Years | 33 (41.3%) | 0 (0.0%) |
| 65 to 74 Years | 103 (37.6%) | 0 (0.0%) |
| 75 Years and over | 9 (16.4%) | 0 (0.0%) |
| Total | 906 (65.0%) | 317 (35.0%) |
Employment Status by Educational Attainment in Pine Valley
According to labor force statistics for Pine Valley, 70.4% of individuals (643) out of the total population between 25 and 64 years of age (914) are in the labor force, with 33.9% or 218 of them being unemployed. The group with the highest labor force participation rate are those with the educational attainment of less than high school, with 100.0% or 16 individuals in the labor force. Within the labor force, individuals with high school diploma education have the highest percentage of unemployment, with 72.3% or 94 of them being unemployed.
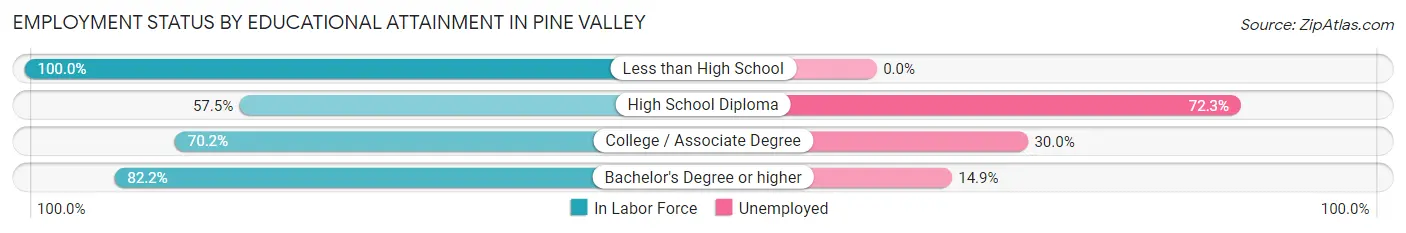
| Educational Attainment | In Labor Force | Unemployed |
| Less than High School | 16 (100.0%) | 0 (0.0%) |
| High School Diploma | 130 (57.5%) | 163 (72.3%) |
| College / Associate Degree | 322 (70.2%) | 138 (30.0%) |
| Bachelor's Degree or higher | 175 (82.2%) | 32 (14.9%) |
| Total | 643 (70.4%) | 310 (33.9%) |
Employment Occupations by Sex in Pine Valley
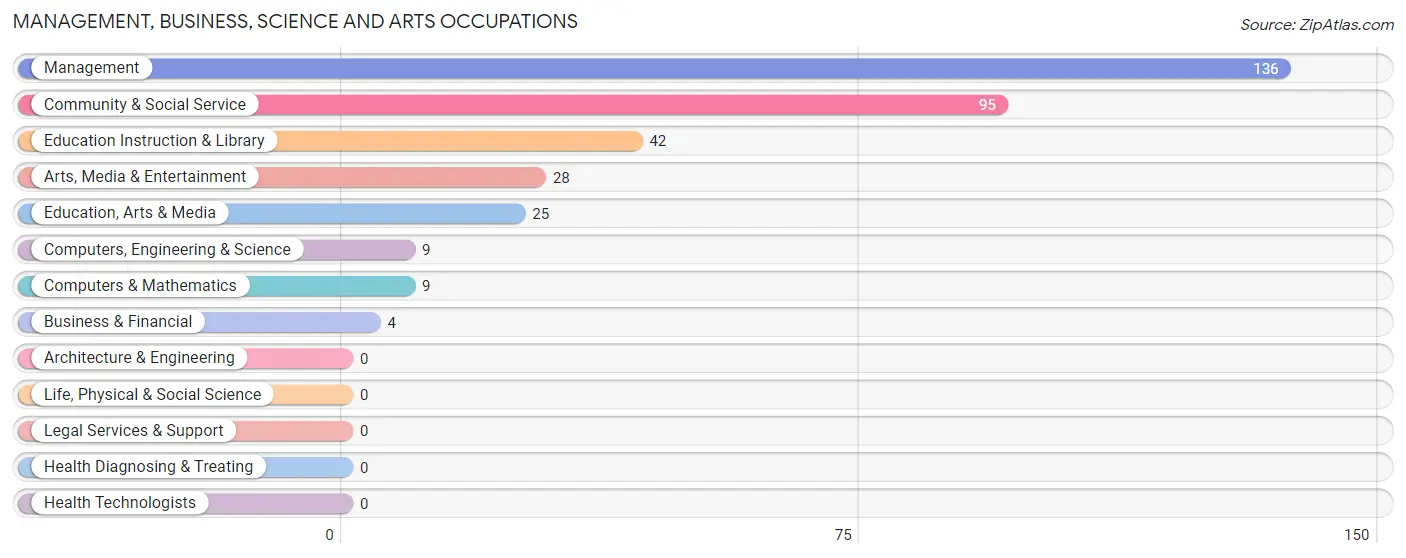
Management, Business, Science and Arts Occupations
The most common Management, Business, Science and Arts occupations in Pine Valley are Management (136 | 24.3%), Community & Social Service (95 | 17.0%), Education Instruction & Library (42 | 7.5%), Arts, Media & Entertainment (28 | 5.0%), and Education, Arts & Media (25 | 4.5%).
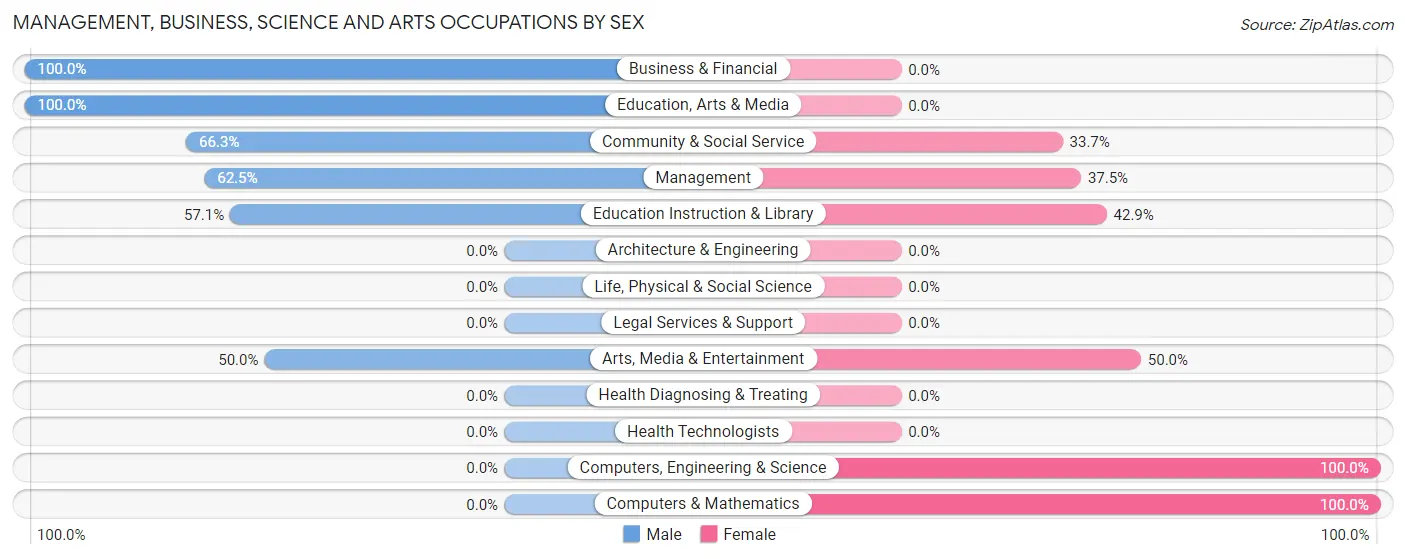
Management, Business, Science and Arts Occupations by Sex
Within the Management, Business, Science and Arts occupations in Pine Valley, the most male-oriented occupations are Business & Financial (100.0%), Education, Arts & Media (100.0%), and Community & Social Service (66.3%), while the most female-oriented occupations are Computers, Engineering & Science (100.0%), Computers & Mathematics (100.0%), and Arts, Media & Entertainment (50.0%).
| Occupation | Male | Female |
| Management | 85 (62.5%) | 51 (37.5%) |
| Business & Financial | 4 (100.0%) | 0 (0.0%) |
| Computers, Engineering & Science | 0 (0.0%) | 9 (100.0%) |
| Computers & Mathematics | 0 (0.0%) | 9 (100.0%) |
| Architecture & Engineering | 0 (0.0%) | 0 (0.0%) |
| Life, Physical & Social Science | 0 (0.0%) | 0 (0.0%) |
| Community & Social Service | 63 (66.3%) | 32 (33.7%) |
| Education, Arts & Media | 25 (100.0%) | 0 (0.0%) |
| Legal Services & Support | 0 (0.0%) | 0 (0.0%) |
| Education Instruction & Library | 24 (57.1%) | 18 (42.9%) |
| Arts, Media & Entertainment | 14 (50.0%) | 14 (50.0%) |
| Health Diagnosing & Treating | 0 (0.0%) | 0 (0.0%) |
| Health Technologists | 0 (0.0%) | 0 (0.0%) |
| Total (Category) | 152 (62.3%) | 92 (37.7%) |
| Total (Overall) | 354 (63.2%) | 206 (36.8%) |
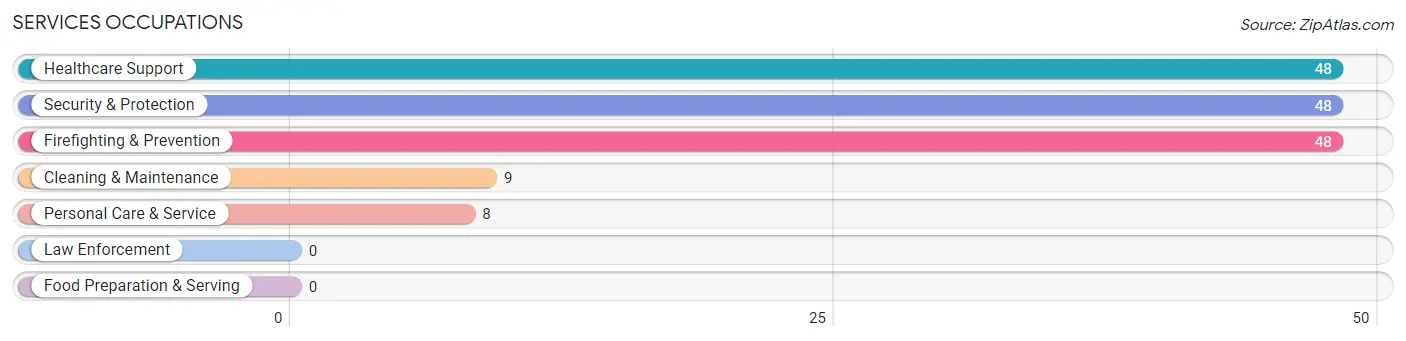
Services Occupations
The most common Services occupations in Pine Valley are Healthcare Support (48 | 8.6%), Security & Protection (48 | 8.6%), Firefighting & Prevention (48 | 8.6%), Cleaning & Maintenance (9 | 1.6%), and Personal Care & Service (8 | 1.4%).
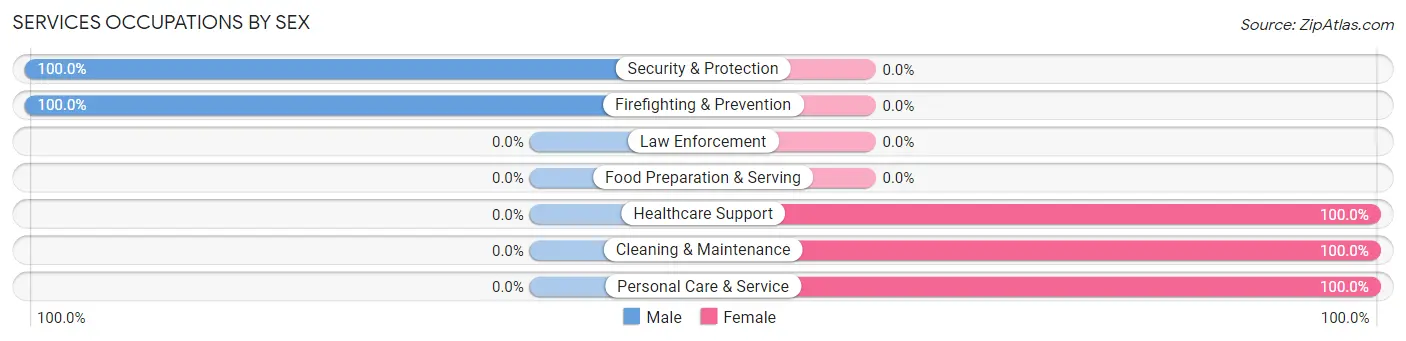
Services Occupations by Sex
Within the Services occupations in Pine Valley, the most male-oriented occupations are Security & Protection (100.0%), and Firefighting & Prevention (100.0%), while the most female-oriented occupations are Healthcare Support (100.0%), Cleaning & Maintenance (100.0%), and Personal Care & Service (100.0%).
| Occupation | Male | Female |
| Healthcare Support | 0 (0.0%) | 48 (100.0%) |
| Security & Protection | 48 (100.0%) | 0 (0.0%) |
| Firefighting & Prevention | 48 (100.0%) | 0 (0.0%) |
| Law Enforcement | 0 (0.0%) | 0 (0.0%) |
| Food Preparation & Serving | 0 (0.0%) | 0 (0.0%) |
| Cleaning & Maintenance | 0 (0.0%) | 9 (100.0%) |
| Personal Care & Service | 0 (0.0%) | 8 (100.0%) |
| Total (Category) | 48 (42.5%) | 65 (57.5%) |
| Total (Overall) | 354 (63.2%) | 206 (36.8%) |
Sales and Office Occupations
The most common Sales and Office occupations in Pine Valley are Sales & Related (61 | 10.9%), and Office & Administration (31 | 5.5%).

Sales and Office Occupations by Sex
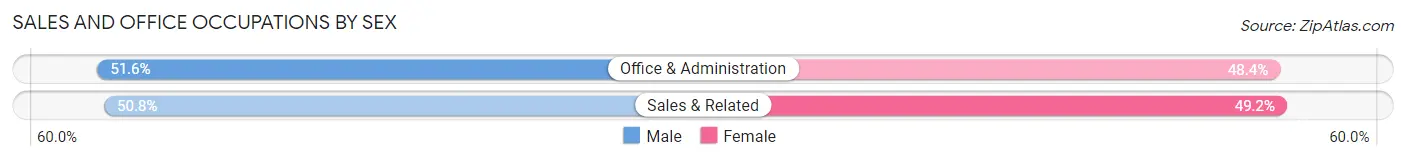
| Occupation | Male | Female |
| Sales & Related | 31 (50.8%) | 30 (49.2%) |
| Office & Administration | 16 (51.6%) | 15 (48.4%) |
| Total (Category) | 47 (51.1%) | 45 (48.9%) |
| Total (Overall) | 354 (63.2%) | 206 (36.8%) |
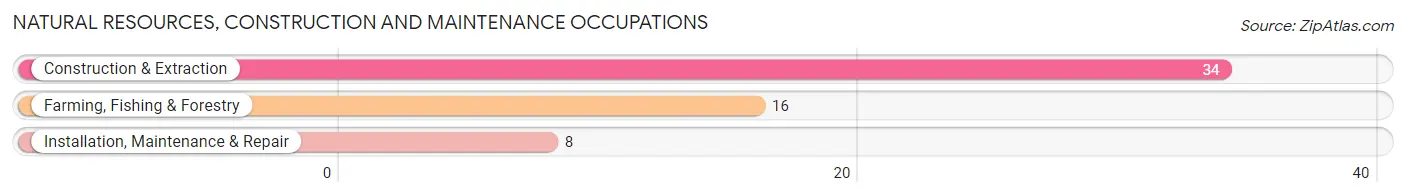
Natural Resources, Construction and Maintenance Occupations
The most common Natural Resources, Construction and Maintenance occupations in Pine Valley are Construction & Extraction (34 | 6.1%), Farming, Fishing & Forestry (16 | 2.9%), and Installation, Maintenance & Repair (8 | 1.4%).
Natural Resources, Construction and Maintenance Occupations by Sex
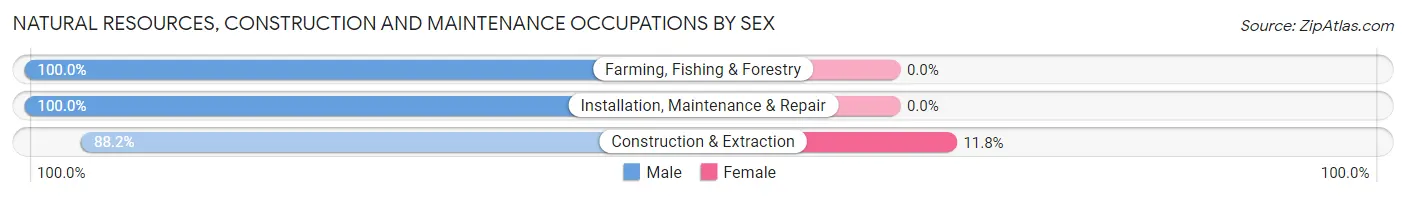
| Occupation | Male | Female |
| Farming, Fishing & Forestry | 16 (100.0%) | 0 (0.0%) |
| Construction & Extraction | 30 (88.2%) | 4 (11.8%) |
| Installation, Maintenance & Repair | 8 (100.0%) | 0 (0.0%) |
| Total (Category) | 54 (93.1%) | 4 (6.9%) |
| Total (Overall) | 354 (63.2%) | 206 (36.8%) |
Production, Transportation and Moving Occupations
The most common Production, Transportation and Moving occupations in Pine Valley are , and Production (53 | 9.5%).
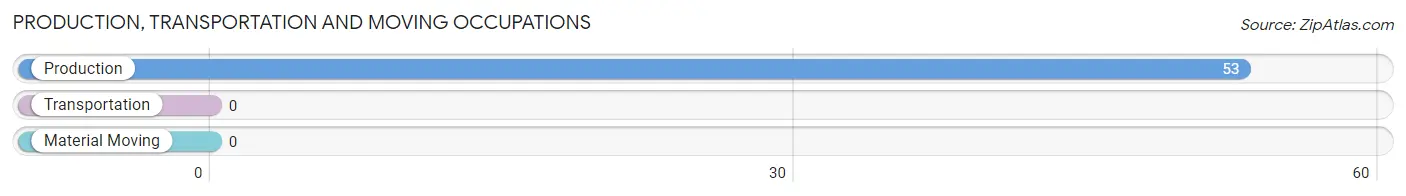
Production, Transportation and Moving Occupations by Sex
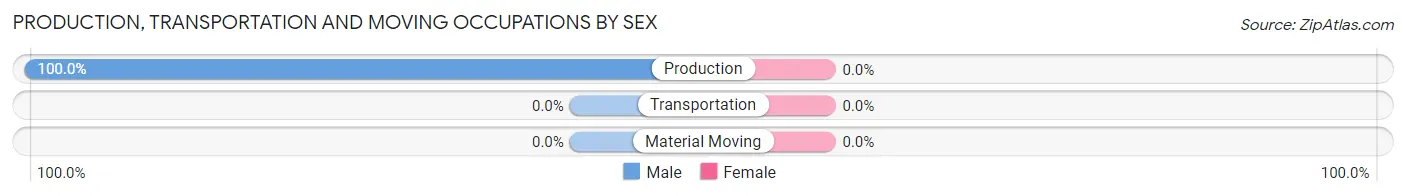
| Occupation | Male | Female |
| Production | 53 (100.0%) | 0 (0.0%) |
| Transportation | 0 (0.0%) | 0 (0.0%) |
| Material Moving | 0 (0.0%) | 0 (0.0%) |
| Total (Category) | 53 (100.0%) | 0 (0.0%) |
| Total (Overall) | 354 (63.2%) | 206 (36.8%) |
Employment Industries by Sex in Pine Valley
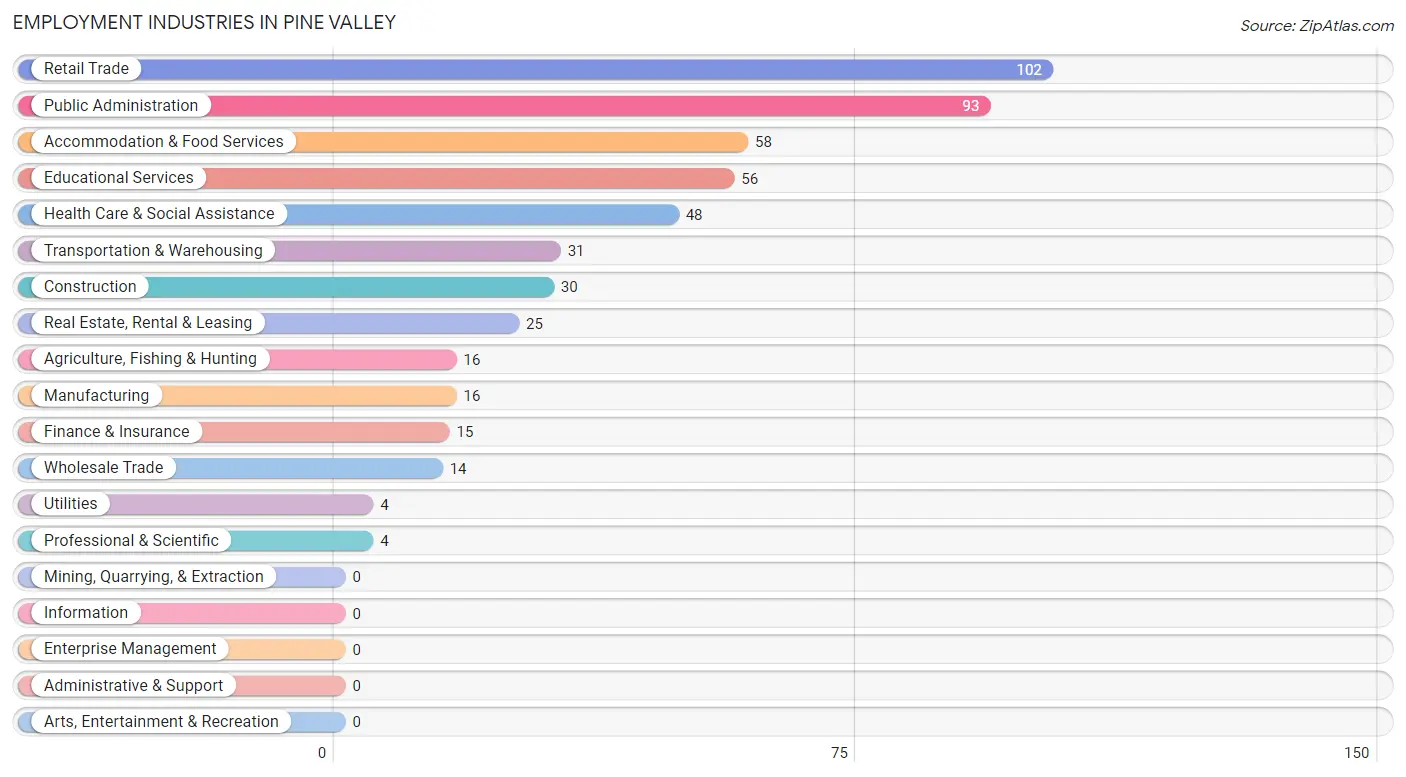
Employment Industries in Pine Valley
The major employment industries in Pine Valley include Retail Trade (102 | 18.2%), Public Administration (93 | 16.6%), Accommodation & Food Services (58 | 10.4%), Educational Services (56 | 10.0%), and Health Care & Social Assistance (48 | 8.6%).
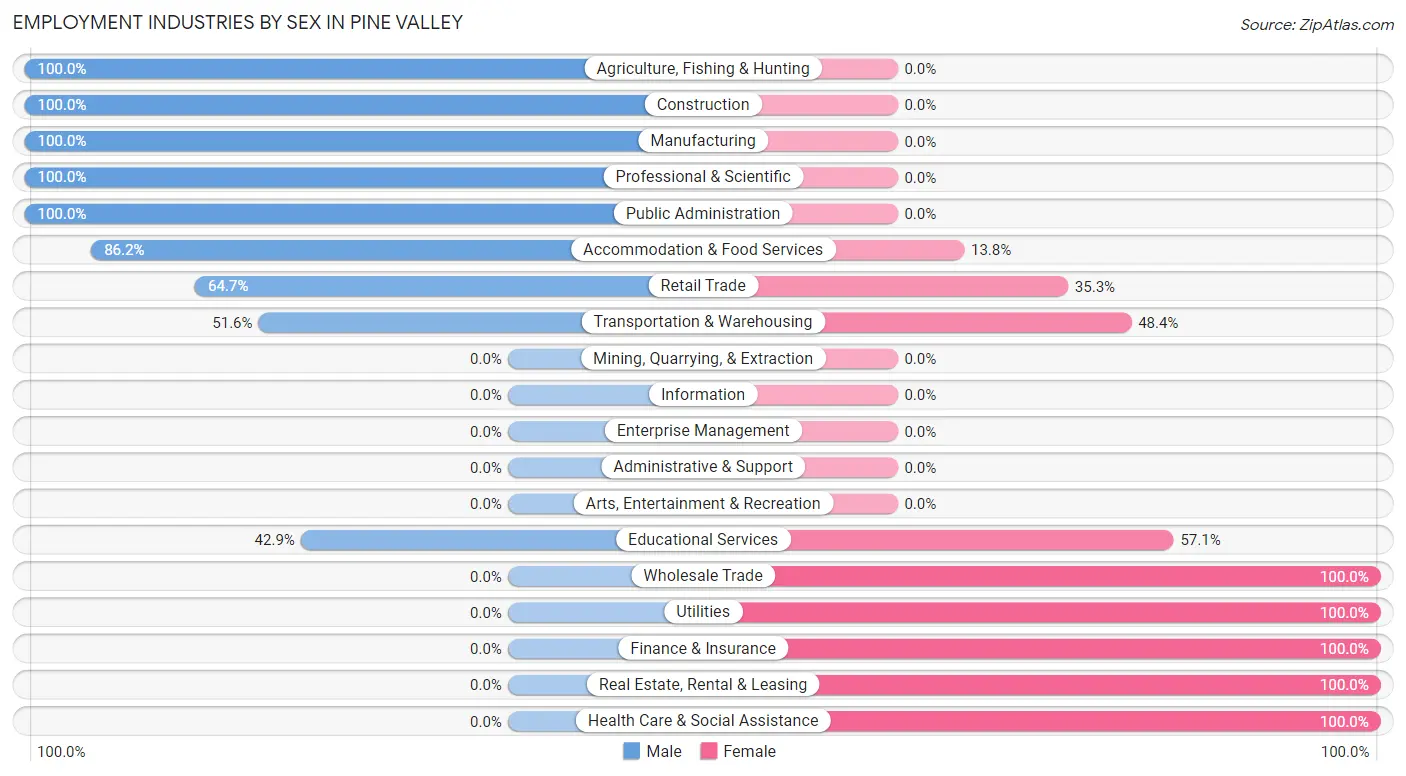
Employment Industries by Sex in Pine Valley
The Pine Valley industries that see more men than women are Agriculture, Fishing & Hunting (100.0%), Construction (100.0%), and Manufacturing (100.0%), whereas the industries that tend to have a higher number of women are Wholesale Trade (100.0%), Utilities (100.0%), and Finance & Insurance (100.0%).
| Industry | Male | Female |
| Agriculture, Fishing & Hunting | 16 (100.0%) | 0 (0.0%) |
| Mining, Quarrying, & Extraction | 0 (0.0%) | 0 (0.0%) |
| Construction | 30 (100.0%) | 0 (0.0%) |
| Manufacturing | 16 (100.0%) | 0 (0.0%) |
| Wholesale Trade | 0 (0.0%) | 14 (100.0%) |
| Retail Trade | 66 (64.7%) | 36 (35.3%) |
| Transportation & Warehousing | 16 (51.6%) | 15 (48.4%) |
| Utilities | 0 (0.0%) | 4 (100.0%) |
| Information | 0 (0.0%) | 0 (0.0%) |
| Finance & Insurance | 0 (0.0%) | 15 (100.0%) |
| Real Estate, Rental & Leasing | 0 (0.0%) | 25 (100.0%) |
| Professional & Scientific | 4 (100.0%) | 0 (0.0%) |
| Enterprise Management | 0 (0.0%) | 0 (0.0%) |
| Administrative & Support | 0 (0.0%) | 0 (0.0%) |
| Educational Services | 24 (42.9%) | 32 (57.1%) |
| Health Care & Social Assistance | 0 (0.0%) | 48 (100.0%) |
| Arts, Entertainment & Recreation | 0 (0.0%) | 0 (0.0%) |
| Accommodation & Food Services | 50 (86.2%) | 8 (13.8%) |
| Public Administration | 93 (100.0%) | 0 (0.0%) |
| Total | 354 (63.2%) | 206 (36.8%) |
Education in Pine Valley
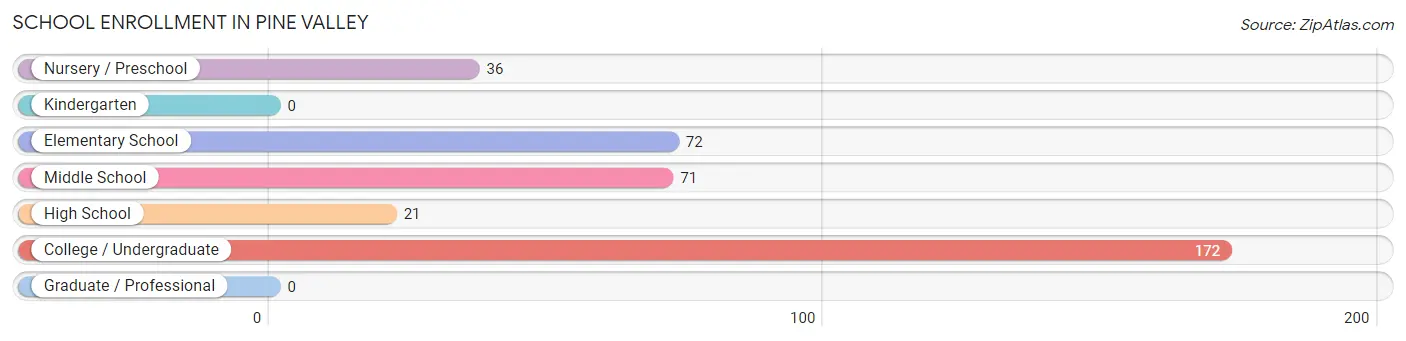
School Enrollment in Pine Valley
The most common levels of schooling among the 372 students in Pine Valley are college / undergraduate (172 | 46.2%), elementary school (72 | 19.4%), and middle school (71 | 19.1%).
| School Level | # Students | % Students |
| Nursery / Preschool | 36 | 9.7% |
| Kindergarten | 0 | 0.0% |
| Elementary School | 72 | 19.4% |
| Middle School | 71 | 19.1% |
| High School | 21 | 5.7% |
| College / Undergraduate | 172 | 46.2% |
| Graduate / Professional | 0 | 0.0% |
| Total | 372 | 100.0% |
School Enrollment by Age by Funding Source in Pine Valley
Out of a total of 372 students who are enrolled in schools in Pine Valley, 47 (12.6%) attend a private institution, while the remaining 325 (87.4%) are enrolled in public schools. The age group of 3 to 4 year olds has the highest likelihood of being enrolled in private schools, with 36 (100.0% in the age bracket) enrolled. Conversely, the age group of 5 to 9 year old has the lowest likelihood of being enrolled in a private school, with 72 (100.0% in the age bracket) attending a public institution.
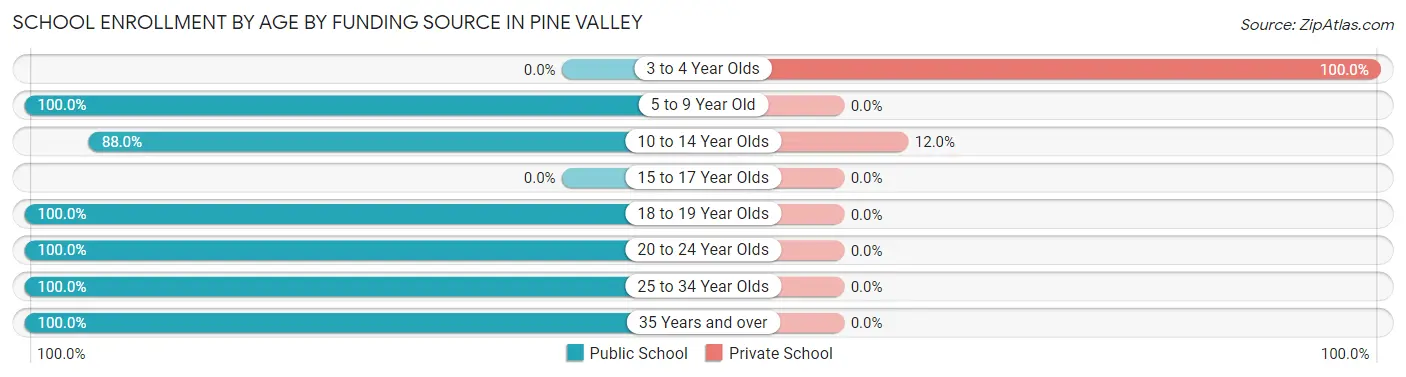
| Age Bracket | Public School | Private School |
| 3 to 4 Year Olds | 0 (0.0%) | 36 (100.0%) |
| 5 to 9 Year Old | 72 (100.0%) | 0 (0.0%) |
| 10 to 14 Year Olds | 81 (88.0%) | 11 (12.0%) |
| 15 to 17 Year Olds | 0 (0.0%) | 0 (0.0%) |
| 18 to 19 Year Olds | 17 (100.0%) | 0 (0.0%) |
| 20 to 24 Year Olds | 82 (100.0%) | 0 (0.0%) |
| 25 to 34 Year Olds | 56 (100.0%) | 0 (0.0%) |
| 35 Years and over | 17 (100.0%) | 0 (0.0%) |
| Total | 325 (87.4%) | 47 (12.6%) |
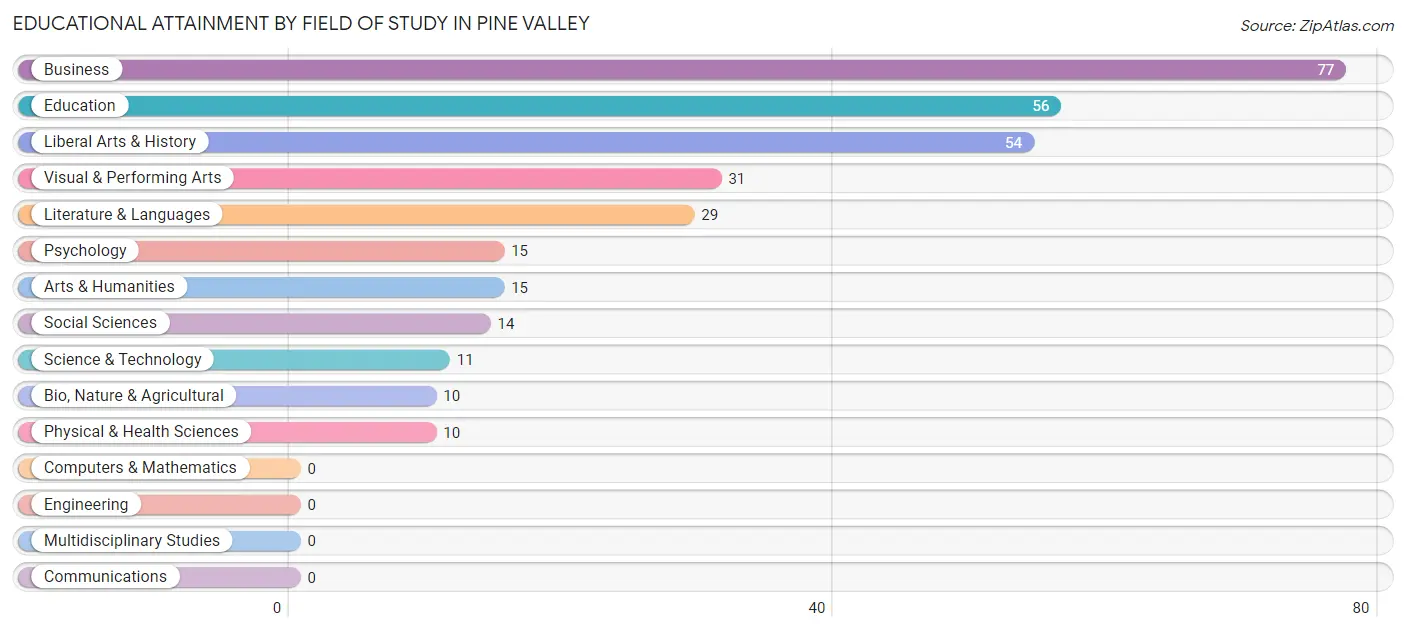
Educational Attainment by Field of Study in Pine Valley
Business (77 | 23.9%), education (56 | 17.4%), liberal arts & history (54 | 16.8%), visual & performing arts (31 | 9.6%), and literature & languages (29 | 9.0%) are the most common fields of study among 322 individuals in Pine Valley who have obtained a bachelor's degree or higher.
| Field of Study | # Graduates | % Graduates |
| Computers & Mathematics | 0 | 0.0% |
| Bio, Nature & Agricultural | 10 | 3.1% |
| Physical & Health Sciences | 10 | 3.1% |
| Psychology | 15 | 4.7% |
| Social Sciences | 14 | 4.3% |
| Engineering | 0 | 0.0% |
| Multidisciplinary Studies | 0 | 0.0% |
| Science & Technology | 11 | 3.4% |
| Business | 77 | 23.9% |
| Education | 56 | 17.4% |
| Literature & Languages | 29 | 9.0% |
| Liberal Arts & History | 54 | 16.8% |
| Visual & Performing Arts | 31 | 9.6% |
| Communications | 0 | 0.0% |
| Arts & Humanities | 15 | 4.7% |
| Total | 322 | 100.0% |
Transportation & Commute in Pine Valley
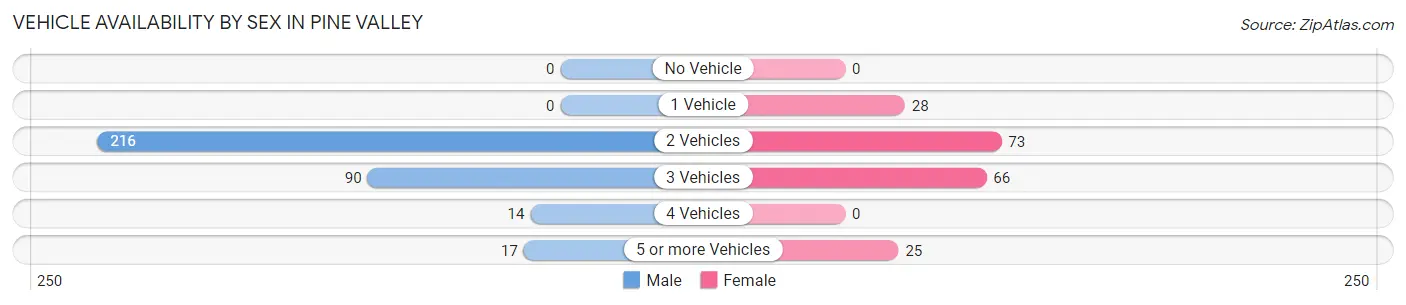
Vehicle Availability by Sex in Pine Valley
The most prevalent vehicle ownership categories in Pine Valley are males with 2 vehicles (216, accounting for 64.1%) and females with 2 vehicles (73, making up 112.5%).
| Vehicles Available | Male | Female |
| No Vehicle | 0 (0.0%) | 0 (0.0%) |
| 1 Vehicle | 0 (0.0%) | 28 (14.6%) |
| 2 Vehicles | 216 (64.1%) | 73 (38.0%) |
| 3 Vehicles | 90 (26.7%) | 66 (34.4%) |
| 4 Vehicles | 14 (4.2%) | 0 (0.0%) |
| 5 or more Vehicles | 17 (5.0%) | 25 (13.0%) |
| Total | 337 (100.0%) | 192 (100.0%) |
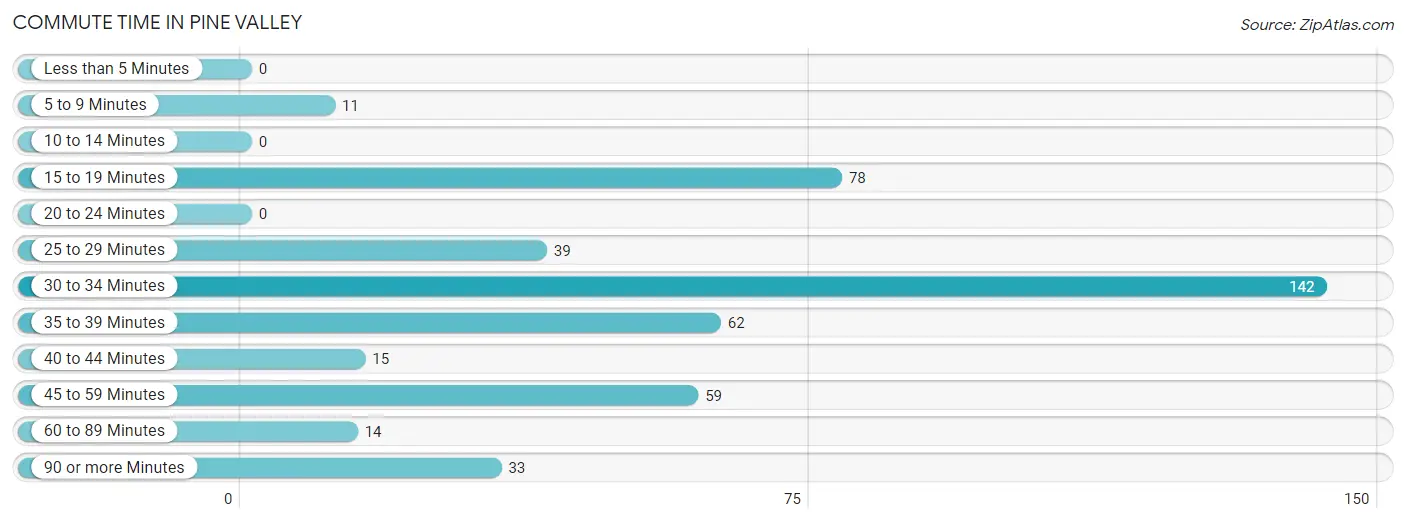
Commute Time in Pine Valley
The most frequently occuring commute durations in Pine Valley are 30 to 34 minutes (142 commuters, 31.4%), 15 to 19 minutes (78 commuters, 17.2%), and 35 to 39 minutes (62 commuters, 13.7%).
| Commute Time | # Commuters | % Commuters |
| Less than 5 Minutes | 0 | 0.0% |
| 5 to 9 Minutes | 11 | 2.4% |
| 10 to 14 Minutes | 0 | 0.0% |
| 15 to 19 Minutes | 78 | 17.2% |
| 20 to 24 Minutes | 0 | 0.0% |
| 25 to 29 Minutes | 39 | 8.6% |
| 30 to 34 Minutes | 142 | 31.4% |
| 35 to 39 Minutes | 62 | 13.7% |
| 40 to 44 Minutes | 15 | 3.3% |
| 45 to 59 Minutes | 59 | 13.0% |
| 60 to 89 Minutes | 14 | 3.1% |
| 90 or more Minutes | 33 | 7.3% |
Commute Time by Sex in Pine Valley
The most common commute times in Pine Valley are 30 to 34 minutes (70 commuters, 23.8%) for males and 30 to 34 minutes (72 commuters, 45.3%) for females.
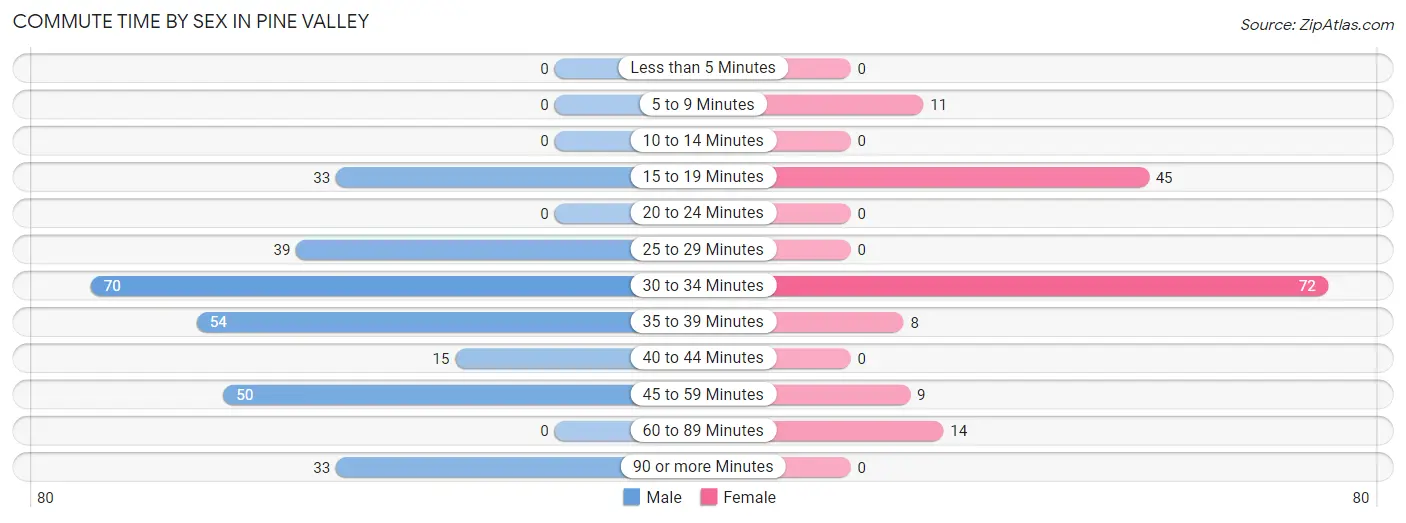
| Commute Time | Male | Female |
| Less than 5 Minutes | 0 (0.0%) | 0 (0.0%) |
| 5 to 9 Minutes | 0 (0.0%) | 11 (6.9%) |
| 10 to 14 Minutes | 0 (0.0%) | 0 (0.0%) |
| 15 to 19 Minutes | 33 (11.2%) | 45 (28.3%) |
| 20 to 24 Minutes | 0 (0.0%) | 0 (0.0%) |
| 25 to 29 Minutes | 39 (13.3%) | 0 (0.0%) |
| 30 to 34 Minutes | 70 (23.8%) | 72 (45.3%) |
| 35 to 39 Minutes | 54 (18.4%) | 8 (5.0%) |
| 40 to 44 Minutes | 15 (5.1%) | 0 (0.0%) |
| 45 to 59 Minutes | 50 (17.0%) | 9 (5.7%) |
| 60 to 89 Minutes | 0 (0.0%) | 14 (8.8%) |
| 90 or more Minutes | 33 (11.2%) | 0 (0.0%) |
Time of Departure to Work by Sex in Pine Valley
The most frequent times of departure to work in Pine Valley are 5:30 AM to 5:59 AM (82, 27.9%) for males and 8:00 AM to 8:29 AM (52, 32.7%) for females.
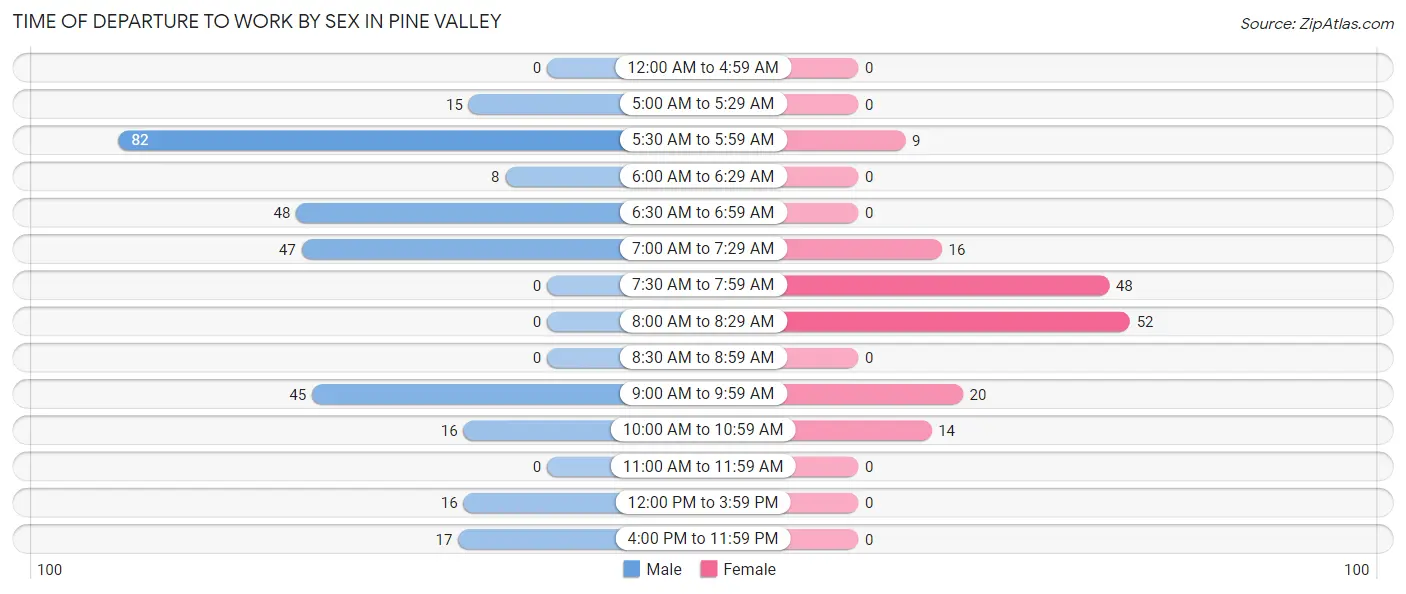
| Time of Departure | Male | Female |
| 12:00 AM to 4:59 AM | 0 (0.0%) | 0 (0.0%) |
| 5:00 AM to 5:29 AM | 15 (5.1%) | 0 (0.0%) |
| 5:30 AM to 5:59 AM | 82 (27.9%) | 9 (5.7%) |
| 6:00 AM to 6:29 AM | 8 (2.7%) | 0 (0.0%) |
| 6:30 AM to 6:59 AM | 48 (16.3%) | 0 (0.0%) |
| 7:00 AM to 7:29 AM | 47 (16.0%) | 16 (10.1%) |
| 7:30 AM to 7:59 AM | 0 (0.0%) | 48 (30.2%) |
| 8:00 AM to 8:29 AM | 0 (0.0%) | 52 (32.7%) |
| 8:30 AM to 8:59 AM | 0 (0.0%) | 0 (0.0%) |
| 9:00 AM to 9:59 AM | 45 (15.3%) | 20 (12.6%) |
| 10:00 AM to 10:59 AM | 16 (5.4%) | 14 (8.8%) |
| 11:00 AM to 11:59 AM | 0 (0.0%) | 0 (0.0%) |
| 12:00 PM to 3:59 PM | 16 (5.4%) | 0 (0.0%) |
| 4:00 PM to 11:59 PM | 17 (5.8%) | 0 (0.0%) |
| Total | 294 (100.0%) | 159 (100.0%) |
Housing Occupancy in Pine Valley
Occupancy by Ownership in Pine Valley
Of the total 665 dwellings in Pine Valley, owner-occupied units account for 602 (90.5%), while renter-occupied units make up 63 (9.5%).
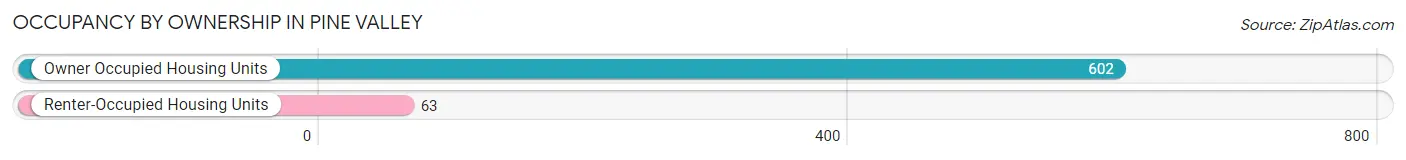
| Occupancy | # Housing Units | % Housing Units |
| Owner Occupied Housing Units | 602 | 90.5% |
| Renter-Occupied Housing Units | 63 | 9.5% |
| Total Occupied Housing Units | 665 | 100.0% |
Occupancy by Household Size in Pine Valley
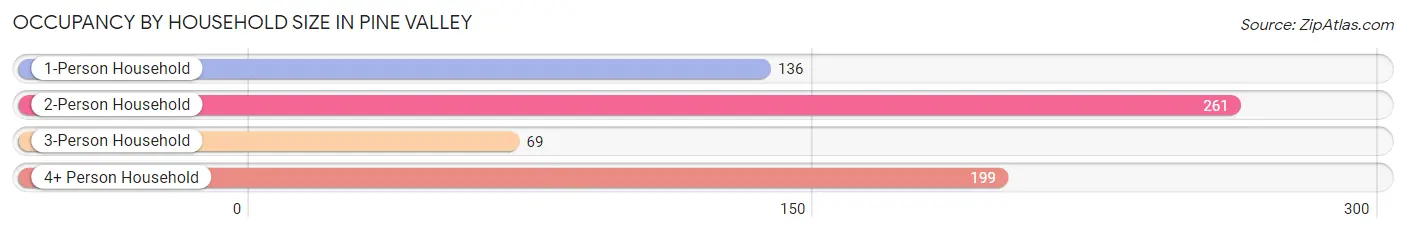
| Household Size | # Housing Units | % Housing Units |
| 1-Person Household | 136 | 20.4% |
| 2-Person Household | 261 | 39.3% |
| 3-Person Household | 69 | 10.4% |
| 4+ Person Household | 199 | 29.9% |
| Total Housing Units | 665 | 100.0% |
Occupancy by Ownership by Household Size in Pine Valley
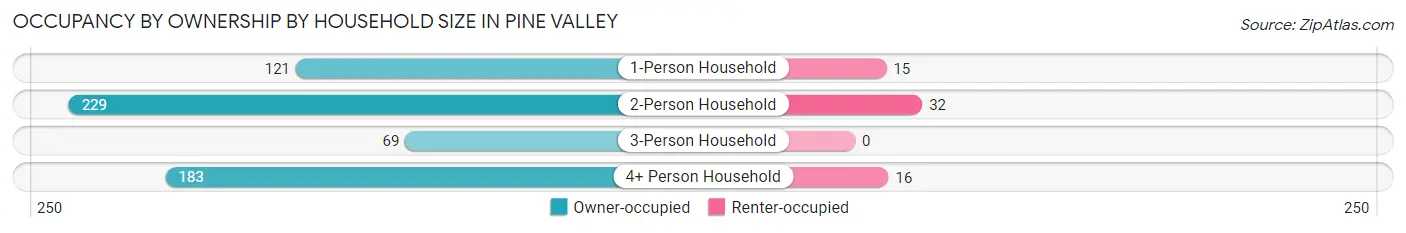
| Household Size | Owner-occupied | Renter-occupied |
| 1-Person Household | 121 (89.0%) | 15 (11.0%) |
| 2-Person Household | 229 (87.7%) | 32 (12.3%) |
| 3-Person Household | 69 (100.0%) | 0 (0.0%) |
| 4+ Person Household | 183 (92.0%) | 16 (8.0%) |
| Total Housing Units | 602 (90.5%) | 63 (9.5%) |
Occupancy by Educational Attainment in Pine Valley
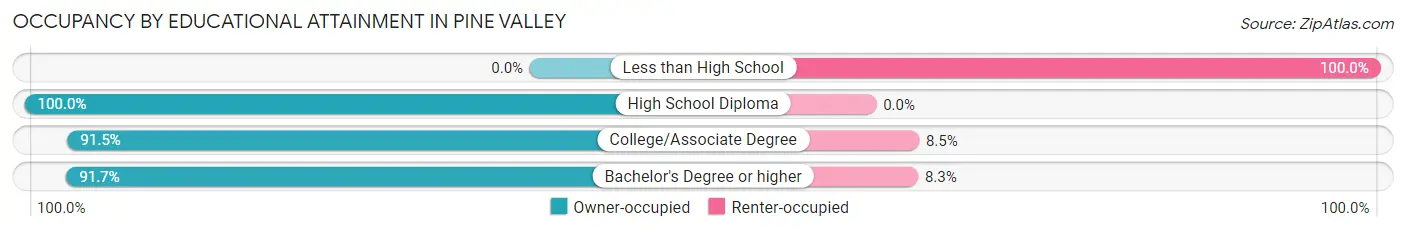
| Household Size | Owner-occupied | Renter-occupied |
| Less than High School | 0 (0.0%) | 16 (100.0%) |
| High School Diploma | 91 (100.0%) | 0 (0.0%) |
| College/Associate Degree | 345 (91.5%) | 32 (8.5%) |
| Bachelor's Degree or higher | 166 (91.7%) | 15 (8.3%) |
Occupancy by Age of Householder in Pine Valley
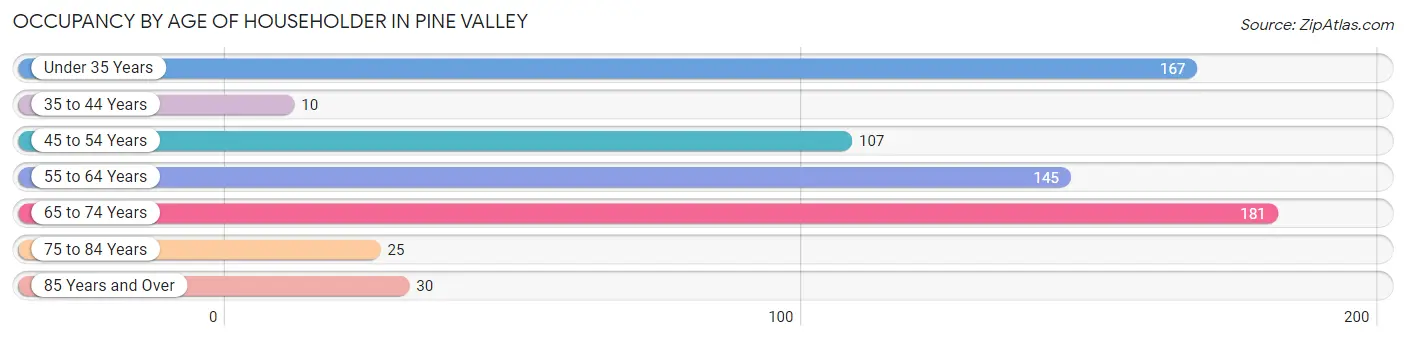
| Age Bracket | # Households | % Households |
| Under 35 Years | 167 | 25.1% |
| 35 to 44 Years | 10 | 1.5% |
| 45 to 54 Years | 107 | 16.1% |
| 55 to 64 Years | 145 | 21.8% |
| 65 to 74 Years | 181 | 27.2% |
| 75 to 84 Years | 25 | 3.8% |
| 85 Years and Over | 30 | 4.5% |
| Total | 665 | 100.0% |
Housing Finances in Pine Valley
Median Income by Occupancy in Pine Valley
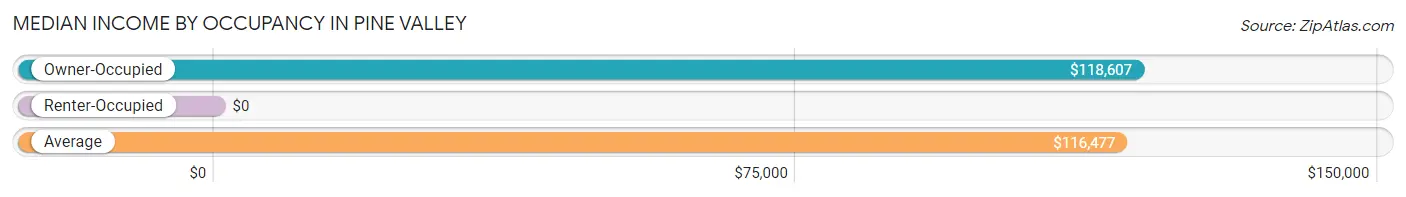
| Occupancy Type | # Households | Median Income |
| Owner-Occupied | 602 (90.5%) | $118,607 |
| Renter-Occupied | 63 (9.5%) | $0 |
| Average | 665 (100.0%) | $116,477 |
Occupancy by Householder Income Bracket in Pine Valley
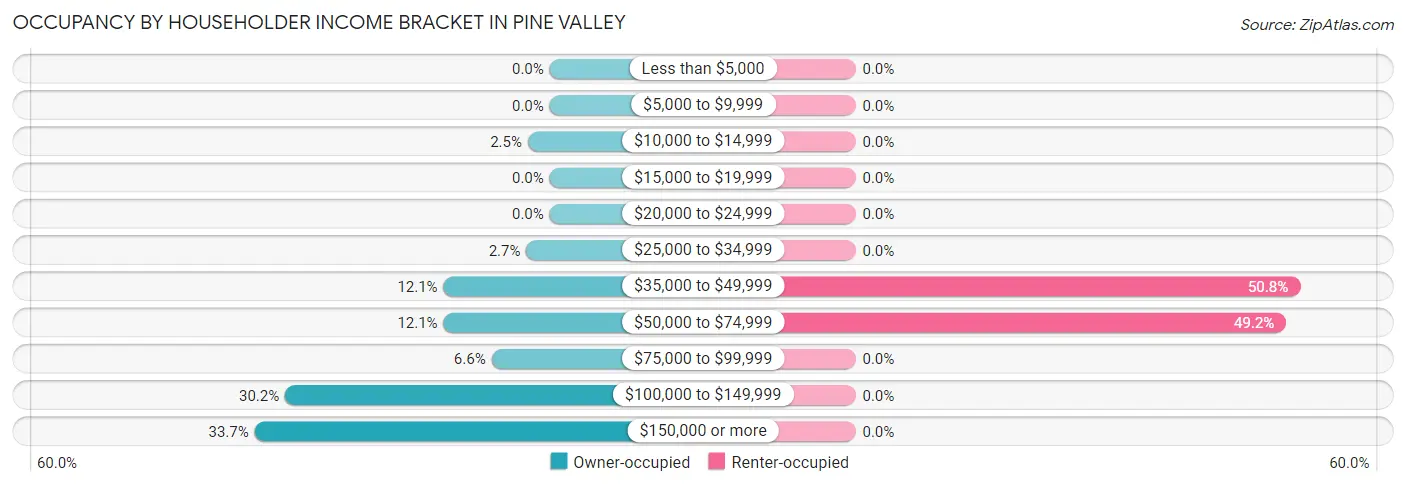
| Income Bracket | Owner-occupied | Renter-occupied |
| Less than $5,000 | 0 (0.0%) | 0 (0.0%) |
| $5,000 to $9,999 | 0 (0.0%) | 0 (0.0%) |
| $10,000 to $14,999 | 15 (2.5%) | 0 (0.0%) |
| $15,000 to $19,999 | 0 (0.0%) | 0 (0.0%) |
| $20,000 to $24,999 | 0 (0.0%) | 0 (0.0%) |
| $25,000 to $34,999 | 16 (2.7%) | 0 (0.0%) |
| $35,000 to $49,999 | 73 (12.1%) | 32 (50.8%) |
| $50,000 to $74,999 | 73 (12.1%) | 31 (49.2%) |
| $75,000 to $99,999 | 40 (6.6%) | 0 (0.0%) |
| $100,000 to $149,999 | 182 (30.2%) | 0 (0.0%) |
| $150,000 or more | 203 (33.7%) | 0 (0.0%) |
| Total | 602 (100.0%) | 63 (100.0%) |
Monthly Housing Cost Tiers in Pine Valley
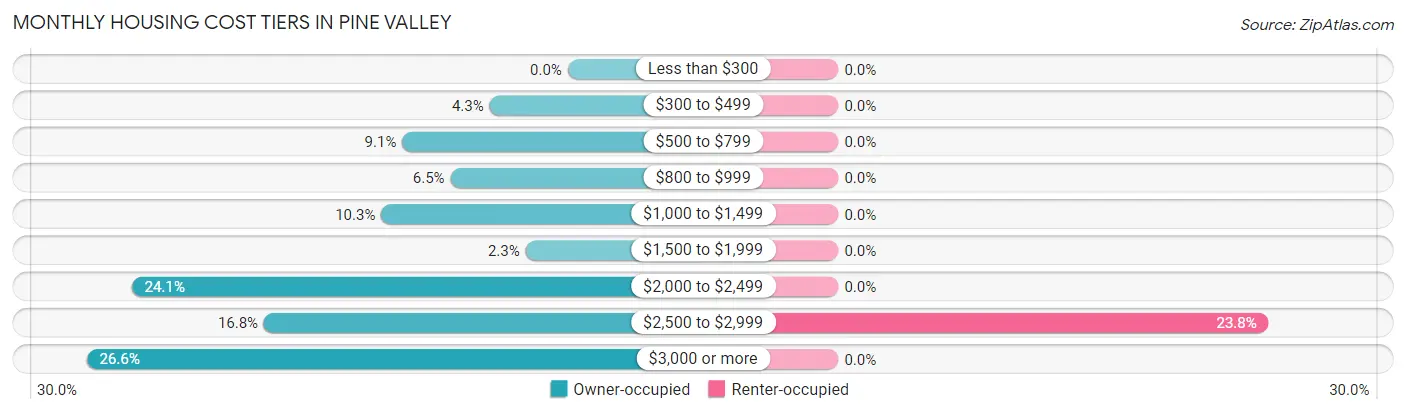
| Monthly Cost | Owner-occupied | Renter-occupied |
| Less than $300 | 0 (0.0%) | 0 (0.0%) |
| $300 to $499 | 26 (4.3%) | 0 (0.0%) |
| $500 to $799 | 55 (9.1%) | 0 (0.0%) |
| $800 to $999 | 39 (6.5%) | 0 (0.0%) |
| $1,000 to $1,499 | 62 (10.3%) | 0 (0.0%) |
| $1,500 to $1,999 | 14 (2.3%) | 0 (0.0%) |
| $2,000 to $2,499 | 145 (24.1%) | 0 (0.0%) |
| $2,500 to $2,999 | 101 (16.8%) | 15 (23.8%) |
| $3,000 or more | 160 (26.6%) | 0 (0.0%) |
| Total | 602 (100.0%) | 63 (100.0%) |
Physical Housing Characteristics in Pine Valley
Housing Structures in Pine Valley
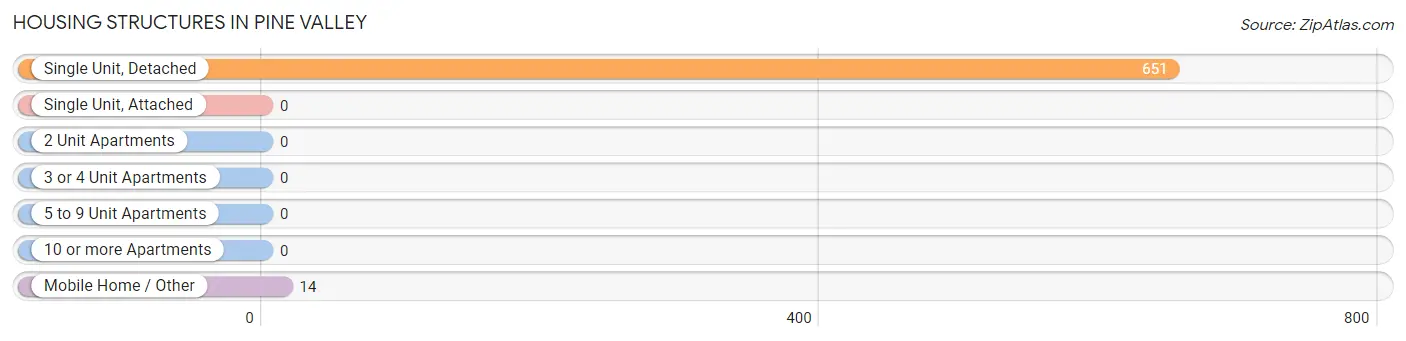
| Structure Type | # Housing Units | % Housing Units |
| Single Unit, Detached | 651 | 97.9% |
| Single Unit, Attached | 0 | 0.0% |
| 2 Unit Apartments | 0 | 0.0% |
| 3 or 4 Unit Apartments | 0 | 0.0% |
| 5 to 9 Unit Apartments | 0 | 0.0% |
| 10 or more Apartments | 0 | 0.0% |
| Mobile Home / Other | 14 | 2.1% |
| Total | 665 | 100.0% |
Housing Structures by Occupancy in Pine Valley
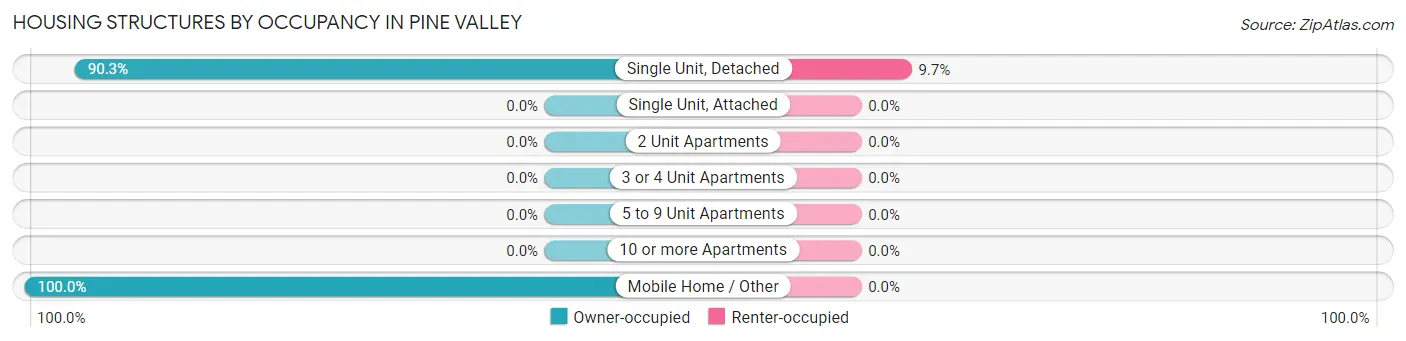
| Structure Type | Owner-occupied | Renter-occupied |
| Single Unit, Detached | 588 (90.3%) | 63 (9.7%) |
| Single Unit, Attached | 0 (0.0%) | 0 (0.0%) |
| 2 Unit Apartments | 0 (0.0%) | 0 (0.0%) |
| 3 or 4 Unit Apartments | 0 (0.0%) | 0 (0.0%) |
| 5 to 9 Unit Apartments | 0 (0.0%) | 0 (0.0%) |
| 10 or more Apartments | 0 (0.0%) | 0 (0.0%) |
| Mobile Home / Other | 14 (100.0%) | 0 (0.0%) |
| Total | 602 (90.5%) | 63 (9.5%) |
Housing Structures by Number of Rooms in Pine Valley
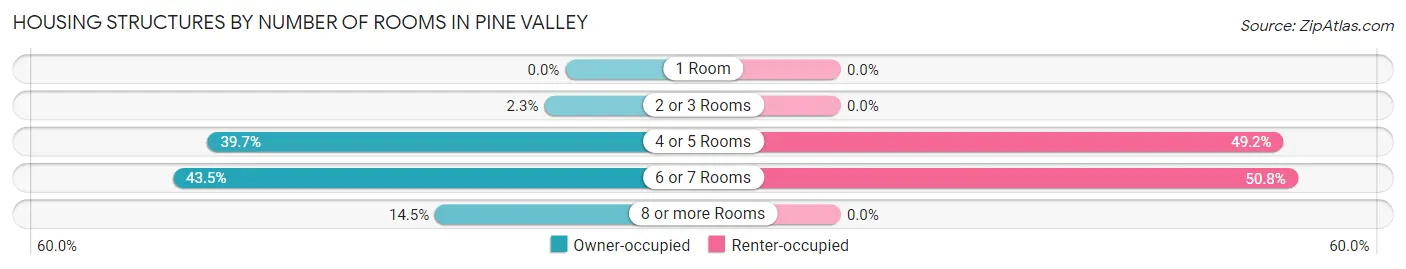
| Number of Rooms | Owner-occupied | Renter-occupied |
| 1 Room | 0 (0.0%) | 0 (0.0%) |
| 2 or 3 Rooms | 14 (2.3%) | 0 (0.0%) |
| 4 or 5 Rooms | 239 (39.7%) | 31 (49.2%) |
| 6 or 7 Rooms | 262 (43.5%) | 32 (50.8%) |
| 8 or more Rooms | 87 (14.4%) | 0 (0.0%) |
| Total | 602 (100.0%) | 63 (100.0%) |
Housing Structure by Heating Type in Pine Valley
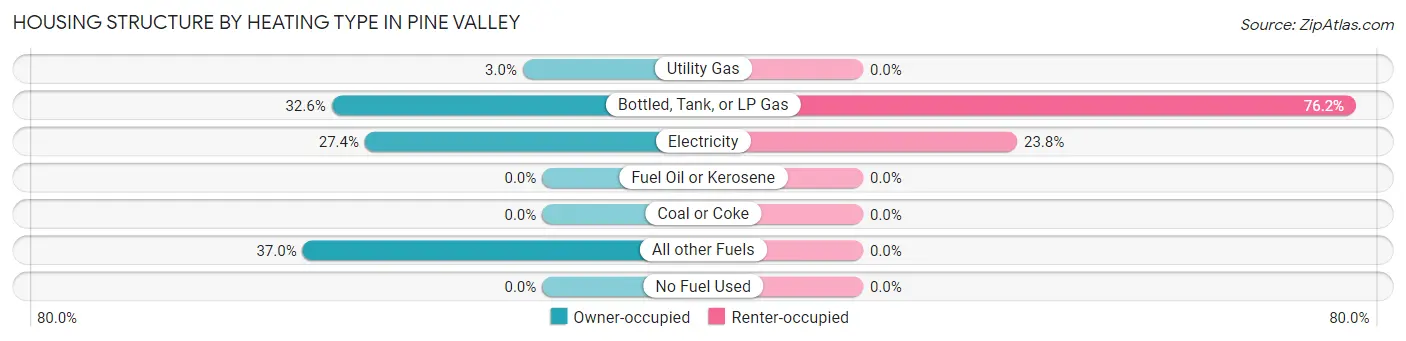
| Heating Type | Owner-occupied | Renter-occupied |
| Utility Gas | 18 (3.0%) | 0 (0.0%) |
| Bottled, Tank, or LP Gas | 196 (32.6%) | 48 (76.2%) |
| Electricity | 165 (27.4%) | 15 (23.8%) |
| Fuel Oil or Kerosene | 0 (0.0%) | 0 (0.0%) |
| Coal or Coke | 0 (0.0%) | 0 (0.0%) |
| All other Fuels | 223 (37.0%) | 0 (0.0%) |
| No Fuel Used | 0 (0.0%) | 0 (0.0%) |
| Total | 602 (100.0%) | 63 (100.0%) |
Household Vehicle Usage in Pine Valley
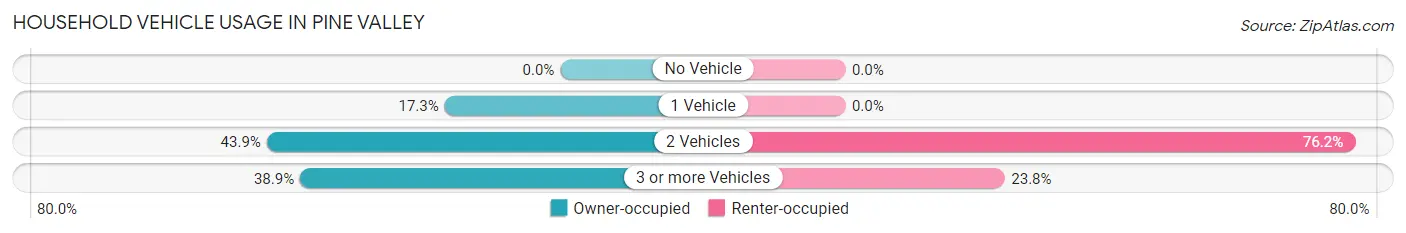
| Vehicles per Household | Owner-occupied | Renter-occupied |
| No Vehicle | 0 (0.0%) | 0 (0.0%) |
| 1 Vehicle | 104 (17.3%) | 0 (0.0%) |
| 2 Vehicles | 264 (43.9%) | 48 (76.2%) |
| 3 or more Vehicles | 234 (38.9%) | 15 (23.8%) |
| Total | 602 (100.0%) | 63 (100.0%) |
Real Estate & Mortgages in Pine Valley
Real Estate and Mortgage Overview in Pine Valley
| Characteristic | Without Mortgage | With Mortgage |
| Housing Units | 114 | 488 |
| Median Property Value | $610,000 | $538,700 |
| Median Household Income | $98,333 | $179 |
| Monthly Housing Costs | $711 | $160 |
| Real Estate Taxes | $3,609 | $0 |
Property Value by Mortgage Status in Pine Valley
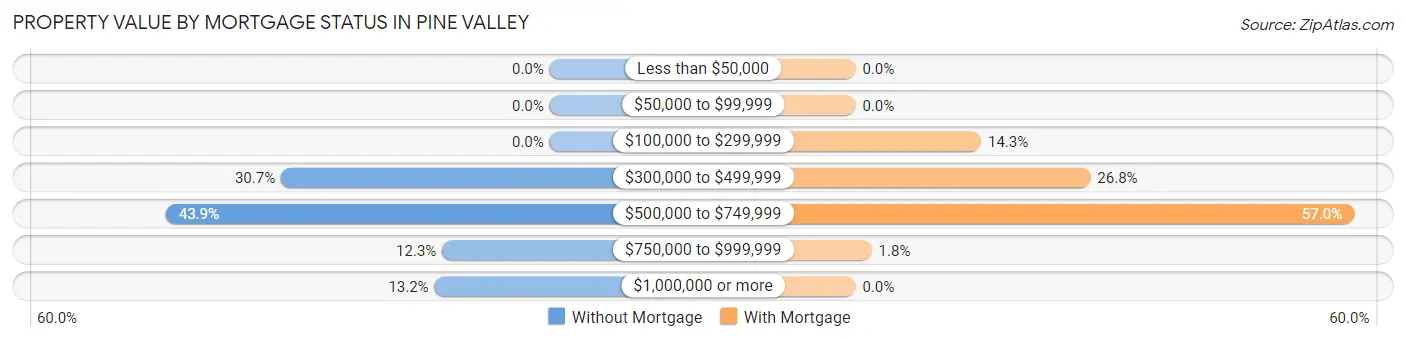
| Property Value | Without Mortgage | With Mortgage |
| Less than $50,000 | 0 (0.0%) | 0 (0.0%) |
| $50,000 to $99,999 | 0 (0.0%) | 0 (0.0%) |
| $100,000 to $299,999 | 0 (0.0%) | 70 (14.3%) |
| $300,000 to $499,999 | 35 (30.7%) | 131 (26.8%) |
| $500,000 to $749,999 | 50 (43.9%) | 278 (57.0%) |
| $750,000 to $999,999 | 14 (12.3%) | 9 (1.8%) |
| $1,000,000 or more | 15 (13.2%) | 0 (0.0%) |
| Total | 114 (100.0%) | 488 (100.0%) |
Household Income by Mortgage Status in Pine Valley
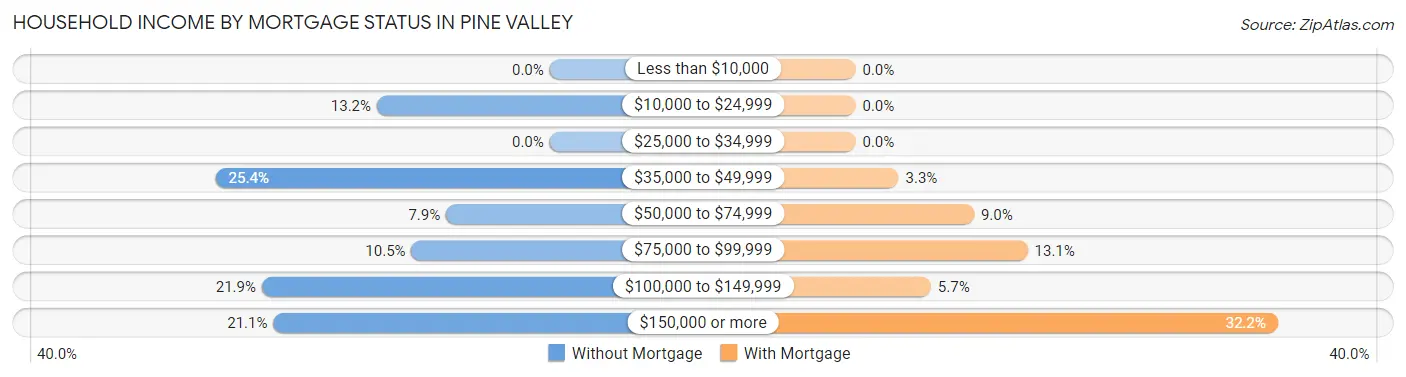
| Household Income | Without Mortgage | With Mortgage |
| Less than $10,000 | 0 (0.0%) | 0 (0.0%) |
| $10,000 to $24,999 | 15 (13.2%) | 0 (0.0%) |
| $25,000 to $34,999 | 0 (0.0%) | 0 (0.0%) |
| $35,000 to $49,999 | 29 (25.4%) | 16 (3.3%) |
| $50,000 to $74,999 | 9 (7.9%) | 44 (9.0%) |
| $75,000 to $99,999 | 12 (10.5%) | 64 (13.1%) |
| $100,000 to $149,999 | 25 (21.9%) | 28 (5.7%) |
| $150,000 or more | 24 (21.0%) | 157 (32.2%) |
| Total | 114 (100.0%) | 488 (100.0%) |
Property Value to Household Income Ratio in Pine Valley
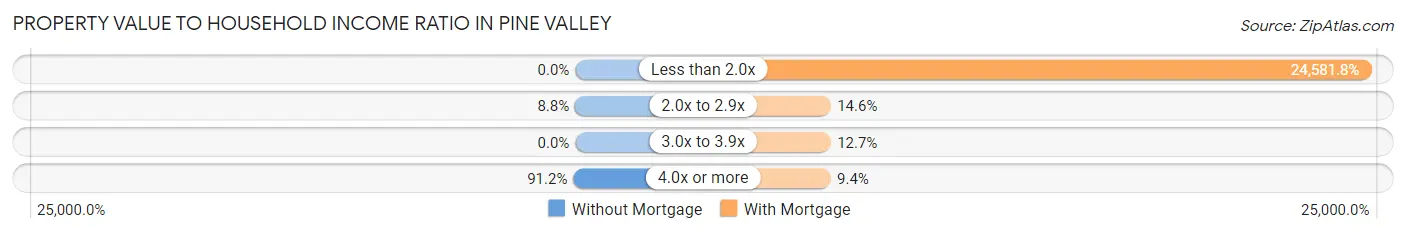
| Value-to-Income Ratio | Without Mortgage | With Mortgage |
| Less than 2.0x | 0 (0.0%) | 119,959 (24,581.8%) |
| 2.0x to 2.9x | 10 (8.8%) | 71 (14.5%) |
| 3.0x to 3.9x | 0 (0.0%) | 62 (12.7%) |
| 4.0x or more | 104 (91.2%) | 46 (9.4%) |
| Total | 114 (100.0%) | 488 (100.0%) |
Real Estate Taxes by Mortgage Status in Pine Valley
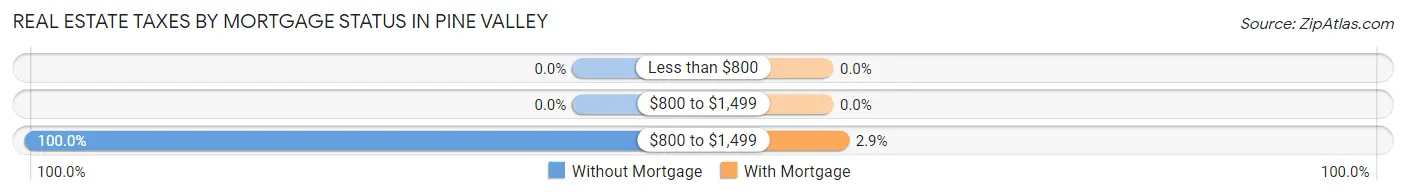
| Property Taxes | Without Mortgage | With Mortgage |
| Less than $800 | 0 (0.0%) | 0 (0.0%) |
| $800 to $1,499 | 0 (0.0%) | 0 (0.0%) |
| $800 to $1,499 | 114 (100.0%) | 14 (2.9%) |
| Total | 114 (100.0%) | 488 (100.0%) |
Health & Disability in Pine Valley
Health Insurance Coverage by Age in Pine Valley
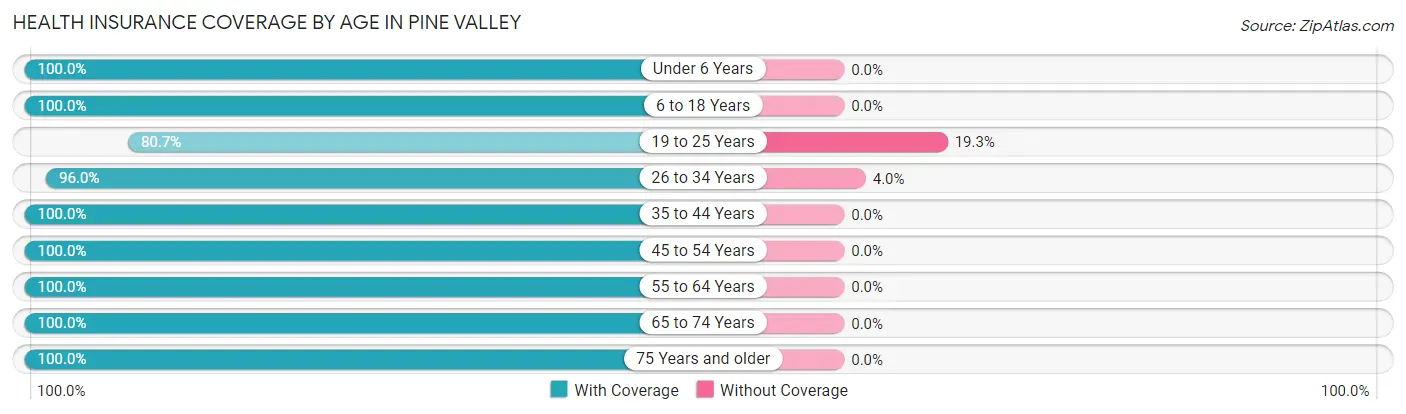
| Age Bracket | With Coverage | Without Coverage |
| Under 6 Years | 161 (100.0%) | 0 (0.0%) |
| 6 to 18 Years | 240 (100.0%) | 0 (0.0%) |
| 19 to 25 Years | 134 (80.7%) | 32 (19.3%) |
| 26 to 34 Years | 263 (96.0%) | 11 (4.0%) |
| 35 to 44 Years | 124 (100.0%) | 0 (0.0%) |
| 45 to 54 Years | 177 (100.0%) | 0 (0.0%) |
| 55 to 64 Years | 262 (100.0%) | 0 (0.0%) |
| 65 to 74 Years | 274 (100.0%) | 0 (0.0%) |
| 75 Years and older | 55 (100.0%) | 0 (0.0%) |
| Total | 1,690 (97.5%) | 43 (2.5%) |
Health Insurance Coverage by Citizenship Status in Pine Valley
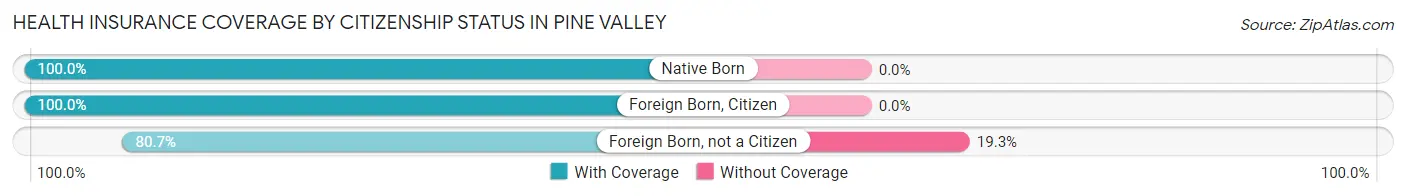
| Citizenship Status | With Coverage | Without Coverage |
| Native Born | 161 (100.0%) | 0 (0.0%) |
| Foreign Born, Citizen | 240 (100.0%) | 0 (0.0%) |
| Foreign Born, not a Citizen | 134 (80.7%) | 32 (19.3%) |
Health Insurance Coverage by Household Income in Pine Valley
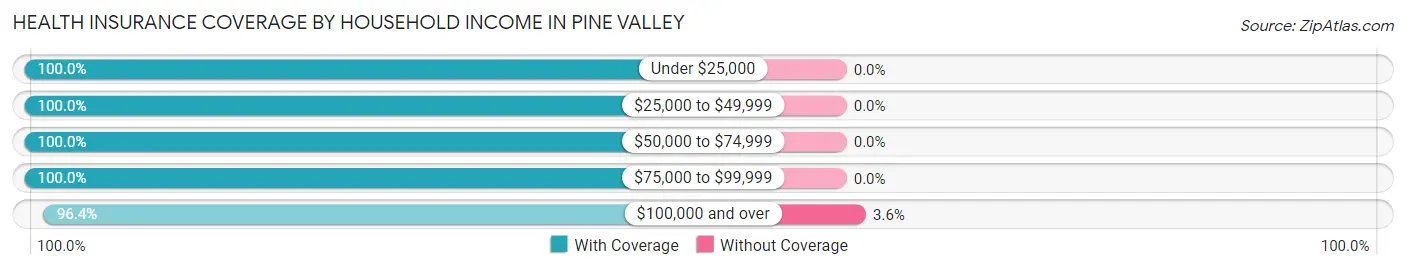
| Household Income | With Coverage | Without Coverage |
| Under $25,000 | 15 (100.0%) | 0 (0.0%) |
| $25,000 to $49,999 | 197 (100.0%) | 0 (0.0%) |
| $50,000 to $74,999 | 245 (100.0%) | 0 (0.0%) |
| $75,000 to $99,999 | 88 (100.0%) | 0 (0.0%) |
| $100,000 and over | 1,145 (96.4%) | 43 (3.6%) |
Public vs Private Health Insurance Coverage by Age in Pine Valley
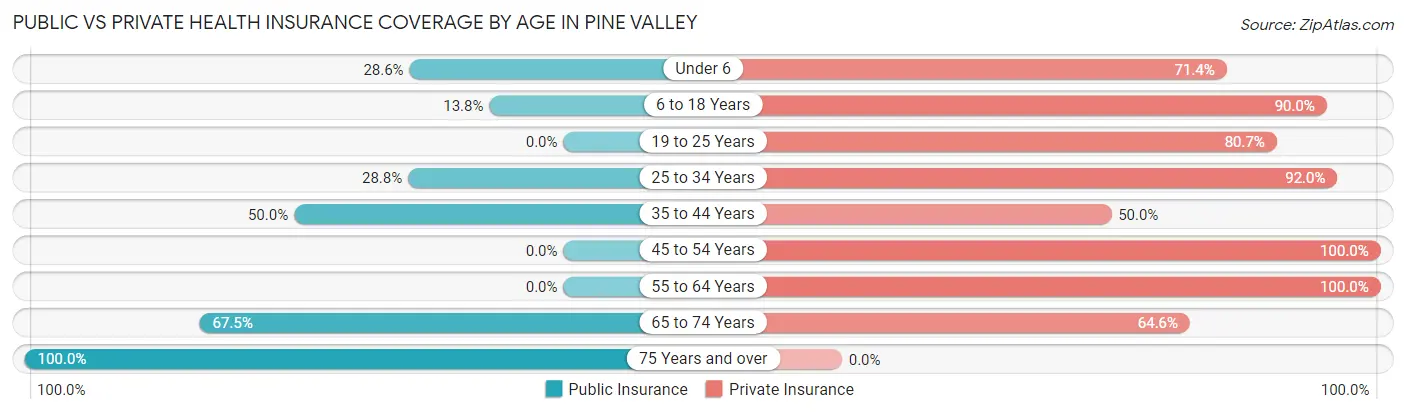
| Age Bracket | Public Insurance | Private Insurance |
| Under 6 | 46 (28.6%) | 115 (71.4%) |
| 6 to 18 Years | 33 (13.8%) | 216 (90.0%) |
| 19 to 25 Years | 0 (0.0%) | 134 (80.7%) |
| 25 to 34 Years | 79 (28.8%) | 252 (92.0%) |
| 35 to 44 Years | 62 (50.0%) | 62 (50.0%) |
| 45 to 54 Years | 0 (0.0%) | 177 (100.0%) |
| 55 to 64 Years | 0 (0.0%) | 262 (100.0%) |
| 65 to 74 Years | 185 (67.5%) | 177 (64.6%) |
| 75 Years and over | 55 (100.0%) | 0 (0.0%) |
| Total | 460 (26.5%) | 1,395 (80.5%) |
Disability Status by Sex by Age in Pine Valley
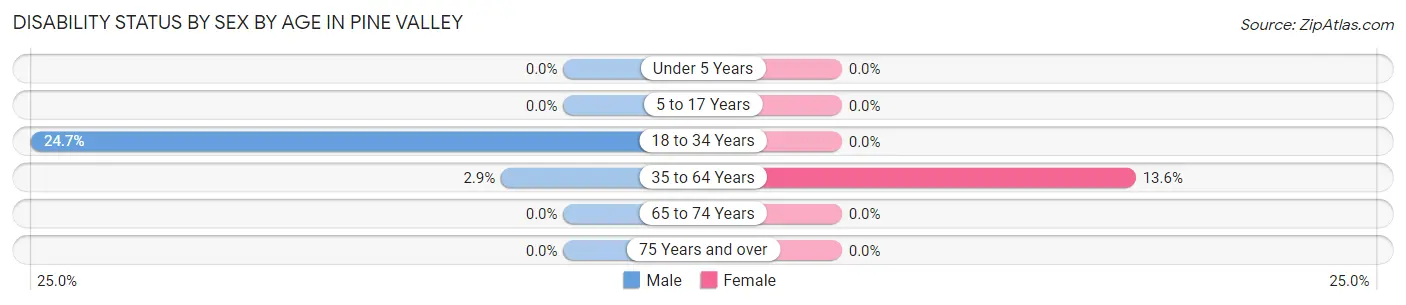
| Age Bracket | Male | Female |
| Under 5 Years | 0 (0.0%) | 0 (0.0%) |
| 5 to 17 Years | 0 (0.0%) | 0 (0.0%) |
| 18 to 34 Years | 62 (24.7%) | 0 (0.0%) |
| 35 to 64 Years | 8 (2.9%) | 39 (13.6%) |
| 65 to 74 Years | 0 (0.0%) | 0 (0.0%) |
| 75 Years and over | 0 (0.0%) | 0 (0.0%) |
Disability Class by Sex by Age in Pine Valley
Disability Class: Hearing Difficulty
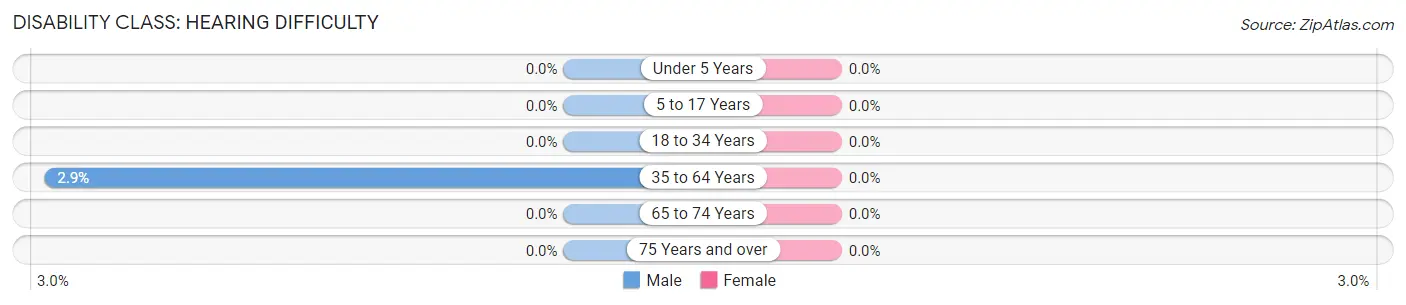
| Age Bracket | Male | Female |
| Under 5 Years | 0 (0.0%) | 0 (0.0%) |
| 5 to 17 Years | 0 (0.0%) | 0 (0.0%) |
| 18 to 34 Years | 0 (0.0%) | 0 (0.0%) |
| 35 to 64 Years | 8 (2.9%) | 0 (0.0%) |
| 65 to 74 Years | 0 (0.0%) | 0 (0.0%) |
| 75 Years and over | 0 (0.0%) | 0 (0.0%) |
Disability Class: Vision Difficulty
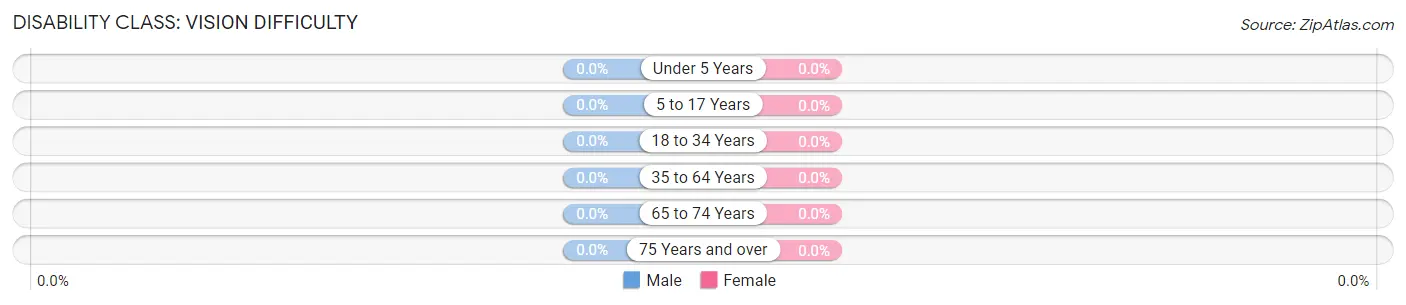
| Age Bracket | Male | Female |
| Under 5 Years | 0 (0.0%) | 0 (0.0%) |
| 5 to 17 Years | 0 (0.0%) | 0 (0.0%) |
| 18 to 34 Years | 0 (0.0%) | 0 (0.0%) |
| 35 to 64 Years | 0 (0.0%) | 0 (0.0%) |
| 65 to 74 Years | 0 (0.0%) | 0 (0.0%) |
| 75 Years and over | 0 (0.0%) | 0 (0.0%) |
Disability Class: Cognitive Difficulty
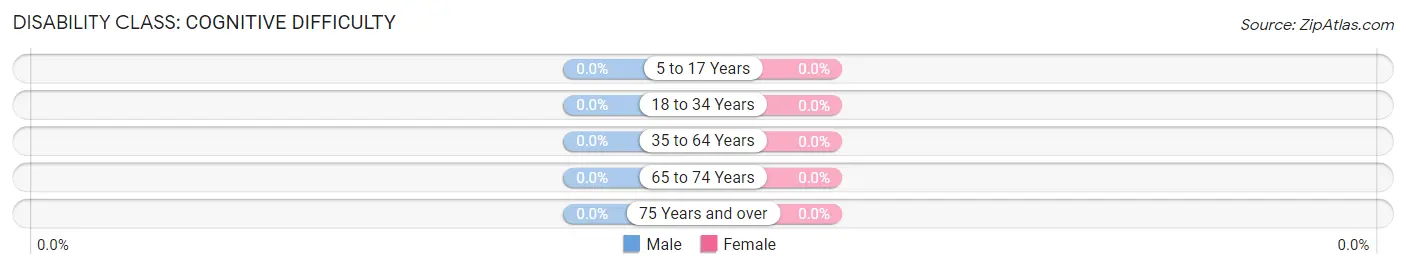
| Age Bracket | Male | Female |
| 5 to 17 Years | 0 (0.0%) | 0 (0.0%) |
| 18 to 34 Years | 0 (0.0%) | 0 (0.0%) |
| 35 to 64 Years | 0 (0.0%) | 0 (0.0%) |
| 65 to 74 Years | 0 (0.0%) | 0 (0.0%) |
| 75 Years and over | 0 (0.0%) | 0 (0.0%) |
Disability Class: Ambulatory Difficulty
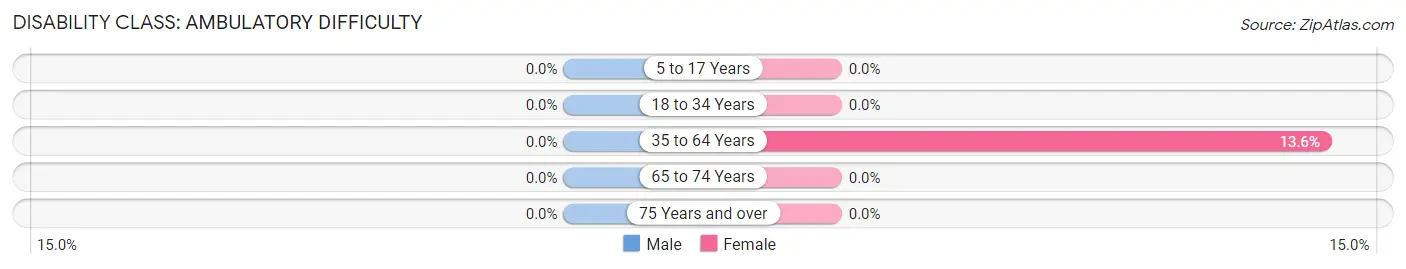
| Age Bracket | Male | Female |
| 5 to 17 Years | 0 (0.0%) | 0 (0.0%) |
| 18 to 34 Years | 0 (0.0%) | 0 (0.0%) |
| 35 to 64 Years | 0 (0.0%) | 39 (13.6%) |
| 65 to 74 Years | 0 (0.0%) | 0 (0.0%) |
| 75 Years and over | 0 (0.0%) | 0 (0.0%) |
Disability Class: Self-Care Difficulty
| Age Bracket | Male | Female |
| 5 to 17 Years | 0 (0.0%) | 0 (0.0%) |
| 18 to 34 Years | 0 (0.0%) | 0 (0.0%) |
| 35 to 64 Years | 0 (0.0%) | 0 (0.0%) |
| 65 to 74 Years | 0 (0.0%) | 0 (0.0%) |
| 75 Years and over | 0 (0.0%) | 0 (0.0%) |
Technology Access in Pine Valley
Computing Device Access in Pine Valley
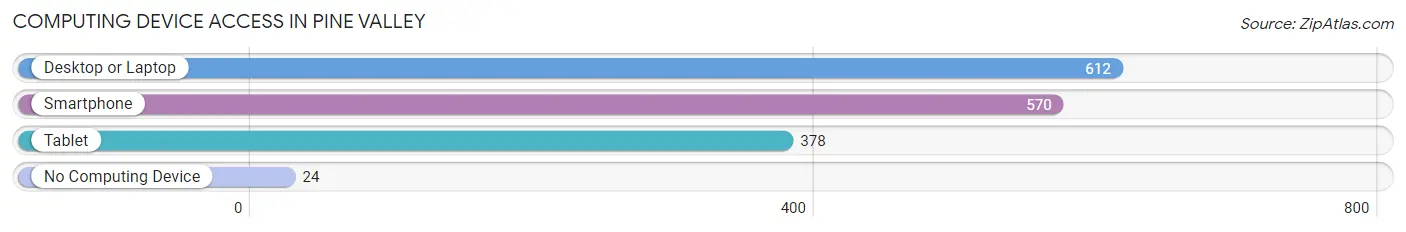
| Device Type | # Households | % Households |
| Desktop or Laptop | 612 | 92.0% |
| Smartphone | 570 | 85.7% |
| Tablet | 378 | 56.8% |
| No Computing Device | 24 | 3.6% |
| Total | 665 | 100.0% |
Internet Access in Pine Valley
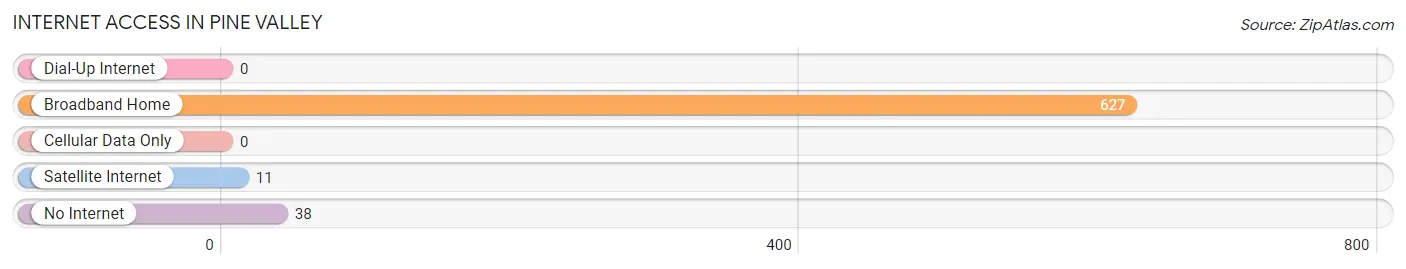
| Internet Type | # Households | % Households |
| Dial-Up Internet | 0 | 0.0% |
| Broadband Home | 627 | 94.3% |
| Cellular Data Only | 0 | 0.0% |
| Satellite Internet | 11 | 1.7% |
| No Internet | 38 | 5.7% |
| Total | 665 | 100.0% |
Pine Valley Summary
Pine Valley is a small unincorporated community located in San Diego County, California. It is situated in the foothills of the Laguna Mountains, approximately 25 miles east of San Diego. The community is surrounded by the Cleveland National Forest and is home to a population of approximately 1,500 people.
History
Pine Valley was first settled in the late 1800s by homesteaders who were attracted to the area by its abundant natural resources. The first settlers were primarily ranchers and farmers who raised cattle, sheep, and horses. The area was also known for its timber, which was harvested for use in the construction of homes and other buildings.
In the early 1900s, the area began to attract tourists who were drawn to the area's natural beauty. The first hotel was built in the area in 1910, and the first post office was established in 1912.
In the 1920s, the area began to attract more permanent residents, and the population began to grow. The first school was built in the area in 1925, and the first church was established in 1927.
Geography
Pine Valley is located in the foothills of the Laguna Mountains, approximately 25 miles east of San Diego. The area is surrounded by the Cleveland National Forest and is home to a variety of wildlife, including deer, coyotes, and mountain lions. The area is also known for its abundant wildflowers, which bloom in the spring and summer months.
The climate in Pine Valley is mild and temperate, with temperatures ranging from the mid-50s in the winter to the mid-80s in the summer. The area receives an average of 15 inches of rain per year.
Economy
The economy of Pine Valley is largely based on tourism and agriculture. The area is home to several small businesses, including restaurants, shops, and lodging. The area is also home to several wineries, which produce a variety of wines.
Agriculture is also an important part of the local economy. The area is home to several farms, which produce a variety of fruits and vegetables, including apples, oranges, and avocados.
Demographics
As of the 2010 census, the population of Pine Valley was 1,500. The racial makeup of the area was 94.2% White, 0.7% African American, 0.7% Native American, 0.7% Asian, 0.7% Pacific Islander, and 2.7% from other races. The median household income was $45,000, and the median age was 44.
Conclusion
Pine Valley is a small unincorporated community located in San Diego County, California. It is situated in the foothills of the Laguna Mountains, approximately 25 miles east of San Diego. The community is surrounded by the Cleveland National Forest and is home to a population of approximately 1,500 people. The economy of Pine Valley is largely based on tourism and agriculture, and the area is home to several small businesses, wineries, and farms. The population of Pine Valley is primarily White, with a median household income of $45,000 and a median age of 44.
Common Questions
What is Per Capita Income in Pine Valley?
Per Capita income in Pine Valley is $43,775.
What is the Median Family Income in Pine Valley?
Median Family Income in Pine Valley is $119,098.
What is the Median Household income in Pine Valley?
Median Household Income in Pine Valley is $116,477.
What is Income or Wage Gap in Pine Valley?
Income or Wage Gap in Pine Valley is 67.8%.
Women in Pine Valley earn 32.2 cents for every dollar earned by a man.
What is Inequality or Gini Index in Pine Valley?
Inequality or Gini Index in Pine Valley is 0.33.
What is the Total Population of Pine Valley?
Total Population of Pine Valley is 1,778.
What is the Total Male Population of Pine Valley?
Total Male Population of Pine Valley is 933.
What is the Total Female Population of Pine Valley?
Total Female Population of Pine Valley is 845.
What is the Ratio of Males per 100 Females in Pine Valley?
There are 110.41 Males per 100 Females in Pine Valley.
What is the Ratio of Females per 100 Males in Pine Valley?
There are 90.57 Females per 100 Males in Pine Valley.
What is the Median Population Age in Pine Valley?
Median Population Age in Pine Valley is 37.1 Years.
What is the Average Family Size in Pine Valley
Average Family Size in Pine Valley is 3.1 People.
What is the Average Household Size in Pine Valley
Average Household Size in Pine Valley is 2.7 People.
How Large is the Labor Force in Pine Valley?
There are 906 People in the Labor Forcein in Pine Valley.
What is the Percentage of People in the Labor Force in Pine Valley?
65.0% of People are in the Labor Force in Pine Valley.
What is the Unemployment Rate in Pine Valley?
Unemployment Rate in Pine Valley is 35.0%.