Pine Mountain Club, CA Map & Demographics
Pine Mountain Club Map
Pine Mountain Club Overview
$37,065
PER CAPITA INCOME
$57,174
AVG FAMILY INCOME
$48,828
AVG HOUSEHOLD INCOME
0.45
INEQUALITY / GINI INDEX
2,195
TOTAL POPULATION
1,224
MALE POPULATION
971
FEMALE POPULATION
126.06
MALES / 100 FEMALES
79.33
FEMALES / 100 MALES
58.2
MEDIAN AGE
2.5
AVG FAMILY SIZE
2.0
AVG HOUSEHOLD SIZE
854
LABOR FORCE [ PEOPLE ]
44.7%
PERCENT IN LABOR FORCE
9.7%
UNEMPLOYMENT RATE
Pine Mountain Club Zip Codes
Income in Pine Mountain Club
Income Overview in Pine Mountain Club
Per Capita Income in Pine Mountain Club is $37,065, while median incomes of families and households are $57,174 and $48,828 respectively.
| Characteristic | Number | Measure |
| Per Capita Income | 2,195 | $37,065 |
| Median Family Income | 644 | $57,174 |
| Mean Family Income | 644 | $79,464 |
| Median Household Income | 1,117 | $48,828 |
| Mean Household Income | 1,117 | $72,717 |
| Income Deficit | 644 | $0 |
| Wage / Income Gap (%) | 2,195 | 0.00% |
| Wage / Income Gap ($) | 2,195 | 100.00¢ per $1 |
| Gini / Inequality Index | 2,195 | 0.45 |
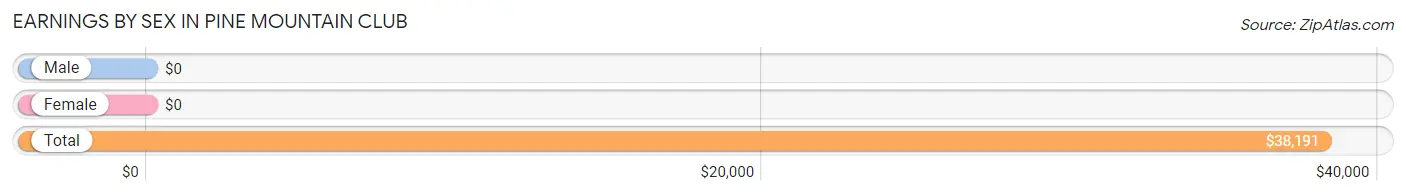
Earnings by Sex in Pine Mountain Club
| Sex | Number | Average Earnings |
| Male | 565 (64.6%) | $0 |
| Female | 310 (35.4%) | $0 |
| Total | 875 (100.0%) | $38,191 |
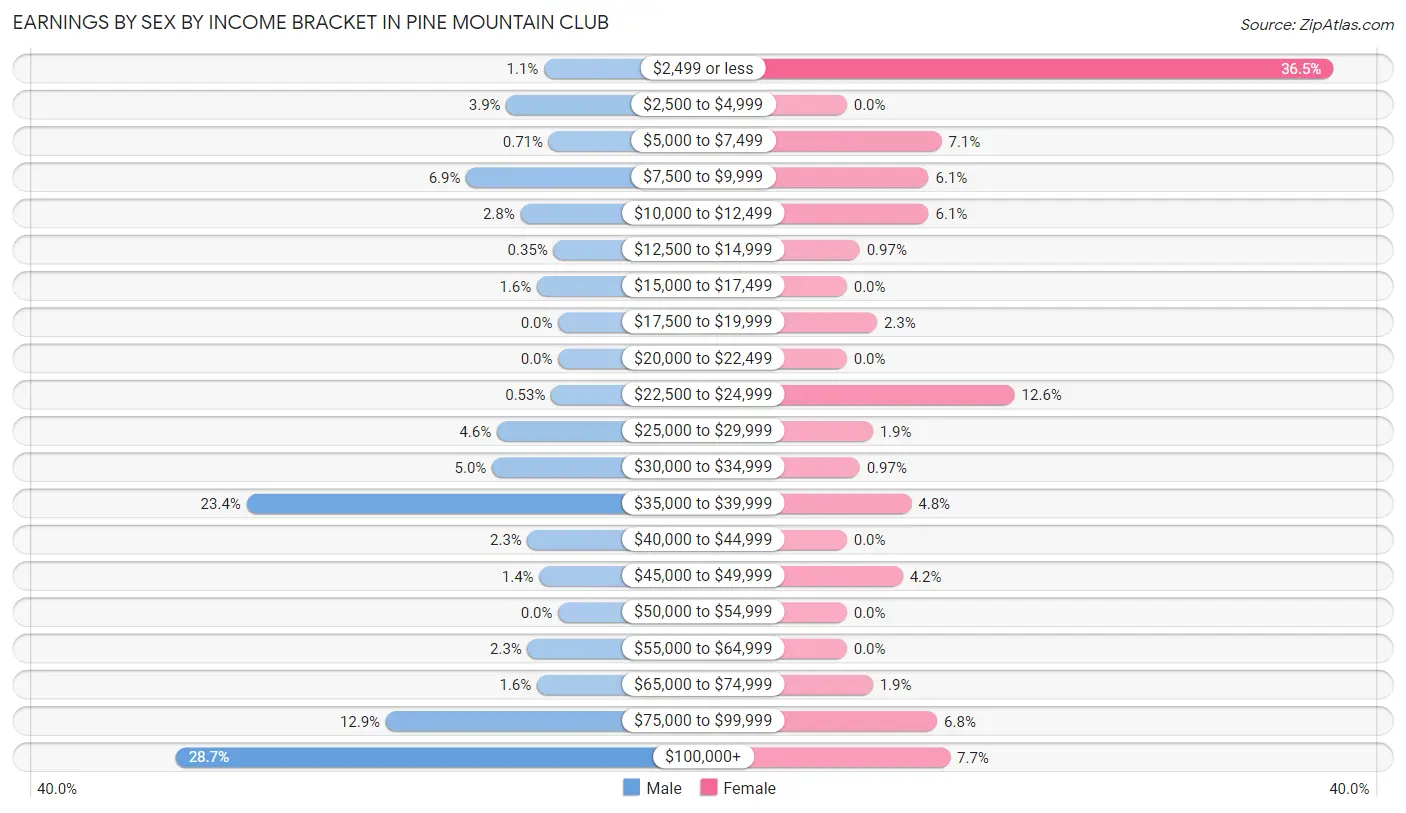
Earnings by Sex by Income Bracket in Pine Mountain Club
The most common earnings brackets in Pine Mountain Club are $100,000+ for men (162 | 28.7%) and $2,499 or less for women (113 | 36.4%).
| Income | Male | Female |
| $2,499 or less | 6 (1.1%) | 113 (36.4%) |
| $2,500 to $4,999 | 22 (3.9%) | 0 (0.0%) |
| $5,000 to $7,499 | 4 (0.7%) | 22 (7.1%) |
| $7,500 to $9,999 | 39 (6.9%) | 19 (6.1%) |
| $10,000 to $12,499 | 16 (2.8%) | 19 (6.1%) |
| $12,500 to $14,999 | 2 (0.4%) | 3 (1.0%) |
| $15,000 to $17,499 | 9 (1.6%) | 0 (0.0%) |
| $17,500 to $19,999 | 0 (0.0%) | 7 (2.3%) |
| $20,000 to $22,499 | 0 (0.0%) | 0 (0.0%) |
| $22,500 to $24,999 | 3 (0.5%) | 39 (12.6%) |
| $25,000 to $29,999 | 26 (4.6%) | 6 (1.9%) |
| $30,000 to $34,999 | 28 (5.0%) | 3 (1.0%) |
| $35,000 to $39,999 | 132 (23.4%) | 15 (4.8%) |
| $40,000 to $44,999 | 13 (2.3%) | 0 (0.0%) |
| $45,000 to $49,999 | 8 (1.4%) | 13 (4.2%) |
| $50,000 to $54,999 | 0 (0.0%) | 0 (0.0%) |
| $55,000 to $64,999 | 13 (2.3%) | 0 (0.0%) |
| $65,000 to $74,999 | 9 (1.6%) | 6 (1.9%) |
| $75,000 to $99,999 | 73 (12.9%) | 21 (6.8%) |
| $100,000+ | 162 (28.7%) | 24 (7.7%) |
| Total | 565 (100.0%) | 310 (100.0%) |
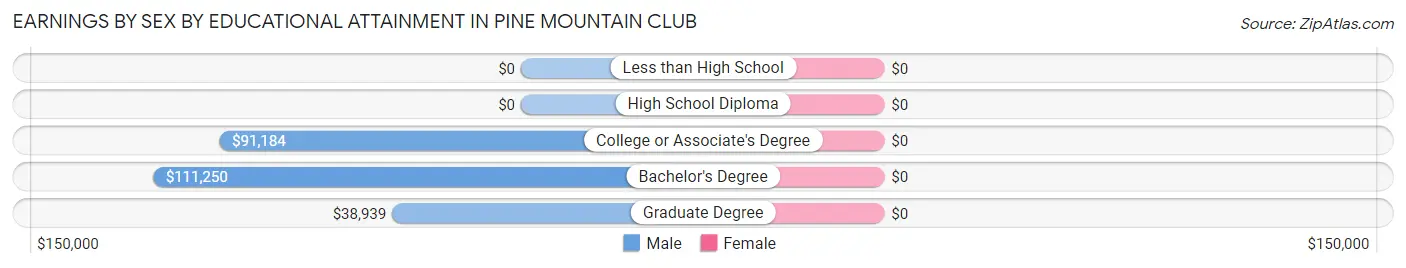
Earnings by Sex by Educational Attainment in Pine Mountain Club
| Educational Attainment | Male Income | Female Income |
| Less than High School | - | - |
| High School Diploma | - | - |
| College or Associate's Degree | $91,184 | $0 |
| Bachelor's Degree | $111,250 | $0 |
| Graduate Degree | $38,939 | $0 |
| Total | - | - |
Family Income in Pine Mountain Club
Family Income Brackets in Pine Mountain Club
According to the Pine Mountain Club family income data, there are 170 families falling into the $35,000 to $49,999 income range, which is the most common income bracket and makes up 26.4% of all families. Conversely, the $15,000 to $24,999 income bracket is the least frequent group with only 8 families (1.2%) belonging to this category.
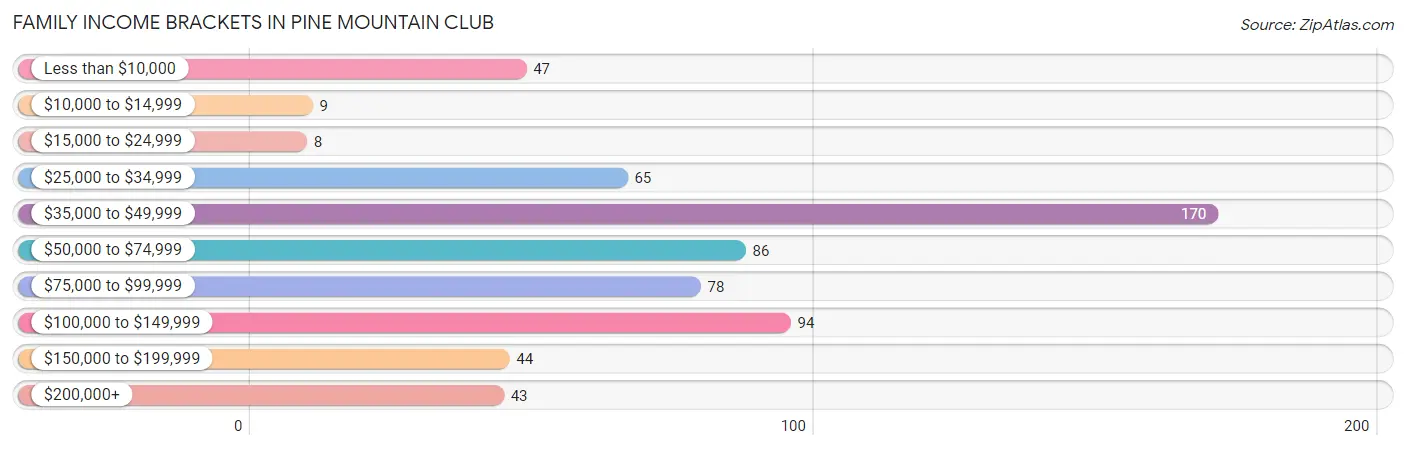
| Income Bracket | # Families | % Families |
| Less than $10,000 | 47 | 7.3% |
| $10,000 to $14,999 | 9 | 1.4% |
| $15,000 to $24,999 | 8 | 1.2% |
| $25,000 to $34,999 | 65 | 10.1% |
| $35,000 to $49,999 | 170 | 26.4% |
| $50,000 to $74,999 | 86 | 13.4% |
| $75,000 to $99,999 | 78 | 12.1% |
| $100,000 to $149,999 | 94 | 14.6% |
| $150,000 to $199,999 | 44 | 6.8% |
| $200,000+ | 43 | 6.7% |
Family Income by Famaliy Size in Pine Mountain Club
2-person families (394 | 61.2%) account for the highest median family income in Pine Mountain Club with $66,429 per family, while 2-person families (394 | 61.2%) have the highest median income of $33,214 per family member.
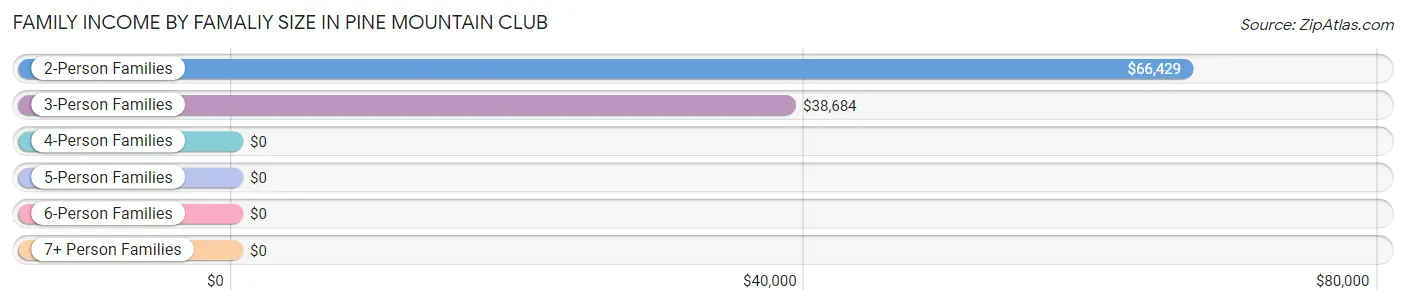
| Income Bracket | # Families | Median Income |
| 2-Person Families | 394 (61.2%) | $66,429 |
| 3-Person Families | 157 (24.4%) | $38,684 |
| 4-Person Families | 56 (8.7%) | $0 |
| 5-Person Families | 9 (1.4%) | $0 |
| 6-Person Families | 0 (0.0%) | $0 |
| 7+ Person Families | 28 (4.3%) | $0 |
| Total | 644 (100.0%) | $57,174 |
Family Income by Number of Earners in Pine Mountain Club
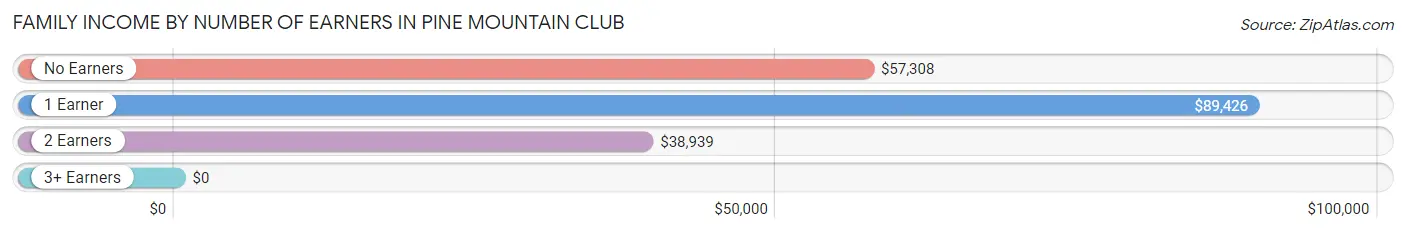
| Number of Earners | # Families | Median Income |
| No Earners | 182 (28.3%) | $57,308 |
| 1 Earner | 255 (39.6%) | $89,426 |
| 2 Earners | 184 (28.6%) | $38,939 |
| 3+ Earners | 23 (3.6%) | $0 |
| Total | 644 (100.0%) | $57,174 |
Household Income in Pine Mountain Club
Household Income Brackets in Pine Mountain Club
With 237 households falling in the category, the $35,000 to $49,999 income range is the most frequent in Pine Mountain Club, accounting for 21.2% of all households. In contrast, only 34 households (3.0%) fall into the $10,000 to $14,999 income bracket, making it the least populous group.
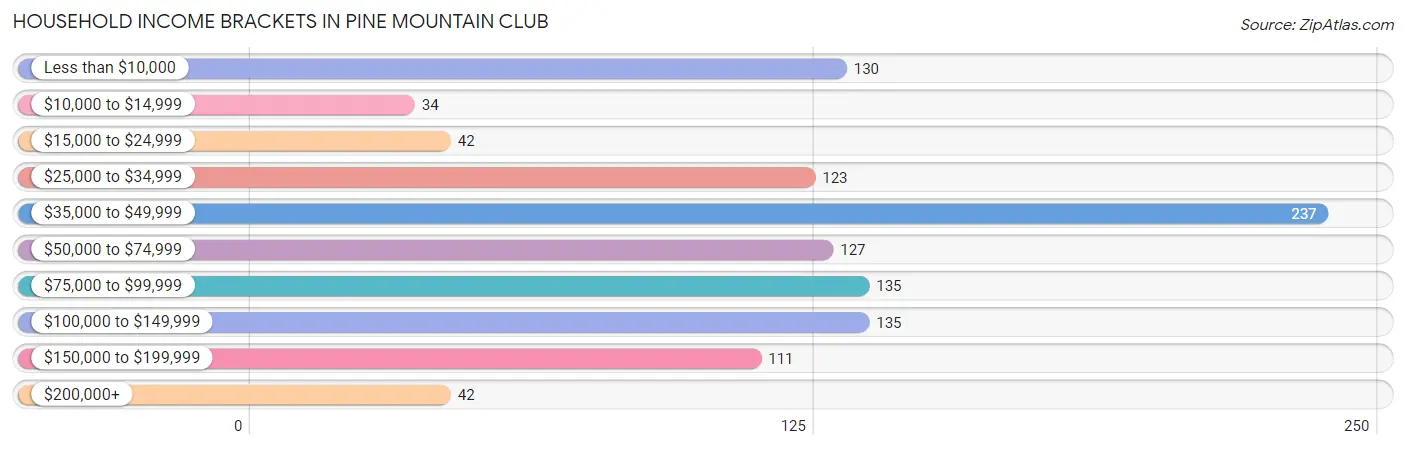
| Income Bracket | # Households | % Households |
| Less than $10,000 | 130 | 11.6% |
| $10,000 to $14,999 | 34 | 3.0% |
| $15,000 to $24,999 | 42 | 3.8% |
| $25,000 to $34,999 | 123 | 11.0% |
| $35,000 to $49,999 | 237 | 21.2% |
| $50,000 to $74,999 | 127 | 11.4% |
| $75,000 to $99,999 | 135 | 12.1% |
| $100,000 to $149,999 | 135 | 12.1% |
| $150,000 to $199,999 | 111 | 9.9% |
| $200,000+ | 42 | 3.8% |
Household Income by Householder Age in Pine Mountain Club
The median household income in Pine Mountain Club is $48,828, with the highest median household income of $61,161 found in the 65+ years age bracket for the primary householder. A total of 439 households (39.3%) fall into this category. Meanwhile, the 15 to 24 years age bracket for the primary householder has the lowest median household income of $0, with 8 households (0.7%) in this group.
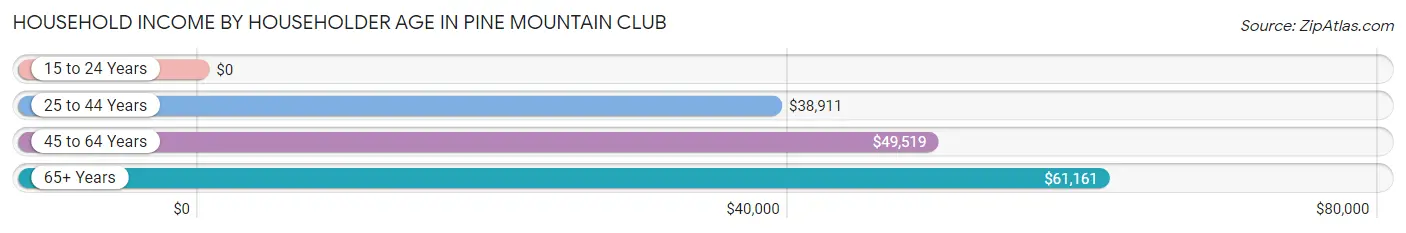
| Income Bracket | # Households | Median Income |
| 15 to 24 Years | 8 (0.7%) | $0 |
| 25 to 44 Years | 237 (21.2%) | $38,911 |
| 45 to 64 Years | 433 (38.8%) | $49,519 |
| 65+ Years | 439 (39.3%) | $61,161 |
| Total | 1,117 (100.0%) | $48,828 |
Poverty in Pine Mountain Club
Income Below Poverty by Sex and Age in Pine Mountain Club
With 9.9% poverty level for males and 23.6% for females among the residents of Pine Mountain Club, 6 to 11 year old males and 45 to 54 year old females are the most vulnerable to poverty, with 11 males (32.4%) and 60 females (48.0%) in their respective age groups living below the poverty level.
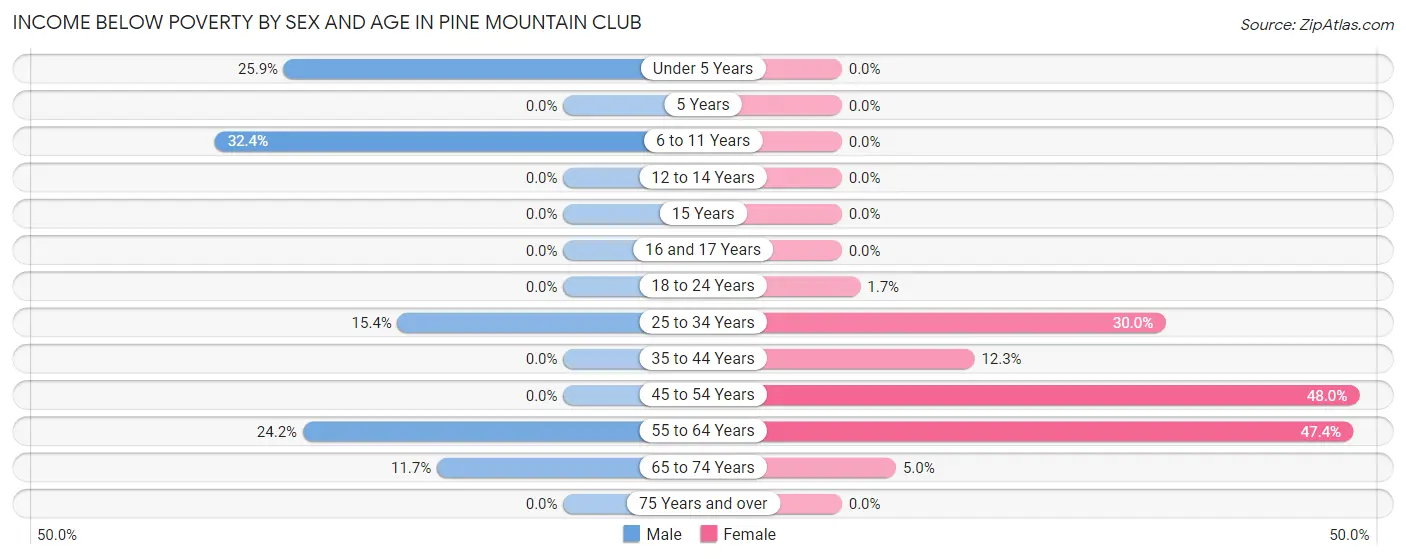
| Age Bracket | Male | Female |
| Under 5 Years | 14 (25.9%) | 0 (0.0%) |
| 5 Years | 0 (0.0%) | 0 (0.0%) |
| 6 to 11 Years | 11 (32.4%) | 0 (0.0%) |
| 12 to 14 Years | 0 (0.0%) | 0 (0.0%) |
| 15 Years | 0 (0.0%) | 0 (0.0%) |
| 16 and 17 Years | 0 (0.0%) | 0 (0.0%) |
| 18 to 24 Years | 0 (0.0%) | 1 (1.7%) |
| 25 to 34 Years | 6 (15.4%) | 15 (30.0%) |
| 35 to 44 Years | 0 (0.0%) | 16 (12.3%) |
| 45 to 54 Years | 0 (0.0%) | 60 (48.0%) |
| 55 to 64 Years | 58 (24.2%) | 129 (47.4%) |
| 65 to 74 Years | 32 (11.7%) | 8 (5.0%) |
| 75 Years and over | 0 (0.0%) | 0 (0.0%) |
| Total | 121 (9.9%) | 229 (23.6%) |
Income Above Poverty by Sex and Age in Pine Mountain Club
According to the poverty statistics in Pine Mountain Club, males aged 12 to 14 years and females aged 5 years are the age groups that are most secure financially, with 100.0% of males and 100.0% of females in these age groups living above the poverty line.
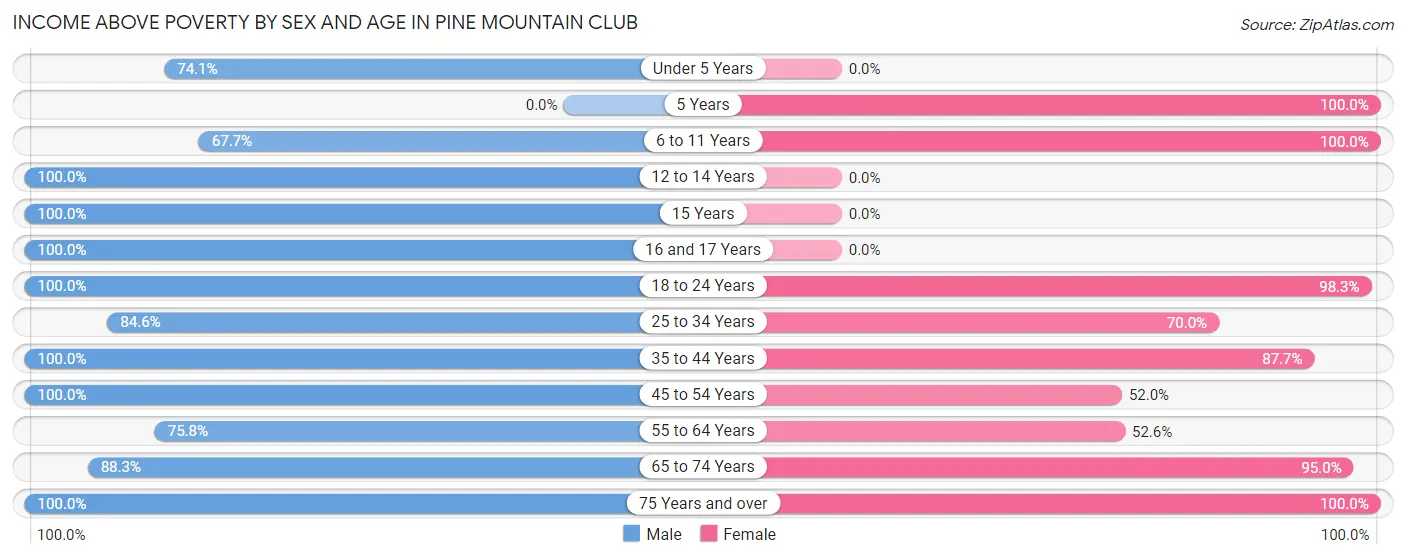
| Age Bracket | Male | Female |
| Under 5 Years | 40 (74.1%) | 0 (0.0%) |
| 5 Years | 0 (0.0%) | 6 (100.0%) |
| 6 to 11 Years | 23 (67.6%) | 57 (100.0%) |
| 12 to 14 Years | 70 (100.0%) | 0 (0.0%) |
| 15 Years | 64 (100.0%) | 0 (0.0%) |
| 16 and 17 Years | 35 (100.0%) | 0 (0.0%) |
| 18 to 24 Years | 8 (100.0%) | 57 (98.3%) |
| 25 to 34 Years | 33 (84.6%) | 35 (70.0%) |
| 35 to 44 Years | 180 (100.0%) | 114 (87.7%) |
| 45 to 54 Years | 106 (100.0%) | 65 (52.0%) |
| 55 to 64 Years | 182 (75.8%) | 143 (52.6%) |
| 65 to 74 Years | 241 (88.3%) | 151 (95.0%) |
| 75 Years and over | 121 (100.0%) | 114 (100.0%) |
| Total | 1,103 (90.1%) | 742 (76.4%) |
Income Below Poverty Among Married-Couple Families in Pine Mountain Club
The poverty statistics for married-couple families in Pine Mountain Club show that 3.0% or 18 of the total 606 families live below the poverty line. Families with 1 or 2 children have the highest poverty rate of 4.1%, comprising of 9 families. On the other hand, families with 3 or 4 children have the lowest poverty rate of 0.0%, which includes 0 families.
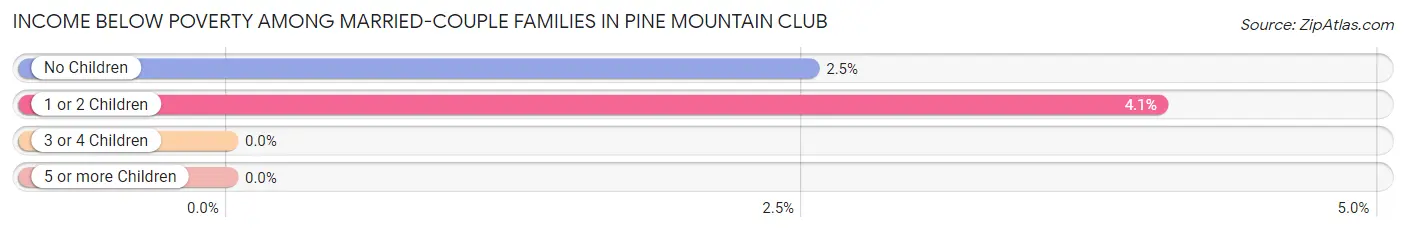
| Children | Above Poverty | Below Poverty |
| No Children | 347 (97.5%) | 9 (2.5%) |
| 1 or 2 Children | 213 (96.0%) | 9 (4.1%) |
| 3 or 4 Children | 23 (100.0%) | 0 (0.0%) |
| 5 or more Children | 5 (100.0%) | 0 (0.0%) |
| Total | 588 (97.0%) | 18 (3.0%) |
Income Below Poverty Among Single-Parent Households in Pine Mountain Club
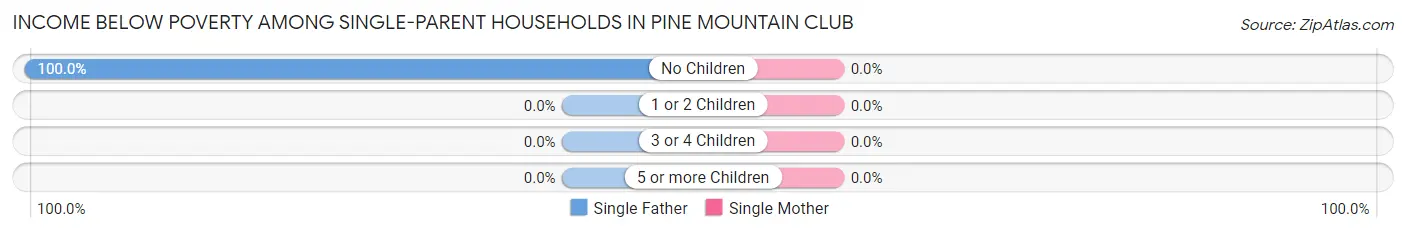
| Children | Single Father | Single Mother |
| No Children | 38 (100.0%) | 0 (0.0%) |
| 1 or 2 Children | 0 (0.0%) | 0 (0.0%) |
| 3 or 4 Children | 0 (0.0%) | 0 (0.0%) |
| 5 or more Children | 0 (0.0%) | 0 (0.0%) |
| Total | 38 (100.0%) | 0 (0.0%) |
Income Below Poverty Among Married-Couple vs Single-Parent Households in Pine Mountain Club
The poverty data for Pine Mountain Club shows that 18 of the married-couple family households (3.0%) and 38 of the single-parent households (100.0%) are living below the poverty level. Within the married-couple family households, those with 1 or 2 children have the highest poverty rate, with 9 households (4.1%) falling below the poverty line. Among the single-parent households, those with no children have the highest poverty rate, with 38 household (100.0%) living below poverty.
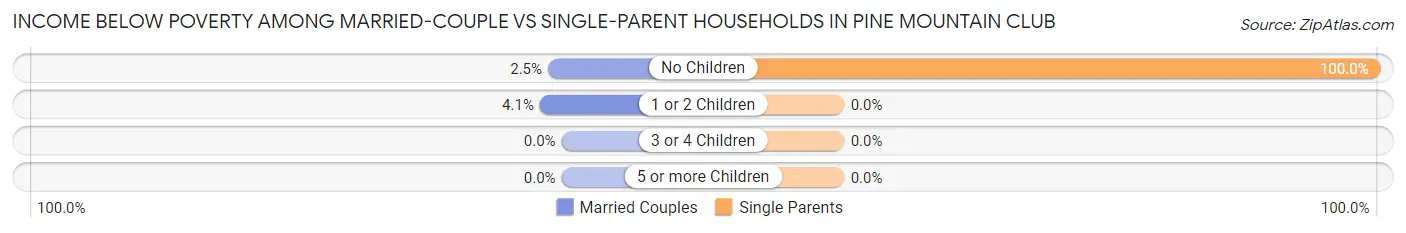
| Children | Married-Couple Families | Single-Parent Households |
| No Children | 9 (2.5%) | 38 (100.0%) |
| 1 or 2 Children | 9 (4.1%) | 0 (0.0%) |
| 3 or 4 Children | 0 (0.0%) | 0 (0.0%) |
| 5 or more Children | 0 (0.0%) | 0 (0.0%) |
| Total | 18 (3.0%) | 38 (100.0%) |
Race in Pine Mountain Club
The most populous races in Pine Mountain Club are White / Caucasian (1,628 | 74.2%), Asian (399 | 18.2%), and Hispanic or Latino (327 | 14.9%).
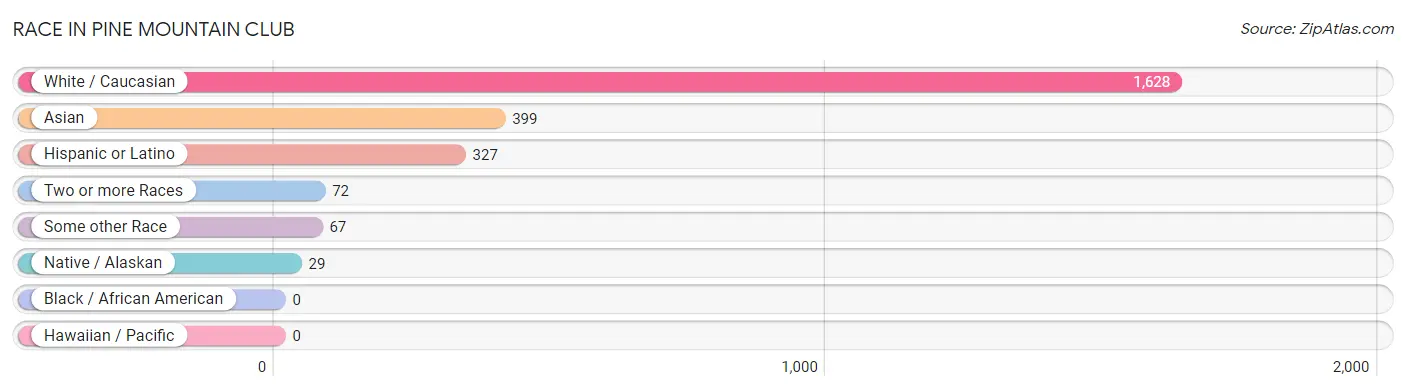
| Race | # Population | % Population |
| Asian | 399 | 18.2% |
| Black / African American | 0 | 0.0% |
| Hawaiian / Pacific | 0 | 0.0% |
| Hispanic or Latino | 327 | 14.9% |
| Native / Alaskan | 29 | 1.3% |
| White / Caucasian | 1,628 | 74.2% |
| Two or more Races | 72 | 3.3% |
| Some other Race | 67 | 3.0% |
| Total | 2,195 | 100.0% |
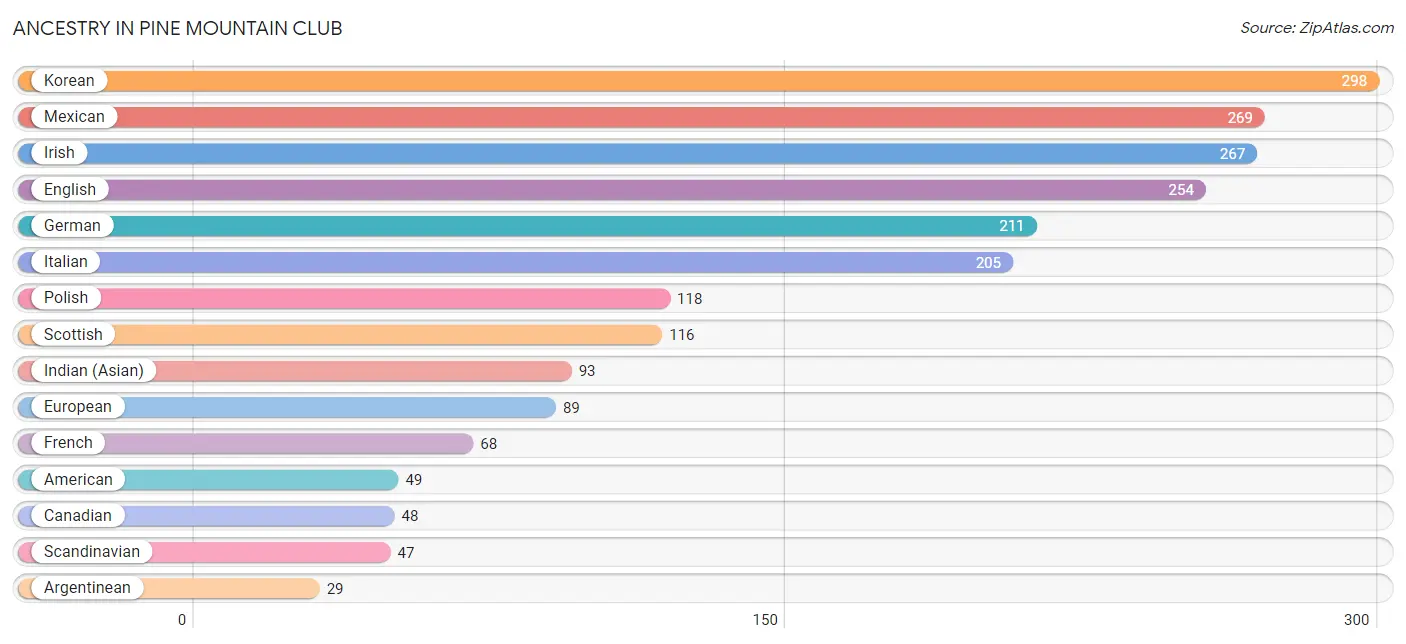
Ancestry in Pine Mountain Club
The most populous ancestries reported in Pine Mountain Club are Korean (298 | 13.6%), Mexican (269 | 12.3%), Irish (267 | 12.2%), English (254 | 11.6%), and German (211 | 9.6%), together accounting for 59.2% of all Pine Mountain Club residents.
| Ancestry | # Population | % Population |
| American | 49 | 2.2% |
| Argentinean | 29 | 1.3% |
| Armenian | 8 | 0.4% |
| Basque | 16 | 0.7% |
| Belgian | 14 | 0.6% |
| British | 17 | 0.8% |
| Burmese | 8 | 0.4% |
| Canadian | 48 | 2.2% |
| Cherokee | 6 | 0.3% |
| Cuban | 6 | 0.3% |
| Danish | 9 | 0.4% |
| Dutch | 18 | 0.8% |
| Eastern European | 22 | 1.0% |
| English | 254 | 11.6% |
| European | 89 | 4.1% |
| Finnish | 3 | 0.1% |
| French | 68 | 3.1% |
| French Canadian | 18 | 0.8% |
| German | 211 | 9.6% |
| Greek | 23 | 1.1% |
| Guamanian / Chamorro | 4 | 0.2% |
| Indian (Asian) | 93 | 4.2% |
| Irish | 267 | 12.2% |
| Italian | 205 | 9.3% |
| Korean | 298 | 13.6% |
| Lithuanian | 4 | 0.2% |
| Mexican | 269 | 12.3% |
| Mexican American Indian | 1 | 0.1% |
| Norwegian | 6 | 0.3% |
| Polish | 118 | 5.4% |
| Puerto Rican | 3 | 0.1% |
| Russian | 24 | 1.1% |
| Scandinavian | 47 | 2.1% |
| Scotch-Irish | 13 | 0.6% |
| Scottish | 116 | 5.3% |
| Slavic | 13 | 0.6% |
| Slovak | 4 | 0.2% |
| South American | 29 | 1.3% |
| Spanish | 20 | 0.9% |
| Swedish | 3 | 0.1% |
| Swiss | 13 | 0.6% |
| Welsh | 28 | 1.3% |
| Yaqui | 18 | 0.8% | View All 43 Rows |
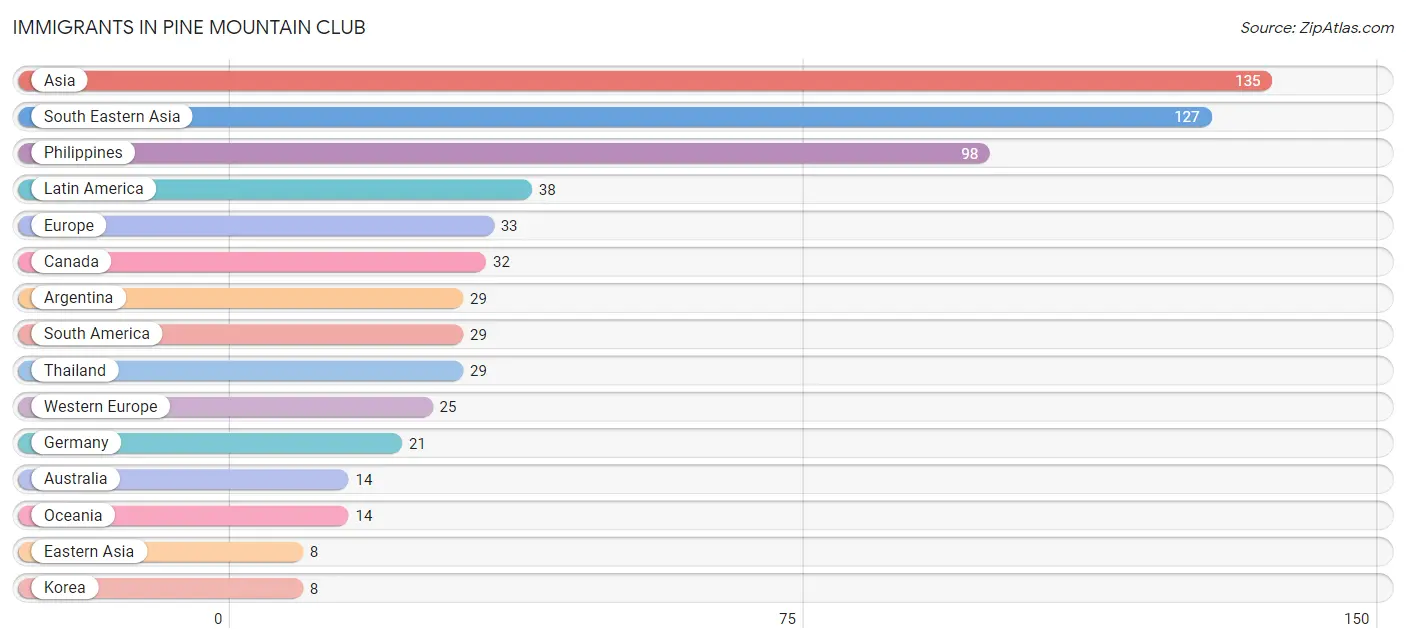
Immigrants in Pine Mountain Club
The most numerous immigrant groups reported in Pine Mountain Club came from Asia (135 | 6.1%), South Eastern Asia (127 | 5.8%), Philippines (98 | 4.5%), Latin America (38 | 1.7%), and Europe (33 | 1.5%), together accounting for 19.6% of all Pine Mountain Club residents.
| Immigration Origin | # Population | % Population |
| Argentina | 29 | 1.3% |
| Asia | 135 | 6.1% |
| Australia | 14 | 0.6% |
| Canada | 32 | 1.5% |
| Caribbean | 6 | 0.3% |
| Central America | 3 | 0.1% |
| Cuba | 6 | 0.3% |
| Eastern Asia | 8 | 0.4% |
| Eastern Europe | 3 | 0.1% |
| England | 2 | 0.1% |
| Europe | 33 | 1.5% |
| Germany | 21 | 1.0% |
| Korea | 8 | 0.4% |
| Latin America | 38 | 1.7% |
| Mexico | 3 | 0.1% |
| Netherlands | 4 | 0.2% |
| Northern Europe | 5 | 0.2% |
| Oceania | 14 | 0.6% |
| Philippines | 98 | 4.5% |
| Romania | 3 | 0.1% |
| South America | 29 | 1.3% |
| South Eastern Asia | 127 | 5.8% |
| Thailand | 29 | 1.3% |
| Western Europe | 25 | 1.1% | View All 24 Rows |
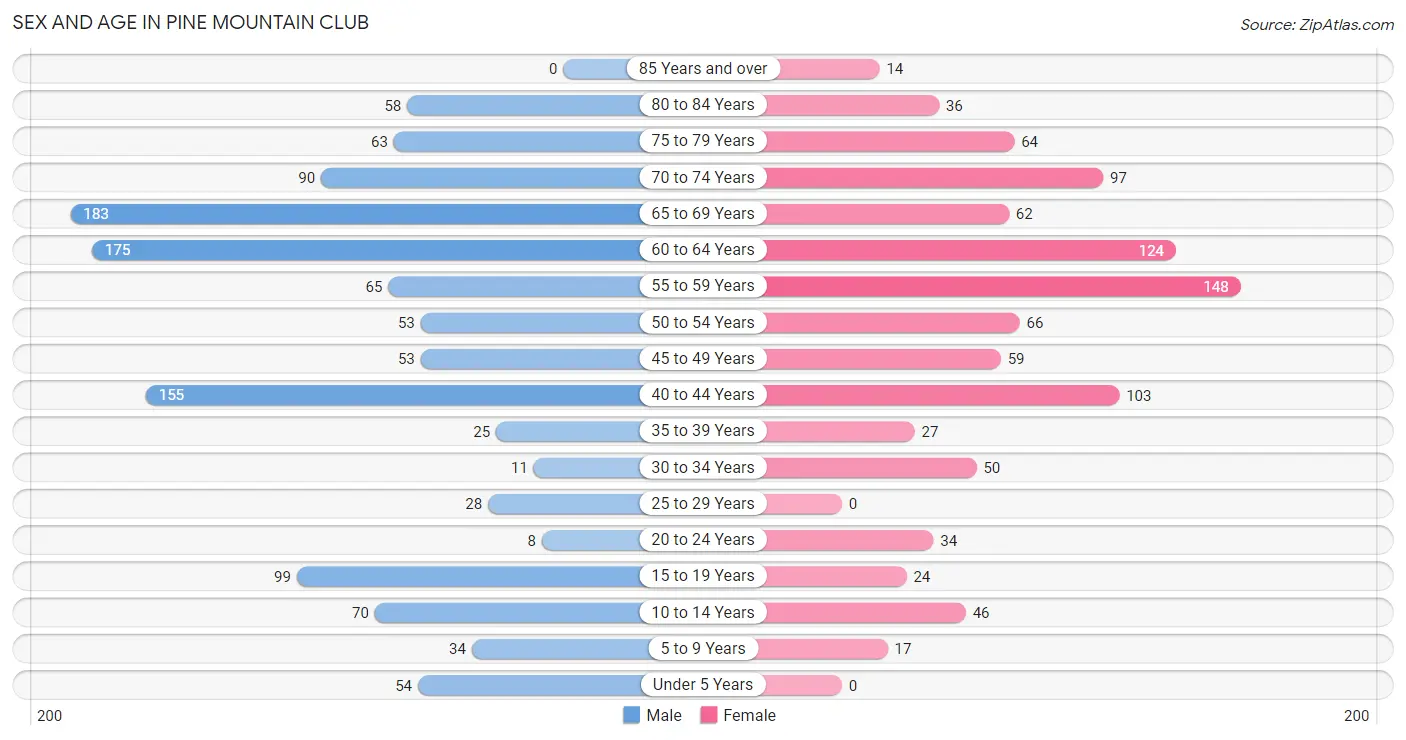
Sex and Age in Pine Mountain Club
Sex and Age in Pine Mountain Club
The most populous age groups in Pine Mountain Club are 65 to 69 Years (183 | 14.9%) for men and 55 to 59 Years (148 | 15.2%) for women.
| Age Bracket | Male | Female |
| Under 5 Years | 54 (4.4%) | 0 (0.0%) |
| 5 to 9 Years | 34 (2.8%) | 17 (1.8%) |
| 10 to 14 Years | 70 (5.7%) | 46 (4.7%) |
| 15 to 19 Years | 99 (8.1%) | 24 (2.5%) |
| 20 to 24 Years | 8 (0.6%) | 34 (3.5%) |
| 25 to 29 Years | 28 (2.3%) | 0 (0.0%) |
| 30 to 34 Years | 11 (0.9%) | 50 (5.1%) |
| 35 to 39 Years | 25 (2.0%) | 27 (2.8%) |
| 40 to 44 Years | 155 (12.7%) | 103 (10.6%) |
| 45 to 49 Years | 53 (4.3%) | 59 (6.1%) |
| 50 to 54 Years | 53 (4.3%) | 66 (6.8%) |
| 55 to 59 Years | 65 (5.3%) | 148 (15.2%) |
| 60 to 64 Years | 175 (14.3%) | 124 (12.8%) |
| 65 to 69 Years | 183 (14.9%) | 62 (6.4%) |
| 70 to 74 Years | 90 (7.3%) | 97 (10.0%) |
| 75 to 79 Years | 63 (5.1%) | 64 (6.6%) |
| 80 to 84 Years | 58 (4.7%) | 36 (3.7%) |
| 85 Years and over | 0 (0.0%) | 14 (1.4%) |
| Total | 1,224 (100.0%) | 971 (100.0%) |
Families and Households in Pine Mountain Club
Median Family Size in Pine Mountain Club
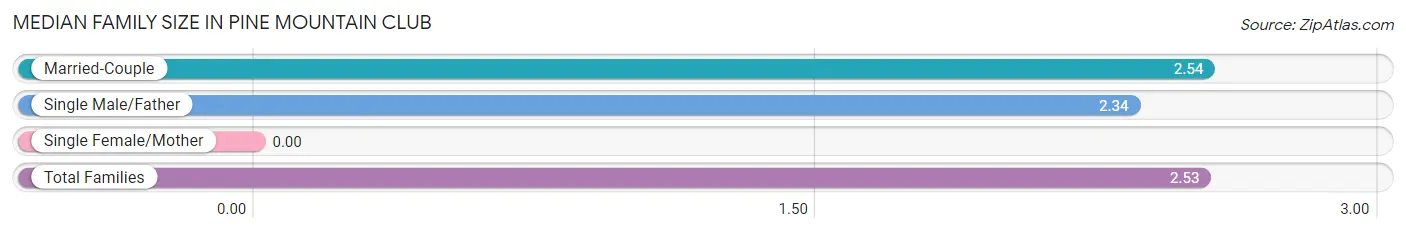
| Family Type | # Families | Family Size |
| Married-Couple | 606 (94.1%) | 2.54 |
| Single Male/Father | 38 (5.9%) | 2.34 |
| Single Female/Mother | 0 (0.0%) | - |
| Total Families | 644 (100.0%) | 2.53 |
Median Household Size in Pine Mountain Club
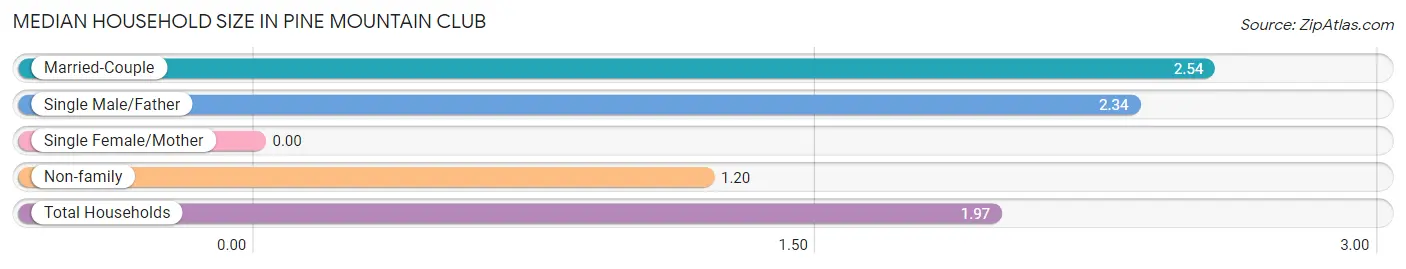
| Household Type | # Households | Household Size |
| Married-Couple | 606 (54.2%) | 2.54 |
| Single Male/Father | 38 (3.4%) | 2.34 |
| Single Female/Mother | 0 (0.0%) | - |
| Non-family | 473 (42.3%) | 1.20 |
| Total Households | 1,117 (100.0%) | 1.97 |
Household Size by Marriage Status in Pine Mountain Club
Out of a total of 1,117 households in Pine Mountain Club, 644 (57.7%) are family households, while 473 (42.3%) are nonfamily households. The most numerous type of family households are 2-person households, comprising 394, and the most common type of nonfamily households are 1-person households, comprising 391.
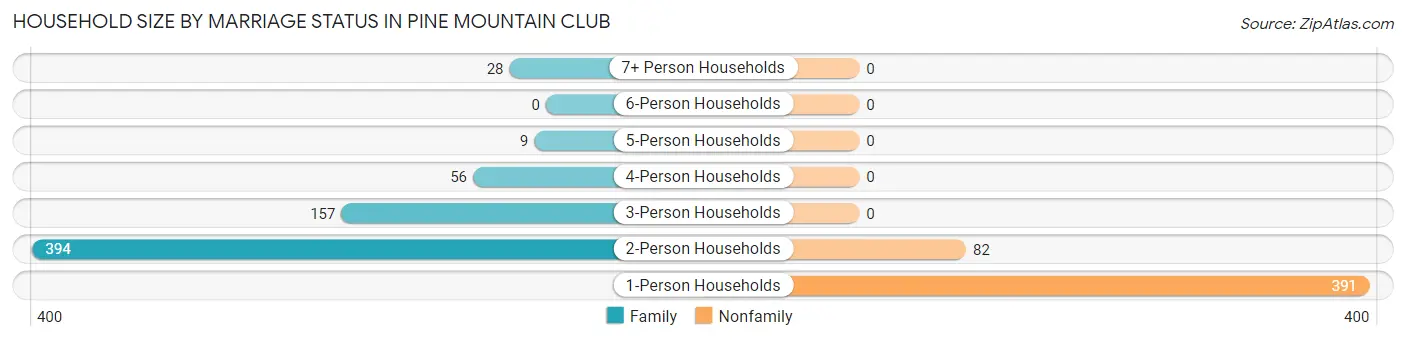
| Household Size | Family Households | Nonfamily Households |
| 1-Person Households | - | 391 (35.0%) |
| 2-Person Households | 394 (35.3%) | 82 (7.3%) |
| 3-Person Households | 157 (14.1%) | 0 (0.0%) |
| 4-Person Households | 56 (5.0%) | 0 (0.0%) |
| 5-Person Households | 9 (0.8%) | 0 (0.0%) |
| 6-Person Households | 0 (0.0%) | 0 (0.0%) |
| 7+ Person Households | 28 (2.5%) | 0 (0.0%) |
| Total | 644 (57.7%) | 473 (42.3%) |
Female Fertility in Pine Mountain Club
Fertility by Age in Pine Mountain Club
Average fertility rate in Pine Mountain Club is 65.0 births per 1,000 women. Women in the age bracket of 20 to 34 years have the highest fertility rate with 238.0 births per 1,000 women. Women in the age bracket of 20 to 34 years acount for 100.0% of all women with births.
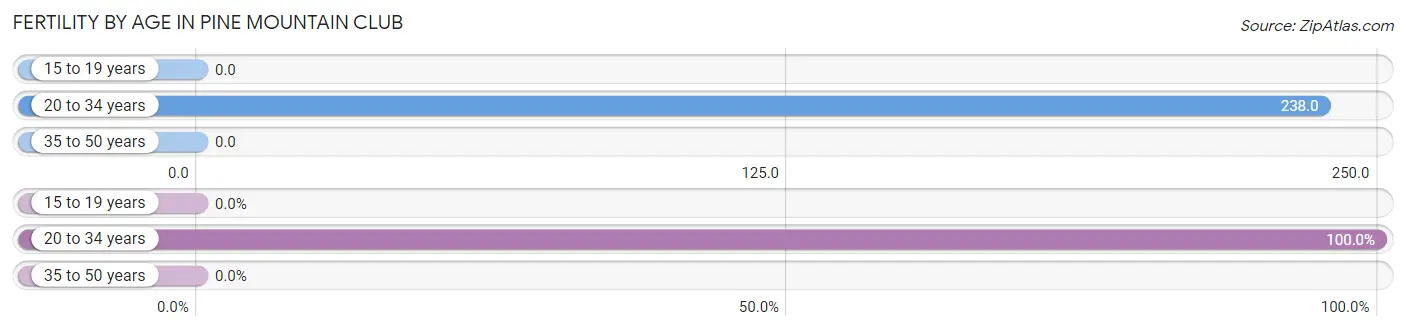
| Age Bracket | Women with Births | Births / 1,000 Women |
| 15 to 19 years | 0 (0.0%) | 0.0 |
| 20 to 34 years | 20 (100.0%) | 238.0 |
| 35 to 50 years | 0 (0.0%) | 0.0 |
| Total | 20 (100.0%) | 65.0 |
Fertility by Age by Marriage Status in Pine Mountain Club
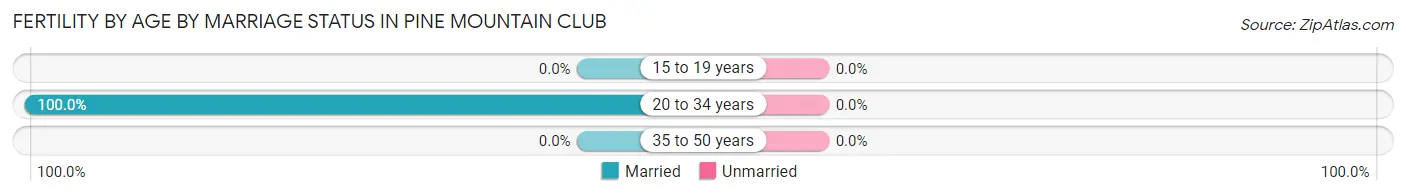
| Age Bracket | Married | Unmarried |
| 15 to 19 years | 0 (0.0%) | 0 (0.0%) |
| 20 to 34 years | 20 (100.0%) | 0 (0.0%) |
| 35 to 50 years | 0 (0.0%) | 0 (0.0%) |
| Total | 20 (100.0%) | 0 (0.0%) |
Fertility by Education in Pine Mountain Club
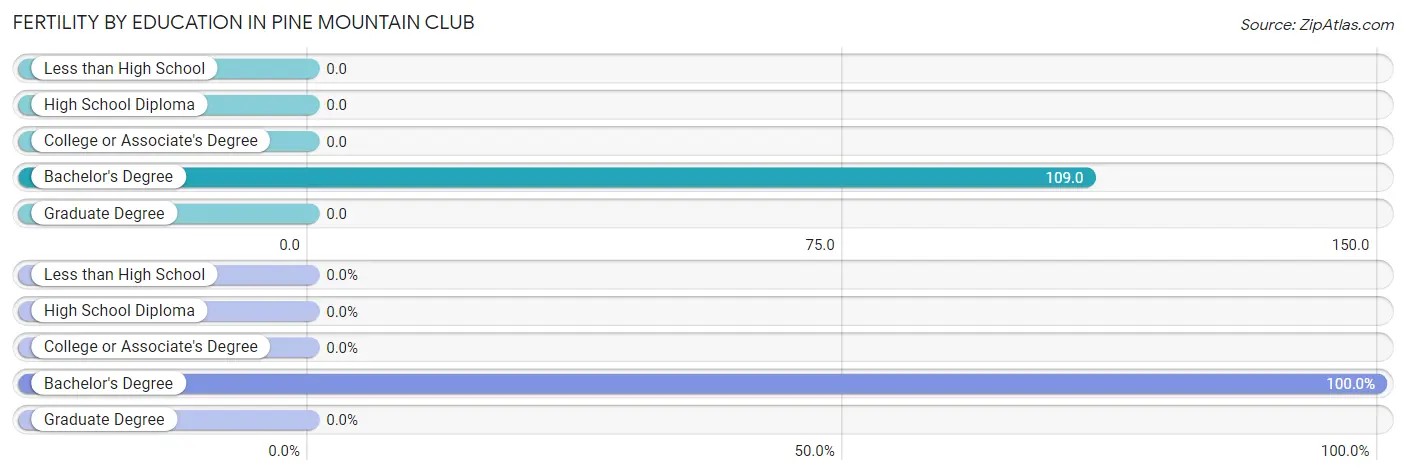
| Educational Attainment | Women with Births | Births / 1,000 Women |
| Less than High School | 0 (0.0%) | 0.0 |
| High School Diploma | 0 (0.0%) | 0.0 |
| College or Associate's Degree | 0 (0.0%) | 0.0 |
| Bachelor's Degree | 20 (100.0%) | 109.0 |
| Graduate Degree | 0 (0.0%) | 0.0 |
| Total | 20 (100.0%) | 65.0 |
Fertility by Education by Marriage Status in Pine Mountain Club
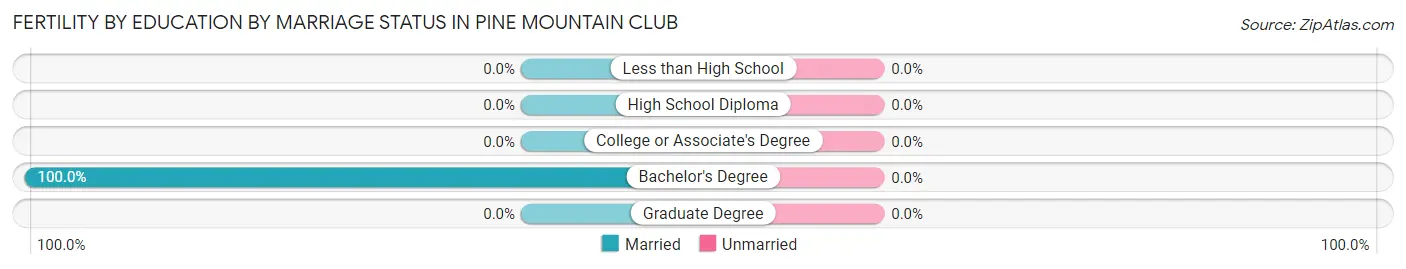
| Educational Attainment | Married | Unmarried |
| Less than High School | 0 (0.0%) | 0 (0.0%) |
| High School Diploma | 0 (0.0%) | 0 (0.0%) |
| College or Associate's Degree | 0 (0.0%) | 0 (0.0%) |
| Bachelor's Degree | 20 (100.0%) | 0 (0.0%) |
| Graduate Degree | 0 (0.0%) | 0 (0.0%) |
| Total | 20 (100.0%) | 0 (0.0%) |
Employment Characteristics in Pine Mountain Club
Employment by Class of Employer in Pine Mountain Club
Among the 733 employed individuals in Pine Mountain Club, private company employees (414 | 56.5%), self-employed (not incorporated) (223 | 30.4%), and not-for-profit organizations (43 | 5.9%) make up the most common classes of employment.
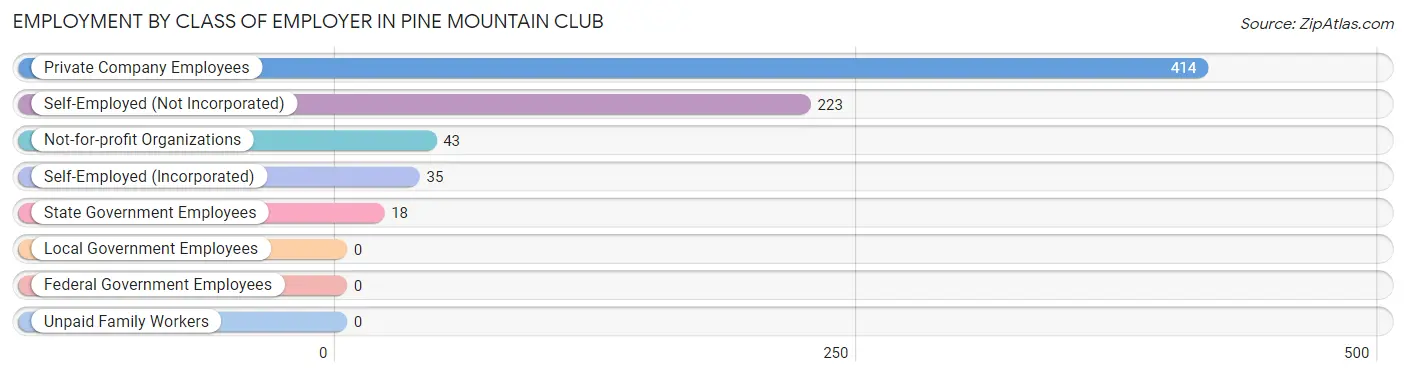
| Employer Class | # Employees | % Employees |
| Private Company Employees | 414 | 56.5% |
| Self-Employed (Incorporated) | 35 | 4.8% |
| Self-Employed (Not Incorporated) | 223 | 30.4% |
| Not-for-profit Organizations | 43 | 5.9% |
| Local Government Employees | 0 | 0.0% |
| State Government Employees | 18 | 2.5% |
| Federal Government Employees | 0 | 0.0% |
| Unpaid Family Workers | 0 | 0.0% |
| Total | 733 | 100.0% |
Employment Status by Age in Pine Mountain Club
According to the labor force statistics for Pine Mountain Club, out of the total population over 16 years of age (1,910), 44.7% or 854 individuals are in the labor force, with 9.7% or 83 of them unemployed. The age group with the highest labor force participation rate is 25 to 29 years, with 100.0% or 28 individuals in the labor force. Within the labor force, the 45 to 54 years age range has the highest percentage of unemployed individuals, with 33.8% or 49 of them being unemployed.
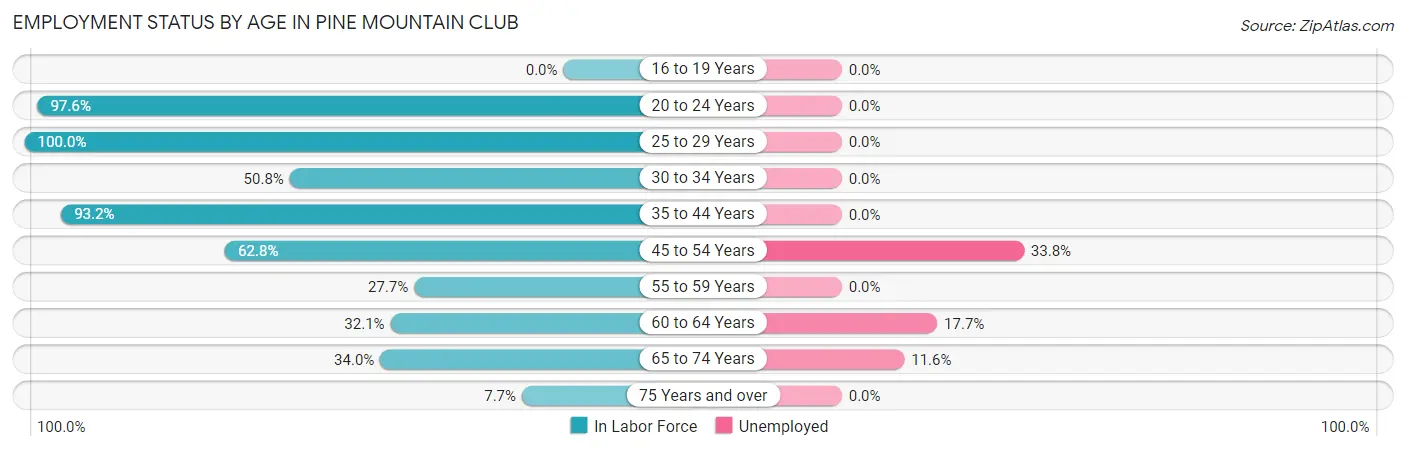
| Age Bracket | In Labor Force | Unemployed |
| 16 to 19 Years | 0 (0.0%) | 0 (0.0%) |
| 20 to 24 Years | 41 (97.6%) | 0 (0.0%) |
| 25 to 29 Years | 28 (100.0%) | 0 (0.0%) |
| 30 to 34 Years | 31 (50.8%) | 0 (0.0%) |
| 35 to 44 Years | 289 (93.2%) | 0 (0.0%) |
| 45 to 54 Years | 145 (62.8%) | 49 (33.8%) |
| 55 to 59 Years | 59 (27.7%) | 0 (0.0%) |
| 60 to 64 Years | 96 (32.1%) | 17 (17.7%) |
| 65 to 74 Years | 147 (34.0%) | 17 (11.6%) |
| 75 Years and over | 18 (7.7%) | 0 (0.0%) |
| Total | 854 (44.7%) | 83 (9.7%) |
Employment Status by Educational Attainment in Pine Mountain Club
According to labor force statistics for Pine Mountain Club, 56.7% of individuals (648) out of the total population between 25 and 64 years of age (1,142) are in the labor force, with 10.2% or 66 of them being unemployed. The group with the highest labor force participation rate are those with the educational attainment of bachelor's degree or higher, with 74.8% or 369 individuals in the labor force. Within the labor force, individuals with college / associate degree education have the highest percentage of unemployment, with 31.1% or 52 of them being unemployed.
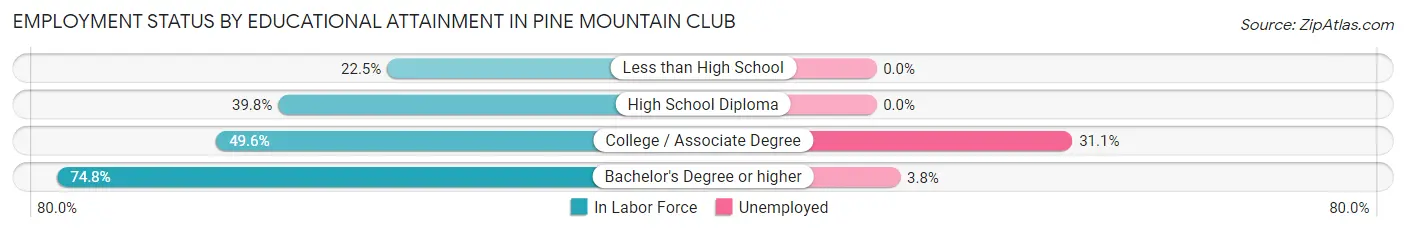
| Educational Attainment | In Labor Force | Unemployed |
| Less than High School | 16 (22.5%) | 0 (0.0%) |
| High School Diploma | 96 (39.8%) | 0 (0.0%) |
| College / Associate Degree | 167 (49.6%) | 105 (31.1%) |
| Bachelor's Degree or higher | 369 (74.8%) | 19 (3.8%) |
| Total | 648 (56.7%) | 116 (10.2%) |
Employment Occupations by Sex in Pine Mountain Club
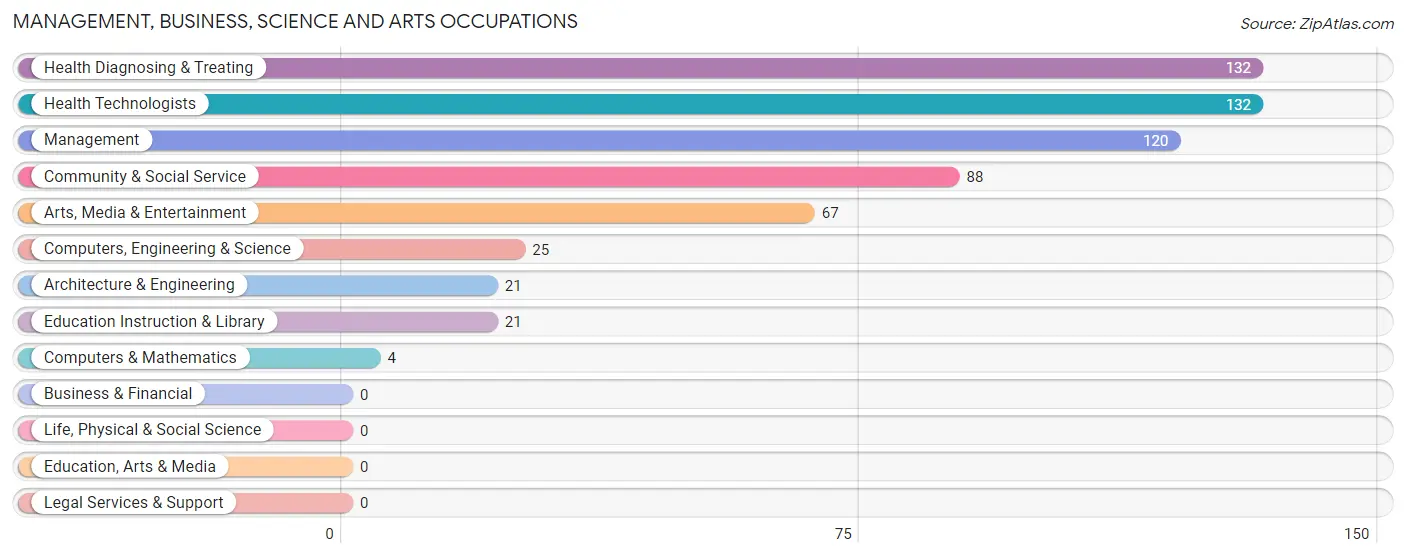
Management, Business, Science and Arts Occupations
The most common Management, Business, Science and Arts occupations in Pine Mountain Club are Health Diagnosing & Treating (132 | 17.1%), Health Technologists (132 | 17.1%), Management (120 | 15.6%), Community & Social Service (88 | 11.4%), and Arts, Media & Entertainment (67 | 8.7%).
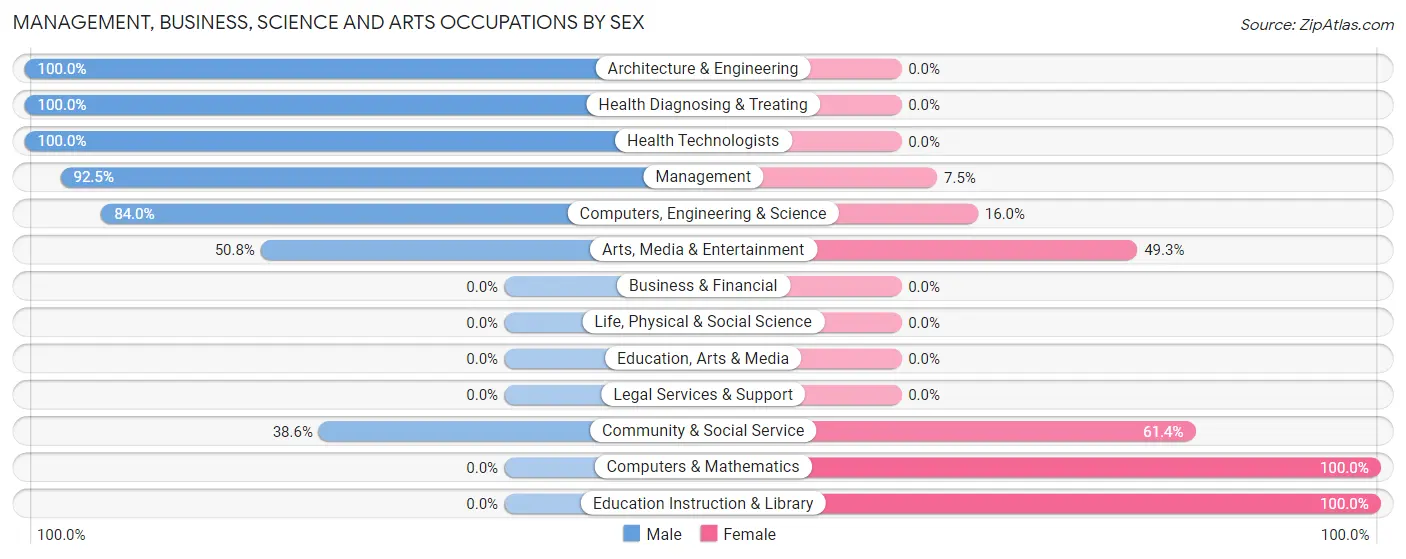
Management, Business, Science and Arts Occupations by Sex
Within the Management, Business, Science and Arts occupations in Pine Mountain Club, the most male-oriented occupations are Architecture & Engineering (100.0%), Health Diagnosing & Treating (100.0%), and Health Technologists (100.0%), while the most female-oriented occupations are Computers & Mathematics (100.0%), Education Instruction & Library (100.0%), and Community & Social Service (61.4%).
| Occupation | Male | Female |
| Management | 111 (92.5%) | 9 (7.5%) |
| Business & Financial | 0 (0.0%) | 0 (0.0%) |
| Computers, Engineering & Science | 21 (84.0%) | 4 (16.0%) |
| Computers & Mathematics | 0 (0.0%) | 4 (100.0%) |
| Architecture & Engineering | 21 (100.0%) | 0 (0.0%) |
| Life, Physical & Social Science | 0 (0.0%) | 0 (0.0%) |
| Community & Social Service | 34 (38.6%) | 54 (61.4%) |
| Education, Arts & Media | 0 (0.0%) | 0 (0.0%) |
| Legal Services & Support | 0 (0.0%) | 0 (0.0%) |
| Education Instruction & Library | 0 (0.0%) | 21 (100.0%) |
| Arts, Media & Entertainment | 34 (50.7%) | 33 (49.2%) |
| Health Diagnosing & Treating | 132 (100.0%) | 0 (0.0%) |
| Health Technologists | 132 (100.0%) | 0 (0.0%) |
| Total (Category) | 298 (81.6%) | 67 (18.4%) |
| Total (Overall) | 515 (66.8%) | 256 (33.2%) |
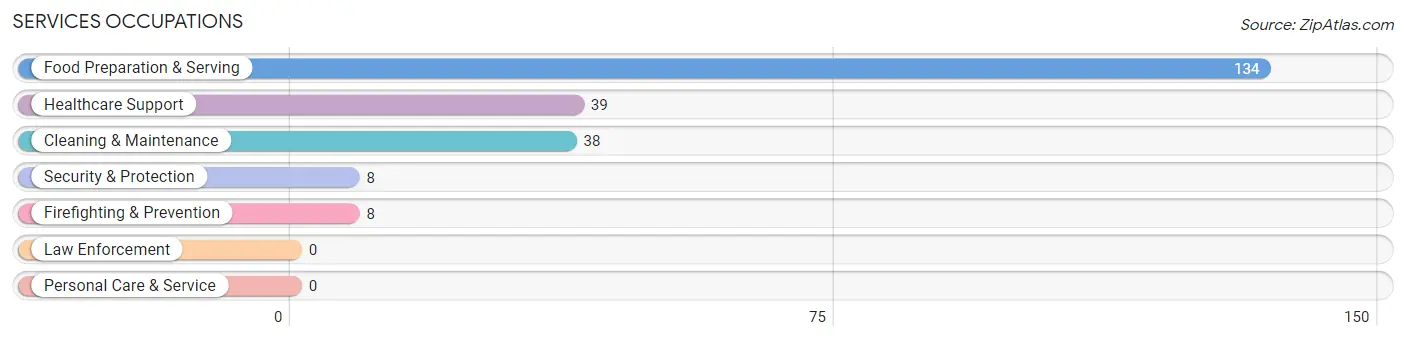
Services Occupations
The most common Services occupations in Pine Mountain Club are Food Preparation & Serving (134 | 17.4%), Healthcare Support (39 | 5.1%), Cleaning & Maintenance (38 | 4.9%), Security & Protection (8 | 1.0%), and Firefighting & Prevention (8 | 1.0%).
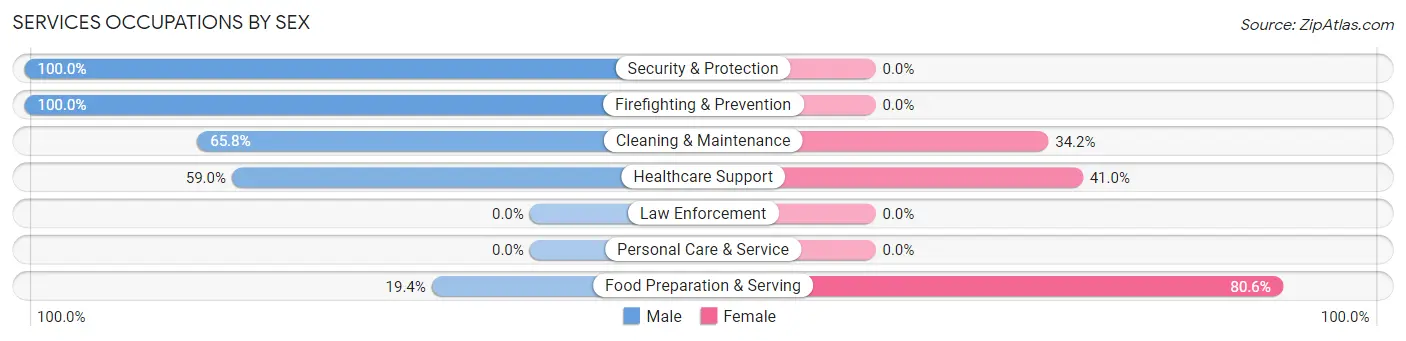
Services Occupations by Sex
Within the Services occupations in Pine Mountain Club, the most male-oriented occupations are Security & Protection (100.0%), Firefighting & Prevention (100.0%), and Cleaning & Maintenance (65.8%), while the most female-oriented occupations are Food Preparation & Serving (80.6%), Healthcare Support (41.0%), and Cleaning & Maintenance (34.2%).
| Occupation | Male | Female |
| Healthcare Support | 23 (59.0%) | 16 (41.0%) |
| Security & Protection | 8 (100.0%) | 0 (0.0%) |
| Firefighting & Prevention | 8 (100.0%) | 0 (0.0%) |
| Law Enforcement | 0 (0.0%) | 0 (0.0%) |
| Food Preparation & Serving | 26 (19.4%) | 108 (80.6%) |
| Cleaning & Maintenance | 25 (65.8%) | 13 (34.2%) |
| Personal Care & Service | 0 (0.0%) | 0 (0.0%) |
| Total (Category) | 82 (37.4%) | 137 (62.6%) |
| Total (Overall) | 515 (66.8%) | 256 (33.2%) |
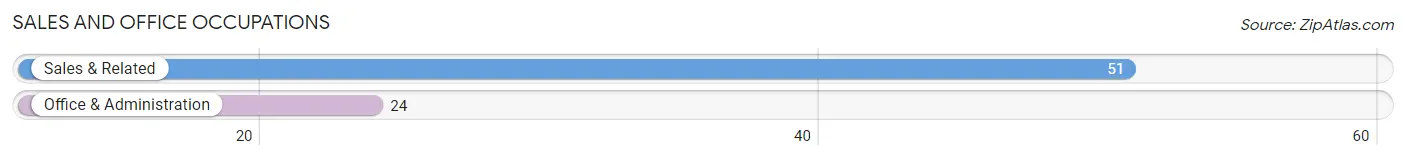
Sales and Office Occupations
The most common Sales and Office occupations in Pine Mountain Club are Sales & Related (51 | 6.6%), and Office & Administration (24 | 3.1%).
Sales and Office Occupations by Sex
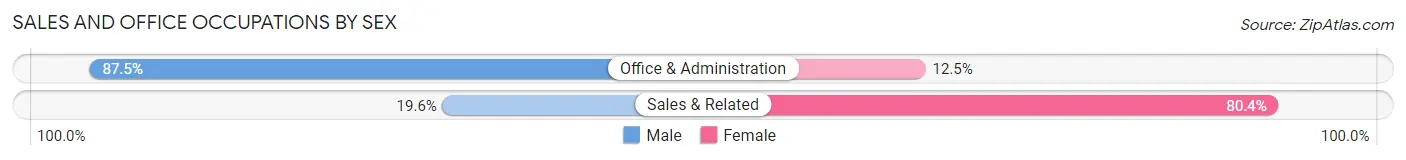
| Occupation | Male | Female |
| Sales & Related | 10 (19.6%) | 41 (80.4%) |
| Office & Administration | 21 (87.5%) | 3 (12.5%) |
| Total (Category) | 31 (41.3%) | 44 (58.7%) |
| Total (Overall) | 515 (66.8%) | 256 (33.2%) |
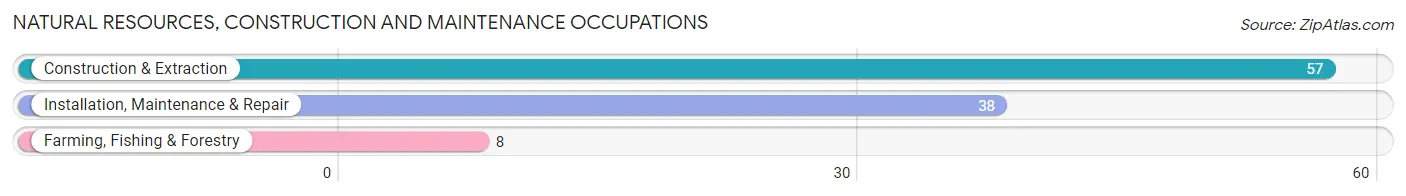
Natural Resources, Construction and Maintenance Occupations
The most common Natural Resources, Construction and Maintenance occupations in Pine Mountain Club are Construction & Extraction (57 | 7.4%), Installation, Maintenance & Repair (38 | 4.9%), and Farming, Fishing & Forestry (8 | 1.0%).
Natural Resources, Construction and Maintenance Occupations by Sex
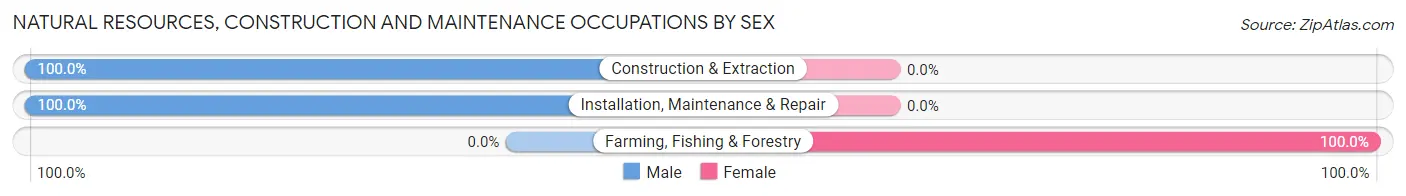
| Occupation | Male | Female |
| Farming, Fishing & Forestry | 0 (0.0%) | 8 (100.0%) |
| Construction & Extraction | 57 (100.0%) | 0 (0.0%) |
| Installation, Maintenance & Repair | 38 (100.0%) | 0 (0.0%) |
| Total (Category) | 95 (92.2%) | 8 (7.8%) |
| Total (Overall) | 515 (66.8%) | 256 (33.2%) |
Production, Transportation and Moving Occupations
The most common Production, Transportation and Moving occupations in Pine Mountain Club are , and Material Moving (9 | 1.2%).
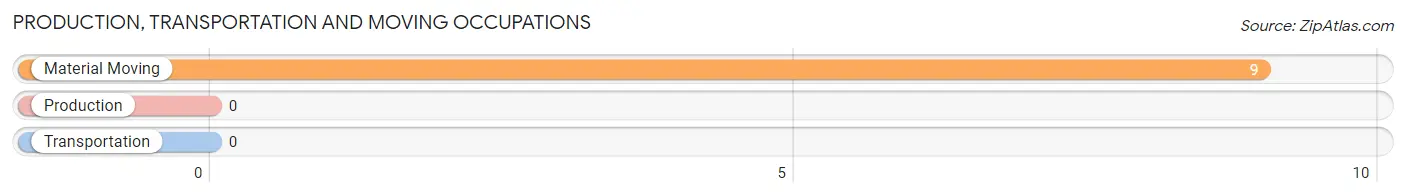
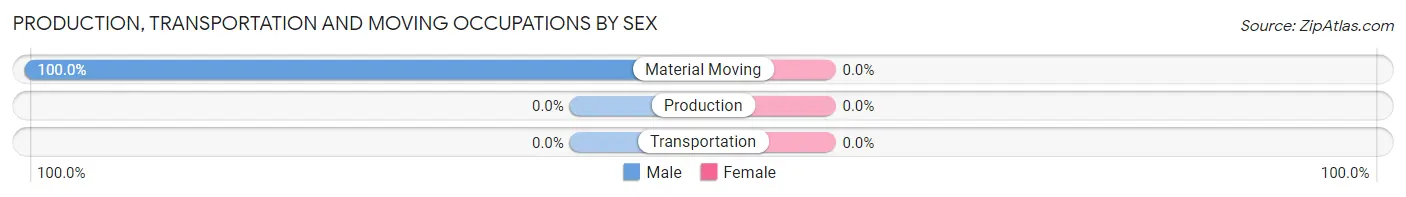
Production, Transportation and Moving Occupations by Sex
| Occupation | Male | Female |
| Production | 0 (0.0%) | 0 (0.0%) |
| Transportation | 0 (0.0%) | 0 (0.0%) |
| Material Moving | 9 (100.0%) | 0 (0.0%) |
| Total (Category) | 9 (100.0%) | 0 (0.0%) |
| Total (Overall) | 515 (66.8%) | 256 (33.2%) |
Employment Industries by Sex in Pine Mountain Club
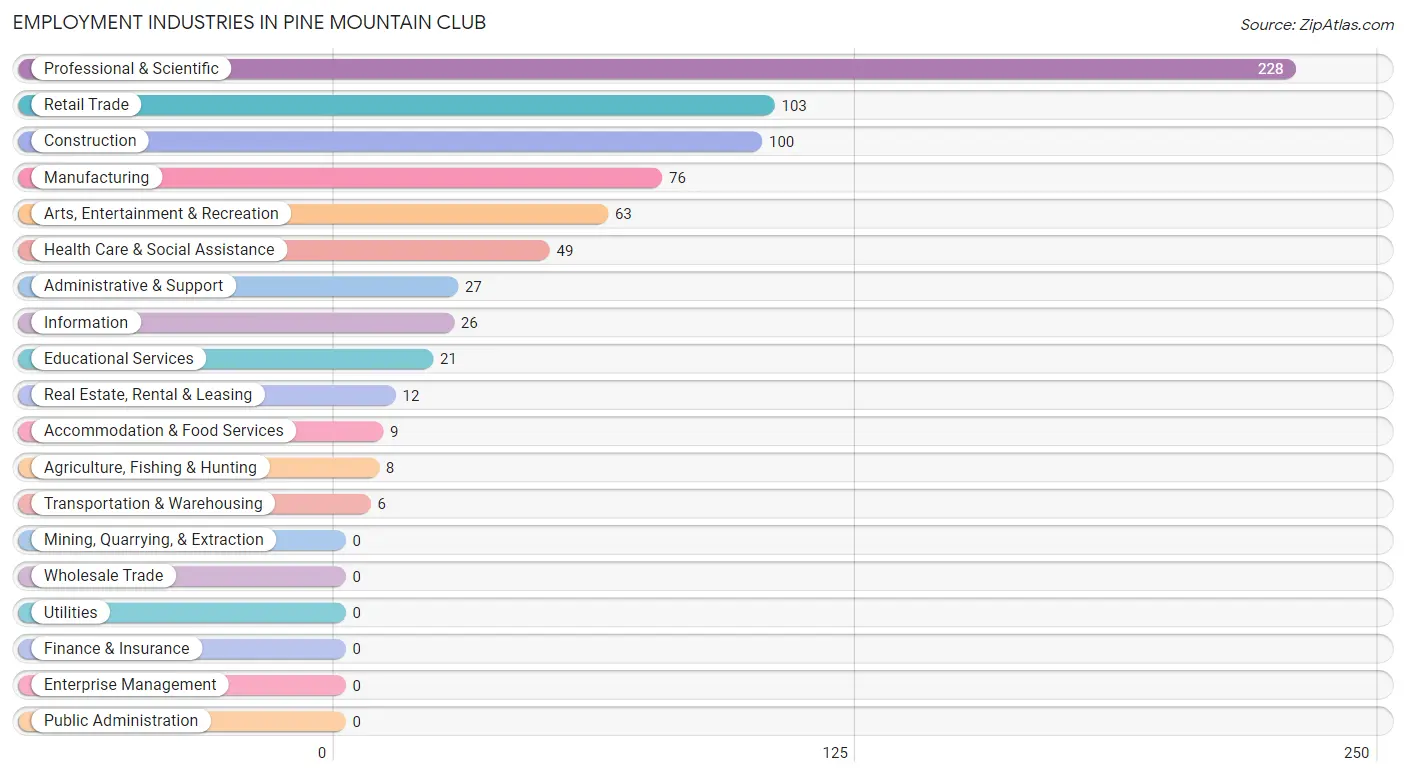
Employment Industries in Pine Mountain Club
The major employment industries in Pine Mountain Club include Professional & Scientific (228 | 29.6%), Retail Trade (103 | 13.4%), Construction (100 | 13.0%), Manufacturing (76 | 9.9%), and Arts, Entertainment & Recreation (63 | 8.2%).
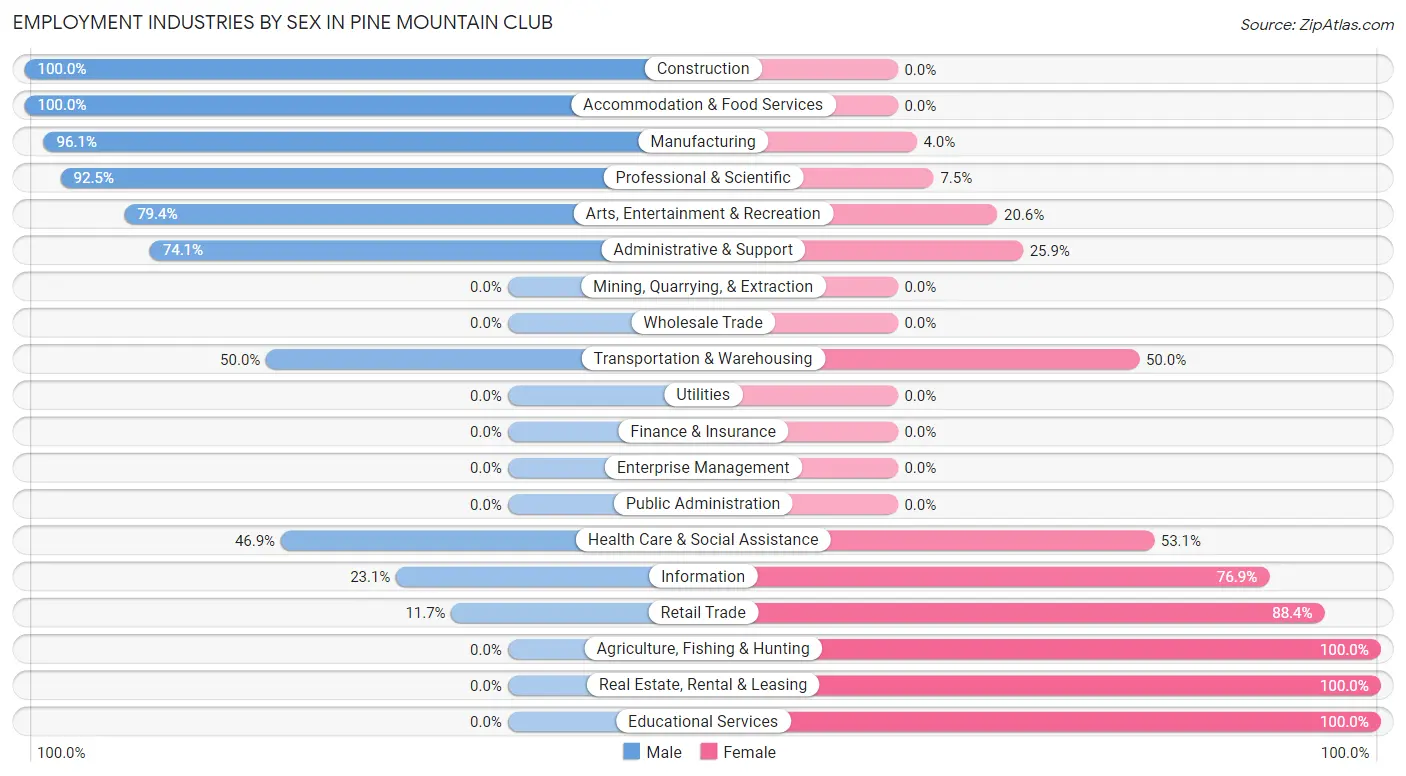
Employment Industries by Sex in Pine Mountain Club
The Pine Mountain Club industries that see more men than women are Construction (100.0%), Accommodation & Food Services (100.0%), and Manufacturing (96.1%), whereas the industries that tend to have a higher number of women are Agriculture, Fishing & Hunting (100.0%), Real Estate, Rental & Leasing (100.0%), and Educational Services (100.0%).
| Industry | Male | Female |
| Agriculture, Fishing & Hunting | 0 (0.0%) | 8 (100.0%) |
| Mining, Quarrying, & Extraction | 0 (0.0%) | 0 (0.0%) |
| Construction | 100 (100.0%) | 0 (0.0%) |
| Manufacturing | 73 (96.1%) | 3 (4.0%) |
| Wholesale Trade | 0 (0.0%) | 0 (0.0%) |
| Retail Trade | 12 (11.7%) | 91 (88.3%) |
| Transportation & Warehousing | 3 (50.0%) | 3 (50.0%) |
| Utilities | 0 (0.0%) | 0 (0.0%) |
| Information | 6 (23.1%) | 20 (76.9%) |
| Finance & Insurance | 0 (0.0%) | 0 (0.0%) |
| Real Estate, Rental & Leasing | 0 (0.0%) | 12 (100.0%) |
| Professional & Scientific | 211 (92.5%) | 17 (7.5%) |
| Enterprise Management | 0 (0.0%) | 0 (0.0%) |
| Administrative & Support | 20 (74.1%) | 7 (25.9%) |
| Educational Services | 0 (0.0%) | 21 (100.0%) |
| Health Care & Social Assistance | 23 (46.9%) | 26 (53.1%) |
| Arts, Entertainment & Recreation | 50 (79.4%) | 13 (20.6%) |
| Accommodation & Food Services | 9 (100.0%) | 0 (0.0%) |
| Public Administration | 0 (0.0%) | 0 (0.0%) |
| Total | 515 (66.8%) | 256 (33.2%) |
Education in Pine Mountain Club
School Enrollment in Pine Mountain Club
The most common levels of schooling among the 329 students in Pine Mountain Club are middle school (116 | 35.3%), high school (99 | 30.1%), and college / undergraduate (63 | 19.2%).
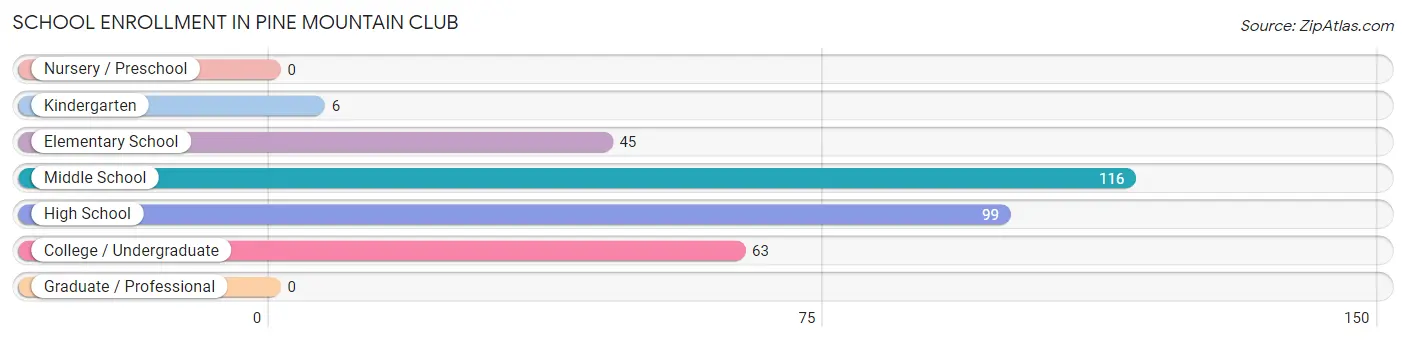
| School Level | # Students | % Students |
| Nursery / Preschool | 0 | 0.0% |
| Kindergarten | 6 | 1.8% |
| Elementary School | 45 | 13.7% |
| Middle School | 116 | 35.3% |
| High School | 99 | 30.1% |
| College / Undergraduate | 63 | 19.2% |
| Graduate / Professional | 0 | 0.0% |
| Total | 329 | 100.0% |
School Enrollment by Age by Funding Source in Pine Mountain Club
Out of a total of 329 students who are enrolled in schools in Pine Mountain Club, 75 (22.8%) attend a private institution, while the remaining 254 (77.2%) are enrolled in public schools. The age group of 10 to 14 year olds has the highest likelihood of being enrolled in private schools, with 64 (55.2% in the age bracket) enrolled. Conversely, the age group of 15 to 17 year olds has the lowest likelihood of being enrolled in a private school, with 99 (100.0% in the age bracket) attending a public institution.
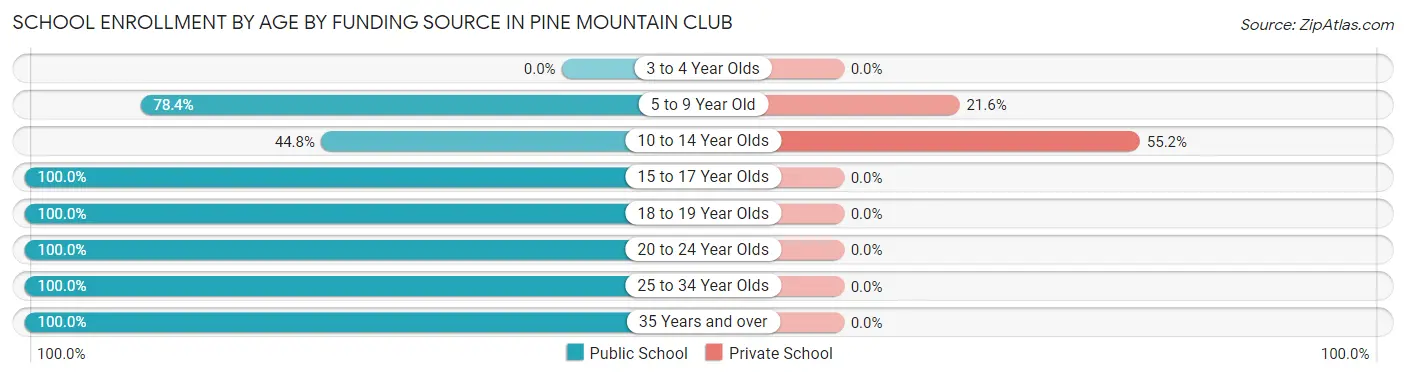
| Age Bracket | Public School | Private School |
| 3 to 4 Year Olds | 0 (0.0%) | 0 (0.0%) |
| 5 to 9 Year Old | 40 (78.4%) | 11 (21.6%) |
| 10 to 14 Year Olds | 52 (44.8%) | 64 (55.2%) |
| 15 to 17 Year Olds | 99 (100.0%) | 0 (0.0%) |
| 18 to 19 Year Olds | 24 (100.0%) | 0 (0.0%) |
| 20 to 24 Year Olds | 26 (100.0%) | 0 (0.0%) |
| 25 to 34 Year Olds | 4 (100.0%) | 0 (0.0%) |
| 35 Years and over | 9 (100.0%) | 0 (0.0%) |
| Total | 254 (77.2%) | 75 (22.8%) |
Educational Attainment by Field of Study in Pine Mountain Club
Bio, nature & agricultural (170 | 22.3%), arts & humanities (135 | 17.7%), business (81 | 10.6%), visual & performing arts (73 | 9.6%), and engineering (63 | 8.3%) are the most common fields of study among 761 individuals in Pine Mountain Club who have obtained a bachelor's degree or higher.
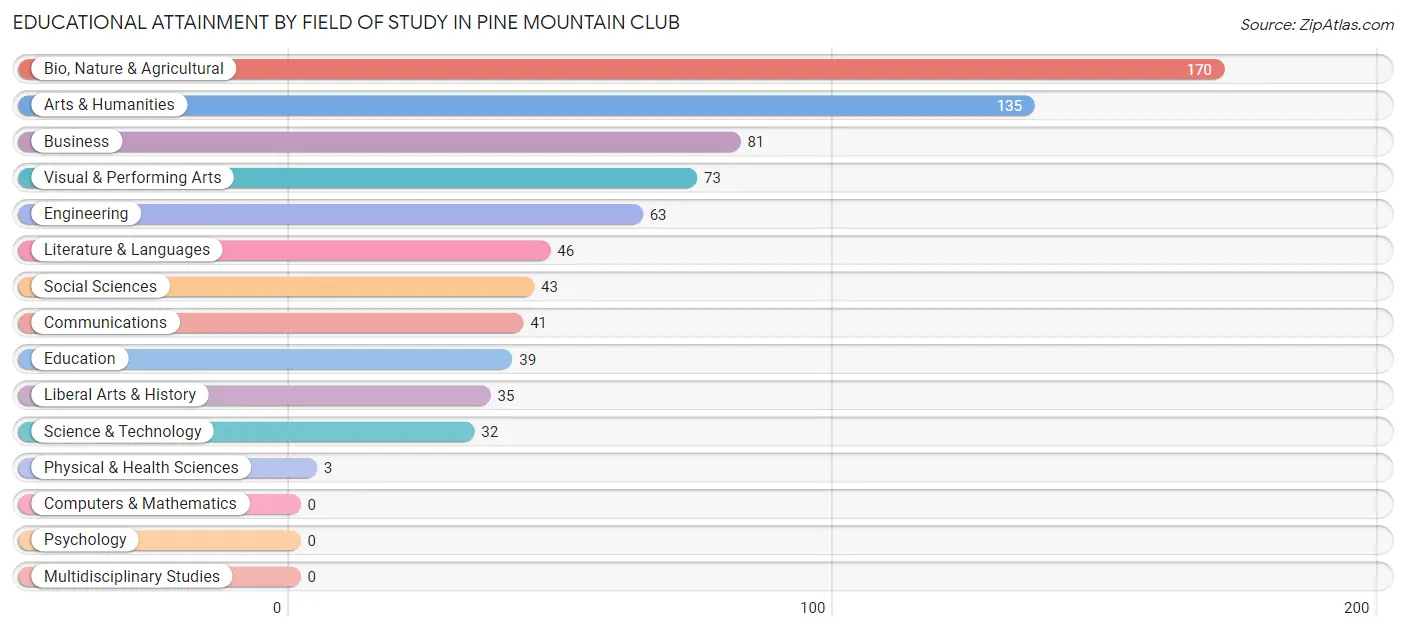
| Field of Study | # Graduates | % Graduates |
| Computers & Mathematics | 0 | 0.0% |
| Bio, Nature & Agricultural | 170 | 22.3% |
| Physical & Health Sciences | 3 | 0.4% |
| Psychology | 0 | 0.0% |
| Social Sciences | 43 | 5.7% |
| Engineering | 63 | 8.3% |
| Multidisciplinary Studies | 0 | 0.0% |
| Science & Technology | 32 | 4.2% |
| Business | 81 | 10.6% |
| Education | 39 | 5.1% |
| Literature & Languages | 46 | 6.0% |
| Liberal Arts & History | 35 | 4.6% |
| Visual & Performing Arts | 73 | 9.6% |
| Communications | 41 | 5.4% |
| Arts & Humanities | 135 | 17.7% |
| Total | 761 | 100.0% |
Transportation & Commute in Pine Mountain Club
Vehicle Availability by Sex in Pine Mountain Club
The most prevalent vehicle ownership categories in Pine Mountain Club are males with 3 vehicles (178, accounting for 36.3%) and females with 3 vehicles (109, making up 73.3%).
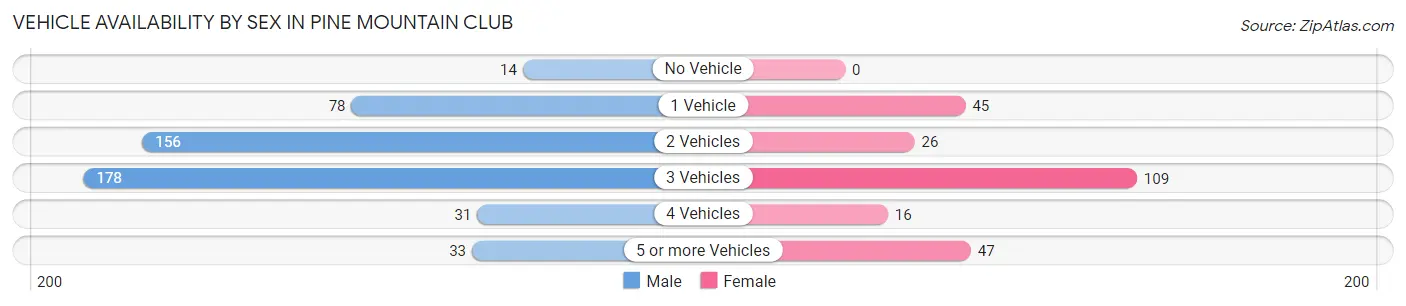
| Vehicles Available | Male | Female |
| No Vehicle | 14 (2.9%) | 0 (0.0%) |
| 1 Vehicle | 78 (15.9%) | 45 (18.5%) |
| 2 Vehicles | 156 (31.8%) | 26 (10.7%) |
| 3 Vehicles | 178 (36.3%) | 109 (44.9%) |
| 4 Vehicles | 31 (6.3%) | 16 (6.6%) |
| 5 or more Vehicles | 33 (6.7%) | 47 (19.3%) |
| Total | 490 (100.0%) | 243 (100.0%) |
Commute Time in Pine Mountain Club
The most frequently occuring commute durations in Pine Mountain Club are 90 or more minutes (194 commuters, 34.7%), 60 to 89 minutes (130 commuters, 23.3%), and 5 to 9 minutes (77 commuters, 13.8%).
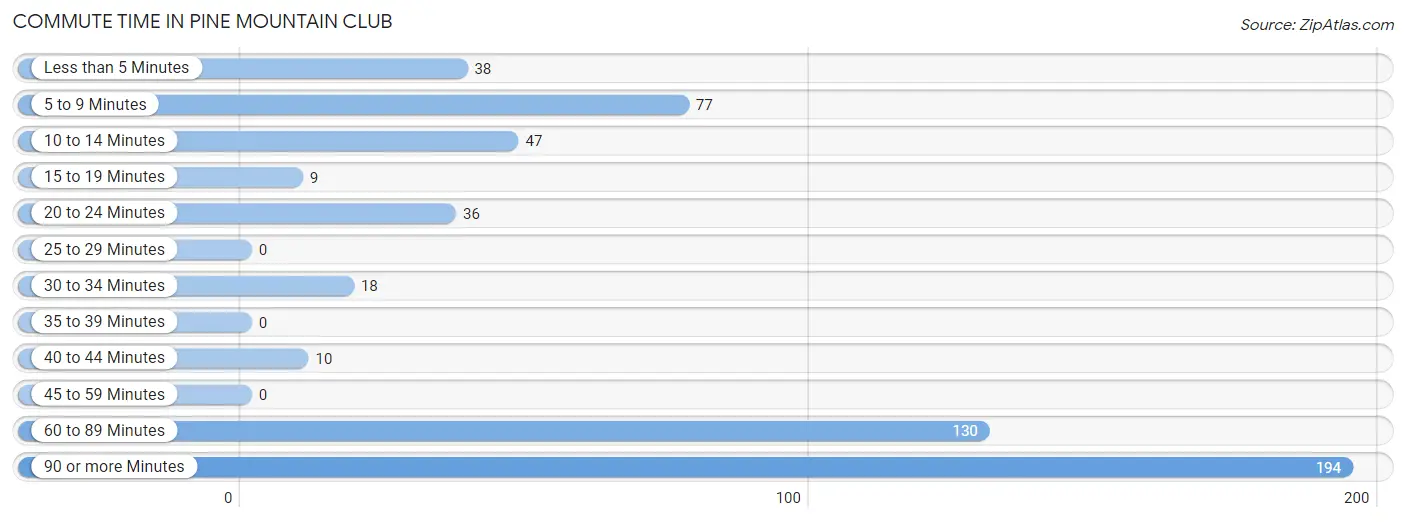
| Commute Time | # Commuters | % Commuters |
| Less than 5 Minutes | 38 | 6.8% |
| 5 to 9 Minutes | 77 | 13.8% |
| 10 to 14 Minutes | 47 | 8.4% |
| 15 to 19 Minutes | 9 | 1.6% |
| 20 to 24 Minutes | 36 | 6.4% |
| 25 to 29 Minutes | 0 | 0.0% |
| 30 to 34 Minutes | 18 | 3.2% |
| 35 to 39 Minutes | 0 | 0.0% |
| 40 to 44 Minutes | 10 | 1.8% |
| 45 to 59 Minutes | 0 | 0.0% |
| 60 to 89 Minutes | 130 | 23.3% |
| 90 or more Minutes | 194 | 34.7% |
Commute Time by Sex in Pine Mountain Club
The most common commute times in Pine Mountain Club are 90 or more minutes (158 commuters, 41.8%) for males and 60 to 89 minutes (82 commuters, 45.3%) for females.
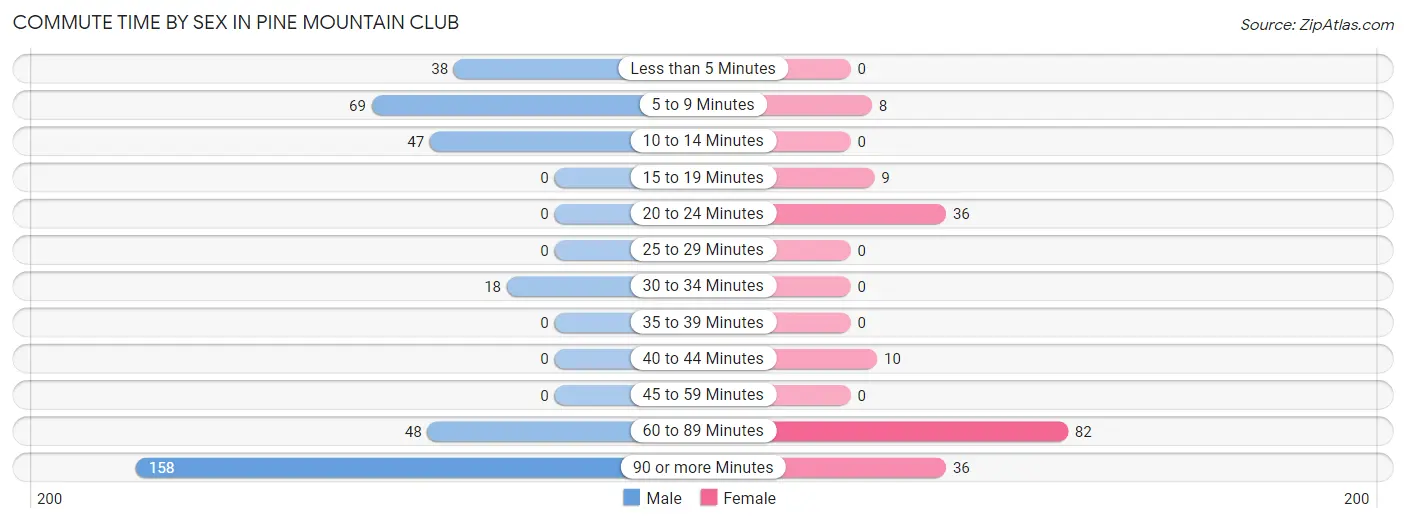
| Commute Time | Male | Female |
| Less than 5 Minutes | 38 (10.1%) | 0 (0.0%) |
| 5 to 9 Minutes | 69 (18.2%) | 8 (4.4%) |
| 10 to 14 Minutes | 47 (12.4%) | 0 (0.0%) |
| 15 to 19 Minutes | 0 (0.0%) | 9 (5.0%) |
| 20 to 24 Minutes | 0 (0.0%) | 36 (19.9%) |
| 25 to 29 Minutes | 0 (0.0%) | 0 (0.0%) |
| 30 to 34 Minutes | 18 (4.8%) | 0 (0.0%) |
| 35 to 39 Minutes | 0 (0.0%) | 0 (0.0%) |
| 40 to 44 Minutes | 0 (0.0%) | 10 (5.5%) |
| 45 to 59 Minutes | 0 (0.0%) | 0 (0.0%) |
| 60 to 89 Minutes | 48 (12.7%) | 82 (45.3%) |
| 90 or more Minutes | 158 (41.8%) | 36 (19.9%) |
Time of Departure to Work by Sex in Pine Mountain Club
The most frequent times of departure to work in Pine Mountain Club are 12:00 PM to 3:59 PM (181, 47.9%) for males and 6:00 AM to 6:29 AM (82, 45.3%) for females.
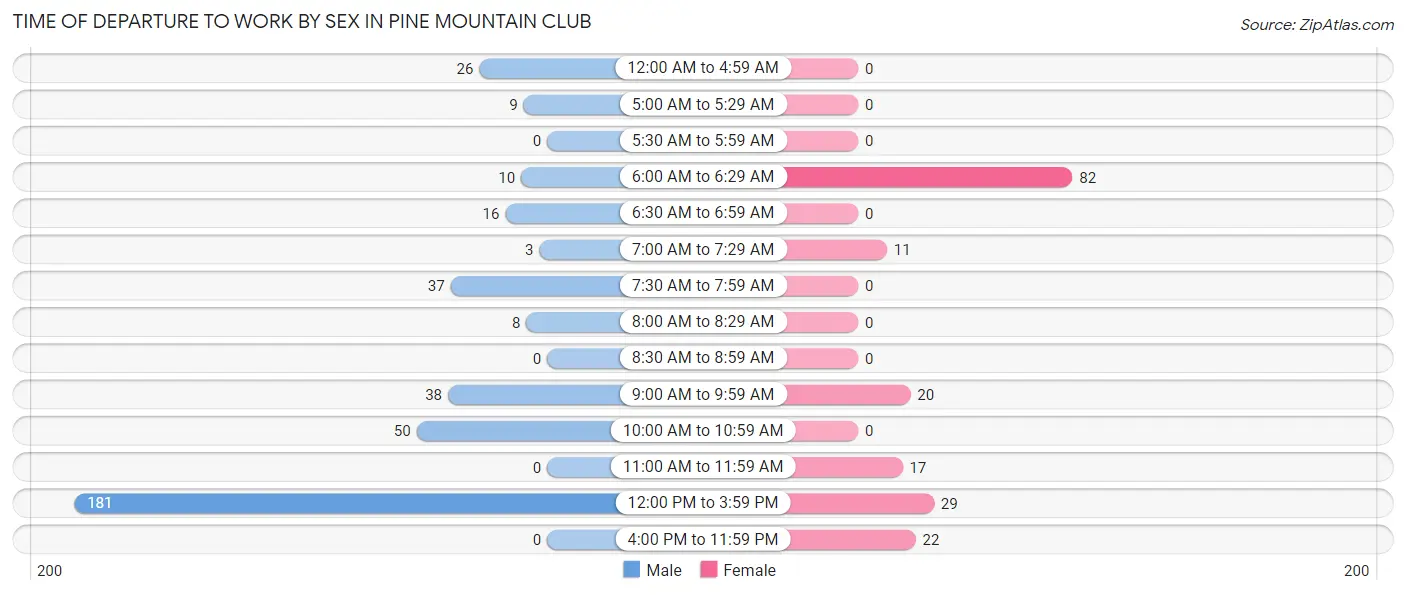
| Time of Departure | Male | Female |
| 12:00 AM to 4:59 AM | 26 (6.9%) | 0 (0.0%) |
| 5:00 AM to 5:29 AM | 9 (2.4%) | 0 (0.0%) |
| 5:30 AM to 5:59 AM | 0 (0.0%) | 0 (0.0%) |
| 6:00 AM to 6:29 AM | 10 (2.6%) | 82 (45.3%) |
| 6:30 AM to 6:59 AM | 16 (4.2%) | 0 (0.0%) |
| 7:00 AM to 7:29 AM | 3 (0.8%) | 11 (6.1%) |
| 7:30 AM to 7:59 AM | 37 (9.8%) | 0 (0.0%) |
| 8:00 AM to 8:29 AM | 8 (2.1%) | 0 (0.0%) |
| 8:30 AM to 8:59 AM | 0 (0.0%) | 0 (0.0%) |
| 9:00 AM to 9:59 AM | 38 (10.1%) | 20 (11.1%) |
| 10:00 AM to 10:59 AM | 50 (13.2%) | 0 (0.0%) |
| 11:00 AM to 11:59 AM | 0 (0.0%) | 17 (9.4%) |
| 12:00 PM to 3:59 PM | 181 (47.9%) | 29 (16.0%) |
| 4:00 PM to 11:59 PM | 0 (0.0%) | 22 (12.1%) |
| Total | 378 (100.0%) | 181 (100.0%) |
Housing Occupancy in Pine Mountain Club
Occupancy by Ownership in Pine Mountain Club
Of the total 1,117 dwellings in Pine Mountain Club, owner-occupied units account for 948 (84.9%), while renter-occupied units make up 169 (15.1%).
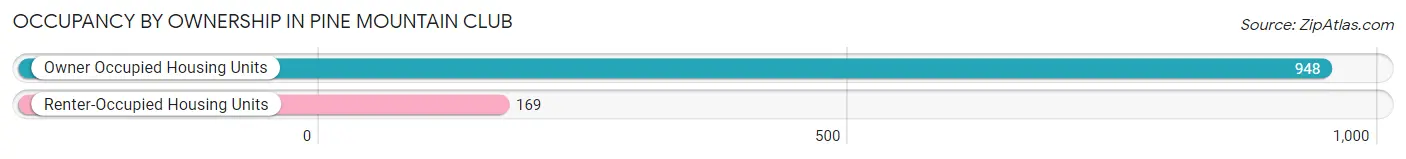
| Occupancy | # Housing Units | % Housing Units |
| Owner Occupied Housing Units | 948 | 84.9% |
| Renter-Occupied Housing Units | 169 | 15.1% |
| Total Occupied Housing Units | 1,117 | 100.0% |
Occupancy by Household Size in Pine Mountain Club
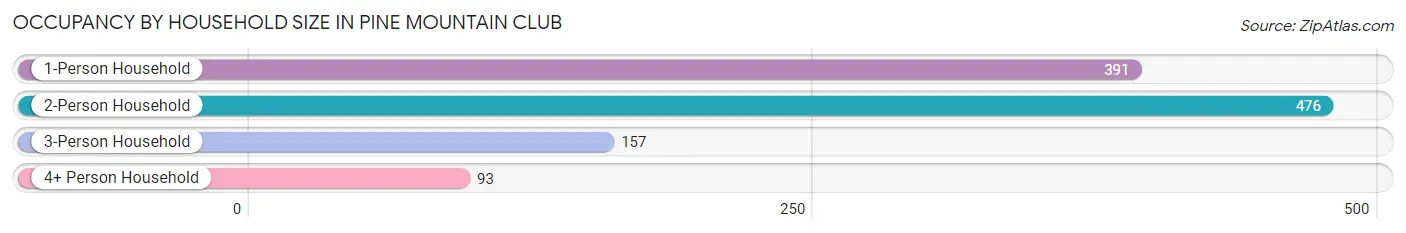
| Household Size | # Housing Units | % Housing Units |
| 1-Person Household | 391 | 35.0% |
| 2-Person Household | 476 | 42.6% |
| 3-Person Household | 157 | 14.1% |
| 4+ Person Household | 93 | 8.3% |
| Total Housing Units | 1,117 | 100.0% |
Occupancy by Ownership by Household Size in Pine Mountain Club
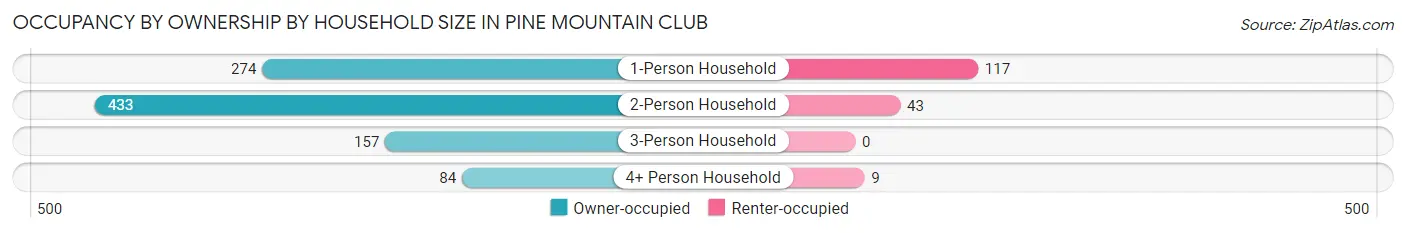
| Household Size | Owner-occupied | Renter-occupied |
| 1-Person Household | 274 (70.1%) | 117 (29.9%) |
| 2-Person Household | 433 (91.0%) | 43 (9.0%) |
| 3-Person Household | 157 (100.0%) | 0 (0.0%) |
| 4+ Person Household | 84 (90.3%) | 9 (9.7%) |
| Total Housing Units | 948 (84.9%) | 169 (15.1%) |
Occupancy by Educational Attainment in Pine Mountain Club
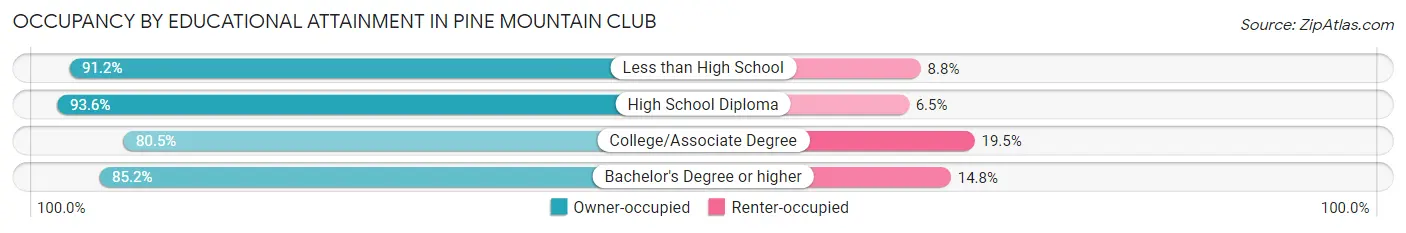
| Household Size | Owner-occupied | Renter-occupied |
| Less than High School | 62 (91.2%) | 6 (8.8%) |
| High School Diploma | 145 (93.5%) | 10 (6.5%) |
| College/Associate Degree | 355 (80.5%) | 86 (19.5%) |
| Bachelor's Degree or higher | 386 (85.2%) | 67 (14.8%) |
Occupancy by Age of Householder in Pine Mountain Club
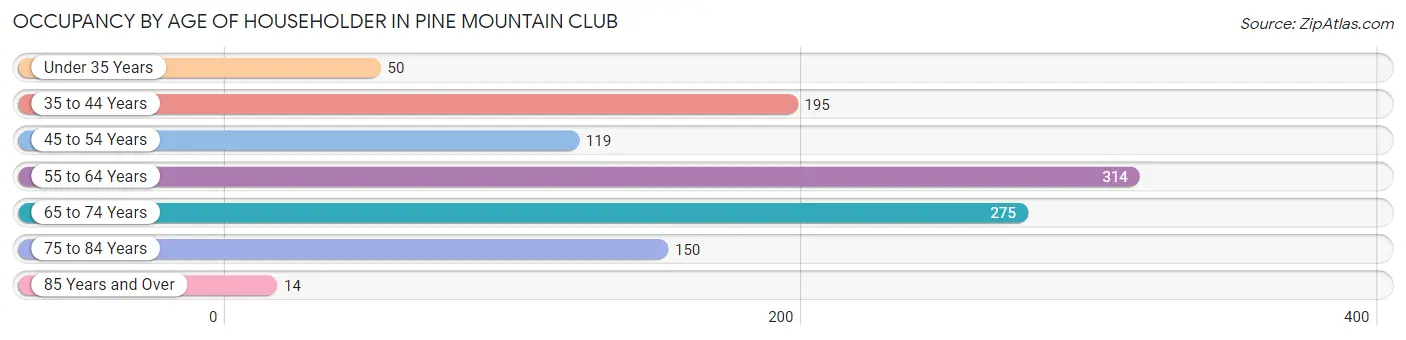
| Age Bracket | # Households | % Households |
| Under 35 Years | 50 | 4.5% |
| 35 to 44 Years | 195 | 17.5% |
| 45 to 54 Years | 119 | 10.6% |
| 55 to 64 Years | 314 | 28.1% |
| 65 to 74 Years | 275 | 24.6% |
| 75 to 84 Years | 150 | 13.4% |
| 85 Years and Over | 14 | 1.3% |
| Total | 1,117 | 100.0% |
Housing Finances in Pine Mountain Club
Median Income by Occupancy in Pine Mountain Club
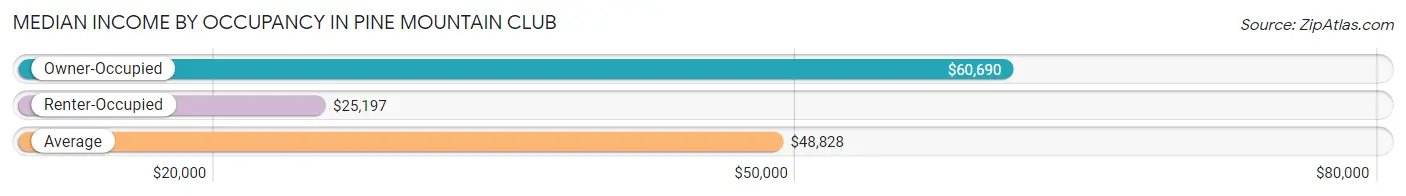
| Occupancy Type | # Households | Median Income |
| Owner-Occupied | 948 (84.9%) | $60,690 |
| Renter-Occupied | 169 (15.1%) | $25,197 |
| Average | 1,117 (100.0%) | $48,828 |
Occupancy by Householder Income Bracket in Pine Mountain Club
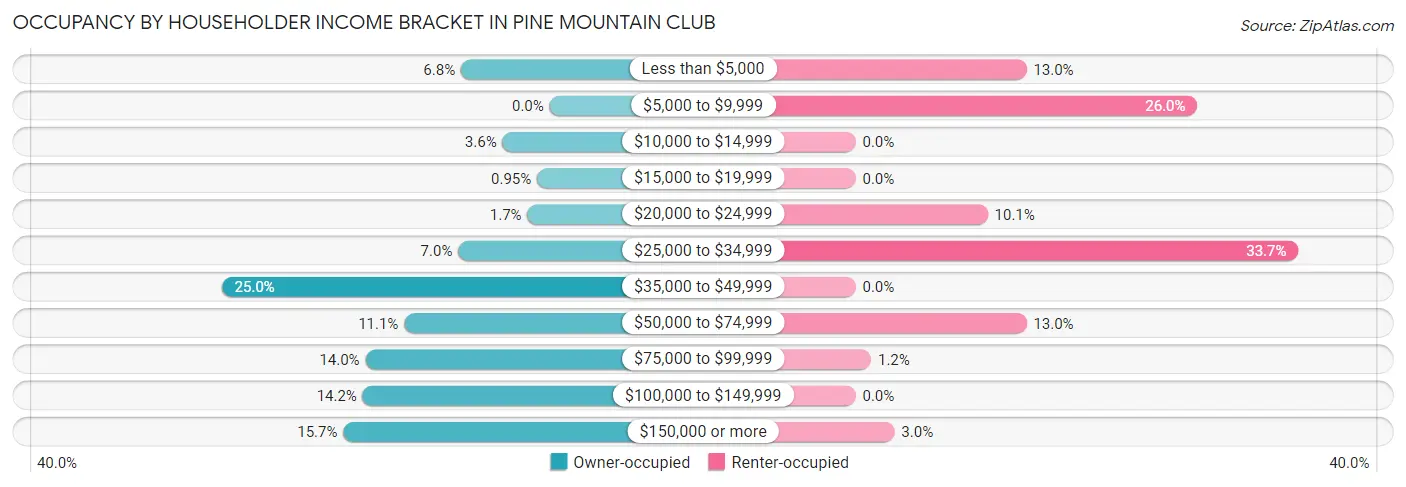
| Income Bracket | Owner-occupied | Renter-occupied |
| Less than $5,000 | 64 (6.8%) | 22 (13.0%) |
| $5,000 to $9,999 | 0 (0.0%) | 44 (26.0%) |
| $10,000 to $14,999 | 34 (3.6%) | 0 (0.0%) |
| $15,000 to $19,999 | 9 (0.9%) | 0 (0.0%) |
| $20,000 to $24,999 | 16 (1.7%) | 17 (10.1%) |
| $25,000 to $34,999 | 66 (7.0%) | 57 (33.7%) |
| $35,000 to $49,999 | 237 (25.0%) | 0 (0.0%) |
| $50,000 to $74,999 | 105 (11.1%) | 22 (13.0%) |
| $75,000 to $99,999 | 133 (14.0%) | 2 (1.2%) |
| $100,000 to $149,999 | 135 (14.2%) | 0 (0.0%) |
| $150,000 or more | 149 (15.7%) | 5 (3.0%) |
| Total | 948 (100.0%) | 169 (100.0%) |
Monthly Housing Cost Tiers in Pine Mountain Club
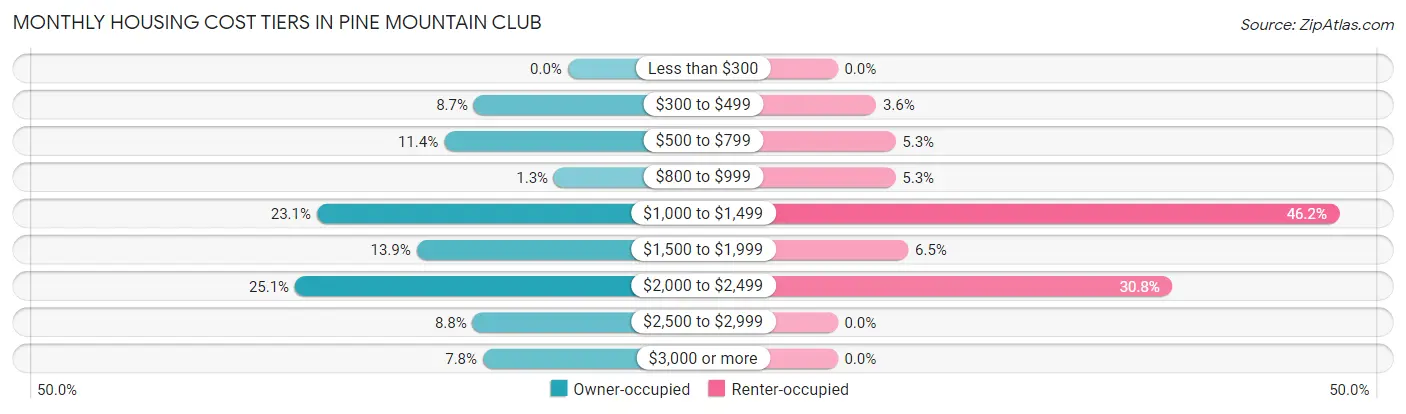
| Monthly Cost | Owner-occupied | Renter-occupied |
| Less than $300 | 0 (0.0%) | 0 (0.0%) |
| $300 to $499 | 82 (8.6%) | 6 (3.5%) |
| $500 to $799 | 108 (11.4%) | 9 (5.3%) |
| $800 to $999 | 12 (1.3%) | 9 (5.3%) |
| $1,000 to $1,499 | 219 (23.1%) | 78 (46.2%) |
| $1,500 to $1,999 | 132 (13.9%) | 11 (6.5%) |
| $2,000 to $2,499 | 238 (25.1%) | 52 (30.8%) |
| $2,500 to $2,999 | 83 (8.8%) | 0 (0.0%) |
| $3,000 or more | 74 (7.8%) | 0 (0.0%) |
| Total | 948 (100.0%) | 169 (100.0%) |
Physical Housing Characteristics in Pine Mountain Club
Housing Structures in Pine Mountain Club
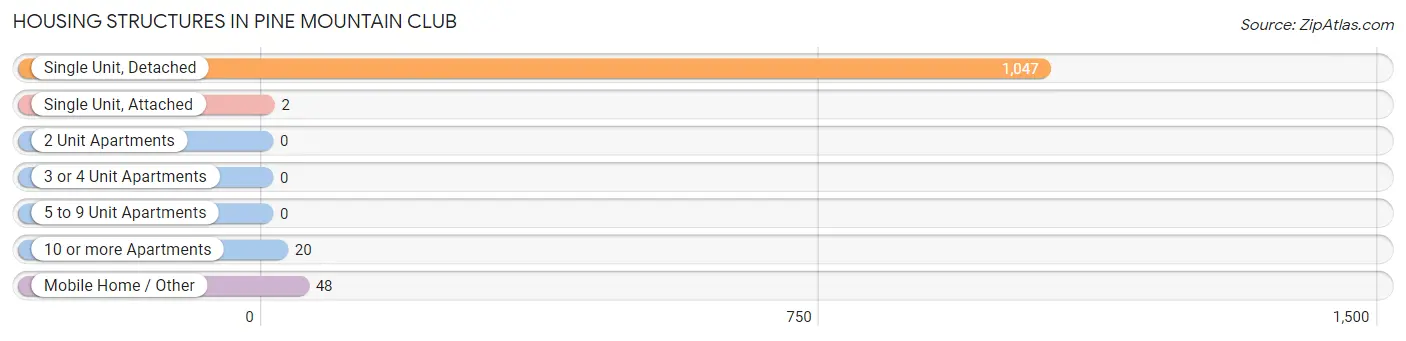
| Structure Type | # Housing Units | % Housing Units |
| Single Unit, Detached | 1,047 | 93.7% |
| Single Unit, Attached | 2 | 0.2% |
| 2 Unit Apartments | 0 | 0.0% |
| 3 or 4 Unit Apartments | 0 | 0.0% |
| 5 to 9 Unit Apartments | 0 | 0.0% |
| 10 or more Apartments | 20 | 1.8% |
| Mobile Home / Other | 48 | 4.3% |
| Total | 1,117 | 100.0% |
Housing Structures by Occupancy in Pine Mountain Club
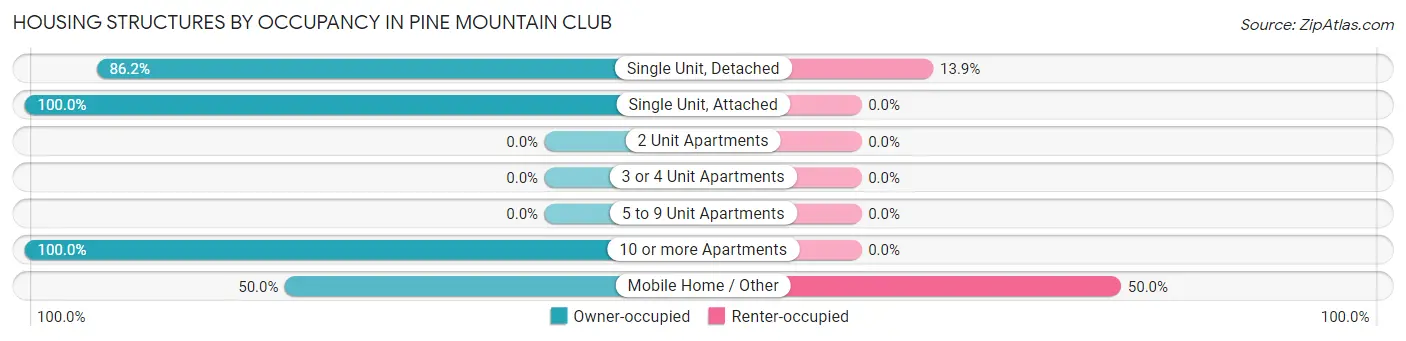
| Structure Type | Owner-occupied | Renter-occupied |
| Single Unit, Detached | 902 (86.2%) | 145 (13.9%) |
| Single Unit, Attached | 2 (100.0%) | 0 (0.0%) |
| 2 Unit Apartments | 0 (0.0%) | 0 (0.0%) |
| 3 or 4 Unit Apartments | 0 (0.0%) | 0 (0.0%) |
| 5 to 9 Unit Apartments | 0 (0.0%) | 0 (0.0%) |
| 10 or more Apartments | 20 (100.0%) | 0 (0.0%) |
| Mobile Home / Other | 24 (50.0%) | 24 (50.0%) |
| Total | 948 (84.9%) | 169 (15.1%) |
Housing Structures by Number of Rooms in Pine Mountain Club
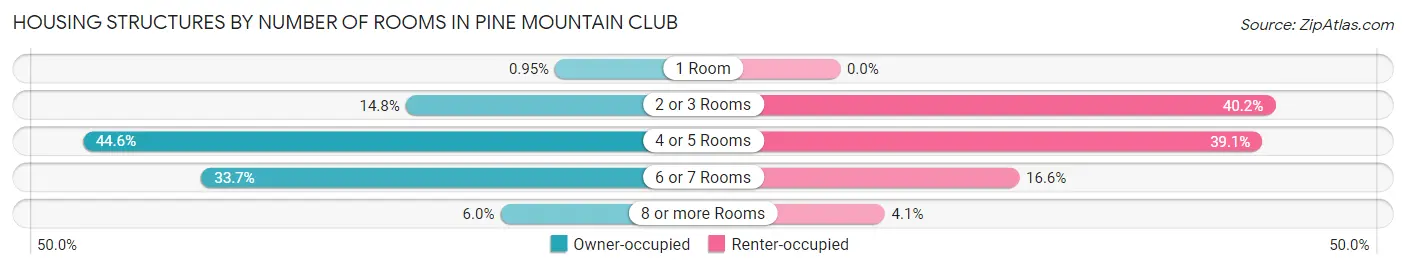
| Number of Rooms | Owner-occupied | Renter-occupied |
| 1 Room | 9 (0.9%) | 0 (0.0%) |
| 2 or 3 Rooms | 140 (14.8%) | 68 (40.2%) |
| 4 or 5 Rooms | 423 (44.6%) | 66 (39.1%) |
| 6 or 7 Rooms | 319 (33.7%) | 28 (16.6%) |
| 8 or more Rooms | 57 (6.0%) | 7 (4.1%) |
| Total | 948 (100.0%) | 169 (100.0%) |
Housing Structure by Heating Type in Pine Mountain Club
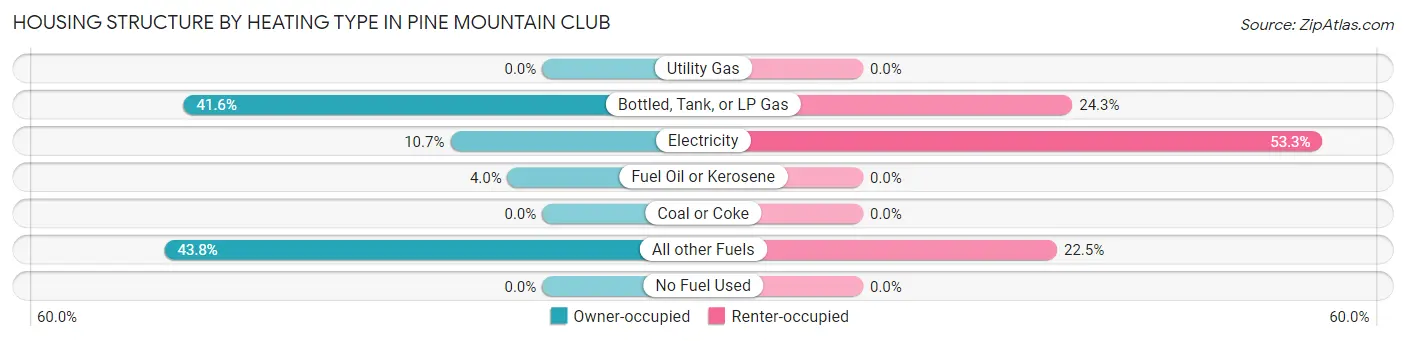
| Heating Type | Owner-occupied | Renter-occupied |
| Utility Gas | 0 (0.0%) | 0 (0.0%) |
| Bottled, Tank, or LP Gas | 394 (41.6%) | 41 (24.3%) |
| Electricity | 101 (10.6%) | 90 (53.2%) |
| Fuel Oil or Kerosene | 38 (4.0%) | 0 (0.0%) |
| Coal or Coke | 0 (0.0%) | 0 (0.0%) |
| All other Fuels | 415 (43.8%) | 38 (22.5%) |
| No Fuel Used | 0 (0.0%) | 0 (0.0%) |
| Total | 948 (100.0%) | 169 (100.0%) |
Household Vehicle Usage in Pine Mountain Club
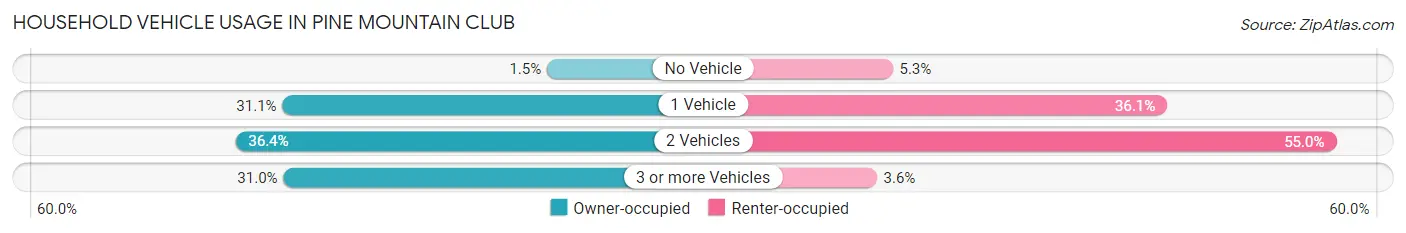
| Vehicles per Household | Owner-occupied | Renter-occupied |
| No Vehicle | 14 (1.5%) | 9 (5.3%) |
| 1 Vehicle | 295 (31.1%) | 61 (36.1%) |
| 2 Vehicles | 345 (36.4%) | 93 (55.0%) |
| 3 or more Vehicles | 294 (31.0%) | 6 (3.5%) |
| Total | 948 (100.0%) | 169 (100.0%) |
Real Estate & Mortgages in Pine Mountain Club
Real Estate and Mortgage Overview in Pine Mountain Club
| Characteristic | Without Mortgage | With Mortgage |
| Housing Units | 206 | 742 |
| Median Property Value | $329,900 | $349,200 |
| Median Household Income | $35,938 | $135 |
| Monthly Housing Costs | $591 | $74 |
| Real Estate Taxes | $2,533 | $25 |
Property Value by Mortgage Status in Pine Mountain Club
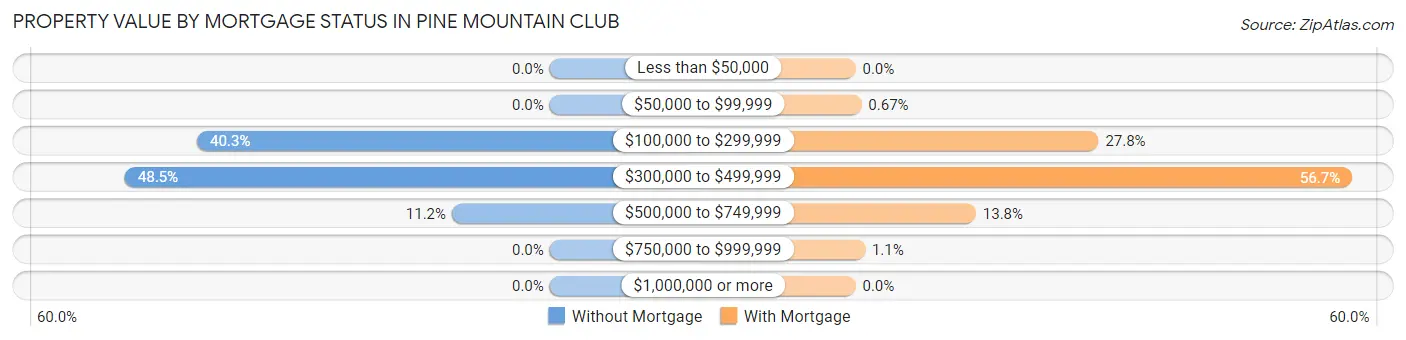
| Property Value | Without Mortgage | With Mortgage |
| Less than $50,000 | 0 (0.0%) | 0 (0.0%) |
| $50,000 to $99,999 | 0 (0.0%) | 5 (0.7%) |
| $100,000 to $299,999 | 83 (40.3%) | 206 (27.8%) |
| $300,000 to $499,999 | 100 (48.5%) | 421 (56.7%) |
| $500,000 to $749,999 | 23 (11.2%) | 102 (13.8%) |
| $750,000 to $999,999 | 0 (0.0%) | 8 (1.1%) |
| $1,000,000 or more | 0 (0.0%) | 0 (0.0%) |
| Total | 206 (100.0%) | 742 (100.0%) |
Household Income by Mortgage Status in Pine Mountain Club
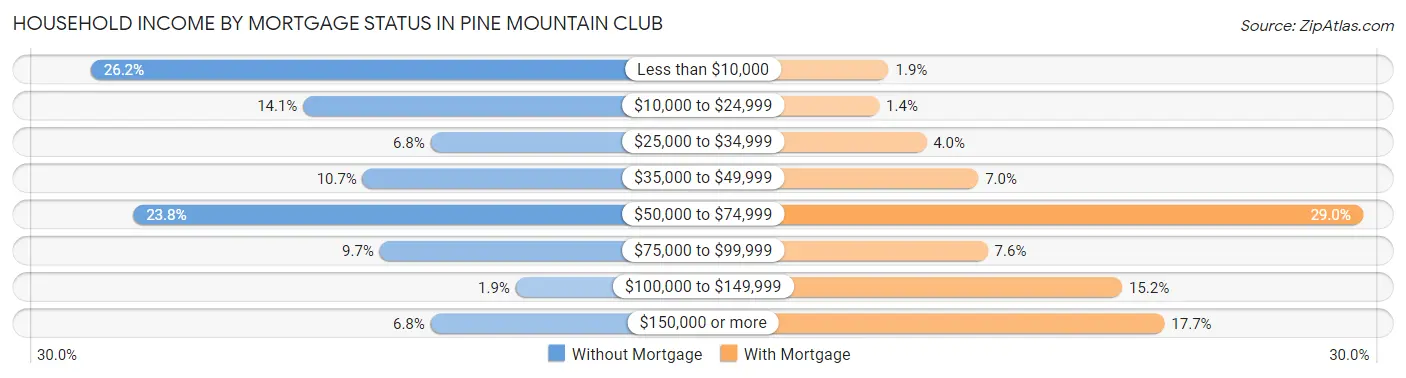
| Household Income | Without Mortgage | With Mortgage |
| Less than $10,000 | 54 (26.2%) | 14 (1.9%) |
| $10,000 to $24,999 | 29 (14.1%) | 10 (1.3%) |
| $25,000 to $34,999 | 14 (6.8%) | 30 (4.0%) |
| $35,000 to $49,999 | 22 (10.7%) | 52 (7.0%) |
| $50,000 to $74,999 | 49 (23.8%) | 215 (29.0%) |
| $75,000 to $99,999 | 20 (9.7%) | 56 (7.5%) |
| $100,000 to $149,999 | 4 (1.9%) | 113 (15.2%) |
| $150,000 or more | 14 (6.8%) | 131 (17.6%) |
| Total | 206 (100.0%) | 742 (100.0%) |
Property Value to Household Income Ratio in Pine Mountain Club
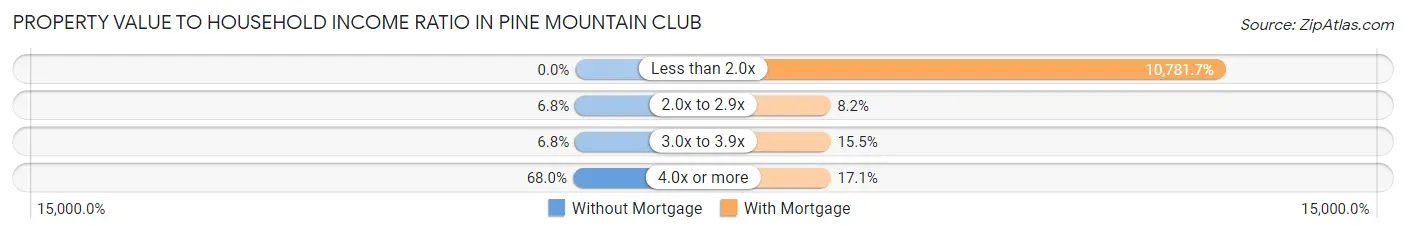
| Value-to-Income Ratio | Without Mortgage | With Mortgage |
| Less than 2.0x | 0 (0.0%) | 80,000 (10,781.7%) |
| 2.0x to 2.9x | 14 (6.8%) | 61 (8.2%) |
| 3.0x to 3.9x | 14 (6.8%) | 115 (15.5%) |
| 4.0x or more | 140 (68.0%) | 127 (17.1%) |
| Total | 206 (100.0%) | 742 (100.0%) |
Real Estate Taxes by Mortgage Status in Pine Mountain Club
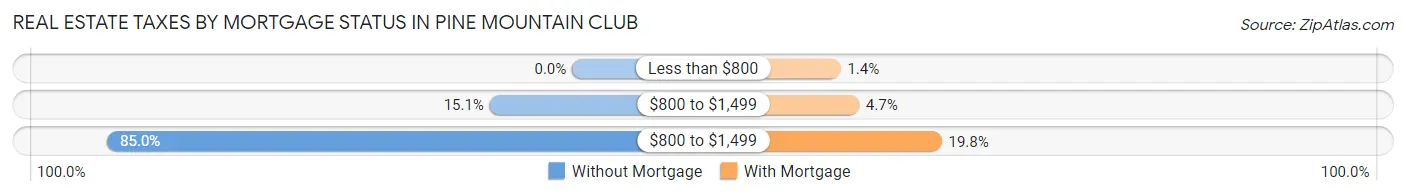
| Property Taxes | Without Mortgage | With Mortgage |
| Less than $800 | 0 (0.0%) | 10 (1.3%) |
| $800 to $1,499 | 31 (15.0%) | 35 (4.7%) |
| $800 to $1,499 | 175 (85.0%) | 147 (19.8%) |
| Total | 206 (100.0%) | 742 (100.0%) |
Health & Disability in Pine Mountain Club
Health Insurance Coverage by Age in Pine Mountain Club
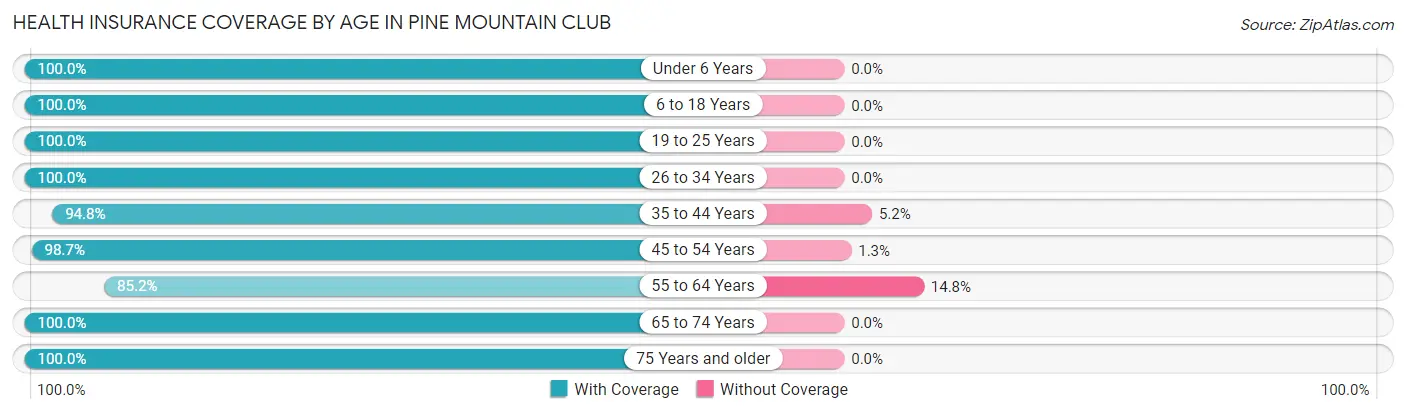
| Age Bracket | With Coverage | Without Coverage |
| Under 6 Years | 60 (100.0%) | 0 (0.0%) |
| 6 to 18 Years | 284 (100.0%) | 0 (0.0%) |
| 19 to 25 Years | 42 (100.0%) | 0 (0.0%) |
| 26 to 34 Years | 89 (100.0%) | 0 (0.0%) |
| 35 to 44 Years | 294 (94.8%) | 16 (5.2%) |
| 45 to 54 Years | 228 (98.7%) | 3 (1.3%) |
| 55 to 64 Years | 436 (85.2%) | 76 (14.8%) |
| 65 to 74 Years | 432 (100.0%) | 0 (0.0%) |
| 75 Years and older | 235 (100.0%) | 0 (0.0%) |
| Total | 2,100 (95.7%) | 95 (4.3%) |
Health Insurance Coverage by Citizenship Status in Pine Mountain Club
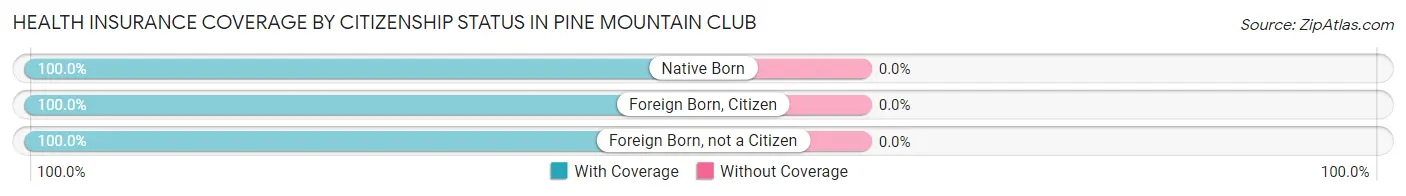
| Citizenship Status | With Coverage | Without Coverage |
| Native Born | 60 (100.0%) | 0 (0.0%) |
| Foreign Born, Citizen | 284 (100.0%) | 0 (0.0%) |
| Foreign Born, not a Citizen | 42 (100.0%) | 0 (0.0%) |
Health Insurance Coverage by Household Income in Pine Mountain Club
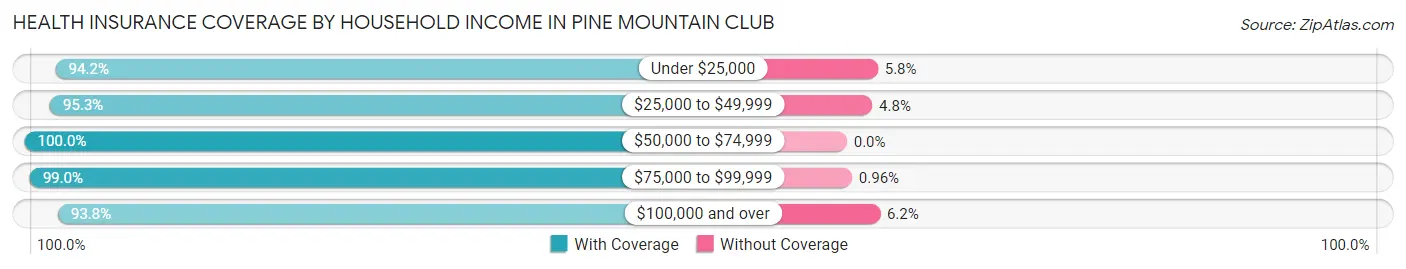
| Household Income | With Coverage | Without Coverage |
| Under $25,000 | 325 (94.2%) | 20 (5.8%) |
| $25,000 to $49,999 | 601 (95.3%) | 30 (4.8%) |
| $50,000 to $74,999 | 231 (100.0%) | 0 (0.0%) |
| $75,000 to $99,999 | 310 (99.0%) | 3 (1.0%) |
| $100,000 and over | 633 (93.8%) | 42 (6.2%) |
Public vs Private Health Insurance Coverage by Age in Pine Mountain Club
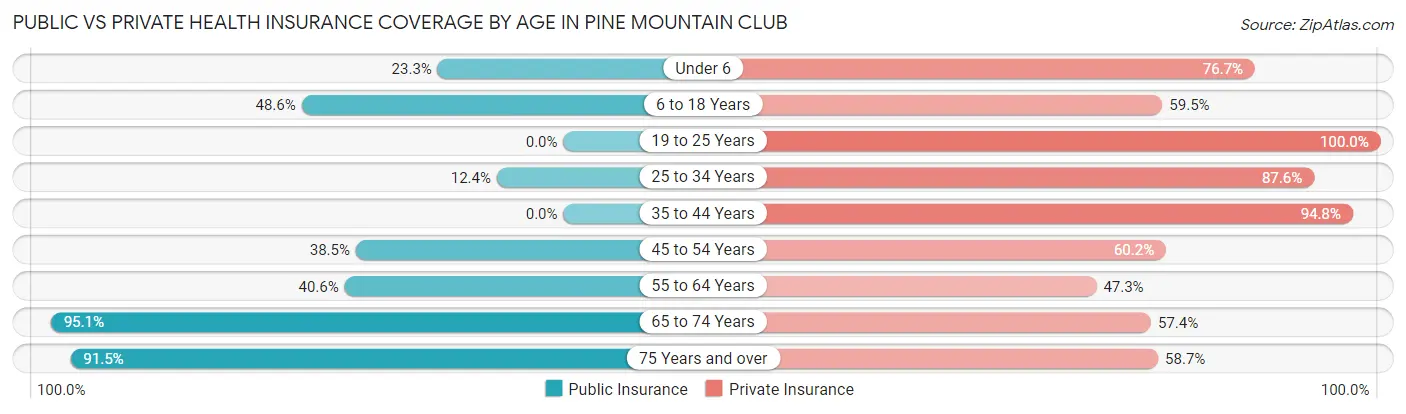
| Age Bracket | Public Insurance | Private Insurance |
| Under 6 | 14 (23.3%) | 46 (76.7%) |
| 6 to 18 Years | 138 (48.6%) | 169 (59.5%) |
| 19 to 25 Years | 0 (0.0%) | 42 (100.0%) |
| 25 to 34 Years | 11 (12.4%) | 78 (87.6%) |
| 35 to 44 Years | 0 (0.0%) | 294 (94.8%) |
| 45 to 54 Years | 89 (38.5%) | 139 (60.2%) |
| 55 to 64 Years | 208 (40.6%) | 242 (47.3%) |
| 65 to 74 Years | 411 (95.1%) | 248 (57.4%) |
| 75 Years and over | 215 (91.5%) | 138 (58.7%) |
| Total | 1,086 (49.5%) | 1,396 (63.6%) |
Disability Status by Sex by Age in Pine Mountain Club
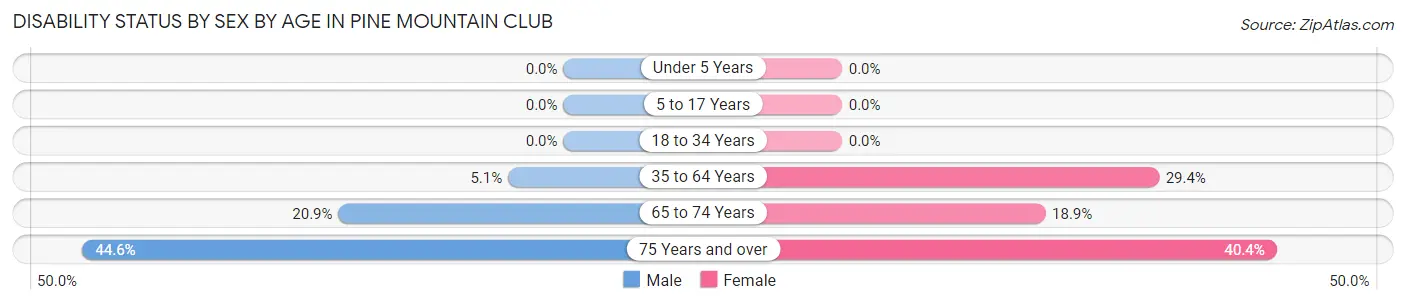
| Age Bracket | Male | Female |
| Under 5 Years | 0 (0.0%) | 0 (0.0%) |
| 5 to 17 Years | 0 (0.0%) | 0 (0.0%) |
| 18 to 34 Years | 0 (0.0%) | 0 (0.0%) |
| 35 to 64 Years | 27 (5.1%) | 155 (29.4%) |
| 65 to 74 Years | 57 (20.9%) | 30 (18.9%) |
| 75 Years and over | 54 (44.6%) | 46 (40.4%) |
Disability Class by Sex by Age in Pine Mountain Club
Disability Class: Hearing Difficulty
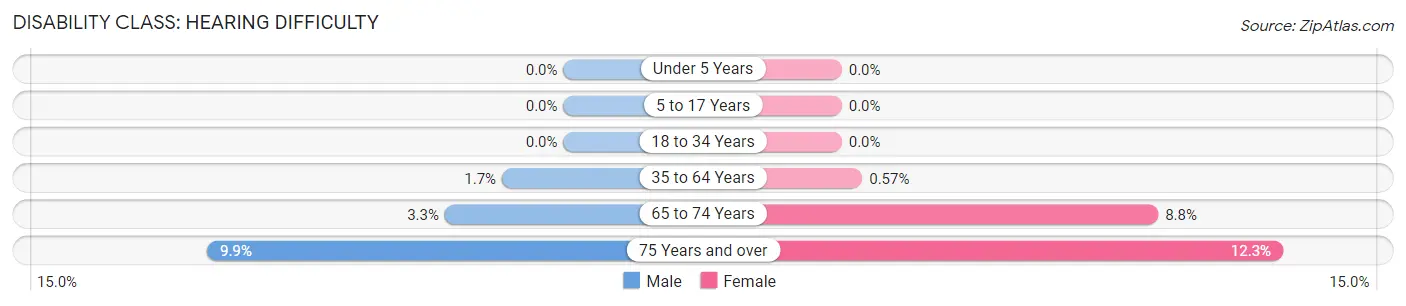
| Age Bracket | Male | Female |
| Under 5 Years | 0 (0.0%) | 0 (0.0%) |
| 5 to 17 Years | 0 (0.0%) | 0 (0.0%) |
| 18 to 34 Years | 0 (0.0%) | 0 (0.0%) |
| 35 to 64 Years | 9 (1.7%) | 3 (0.6%) |
| 65 to 74 Years | 9 (3.3%) | 14 (8.8%) |
| 75 Years and over | 12 (9.9%) | 14 (12.3%) |
Disability Class: Vision Difficulty
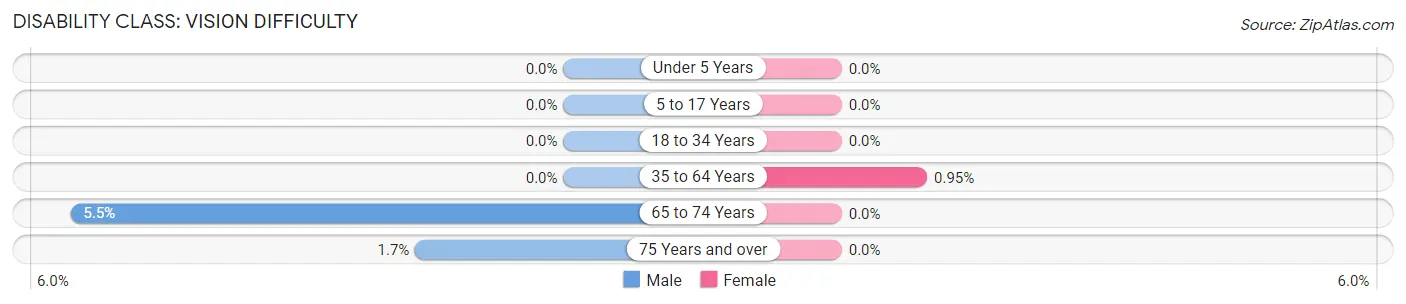
| Age Bracket | Male | Female |
| Under 5 Years | 0 (0.0%) | 0 (0.0%) |
| 5 to 17 Years | 0 (0.0%) | 0 (0.0%) |
| 18 to 34 Years | 0 (0.0%) | 0 (0.0%) |
| 35 to 64 Years | 0 (0.0%) | 5 (0.9%) |
| 65 to 74 Years | 15 (5.5%) | 0 (0.0%) |
| 75 Years and over | 2 (1.7%) | 0 (0.0%) |
Disability Class: Cognitive Difficulty
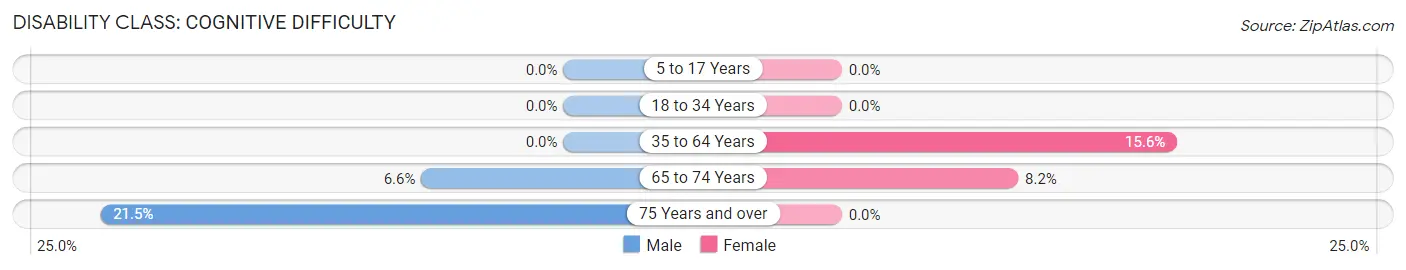
| Age Bracket | Male | Female |
| 5 to 17 Years | 0 (0.0%) | 0 (0.0%) |
| 18 to 34 Years | 0 (0.0%) | 0 (0.0%) |
| 35 to 64 Years | 0 (0.0%) | 82 (15.6%) |
| 65 to 74 Years | 18 (6.6%) | 13 (8.2%) |
| 75 Years and over | 26 (21.5%) | 0 (0.0%) |
Disability Class: Ambulatory Difficulty
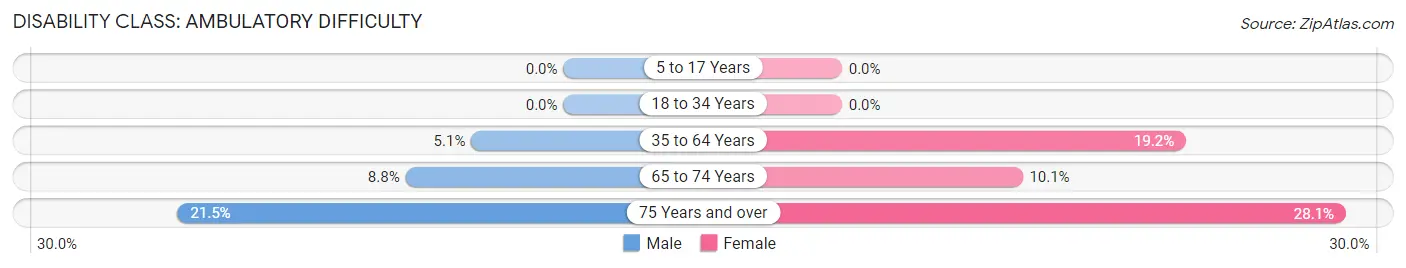
| Age Bracket | Male | Female |
| 5 to 17 Years | 0 (0.0%) | 0 (0.0%) |
| 18 to 34 Years | 0 (0.0%) | 0 (0.0%) |
| 35 to 64 Years | 27 (5.1%) | 101 (19.2%) |
| 65 to 74 Years | 24 (8.8%) | 16 (10.1%) |
| 75 Years and over | 26 (21.5%) | 32 (28.1%) |
Disability Class: Self-Care Difficulty
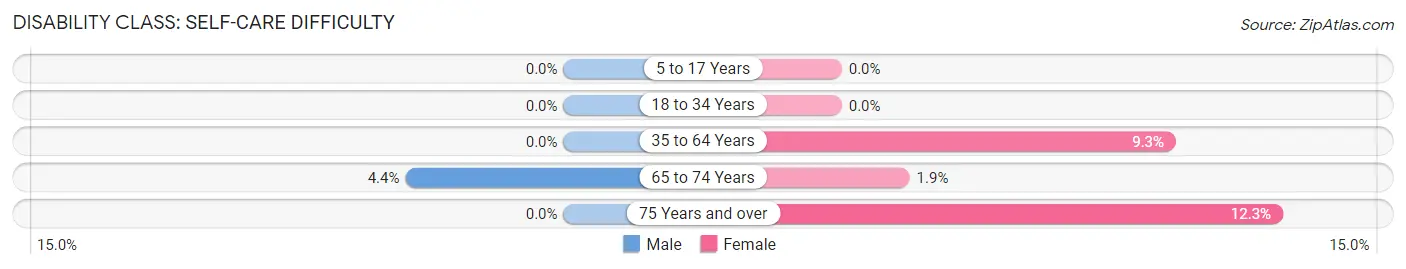
| Age Bracket | Male | Female |
| 5 to 17 Years | 0 (0.0%) | 0 (0.0%) |
| 18 to 34 Years | 0 (0.0%) | 0 (0.0%) |
| 35 to 64 Years | 0 (0.0%) | 49 (9.3%) |
| 65 to 74 Years | 12 (4.4%) | 3 (1.9%) |
| 75 Years and over | 0 (0.0%) | 14 (12.3%) |
Technology Access in Pine Mountain Club
Computing Device Access in Pine Mountain Club
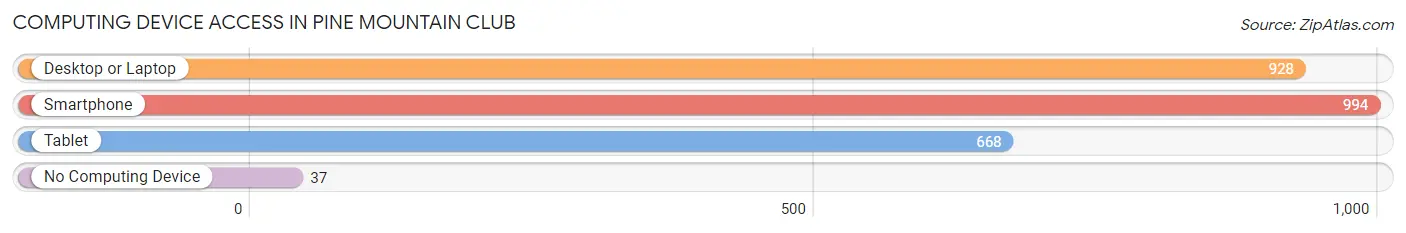
| Device Type | # Households | % Households |
| Desktop or Laptop | 928 | 83.1% |
| Smartphone | 994 | 89.0% |
| Tablet | 668 | 59.8% |
| No Computing Device | 37 | 3.3% |
| Total | 1,117 | 100.0% |
Internet Access in Pine Mountain Club
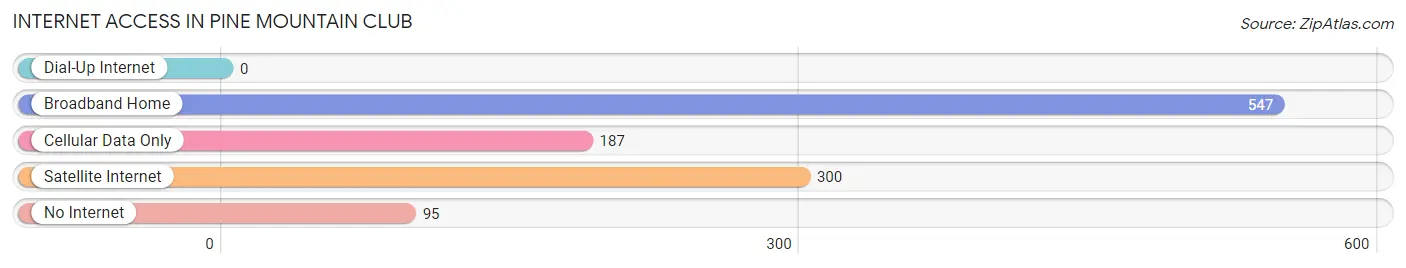
| Internet Type | # Households | % Households |
| Dial-Up Internet | 0 | 0.0% |
| Broadband Home | 547 | 49.0% |
| Cellular Data Only | 187 | 16.7% |
| Satellite Internet | 300 | 26.9% |
| No Internet | 95 | 8.5% |
| Total | 1,117 | 100.0% |
Pine Mountain Club Summary
Pine Mountain Club is a small unincorporated community located in the Los Padres National Forest in the mountains of northern Los Angeles County, California. It is situated at an elevation of 4,724 feet (1,440 m) in the San Emigdio Mountains, and is part of the Santa Clarita Valley. The community is located approximately 40 miles (64 km) north of downtown Los Angeles, and is accessible via Interstate 5 and State Route 33.
History
The area that is now Pine Mountain Club was originally inhabited by the Chumash people, who lived in the area for thousands of years before the arrival of Europeans. The first Europeans to settle in the area were Spanish missionaries, who established a mission in nearby San Emigdio in 1776. The area was later settled by ranchers, who established large cattle ranches in the area.
In the early 1900s, the area was developed as a resort community by the Los Angeles-based Pine Mountain Club Corporation. The corporation purchased the land from the ranchers and developed the area into a resort community, complete with a golf course, tennis courts, and a clubhouse. The resort was popular with Hollywood celebrities, who would come to the area to escape the hustle and bustle of Los Angeles.
In the 1950s, the area was developed into a residential community, and the Pine Mountain Club Corporation sold off the land to developers. The area was incorporated as a census-designated place in 1980, and the population has grown steadily since then.
Geography
Pine Mountain Club is located in the San Emigdio Mountains, in northern Los Angeles County. It is situated at an elevation of 4,724 feet (1,440 m) in the San Emigdio Mountains, and is part of the Santa Clarita Valley. The community is located approximately 40 miles (64 km) north of downtown Los Angeles, and is accessible via Interstate 5 and State Route 33.
The area is characterized by rugged terrain, with steep hills and deep canyons. The area is home to a variety of wildlife, including deer, coyotes, bobcats, and mountain lions. The area is also home to a variety of plant life, including oak, pine, and manzanita trees.
Economy
The economy of Pine Mountain Club is largely based on tourism and recreation. The area is home to a variety of outdoor activities, including hiking, camping, fishing, and horseback riding. The area is also home to a variety of restaurants, bars, and shops.
The area is also home to a variety of businesses, including a gas station, a grocery store, a hardware store, and a post office. The area is also home to a variety of professional services, including doctors, lawyers, and real estate agents.
Demographics
As of the 2010 census, the population of Pine Mountain Club was 1,521. The population is largely white (90.2%), with a small Hispanic population (7.2%). The median household income is $50,000, and the median home value is $250,000. The area is largely rural, with only a small percentage of the population living in urban areas.
Common Questions
What is Per Capita Income in Pine Mountain Club?
Per Capita income in Pine Mountain Club is $37,065.
What is the Median Family Income in Pine Mountain Club?
Median Family Income in Pine Mountain Club is $57,174.
What is the Median Household income in Pine Mountain Club?
Median Household Income in Pine Mountain Club is $48,828.
What is Inequality or Gini Index in Pine Mountain Club?
Inequality or Gini Index in Pine Mountain Club is 0.45.
What is the Total Population of Pine Mountain Club?
Total Population of Pine Mountain Club is 2,195.
What is the Total Male Population of Pine Mountain Club?
Total Male Population of Pine Mountain Club is 1,224.
What is the Total Female Population of Pine Mountain Club?
Total Female Population of Pine Mountain Club is 971.
What is the Ratio of Males per 100 Females in Pine Mountain Club?
There are 126.06 Males per 100 Females in Pine Mountain Club.
What is the Ratio of Females per 100 Males in Pine Mountain Club?
There are 79.33 Females per 100 Males in Pine Mountain Club.
What is the Median Population Age in Pine Mountain Club?
Median Population Age in Pine Mountain Club is 58.2 Years.
What is the Average Family Size in Pine Mountain Club
Average Family Size in Pine Mountain Club is 2.5 People.
What is the Average Household Size in Pine Mountain Club
Average Household Size in Pine Mountain Club is 2.0 People.
How Large is the Labor Force in Pine Mountain Club?
There are 854 People in the Labor Forcein in Pine Mountain Club.
What is the Percentage of People in the Labor Force in Pine Mountain Club?
44.7% of People are in the Labor Force in Pine Mountain Club.
What is the Unemployment Rate in Pine Mountain Club?
Unemployment Rate in Pine Mountain Club is 9.7%.